
Experimental and computational studies of oxidizer and fuel side addition of ethanol to opposed flow...
15
Combustion and Flame 142 (2005) 413–427 www.elsevier.com/locate/combustflame Experimental and computational studies of oxidizer and fuel side addition of ethanol to opposed flow air/ethylene flames Kevin L. McNesby a,∗ , Andrzej W. Miziolek a , Thuvan Nguyen a , Frank C. Delucia a , R. Reed Skaggs a , Thomas A. Litzinger b a Army Research Laboratory, Aberdeen Proving Ground, MD 21005-5066, USA b Penn State University, State College, PA, USA Received 20 May 2004; received in revised form 1 April 2005; accepted 12 April 2005 Available online 5 July 2005 Abstract Results of computations based on a detailed chemical kinetic combustion mechanism and results of experiments are compared to understand the influence of ethanol vapor addition upon soot formation and OH radical concen- tration in opposed flow ethylene/air diffusion flames. For this work, ethanol vapor was added to either the fuel or the oxidizer gases. Experiment and calculations are in qualitative agreement, and both show differing concentra- tions of soot, soot precursors, and OH depending on whether the ethanol is added to the fuel or oxidizer gases. An explanation for the observed differences for oxidizer or fuel side ethanol addition to opposed flow ethylene/air diffusion flames is proposed, based on an analysis of the chemical kinetic mechanism used in the computations. 2005 Published by Elsevier Inc. on behalf of The Combustion Institute. Keywords: Soot formation; Opposed flow flames; Ethylene flames; Ethanol; PLIF 1. Introduction It is estimated that U.S. military aircraft emit about 600,000 kg of particulate matter into the atmosphere each year. Most of this particulate matter is in the form of soot particles with diameters less than 2.5 μm (PM2.5) [1]. In addition to shortening engine life and limiting the time between engine servicing, there is a growing body of evidence that shows these small par- ticles cause both health and environmental problems [2–4]. * Corresponding author. Fax: +1 410 306 1909. E-mail address: [email protected] (K.L. McNesby). As part of a Strategic Environmental Research and Development Program (SERDP) effort investigating superefficient (ppm level) fuel additives for soot re- duction in turbine engines [5], fundamental studies of the effects of additives on soot formation and oxida- tion in different types of burners and combustors are underway at several laboratories using a wide range of diagnostic methods. Part of the rationale of this pro- gram is to use different types of burners and combus- tors (diffusion, premixed, well-stirred reactors, etc.) to approximate the different stages of fuel combustion that occur in a turbine engine. For the initial series of experiments for this program, ethylene was chosen as the fuel because it has been used in past studies of soot formation processes in a wide range of burners [6]. 0010-2180/$ – see front matter 2005 Published by Elsevier Inc. on behalf of The Combustion Institute. doi:10.1016/j.combustflame.2005.04.003
-
Upload
independent -
Category
Documents
-
view
0 -
download
0
Transcript of Experimental and computational studies of oxidizer and fuel side addition of ethanol to opposed flow...

e
erimentsconcen-fuel or
ncentra-er gases.lene/airtations.
Combustion and Flame 142 (2005) 413–427www.elsevier.com/locate/combustflam
Experimental and computational studies of oxidizerand fuel side addition of ethanol to opposed flow
air/ethylene flames
Kevin L. McNesbya,∗, Andrzej W. Mizioleka, Thuvan Nguyena,Frank C. Deluciaa, R. Reed Skaggsa, Thomas A. Litzingerb
a Army Research Laboratory, Aberdeen Proving Ground, MD 21005-5066, USAb Penn State University, State College, PA, USA
Received 20 May 2004; received in revised form 1 April 2005; accepted 12 April 2005
Available online 5 July 2005
Abstract
Results of computations based on a detailed chemical kinetic combustion mechanism and results of expare compared to understand the influence of ethanol vapor addition upon soot formation and OH radicaltration in opposed flow ethylene/air diffusion flames. For this work, ethanol vapor was added to either thethe oxidizer gases. Experiment and calculations are in qualitative agreement, and both show differing cotions of soot, soot precursors, and OH depending on whether the ethanol is added to the fuel or oxidizAn explanation for the observed differences for oxidizer or fuel side ethanol addition to opposed flow ethydiffusion flames is proposed, based on an analysis of the chemical kinetic mechanism used in the compu 2005 Published by Elsevier Inc. on behalf of The Combustion Institute.
Keywords:Soot formation; Opposed flow flames; Ethylene flames; Ethanol; PLIF
utereheµmds aar-ms
andinge-fa-
aree ofro-us-c.)ionof
n assoot
1. Introduction
It is estimated that U.S. military aircraft emit abo600,000 kg of particulate matter into the atmospheach year. Most of this particulate matter is in tform of soot particles with diameters less than 2.5(PM2.5)[1]. In addition to shortening engine life anlimiting the time between engine servicing, there igrowing body of evidence that shows these small pticles cause both health and environmental proble[2–4].
* Corresponding author. Fax: +1 410 306 1909.E-mail address:[email protected]
(K.L. McNesby).
0010-2180/$ – see front matter 2005 Published by Elsevier Indoi:10.1016/j.combustflame.2005.04.003
As part of a Strategic Environmental ResearchDevelopment Program (SERDP) effort investigatsuperefficient (ppm level) fuel additives for soot rduction in turbine engines[5], fundamental studies othe effects of additives on soot formation and oxidtion in different types of burners and combustorsunderway at several laboratories using a wide rangdiagnostic methods. Part of the rationale of this pgram is to use different types of burners and combtors (diffusion, premixed, well-stirred reactors, etto approximate the different stages of fuel combustthat occur in a turbine engine. For the initial seriesexperiments for this program, ethylene was chosethe fuel because it has been used in past studies offormation processes in a wide range of burners[6].
c. on behalf of The Combustion Institute.

414 K.L. McNesby et al. / Combustion and Flame 142 (2005) 413–427
rchin-
elynd
talerseat-
tedfor
eenionice-ions
ch-ingbil-
as
icalel-
cu-andre-
ins-nceot-
ture
allyonstionshetiontriczer
ingedas-
al,
e.
inggas
lo-ere
per-ea-
a-lu-ep-ad-ndonxi-ar-yis
or, is
edairH
/airn ofel-ed
co-orereech-hyl-
The part of the effort conducted at the Army ReseaLaboratory (ARL) uses an opposed flow burner tovestigate ethylene/air combustion.
Soot reducing additives studied in the past largfall into two categories, metal-based additives aoxygenated compounds[6]. Although often very ef-fective at soot reduction, the investigation of meadditives was ruled out due to concerns about advhealth and environmental impact as well as incompibility with gas turbines. Thus, the use of oxygenacompounds (that are drawing increasing attentionuse in diesel engines) was selected[7]. It is worth-while to note that oxygenated compounds are not sas an ultimate solution to the particulate emissproblem for gas turbine engines, because for notable effect they must be added at high concentrat(percentage levels) to the fuel[7], making them im-practical. However, they do provide a good benmark for the standardization tests. After considerthe available data in the literature and compatiity with tests using ethylene, ethanol was selectedthe initial additive compound to be studied[8,9]. Thechoice of ethanol and ethylene also allowed chemmechanisms from the literature to be used in moding of the results[10].
2. Background
The separation of the regions of highest partilate and aromatic concentrations (sooting region)the main combustion (flame radical production)gion in opposed flow flames has been reportedRef. [11]. We are aware of only one investigator uing simultaneous planar laser-induced fluoresce(PLIF) and light-scattering measurements in soing opposed flow diffusion flames[12]. Simultane-ous measurement has been reported in the literafor coflowing diffusion flames[13]. For sooting op-posed flow flames, peak soot concentration typicoccurs near the stagnation plane, in fuel-rich regiat temperatures slightly lower than peak combustemperatures[14]. For opposed flow diffusion flamein which the stagnation plane is fuel rich (e.g., tflame reported here), the flame occurs at the locawhere fuel and oxidizer are close to stoichiomecombustion proportions. This occurs on the oxidiside of the stagnation plane (seeFig. 1a), and the stoi-chiometric mixture is achieved by fuel gases diffusupstream into the oxidizer flow. For the flames ushere (ethylene/air) the overall chemical reaction (suming air to be 20% oxygen) is
C2H4 + 3O2 + 12N2 → 2CO2 + 2H2O + 12N2.(R1)
Reaction 1(R1) shows that for fuel (C2H4) andoxidizer (air) flow rates that are approximately equ
Fig. 1. A schematic of the opposed flow burner and flam
in an opposed flow burner (our conditions), assumgases with similar momenta (our conditions), themixture at the stagnation plane will be fuel rich[14].The stagnation plane is conceptually shown inFig. 1.The stagnation plane is typically described as thecation between the gas and the oxidizer ducts whthe axial gas velocity goes to zero. For these eximents, the stagnation plane location was not msured, but was estimated by calculation.
For opposed flow flames that exhibit similar seprations of sooting (particle laden) and flame (i.e.,minous) regions (e.g., ethylene/air, propane/air, htane/air in the authors’ experience), the effect ofditives upon flame structure, radical formation, aextinction strain rate may be different dependingwhether the additive is added to the fuel or odizer stream. As an example, when iron pentacbonyl (Fe(CO)5) is added to the air stream of manopposed flow hydrocarbon/air flame systems, itamong the most efficient flame inhibitors known. Ffuel stream addition, the effect, on a molar basismuch less pronounced[15].
The analysis of the experimental work describhere attempts to understand the effect of fuel orside addition of ethanol upon soot formation and Oradical concentrations in opposed flow ethyleneflames. The approach focuses on a comparisoexperimental results with results of flame moding calculations incorporating the well-characterizC2 combustion mechanism of Frenklach andworkers [10]. This mechanism was developed fpremixed flame systems, and we have used it hwithout modification. It may be worth noting that thactivation energies for some reactions in the meanism may exhibit a pressure dependence in et

K.L. McNesby et al. / Combustion and Flame 142 (2005) 413–427 415
etionon-es.lse,sedres-
04ntatir)
byere
tableernoltheamandddi-orvelx-e
d tos.ox-zeer
eingcesseri-atic
fla-andowas
ass-nairtelydi-n,alsikun-p)
re-ra
acat-sebyem-at
enthe
seen,er-hisata
ion.veandres-ningecknol
htith
ene/air counterflow flames[16]. As noted above, thexperiments take advantage of the spatial separabetween regions of peak soot (particles) and OH ccentrations in the opposed flow ethylene/air flamThis spatial separation allows a single laser putuned to resonance with an OH absorption, to be uto simultaneously measure OH laser-induced fluocence (LIF) and light scattering (Mie+ Rayleigh) bysoot particles.
3. Experimental conditions
The opposed flow burner is constructed of 3stainless steel, and is based on the design of Leand Chelliah[17]. Fuel (ethylene) and oxidizer (aiducts are 15 mm in diameter, and are separated10 mm. Flow rates for the experiments reported hwere 4.6 L/min ethylene and 6.2 L/min air. Thesevalues were chosen because they gave the most sflame. Ethanol vapor was added to fuel or oxidizgases using an injection pump (Isco). The ethawas injected as a liquid at room temperature intofuel or oxidizer gas lines approximately 2 m upstrefrom the gas entrance into the burner assemblywas assumed to vaporize completely. Ethanol ation was up to 0.08 mol fraction (8%) in the fueloxidizer gas stream. It should be noted that this le(8%) of addition to the oxidizer stream makes the “oidizer” a rich fuel/air mixture. The change in flambehavior as the oxidizer gas stream is transitionea fuel/air mixture is treated in detail in what followA shroud gas (nitrogen) surrounded both fuel andidizer ducts within the burner assembly to minimientrainment of room air into the flame. The burnwas enclosed in a chamber that was capable of bevacuated. However, for these experiments the acports of the chamber were left open and so all expments were run at atmospheric pressure. A schemof the experimental apparatus is shown inFig. 2.
Fig. 2. A schematic of the experimental apparatus.
The experimental procedure was as follows. Ame source was placed between the burner ductsgas flow was then commenced, with the opposed flflame igniting immediately. The nitrogen shroud gflow (5 L/min total) was initiated and the flame wallowed to stabilize for 5 min. For experiments uing fuel or oxidizer additive, a valve on the injectiopump was opened and flow of ethanol into theor ethylene streams was begun. After approxima1 min of flow of ethanol, a sheet of pulsed laser raation (typically 0.5 mJ/pulse, approx 20-ns duratioformed using a double apertured, half-cylindriclens) near a wavelength of 281 nm (Lambda PhyExcimer/Scanmate system: Coumarin 153 dye; Fdamental at 560 nm, 2× frequency to 281 nm; pumA2�+ (v = 1) ← X2� (v = 0), detect ((0,0), (1,1around 310 nm) was passed through the flamegion. A gated, unfiltered, intensified CCD came(Roper Scientific, 256×1024 pixels), equipped withNikor 1:4.5 UV lens, was used to measure laser ster during and immediately following the laser pul(camera gate width= 80 ns). The images produced100 laser pulses were averaged in the camera mory. From this average image, the maximum valuea given pixel location along the centerline betwethe fuel and the oxygen ducts was selected insooting and combustion regions of the flame (Fig. 3). A background value at that pixel locatiomeasured prior to the flame initiation (also 100 avaged images), was subtracted from this value. Tbackground-corrected pixel value became the dpoint representing peak particle or OH concentratFollowing data collection, the injection pump valwas closed, the pump flow parameters were reset,the process repeated. Planar laser-induced fluocence and light scatter measurements at the beginand end of each run series were performed to chthat the flame returned to normal after the etha
Fig. 3. (Upper) Simultaneous image of OH PLIF and ligscattering by soot particles. (Lower) Same image, but wthe laser tuned off of resonance with the OH absorption.

416 K.L. McNesby et al. / Combustion and Flame 142 (2005) 413–427
foreiedck-sereral-eldry
oot-ar-sevi-
re,vedionin
thean
ingrti-er’s
t
ooticleol-
-etic
hetedar-
ofze
nd-twono-
-r-
r isgh
ve-ant
flowof
d asng.ter-to
er-of
he-
er-ofum
toim-off
,0)
onign,IF
toha-eac-ed
es-nd
per-
iredn af theas
pro-heies
. Inhethe
llerro-henif-ge.acedal-
flow was stopped. Laser power was measured beand after each experimental run and typically varby less than 2%. Other than subtraction of baground, no corrections were made for changes in lapower or variations in spatial intensity, and no othspecific dark field pixel corrections were made,though previous measurements of the CCD dark fi(camera blocked) showed pixel to pixel output to vaby less than 2%.
The region of the flame referred to here as the sing region (and other flame regions) may contain pticles and polyaromatic hydrocarbons (PAH). ThePAH are known to fluoresce when exposed to ultraolet radiation[18]. For the experiments reported hewe are assuming that the bulk of the signal obserin the sooting region is from scattered laser radiat[19]. To evaluate the part of the observed imagethe sooting region due to light scatter, we dividedtheoretical treatment of the scattering process intoextinction part and a Mie theory part[20–22].
The intensity of scattered laser light (assumunit incident intensity and zero absorption) by pacles in the flame may be approximated by BouguLaw:
(2)I = exp(−3QempL/2ρd).
Here,I is the intensity of the scattered light,Qe is thesoot extinction coefficient,mp is the weight of sooparticles per unit volume,L is the pathlength, andρandd are the density and diameter of the average sparticle. This equation predicts that as soot partsize (d) decreases for a fixed soot mass per unit vume, scattering intensity increases.
According to Mie’s solution of Maxwell’s equations in spherical coordinates for an electromagnwave incident on a sphere[22], the angular distrib-ution of intensity and degree of polarization of tlight scattered by a collection of particles are relato both the size and index of refraction of the pticles. The general solution describing scatteringmonochromatic light by a single particle of any simay be described by
(3)Iθ = λ2/(8R2π2)[i1(θ) + i2(θ)
].
Here,Iθ is the light intensity scattered at angleθ , λ isthe wavelength of the incident radiation,R is the dis-tance from the particle to the point of observation, ai1(θ) andi2(θ) are angular distribution intensity functions that are dependent on the intensities of theplane polarized components of the scattered mochromatic incident light.
Application of Mie’s solutions for light scattering by particles is usually simplified by consideing the limiting cases where the particle diametemuch smaller than the wavelength of light (Raylei
scattering,λ−4 intensity dependence), near the walength of light (Mie scattering), or much greater ththe wavelength of light (diffractive optics). For lighscattering by nascent soot particles in opposedflames (soot particle sizes of tens to hundredsnanometers), the scattering is typically categorizehaving characteristics of Rayleigh and Mie scatteriFor observation at 90˚ to the incident beam, scating in both Rayleigh and Mie regions is predictedbe perpendicularly polarized and nonzero.
So, for measurement of scattering intensity ppendicular to the incident laser beam, by a cloudspherical particles with fixed size distribution, in tlimit of (3QempL/2ρd) � 1, the scattering intensity should be approximately proportional tomp, andhence to soot volume fraction.
Fig. 3shows images of simultaneous light scatting and OH LIF taken perpendicular to the planethe laser sheet. In this figure, the regions of maximparticle concentration and OH formation are seenbe well separated. Also shown in the figure is anage taken of the same flame with the laser tunedof resonance with the OH absorption transition ((1A2S ← X2P ).
Calculations used the OPPDIF flow code, basedthe Chemkin database, marketed by Reaction DesInc. The chemical mechanism input to the OPPDflow code used the Frenklach mechanism[10] forethane combustion, modified by one of us (T.A.L.)include ethanol addition. The final chemical mecnism incorporates 156 species and contains 659 rtions. Input conditions for the calculations assuminitial gas temperatures at 300 K, 1 atm total prsure, duct separation of 1 cm, and initial fuel aoxidizer gas stream velocities of 41 and 55 cm/s,respectively. For the burner system used in the eximents, the fuel velocity was approximately 41 cm/s,and the oxidizer velocity was approximately 55 cm/s.Duct separation was 1 cm. Each calculation requapproximately 100 min to reach convergence oPentium 4-based desktop computer. The results oChemkin calculations predict flow parameters (gvelocity, strain, etc.), temperature, and speciesfiles as a function of distance from the fuel duct. TFrenklach mechanism allows prediction of specprofiles for aromatic rings up to A4 (C16H10).
Two approaches were used for the calculationsthe first approach, the initial conditions input to tprogram specified a 60-point space grid betweenburner ducts, with grid spacings becoming smanear the combustion region. As the calculation pceeds, the program regrids to finer increments. Wthis initial grid was used, calculations often had dficulty converging, or took several hours to converThe second approach used a 5-point, evenly spgrid as the initial condition. The program was then

K.L. McNesby et al. / Combustion and Flame 142 (2005) 413–427 417
eryughsec-teriare
the. Tossary00.ult
er-e-
)re-
grid5).ere
onH,,e.gd us-meentpa-as-
filefor
y oflso
n-taub-ta,ceasH
cat-oadserA4usean
e.ofcal-niteoc-heityhee-nd
thenseon-ne)sedble
ro-ch-
ce
dis-c-ha-airsi-
lowed to regrid as the calculation proceeded. In evcase for which convergence was achieved, althofinal results for the two approaches agreed, theond approach converged faster. Convergence criused for Newton iteration and for time stepping wethe program default values, with the exception ofcases of 5 to 8% ethanol added to the air streamachieve convergence for these cases, it was neceto relax the convergence criteria by a factor of 1This reduction was achieved by relaxing the defavalues for the absolute (ATOL) and relative convgence criteria (RTOL) for Newton iteration from dfault values of 10−9 and 10−4, respectively, to 10−7
and 10−2. The absolute (ATIM) and relative (RTIMconvergence criteria for time stepping were alsolaxed from default values of 10−9 and 10−4, respec-tively, to 10−7 and 10−2. The final grid for thesecases contained approximately 2/3 the number ofpoints as for the other calculations (from 97 to 6The calculated results for all cases are included hfor completeness.
4. Results and discussion
4.1. Neat ethylene/air opposed flow flames
Fig. 4 shows a graph of calculated mole fractiprofiles versus distance from the fuel duct for OC2H2, C3H3, A1 (benzene, C6H6), and A4 (pyreneC16H10) for a neat ethylene/air opposed flow flamOverlaid ontoFig. 4are values of pixel intensity alonthe centerline between the burner ducts, measureing the light scattering/PLIF technique, for the saflame. The calculation is in reasonable agreemwith observation. The calculation predicts the seration of regions of maximum soot concentration (
Fig. 4. Results of calculations showing temperature proand separation of soot forming and flame radical regionsan undoped ethylene/air opposed flow flame, with overlameasured centerline pixel intensities for similar flame. Ashown is estimated position of stagnation plane.
suming A1–A4 to be soot precursors in fuel-rich evironments[23–25]) and OH. The experimental dain this figure have been background-corrected by stracting the pixel dark current. To compare the dathe spatial location of the peak from OH fluorescen(relative to the fuel duct) measured in the flame wmatched to the spatial location of the peak from Opredicted by the calculation. The measured light ster from particles in the flame (and also possible brband fluorescence from aromatics) is slightly cloto the fuel duct than the location of peak A1 andconcentrations predicted by the calculation. Becathe soot particles in the flame are likely larger thA4, thermophoretic forces[26] may be driving thelarger particles toward cooler regions of the flamAlso shown inFig. 4(dashed line) is an estimationthe location of the stagnation plane, based on theculations. We have given the stagnation plane a fiwidth defined by the point where the axial gas velity goes to zero (approximately 0.375 cm from tfuel duct) and the point where the radial gas velocis at a maximum (approximately 0.428 cm from tfuel duct). The initial fuel and oxidizer gas stream vlocities (for experiment and calculation) were 41 a55 cm/s, respectively.
To understand how adding ethanol vapor tofuel or oxidizer gases will affect the concentratioof OH and particles, we begin by identifying thmain chemical reactions in our mechanism respsible for the conversion of ethylene to A1 (benzein neat opposed flow flames. The approach we utakes advantage of the postprocessor utility availain Chemkin that allows calculation of the rates of pduction and destruction of each species in the meanism by each reaction involving that species.Fig. 5shows the rate of production of A1 versus distan
Fig. 5. The calculated rates of production of A1 versustance from the fuel duct for the top four contributing reations in the mechanism (out of 15 reactions in the mecnism involving A1). Calculation is for the neat ethylene/opposed flow diffusion flame. Also shown is estimated potion of stagnation plane.

418 K.L. McNesby et al. / Combustion and Flame 142 (2005) 413–427
-thege
heve-reae of
l-se
theit isre-
sedednetita-
d.an
uchoc-in
A1
-
eial%re-ich
he
eof
yl-e
a-ns
on.
ionsors,
htofer-D)oc-
ad-cur-eakof
la-in
ten-oxi-in-ingfore-ongter,ofgeres-g anolenbe
ar-a
hes
ngery.iesase
from the fuel duct for the top four contributing reactions in the mechanism (out of 15 reactions inmechanism involving A1). To assign a percentacontribution to A1 formation to each reaction, tarea under the curve (divided by the local gaslocity) for each reaction was integrated, and this aper reaction compared to the area for the total ratproduction for A1 (not shown inFig. 5). Accordingto this method, for A1 production in our neat ethyene/air opposed flow flame, the contribution of thefour reactions is
(R4)C3H3 + C3H3 → A1 73%,
(R5)n-C4H5 + C2H2 → A1 + H 12%,
(R6)l-C6H6 + H → A1 + H 8%,
(R7)n-C6H7 → A1 + H 6%.
It is worth noting that l-C6H6 andn-C6H7 are depen-dent upon reactions ofn-C4H5 with acetylene. Forradical species that are formed in one part(s) offlame, and consumed in other parts of the flame,necessary to modify this approach by limiting thegions of integration.
This approach was used in the neat oppoflow ethylene/air flame to follow carbon as it passfrom ethylene to A1. When the conversion from ospecies to another in the flame was near quantive (such as the initial decomposition step of C2H4to C2H3), tracing the reaction was straightforwarWhen the main path to A1 production was less thquantitative for destruction of a certain species (sas CH2 conversion to C3H3), it was necessary texamine the contribution of all reactions to prodution and destruction rates for species participatinga given reaction. Using this method, the path tofrom ethylene begins with the conversion of C2H4to C2H3 (99%, via H and OH), followed by conversion of C2H3 to acetylene (C2H2) (90%). Theformation of this acetylene “bath” is important to thchemistry of soot formation. However, as the initethylene/air mixture is fuel rich, approximately 44of the acetylene formed in this step remains unacted. The mechanism contains 77 reactions in whacetylene is a participant. Approximately 34% of tacetylene is converted to methylene (CH2) and sin-glet methylene (CH*2), approximately 4% of which isconverted to propargyl (C3H3), approximately 6% ofwhich is converted to A1. Although propargyl is thmain source of A1 formation, only a small fractionpropargyl reacts directly to form A1.
Table 1shows the stepwise conversion of ethene to A1 predicted by the calculation for this flamsystem, lists the reactions important for A1 formtion, and some of the important competing reactio(where applicable) for steps leading to A1 producti
Fig. 6. Graph of experimental measurements and predictbased upon calculations for OH, soot, and soot precursfor air side addition of ethanol.
Species in bold face in the reaction list on the rigside ofTable 1are the species for which the ratedestruction listed applies. Also shown is the tempature at which maximum rates of destruction (ROand rates of production (ROP) for several speciescur.
4.2. Oxidizer side addition of ethanol
In experiments and calculations, oxidizer sidedition of ethanol vapor reduces soot and soot presors. A graph of experimental measurements of plight scatter and OH fluorescence and predictionsspecies maximum mole fraction based on calcutions, for oxidizer side addition of ethanol, is shownFig. 6. The error in the measured scattered laser insity and OH fluorescence is estimated to be apprmately 5%, based upon pixel to pixel noise in thedividual images. Overall, the change with increasethanol addition of calculated peak mole fractionsthe species C2H2, A1, and A4 is in reasonable agrement with peak experimental values (measured althe centerline between burner ducts) of light scatwhile the change with increasing ethanol additionthe calculated peak mole fraction of OH is in averaagreement with peak measured values of OH fluocence, with calculation and experiment predictinsmall decrease in peak OH concentration with ethaaddition. The slight increase in light scattering whethanol vapor addition increases above 5% maydue to the transition from a diffusion flame to a ptially premixed diffusion flame, and the onset ofsecondary flame as the oxidizer mixture approacpremixed stoichiometry.
These results (decrease in soot, negligible chain peak OH concentration) at first seem contradictoSoot reduction by addition of an oxygenated specis generally interpreted to be caused by an incre

K.L. McNesby et al. / Combustion and Flame 142 (2005) 413–427 419
renthesis
Table 1Reaction path of ethylene to A1 for neat ethylene/air opposed flow diffusion flames
Max. T (K) at peak Neat ethylene/air opposed flow flame
ROP ROD
Note. Important reactions contributing to each species concentration are shown to the right. Percentage value in parefers to the amount of species inbold consumed or produced by that reaction.
-
n-ede-the
ingles.Helictsre-n.
ofthem-e.
ideofas
highonegas
irione.m-
in local OH radical[27] concentration, leading to increased soot oxidation:
CxHy (soot)+ OH → CO2 + H2O. (R8)
However, examination of the individual experimetal images (Fig. 7) shows that as ethanol is addto the oxidizer (air) stream, the width of the OH rgion increases. We believe that the broadening ofOH region for this flame is the key to understandthe decrease in measured light scattering by particFigs. 8 and 9show calculated temperature and Omole fraction as a function of distance from the fuduct. These figures show that the calculation predbroadening of the OH and high-temperature flamegions with increasing oxidizer side ethanol additio
Fig. 10 shows the calculated rate of destruction4% ethanol vapor added to the oxidizer side ofopposed flow flame, overlaid with the calculated teperature profile for this flame and for the neat flamThe region of ethanol destruction is shown to coincin location with the onset of the broadened regionhigh temperature in the flame to which ethanol hbeen added. We believe this broadened region oftemperature is indicative of a secondary flame zas the oxidizer gas gradually changes to a fuel/airmixture.
Qualitatively, addition of ethanol vapor to the astream causes the flame to change from a diffusflame toward a partially premixed diffusion flamThe broadening of the OH region and of the te

420 K.L. McNesby et al. / Combustion and Flame 142 (2005) 413–427
ar-d to
ea-les
ionion
ionighere-n-
ionir
F)in
intostionngre-
re-e
a-.
di-ofci-ned
pre-his
isionith
ply.m
ion
porinlyHre-
arehenon.
Fig. 7. Images of OH PLIF and light scattering by soot pticles as increasing amounts of ethanol vapor are addethe air side. Note increasing width of OH region (upper fture) and decreasing intensity of light scatter from partic(lower feature).
Fig. 8. Calculated temperature profiles for air side additof ethanol. Also shown is estimated position of stagnatplane.
perature profile moves the flame region (i.e., regof appreciable flame radical concentration and htemperature) closer to the stagnation plane, and thfore closer to the region of maximum soot concetration, thereby increasing the rate of soot oxidat(seeFigs. 8 and 9). Introduction of ethanol to the astream moves the flame from a soot formation (Stype toward a soot formation/oxidation (SFO) type,which soot particles must travel a shorter distancethe oxidation region[14]. As more ethanol vapor iadded to the air stream, the flame begins to transito a multiple flame structure due to partial premixias has been studied with other fuel-rich-oxidizer pmixed flames[28].
To explore further the mechanism of particleduction in these flames,Table 2shows the stepwis
Fig. 9. Calculated OH profiles for air side addition of ethnol. Also shown is estimated position of stagnation plane
Fig. 10. Calculated temperature profile for air side adtion of ethanol, overlaid with overall rate of destructionethanol vapor (4% mole fraction fuel side). Note the coindence of ethanol vapor combustion with edge of broadetemperature profile.
reactions of ethanol added to the oxidizer streamdicted by the calculation for this flame system. Ttable shows the reaction of ethanol and air in thepre-mixed region of the diffusion flame. This regionthe region between the oxidizer duct and the diffusflame zone, when there is ethanol vapor mixed in wthe oxidizer gas. As inTable 1, species in bold face inthe reaction list on the right side ofTable 2are thespecies for which the rates of destruction listed apAlso shown is the temperature at which maximurates of destruction (ROD) and rates of product(ROP) for several species occur.Table 2shows thatin the lean premixed flame region, the ethanol vais converted by a series of oxidation reactions (mainvolving H atom abstraction) to eventually yield Oand CO, prior to reaching the main combustiongion of the diffusion flame (seeFig. 10). The OH andCO produced by the premixed ethanol/air flameformed at a temperature near 1500 K, and are tconvected into the diffusion flame combustion regi
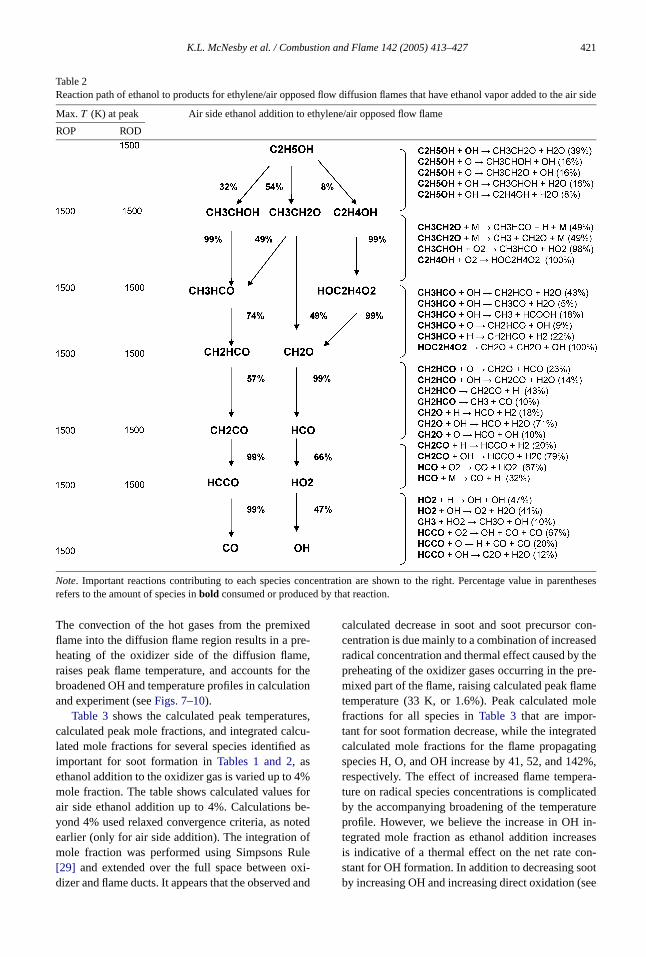
K.L. McNesby et al. / Combustion and Flame 142 (2005) 413–427 421
e air side
rentheses
Table 2Reaction path of ethanol to products for ethylene/air opposed flow diffusion flames that have ethanol vapor added to th
Max. T (K) at peak Air side ethanol addition to ethylene/air opposed flow flame
ROP ROD
Note. Important reactions contributing to each species concentration are shown to the right. Percentage value in parefers to the amount of species inbold consumed or produced by that reaction.
edre-e,r thetion
es,lcu-as
4%for
be-otedofulexi-and
con-edthere-meole
teding2%,ra-ted
turein-sesn-
ootsee
The convection of the hot gases from the premixflame into the diffusion flame region results in a pheating of the oxidizer side of the diffusion flamraises peak flame temperature, and accounts fobroadened OH and temperature profiles in calculaand experiment (seeFigs. 7–10).
Table 3shows the calculated peak temperaturcalculated peak mole fractions, and integrated calated mole fractions for several species identifiedimportant for soot formation inTables 1 and 2, asethanol addition to the oxidizer gas is varied up tomole fraction. The table shows calculated valuesair side ethanol addition up to 4%. Calculationsyond 4% used relaxed convergence criteria, as nearlier (only for air side addition). The integrationmole fraction was performed using Simpsons R[29] and extended over the full space between odizer and flame ducts. It appears that the observed
calculated decrease in soot and soot precursorcentration is due mainly to a combination of increasradical concentration and thermal effect caused bypreheating of the oxidizer gases occurring in the pmixed part of the flame, raising calculated peak flatemperature (33 K, or 1.6%). Peak calculated mfractions for all species inTable 3 that are impor-tant for soot formation decrease, while the integracalculated mole fractions for the flame propagatspecies H, O, and OH increase by 41, 52, and 14respectively. The effect of increased flame tempeture on radical species concentrations is complicaby the accompanying broadening of the temperaprofile. However, we believe the increase in OHtegrated mole fraction as ethanol addition increais indicative of a thermal effect on the net rate costant for OH formation. In addition to decreasing sby increasing OH and increasing direct oxidation (

422 K.L. McNesby et al. / Combustion and Flame 142 (2005) 413–427
;2.4
8;1
.98
;1.5
4;1
.14
;0.7
5
dic-cur-
ionde-
onon-
di-ors,elys ofdic-cal-
nal-ns
OH5%,
-ng),u-inea-) ofel
oleakandtra-
nolblenoli-
Table
3T
heca
lcul
ated
chan
gein
peak
and
inte
grat
edm
ole
frac
tion
for
air
side
etha
nola
dditi
onfo
rH
,O,O
H,C
H2,C
2H
2,C
3H
3,n
-C4H
5,C
4H
6,A
1,an
dA
4
Mol
efr
actio
nE
tOH
T (K)
Pea
km
ole
frac
tion;
inte
grat
edm
ole
frac
tion
(mol
efr
actio
n-cm
)
H (×10
−4)
O (×10
−4)
OH
(×10
−4)
CH
2(×
10−6
)C
2H
2(×
10−2
)C
3H
3(×
10−6
)n-C
4H
5(×
10−8
)C
4H
6(×
10−4
)A
1(×
10−5
)A
4(×
10−9
)
020
5365
;3.9
752
;2.7
74;3
.93
57;1
.46
5.5;
0.65
110
4;7.
751
;2.3
927
;2.3
014
;1.4
425
120
5862
;4.2
047
;2.8
76;4
.58
52;1
.44
5.4;
0.65
597
;7.4
47;2
.27
27;2
.25
13;1
.35
192
2062
59;4
.40
44;3
.077
;5.4
147
;1.4
05.
3;0.
658
90;7
.145
;2.1
427
;2.2
412
;1.2
515
320
6854
;4.8
039
;3.3
77;6
.62
41;1
.38
5.2;
0.66
082
;6.8
40;2
.01
26;2
.24
11;1
.15
114
2086
48;5
.60
32;4
.178
;9.5
035
;1.4
05.
0;0.
670
75;6
.536
;1.8
726
;2.2
79;
1.03
7
%ch
ange
+1.6
(33
K)
−26;
+41
−63;
+52
+5.4
;+14
2−3
8;−4
−9;+
3−2
8;−1
6−2
9;−2
2−4
;−1
−33;
−28
−72;
−70
Note
.Thi
sta
ble
ispr
esen
ted
tosh
owth
atm
osts
peci
esin
fluen
cing
A1
and
A4
prod
uctio
nar
eaf
fect
edby
air
side
addi
tion
ofet
hano
lvap
or. Fig. 11. Graph of experimental measurements and pre
tions based upon calculations for OH, soot, and soot presors, for fuel side addition of ethanol.
(R8)), the thermal effect decreases A1–A4 formatby increasing integrated OH and H mole fraction,creasing the amount of CH2 available for reaction topropargyl. Formation of propargyl (C3H3) is depen-dent upon the reaction:
CH2 + C2H2 → C3H3 + H. (R9)
The rate of production of propargyl by this reactidecreases approximately 28% when the oxidizer ctains 4% mole fraction ethanol.
4.3. Fuel side addition
In experiments and calculations, fuel side adtion of ethanol increases soot and soot precurswhile peak OH concentrations remain approximatconstant. A graph of experimental measurementpeak light scatter and OH fluorescence and pretions of species maximum mole fraction based onculations, for fuel side addition of ethanol, is showin Fig. 11. The calculated data have been normized to the experimental data to allow comparisoof the trends shown by each. As inFig. 6, the er-ror in the measured scattered laser intensity andfluorescence is estimated to be approximatelybased upon pixel to pixel noise in the individual images. Overall, the trend of the change (increasiwith increasing fuel side ethanol addition, of calclated peak mole fractions for the species A1–A4 isgood agreement with peak experimental values (msured along the centerline between burner ductslight scatter, while the change, with increasing fuside ethanol addition, of the calculated peak mfraction of OH is in reasonable agreement with pemeasured values of OH fluorescence. Calculationexperimental measurement show peak OH concention to remain nearly constant with increasing ethaaddition. For these flames, the calculation was ato reach convergence for all mole fractions of ethausing an initial grid of 60 points. Individual exper

K.L. McNesby et al. / Combustion and Flame 142 (2005) 413–427 423
eatthe
ieldemenge
d toiblel for
and
%ted
eeb-m-lcu-
n-de-ded
ion4
(a)
(b)
(c)
(d)
Fig. 12. Calculated A1 (a), A2 (b), A3 (c), and A4 (d) molefraction profiles for increasing amounts of ethanol vaporadded to the fuel stream.
Fig. 13. Calculated temperature and OH profiles for nflames and for flames with 8% ethanol vapor added tofuel stream. Intermediate values of ethanol addition ytemperatures and OH profiles between those for the extrvalues. Note that the calculation predicts negligible chain OH and temperature for fuel side addition of ethanol.
Fig. 14. Calculated acetylene (C2H2) and propargyl (C3H3)profiles for increasing amounts of ethanol vapor addethe fuel stream. Note that the calculation predicts negligchange in acetylene and very small decrease in propargyfuel side addition of ethanol.
mental images do not show apparent differencesare not reproduced here.
Calculations predict that addition of 8 molethanol to the fuel stream increases the integramole fraction of aromatic species A1 (C6H6), A2(C10H8), A3 (C14H10), and A4 (C16H10) by ap-proximately 3, 19, 23, and 22%, respectively (sFigs. 12a–12d). The peak increase in light scatter oserved experimentally was approximately 19%. Teperature and OH concentration are predicted by calation to remain approximately constant (seeFig. 13).Acetylene is predicted to remain approximately costant while propargyl concentration is predicted tocrease approximately 9% when 8% ethanol is adto the fuel stream (Fig. 14). In what follows, the pro-duction of soot precursors is divided into a discussof A1 formation followed by a discussion of A2–Aformation.

424 K.L. McNesby et al. / Combustion and Flame 142 (2005) 413–427
fuel side
rentheses
Table 4Reaction path of ethanol to products for ethylene/air opposed flow diffusion flames that have ethanol vapor added to the
Max. T (K) at peak Fuel side ethanol addition to ethylene/air opposed flow flame
ROP ROD
Note. Important reactions contributing to each species concentration are shown to the right. Percentage value in parefers to the amount of species inbold consumed or produced by that reaction.
oledi-deonon-tee,
e as
1
4.3.1. A1 formationBecause the calculated change in propargyl m
fraction with ethanol addition was in the oppositerection of the change in A1 mole fraction for fuel siethanol addition, a calculation of rate of formatiof A1 by reaction was performed. The reactions ctributing to A1 formation, and the change in A1 raof formation per reaction, relative to the neat flamwhen 8% ethanol was added to the fuel stream, ar
follows:
Reaction Calculated change in rate of Aformation—8% EtOH additionto fuel (relative to neat flame)
C3H3 + C3H3 → A1 −8% (R4)n-C4H5 + C2H2 → A1 + H 23% (R5)l-C6H6 + H → A1 + H 27% (R6)n-C6H7 → A1 + H 34% (R7)

K.L. McNesby et al. / Combustion and Flame 142 (2005) 413–427 425
inedhe
redngenol
andacknol,si-deay-theonofsis
cald-ghtcies
d-
ithrase-di-r-
ofact
rate
th-
tionxi-
m-thepar-
A1
ofon
r-f
ies.
n ofyl-
duc-n to
re-en-thectedandeele
isad-
med
onhe
th-
The calculation predicts that all of the increaseA1 produced by fuel side ethanol addition is causby reactions other than propargyl recombination. Treactions of phenyl (A1·) influencing A1 formation,
A1· + H (+M) → A1 (+M), (R10)
A1 + OH → A1· + H2O, (R11)
are included in the mechanism but are not consideimportant here for A1 formation because the chain rate of each was less than 1% with fuel side ethaaddition.
To understand why propargyl is decreased,why (R5)–(R7) are enhanced, it is necessary to trthe path of oxygen and carbon added, via ethato the fuel gas. A listing of the reactions responble for the increase in soot formation for fuel siethanol addition, predicted by the calculations, mbe found inTable 4. The initial decomposition reactions for ethanol when added on the fuel side offlame differ from those for air side ethanol additi(seeTable 2). For fuel side addition, in the absenceoxygen, ethanol decomposition occurs via a pyrolymechanism at approximately 1500 K:
(R12)C2H5OH (+M) → C2H4 + H2O (+M) 58%,
(R13)C2H5OH (+M) → CH3 + CH2OH (+M) 30%,
(R14)C2H5OH (+M) → C2H5 + OH (+M) 8%.
The ethylene, water, ethyl radical, and OH radiformed from the initial decomposition have little aditional effect on the chemistry as they are very sliperturbations on the concentrations of these sperelative to the neat flame (seeFigs. 13 and 14) orare similar to fuel or initial fuel decomposition proucts. The bulk of the reactive oxygen (as CH2OH) isstepwise-converted to HCO, which then reacts wpropargyl to yield CO and C3H4, which is then neaquantitatively reconverted to propargyl. The increin other soot precursors[6] predicted by the calculation may be ascribed to introduction of methyl racal (R13) into a relatively low-temperature hydrocabon/acetylene bath[14].
The methyl radicals formed in cooler regionsthe flame (1400–1700 K) via ethylene pyrolysis rewith propargyl (C3H3) to form C4H6:
C3H3 + CH3 (+M) → C4H6 (+M). (R15)
This reaction shows a calculated increase in theof production of C4H6 of 17% for the flame with8 mol% fraction ethanol compared to the neat eylene/air flame. Mole fraction profiles (seeFig. 14)of propargyl show a slight decrease in concentraover this temperature range (1400–1700 K). Appromately 85% of the C4H6 reacts with H to form C4H5,
Fig. 15. Rates of production of A1 by the three most iportant reactions contributing to A1 production. Noteenhancement of rates of reactions that do not involve progyl.
which then reacts in the acetylene bath to formand aromatic precursors.
C4H6 + H → C4H5 + H2, (R16)
C4H5 + C2H2 → A1 + H, (R17)
C4H5 + C2H2 → n-C6H7. (R18)
Overall, the calculation predicts that the additionethanol to the fuel stream has a negative effectintegrated C3H3 concentration while enhancing altenate pathways, via C4H6 production, to formation oinitial aromatic ring species (seeFig. 15). This resultwas not anticipated prior to the experimental studHowever, it should be noted that other researchers[9]have measured soot increases during combustioethanol/hydrocarbon mixtures, relative to neat ethene combustion. Increases in soot precursor protion have also been reported for methane additioheptane/air flames[30].
4.3.2. A2–A4 formationFor fuel side ethanol addition, the calculation p
dicts an increase in integrated mole fraction of bzene of 3% when 8% ethanol is added, relative toneat flame. For the same comparison, the prediincrease in A2 (naphthalene), A3 (phenanthrene),A4 (pyrene) is 19, 23, and 22%, respectively (sFigs. 12a–12d). However, the absolute change in mofraction of A1 with 8% fuel side ethanol additiongreater than 10 times the absolute change in A2dition. The change in mole fraction in going frothe neat flame to the flame with 8% ethanol addto the fuel side for A1, A2, A3, and A4 is 5× 10−7,4.2 × 10−8, 1.6 × 10⁻⁹, and 4.8 × 10⁻¹⁰, respec-tively. In contrast to the reaction path to A1 formatidiscussed above, the formation of A2–A4 follows tH-abstraction–C2H2-addition mechanism[31]. ForA1 conversion to A2, an example of one of the pa

426 K.L. McNesby et al. / Combustion and Flame 142 (2005) 413–427
or-esandiorideeri-er-mi-ntous-
ainis
teder-
file.thea-ionnte-andootiththatasal
ofialac-m.
ofton
ofonughser-
intionol
in-isml-tion
era-nge
yandankchns.a-
s-
ass,
H.. J.
ci-
nnel
neheent
ci.
tin,
ess,
)
ways may be summarized as follows:
5. Conclusion
This study provides an example of how soot fmation in opposed flow ethylene/air diffusion flamis dependent upon temperature, flame radical,bath gas compositions. Differing chemical behavin opposed flow flames depending on fuel or air saddition of ethanol vapor has been observed expmentally and modeled, and shown to occur via diffent pathways within the context of a detailed checal mechanism. In particular, ethanol introduced ithe air side of the flame creates a premixed combtion (secondary flame zone) region prior to the mdiffusion flame region. Hot gas products from thpremixed flame region, including OH, are convecinto the diffusion flame zone, increasing peak tempature and broadening the OH concentration proThe broadened OH concentration profile movesoxidizing region of the flame closer to the stagntion plane and to the high soot concentration regof the flame. The increased temperature and igrated OH mole fraction cause an increase in sootsoot-precursor oxidation, leading to lower overall sconcentrations in ethylene/air diffusion flames wethanol added to the air stream. It should be notedthe effect of radiation from soot in the experiment wnot accounted for in the “particle-free” computationmodel.
When ethanol is introduced into the fuel streamthe ethanol/air opposed flow diffusion flame, initdecomposition of ethanol occurs via pyrolysis retions because of the lack of oxygen in the fuel strea
Methyl radical produced during the initial stepsdecomposition of ethanol reacts with propargylproduce C4H6, which leads to increased productioof A1.
In summary, we believe that the additionethanol to the air side of the ethylene/air diffusiflame decreases soot concentration mainly throa thermal mechanism. This is supported by obvation of the flame and the calculated increasetemperature (33 K) and increase in OH concentra(142%) relative to the neat flame. Addition of ethanto the fuel side of the ethylene/air diffusion flamecreases soot mainly through a chemical mechaninvolving introduction of methyl radical into an ethyene/acetylene bath. This is supported by observaof the flame and the calculated constant tempture and OH concentrations over the studied raof ethanol addition.
Acknowledgments
Funding support for this work was provided bthe U.S. DoD Strategic Environmental ResearchDevelopment Program (SERDP). The authors thMichael Frenklach and Charles Westbrook for muof the chemical mechanism used in the calculatioAlso, the authors thank Sukh Sidhu, Med Colket, Vleri Babushok, and William Anderson for helpful dicussions.
References
[1] R.P. Howard, Experimental Characterization of GTurbine Emissions at Simulated Altitude ConditionSeptember 1996, AEDC-TR-96-3.
[2] D.W. Dockery, C.A. Pope, X. Xu, J.D. Spengler, J.Ware, M.E. Fay, B.G. Ferris, F.E. Speizer, N. EnglMed. 329 (1993) 1753–1759.
[3] M.F. Denisenko, A. Pao, M.-S. Tang, G.P. Pfeifer, Sence 273 (1996) 430–432.
[4] R. Niedzwiecki, Aircraft Technology and its Relatioto Emissions, Report of The Intergovernmental Paon Climate Change, IPCC, chap. 7, in press.
[5] Reduced PM2.5 Emissions for Military Gas TurbiEngines Using Fuel Additives, administered by tStrategic Environmental Research and DevelopmProgram (DoD, EPA, DOE).
[6] H. Richter, J.B. Howard, Progr. Energy Combust. S26 (2000) 565–608.
[7] M.B. Colket, R.J. Hall, in: H. Bockhorn (Ed.), SooFormation in Combustion, Springer-Verlag, Berl1994, p. 417.
[8] I. Glassman, Combustion, second ed., Academic PrSan Diego, 1987, pp. 360–375.
[9] A. Alexiou, A. Williams, Combust. Flame 104 (199651–65.

K.L. McNesby et al. / Combustion and Flame 142 (2005) 413–427 427
ns
r,ctsn
ar,
96)
01)
28
3
5
7)
st.
st.
st.
ond
-
ust.
-
st.
n-
ofnd
rk,
f-34
7)
[10] J. Appel, H. Bockhorn, M.Y. Frenklach, HydrocarboCombust. Flame 121 (2000) 122–136.
[11] R.J. Hall, M.D. Smooke, M.B. Colket, in: F.L. DryeR.F. Sawyer (Eds.), Physical and Chemical Aspeof Combustion—A Tribute to Irvin Glassman, Gordoand Breach, New York, 1997, pp. 189–230.
[12] E.J. Welle, W.L. Roberts, C.D. Careter, J.M. DonbCombust. Flame 135 (2003) 285–297.
[13] C.R. Shaddix, K.C. Smyth, Combust. Flame 107 (19418–452.
[14] J.Y. Hwang, S.H. Chung, Combust. Flame 125 (20752–762.
[15] M.D. Rumminger, G.T. Linteris, Combust. Flame 1(2002) 145–164.
[16] D.X. Du, H. Wang, C.K. Law, Combust. Flame 11(1988) 264–270.
[17] A.M. Lentati, H.K. Chelliah, Combust. Flame 11(1998) 158–179.
[18] I.M. Kennedy, Combust. Sci. Technol. 59 (10(1988) 1.
[19] K.C. Smyth, C.R. Shaddix, D.A. Everest, CombuFlame 111 (1997) 185–207.
[20] J.B. Howard, W.J. Kausch, Progr. Energy CombuSci. 6 (1980) 263–276.
[21] K.T. Kang, J.Y. Hwang, S.H. Chung, CombuFlame 109 (1997) 266–281.
[22] P.C. Reist, Aerosol Science and Technology, seced., McGraw–Hill, New York, 1993, pp. 263–275.
[23] K.H. Song, P. Nag, T.A. Litzinger, D.C. Haworth, Combust. Flame 135 (2003) 341–349.
[24] H.F. Calcote, Combust. Flame 42 (1981) 215–242.[25] B.S. Haynes, H.G. Wagner, Progr. Energy Comb
Sci. 7 (1981) 229–273.[26] C.J. Sung, J.S. Kistler, M. Nishioka, C.K. Law, Com
bust. Flame 105 (1996) 189–201.[27] C.R. Shaddix, J.E. Harrington, K.C. Smyth, Combu
Flame 99 (1994) 723–732.[28] R.D. Lockett, B. Boulanger, S.C. Harding, D.A. Gree
halgh, Combust. Flame 119 (1999) 109–120.[29] M. Abramowitz, I.A. Stegun (Eds.), Handbook
Mathematical Functions with Formulas, Graphs, aMathematical Tables, ninth ed., Dover, New Yo1972, p. 886.
[30] J.F. Roesler, S. Martinot, C.S. McEnally, L.D. Pfeferle, J.-L. Delfau, C. Vovelle, Combust. Flame 1(2003) 249–260.
[31] H. Wang, M. Frenklach, Combust. Flame 110 (199173–221.