EXPERIMENTAL ANALYSIS OF THE AERODYNAMICS OF POROUS FLAP SIDE-EDGE FOR NOISE REDUCTION
12
22nd International Congress of Mechanical Engineering (COBEM 2013) November 3-7, 2013, Ribeirão Preto, SP, Brazil Copyright © 2013 by ABCM EXPERIMENTAL ANALYSIS OF THE AERODYNAMICS OF POROUS FLAP SIDE-EDGE FOR NOISE REDUCTION Francisco Plata Moraleda Universidad Politecnica de Madrid , Madrid Spain Fernando Martini Catalano Aeronautical Engineering Department – EESC – USP, Av. Trabalhador São-carlense, 400, Pq Arnold Schimidt, 13566-590 – São Carlos – SP, Brazil [email protected] Abstract. Experimental testes were carried out to investigate the flow near a flap side-edge with attached porous plate as a potential noise reduction device. The experiments were performed over a wing to simplify the installation. The objective was to perform a first approximation to the flow field produced by the addition of porosity of different sizes. Specifically, the changes in tip vortex were studied. Baseline case and plates of 10mm, 20mm, 30mm, 50mm and 70mm placed in the bottom side of the wing tip were tested. Also another configuration was tested, with a plate of 25mm roughly placed in the attachment line of the vortex. Aerodynamic experiments were performed to evaluate the changes in the lift, drag and pitching moment coefficients. Hot wire anemometry measurements were performed in perpendicular planes to the direction of the undisturbed flow. Problems in the calibration were detected, that corrupts all the values. Nevertheless, first results about the behavior of the flow field were achieved. The addition of the porous plate transforms the structure of the vortex by dramatically decreasing the axial velocity in the core center transforming the tip vortex from a jet vortex to a wake vortex. Vorticity was also changed with a noticeable decrease. From 30mm porous strip, this decrease becomes asymptotic. There are some structures that are not completely explained. The attachment line plate and the 10mm plate cases present a complex structure, which seems due to various vortices. The 50mm and 70mm plates show a merging between the wake and the vortex. The addition of the porous plate weakens the mechanisms of noise production. It is judged that this will lead to a noise reduction. Keywords: flap side edge vortex, porous wing tip, experimental aerodynamics 1. INTRODUCTION The noise produced for the aircrafts become a more important constraint in the design in the last years, due to the new normative and the high rate of growing of the civil aviation. The advances in engine technology achieve an important reduction in engine noise that put the airframe noise in the spotlight. The noise produced by the aircrafts becomes a more and more important problem with the increase of the civil aviation. For many years, the critical source of noise was the engine. Around 1970, the introduction of high-bypass engine ratio for fuel saving becomes in an important reduction of the noise. The aircraft noise became the bottleneck for noise reduction and was put into the spotlight [Choudhari and Khorrami, 2003]. Studies about the aircraft noise began, whether developing empirical models, either searching for methods to decrease it. However, it was in the last years that the major actors put in the focus the noise reduction. NASA’s Advanced Subsonic Technology (AST) program starts in 1995 and supposed a great effort to decrease noise [Strett, 1998]. The aim is to reduce noise one half respects to 1997 technology within 10 years and three quarters (20 dB) within 25 years [Dobrzynski, 2010]. Whereas, the European Union proposes to reduce the noise one half respect to 2000 technology, included inside the objectives of the "Vision for 2020" [Visions2020, 2001]. Figure 1 shows a diagram with the two goals. The Projeto Aeronave Silenciosa is another example of the effort that is being done in this direction. The present work is included in the framework of the investigations of this project. The airframe noise is especially important during the approach, when the engines are throttled down and the high-lift devices are displayed. The major sources of noise are the landing gear, the spoilers and the high-light devices situated both in the leading and the trailing edge, like slats and flaps [Khorrami and Singer, 1999].A number of projects to reduce this type of noise were developed for the major actors in aeronautics. The present work is included in the framework of the investigations of one of these projects, the Projeto Aeronave Silenciosa which is coordinated by the University of São Paulo (USP) and supported by FINEP and EMBRAER (Empresa Brasileira de Aeronáutica). One of the most promising methods developed in the project Aeronave Silenciosa is the use of a porous plate to diminish the noise produced for the flap side-edge. An appreciable diminution in noise was achieved [Catalano et al., 2012]. Nevertheless, the mechanism of noise reduction was not completely understood. A wing with different sizes of porous plate was tested to improve the knowledge about the physical process. Aerodynamic forces were measured, as well as the flow field in a plane perpendicular to freestream velocity, using 3D hot-wire probe. The aim is to have a first understanding of the porous plate effect in the tip vortex, although the physical process is not exactly the same in a wing that in a flap. The field of study is really large and this work should be extended with more researches.
Transcript of EXPERIMENTAL ANALYSIS OF THE AERODYNAMICS OF POROUS FLAP SIDE-EDGE FOR NOISE REDUCTION
22nd International Congress of Mechanical Engineering (COBEM 2013) November 3-7, 2013, Ribeirão Preto, SP, Brazil
Copyright © 2013 by ABCM
EXPERIMENTAL ANALYSIS OF THE AERODYNAMICS OF POROUS
FLAP SIDE-EDGE FOR NOISE REDUCTION
Francisco Plata Moraleda Universidad Politecnica de Madrid , Madrid Spain
Fernando Martini Catalano Aeronautical Engineering Department – EESC – USP, Av. Trabalhador São-carlense, 400, Pq Arnold Schimidt, 13566-590 – São
Carlos – SP, Brazil
Abstract. Experimental testes were carried out to investigate the flow near a flap side-edge with attached porous plate
as a potential noise reduction device. The experiments were performed over a wing to simplify the installation. The
objective was to perform a first approximation to the flow field produced by the addition of porosity of different sizes.
Specifically, the changes in tip vortex were studied. Baseline case and plates of 10mm, 20mm, 30mm, 50mm and 70mm
placed in the bottom side of the wing tip were tested. Also another configuration was tested, with a plate of 25mm
roughly placed in the attachment line of the vortex. Aerodynamic experiments were performed to evaluate the changes
in the lift, drag and pitching moment coefficients. Hot wire anemometry measurements were performed in
perpendicular planes to the direction of the undisturbed flow. Problems in the calibration were detected, that corrupts
all the values. Nevertheless, first results about the behavior of the flow field were achieved. The addition of the porous
plate transforms the structure of the vortex by dramatically decreasing the axial velocity in the core center
transforming the tip vortex from a jet vortex to a wake vortex. Vorticity was also changed with a noticeable decrease.
From 30mm porous strip, this decrease becomes asymptotic. There are some structures that are not completely
explained. The attachment line plate and the 10mm plate cases present a complex structure, which seems due to
various vortices. The 50mm and 70mm plates show a merging between the wake and the vortex. The addition of the
porous plate weakens the mechanisms of noise production. It is judged that this will lead to a noise reduction.
Keywords: flap side edge vortex, porous wing tip, experimental aerodynamics
1. INTRODUCTION
The noise produced for the aircrafts become a more important constraint in the design in the last years, due to the
new normative and the high rate of growing of the civil aviation. The advances in engine technology achieve an
important reduction in engine noise that put the airframe noise in the spotlight. The noise produced by the aircrafts
becomes a more and more important problem with the increase of the civil aviation. For many years, the critical source
of noise was the engine. Around 1970, the introduction of high-bypass engine ratio for fuel saving becomes in an
important reduction of the noise. The aircraft noise became the bottleneck for noise reduction and was put into the
spotlight [Choudhari and Khorrami, 2003]. Studies about the aircraft noise began, whether developing empirical
models, either searching for methods to decrease it. However, it was in the last years that the major actors put in the
focus the noise reduction. NASA’s Advanced Subsonic Technology (AST) program starts in 1995 and supposed a great
effort to decrease noise [Strett, 1998]. The aim is to reduce noise one half respects to 1997 technology within 10 years
and three quarters (20 dB) within 25 years [Dobrzynski, 2010]. Whereas, the European Union proposes to reduce the
noise one half respect to 2000 technology, included inside the objectives of the "Vision for 2020" [Visions2020, 2001].
Figure 1 shows a diagram with the two goals.
The Projeto Aeronave Silenciosa is another example of the effort that is being done in this direction. The present
work is included in the framework of the investigations of this project. The airframe noise is especially important during
the approach, when the engines are throttled down and the high-lift devices are displayed. The major sources of noise
are the landing gear, the spoilers and the high-light devices situated both in the leading and the trailing edge, like slats
and flaps [Khorrami and Singer, 1999].A number of projects to reduce this type of noise were developed for the major
actors in aeronautics. The present work is included in the framework of the investigations of one of these projects, the
Projeto Aeronave Silenciosa which is coordinated by the University of São Paulo (USP) and supported by FINEP and
EMBRAER (Empresa Brasileira de Aeronáutica).
One of the most promising methods developed in the project Aeronave Silenciosa is the use of a porous plate to
diminish the noise produced for the flap side-edge. An appreciable diminution in noise was achieved [Catalano et al.,
2012]. Nevertheless, the mechanism of noise reduction was not completely understood. A wing with different sizes of
porous plate was tested to improve the knowledge about the physical process. Aerodynamic forces were measured, as
well as the flow field in a plane perpendicular to freestream velocity, using 3D hot-wire probe. The aim is to have a first
understanding of the porous plate effect in the tip vortex, although the physical process is not exactly the same in a wing
that in a flap. The field of study is really large and this work should be extended with more researches.

Francisco Plata Moraleda, Fernando Martini Catalano Experimental Analysis of Porous Flap Side-Edge for Noise Reduction
1.1 Flap Noise.
The theoretical analysis of the sources of flap noise is out of the objectives of this work. Nevertheless, a revision of
some of the theories existing in the literature is done in this section, in order to support the experimental results with
theoretical explanations. The main source of noise in the flap is the side-edge, where a strong vortex is produced due to
the difference of lift between flapped and unflapped sections (Fig. 2). This vortex is feeding with vorticity from the
cylindrical shear layer. Both experimental and computational studies confirm this fact [Angland, 2008, Catalano et al.,
2012, Brooks and Humphreys, 2003, Strett, 1998]. Consequently, all of the literature about flap noise is actually about
flap side-edge noise. The noise produced is present in a large range of frequencies, that makes more difficult the study,
specially with computational methods [Strett, 1998]. There are a lot of approaches to explain the noise generation in
flap side-edge. The theories presented here are only a little part of the literature, selected either because of its
importance, either because of they agree with a large number of studies, either because they present a model that can be
interesting for the present work. All of the works agree with the next idea [Catalano et al., 2012]: there is a 2-vortex
system, one smaller located at the top surface and one stronger at the bottom one, attached to the side-edge. The
structure of the vortices can be seen at Fig. 2. The vortex resulting of the merge of these two is one of the fundamental
sources of noise. This merging happens approximately at the mid-chord. The computational study of [Choudhari and
Khorrami, 2003] mentions four sources of noise: free shear layers and their rollup, formation of multiple vortices,
vortex merging and vortex bursting. The last mechanism only is produced when the flap deflection reaches a critical
value.
Figure 1Goals in noise reduction for 2020 Figure 2 Contours of streamwise vorticy. [Strett, 1998].
The article mentioned above is especially relevant for this work, because analyze how the flow field is changed with
the introducing of a porous plate. The article of [Khorrami and Singer, 1999] focuses in the mechanisms of noise
generation in flaps. Analyzing the possible instabilities of the flow, it proposes five sources of noise: 1) large-scale flow
fluctuations due to the free-shear layer, 2) large scale flow fluctuations due to the post merged vortex downstream, 3)
convection of the turbulent boundary layer, 4) vortex merging and 5) vortex bursting. Only two of these mechanisms
are studied, considered as the most potentially unstable, 1) and 2). The first refers to the shear layer that emanates from
the flap bottom edge and spans the entire flap chord. The second one refers to the vortex produced by the merge of the
two initial vortices, roughly in the mid-chord region. The fifth mechanism, the vortex breakdown, only appears when
there is a great adverse pressure gradient, that is, when the angle of attack is high enough. In this case it can be
dominant. The work of [Strett, 1998] analyzes numerically the flow field around the flap side-edge, in order to
understand the unsteady fluid dynamics associated with the high-lift system. It employs a series of hypothesis that
allows executing this with a reduced computational cost, separating the calculation of the flowfield and the calculation
of the sound level. The Section 2.4 explains with more detail the assumptions employed in the code. The conclusions
that are achieved are roughly the same that with the experimental methods. First, there is a broadband instability
associated with the cylindrical shear layer that supposes relevant part of the noise. Secondly, the vortex formed at the
side-edge has another family of disturbances. There is a concentrated region along the chord that is the fundamental
source of noise. All of these results agree with the experimental data, suggesting that the source noises were correctly
captured. The article of [Brooks and Humphreys, 2003] develops successfully two noise prediction methods, a causality
approach and an edge-noise scatter solution. The initial hypothesis is that the first mechanism of generation is the
instability of the cylindrical shear layer and the pressure scatter related with it. The two methods achieve a good
agreement with the experimental result and only the activation of the vortex bursting introduces a significant error. This
is because the contribution of the vortex bursting is not localized to just the immediate edge region. This remarks the
importance of study the process of vortex bursting for elevated angles of attack. Employing porous materials are one of
the most prevalent ways to reduce the noise of the flap side-edge. It is the method that is going to be evaluated
experimentally in the present work. The basic idea of the employment of porous material is use their impedance to weak
22nd International Congress of Mechanical Engineering (COBEM 2013) November 3-7, 2013, Ribeirão Preto, SP, Brazil
the fluctuating instabilities in the flow field. This method is already used to weak other sources of noise, like airfoils
[Sarradj and Geyer, 2007]. The article of [Choudhari and Khorrami, 2003] studies the changes on the flow field due to
the porous material, through a numerical computation using the RANS equations. An important modification of the
vortex structure is achieved applying porous treatment in a little fraction of the wetted area. The aerodynamic affectivity
of the flap is maintained. According to the authors, there are two mechanisms of noise reduction: a reduction of flap
loading near the side-edge; and a a damping effect over the pressure fluctuations near the side-edge. These two
mechanisms becomes in a series of beneficial changes in the flow structure: the vortex structures are weakened; the
structures are further from the side-edge, leading to a more benign interaction between the vortex; and the fluctuations
on the boundary layer are reduced. The experiments that precede the present work are presented in [Catalano et al.,
2012]. In this case, it is employed a porous plate, not a treatment on the flap. This plate is applied both the bottom and
the top surface, obtaining that the optimal solution corresponds to the bottom configuration. The investigations obtain
similar results with the presented above: reduction of the vortex, reduction of the shear layer that fed the vortex and
displacement of the vortical structure away of the flap surface. It is reached a reduction until 6 dB above 3.2 kHz. The
principal advantage of this method is the facility to implement and to certify it, due to her relative simplicity. The
principal aim of the present work is to perform a trade-off of the optimal implementation of this technique, in terms of
the width and the porosity of the plate.
1.2 Studies on Tip Vortex.
The ultimate goal of this work is the study of the noise produced by the flap side-edge. Nevertheless, the research
was focused in the alterations of the tip vortex with the addition of a porous plate. The intention is translate this
knowledge to the real case of a complete wing with a high-lift system. This fact led to investigate some of the literature
related with the vortex, even though it is not related with noise. A short review of these references is done in this
section. References about measure the vortex with a porous plate in the tip were not found. The paper of [Gerz et al.,
2002] presents a review of the investigations in Europe about commercial aircraft wake vortices. This study is far from
the subject of the work, but the paper presents several interesting recommendations about how to study the vortex. It
recommends some formulas about the calculation of the center of the vortex, the circulation and other parameters that
describe the structure of the vortex. Also it presents some advices about how to define non-dimensional time and
distance from the evolution of the vortex. The master thesis of [Hong joon Park, 2006] measures the vortex produced in
the wing of a Micro-Air Vehicle (MAV). The same three-sensor anemometer is used to perform the measurements that
support the principal interesting of this work. It can proportionate a reference to compare the results of the baseline case
and also about the methods to perform the calibration. The research of [Anderson and Wright, 2000] shows some
interesting results that can be helpful for the analyzing of the results of this work. It confirms the existence of various
vortices produced in the end of the flat end-cap. These vortices move downstream around a common center until merge
to form a single vortex. Another interesting idea is the proposal of two types of vortex: “jet-like” vortex or “wakelike”,
depending on the axial velocity in the center is bigger or smaller than the free-stream velocity U∞. This differentiation is
governed by the loading parameter, Г/U∞c, where Г is the circulation and c the airfoil chord. In this work, the wing
without porous plate produces a “jet-like” vortex, but the addition of it transforms the vortex into a “wake-like”.
2. EXPERIMENTAL SET-UP
The Wind tunnel LAE-1 of the Aerodynamics Laboratory of the University of São Paulo, located at EESC (Escola
de Engenharia de São Carlos), São Carlos, was used for the tests. All of the information present in this section can be
found in [Catalano, 2004] and [Santana et al., 2010]. The first article explains the principal characteristics of the wind
tunnel and the process employed in its construction. The second refers to the update of the tunnel to adapt it to
aeroacoustics measurements. The working section of the tunnel is 1:30m high and 1:70m wide, with a usable length of
3m. This working section is involved by a room or plenum chamber made of concrete, in order to ensure that the static
pressure of the chamber is equal to the atmospheric pressure. The flow is drive though an electric motor of 110HP with
8 blades and 7 straighters. The blades of the motor are carefully designed to obtain a high aerodynamic efficiency with
low noise. The velocity is in the range of 10m=s to 55m=s, with a turbulence level of 0.21%. The turbulence of the
tunnel when it was constructed was 0.25%. The reduction until 0.21% was achieved after the aeroacoustic update. The
contraction ratio of the tunnel is 1:8, due to the building limitation. There are vanes in the four corners in order to drive
properly the flow. The contraction cone on the flow stabilization section is designed using the Morel’s technique, that
is, two cubic curves separated by an inflection point. There are two 54% porosity screens of the nylon type to reduce
turbulence. The main instrumentation is composed for a six component sting balance, three components underneath
balance, digital pressure scanivalves and a three-channel hot wire anemometer. This anemometer includes a 3D
transverse gear and it was used extensively during the experiments.

Francisco Plata Moraleda, Fernando Martini Catalano Experimental Analysis of Porous Flap Side-Edge for Noise Reduction
Figure 3 Wind Tunnel lay out.
The wing employed in the experiments has a chord c of 0:3m and a wingspan b of 0:45m. The airfoil of the wing is
not a standard profile. It was generated in the framework of an investigation of a wind generator. The profiles of the
root and tip were optimized with a genetic algorithm following a series of criteria. The airfoil of the wing employed
corresponds to the intermediate profile between the root and the tip. It was chosen due to its availability at the
laboratory and its shape that is relatively similar to a flap. The shape can be seen in Fig. 4. The maximum thickness is
approximately 10% of the chord, that is, 30mm. The wing has a trip-strip in the leading-edge, in order to advance the
turbulent transition and avoid complex flows with reattachment zones. The trip-strip is placed at 7% of the chord and
has a width of 10mm. The porous plate is the same used for the last testes [Catalano et al., 2012]. The plate has a 33%
of porosity, with holes of 0:75mm of diameter and 1mm of thickness. A detail of the porosity can be seen in Fig. 5. Two
possible positions of the porous plate were examined. The first one corresponds to the best result obtained in the past
experiments, the plate in the pressure side. This configuration presents a good performance decreasing the noise and
also has the big advantage of be compatible with the existing flap configurations. The other configuration that was
studied is the attach case, in which the porous plate is roughly in the attachment line of the bottom vortex.
Figure 4 Wing model airfoil. Figure 5 Perforated plate, porosity 33%.
Photography of each placement of the plate can be seen in Fig. 6. Several widths of the plate d were examined. For
the standard case, six different widths were studied: baseline, 10mm, 20mm, 30mm, 50mm and 70mm. For the attach
case, only one width was studied, 25mm. In the precedent work [Catalano et al., 2012], the maximum with examined
was 15mm, with a chord c of 0:5m. This implies a non-dimensional width of d/c = 0.03, while in this work it was
reached a maximum of d/c = 0.23. The purpose is study a wide range of sizes, to understand the entire physical process.
Figure 6 (left) Position of the plate for the standard configuration. (right) Position of the plate for the attach
configuration.
22nd International Congress of Mechanical Engineering (COBEM 2013) November 3-7, 2013, Ribeirão Preto, SP, Brazil
2.1 Hot-wire Implementation.
The correct employ and calibration of the 3D hot-wire probe was the most important problem during the
development of the present work. It was used the software included with the hot-wire system, the Streamware R v5.0.
Apart from other functionalities, this software converts the voltages of each wire, the raw data, to 3D velocity data
available for the user. However, problems related with this post-processing were founded along the testes. The
experimental installation is formed for a triple-sensor probe with a traverse gear that allows 3D movement. Also a
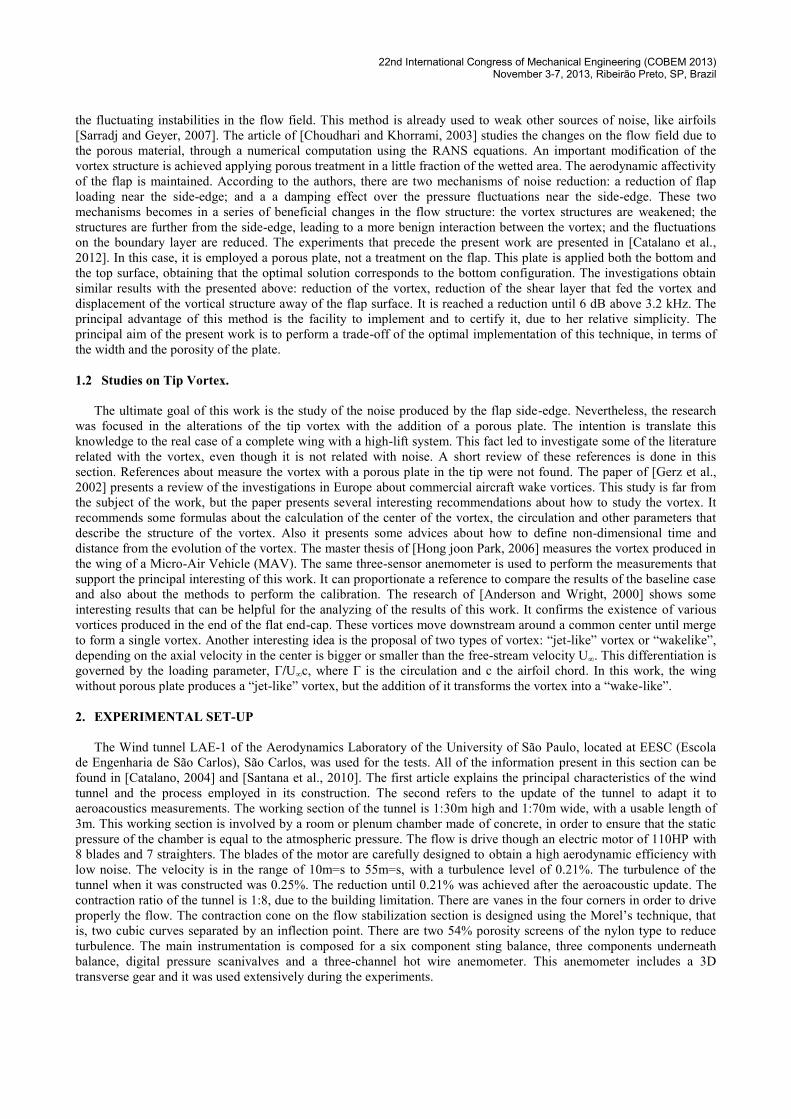
single-sensor probe was used in some tests. All of the instruments were supplied by DANTEC Dynamics. Fig.7 shows a
diagram with the connections between the devices. The most relevant devices are: Triple-sensor probe 55P91, the
general aspect of the probe can be seen in Fig. 8, with also an explanation of the relative position of the axes; single-
sensor probe 55P01; NI DAQCard-6036E; Streamline 90N10 frame with three CTA Modules 90C10 and the traverse
gear.
Figure 7 Hardware setup. Figure 8 Hot wire probe coordinates.
It was checked that this configuration is sufficient to capture the mean values of the flow field. The raw data have to
be transformed in velocity expressed in laboratory coordinates.
The tool to do this in Streamware is called Data Conversion. It follows the next sequence [User’sGuide, 2000]:
1. Rescaling: the out voltage Eout is converted into bridge voltage Ebridge if Signal Conditioner is active.
2. Temperature correction: the bridge voltage is corrected to Ecorr, taking into account the effect of the external
temperature.
3. Linearization: the corrected voltage is converted into effective velocity Ueff , using the relationship selected
(polynomial or power law). In any case, a calibration has to be performed, to know the velocity for each
voltage.
4. Velocity decomposition: the effective velocity is transformed into wire coordinates Ui and after into probe
coordinates (U, V, W). Again, a calibration has to be performed.
5. Velocity transformation: the velocity is transformed into laboratory coordinates (Ul; Vl;Wl), in the case that they
are different to probe coordinates.
The other important transformation is the Data Reduction. It consists in convert the multiple data for each position
in statistical values. It can be done before or after the Data Conversion. The most important statistical values that are
provided for the program are the mean value Xmean and the standard deviation Xrms:
N
imean XN
X
1
;1
5.0
1
2)(1
1
N
meanirms XXN
X (1)
Where N is the number of samples (1024, in this case) and Xi are the different measures. X can be anyone of the
data mentioned before, as voltage, velocity in wire coordinates or velocity in laboratory coordinates. The standard
deviation is used to evaluate the turbulence in each point. It is necessary be careful with the next fact: the statistical
result of a transformed value is not the same that the transformed of the statistical result. That is, to calculate the mean
of the laboratory coordinates, it is necessary to execute the transformation over all of the samples and then calculate the
mean value. During the experiments, problems were observed with the Data Reduction and Conversion done by the
program. Different results were obtained for the same set up and also non-sense results were obtained. It was not clear if
this was due to an incorrect use of the software, errors present in the program or a combination of both. In any case, it
was developed an own algorithm to post-process the data, based in the formulas presented in [User’sGuide, 2000]. The
principal advantage of the algorithm developed is its transparency. While the problems with the DANTEC software still
not clarified, errors in the scripts developed can be directly revising the code.
Francisco Plata Moraleda, Fernando Martini Catalano Experimental Analysis of Porous Flap Side-Edge for Noise Reduction
3. RESULTS AND DISCUSSION
3.1 Aerodynamic balance results.
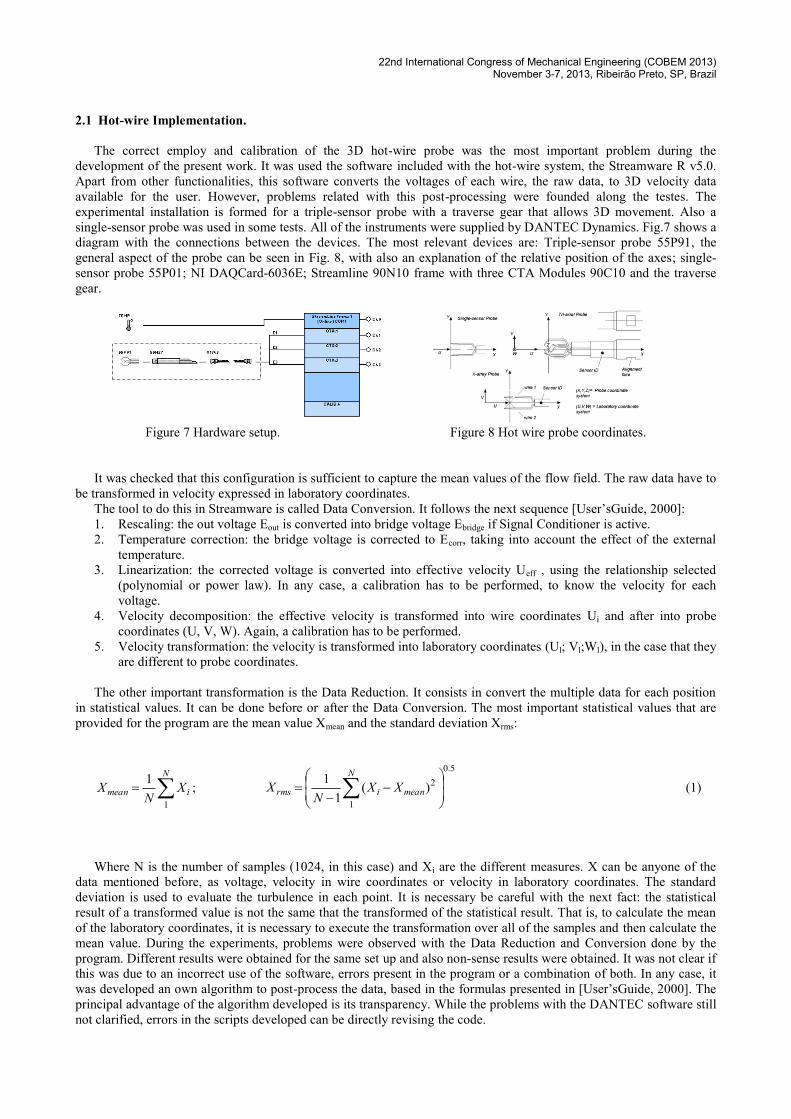
The lift coefficient curves are shown in Fig. 9 shows that the addition of the porous plate has a clear effect in the
slope of the linear part of the curve experiments with a little increase, without significant changes in the angle of
maximum lift coefficient CLmax. The angle of attack for zero lift is always the same, -6o. This result is important
because suggests an increase of the effective aspect ratio by moving the tip vortex in the spanwise direction away from
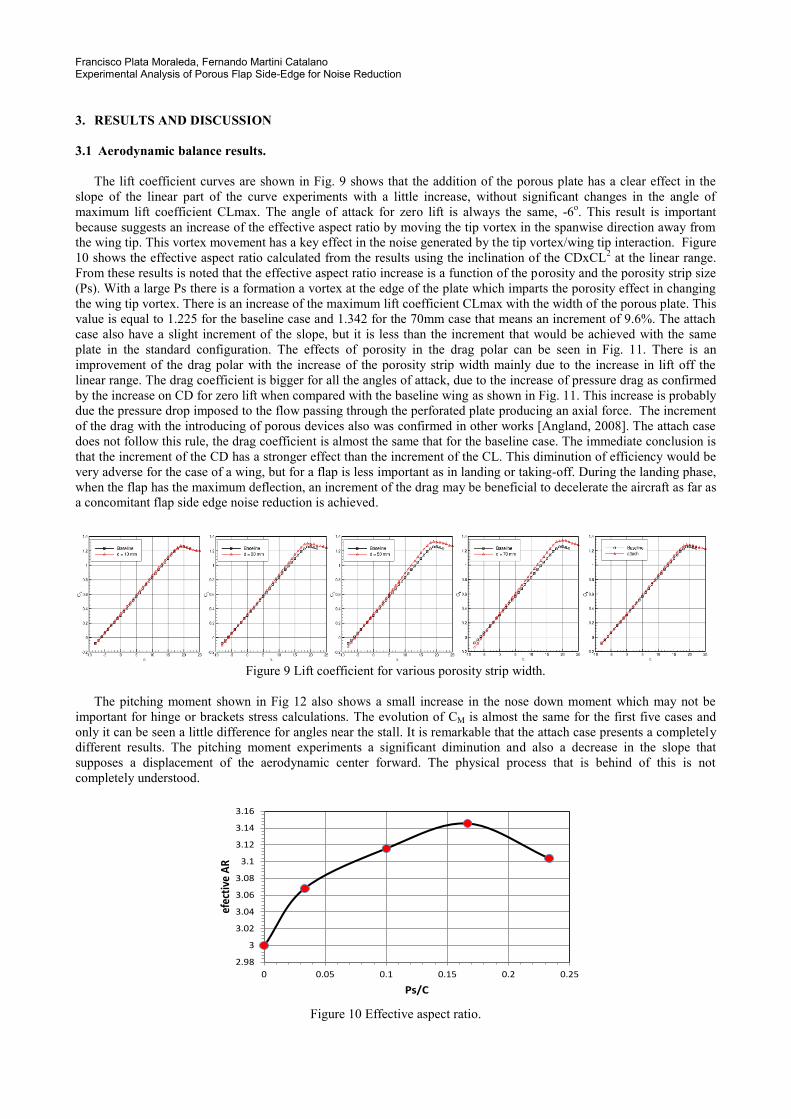
the wing tip. This vortex movement has a key effect in the noise generated by the tip vortex/wing tip interaction. Figure
10 shows the effective aspect ratio calculated from the results using the inclination of the CDxCL2 at the linear range.
From these results is noted that the effective aspect ratio increase is a function of the porosity and the porosity strip size
(Ps). With a large Ps there is a formation a vortex at the edge of the plate which imparts the porosity effect in changing
the wing tip vortex. There is an increase of the maximum lift coefficient CLmax with the width of the porous plate. This
value is equal to 1.225 for the baseline case and 1.342 for the 70mm case that means an increment of 9.6%. The attach
case also have a slight increment of the slope, but it is less than the increment that would be achieved with the same
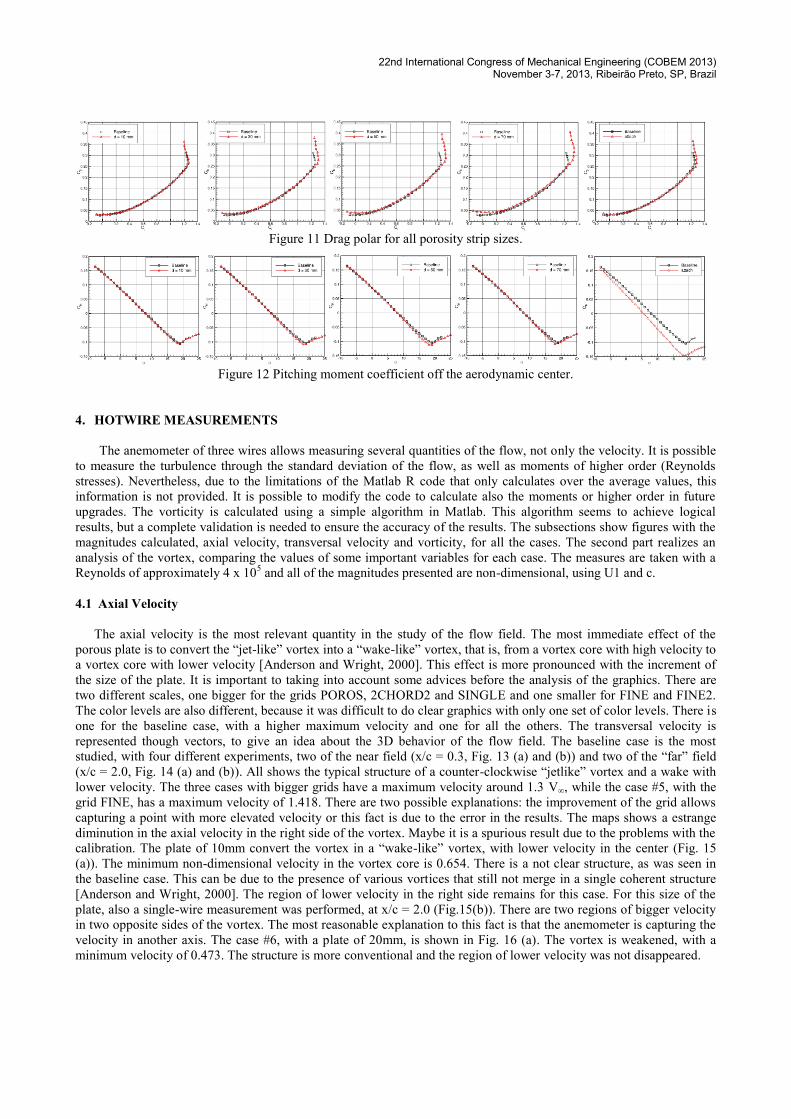
plate in the standard configuration. The effects of porosity in the drag polar can be seen in Fig. 11. There is an
improvement of the drag polar with the increase of the porosity strip width mainly due to the increase in lift off the
linear range. The drag coefficient is bigger for all the angles of attack, due to the increase of pressure drag as confirmed
by the increase on CD for zero lift when compared with the baseline wing as shown in Fig. 11. This increase is probably
due the pressure drop imposed to the flow passing through the perforated plate producing an axial force. The increment
of the drag with the introducing of porous devices also was confirmed in other works [Angland, 2008]. The attach case
does not follow this rule, the drag coefficient is almost the same that for the baseline case. The immediate conclusion is
that the increment of the CD has a stronger effect than the increment of the CL. This diminution of efficiency would be
very adverse for the case of a wing, but for a flap is less important as in landing or taking-off. During the landing phase,
when the flap has the maximum deflection, an increment of the drag may be beneficial to decelerate the aircraft as far as
a concomitant flap side edge noise reduction is achieved.
Figure 9 Lift coefficient for various porosity strip width.
The pitching moment shown in Fig 12 also shows a small increase in the nose down moment which may not be
important for hinge or brackets stress calculations. The evolution of CM is almost the same for the first five cases and
only it can be seen a little difference for angles near the stall. It is remarkable that the attach case presents a completely
different results. The pitching moment experiments a significant diminution and also a decrease in the slope that
supposes a displacement of the aerodynamic center forward. The physical process that is behind of this is not
completely understood.
2.98
3
3.02
3.04
3.06
3.08
3.1
3.12
3.14
3.16
0 0.05 0.1 0.15 0.2 0.25
efec
tive
AR
Ps/C
Figure 10 Effective aspect ratio.
22nd International Congress of Mechanical Engineering (COBEM 2013) November 3-7, 2013, Ribeirão Preto, SP, Brazil
Figure 11 Drag polar for all porosity strip sizes.
Figure 12 Pitching moment coefficient off the aerodynamic center.
4. HOTWIRE MEASUREMENTS
The anemometer of three wires allows measuring several quantities of the flow, not only the velocity. It is possible
to measure the turbulence through the standard deviation of the flow, as well as moments of higher order (Reynolds
stresses). Nevertheless, due to the limitations of the Matlab R code that only calculates over the average values, this
information is not provided. It is possible to modify the code to calculate also the moments or higher order in future
upgrades. The vorticity is calculated using a simple algorithm in Matlab. This algorithm seems to achieve logical
results, but a complete validation is needed to ensure the accuracy of the results. The subsections show figures with the
magnitudes calculated, axial velocity, transversal velocity and vorticity, for all the cases. The second part realizes an
analysis of the vortex, comparing the values of some important variables for each case. The measures are taken with a
Reynolds of approximately 4 x 10⁵ and all of the magnitudes presented are non-dimensional, using U1 and c.
4.1 Axial Velocity
The axial velocity is the most relevant quantity in the study of the flow field. The most immediate effect of the
porous plate is to convert the “jet-like” vortex into a “wake-like” vortex, that is, from a vortex core with high velocity to
a vortex core with lower velocity [Anderson and Wright, 2000]. This effect is more pronounced with the increment of
the size of the plate. It is important to taking into account some advices before the analysis of the graphics. There are
two different scales, one bigger for the grids POROS, 2CHORD2 and SINGLE and one smaller for FINE and FINE2.
The color levels are also different, because it was difficult to do clear graphics with only one set of color levels. There is
one for the baseline case, with a higher maximum velocity and one for all the others. The transversal velocity is
represented though vectors, to give an idea about the 3D behavior of the flow field. The baseline case is the most
studied, with four different experiments, two of the near field (x/c = 0.3, Fig. 13 (a) and (b)) and two of the “far” field
(x/c = 2.0, Fig. 14 (a) and (b)). All shows the typical structure of a counter-clockwise “jetlike” vortex and a wake with
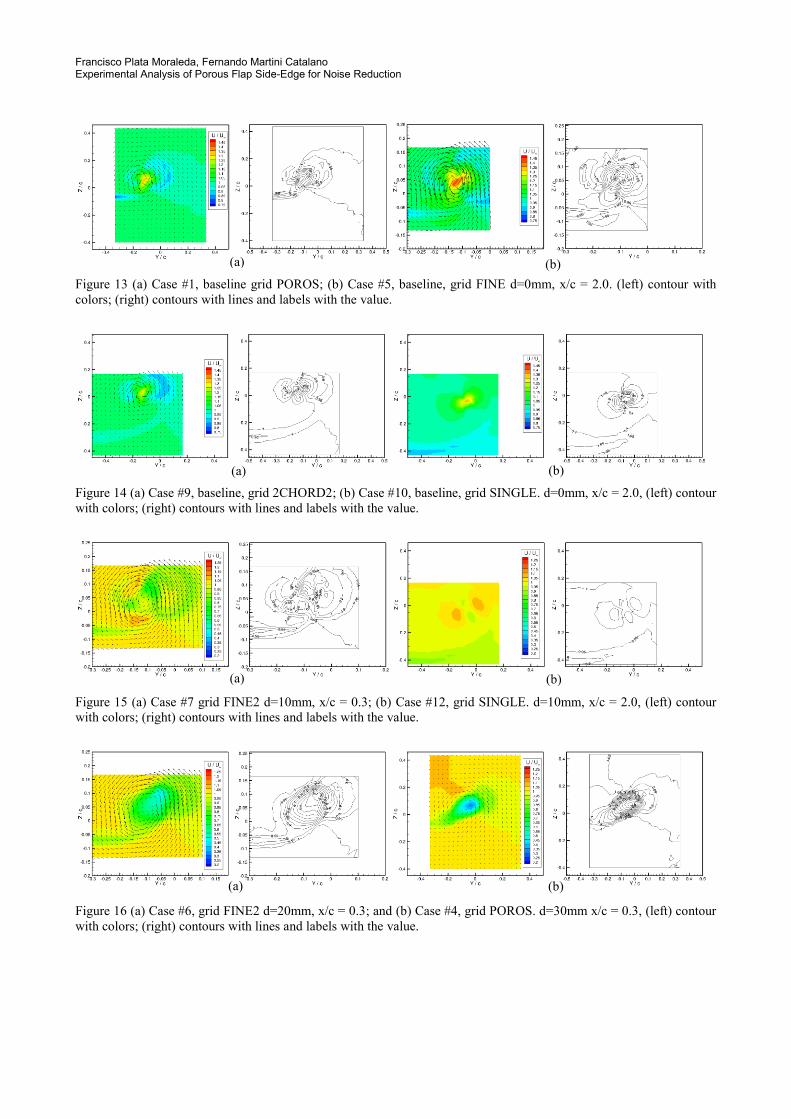
lower velocity. The three cases with bigger grids have a maximum velocity around 1.3 V∞, while the case #5, with the
grid FINE, has a maximum velocity of 1.418. There are two possible explanations: the improvement of the grid allows
capturing a point with more elevated velocity or this fact is due to the error in the results. The maps shows a estrange
diminution in the axial velocity in the right side of the vortex. Maybe it is a spurious result due to the problems with the
calibration. The plate of 10mm convert the vortex in a “wake-like” vortex, with lower velocity in the center (Fig. 15
(a)). The minimum non-dimensional velocity in the vortex core is 0.654. There is a not clear structure, as was seen in
the baseline case. This can be due to the presence of various vortices that still not merge in a single coherent structure
[Anderson and Wright, 2000]. The region of lower velocity in the right side remains for this case. For this size of the
plate, also a single-wire measurement was performed, at x/c = 2.0 (Fig.15(b)). There are two regions of bigger velocity
in two opposite sides of the vortex. The most reasonable explanation to this fact is that the anemometer is capturing the
velocity in another axis. The case #6, with a plate of 20mm, is shown in Fig. 16 (a). The vortex is weakened, with a
minimum velocity of 0.473. The structure is more conventional and the region of lower velocity was not disappeared.
Francisco Plata Moraleda, Fernando Martini Catalano Experimental Analysis of Porous Flap Side-Edge for Noise Reduction
Figure 13 (a) Case #1, baseline grid POROS; (b) Case #5, baseline, grid FINE d=0mm, x/c = 2.0. (left) contour with
colors; (right) contours with lines and labels with the value.
Figure 14 (a) Case #9, baseline, grid 2CHORD2; (b) Case #10, baseline, grid SINGLE. d=0mm, x/c = 2.0, (left) contour
with colors; (right) contours with lines and labels with the value.
Figure 15 (a) Case #7 grid FINE2 d=10mm, x/c = 0.3; (b) Case #12, grid SINGLE. d=10mm, x/c = 2.0, (left) contour
with colors; (right) contours with lines and labels with the value.
Figure 16 (a) Case #6, grid FINE2 d=20mm, x/c = 0.3; and (b) Case #4, grid POROS. d=30mm x/c = 0.3, (left) contour
with colors; (right) contours with lines and labels with the value.
a
(a) (b)
(a) (b)
(a) (b)
(a) (b)

22nd International Congress of Mechanical Engineering (COBEM 2013) November 3-7, 2013, Ribeirão Preto, SP, Brazil
Figure 17 Case #3, d=50mm, x/c = 0.3, grid POROS. U velocity. (left) Contour with colors. (right) Contours with lines
and labels with the value.
Figure 18 Case #12, d=10mm, x/c = 2:0, grid SINGLE. (left) contour with colors and (right) contours with lines and
labels with the value.
Figure 19 Case #2, d=70mm, x/c = 0:3, grid POROS. (left) contour with colors and (right) Contours with lines and
labels with the value.
Fig. 16 (b) shows the case #4, with a plate of 30mm and a larger grid. The vortex begins to merge with the wake.
The minimum velocity is 0.307 and the region of lower velocity is not exactly coincident with the center of rotation of
the flow. The case #3, d=50mm begins to show a new behavior (Fig. 17). The wake is completely merged with the
vortex and the flow seems to have two different vortex structures. Nevertheless, the region of minimum velocity (0.353)
remains in the place of the vortex of the previous cases. Figure 18 shows this size of plate at a distance of two chords,
with a single-wire, as it was expected. It is not known if the mentioned structure in the near field would be benefit for
noise reduction. The case #2, d=70mm, shows a reinforcement of the structure mentioned above, but the region of lower
velocity is shifted to the left side (see Fig. 19). This is the minimum non-dimensional velocity measured in all of the
experiments, 0.235. The study of the energy exchange between the wake and the vortex can be topic of study in future
works. Figure 20 shows the attach case, that, one more time, has a completely different aspect. The vortex seems to be
weakened, but the center has a bigger velocity that the flow around. The transversal velocity is also higher than for
configurations with similar size of the plate. The comparison between the attach and the standard configuration suggests
that the effect over the vortex is completely different.

Francisco Plata Moraleda, Fernando Martini Catalano Experimental Analysis of Porous Flap Side-Edge for Noise Reduction
Figure 20 Case #8, attach, d=25mm, x/c = 0:3, grid FINE2.
4.2 Tangential Velocity
The vortex is composed for the spinning motion of the transversal velocity, so these components are important to
understand it. Ideally, the graphics would show a negative and a positive region separated for a perpendicular line at one
of the axis. However, the separating line between positive and negative regions is inclined in some cases. A roll angle of
30o was already applied to the results, but it have to be considered future improvements of this value, as well as
different values for each case. All of the figures have the same color levels, and then the graphics with less variations of
the flux have a very similar color. It was preferred to have this little disadvantage to have problems of interpretation due
to different legends. All of the cases have a very similar behavior, with little variations respect to the “ideal” case. The
general tendency is a decrease of both components with the increase of the porous plate. The only strange detail is an
asymmetry on the V - values. The results show systematically a higher value in the upper part than in the lower. No
explanations were found for this fact. Figure 21 (a) shows the profiles of W velocity for the z coordinate that passes in
the vortex core. The results are divided into two graphics to improve the visualization of the results. The two
measurements done for the baseline shows a good agreement. The shape of the curves is the expected, although there is
some asymmetry. This is partially due to the accuracy of the grid and partially to the errors in the results. The maximum
values are almost the same for the negative and the positive side. However, the curve is not symmetric. It shows a
slower decrease in the right side that corresponds to the area of lower axial velocity already mentioned. Figure 21(b)
shows the profiles of V velocity for the y coordinate that passes in the vortex core. The non-symmetric aspect of the
curves is due to the dimensions of the grids, with more space below the vortex than above. Nevertheless, there is
another asymmetry, already mentioned in this subsection. The velocity V reaches a higher absolute value in the upper
part than in the lower. This is probably due to an interaction with the wake.
Figure 21 Profiles of W velocity (a) and profiles of V velocity (b).
4.3 Vorticity
The vorticity is the rotational of the flux and gives a measurement about how quickly the fluid is rotating. Therefore, it
is the perfect variable to evaluate the vortex, leaving aside the velocity. The mathematical expression is:
VrotV
(2)
Where
is the vorticity, V the velocity of the flow and and rot are the vectorial operator rotational.
The hotwire probe only give results in a y - z plane, then only it is possible to calculate the vorticity normal to this
plane, that is, the vorticity in the x-axis x :
22nd International Congress of Mechanical Engineering (COBEM 2013) November 3-7, 2013, Ribeirão Preto, SP, Brazil
Z
V
Y
Wx
(3)
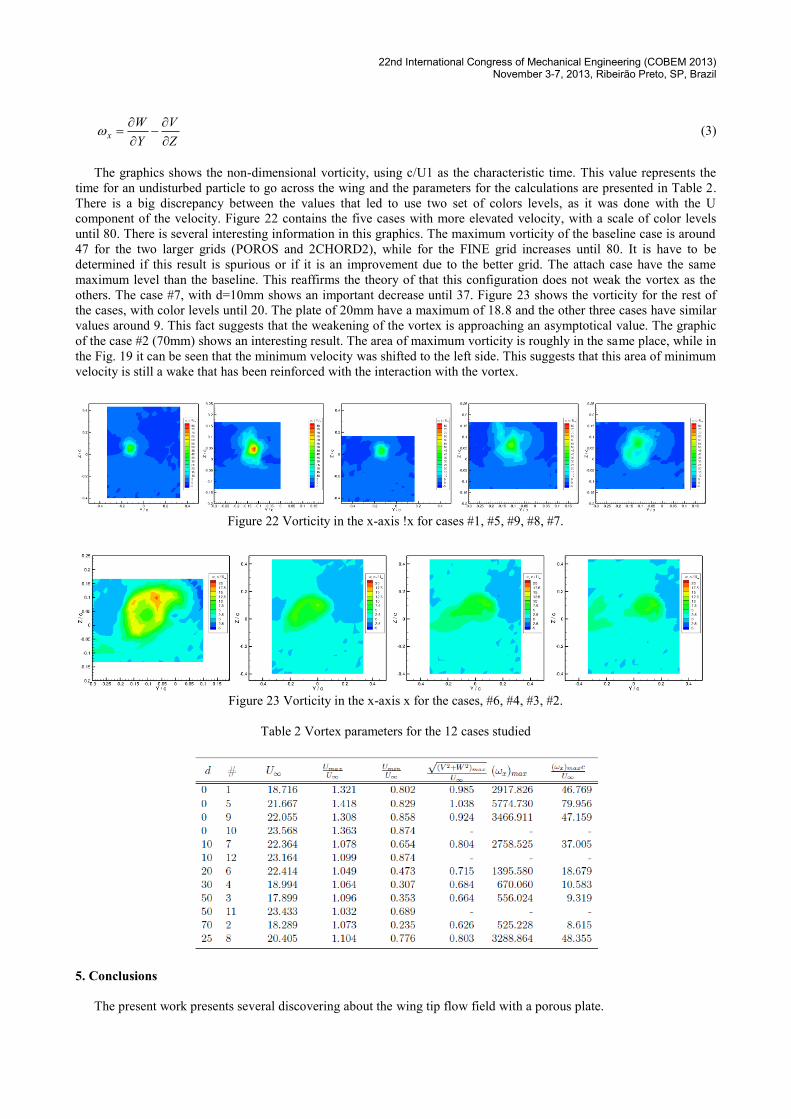
The graphics shows the non-dimensional vorticity, using c/U1 as the characteristic time. This value represents the
time for an undisturbed particle to go across the wing and the parameters for the calculations are presented in Table 2.
There is a big discrepancy between the values that led to use two set of colors levels, as it was done with the U
component of the velocity. Figure 22 contains the five cases with more elevated velocity, with a scale of color levels
until 80. There is several interesting information in this graphics. The maximum vorticity of the baseline case is around
47 for the two larger grids (POROS and 2CHORD2), while for the FINE grid increases until 80. It is have to be
determined if this result is spurious or if it is an improvement due to the better grid. The attach case have the same
maximum level than the baseline. This reaffirms the theory of that this configuration does not weak the vortex as the
others. The case #7, with d=10mm shows an important decrease until 37. Figure 23 shows the vorticity for the rest of
the cases, with color levels until 20. The plate of 20mm have a maximum of 18.8 and the other three cases have similar
values around 9. This fact suggests that the weakening of the vortex is approaching an asymptotical value. The graphic
of the case #2 (70mm) shows an interesting result. The area of maximum vorticity is roughly in the same place, while in
the Fig. 19 it can be seen that the minimum velocity was shifted to the left side. This suggests that this area of minimum
velocity is still a wake that has been reinforced with the interaction with the vortex.
Figure 22 Vorticity in the x-axis !x for cases #1, #5, #9, #8, #7.
Figure 23 Vorticity in the x-axis x for the cases, #6, #4, #3, #2.
Table 2 Vortex parameters for the 12 cases studied
5. Conclusions
The present work presents several discovering about the wing tip flow field with a porous plate.
Francisco Plata Moraleda, Fernando Martini Catalano Experimental Analysis of Porous Flap Side-Edge for Noise Reduction
The porous plate produces a increment in the lift, higher when wider is the plate. This increment is countered with
an increase of the drag that finally results in a diminution of the efficiency L/D. The attach case have a different
behavior, as in another aspects of the results. The addition of the porous plate provokes immediately the change from a
structure “jet-like” (higher velocity in the core) to a “wake-like” structure (lower velocity in the core). The vortex is
weakened in all of the parameters taken to its study: maximum axial velocity, maximum transversal velocity and
maximum vorticity. From d=30mm, it seems that the diminution approaches to an asymptotic value. The attach case
does not modify the vortex in the same way. It seems that the structure also changes to “wake-like”, but this is not
completely confirmed. The vorticity does not have significant changes that suggest the diminution in the axial velocity
is only a pressure drop due to the extra drag of the plate. The wake and the vortex seems to merge for d=50mm and
d=70mm. This physical process and it consequences for the noise can be investigated in future works.
5. REFERENCES
Anderson, D. E. A. and Wright, C. T. (2000). Experimentalstudy of the structure of a wingtip vortex.
Angland, D. (2008). Aerodynamics and Aeroacoustics of Flap Side-Edges. PhD thesis, University of Southampton,
Faculty of Engineering, Scienceand Mathematics, School of Engineering Sciences.
Brooks, T. F. and Humphreys, W. M. (2003). Flap edge aeroacoustic measurements and predictions. Journal of Sound
and Vibration, 261:31–74.
Catalano, F. (2004). The new closed circuit wind tunnel of the aircraft laboratory of university of São Paulo. In 24th
ICAS 2004 Congress.
Catalano, F. M., Vanucci, P., and Correa, L. G. N. (2012).Wind tunnel testing of porous devices for the reduction of
flap side-edge noise. In 28th ICAS 2012 Congress.
Choudhari, M. M. and Khorrami, M. R. (2003). Computational study of porous treatment for altering flap side-edge
flowfield. AIAA-2003-3113.
Dobrzynski, W. (2010). Almost 40 years of airframe noise research: What did we achieve? Journal of Aircraft,
47(2):353–367.
Gerz, T., Holzäpfel, F., and Darracq, D. (2002). Commercial aircraft wake vortices. PERGAMON Progress in
Aerospace Sciences, 38:181–208.
Guo, Y. P. and Yoshi, M. C. (2003). Noise characteristics of aircraft high lift systems. AAIA Journal, 41(7):1247–1256.
Hong joon Park, M. (2006). Three component velocity measurements in the tip vortex of a micro-air-vehicle. Master’s
thesis, Air Force Institute of Technology.
Jørgensen, F. E. (2002). How to measure turbulence with hot-wireanemometers – a pratical guide.
Khorrami, M. R. and Choudhari, M. M. (2003). Application of passive porous treatment to slat trailing edge noise.
Technical report, NASA Langley Research Center.
Koop, L., Ehrenfried, K., and Dillman, A. (2002). Reduction offlap side-edge noise by active flow control. AIAA-2002-
2469.
Macaraeg, M. G. (1998). Fundamental investigations of airframe noise. AIAA-98-2224.
Maunsell, M. G. (1977). Desenvolvimento, construção e ensaios de uma balança aerodinâmica. Master’s thesis, Escola
de Engenharia de São Carlos, Universidade de São Paulo.
Rossignol, K.-S. (2010). Development of an empirical prediction model for flap side-edge noise. AIAA-2010-3836.
Santana, L. D., Catalano, F. M., Medeiros, M. A. F., and Carmo, M. (2010). The update process and characterization of
the São Paulo university wind tunnel for aeroacoustics testing. In 27th ICAS 2010 Congress.
Sarradj, E. and Geyer, T. (2007). Noise generation by porous airfoils. AIAA-2007-3719.
Storms, B. L., Hayes, J. A., Jaeger, S. M., and T., S. P. (2000). Aeroacustic study of flap-tip noise reduction using
continuous moldline technology. AIAA-2000-1976.
Strett, C. L. (1998). Numerical simulation of a flap-edge flowfield. AIAA-98-2226.
Thomas, R. H., Choudhari, M. M., and Joslin, R. D. (2002). Flow and noise control: toward a closer linkage. In ICAS
2002 Congress
6. RESPONSIBILITY NOTICE
The author(s) is (are) the only responsible for the printed material included in this paper.