EXPERIMENT DATA REPORT FOR LOFT NONNUCLEAR ...
304
TREE-N U REG-1 065 for U.S. Nuclear Regulatory Commission EXPERIMENT DATA REPORT FOR LOFT NONNUCLEAR TEST L 1-3 GARY M. MILLAR April 1977 n EGB.G Idaho, Inc. IDAHO NATIONAL ENGINEERING LABORATORY . . ENERGY RESEARCH AND DEVEL<>PMENT ADMINISTRATION . ' ' . ._. IDAHO OPERATIONS OFFICE UNDER CONTRACT EY-76-C-07-1570 0 U "E.NT IS f- THIS DOC WI
-
Upload
khangminh22 -
Category
Documents
-
view
2 -
download
0
Transcript of EXPERIMENT DATA REPORT FOR LOFT NONNUCLEAR ...

TREE-N U REG-1 065 for U.S. Nuclear Regulatory Commission
EXPERIMENT DATA REPORT FOR LOFT NONNUCLEAR TEST L 1-3
GARY M. MILLAR
April 1977
n ~~ EGB.G Idaho, Inc.
IDAHO NATIONAL ENGINEERING LABORATORY
. .
ENERGY RESEARCH AND DEVEL<>PMENT ADMINISTRATION . ' ' . ._.
IDAHO OPERATIONS OFFICE UNDER CONTRACT EY-76-C-07-1570
QISTR~BUTIOI'I 0 U"E.NT IS UNLIMITE~~
f- THIS DOC WI
DISCLAIMER
This report was prepared as an account of work sponsored by an agency of the United States Government. Neither the United States Government nor any agency Thereof, nor any of their employees, makes any warranty, express or implied, or assumes any legal liability or responsibility for the accuracy, completeness, or usefulness of any information, apparatus, product, or process disclosed, or represents that its use would not infringe privately owned rights. Reference herein to any specific commercial product, process, or service by trade name, trademark, manufacturer, or otherwise does not necessarily constitute or imply its endorsement, recommendation, or favoring by the United States Government or any agency thereof. The views and opinions of authors expressed herein do not necessarily state or reflect those of the United States Government or any agency thereof.

DISCLAIMER
Portions of this document may be illegible in electronic image products. Images are produced from the best available original document.
Pri nted in the United States of Ameri ca Avai lable from
Natio nal Techni ca l Informat ion Service U.S. Department of Commerce
5285 Port Roya l Road Springfield, Virginia 22161
Price: Pr inted Copy $9.75; Microfi che $3.00
"The NRC will make available data tapes and operational computer codes on research programs dealing with postulated loss-of-coolant accidents in light water reactors. Persons requesting this information must reimburse the NRC contractors for their expenses in preparing copies of the data tapes and the operational computer codes. Requests should be submitted to the Research Applications Branch, Office of Nuclear Regulatory Research , Nuclear Regulatory Commission, Washington, D.C. 20555."
.-------------- NOTICE
This report was prepared as an account of work sponsored by the United States Government. Neither the United States nor the Energy Research and Development Administration , nor the Nuclear Regulatory Commission, nor any of their employees, nor any of their contractors, subcontractors , or their employees, makes any warranty, express or implied, or assumes any legal liability or responsibility for the accuracy, completeness or usefulness of any information, apparatus , product or process disclosed , or represents that its use would not infringe privately owned rights.

•
!i' •.
EXPERIMENT DATA REPORT FOR LOFT
NONNUCLEAR TEST Ll-3
Approved:
~ I .. ..
L;· P. Leach, Acting Manager LOFT Experimental Program Division
,-.-----NOTICE-----~ This report was prepared as an account of wort 'POnsorr:ct by the United States Government. Neithet the Umted States nor the United States Energy ~arch and Development AdnUnistralion, nor any of theu emplovces, nor any of their oontructou subcontractors, or their employees, mates anY ~~nty, express or implied, or assumes any legal liability or responsib~ty for the accuracy, completeness or useful~ess of any mformation, apparatus, product or ~ro~ d~losed, or represents that its use would not mfnnge pnvately owned rights.
~·
-·DOCUMENT IS UNLIMITEQ OISTRIBUTION OF THIS .

4 -
-.
TREE-NUREG-1065 Distr1buted Under Category: NRC-2
Water Reactor Safety Research Systems Engineering
EXPERIMENT DATA REPORT FOR LOFT
NONNUCLEAR TEST L1-3
by
Gary M. Mi 11 ar
EG&G Idaho, Inc.
Apri 1 1977
PREPARED FOR THE U.S. NUCLEAR REGULATORY rQMMTSSTON AND
ENERGY RESEARCH AND DEVELOPMENT ADMINISTRATION IDAHO OPERATIONS OFFICE
UNDER CONTRACT NO. EY-76-C-07-1570

-ACKNOWLEDGMENTS
Appreciation is expressed to J. R. Chappell, L. D. Goodrich, G. Hammer, H. C. Robinson, T. K. Samuels, and the personnel of the LOF.T Data Systems Branch for their special help in prepari.ng this document.
,.·
i i
•
•
ABSTRACT
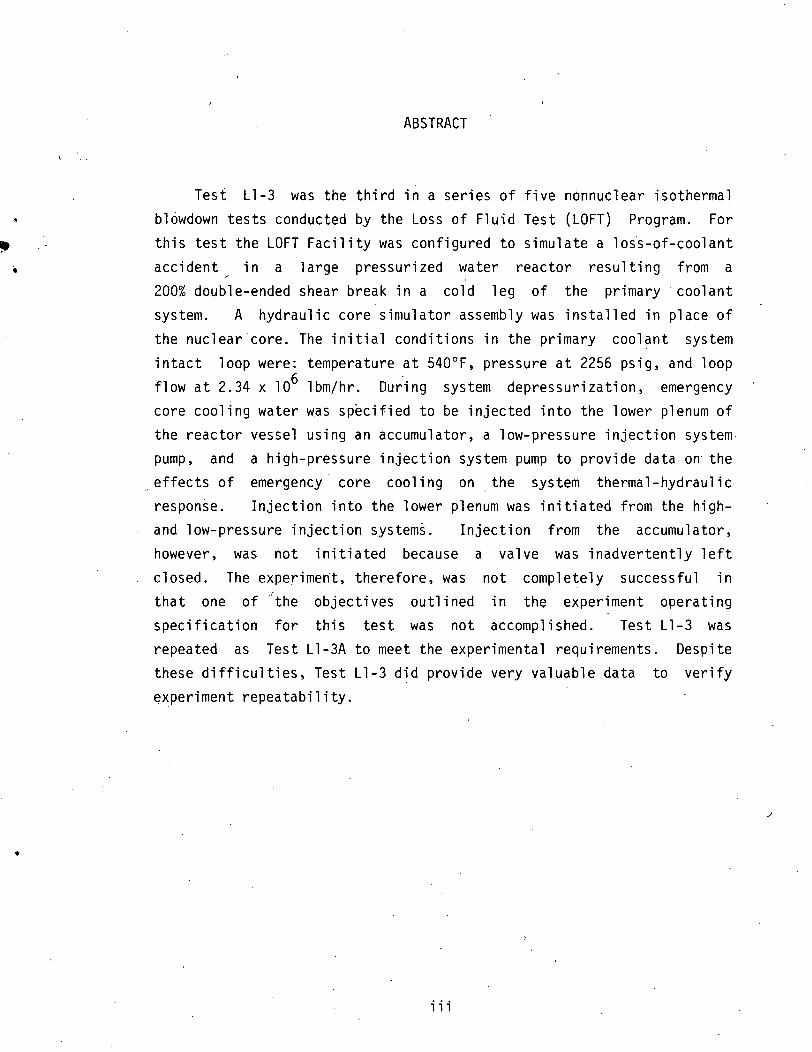
Test Ll-3 was the third in a series of five nonnuclear isothermal
blowdown tests conducted by the Loss of Fluid Test (LOFT) Program. For this test the LOFT Facility was configured to simulate a los·s-of-coolant
accident in a large pressurized water reactor resulting from a
200% double-ended shear break in a cold leg of the primary coolant system. A hydraulic core simulator assembly was installed in place of
the nuclear core. The initial conditions in the primary cool~nt system
intact loop were: temperature at 540°F, pressure at 2256 psig, and loop flow at 2.34 x 10⁶ lbm/hr. During system depressurization, emergency core cooling water was specified to be injected into the lower plenum of
the reactor vessel using an accumulator, a low-pressure injection system pump, and a high-pressure injection system pump to provide data on· the
effects of emergency core cooling on the system thermal-hydraulic response. Injection into the lower plenum was initiated from the high
and low-pressure injection systems. Injection from the accumulator, however, was not initiated because a valve was inadvertently left
closed. The experimertt, therefore, was not completely successful in that one of 'the objectives outlined in the experiment operating
specification for this test was not accomplished. Test Ll-3 was repeated as Test Ll-3A to meet the experimental requirements. Despite these difficulties, .Test Ll-3 did provide very valuable data to verify
~xperiment repeatability .
i i i
SUMMARY
The intent of this report is to present selected data from LOFT Test Ll-3, which was performed as a part of the Ll (nonnuclear) series of LOFT Program tests. The ·data are presented in the form of graphs in engineering units for easy interpretation. In conjunction with the data obtained from direct measurement, chosen computed parameters are included to facilitate in the analysis of the system thermal-hydraulic behavior. Plots of representative instrument types and ranges and their associated error bands are also presented.
The Ll test series consists of five nonnuclear blowdown experiments which are initiated with isothermal conditions established in the reactor coolant loop. Test Ll-3, the third test in the Ll series, was conducted on June 28, 1976.
The LOFT Integral Test Facility is a highly instrumented, 'pressurized water reactor test system designed to be represent~tive of large pressurized water reactors (LPWR)·fo~ the simulation of loss-of~
coolant accidents (LUCA). lhe test assembly consists of:
(1) A reactor vessel with a hydraulic core simulator installed- 'in place of a nuclear core.
(2) An intact loop with active steam ·generator, pressuriz~r, and two primary coolant pumps connected in parallel.
(3) A broken loop with a simulated pump, a simulated steam generator, and two quick-opening blowdown valve assemblies.
(4) A blowdown suppression system consisting of a blowdown header, blowdown suppression tank, and a blowdown suppression tank spray system.
iv
•
•
..
(5) An-emergency core coolant (ECC) injection system consisting of a low-pressure injection system (LPIS) pump, a high-pressure injection system (HPIS) pump, and an accumulator.
For the performance of the Ll-3 loss-of-coolant experiment (LOCE), the test assembly was configured to represent a 200% double-ended offset shear in a cold leg of a LPWR.
The areas of interest specific to Test Ll-3 were to evaluate (a) the effect of intact loop resistance on system thermal-hydraulic response by comparison with corresponding results from Test Ll-2 and (b) the effect on system thermal-hydraulic response by injection of ECC directly into the lower plenum of the reactor vessel~ To establish the imporfance of intact loop resistance, this test was conducted with . low resistance orifice plates insta1led in the steam generator which were based on core flow area scaling .. To specified to be directed to the accumulator ACC-A, HPIS pump A,
determine system response, ECC w~s lower plenum injection line using
and LPIS pump A. The accumulator injection failed to initiate; HPIS flow and LPIS flow were initiated at 32.6 and 37.5 seconds after rupture, respectively. This failure o~
accumulator injettion is not important to -future LOFT nuclear operat1on since the plant protection system (PPS) would have initiated all modes of ECC. The PPS was intentionally deactivated for the performance of this experiment.
Test Ll-3 was initiated from primary coolant system initial conditions of 2256 psig and 540°F with an_ intact loop flow rate of 2.34 X 10⁶ 1 bm/hr. The complete set of initial test conditions is specified in Reference 1 and is summarized in Table III of this report. Measured experiment conditions for Test Ll-3 were within their specified tolerance bands except that the intact loop flow rate was 2.34 x 10⁶ lbm/hr instead of the 2.15 x 10⁶ lbm/hr as specified. This
discrepancy did not adversely affect the experiment.
Data were successfully collected and processed from 512 of the 549
data channels utilized during Test Ll-3. Instrument malfunctions
v
pertinent to a particular data channel are specified in Table VI. Of the instruments which produced no useful data, none impacted the success of the experiment.
Test Ll-3 was not completely successful in aGcomplishing objectives as presented in Reference 1 and summarized in Section I
this report since. accumulator injection did . not initiate. experiment, however, did provide extremely valuable information verify. data repeatability for the same experiment conducted essentially the same initial conditions.
vi
the of
This to
from
.. -: ..
,,

..
CONTENTS
ACKNOWLEDGMENTS i i
ABSTRACT.
SUMMARY .
I.
II.
I I I.
IV.
v.
VI.
VI I.
VIII.
IX.
1.
2.
3.
4.
. . .
INTRODUCTION.
SYSTEM. CONFIGURAfiON ..
MEASUREMENTS AND INSTRUMENTATION
TEST PROCEDURES . .
INITIAL CONDITIONS.
DATA CONSISTENCY CHECKS
· DATA PRESENTATION . . .
1. TEST Ll-3 MEASURED PARAMETERS SHORT-TERM PLOTS
iii
iv
1
. 6
12
30
35
41
51
(1 Second Or Less) ..... ; .. ~ . . . . . 101
2. TEST Ll-3 MEASURED PARAMETERS MEDIUM-TERM PLOTS (-10 to 70 Seconds). . . . . . . . . . . . . . 117
3. TEST Ll-3 MEASURED PARAMETERS LONG-TERM PLOTS ( 175- and 500-Second Plots). . 187
4. TEST Ll-3 COMPUTED PARAMETERS. 209
5. TEST Ll-3 ERROR.BAND PLOTS 241
REFERENCES ..•........
LIST OF ABBREVIATIONS AND ACRONYMS.
FIGURES
LOFT major components ..
LOFT piping schematic (with instrumentation)
Gamma densitometer beam configuration.
Gamma densitometer flow regime logic •
vii
264
267
10
11
14
15

5.
6.
7.
8.
9.
10.
11.
12.
13.
LOFT' thermo-fluids measurements instrumentation.
LOFT reactor vessel instrumentation.
LOFT pressurizer instrumentation ..
LOFT steam generator instrumentation
LOFT intact loop pump instrumentation.
LOFT accumulator instrumentation ...
LOFT ECC system instrumentation (left sid~).
LOFT suppression tank instrumentation ...
Determinat~ori O! time of rupture (T0) and vulve opemng t1mc I ~.I •••••••
TEST Ll-3 MEASURED PARAMETERS SHORT-TERM PLOTS (i SECOND OR LESS)
14. Valve opening (%) for broken loop QOBV, cold leg valve (CV-Pl38-l), and hot leg valve
19
20
21
22
23.
24
25
26
(CV-Pl38-15) . . . . . . . . . . . . . . . 102
15. Valve opening (%) for broken loop cold leg QOB~ (CV-Pl38-l) and cold QOBV inlet pressure (PT-Pl38-lll). . . . . . . . . . . . . . . 102
16. Valve opening (%) for broken loop hot leg QOBV lCV-P138-Ib) and hot leg QOBV 1nlet pressure (PT-Pl38-112). . . . . . . . . . . . . 103
17. Pressure in broken loop cold leg (PE-BL-1, -4, and -8) (filtered to 250Hz) . . . . . . . 103
18. Pressure in broken loop hot leg (PE-BL-2, -3, and -6) (filtered to 250Hz) . . . . . . 104
19. Pressure in intact loop cold leg, hot leg, steam generator outlet, and pressurizer (PE-PC-1 ~ -2, -3A, and -4) (filtered to 250 Hz) .. 104
20. Pressure in reactor vessel core simulator instrument stalk and downcomer instrument stalk 1 (PE-CS-lFF and -2FF and PE-1ST-3FF) (filtered to 250 Hz) .......... .
21. Pressure in blowdown suppression tank bottom, 180° from top vertical reference (PE-SV-1, -22,
. 105
-24, and -44). . . . . . . . ......... 105
viii

22. Pressure in blowdown suppression. tank bottom, 180° from top vertical reference (PE-SV-3, -26, -27, and -43). . . . . . . . . . . . .....
23. Pressure in blowdown suppression tank submerged, 112.5° from top vertical reference (PE-SV-2, -23,
106
and -25) · ..................... 106
24. Pressure in blowdown suppression tank submerged, 112.5° from top vertical reference (PE-SV-4, -28, and -29) . . . . . . . . . . . . . . . . . . 107
25. Pressure in blowdown suppression tank vapor space, 67.5° from top vertical reference {PE-SV-58 and -61) . . . . . . . . . . . . 107
26. Pressure in blowdown suppression tank vapor space, 45° from top vertical reference (PE-SV-57 and -59) . . . . . . . . . . . . . . . . ... 108
27. Pressure in blowdown suppression tank top, 0° from top vertical reference (PE-SV-17, -55, and -60) . . . . . . . . . . . . . . . . . . . . . . 1 08
28. Pressure in blowdown suppression tank submerged, 230° from top vertical reference (PE-SV-15 and -16) . . . . . . . . . . . . . . . . . 109-
29. Pressure in blowdown suppression tank header (PE-SV-14 and -18) . . . . . . . . . . . . 109
30. Pressure in blowdown suppression tank B-end submerged along vertical centerline (PE-SV-11, -13, and -27). . . . . . . . . . . . . . . 110
31. Pressure in blowdown suppression tank A-end submerged along vertical centerline (PE-SV-10, -12, and -24). . . . . . . . . . . . ; . . . . . 110
32. Pressure in blowdown suppression tank in a transverse plane, 316.5 in. from B-end reference (PE-SV-1, -2, and -58) . . . . . . . . . . . . . 111
33. Pressure in blowdown suppression tank in a tr·ar1sv~r·s~ pla.ne, 316.5 in. fron1 B-end r-efet'ence (PE-SV-15, -55, and· -57) ....... ~ . . . . 111
34. Pressure in blowdown suppression tank in a transverse plane, 263 in. from B-end reference (PE-SV-22 and -23) ............. ~ .. 112
35. Pressure in b1owdown suppression tank in a transverse plane, 263 in. from B-end reference (PE-SV-17 and -59) ..•....•...... 112
ix

36.
37.
38.
39.
40.
41.
42.
Pressure in blowdown suppression tank in a transverse plane, 28.5 in. from B-end reference (PE-SV-3, -4, -16,-60, and -61). . . ...
Pressure in blowdown suppression tank header snubber (end) (PE-SV-30) ......... .
Pressure in blowdown suppres~ion tank header snubber (end)' (PE-SV-31) ......... .
Pressure in blowdown suppression tank header snubber (bend) (PE-SV-45) ......... .
Pressure in blowdown suppression tank he~der snubbe1· (bend) (PE-SV~4G). . . .
Pressure in blowdown vacuum relief system rupture disc standpipe (PE-SV-54) .....
Pressure in bellows between broken loop and blowdown suppression tank header (PE-SV-70).
TEST Ll-3 MEASURED PARAMETERS MEDIUM-TERM PLOTS (-10 TO 70 SECONDS)
43. Density in broken loop cold leg, chordal density (DE-BL-lA, -lB, and -lC) (filtered
113
113.
114
114
115
115
il6
to 4Hz) . . . . . . . . . . . . 118
44. Density in broken loop hot leg, chordal rlPnc:;it.y (nF-Rl.-?A, -2R, and. ,2C) (filtered to 4 Hz) . . . . . . . . . . . . . . . . 1 18
45. Density in broken loop, average fluid densities. (DE-BL-1 and -2) (filtered to 4Hz). . . . . 119
46. Density in intact loop cold leg, chordal density (DE-PC-TB and -lC) (fi·ltered to 4Hz}. . . 119
4 7. Density in intact 1 oop hot 'I eg, chorda 1 density (DE-PC-2A, -2B, and -2C) (filtered to 4 Hz). . . 120
48. Density in intact loop at steam generator outlet, chordal density (DE-PC-3A, -3B, and -3C) (filtered to 4 Hz) . . . . . . . . ~ . . . . 120
49. Density in intact loop, avera~e fluid densities (DE-PC-2 and -3) (filtered to 4Hz). . . . . . . 121
50. Average fluid velocity in broken loop cold leg at OTT flange (FE-BL-1) (filtered to 4Hz) 121
X
•

51.
52.
53.
Average fluid velocity in broken loop hot leg ~t OTT flange (FE-BL-2) (filtered to 4 Hz) ..
Average fluid velocity in broken loop cold and hot legs at OTT flanges (FE-BL-1 and -2) (fil-tered to 4 Hz) . . . . . . . . . . . . .
-Average fluid velocity in reactor vessel core simulator instrument stalk (FE-CS-1) (filtered to 4 Hz) . . . . . . . . . . . . . . . . .
54. Average fluid velocity in intact loop cold leg
122
122
123
at OTT flange (FE-PC-1) (filtered to 4Hz) . . 123
55. Average fluid velocity in intact loop hot leg at OTT flange (FE-PC-2) (filtered to 4 Hz) 124
56. Average fluid velocity in intact loop steam generator outlet at OTT flange (FE-PC-3) (filtered to 4Hz) . . . . . . . . . . . .... 124
57. Average fluid velocity ·in intact loop cold leg, hot leg, and steam generator outlet at OTT flanges (FE-PC-1, -2, and -3) (filtered to 4Hz). . . . . . . . . . . . . . . . . . . .. 125
58. Average fluid velocity in reactor vessel downcomer stalk 1, 47.1 in. above reactor vessel bottom (FE~lST-1) (filtered to 4Hz) ....... 125
59. Average fluid velocity in reactor vessel downcomer stalk 2, 47.1 in. above reactor vessel bottom (FE-2ST-l) (filtered to 4Hz) .... 126
60. Average fluid velocity in reactor vessel downcomer stalks 1 and 2, 47.1 in. above rear.tor vessel bottom (FE-lST-1 and FE-2ST-l) (filtered to 4 Hz) . . . . . . . . . . . . . . . . . 126
. 61.
62.
63.
64.
I
Flow rate in ECCS LPIS pump A discharge (FT-Pl20-85) . . . . . . . . . ...
Flow rat~ in ECCS HPTS pump A discharge (FT-Pl28-104). . . . . . ..
Flow rate in intact loop hot leg venturi ·(FT-Pl39-27-l and -27-3) ....... .
Liquid level in reactor vessel downcomer instrument stalk 1, bubble plot (LE-lST-1 and -2). . . . . . . . . . . . . .
xi
127
127
. . . 128
129
65.J Liquid level in reactor vessel downcomer instrument stalk 2, bubble plot (LE-2ST-l
·and -2). . . . . . . . . . . . . . .
66. Liquid level in blowdown suppression tank (LT-Pl38-33 and -58) . . . ...
67. Liquid level in pressurizer, southeast side (LT-Pl39-6). . . . . . . . . . .
68. Liquid level in pressurizer, southwest side (LT-Pl39-7). . . . . . . . . . .
69. Liquid level ih pressurizer, north side (LT-Pl39-8) ........ ~ ..... .
70. Liquid level in steam generator secondary coolant system {LT-P4-8B) ..... · .. : ..
. . .
. .
71. Average momentum flux in broken loop cold leg at
. 130
131
131
132
. 132
133
OTT flange (ME-BL-1) (filtered to 4Hz). . . 133
72. Average momentum flux in broken loop hot leg at OTT flange (ME-PC-2) (filtered to 4Hz). . . 134
73. Average momentum flux in broken loop cold and hot legs at OTT flanges (ME-BL-1 and -2) (fil-tered to 4 Hz) . . . . . . . . . . . . . . . 134
74. Average momentum flux in reactor vessel core simulator stalk (ME-·CS··-1) (filtered to 4Hz). 135
75. Average momentum flux in intact loop cold leg at OTT flange (ME-PC-1) (filtered to 4Hz) 135
76. Average momentum flux in intact loop steam generator outlet at OTT flange (ME-PC-3) (filtered to 4 Hz) . . . . . . . . . . . . . . 136
77. Average momentum flux in intact loop cold leg and steam generator outlet at OTT flanges
78.
(ME-PC-1 and -3) (filtered to 4Hz). . . . . . 136
Average momentum flux in reactor vessel downcomer stalk 1, 44.5 in. above reactor vessel bottom (ME-lST-1) (filtered to 4Hz) . . . . . 137
79. Momentum flux in reactor vessel downcomer stalk 2, 44.5 in. above reactor vessel bottom (ME-2ST-l) (filtered to 4Hz) ....... 137
80. Differential pressure in broken loop hot leg across 14-to-5-in. contraction (PdS-BL-1) (filtered to 4Hz) ............. '· 138
xii
;..

81. Differential pre~sure in broken loop cold leg across 14-to-5-in. contraction (PdE-BL-2) (fil-tered to 4 Hz) ... , . . . . . . . . . . . . 138
82. Differential pressure in broken loop across break planes (PdE-BL-3 and -4) . .. . . 139
83. Differential pressure in broken loop hot leg across pump simulator (PdE-BL-5) . 139
84. Differential pressure in broken loop hot leg across steam generator simulator outlet flange (PdE-BL-6) ................ · ..
85. Differential pressure in broken loop hot leg
140
across the steam generator simulator (PdE-BL-7) .. 140
86. Differential pressure in broken loop hot leg across steam generator simulator inlet flange (PdE-BL-8) (filtered to 4 Hz) ...... ·. . . . 141
87.
88.
89.
90.
Differential pressure in reactor vessel core simulator to downcomer instrument stalk 2, 24.'5 in. from reactor vessel bottom (PdE-CS-1) (filtered to 4 Hz) .............. .
Differential pressure in intact loop cold leg across primary coolant pumps 1 and 2 (PdE-PC-1).
Differential pressure in intact loop across the·steam generator (Pd~-PC-2) ...
Differential pressure in intact loop hot leg piping from reactor vessel outlet to the flow venturi (PdE-PC-3) (filtered to 4 Hz) .....
91. Differential pressure· in intact loop hot leg piping from flow venturi to steam generator
141
142
142
143
inlet (PdE-PC-4) (filtered to 4Hz). . . . . . . 143
92. Differential pressure in intact loop cold leg pri rna ry coo 1 ant pump discharge to reactor vessel inlet nozzle (PdE-PC-5) (filtered to 4 Hz) . . . . . . . . . . . . . . . . . . . . . . .. 144
93. Differential pressure in intact loop cold leg reactor vessel inlet to broken loop cold leg reactor vessel inlet (P~E-PC-7) (filtered to 4 Hz) . . . . · . . . . . . . . . . . . . . . . 144
94. Differential pressure in reactor vessel duwncomer stalk 1 to thi blowdown suppression tank (PdE-RV-1) . . . . . . . . . ........ 145
xiii

95. Differential pressure in reactor vessel intact loop cold-leg inlet to downcomer stalk 2 (PdE-RV-3) (filtered to 4Hz) ....... 145
96.
97.
Differential pressure in reactor vessel· upper plenum to the intact loop hot leg reactor vessel outlet nozzle (PdE-RV-4).
, Differential pressure in blowdown suppression tank across vacuum breaker line (PdE-SV-9) ..
98. Differential pressure in reactor vessel downcomer stalk 2, between 209.4 and 24.5 in. above reactor vessel bottom (PdE-2ST-2) (filtered to
146
146
4Hz) ....................... 147
99.
100.
101.
102.
103.
Differential pressure in intact loop across reactor vessel inlet and outlet nozzles (PdT-Pl39-30). . . Pressure in broken loop cold and hot legs (PE-8L-l and -2) . . . . . . . . . . .
Pressure in broken loop cold leg (PE-8L-l, -4, and -8). . . . •, . . . . . . . . . Pressure in broken loop hot leg (PE-8L-2, -3, and "-6). . . . . . . . . . . . . . . Pressure in reactor vessel core simulator instrument stalk, wide range (PE-CS-lA~ ..
104. Pressure in reactor vessel core simulator
the
. . . . 147
. . . . 148
. . . . 148
' ' ' 149
149
instrument stalk, narrow range (PE-CS-18). 150
105. Pressure in intact loop cold leg, hot leg, and steam generator outlet (PE-PC-1, -2, and -3A). 150
106. Pn::!::.::.ur·t! i11 iiiLdt.:L luu~ ~Ledlll yem:!r·ator outlet,. narrow range (PE-PC-38). . . . . . . . . . 151
107. Pressure in intact loop cold leg, hot leg, and pressurizer (PE-PC-1, -2, and -4). . . . . . . 151
108. Pressure in reactor vessel downcomer instrument stalk 1 and core simulator (PE-CS-lA and PE-lST -lA and -3A) ................ 152
109. Pressure in reactor vessel downcomer instrument stalk 1, 24.5 in. above reactor vessel bottom, narrow range (PE-lST-18) ............. 152
xiv
~·

110. Pressure in reactor vessel downcomer instrument stalk 1, 209.4 in. above reactor vessel bottom,
111.
112.
113.
114.
115.
116.
117 ..
118.
119.
120.
. 121.
122.
123.
124.
-125 ..
narrow range (PE-lST-38) . . . . . . . . . . 153
Pressure in reactor vessel core simulator and downcomer instrument stalk 1 (PE-CS-lFF and PE-lST-lFF and -3FF) . . . ...... .
Pressure in reactor vessel core simulator and downcomer instrument stalk 2 (PE-CS-lA and PE-2ST -lA) . . . . . . . . . . . . . . . .
Pressure in reactor vessel downcomer instrument
153
154
stalks 1 and 2 (PE-1ST-3FF and PE-2ST-3FF) . 154
Pre~sure in reactor vessel ctire simulator and downcomer instrument stalk 2 (PE~CS-2FF and PE~2ST-3FF). . . . . . . . . . . . . . . . . . 155
Pressure in blowdown suppression· tank bottom under downcomer 4, 180° (PE-SV-1) (filtered to 60 Hz) • .• • • • . • • • . • • . . • . . 155
Pressure in blowdown suppression tank across from downcomer 1, 157.5° (PE-SV-3) . . . . . 156
Pressure in .blowdown suppression tank header above downcomer 4, 321° (PE-SV-14) . . . . . 156
Pressure in·blowdown suppression tank 54.5 in. north of downcomer 2, 32]0 (PE-SV-17). . . . 157
Pressure in blowdown suppression tank header above downcomer 1 (PE-SV-18) . . . . . . . . 157
Pressui"e in bluwtluwn suppress1on ·tank bottom 54.5 in. north of downcomer 3, 180° (PE-SV-22) 158
Pressure in blowdown suppression tank bottom 54.3 in. north of downcomer 2, 180° (PE-SV-26) 158
Pressure in blowdown suppression tank bottom under downcomer 2, 180° (PE-SV-43) . . . 159
Pressure in bluwdown suppress1on tank top 6 in. north of downcomer 4, 0° (PE-SV-55).
Pressure in blowdown suppression tank top above downcomer 1, 0° (PE-SV-60) . . .
Pressure in blowdown suppression tank bottom (PE-SV-1, -22, -26, and -43) ........ .
XV
159
160
160

126.
127.
128.
129.
130.
131.
132.
133.
134.
135.
136.
137.
13.8.
139.
140 ..
141.
142.
Pressure in blowdown suppression tank top (PE-SV-17, -55, and -60) ....... .
Pressure in blowd.own suppression tank' header above downcomers 4 and 1 (PE-SV-14 and -18).
Pressure in ECCS lower plenum injection line (PT-Pl20-64) ............ . -.
Pressure in ECCS lower plenum injection line and
161
161
162
lower plenum (PT-Pl20-64 and PE-lST-lA). 162
Pressure in ECCS LPIS pump A di.scharge (PT-Pl20-83) . . . . . . . . . . .
Pressure in blowdown suppression tank .header 35 in. south of downcomer 1 (PT-Pl38-23) .
Pressure in blowdown suppression tank top (PT-Pl38-55 and -56) . . . . . . . .
Pressure in intact loop hot leg venturi (PT-Pl39-2 and -3) ....
Pump speed for intact loop pumps and 2 (RPE-PC-1 and -2). . . .
Temperature in broken loop cold leg, hot leg, and reflood assist bypass system (TE-BL-1, -2, and -3). . . . . . . . . . . . . . . . . . . .
Temperature in broken loop cold leg and hot lrig warmup lines (TE-CL-1 and TE-HL-2) ...... .
Temperature in reactor vessel core simulator instrument stalk (TE-CS-1) ........ .
Temperature in intact loop cold leg, hot leg, and steam generator outlet (TE-PC-1, -2, and -3)
Temperature in blowdown suppression tank liquid ~t t~nk hottom (TE-Pl38-22) ..... .
Temperature in blowdown suppression tank vapor at tank top (TE-P138-34) .....
Temperature in broken loop cold leg QOBV inlet and isolation valve inlet (TE-Pl38-62 and -63) . . . . . . . . . . . . .....
Temperature in broken loop hot leg QOBV inlet and isolation valve inlet (TE-Pl38-66 and -65)
xvi
Hi3
163
164
164
165
165
166
166
167
167
. 168
168
169

143. Temperature in intact loop pressurizer vapor and liquid (TE-Pl39-19 and -20). . . . . . . 169
144. Temperature in intact loop cold leg upstream of DTT flange (TE-Pl39-29) . . . . . . . . 170 .
145. Temperature in intact loop hot leg in elbow near venturi (TE-Pl39-32 and -33). . . . 170
146. Temperature in steam generator intact loop cold leg, hot leg, and secondary side (TE-SG-1, -2, and -3). . . . . . . . . . 171
147. Temperature in blowdown suppression tank B-end thermocouple stalk (TE-SV-1, -2, and -3) 171
148. Temperature in blowdown suppression tank B-end thermocouple stalk (TE-SV-4, -5, and -6) 172
149. Temperature in blowdown suppression tank A-end thermocouple stalk (TE-SV-7, -8, and -9) . . 172
150. Temperature in blowdown suppression tank A-end thermocouple stalk (TE-SV-10, -11, and -12). . 173
151. Temperature in blowdown suppression tank 107.2 in. from tank bottom (TE-SV-1 and -7). . . . 173
152. Temperature in blowdown suppression tank 93.0 in. from tank bottom (TE-SV-2 and -8) ......... 174
153. Temperature in blowdown suppression tank 74.7 in. from tank bottom (TE-SV-3 and -9). . . . . . .. 174
154. .Temperature in blowdown ·suppression tank 57.2 in. from tank bottom (TE-SV~4 and -10) . . . 175
155. Temperature in blowdown suppression tank 39.0 in. from tank bottom (TE-SV-5 and -11). 17.5
156. Temperature in blowdown suppression tank 14.7 in. from tank bottom (TE-SV-6 and -12). 176
157. Temperature in reactor vessel downcomer instrument stalk 1 (TE-lST-1, -2, -3, and -4). 176
158. Temperature in reactor vessel downcomer instrument stalk 1 (TE-lST-6, -8, -9, and -10) 177
159. Temperature in reactor vessel downcomer instru-.ment stalk 1 (TE-lST-11, -12, -13, and -14). . . 177
xvii
160.
1,61.
162.
Temperature in reactor vessel downcomer instru-ment stalk 2 (TE-2ST-2, -4, -7, and -9). . . .. · 178
Temperature in reactor vessel downcomer instru-ment stalk 2 (TE-2ST-10, -12, and -14). . .. 178
Temperature in reactor vessel downcomer instrument stalk 1, 189.3 in. from reactor vessel bottom (TE-lST-l). . . . . . .......... 179
163. Temperature in reactor vessel downcomer instrument stalks 1 and 2, 165.3 in. above reactor vessel bottom (TE-lST-2 and TE-2ST-2). . . . . 179
lb4. lemperature in reactor vessel downcomer instrument stalk 1, 141.3 in. above reactor vessel bottom (TE-lST-3) .................. 180
165. Temperature in reactor vessel downcomer instrument stalks 1 and 2, 117.3 in. above reactor vessel bottoni (TE-lST-4 and TE-2ST-4) .. ' . . .. 180
166. Temperature in reactor vessel downcomer instru- · ment stalk 1, 69.3 in. above reactor vessel bottom (TE-lST-6). . . . . . . . . . . ... 181
l67. Temperature in reactor vessel downcomer instrument stalk 2, 33.3 in. above reactor vessel bottom (TE-2ST-7). . . . . . ........... 181
lGO. T~mp~ratur~ in r~actor vessel do~ncomer instrument stalk 1, 29.3 in. above reactor vessel bott6m (TE-lST-8). . . . . . . . . . . . . . . . 182
169. Temperature in reactor vessel downcom~r instrument stalks 1 and 2, 25.3 in. above reactor v~~~el hnttnm (T~-l~T-9 anrl lE-2ST-9). . . 182
170. Temperature in reactor vessel downcomer instrument stalks 1 and 2, 21.3 in. above reactor vessel bottom (TE-lST-10 and TE-2ST-10). . . . . 183
171 Temperature in reactor vessel downcomer instrument s ta 1 k 1 , 17. 3 in above reactor ves·se 1 bottom (TE-lST-11) . . . . . . . . . . . . .. 183
172. Temperature in reactor vessel downcomer instrument stalks 1 and 2, 13.3 in. above reactor vessel bottom (TE-lST-12 and TE-2ST-12) ...... 184
173. Temperature i~ reactor vessel downcomer instrument stalk 1, 9.3 in. above reactor vessel bottom (TE-lST-13) . . . . . . . . . . . .... 184
xviii
174. Temperature in reactor vessel downcomer instrument stalks 1 and 2, 45.9 in. above reactor vessel bottom in DTTs (TE-lST-1~ and TE-2ST-14). 185
175. Temperature in ECCS lower plenum injection line (TT-P120-65) ................ : . 185
176.
177.
178.
179.
180.
181.
182.
183.
184.
185.
186.
TEST Ll-3 MEASURED PARAMETERS LONG-TERM PLOTS (175- AND 500-SECOND PLOTS)
Density in broken loop cold leg, chordal density (DE-BL-lA, -lB, and -lC) ....
Density in broken loop hot leg, chordal density (DE-BL-2A, -2B, and -2C) .
Fluid velocity in broken loop cold leg at OTT flanges (FE-BL-1) .... ~ ....... .
Fluid velocity in reactor vessel downcomer instrument stalk 2, 47.1 in. above reactor vessel bottom (FE-2ST-1) ...... .
Flow rate in blowdown suppression tank spray system 60-gpm header (FE-Pl38-138) ..
Flow rate in blowdown suppression tank spray system pump discharge (FE-P138-139) ..
Flow rate in blowdown suppression tank spray system 220-gpm header (FE-P138-140) ..
Flow rate in blowdown suppression tank spray system pump recirculation line (FE-P138-153)
Flow rate in ECCS LPTS pump A discharge (FT-Pl20-85) ........... .
Liquid level in blowdown suppression tank (LT-Pl38-33 and -58) .......... .
Momentum flux in the broken loop cold leg at nTT flange (ME-BL-1) ......•....
187. Momentum flux in reactor ~essel downcomer instrument s~alk 2, 44.5 in. above reactor
188
188
189
190
191
191
192
192
193
193
194
vessel bottom (ME-2ST-·l) ............. 194
188. Pressure in.reactor vessel core simulator instrument stalk, narrow range, and intact loop steam generator outlet (PE-CS-lB and PE-PC-3B). . . . . . . . . . . .• . . . . . ~ .
xix
195

189. Pressure in blowdown suppression tank across from downcomer 1, 157.5°, and bottom 54.5 in. north of downcomer 3, 180° (PE•SV-3 and -22) .. 195
190.
191.
192.
Pressure in blowdown suppression tank top north of downcomer 4 and above downcomer 1 (PE-SV-55 and -60) . . ....... .
Pressure in ECCS lower plenum injection line (PT-Pl20-64) .......... .
Pressure in ECCS LPIS pump A discharge (PT-Pl20-83) ............ .
193. Pressure in blowdown suppress1on tank top 48 in. north of downcomer 1 and 49 in. north
196
196
197
of downcomer 2 (PT-Pl38-55 and -66). . . . . 197
194. Pressure in'blowdown suppression tank spray system pump discharge and cooldown heat exchanger outlet (PT-Pl38-136 and -151). . . 198
195. Temperature in broken loop cold leg and hot leg (TE-BL-1 and -2) . . . . . . . . . . . . 198
196. Temperature in reactor vessel core simulator instrument sta 1k (TE-SC-1) . . . . 199
197. Temperature in intact loop cold leg, hot leg, and steam generator outlet (TE-PC-1, -2, and -3) 199
198. Temperature in blowdown suppression tank spray system pump discharge (TE-Pl38-142). . . . 200
199. Temperature in blowdown suppression tank spray system 60-gpm header and 220-gpm .spray header (TE-Pl38-141 and -143) . . . . . . . . . . . . 200
200.. Temperature in blowdown suppression tank B-end thermocouple stalk (TE-SV-1, -2, and -3) 201
201. Temperature in blowdown suppression tank B-end thermocouple stalk (TE-SV-4, -5, and -6) 201
202. Temperatare in blowdown suppression tank A-end thermocouple stalk (TE-SV-7, -8, and -9) 202
203. Temperature in blowdown suppression tank A-end thermocouple stalk (TE-SV-10, -11, and -12). . 202
204. Liquid level in blowdown suppression tank north end (LT-Pl38-33) ................. 203
XX
205. Liquid ~evel in blowdown suppression tank south end (LT-Pl38-58) . . . . . . . . . . . . . . . 203
206. Pressure in blowdown suppression tank across from downcomer 1, 157.5° (PE-SV-3) . . . . . . 204
207. Pressure in blowdown suppression tank bottom 54.5 in. north of downcomer 3, 180° (PE-SV-26) .- 204
208. Pressure in blowdown suppression tank bottom under downcomer 2 and under downcomer 3, 180° (PE-SV-43 and -44) . . . . . . . . . . . . . . . 205
209. Pressure in blowdown suppression tank top 48 in. north of downcomer 1 and 49 in. north of downcomer 2 (PT-Pl38-55 and -56) .. : 205
210. Temperature in blowdown suppression tank B-end thermocouple stalk (TE-SV-1, -2, and -3) 206
211. Temperature in blowdown suppression tank B-end thermocouple stalk (TE-SV-4 and -6). . . 206
212. Temperature in blowdown suppression tank A-end thermocouple stalk (TE-SV-10) ... ; . . . . . 207
213.
214.
215.
216.
217.
218.
219.
220.
TEST Ll-3 COMPUTED PARAMETERS
Flow regime and average density in broken loop cold leg .... · .......... .
Flow regime and average density in broken 1 oop hot_ 1 eg . . . . . . . . ._ . . . . . . . .
Flow regime and average density in intact loop hot 1 eg . . . . . . . . Enthalpy in broken loop cold leg
Enthalpy in broken loop hot leg.
Enthalpy in intact loop cold leg
Enthalpy in intact loop hot leg.
Enthalpy in intact loop at steam generator outlet . . . . . . . . . . . . . . . . .
221. Mass flow rate per system volume in broken loop cold leg calculated from FE-BL-1 and
210
211
212
213
213
214
214
. 215
ME-BL-1. . . . . . . . . , . . , . . . . . . . . . 215
xxi

222. Mass flow rate per system volume in broken loop cold leg calculated from DE-BL-1 and ME-BL-1 . 216
223. Mass flow rate per system volume in broken loop cold leg calculated from DE-BL-1 and FE-BL-1 .................... 216
224. Ma.ss flow rate per system volume in broken loop cold leg calculated from DE-BL-1 and PdE-BL-2 . . . . . ·· . . . . . . . . . . . . . . . 217
225. Mass flow rate per system volume in broken loop hot leg calculated from DE-BL-2 and· ME-.BL-2 ...................... 217
226. Mass flow rate per system volume in broken loop hot leg calculated from DE-BL-2 and FE-BL-2. . . . . . . . . . . . . . . . . .
227. Mass flow rate per system volume in broken loop
. 218
hot leg calculated from DE-BL-2 and PdE-BL-1 ... 218
228. Mas~ flow rate per system volume in intact loop cold leg calculated from FE-PC-1 and ME-PC-1 ... 219
229. Mass flow rate per system volume in intact loop cold leg calculated from FE-PC-1, PE-PC-1, and DE-PC-lB . . . . . . . . . . . . . . . . . . 219
230. Mass flow rate per system volume in intact luup cold leg Cdlculated from DE-PC-10 and ME-PC-1. . . . . . . . . . . . . . . . . . . . . . 220
231. Mass flow rate per system volume in intact loop cold leg calculated from DE-PC-lB and FE-PC- 1 .· . . . . . . . . . . . . . . . . . . . . . 220
232. Mass flow rate pe~ system volume in intact loop hot leg calculated from FE~PC-2 and PE-PC-2 ...................... 221
233. Mass flow rate per system volume in intact loop hot leg calculated from DE-PC-2 ~nd FE-PC-2. . . . . . . . . . . . . . . . . . . . . 221
234. Mass flow rate'per system volume in intact loop steam generator outlet calculated from FE-PC-3, PE-PC-3A, and DE-PC-3 .......... 222
235. Mass flow rate per system volume in intact loop steam generator outlet calculated from DE-PC-3 and ME-PC-3 ............ .
xxii
222
236. Mass flow rate per system volume in intact loop steam generator outlet calculated from DE-PC-3 and FE-PC-3. . . . . . . . . . . . . .. 223
237. Mass flow rate per system volume in intact loop pressurizer calculated from LT-Pl39-8 and PE-PC-4. . . . . . ~ . . . . 223
238. Pump speed, electrical, in intact loop primary coolant pumps 1 and 2. . . . . . . . . . . . . 224
239. Pump speed, electrical and mechanical, in intact loop primary coolant pump 1. . . . . • . . . . . 224
240. Pump speed, electrical and mechanical, in intact loop primary coolant pump 2. . . . . . . . . . 225
241. Pump motor slip in intact loop primary coolant pumps 1 and 2. . . . . . . . . . . . . . . . . 225
242. Pump motor individual electrical horsepower in intact .loop primary coolant pumps 1 and 2. 226.
243.
244.
245.
246.
247.
248.
249.
250.
251.
252.
253.
,254.
Pump motor total electrical horsepower in intact loop primary coolant pumps 1 and 2.
Pump total water horsepower in intact loop primary coolant pumps 1 and 2 ...
Pump combined efficiency in intact loop. primary coolant pumps. 1 and 2 ....... .
Pressure, closure, in intact loop (filtered to 4 Hz) . • • • • • • • • • • • • • •
Static quulity in broken loop cold leg
Static quality in brok~n loop hot leg.
Static quality in intact loop cold leg
Static quality in intact loop hot leg:
Static quality in intact loop at steam gene~utor outlet ....... .
Flow quality in broken loop cold leg
Flow quality in broken loop hot leg.
Flow quality in intact loop cold leg
xxiii
226
227
227
228
220
229
229
230
230
231
231
232

255.
256.
257.
258.
259.
260.
261.
262. "
263.
264.
265.
266.
267.
268.
269.
Flow quality in intact loop hot leg. . . . . . . . 232
Flow quality in intact loop at steam generator outlet . . . . . . . . . . 233
Saturation temperature in broken loop cold leg overlaid with TE-BL-1. . . . . . . . . . . . . 233
Saturation temperature in broken loop hot leg overlaid with TE-BL-2. . . . . . . . . . . 234
Saturation temperature in intact loop cold leg overlaid with TE-PC-1. . . . . . . . . . . 234
Saturation temperature in intact loop hot leg overlaid with TE-PC-2. . . . . . . . . . . . 235
Saturation temperature in intact loop steam generator outlet overlaid with T£-PC-3 . . . 235
Saturation temperature in reactor vessel core simulator instrument stalk overlaid with TE-CS-1 . 236
Saturation temperature tn reactor vessel downcomer instrument stalk 1 overlaid with TE-lST-9 ..................... 236
Saturation temperature in reactor vessel downcomer instrument stalk 2 overlaid with TE-2ST-9 .............. .
Void fraction in brokl:m loop cold lea.
Void fraction in broken loop hot leg .
Void fraction in intact loop cold 1 eg. ·
Void fraction in intact loop hot leg ..
Void fraction in intact loop at steam generator outlet . . . . .
TEST Ll-3 ERROR BAND PLOTS
237
?17
238
238
239
239
270. Valve opening (%) in broken loop hot leg QOBV with error bands (CV-Pl38-l5). . . . . . . . 242.
271. Chordal density in broken loop cold leg with error bands (DE-BL-lA) (filtered to 4Hz). . 242
272. Average velocity in broken loop cold leg at DTT flange with error bands (FE-BL-1) (filtered to 4 Hz) . . . . . . . . . . . . . . . . . . . . . . 243
xxiv
273. Average velocity in reactor vessel downcomer instrument stalk 1 with error bands (FE-lST-1) (filtere~ to 4 Hz) . . . . . . . . . . , . 243
274. Flow rate in blowdown suppression tank spray system pump discharge with error bands (FE-Pl38-139). . . . . . . . . . . . . . 244
.275. Flow rate in ECCS LPIS pump A discharge with error bands (FT-Pl20-85) .... ; ..... . ·. . •244
276.
277.
278.
279.
.280.
Flow rate in ECCS HPIS pump A discharge with error bands (FT-Pl28-104). . . ...
Flow rate in intact loop hot leg venturi with error bands (FT-Pl39-27-3) .
Liquid level in blowdown suppres?ion tank south end with error bands (LT-Pl38-58) ..... .
Liquid level .in pressurizer north side with error bands (LT-Pl39-8) .......... .
Momentum flux in broken loop cold leg at OTT flange with error bands (ME-BL-1) (filtered to 4 Hz). . . . . . . .. . . . . . . . . . · . . . .
281. Momentum flux in reactor vessel downcomer instrument stalk 1 with error bands (ME-lST-1) (filtered
245
245
246
247
to 4 Hz) ..................... 247
282. ·Differential pressure in broken loop hot leg at 14-to-5-in. reduction with error bands (PdE-BL-1) (filtered to 4 Hz) ................ 248
283. Differential pressure in broken loop cold leg at 14-to-5-in. reduction with error bands (PdE-BL-2) (filtered to 4Hz) . . . . . . . . . . . . . . 248
284. Differential pressure in broken loop cold leg across break plane with error bands (PdE-BL-3) .. 249
285. Differential pressure in broken loop hot leg across steam generator simulator outlet flange with error bands (PdE-BL-6) (filtered to 4 Hz) .. 249
286.
287.
Differential pressure in intact loop cold leg across primary coolant pumps 1 and 2 with error bands (PdE-PC-1) .............. .
D1fferent1al pressure 1n intact loop across steam generator ·with error bands (PdE-PC-2). ·.
XXV
250
250

288. Differential pressure in intact loop hot leg reactor vessel outlet to flow venturi with error bands (PdE-PC-3) .............. 251
289. Differential pressure from reactor vessel downcomer stalk 1 to blowdown suppression tank with error ban~s (PdE-RV-1) . . . . . . .. 251
290. Differential pressure in intact loop across the reactor vessel inlet and outlet nozzles with error bands (PdT-Pl39-30) . . . 252
291. Pressure in broken loop hot leg with error bands (PE-BL-2) ..... ~ . . . . . . . . . . 252
292. Pressure in reactor vessel core simulator instrument stalk, wide range, with error bands (PE-CS-lA) . . . . . . . . . . . . . . . . . . 253
293. Pressure in reactor vessel core simulator instrument stalk, narrow range, with error bands (PE-CS-lB) ...... · ........... 253
294. Pressure in reactor vessel core simulator instrument stalk, short-term plot, with error bands (PE-CS-2FF) .......... , . ~ .. 254
295. Pressure in reactor vessel core simulator instrument stalk, 70-second plot, wi~h error bands (PE-CS-2FF) ................. 254
296. Pressure in blowdown suppression tank header above downcomer 4, short-term plot, with error bands (PE-SV-14) .................. 255
297.
298.
299.
300.
Pressure in blowdown suppression tank header above downcomer 4, 70-second plot, with error bands (PE-SV-14) .............. .
Pressure in ECCS lower plenum injection point with error band::; (PT--Pl20-64) ....... .
Pressure in ECCS LPIS pump A discharge with error bands (PT-Pl20-83) ........ .
Pressure in blowdown suppression tank top with error bands (PT-Pl38-55) ...... .
255
256
256
257
301. Pressure in broken loop cold leg QOBV inlet, short-term plot, with error bands (PT~Pl38-lll) .. 257
302. Pressure in blowdown suppression tank spray system pump discharge with error bands (PT-Pl38-136). . ............. 258
xxvi
303.
304.
305.
306.
307.
308.
309.
310.
Pump speed in intact loop operating pump 2 with error bands (RPE-PC-2). · ..... .
Temperature in broken loop hot leg with error band~ (TE-BL-2) ......... .
Temperature in blowdown suppression tank liquid at tank bottom with error bands (TE-Pl38-22) ............. .
Temperature in blowdown suppression tank vapor at tank top with error bands (TE-Pl38-34) ...
Temperature in broken loop cold leg at QOBV inlet with error bands (TE-Pl38-62) .....
Temperature in broken loop cold leg isolation valve inlet with error bands (TE-Pl38-63). · ..
Temperature in blowdown suppression tank spray system 60-gpm header with error bands (TE-Pl38-141) ................ .
Temperature in intact loop pressurizer liquid with error bands (TE-Pl39-20) ........ .
258
. 259
259
260
260
261
261
262
311. Temperature in intact loop cold leg at steam generator inlet plenum with error bands (TE-SG-1). 262
312. Temperature in blowdown suppression tank B-end thermocou~le stalk with error bands (TE-SV-6) ... 263
I.
II.
I I I.
IV.
v.
VI.
VI I.
TABLES
Nomenclature for LOFT Instrumentation.
Chronology of Events for Test Ll-3 .
LOCE Ll-3 Initial Conditions ...
Primary Coolant Temperature Distribution at Rupture . , , . . , . . . • •
Water Chemistry Results for Test Ll-3.
Measured Parameters for LOFT Test Ll-3 .
Computed Parameters for.LOFT Test ll-3
xxvii
18
34
36
38·
40
54
85
/
EXPERIMENT DATA REPORT FOR LOFT NONNUCLEAR TEST Ll-3
I. INTRODUCTION
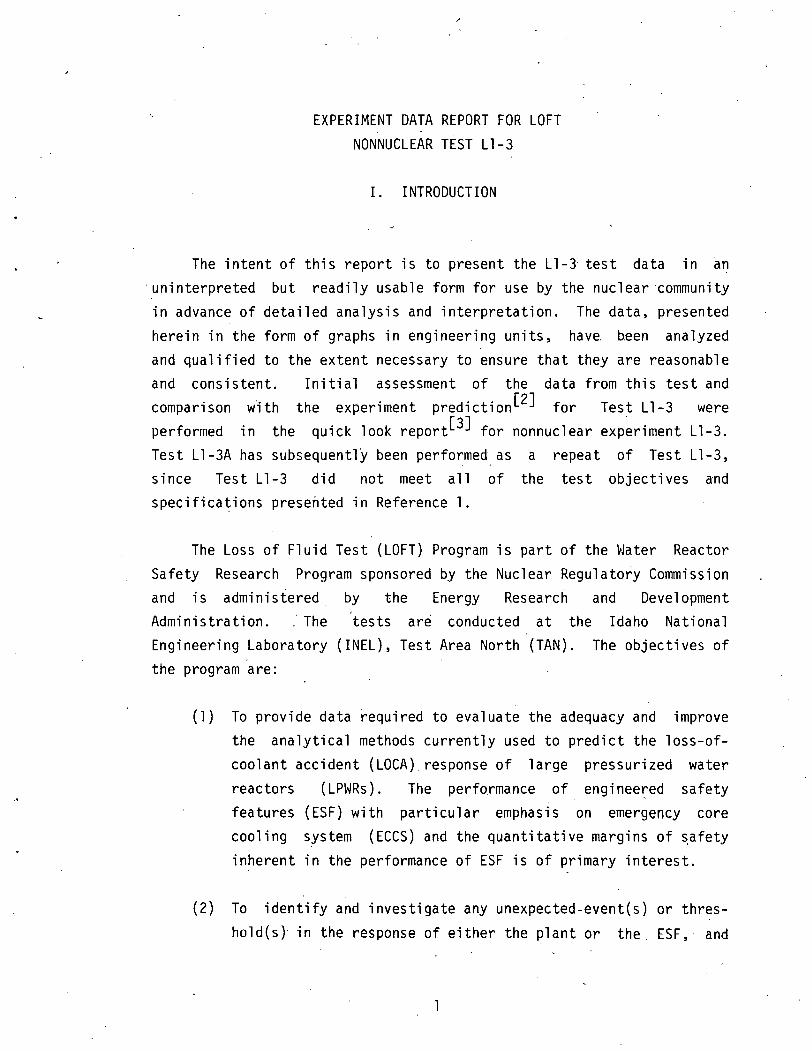
The intent of this report is to present the Ll-3 test data in an uninterpreted but readily usable form for use by the nuclear ·community in advance of detailed analysis and interpretation. The data, presented herein in the form of graphs in engineering units, have. been analyzed and qualified to the extent necessary to ensure that they are reasonable and consistent. Initial assessment of the data from this test and comparison with the experiment prediction[2] for Test Ll-3 were performed in the quick look report[ 3] for nonnuclear experiment Ll-3. Test Ll-3A has subsequentlY been performed as a repeat of Test Ll-3, since Test Ll-3 did not meet all of the test objectives and specifications presented in Reference 1.
The Loss of Fluid Test (LOFT) Program is part of the Water Reactor Safety Research Program sponsored by the Nuclear Regulatory Commission and is adminisiered by the Energy Research and Development Administration. .·The tests ar~ conducted at the Idaho National Engineering Laboratory (INEL), Test Area North (TAN). The objectives of the program are:
(1) To provide data required to evaluate the adequacy and improve the analytical methods currently used to predict the loss-ofcoolant accident (LOCA) response of large pressurized water reactors (LPWRs). The performance of engineet:'ed safety features (ESF) with particular emphasis on emergency core cooling system (ECCS) and the quantitative margins of s.afety inherent in the performance of ESF is of primary interest.
(2) To identify and investigate any unexpected-event(s) or threshold(s)· in the response of either the plant or the. ESF, and
·,

develop analytical techniques that adequately describe and account for such unexpected behavior.
In order to meet these objectives, the LOFT Integral Test Facility[a] has been designed to simulate the major components of a
LPWR, and several series of the experiments have been planned to produce data on the combined thermal, hydraulic, nuclear, and structural processes expected to occur during a LOCA.
The first LOFT test series (designated Ll) is the nonnuclear test series which consists ·of five isothermal blowdown tests .. This test series has been designed to make available large scale isothermal blowdown and reflood system data as a first phase of the LOFT Program. Varied parameters include break size, break location, break opening time, primary coolant system flow resistance, emergency core coolant (ECC) injection location, and primary coolant system pressure. Blowdown suppression tank performance, as influenced by initial tank level, water temperature, pressure, and spray system control, will be evaluated. Specifically, the purposes of this test series are:
(1) To determine that the equipment/systems function properly
(2) To demonstrate that the entire test facility can withstand the structural loads of blowdown
(3) To determine that the blowdown test procedures are adequate
[a] The term "integral" is used to describe an experjment combining the nuclear, thermal, hydraulic, and structural processes occuring during a LOCA and differentiates it from the separate effects, nonnuclear, small-scale, thermohydraulic experiments conducted for
loss-of-coolant analysis.
2
' '
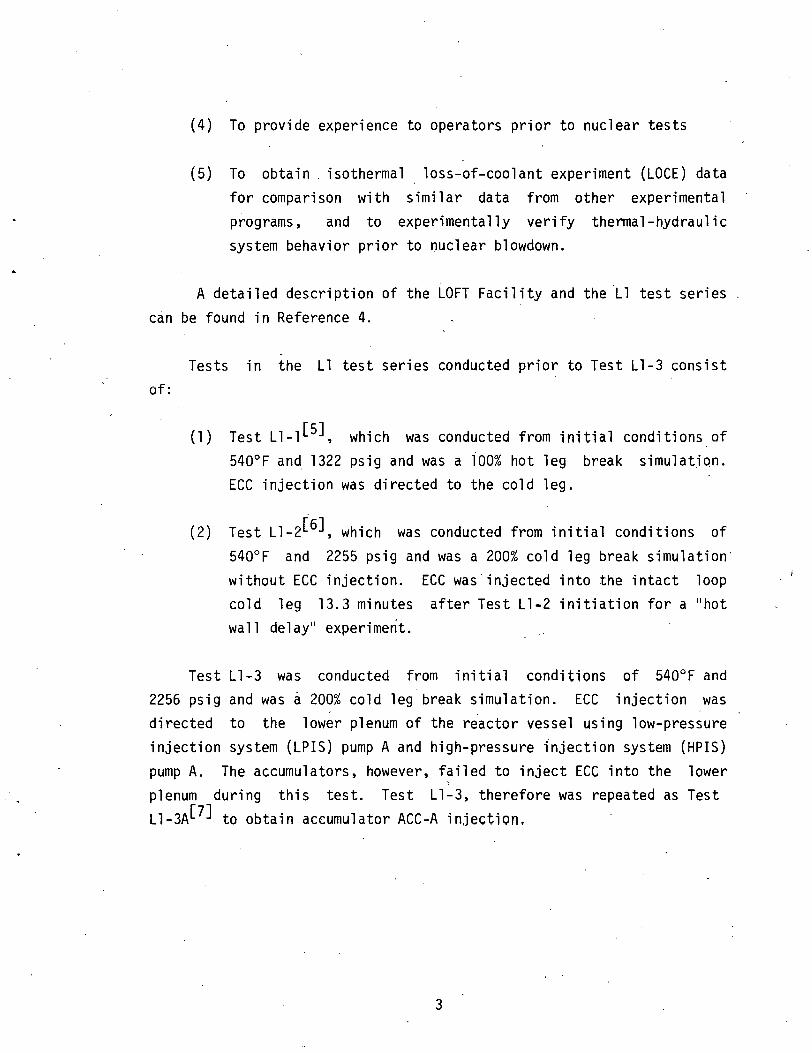
(4) To provide experience to operators prior to nuclear tests
(5) To obtain . isothermal . loss-of-coolant experiment (LOCE) data for comparison with similar data from other experimental programs, and to experimentally verify thermal-hydraulic system behavior prior to nuclear blowdown.
A detailed description of the LOFT Facility and the Ll test series can be found in Reference 4.
of: Tests in the Ll test series conducted prior to Test Ll-3 consist
(1) Test Ll-1[5J, which was conducted from initial conditions of 540°F and 1322 psig and was a iOO% hot leg break simulation. ECC injection was directed to the cold leg.
(2) Test Ll-2(6], which was conducted from initial conditions of 540°F and 2255 psig and was a 200% cold leg break simulation· without ECC injection. cold leg 13.3 minutes wall delay,. experiment.
ECC was·injected into the intact loop after Test Ll-2 initiation for a 11 hot
Test Ll-3 was conducted from initial conditions of 540°F and 2256 psig and was a 200% cold leg break simulation. ECC injection was directed to the lower plenum of the r~actor vessel using low-pressure injection system (LPIS) pump A and high-pressure 1njection system (HPIS) pump A. The accumulators, however, failed to inject ECC into the lower plenum during this test. Test Ll-3, therefore was repeated as Test Ll-3A[?] to obtain accumulator ACC-A injection.
3

The specific purposes of Test Ll-3 were to:
(1) Compare break flow data with predictions
(2) Measure pump resistance and coastdown characteristics
(3) Determine system performance with ECC injection into the lower plenum
(4) Determine two-phase flow resistance . of various components
system
(5) Evaluate the scaling effects of the various primary system components
(6) Evaluate the effect of intact loop resistance on system thermal-hydraulic performance by comparison with corresponding results from Test Ll-2.
Test Ll-3 met all of these objectives except number 3. Since Ll-3 was nearly identical to Ll-3A up to the t1me of accumulator injection (22 seconds after blowdown initiation), Test Ll-3 provides a good measure of experiment repeatability. Also, since Test Ll-3 did include HPIS and LPIS injection, some indication of degraded ECC performance is provided by the Ll-3 data.
Section II of this report briefly describes the LOFT system and the facility configuration specific to this test. Section III discusses the LOFT instrumentation system 1nclud1ng the basic types of detectors utilized, the methods of obtaining certain mea~urements, and the LOFT data reduction process. Section IV summarizes the test procedures used to conduct Test Ll-3 and presents a chronology of events that occurred during the test. Section V presents the initial conditions of the test,
both specified and as measured. Section VI discusses numerous methods
employed to verify the consistency and accuracy of the data presented.
Finally, Section VII presents the data graphs and provides tables of
4

comments and supporting information necessary for the interpretation of .the data.
5

II. SYSTEM CONFIGURATION
The LOFT Facility has been designed to simulate the major components and system responses of a LPWR during a LOCA. The test assembly is comprised of five major subsystems which have been instrumented such that desirable system parameters can be measured and recorded during a LOCE. The subsystems include: (a) the reactor vessel, (b) the intact loop, (c) the broken loop, (d) the blowdown suppression system, and (e) the ECCS. System instrumentation is discussed in Section III.
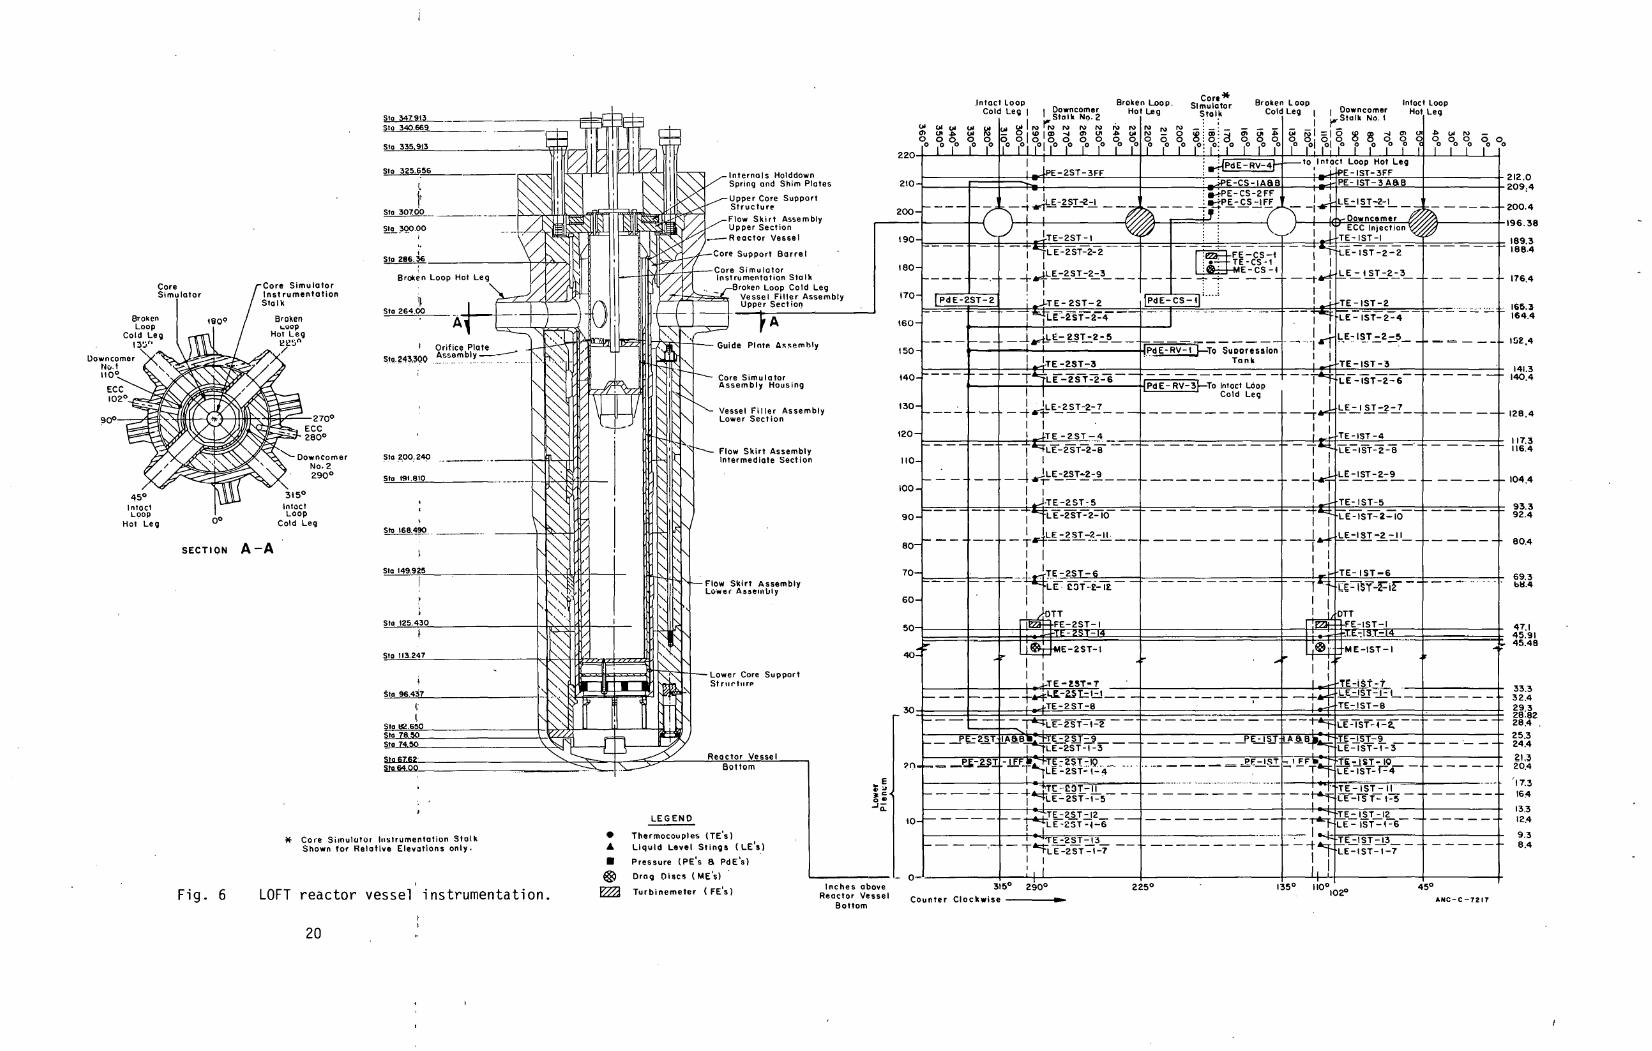
The LOFT reactor vessel simulates the rea~tor vessel of a LPWR. It has an annular downcomer, a lower plenum, lower core support plates, a core simulator, and an upper plenum. The downcomer connects with the cold leg of both the intact loop and the broken loop and contains·two experimental instrument stalks; the upper plenum connects the hot leg of both the intact loop and the broken loop. The core simulator contains an experimental instrument staJk and a hydraulic orifice plate assembly to simulate the flow resistance of a nuclear core which will be installed for nonnuclear LOCE Ll-5.
The intact loop simulates the unbroken loops of a LPWR. This loop contains a steam generator, two circulating coolant pumps connected in parallel, a pressurizer, a venturi flowmeter. and connecting piping. Each circulating coolant pump is powered by a primary system motor generator (PSMG) set consisting of an ac motor coupled to an ac generator through an adjustable fluid clutch. A flywheel is connected directly to each generator shaft. For this experiment, the primary s1de steam generator inlet and outlet plenums contained square edged orifice plates sized for low resistance based on core flow area scaling. · Thus, these orifices provided a similar pressure drop at scaled flow rates around the LOFT intact loop (excluding the reactor vessel) as exists in a . LPWR operating loop. The secondary side of the steam generator was filled to a predetermined level and isolated from the remainder of the secondary coolant system. The intact loop cittulating coolant pumps
6
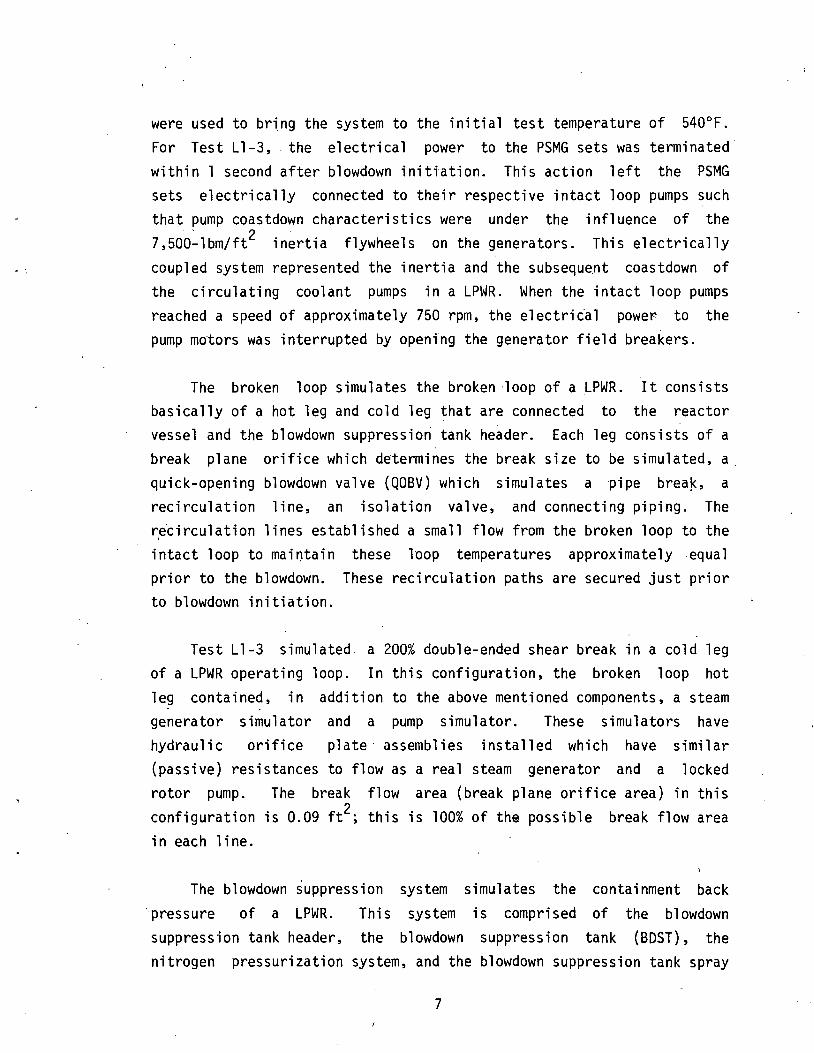
were used to bring the system to the initial test temperature of 540°F. For Test Ll-3,- the electrical power to the PSMG sets was terminated· within 1 second after blowdown initiation. This action left the PSMG sets electrically connected to their respective intact loop pumps such that pump coastdown characteristics were under the
. ' 2 7,500-lbm/ft inertia flywheels on the generators.
influence of the This electrically
coupled system represented the inertia and the subsequent coastdown of the circulating coolant pumps in a LPWR. When the intact loop pumps reached a speed of approximately 750 rpm, the electric.al power- to the pump motors was interrupted by opening the generator field breakers.
The broken loop simulates the broken ·loop of a LPWR. It consists basically of a hot leg and cold leg that are connected to the reactor vessel and the blowdown suppressiori tank header. Each leg consists of a break plane orifice which de·termines the break size to be simulated, a quick-opening blowdown valve (QOBV) which simulates a pipe break, a recirculation line, an isolation valve, and connecting piping. The r,edrculation lines established a small flow from the broken loop to the intact loop to maintain these loop temperatures approximately .equal prior to the blowdown. These recirculation paths are secured just prior to blowdown initiation.
Test Ll-3 simulated a 200% double-ended shear break in a cold leg of a LPWR operating loop. In this configuration, the broken loop hot leg contained, in addition to the above mentioned components, a steam generator simulator and a pump simulator. These simulators have hydraulic orifice plate· assemblies installed which have similar (passive) resistances to flow as a real steam generator and a locked rotor pump. The break flow area (break plane orifice area) in this configuration is 0.09 ft2; this is 100% of the possible break flow area in each line.
The blowdown suppression system simulates the containment back pressure of a LPWR. This system is comprised of the blowdown suppression tank header, the blowdown suppression tank (BDST), the nitrogen pressurization system, and the blowdown suppression tank spray
7

system (BDSTSS). The blowdown header is connected to the suppression tank by four suppression tank downcomers that extend inside the tank and
discharge below the water level established as a Test Ll-3 initial condition. The nitrogen pressurization system is supplied by the LOFT inert gas system and utilizes a remote controlled pressure regulator to establish and maintain the specified BDST initial pressure. The spray system consists of a centrifugal pump which discharges through a heatup heat exchanger and either three spray headers or a pump recirculation
line that contains a cooldown heat exchanger. The spray pump suction can be aligned to either the BUST or the borated water storage tank {BWST). The three spray headers have a 20-gpm, a 60-gpm, and a 220-gpm flow rate capacity and are located in the BDST along the upper
centerline.
To model the containment back pressure of a LPWR, predetermined initial conditions are established in the BDST. Thus, prior to blowdown initiation, the spray pump suction is aligned to the BDST and BDST water
is recirculated through the three spray headers. Steam is admitted to the heatup heat exchanger until the BDST water is heated to its specified temperature. Following BDST heatup, flow is secured through the three spray headers and the BDSTSS piping is cooled down using the cooldown heat exchanger in the pump recirculation line. Prior to BDST spray initiation, the spray pump suction is specified to be shifted to
the BWST so that a cooler water source is available for BDST pressure suppression. For Test Ll-3, suppression tank spray was manually initiated and adjusted to 320 gpm after accumulator nitrogen entered the
tank to establish the pressure suppression effectiveness of the BDSTSS. Therefore, the blowdown effluent was.contained within the BDST while
obtainin~ the same peak pressure as if the break was in a LPWR which was discharging into its containment vessel.
The LOFT ECCS simulates the ECCS of a LPWR. The accumulator, the
HPIS, and the LPIS were specified to be used during this experiment.
Each system was configured to inject scaled flow rates of ECC directly
into the lower plenum of the reactor vessel. To provide these scaled
flow rates, accumulator ACC-A, HPIS pump A, and LPIS pump A were
8

selected. Accumulator ACC-A was preset to inject ECC at a system pressure of 600 psig. Due to a procedural error, · however,
accumulator ACC-A and backup accumulator ACC-B failed to initiate injection. HPIS pump A was preset to inject at 17.2 gpm and to
initiate by LOCE ·control at 22 seconds after the initiation of
blowdown; LPIS pump A was adjusted to initiate by LOCE control at
35.5 seconds after the initiation of blowdown. While the above ECCS injection times and pressure represent those preset test conditions
specified in the EOS, the actual recorded parameters are presented in the test summary and Section IV.
The LOFT major components are shown.pictorially in Figure 1, and a
LOFT piping schematic, with instrumentation, is shown in Figure 2.
Reference 1 gives details of the experiment configuration and operation;
Reference 4 gives a detailed description of the LOFT system.
9

Steam Generator
Steam Generatcr Outlet OTT Flarge
Broken .1
L<lop Cold l...9g OTT !Flange
Broken Loop .. HQt Le91 [)Jll'
Fl3nge
ECC Lower Plenum Injection l,ret
+-+----- ECC Cold Leg Injection l~et
Intact Loop Cold Leg OTT Farge
EGG-A-9!9
Fig. 1 LOFT major compohents.
Suppression Tank

Borated Water Storage Tonk
4"
4" XR0-67
. ( --~~ 'r---, XR2t---69-------=-6'_' --------,
"" ~ Accumulator B ,..---------------"4',-------~--l
4"
I I I
4"
XR0-65
4" I I I I I
L_ ______ . ___________ l r-----, : Oecon.
411 ,.!." . 2
I HPI~, " I
Pump B Aux. Spray from I Purification .--------- _j
System 1
I Spray Llnel from Cold I
Leg I Pres.surizer PE-PC-4
TE-P139-
PT-P139-3,4,5
/L T-:\ P-139-'6.7.81
I I I
;~-P13;9---~~~~--~~~<5~~-c============:J~~--~
. Cycling l Backup Heaters
PE-PC-3A PE-PC-36 FE-PC-3 ME-PC-3 TE-PC-3 DE-PC-3
« Electrically '--T~ Connected
to PC- P-2
PE-PC-1 FE-PC-1
·ME-PC-1 TE-PC-1 DE-PC-1
TE-P139-28-2,29
Mechanical Connections
Alternator
~
CD J: 0 a.. u <[
E lectrlcolly ~
~!_A _______ ~, Connected ~
to PC-P -I
PT-P120-43 HPIS, II
Pump A
I I I I L
4"
4" Crossover Line
4" ECC
4"
611 x 4 11
Reducer
4"
PE-BL-1 FE-BL-1 ME-BL-1 TE-BL-1
PE-BL-2 FE-BL-2 ME-BL-2 TE-BL-2 DE-BL-2
FT-P120-85
To Suppression Tonk Pressure Control System
I ,~ ..
FE-P-138-153
4"
I FE·P·t38· 140--
3" ! 3"
•I
I I I I I
4"
4"
4"
~~m~_..J
FE-P138-139
4" Crossover Line
t. This Section is Valve and Mechanical Joint l
ANC-D-7221
Fig. 2 LOFT piping schematic (with instrumentation).
11

III. MEASUREMENTS AND INSTRUMENTATION
The LOFT instrumentation system was designed to measure and record the important events that occur during a LOCE. For Test Ll-3, 549 channels of data were recorded. Data from the thermal-hydraulic measurements (i.e., temperatures, pressures, flow rates, liquid levels, densities, pump speeds, and QOBV positions as functions of time) are of primary importance and are included in this report. Mechanical measurement data such as acceleration and strain were recorded for monitorina structurnl londs on t.hP. LOFT system but are not of primary intl::'rPc.;t·. rt<.; l.hP. r·f!~ulb are specific to the LOFT mechanical arrangement and therefore are not included.
Thermocouples and resistance temperature devices were used to sense the fluid temperatures at all major locations 'in. the system.
Pressure measurements were generally obtained with strain-gage-type transducers with pressure transmission lines connecting the transducers to the measurement points. A few piezoelectric-type transducers were u5ed Where high frequency response wa~ de~ired rather than absolute accura.c:y. FrP.P. .... fiP.ld pressure transdu<.;~rs, in which the· sensing elements w~r~ 1ns1de a bellows arrangement, were alsu used ·tu ~l·JminiiL~
connecting transmission lines and thereby produce higher frequency response without the distortion caused by the lines.
Differentiai pressures were measured by strain-gage-type transducers with double chambers. The transducers were connected to the two measur~ment points with pressure transmission lines.
Flow velocities were generally obtained by use of turbine flowmcters, which consisted of rotating vanes with magnetic blades and stationary magnetic pickup coils. Other methods of determining flow velocity included calculation by:
12

(1) Dividi.ng mass flow from venturi meters by the density and flow area
(2) Dividing momentum flux from the drag discs by the density and· taking the square root of the quotient:
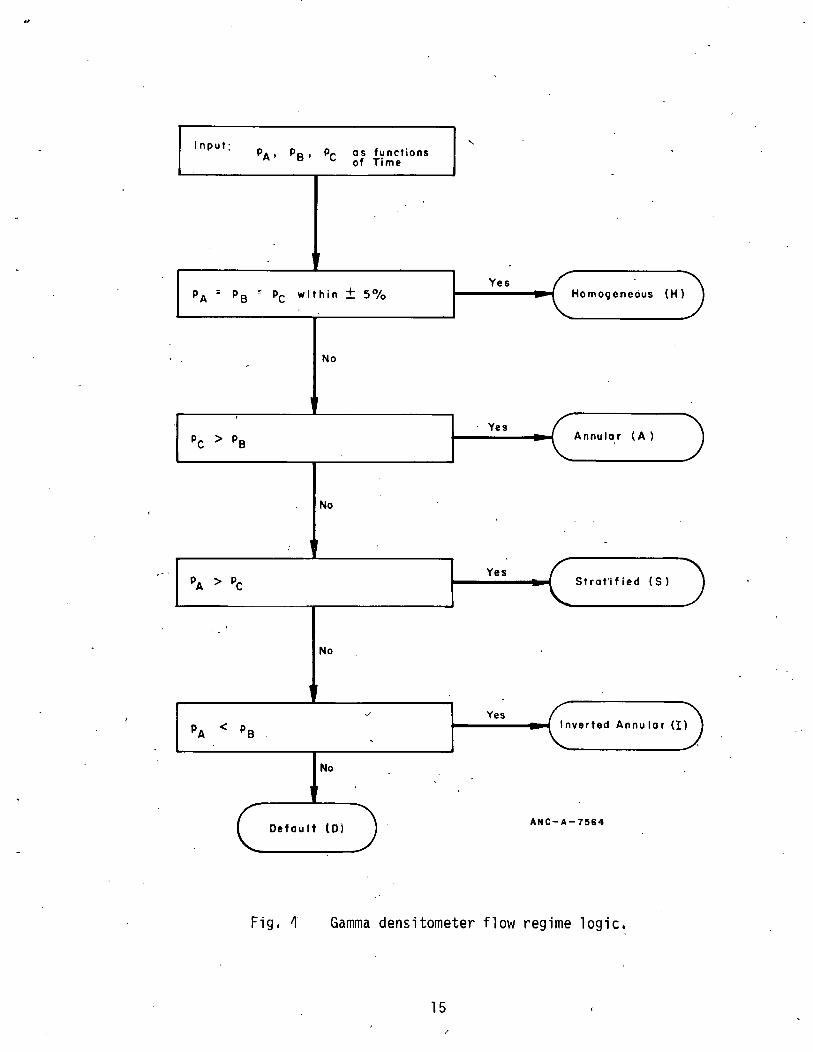
Density was·measured by means of gamma densitometers (shown in Figure 3), which use the attenuation of gamma rays from a cesium-137 source to sense the mass of fluid within a pipe. The densitometers used in LOFT each have three beams (designated A, B, and C) which traverse the lower, middle, and upper parts of the pipe, respectively, for the horizontal pipe densitometers. For the steam generator discharge densitometer, where the pipe is vertical, the densitometer •s• beam is in the plane of the adjacent pipe bends. By using the logic table given in Figure 4 and special calibrations, the average density and the flow regime can be obtained, The special calibratio~s mentioned were obtained from testing with lucite and wood representations of various fluid density distributions in an actual piece of LOFT piping. These calibrations were then used to produce weighting factors to be used on each beam in combining the individual beam outputs to obt~in the average density. Experimentation showed the use -of simple weighting factors to be as accurate for average density as severa 1 more complex meth.ods of determining the fluid distribution in the pipe. The resultant weighting factors were changed as a function of the flow regime. The weighting factors used in this report were as shown in the following equations:
for stratified flow, and
p = 0.345pA + 0.40lpB + 0.254pc
for other flow regimes.
Another method used in LOFT for obtaining fluid density is by means of drag discs, which sense momentum flux, and turbine meters, which
13 \.

~---- Source
Pipino 'C' Detector
.---'c' Detector
<t_ 'c' Beam
Be om
'A' Detector ct_ '.l' Be om
ANC-1·7051
Relation of source and detector to pipe in DE-BL-1 and DE-PC-1 (view looking to-.-Jard reactor vessel).
i
I I~ C Beam
'e' Detector ~----i...,
'e; Beam ~I 'A' Becm
AN C·A-70 52
Relation of source and detector to pipe in DE-BL-2 and DE-PC-2 (view looting toward reactor vessel).
; C' Detector
LOFT Pi pi 10
'A' Beam ANC-A-70110
Fig. 3
Relatian of source and detector to pipe in ~E-PC-3 (view looking dm<~n). ·
Gamma densitometer beam configuration.
..
Input: ' PA I P8 1 Pc OS functions
of Time -
-Yes
PA : Pe = Pc within + 5°/o Homogeneous (H l
No -
' Yes Pc > Pe Annular (A l
No
-
Yes PA > Pc StrotH ied ( s)
No
-v Yes
PA < Pe Inverted Annu lor (!)
'
No
Default (0) ANC-A-7!164
Fig. ~· Gamma densitometer flow regime logic.
15 /

measure velocity .. The density is obtained from these measurements by
dividing the momentum flux by the square of velocity:
p 2 = pV -2
v
(from drag disc) ·
(from turbine meters).
This simplified approach neglects the effects of phase slip, velocity,
and the density distributions near the measurement locations.
Lif'juid levels were obtained by means of (a) differential pressure
transducers in the pressurizer, accumulators, a.nd suppression tank, and
(b) liquid detectors, which sense the conductivity of the fluid near each of a series of electrical contacts, in the reactor vessel.
Valv~· positions (analog indication from 0 to 100% of opening) were
measured. by either resistance potentiometers or . differential
transformers.
Mechanical pump speed was measured by an eddy current displacement
transducer which used a slotted metallic target attached to the top of
the pump motor shaft. The target contains six asymmetrical slots such that pump speed and direction of rotation can be determined. Pump speed
was also calculated from the PSMG set frequency. No allowance for slip
between the electrical field and the rotor was used in this latter
calculation.
Acceleration, displacement, mechanical strain, and valve off-on
indicators were sensed by accelr.rometers, linear variable differential transformers, bonded strain gages, and microswitches, respectively.
Since these are not considered of prime importance in understanding this
experiment, they are not included here. This information will he
reported in an addendum to this report if sufficient requests for the
information are received.
16

Many variables can be computed by combining measured parameters. Some of the~e variables are shown in Section VII.
The data acquisition and visual display system (DAVDS) was used to -
record the measurement data from the various instrumentation. systems on a combination of narrow-band digital recorders, medium-band multiplexed frequency modulator (FM) analog tape recorders, wide-band analog tape recorders, strip charts, and oscillograph recorders. Redundant records were. made where different uses dictated more than one recording mode or ' extra safety measures were desired for critical measurements.
A digital computer was used to collect the data at the LOFT Facility and to perform equipment calibrations and post-test data reduction and plotti.t1g. Immediately following the test, the computer was used to reduce critical channels of digital data so that a decision could be made quickly as to the success of the experiment. The digital data was transferred to magnetic tape and the tape recorded analog data was converted into digital form on magnetic tape compatable with the IBM-360/75 computer data processing programs.
The IBM-360/75 computer was used to further reduce the data. Calibration factors were first applied to produce engineering units data plots so that engineering specialists could examine each channel for discrepancies or unexpected events. After the data graphs were examined and qualified, ·they were then used to generate graphs and compute variables. Specifics of these topics are given in Section VII and a complete description of the data acquisition system and data reduction ·is given in References 8 anq 9.
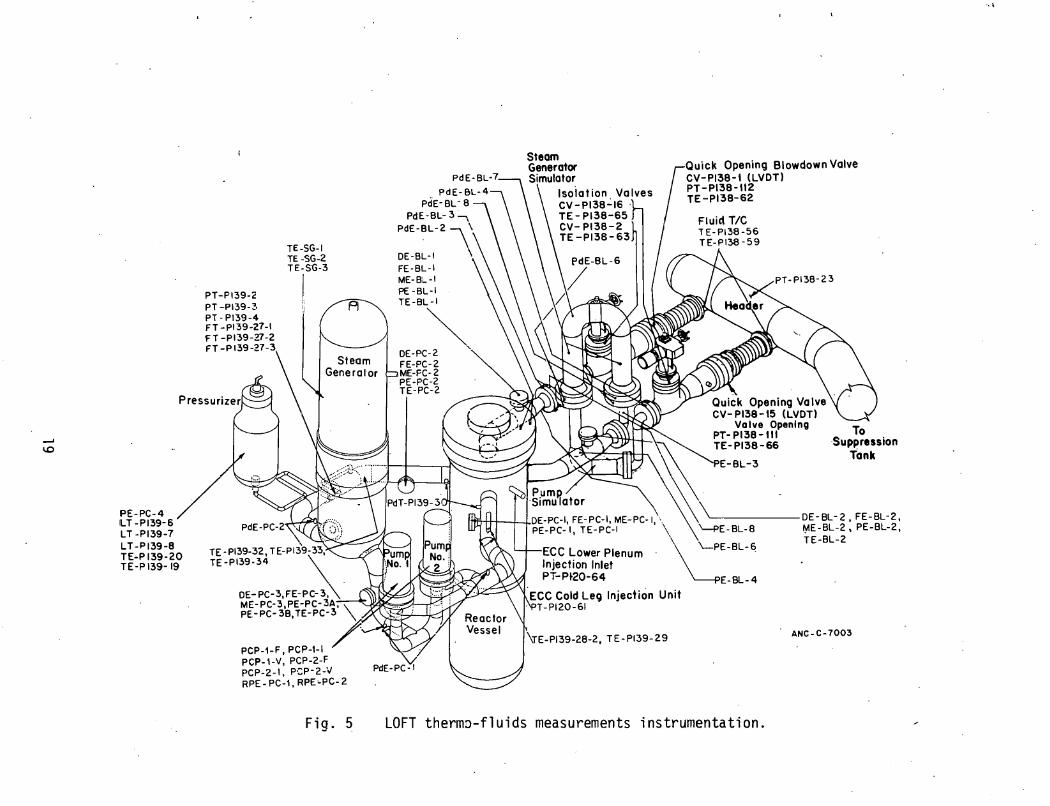
figure 2 shows a piping schematic with instrument locations indicated. Table I gives the nomenclature for LOFT instrumentation designations. Figure 5 shows an isometric view of the major system components with instrument locations indicated, and Figures 6 through 12 give more specific locations for instruments located on individual components. Reference 4 should be consulted for details of instrument design and locations. (Locations, ranges, and frequency responses for
17
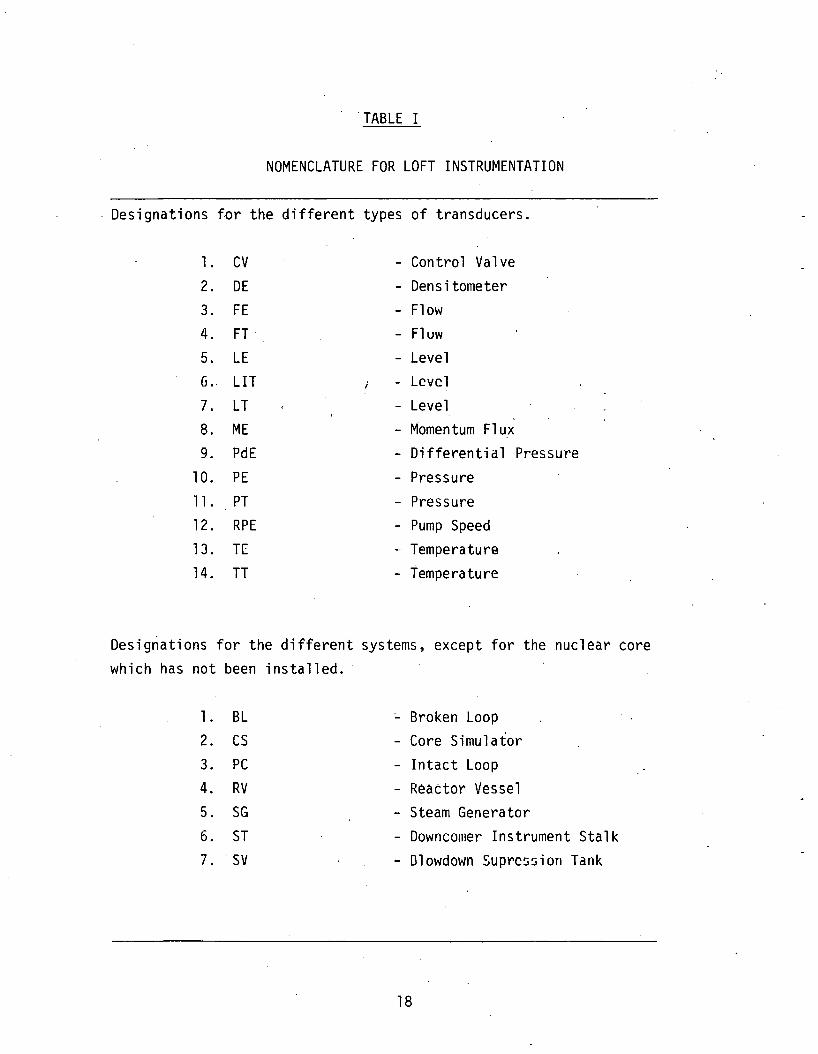
TABLE I
NOMENCLATURE FOR LOFT INSTRUMENTATION
Designations for the different types of transducers.
1. cv - Control Valve 2. DE - Densitometer 3. FE - Flow 4. FT· Fluw 5. LE - Level
fi.' LIT -· Lcvc 1 7. LT - Level 8. ME - Momentum Flux 9. PdE - Differential Pressure
10. PE - Pressure 11. PT - Pressure 12. RPE - Pump Speed 1 J. TE ·· Temperature 14. TT - Temperature
Designations for the different systems, except for·the nuclear core which has not been installed.
1. BL - Broken Loop 2. cs Core Simulator 3. PC - Intact Loop 4. RV - Reactor Vessel 5. SG - Steam Generator 6. ST - Downcomer Instrument Stalk 7. sv - Olowdown Suprcssion Tank
18
PT-P139-2 PT -PI39-~· PT- P139-4 FT-PI39-Z7-1 FT-PI39-27-2 FT -P 139-27-3
TE-SG-1 TE -SG-2 TE-Su-3
I !I
Pressurizer
PE-PC-4 IL T -P139-6 LT -P139-7 L T -P139-8 TE-P139-20 TE-P139-19
PCP-1-F, PCP-1-1 PCP-1-V, PCP-2-F PCP-2-1, PGP-2-V RPE-PC-1,RPE"PC-2
Fig. 5
PdE-BL-4 PdE-BV 8
PdE-BL- 3 1 PdE-BL-2 \\
DE-BL-1 \ FE-BL-1 ME-B'.-1 PE -BL-1 TE-BL-1
~
\TE-P139-28-2, TE-P139-29
Quick Opening Slowdown Valve CV-PI38-t (LVDT) PT-PI38-tt2 TE-PI38-62
ANC-C-7003
LOFT thermJ-fluids measurements instrumentation.
...
Sto 335,913
Sto 325.~~5~6 ____________ _ lerna Is Holddown
I. pring and Shim Plates
1' pper Core Support tructure low Skirt Assembly ~--- --------- -----~~Htg~~~RTf'ffi'n~~aJC1~~071
Intact LOOP
Core Simulator
Hot Leg
Care Simulator lnst rumentatian Stalk
+-+H&P~~~~---270° ECC 280°
Intact Loop
Cold Leg
Sto ~QO.OO
I Sto 286.36
Brok~n Loop Hot Leg
II Sto 264.00
Orifi<:e Plqte ~IQ.g'\~.~OO Assembly _ ___.
Sto .ZOO, 249
Sta 19t.F.lt0
Sto 168.490
SECTION A -A
Fig. 6
Sto 149.925
Sto 125.430
Sto tf3.Z47
Sto 96.437
Sto 112.650 Sto Sto 4 !50
* Core Sirnulotor Instrumentation Stalk Shown tar Relative Elev~tions only.
LOFT reactor vessel instrumentation.
20
pper Section eactor Vesse I
Support Barrel
Simulator rumentation Stalk roken Loop Cold Leg Vessel Filler Assembly Upper SectioQ
rA e PlntP. A"'emhly
e Simulator embly Housing
sel Filler Assembly
LEGEND
Thormocouples (TE's) Liquid Level Stings
er Sect ion
w Skirt Assembly rmediate Section
kirf Assembly A••eml.oly ·
r Core Support turP.
or Vessel 11om
( LE's)
Pressure (PE's 6 PdE
Oro~;~ (liS<:$ (ME's)
Turbinemeter (FE's)
'sl
t; J:C: oe> ,J-
0..
Inches above Reactor Vessel
Bottom
Jntact Loop Cold Leg I I Oowncomer I Stalk No.2
Broken Loop. Hot Leg
Core* Simulator
Stalk 1 Oowncomer Broken Loop
Cold Leg 1 I t-'Stalk No. t
Intact Loop Hot Le9
; .... .... .... .... k'l ....... "'I"'"' "' "' "' "' "' "' "' "' -·- - c;; Ui :i> ~~ 1 5 1 8~ en "' "' .... - OICDia>-..~ en"' "' .... "' 0 ~=~:~ 3 -..j
~ 1 "' .... "' 0 oa 0 0 0 0 oooooooo 0 0 0 0 0 0 0 0 0 0 0 0
220 a 1a j_a f Ia llo f_uolto lo j_o lo L
0 f 10 10 10 10~ ( 10 10 10 10 t lol lol lo I 10 10 t 1° 1° 10
I I ~ -+i,PdE-RV-4!-1---ta
0 I ntoct Loop Hot Leg
I lPE-2ST 3FF ..i-iPE-IST-3FF 210 ! : j.pE-CS-IA8B ....- PE- 1ST 3A8B
-~.J-_s-_g§T~~ --; _.;.PE-CS-2FF
I I :a-<PE-CS-IFF LE-IST-2-1 200-
r---- -- ----:,:---- --i--1= ------:::1::------I I Oowncomer
190 I ..,!.TE-2ST- t I J_ ECC Injection TE-IST-1
~--=vLE-2ST-2-2 ~E-CS-1 li rL-E-IST-2-2
180 I I E -CS-1
+¥1:-LE-2ST-2-3 E-CS -4 -~..f LE-IST-2-3 ---- r-.- -- -~-+-- --- ~------- - - --- I ~-------I I
170 lPdE-2ST-2 , I
JPdE-CS-t("'' I l '~TE- 2ST-2 TE-IST-2 -- .......... - ~~f'-1st-2-4 -- 0 -MO 00 .... ..... ,_,_ ~-- ··-··- '"~--
/l ---
160-LE-IST-2-4
_l~E-2ST·2·5 LE-IST-2-5 ---- f- -- ------ . _ . ..., ''IAJ ",. _,_ --- -...:.=---
150 I PdE-RV-1 lo Suooreulon I J-TE·2ST-3 Tank I I
I - TE-IST-3 140 ---- 1--- --T"'-ju- 2S'T=2=&-- ---------- --rt -:-.-- ----- -----
PdE-RV-3 'To Intact LOop LE-IST-2-6
I I Cold Leg I I 130 I 1LE-2ST-2-7 -~4 LE-IST-2-7 ---- t-·-- --+.-t- ------- --------- -------: ------
I I 120- I ..1-TE -2ST-4 ~ -~ TE-IST-4
- - T*'kE-2ST-2=8 -
"' LE-IST-2-6 -110 I I I
-- ---~~~~~T~~--- --H LE-IST-2-9 --- ---------- ------ r-----100 I I
I J-TE-2ST-5 lj.. TE-IST-5
lrLE-2ST-2-IO - li- 'LE-IST-2-10
-- ·-90
1---- I ILE-2ST-2-II --44 LE-IST-2 -II eo- -- t--ToFf--------- ----------- ~-=·-- ---- -----
I I I I I I I I
70- -- t'f~-~ ~~~ ~:- I~ I _..., TE-IST-6
r- t- - -- i1 7:"'~=-TS'f-~if" ·- --· -·· ... ". 60-
MOTT _rbt OTT
50 RFE-2ST-I R-FE-IST-1 .-rTI:._-L::L - - .. t.:: l::l_l,- --
40.:: ""' ~E-2ST-I ~ ij-ME-IST-1 ~
~ I I
..... I I
~
I I il-TE-!!T•T TE-ISt-t
t--- t-- -~w-fl.,t,-Z}!=I-1 ___ ---------- -t~ LE -IST=i":-'1 . -------------
A-TE-2ST-8 0 TE-IST-8
r30 r- r- T*'l='LE-2ST-I-2 - ·--·
-r-~ -LE -1ST- 4 -Z,
t-- _.f'~~T tLA.!lB-rr~2li =!} ____ ----- _ _ru~ ~A .!l B_,A.,; TE-IST 9 t---·- --I LE-2ST-I-3 LE-=-iST-t-3-
r=~ _es;-.l.H - .LEF:.r..:rr~=-2H:::!Q_ -- ...... - .. --- _ = gf._::!ST . t FF-?A.:: TE·IiT- 10 :>n , ___ ~-T LE-IsT-r-4- -----
1 E-2ST-I-~
I ··-"" ... ---~ ··- --~··•·"······-~·········-··· ··-. ·- ,.,,_,,,,
----_ ___:_ -+ ·-::rc:cc~T-!! ---------- --;4 TE-IST-11-- "91------- LE-TST-=-t-5- -----I ,LE-2ST-t-5
__ -r~rs..:2..§..T =.J2 ____ --~ TE-IST-12 tO------- ---------- r,-;------ -----I
1LE-ZST-4-6 LE- IST-1-6
·-··--· .. ~I e.J------.- ::::rE-2ST 13 -- --------·-- - :.._-+~ r!-E-=.lli ::.!.3 ___ -----
- T.lo:::J:"LE-2ST-=-i-7 LE-IST-1-7 I I l I I I -· o-
315°
Counter Clockwise ------- ANC-C-7217
212.0 209,4
200.4
196.38
IB9.3 188.4
176,4
165.:5 164.4
l!i2,4
141.3 140,4
12B,4
117.3 116.4
104,4
93.3 92.4
80.4
69.3 btl.4
47.1 45.91 45.48
33.3 32.4
~ij:~2 28.4
25.3 24.4
g!,~ 20.4
'17.3 16.4
13.3 12.4
9.3 8.4
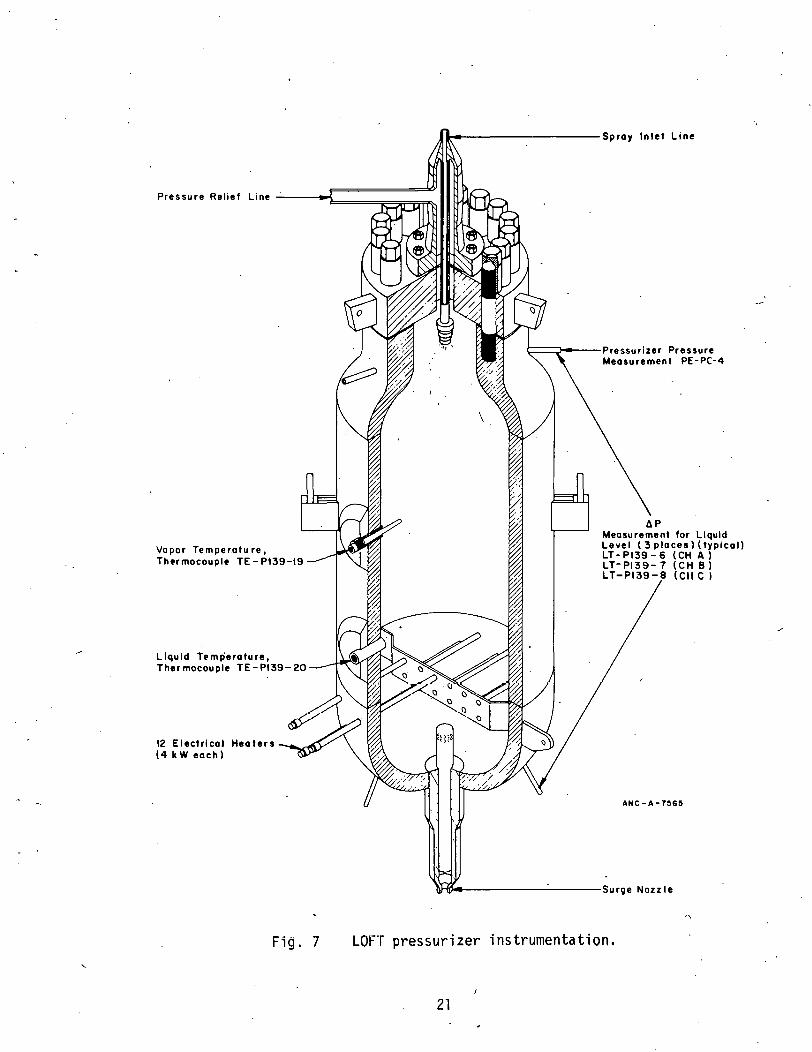
Vapor Temper.atu re, Thermocouple TE- Pl39-19
Liquid Temperature, Thermocouple TE-P139-20
12 Electrical Heaters (4 k W each)
Fig. 7
J:oot------------Spray Inlet Line
c::::=:>-o---Pressurizer Pressure Measurement PE-PC-4
~p
Measurement for Liquid Level (3places)(typical) LT-P139-6 (CH A) LT-PI39- 7 (CH 8) LT-P139-8 (CII C l
ANC-A-7565
LOFT pressurizer instrumentation.
21

Feedwater Inlet
Strain Gao .. ( 4-3Gao• Rosettes) SE-PCi4-i
thru SE-PCt4-t2
Primary Coolant Inlet
Fig. 8
..---·Accelerometer (2) AE-PC17-1
AE-PCf7-2
2 Differential Pressure for. FHdwater Liquid Level
~----~-LT-P4-8A
LT-P4-88
Coolant Temperature Thermeoo11ple TE-SG-3
strain Gove(4-3 Gaoe RoHttes) SE-PC15-1 thru SE- PCt5-12
Coolent Ternperatlri Thtrrnocouple .(on Handhot .. )
~r-tt----lf.W...-.d-~--TE-SG-1
rimary Coolant Outlet
Pressure Transducer ANC-A-!M>I9
LOFT steam generator instrumentation.
22

Pump Speed Probe (RPE-PC-1 & RPE-PC-2)
Component Cooling Water Outlet
Component Cooling Water Inlet
3 Acceleterometers AE-PC-18-1 thru AE-PC-18-3 (pump no. 1) AE-PC-19-1 thru AE-PC-19-3 (pump no. 2)
3 Strain Gage Rosettes SE-PC-17-1 thru SE-PC-17-12 (pump no. 1) SE-PC-17-13 thru SE-PC-17-20 (pump no. 2)
Inlet
Fig. 9 LOFT irrtact loop pump 1nstrumentation.
23
Impeller (6 vanes)
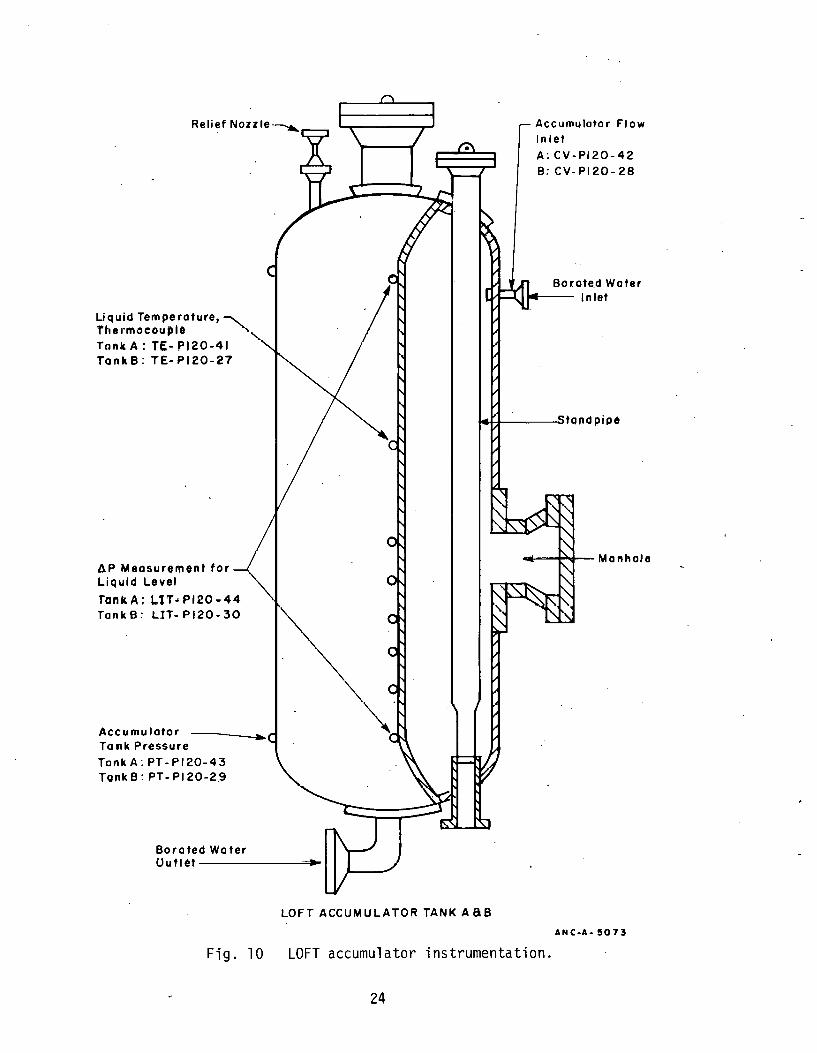
Liquid Temperature,........._ i'hermoeou~le "', Tonk A: TE- P120-41 TankB: TE-PI20-27
AP Measurement for~ Liquid Level
rank A; L.tT .. Pl20 -44· TonkB: LIT- P120-30
Accumulator Tonk Pressure TankA: PT-PI20-43 Tonk B: PT- Pl20-29
Borated Water
Accumulator Flow Inlet
A: CV-PI20-42 B: CV-P120-28
Borated Water a.---Inlet
~+----_.:,tondpipe
(Jut I et ------~~
LOFT ACCUMULATOR TANK A 88
ANC-A- !5073
Fig. 10 LOFT accumulator instrumentation.
24

Ace. Vent li,,e Valvt (potentiometer} (CV- P120·39)
N2 Suppl) to Ace. A, Valve
(polonliomelor) CV-P120-38
Ace Oisc~,arve li,e Valve -----"""';(!f (level switch]· CV-P 20·47
Ace Oischaroe Bypass line Valve ----t-1ii>.;tJ (level switch) CV-PI20·48
Cold LeQ niection Pressure PT -P120-61
Cold IBQ lr,jection femperoture ( RTD) TT -P120··62 -----=,.. ..... ~ Cold lnjec:ion lsatction Valve (limit switch) CV -IP 120-90
·Intact loop Cold LoQ
LPI S Pump to Lower Plen•m Pressure
( PT ->120-64
\. LPIS Pump to LOwer Plon•m (RTO) TT->120-65
LPIS Flow
LP.IS Heotex.chanoer Ou11et
T..,poroture (TC)
T[ -Pi20- 100
LPIS Heat Ex.chanoe'
Borated water Storo;e Ta,,k
ECC·T·42
Ace. Olacharoe Isolation Valve
VA:~..._-(Ievel switch} CV- P120 -50
BWST Vo ivo CV -Pi20- 98
Note:
Elevation 4829
Elevation 4807'
4790
Veuel Wall
Brokpn Loop Reci:culotion
Far the Instrumentation Between tho BWST and tt'le Containment Vessel Wall, Consult tho Loll ECC S1stom Process Instrumentation (rioht side} Orawino.
to LPIS pump, Valve (limit switch) CV·P120·80
BWST to LPIS pump, Valve (limit switch) CV- Pi20-81
Sump
Oiachoroe Pressure
Pump ECC·P·644
Fig. 11 LOFT ECC system instrumentation (left side).

PE-SV-tt
"e" END
1 oFr N ...
·o ·o N
I o
'-ttOs,-~--~o-.....: ,___ ___ 136.5--·
l_l
·o -0 0 0 -0 -0 ·o 7o ~ <D CX) 2 ~ ! ~ ~
26
LOFT N ,....
I
"A .. END
PE-SV-12
I . I I 1-----t3G.5~-- _ , PE-SV-24
tool· I..... j ~-~ '.......-r-A
I I --= "'" _ i ..
-~S .QN,_:N 10
;;;~~:::: ;1;
0 -0 -0 -0 -0 -0 -0 -~ 0 N ~ <D CX) 0 N N N N N N .., .., ..,
Note:
Alt Dimensions in Inches
• oo VIEW A-A
180°
VIEW B-8
vacuum Relief System
VIEW C-C
Fig. 12
,....--- PT-PI38-23
B lowdown Header
Slowdown Suppression Tank
Vacuum Rei ief System Manway
TOP VIEW
LOFT suppression tank instrumentation.

~·
instruments used in obtaining data presented in this report may also be obtained from Table VI which_ is presented in Section VII.)
Instruments were calibrated before installation either by the. iristrument vendor or at the INEL. Calibration data were then correlated with other parameters to determine the functional relationships between systemmatic errors and variables other th~n those the instrument was designed to measure. These error functions were then represented by mathematical equations (usually in the form of polynomiai-s of degree five or less) and incorporated in the data reduction program.
The turbine meters arid the drag discs in the intact loop were calibrated to convert the point·measurement values to the mean values across the entire flow area. ·These calibrations were performed using the data from the single-phase variable frequency pump tests conducted
~ .
prior to blowdown initiation. Least squares curve fits were calculated for the square ~ooi of the intact loop differential pressures plotted against the pump sp~ed to confirm the adequacy of the differential pressure offset corrections. Similarly, the intact loop venturi meter data were plotted against the square root of the corrected differential pressure measurements to confirm or adjust the venturi meter offset corrections. The corrected venturi meter data were then used to calculate average velocities and momentum fluxes in the inta_ct loop and the reactor vessel. These calculated quantities were' subsequently compared to the measured turbine meter velocities and drag disc momentum fluxes to verify ·or to provide changes to the respective instrument calibration equations.
Additional calibrations were performed on specified turbine meters and drag discs to convert the point measurements to average measurements. These instruments· included broken loop turbine meters and drag discs in the intact loop and reactor vessel which were overranged during the pump frequency tests. In the intact loop and reactor vessel, the flow rates calculated using the turbine meters and their associated areas were normalized with the intact loop venturi during steady- state. (initial) conditions to determine the calibration factors for the
27·

turbine flowmeters. The flow rate for the turbine meter in the core
simulator was calculated with a core flow area equal to that of the
nuclear core to be installed for Test Ll-5. Calibration factors were then determined by normalizing this rate. These calibration factors for
flow rate with the venturi flow the turbine meters were then
squared and applied to the respective drag discs. Similar calibration f de Lur~ were deve1 oped for the broken ·1 oop tlr·dy tl i scs using the results of accumulator blowdown tests (where the accumulator flow was directed through the hrnkPn loop). Average m9asurements were then obtuined by
multiplying thP calibration factors with the respective point measurements. The additional calibration factors obtained in this manner and used in the presented data for Test Ll-3 are summarized below:
rc-o~-1 ==---- 1 '00 MF-RI-1 ------ I.UU FE~BL-2 ------ 1.00 ME-BL-2 ------ 1.00
ME-CS-1 ------ 0.0727
ME-PC-3 ------ 0.550
The presented data for average velocity and average momentum flux
are based on the following flow areas at the instrument locations:
Instrument Flow Area
FE-OL-1 and -2 ME-BL-1 and -2
FE-PC-1, -2, and -3 0.6485 ft 2
ME-PC-1, -2, and -3
FE-CS-1 1.78 ft2
ME-CS-1
FE-lST-1 and FE-2ST-l 1.52 ft2
ME-lST-1 and ME-ZST-1
28
Upper and lower error bands based on 95% (2o) confidence levels were added as overlays to the plots of certain representative instruments. These plots can be found in Section 5 of the presented data. The error band plots presented for the LOFT process instruments are valid only for steady-state measurements. These· instruments are
listed in Reference 4 and are characterized by the P ... designation in the channel~measurement identifications~
Information on the calibration factors, accuracy, and response of specific instruments is given in the LOFT Experimental Measurements Uncert~inty Analysis[lO]_ Instrument calibrations and system testing
conducted subsequent to completing the uncertainty analysis have been used to update ~he information presented and to process the data contained herein. Reference 10 is currently being revised to reflect the improved information and the.observed performance obtained to date.
29
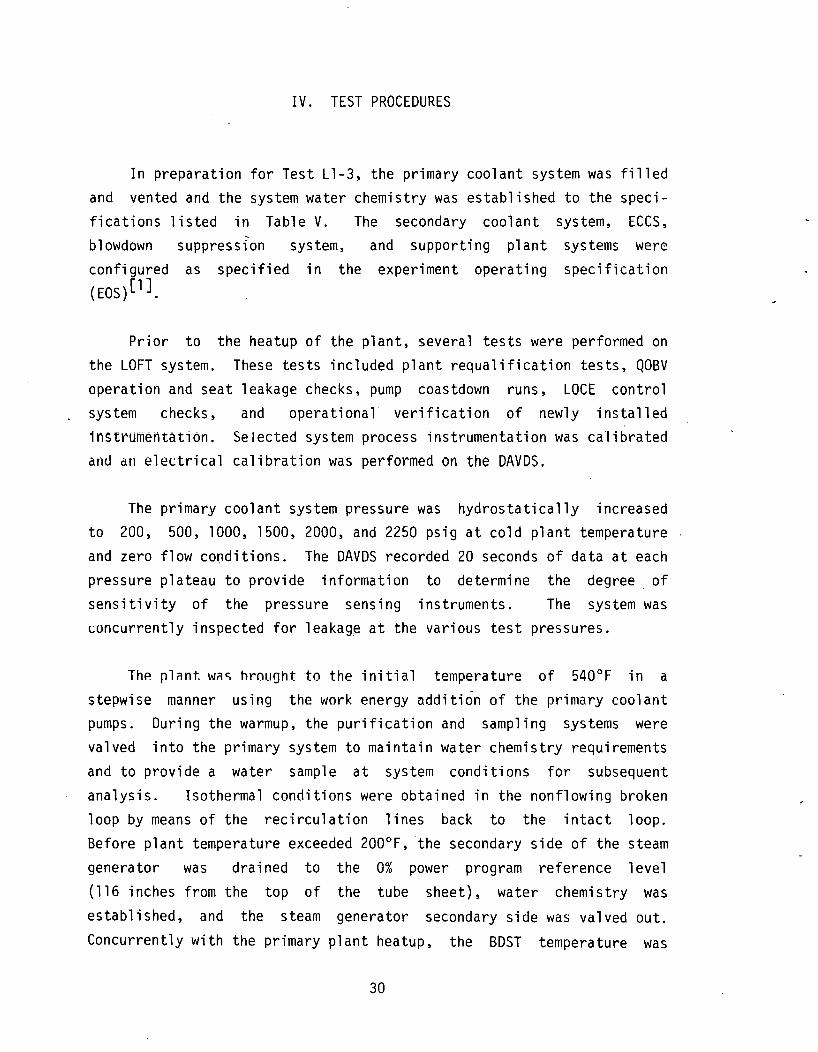
IV. TEST PROCEDURES
In preparation for Test Ll-3, the primary coolant system was filled and vented and the system water chemistry was established to the specifications listed in Table V. The secondary coolant system, ECCS, blowdown suppression system, and supporting plant systems were configured as specified in the experiment operating specification (EOS)[lJ.
Prior to the heatup of the plant, several tests were performed on
the LOFT system. These tests included plant requalification tests, QOBV operation and seat leakage checks. pump coastdown runs, LOCE control system checks, and operational verification of newly installed 1nstrumentation. Selected system process instrumentation was ca·librated and an electrical calibration was performed on the DAVDS.
The primary coolant system pressure was hydrostatically increased to 200, 500, 1000, 1500, 2000, and 2250 psig at cold plant temperature
and zero flow conditions. The DAVDS recorded 20 seconds of data at each pressure plateau to provide information to determine the degree of sensitivity of the pressure sensing instruments. The system was concurrently inspected for leakage at the various test pressures.
ThA pl~nt w~~ hrouaht to the initial temperature of 540°F in a
stepwise manner using the work energy addition of the primary coolant pumps. During the warmup, the purification and sampling systems were
valved into the primary system to maintain water chemistry requirements and to provide a water sample at system conditions for subsequent
analysis. Isothermal conditions were obtained in the nonflowing broken loop by means of the recirculation lines back to the intact loop. Before plant temperature exceeded 200°F, the secondary side of the steam
generator was drained to the 0% power program reference level
(116 inches from the top of the tube sheet), water chemistry was
established, and the steam generator secondary side was valved out.
Concurrently with the primary plant heatup, the BDST temperature was
30

increased as the tank was pressurized with nitrogen to its specified initial conditions.
The plant was stabilized at three points during heatup: 250°F -'500 psig, 460°F - 2250 psig, and 540°F 2250 psig. At- each stabilization point a burst (20 to 30 seconds) of data was recorded
under flow and no-flow conditions for calibration checks and to determine the degree of instrument temperature sensitivity. At the 460°F stabilization point, ~ single-phase pump coastdown test was
conducted with an initial flow of 3.6 x 10⁶ lhm/hr. At the 540°F stabiliZation point, frequency tests were performed by varying primary coolant pump frequency from 20 to.60 Hz in 10-Hz increments. Following the frequency ·tests, single-phase pump coastdown tests were conducted with initial flows of 2.15 x 10⁶ lbm/hr and 3.6 x 10⁶ lbm/hr. Data were recorded for about 60 seconds for each of the three pump coastdowns, and
the data were used for calibration checks. Following each pump coastdown, data were recorded for zero-flow conditions. When the plant temperat~re was stabilized at 540°F, a pressure test was performed at zero-flow conditions by varying the primary coolant system pressure from 2250 to 1450 psig and back to 2250 psig in-.200-psig increments. At each pressure plateau, approximately 20 seconds of DAVDS data were recorded to determine the degree of hot instrument pressure sensitivity. When plant conditions were again stabilized at 540°F and 2250 psig, the plant was allowed to soak for more than 6 hrs to assure isothermal conditions
for the blowdown. During this 6-hr soak an electrical calibration of the DAVDS was performed. Additionally, ECCS accumulator ACC-A was filled and pressurized to its specified values and a dry run of all the critical steps required prior to blowdown initiation was conducted.
Prior to blowdown initiation, the system parameters were checked to insure that they were within specified bands and last-minute instrument
and valve lineup checks were performed. During this period, the
initial-condition water samples were taken from the primary coolant
system, the secondary coolant system, and the BDST. The pressurizer,
steam generator, and BDST water levels were established. A computer
program ca 1 i brati on and a data integrity check o·f the DAVDS was
31
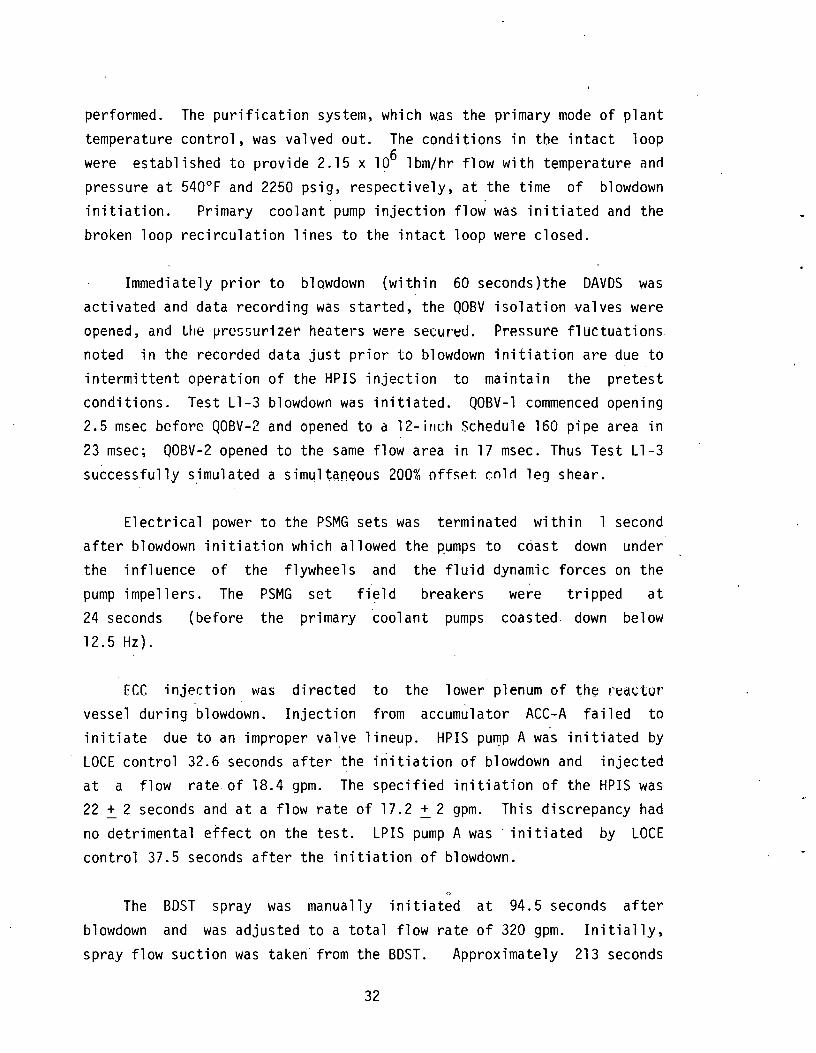
performed. The purification system, which was the primary mode of plant temperature control, was valved out. The conditions in the intact loop were established to provide 2.15 x 10⁶ lbm/hr flow with temperature ~nrl pressure at 540°F and 2250 psig, respectively, at the time of blowdown initiation. Primary coolant pump injection flow was initiated and the
broken loop recirculation lines to the intact loop were closed.
Immediately prior to blowdown (within 60 seconds)the DAVDS was activated and data recording was started, the QOBV isolation valves were opened, and the 11re~~ur1zer heute1·s were secun~LI. Pressure fluctuations noted in the recorded data just prior to blowdown initiation are due to intermittent operation of the HPIS injection to maintain the pretest conditions. Test Ll-3 blowdown was initiated. QOBV-1 commenced opening 2.5 msec before QOBV-2 and opened to a 12-ir1ch Schedule 160 pipe area in 23 msec; QOBV-2 opened to the same flow area in 17 msec. Thus Test Ll-3 successfully s~mulated a simyltaneous 200% offset rnlrl leg shear.
Electrical power to the PSMG sets was terminated within 1 second after blowdown initiation which allowed the pumps to coast down under the influence of the flywheels and the fluid dynamic forces on the pump impe1lers. The PSMG set field breakers were tripped at 24 seconds (before the primary coolant pumps coasted down below
12.5 Hz).
FCC injection was directed vessel during blowdown. Injection
to the lower plenum of the reactor from accumulator ACC-A failed to
initiate due to an improper val_ve lineup. HPIS pu~p A was initiated by LOCE control 32.6 seconds after the initiation of blowdown and injected at a flow rate of 18.4 gpm. The specified initiation of the HPIS was 22 + 2 seconds and at a flow rate of 17.2 + 2 gpm. This discrepancy had
no detrimental effect on the test. LPIS pump A was ·initiated by LOCE control 37.5 seconds after the initiation of blowdown.
The BDST spray was manually initiated at 94.5 seconds after
blowdown and was adjusted to a total flow rate of 320 gpm. Initially,
spray flow suction was takeri from the BDST. Approximately 213 seconds
32

after blowdown initiation,· BDSTSS pump suction was shifted from the BDST to the BWST. This departure from procedure had no adverse impact on the conduct of the test. · BDSTSS flow was c~ntinued for approximately 5.7 min and then secured.
The DAVDS digital recording system obtained appr6ximately 6 minutes of· data /after simulated rupture and was secured. -The DAVDS analog system continued recording blowdown suppression tank parameters for 10 minutes after blowdown initiation and was then secured. An electrical calibration o1 the DAVDS was performed following the test completion.
A sequence of events for Test Ll-3 is provided in Table II.
33

TABLE II
CHRONOLOGY OF EVENTS FOR TEST Ll-3
Event Time After Bl owdown Ini ti:a.ti OJ;l' (:s~c-).
Ll-3 Initiation
End. of subcooled blowdown
PCS[a] pump trip
Pressurizer empty
Accumulator ACC-A injection initiation
HPIS ·injection initiation
LPIS 1njection initiation
Cnd of sdturated blowdown
PCS-BDST reached equilibrium pressure
First evidence of ECC in lower plenum
Reactor vessel lower plenum liquid full
BDST spray initiated (pump sucLiun from BDST)
BDST spray pump suction ~hffted to BWST
BDST spray completed
[a] Primary coolant system. [b] Specified in EOS to be 22 + 2 seconds. [c] Specified in EOS to be 35.5 + 2 seconds.
34
0
•1,1. 0
'" 12
Failed to initiate
32.6[b]
37.5[c]
rv50
rv50
56.3
70.6
94.5
rv213
rv436

V. INITIAL CONDITIONS
The initial conditions and pres.ented in Table III along with to the blowdown initiation. justification for their selection
tolerance bands for Test Ll-3 are the values measured immediately prior These pretest requirements and the are.specified in EOS Volume 2[l].
Only one initial condition was out of tolerance for this test: The measured intact loop flow rate was. 2.34 x 10⁶ lbm/hr instead of the maximum 2.2 x 10⁶ lbm/hr as specified in EOS Volume 2. This discrepancy did not have any adverse effect on the experiment.
Table IV gives the fluid temperature distribution of the primary coolant system immediately prior to ·blowdown initiation. ·As can be seen, the system temperature distribution was nearly constant, except for the pressurizer liquid and vapor space. This essentially isothermal condition was due to the greater than 6-hour soak at the initial condition temperature and pressure before the commencement of blowdown.
Table V specifies the required water chemistry for the primary coolant system, the.blowdown system. In addition, ·the these systems are presented
suppression tank, and the secondary coolant results of the water chemistry analysis for for. pre-LOCE and· post-LOCE conditions.
These analyses were required to utilize the data from the reactor vessel downcomer liquid level probes.
35
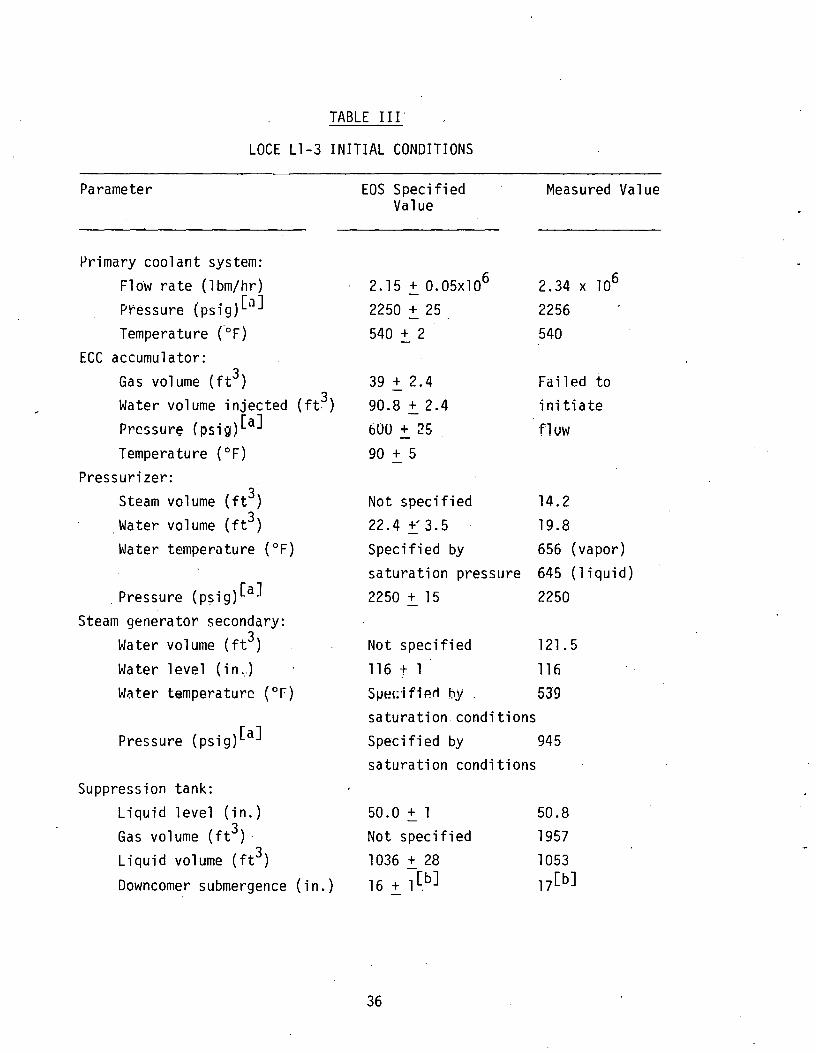
TABLE III.
LOCE Ll-3 INITIAL CONDITIONS
Parameter
Primary coolant system: Flow rate (lbm/hr) Pressure (psig)[a]
Temperature ( 0 F)
ECC accumulator: Gas volume (ft3) Water volume injected Pressure (psig)[a] Temperature ( 0 F)
Pressurizer: Steam volume (ft3)
.Water volume (ft3) Water temperature (°F)
Pressure {psig)[a]
Steam generator secondary: Water volume (ft3) Water level (in .. ) Water temperature (or)
Pressure {psig)[a]
Suppression tank: Liquid level (in. ) Gas volume (ft3) · Liquid volume (ft3)
Downcomer submergence
(ft3)
(in.)
EOS S pee ifi ed Value
2.15 + 0.05xlo6
2250 + 25 540 + 2
39 + 2.4 90.8 + 2.4 600 + 25
90 + 5
Not specified 22.4 +' 3. 5
Specified by saturation pressure 2250 + 15
Not specified 116 t 1 S1-1ed f1 P.rl by .
saturation conditions Specified by saturation conditions
50.0 + 1 Not specified 1036 + 28 16 + ~~b]
36
Measured Value
2.34 X 10⁶
2256 540
Failed to
initiate flow
14.2 19.8 656 (vapor) 645 (liquid) 2250
121.5 116
539
945
50.8 1957 1053 17[b]

TABLE III (contdJ
Parameter
Water temperature (°F) Pressure (gas space) {psig)[a]
Differenti~l water level between downcomer interior volume and suppression tank (in.)
EOS Specified Value
188.5 + 6.5
11.9 + 2
Not specified
[a] Local barometric pressure = 12.5 psia. [b] Based on average submergence of four downcomers.
37
Measured Value
188
10
5.6

TABLE IV
PRIMARY COOLANT TEMPERATURE DISTRIBUTION AT RUPTURC
Location Detector' Temperature (uF)
Intact loop hot leg (near vessel) TE-PC-2 543
, Intact loop steam generator inlet TE-SG-1 538
Intact 1 oop steam generator outlet . TE-SG.-2 542
Intact 1 oop .co 1 d 1 eg (near steam generator outlet) TE-PC-3 542
Intact loop cold leg (near vessel) TE-PC-1 541
Reactor vessel downcomer: Instrument stalk TE-lST-2 540 Instrument stalk 2 TE-2ST-2 541
Reactor vessel lower plenum: Instrument s ta 1 k TE-lST-9 540 Instrument stalk 2 TE-2ST-9 539
Reactor vessel core simulator TE-CS-1 544
Broken 1 oop hot leg (near vessel) TE-BL-2 537
Broken loop hot leg (steam generator simulator inlet)[a] PE-BL-3 543 (~3. 9)
38
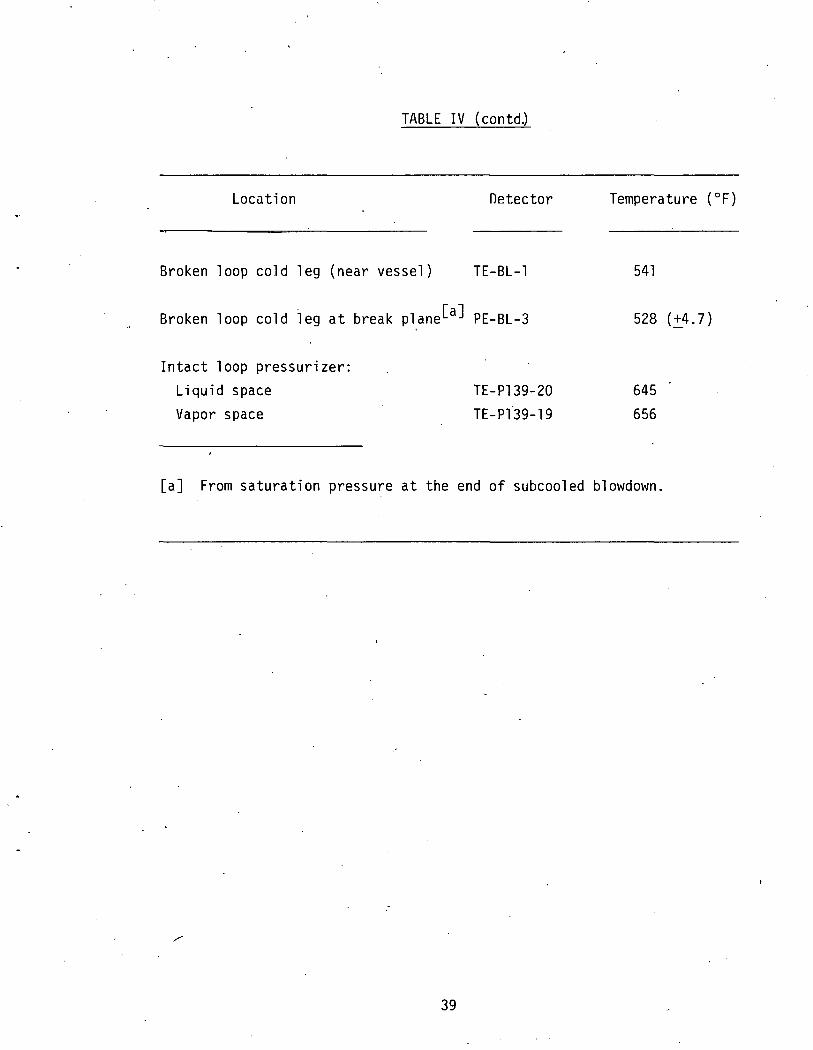
TABLE IV ( contd.)
Locc1tion [)etector Temperature (°F)
Broken loop cold 1 eg (near vessel) TE-BL-1 541
Broken loop cold leg at break plane[a] PE-BL-3 528 {~4. 7)
Intact loop pressurizer: Liquid space TE-Pl39-20 645 Vapor space TE-Pl39-19 656
[a] From saturation pressure at the end of subcooled blowdown.
39

TABLE V
WATER CHEMISTRY RESULTS FOF: TES" L 1-3
Primar~ Coolant Intact Lao~ Blowdown
Parameter S~ecifi ed Pre-LJCE[a]Post-LOCE[b]Specified
PH 9.5-10.5 1•). 11 9.81 4.0-"0.5
Conductivity ( llmho) 1-40 24.6 15.8 24-40 (025 C) em
Total solids (ppm) 25 7.5 '
Total gas (cc/kg) 100 max 32.04
Dissolved otygen (ppm) 0.10 max <0.005 4.55
Lithium (ppm) 0.2-2.2 0.7 0.6
~ Hydrazine (ppm) 0
(at <250°F} 1. 0 min <C. 01 <1. 0
Chloride (ppm} 0.15 max .::0.1 <0. 1 0.15 11ax
Dissolved solids (ppm) 25 7.5
Undissolved solids (ppm) 1.0 max <j,5 <1. 0 1. 0 max
Hardness (ppm)
Phosphate (ppm)
Gas o6
content (%) (by v lume)
[a] Sample taken upstream of the prirr•ary coolant system ion excharger. [b] Sample taken from the pressurize~.
Su~~ression Tank Pre-LOCE Post-_OCE
9.76 9.62
"13. 5 16.5
28 75.5
20.77 19.5
·:0. 1 <0. 1
~-s 75
c0.5 0.5
9
Se:ondar~ Coolant S~stem S~ecified Pre-LOCE
9.0-10.2 9. 41
56
39.9
9
0.10 max 0
1 . 0 min <0 .1
0.5 max <0. 1
500 max 39
50 max 0.9
<0. 1
15-75 35.2

VI. DATA CONSISTENCY CHECKS
As a subsequent step in the data reduction process described in ·section III, all data presented in this report were subjected to a thorough review to verify that they were consistent and reasonable. Where possible, instrument channel outputs and computed parameters were compared to test predictions, previous tests, corresponding parameter channels, and calculated quantities. In many instances, these consistency checks were _performed as data plot overlays and, therefore, the respective figure numbers are specified below as the individual topics are discussed. For other measurements, the comparisons and r~sulting calculations were performed within the company and are not included in this report. Those measurement comparisons that were determined to be within the accuracy of the particular instrument, as specified in Reference 10, were labeled as qualified engineering units data (QEUD). Specifically, several techniques have been developed and employed to perform data consistency checks on the presented data; these techniques are discussed below.
Measured system· temperatures were qualified where possible by reviewing the isothermal temperature distributions just prior to blowdown initiation and during the blowdown transient. When temperatures measuring a similar condition were within the specified accuracy of the detectors, the detector output was considered reasonable and was qualified. All primary coolant system (PCS) temperature channels were reviewed in this manner, and selected initial temperature measurements are summarized in Table IV. Selected PCS temperature channels were overlaid in Figures 135 through 146 and Figures 157 through 175 for comparison of the temperature distribution. The pressurizer liquid and vapor space, temperatures were checked for cpnsistency by comparing ~hese values with the saturation temperature for the corresponding pressurizer pressure at various· points in time. This check was valid prior to and during the system blowdown until the pressurizer emptied at 12 seconds. Similarly, steam generator secondary coolant system (SCS) temperature was examined throughout the test by comparing the measured temperature with the saturation temperature for
41
the respective SCS pressure. BDST temperature elements TE-SV-1-6 and
TE-SV-7-12 were evaluated by comparing the pretest measurements of the
thermocouples in the same horizontal stratum. Overlays of these parameters are presented in Figures 151 through 156. Figures 147 through 150 compare TE-SV-1-4 and TE-SV-7-10 in the vertical plane of the gas space in the BDST. While the data from these temperature instruments are compared for_ consistency, it should be noted that TE-SV-1-4 and TE-SV-7-10 may not represent the actual vapor space tempertaure since these instruments were designed to measure liquid temperature. TE-SV-5-6 and TE-SV-11-12 could not be compared for pretest temperature distribution in the vertical plane due to
temperature stratification in the BDST liquid. BDST temperature comparison after the initiation of blowdown was not meaningful for data consistency checks due to uneven mixin~ and condensation producin~
temperature stratification in the tank.
Pressure data were reviewed in a similar manner. During the approach to Test Ll-3 initial conditions with the primary coolant pumps secured, the PCS was raised to various specified temperatures and pressures as described in Section V. At each data point, PCS pressure
measurement detectors were compared to a 0.1% accuracy, 0 to 5000 psig pressure test gauge to verify that the slope had not statistically changed and to establish the offset of the instrument. Immediately prior to blowdown, PCS pressures were again compared to the test gauge standard to ensure that all detectors were measuring within their specified accuracy bands. During the blowdown transient, pressure data from corresponding measurement locations were compared by overlaying the data plots. These plots are presented in Figures 100 through 114. Pressurizer pressure was qualified by comparison with PCS pressure
channels and by saturation temperature as discussed above; SCS pressure was qualified by comparison of saturation temperature to the measured temperature as . presented in the paragraph on temperature te~hniques.
The BDST pressure instruments were evaluated by compariny process and
experimental pressure measurements prior to and during the blowdown
transient. Representative instrument plots are presented for this
comparison in Figures 21 through 42 and Figures 115 through 127. It
42

should be noted that the BDST experimental pressure data have all been adjusted to
\ a 0-psig initial pressure for comparison of the tank
pressure rise during blowdown. Initial BDST pressure can be obtained from the data plots of PT-Pl38-55 and.PT-Pl3R-56 in Figure 132.
Comparison of measu~ed temperature with the saturation temperature of the press~re measurement at the same location provided another method to verify PCS data consistency. This technique, however, was valid only during the saturated blowdown transient up till the time the measurement location voided of fluid. Afte~ voiding occ~rred, the measured temperature increased above the corresponding saturation temperature due to radiant heating of . the detector element by the structural system components and detector element stem conduction. Temperature detectors
' in the reactor vessel which became wetted by the ECCS lower plenum injection.displayed a measured temperature which decreased below the corresponding saturation temperature as the detector became immersed in the cooler fluid. Comparisons of saturated temperature and measured temperature are presented in Figures 257 through 264.
Data consistency checks for the differential pressure measurements were provided by ~everal basic methods. Prior to blowdown initiatiori, zero-flow data were recorded to .determine instrument offsets. PCS operating conditions were then established as specified in EOS Volume 2, and selected PCS pressure drops were compared with predicted values.. At various PCS operating conditions, intact loop flow resistance coefficients were calculated and verified to remain essentially constant and to agree with previously tabulated data. Further consistency checks were performed on the intact loop differential pressure instruments by plotting the square root of the differential pressure against pump speed using data from the pump frequency tests conducted prior to blowdown. The results of least squares curve fits performed on these plots were
then used to confirm instrument zero offsets. Both prior to and during the blowdown transient, ·differential pressure measurements were compared with the differential pressure computed by subtracting appropriate absolute pressure. measurements. Finally, pressure closure was
43

calculated for three flow loops: (a) the PCS intact loop, (b) the broken loop hot leg to the BDST, and (c) the broken loop cold leg to the BDST. The pressure closure for these three loops is defined. in Table VII and presented for loop (a) in Figure 246. Investigation of these data plots revealed that the algebraic sum of the differential pressures in the two broken loops was not zero on the blowdown transient and remained positive. lt is believed that this deviation is ca·used by a velocity head and two-phase flow effects at the measurement loca·tions and system components in the flow loop for which a differential pressure
measurement ~id not cx1st. rurther invesliydtiun of these results is needed to support the supposition and account for observed discrepancies.
Three 5,Y5tcm revel measut·em~nt.:-. wPrP 1mrortant for lest Ll 3: (a)
HOST liquid level, (b) pressurizer coolant level, and (c) reactor vessel cuuldflt 1evel. BOST liquid level was evaluated by comparing two independent level measurements which are plotted as an overlay in Figure 66. Similarly, pressurizer level was reviewed by redundant level measurements which are presented for comparison in Figures 67 through 6Y. It should be noted that level instrument LT-Pl39-7 showed an unexpected level increase at 40 seconds; further investigation will be necessary to resolve this occurrence. The reactor vessel liquid level probes were verified to be indicnting satisfactorily by performing a pretest conductivity calibration with the vessel liquid full and under cold and hot plant conditions.
Primary coolant pump speed measurements were checked for
consi~tency by comparison with pump speed as calculated from the PSMG frequencies. This check was valid prior to and during the blowdown transient until the PSMG fielq breakers were opened at 24 seconds. These comparisons were overlaid in Figures 239 and 240. Prior to test· initiation, the pump speed was further checked, along with the intact loop flow rate and pump differential pressure, by reviewing the agreement with the manufacturer's pump performance curves. Pump run voltages and currents were evaluated prior to the initiation of blowdown by calculating the pump electrical horsepower input, the pump water
44

~ .. ~ . .
'.
..:·
horsepower, and finally the combined pump efficiency .. These calculated efficiencies were then compared to previously recorded efficiencies determined during pump requalification tests.
To evaluate the PCS average fluid densities, calculations were performed by two independent methods using the gamma densitometer and drag disc turbine flowmeter outputs as described in Section III. To ensure that the gamma densitometer measurements were accurate for these calculations, the individual beam densities were compared to the known density of the PCS just prior to blowdown initiation. Additionally each densitometer gamma source was stowed in iti lead cask to obtain an essentially infinite density data point for each densitometer calibration ·curve. These known density values were then used to adjust
·the instrument electronics to give the correct readings from the gamma densitometers. As a final pretest check on the densitometer calibrations, a high ·and low calibration tungsten shim of known density
--was inserted in each individual densitometer beam. DAVDS data were then taken and reviewed for these measurement channels in each shim position.
Several techniques were employed to verify the validity of the measured data from the turbine meters, the drag discs, and the intact loop mass flow rate venturi meters. In particular, the broken loop turbine meters and drag discs were calibrited as discussed in Section III. The intact loop venturi meter data were examined by perfor~ing least squares curve fits for the computed venturi meter velocities plotted against the square root of the differential pressure transducers in the intact loop. The results of these data consistency checks for this test indicated discrepancies in the intact loop mass flow rates measured by the venturi meters. New venturi meter calibration equation offsets were therefore derived by using the above curve fitting technique with the variable-frequency single-phase test data obtained prior to blowdown initiation. These corrected venturi meter mass flow rates were then used to calculate average velocities and momentum fluxes in the intact loop and the reactor vessel. These values were subsequently used to correlate the outputs of the turbine meters and the drag discs. Finally, the measured average turbine meter
45

velocities and drag disc momentum fluxes were confirmed or adjusted to produce consistent data in the pump frequency tests. As an independent check, the turbine met~r and drag disc data were used to calculate fluid density as specified in Section III. These values were then compared to the known single-phase density prior to blowdown. This analysis was performed on all the turbine meters and drag discs in the intact loop and the reactor vessel with .the exception of ME-PC-3 and ME-CS-1 and those instruments that failed as listed in Table VI. ME-PC-3. and ME-CS-1 were overranged during the pump frequency tests, and data con~i5tcncy wns verified ~y ~erform1ng the pretesL· ~ctl ibrat1ons dis
cussed in Section III.
The computed parameter, mass flow rate per system volume, was calculated by five different methods at various lr1r~tions in the intact loop, broken loop, and the reactor vessel. A list of the measu~ement
panimet~t~, IHeasurement locations, and the calculation methods used are summarized in Table VII. Comparison of the calculated results obtained by each method at a particular measurement location was utilized to provide the data consistency checks for this computed parameter. It should also be noted that these comparisons provided a redundant check of the individual instruments used for each computation. Mass flow rate per system volume could not be calculated for any method or at the respective locations using ME-PC-2 or the average density computed from DE-PC-1 due to the failure of ME-PC-2 and DE-PC-lA. For purposes of comparison, however, mass flow rates per system volume were calculated using the chordal density from DE-PC-lB instead of the average density for that location. Although they are not overlaid, selected results calculated by the various methods are presented for each location in Figures ?21 through 236 for comparison.
The mass flow rates per system volume were also calculated for the pressurizer as defined in Table VII. Consistency was verified by (a) calculating each parameter using two similar but independent sets of input data ana comparing results and (b) by integrating the mass flow rate with time and comparing the total mass ejected with the known mass
46

in the pressurizer prior to blowdown initiation.
pres~nted in Figure 237.
The results are
System fluid velocities were evaluated during the blowdown. transient by utilizing two independent methods. Velocities were measured directly by the turbine meters and were subsequently calculated. using the gamma densitometers and drag disc as discussed in Section III. Data consistency checks were performed by comparing the turbine flowmeter velocities for representative system locations with the respective calculated vP.locities, To provide reliable data for these velocity checks, the gamma densitometers, the drag discs, and the turbine flowmeters were calibrated prior to test initiation as discussed in Section III and in this section. Fluid velocities could not be computed at the locations using MC-PC-2, and the . average density was computed from DE-PC-18 due to the failure of ME-PC-2 and DE-PC-lA.
As a redundant approach to verify the validity of Test Ll-3 data, selected instrument parameters were overlaid with plots from (a) the expe~iment prediction for Test Ll-3[2], (b) the Semiscale counterpart test {S-Ol-3)[ll], (c) the LOFT nonnuclear Test Ll-2[6], and (d) the
LOFT nonnuclear Test Ll-3A[ 7J. Parameters of interest in these comparisons included broken and intact loop average densities, pressures, temperatures, fluid velocities, and computed mass flow rates per system volume. The differential pressure measurements across selected PCS components were also examined. The results of these comparisons are not included in this report.
Several additional methods are being developed to reconcile inconsistancies in the presented data. The mass flow rates through the break planes can be calculated by each of five different methods and then integrated with respect to time. Comparisons are then made between the resulting total mass ejected from each integral and the total mass of water initially in the PCS, including the mass of water injected by the ECCS. The five methods presently utilized to compute mass flow rates are:
47

( 1 ) M = (11 densitometer 11 X 11 drag disc 11
)112 X A
(2) M = (11 densitometer 11
) X ( 11 turbine meter 11) X A
(3) M = (11 drag disc 11 /"turbine meter 11
) X A (4) M ::: Constant X (d 11 BDST level 11 /dt) (5) M = Constant X {L'>P 11 l4 11 to 5 11 reduction 11 X 11 densitometer 11
)112.
To date, ar1 anulysis has l.u:en performed using broken lo~p data from Tests Ll-1, Ll-2, LJ-3, and Ll-3A to investigate the integrated mass flow rate JJ<;ina Methods 1 through S ~I.Juve. The genera'! shape of the graphs of the rnass flow integral as a function of time were similar for each experiment, although the magnitudes were different. The rnagnitudes of the integrals, however, were generally ordered the same. That is, Method 3 was highest, Method 1 was second, Method 4 was third, Method 5
was fourth, and Method 2 was lnwP.<;t, Method~, usinq the RnST levQl change with time, was Llle most erratic, probably due to pressure vnrintion5 on the lev~l ueleclurs caused by waves and blowdown turbulence within the BDST. Further calculations using the mass of the water in the suppression tank, however, provided the best check on the integrated mass flow from the system.
A correction technique was formulated based on the assumption that the densitometer density was correct and that observed deviations in the mass balances were due to variations in the measured momentum flux and the measured velocity. The ratio of the integral from mass flow computed by Method 1 and the BDST mass change was used to determine a correction factor K1. Similarly, a constant K2 was calculated for the turbine meter from Method 2. ·As a check, Method 3 was used to compute a mass flow integral with the drag disc data corrected by a factor equal to l/K1
2 Then the correction factor for the turbine meter was calculated by comparison with the BDST mass change. The resulting factor compared well with the previously calculated K2. A similar correction constant was calculated for Method 5, again using the mass change in the BDST as a reference.
The results of this analysis for all four tests were then used to produce a set of correction factors for the mass flow rate data
48

/
calculated by Methods 1, 2, 3, and 5. When these correction factors are . applied to the individual test data, however, unresolved discrepancies
are present in the results. It is believed that these discrepancies are caused by the ·effect of two-phase flow at the measurement locations. Therefore, more detailed analysis needs to be performed to make the system mass balance a valid data consistency check.
I .
The corre~tion factors resulting from the above analysis are listed below along with method designation and the figure containing the applicable. mass flow rate graph. These graphs should be multiplied by the respective correction factor to produce a more consistent mass balance.
Method Correction Factor Applicable Figure No<.:
( 1 ) 1 0. 778 222 and 225
(2) 2 '1.417 223 and 226
(3) 3 0.443 221
(4) 5 0.917 224 and 227
' It should be noted that these results have been applied only to the broken loop measurements. An analogous technique will be applied to the intact loop but as yet has not been performed.
49

VII. DATA PRESENTATION
The data presented in this report include selected pertinent
thermal-hydraulic data from LOFT Test Ll-3. The data have been divided into four categories: qualified engineering units data (QEUD), un1nterpreted data, yuud data-not qualified~ and channel failed. The "lJI:.UlJ" designation was applied to measurements that have been compared to other measurements and have been found to be within the accuracy of the instrument. These data checks are discussed in detail in Sect1on VI. lhe "uninterpreted data" designation was applied to measurements in which the instruments did not fail but the data are not in a readily usable form. The "good data-not qualified" designation was . .
applied to measurements that appeared to be reasonable but no compnrnhle measurement for cross-checking was recorded.
The data were processed to the extent of converting the data to engineering units, combining measurements to produce computed parameters, and overlaying graphs of corresponding parameters at several locations to facilitate comparison. Point values of momentum flux from the drag discs and velocity from the turbine flowmeters have been conVerted to average values by using the intact loop venturi meter ns discussed in Section III. Data from the drag discs, the turbine flowmeters, and the gamma densitometers were filtered with a 4-Hz filter prior- to 1Jr·esentat1on. Numerous other instrument channel outputs were also Fi ILer·ed prior to presentation. These channels are indicated in Table VI and on the individual plots along with the filter used. Measurement uncertainties for each instrument were reported in
Reference 10 and are subsequently being revised as dictated by in situ testing and calibrations. These uncertainties have been used to produce error band plots [plots of data with upper and lower bounds of the 95% (2cr) confidence levels overlaid]. For the drag discs and gamma densi
tometers, uncertainty analyses have been performed for the point
measurements only. Further analyses will be required before average value uncertainties can be reported.
50
For LOFT Test Ll-3, the instrumentation system performed well. Of 549 instrument channels recorded during this experiment, only 37 iristruments failed. Many of the i~Struments (such as accelerometers and strain g~ges) were used to measure system loads or contributed little·or nothing towar~ understanding what occurred in this test. Thus, data from only 199 of the instrument detectors recorded are included in th1s report.
Table V_I lists the sensors that were intended to be reported for Test Ll-3. Tt gives the detector 1 ocation, range, and frequency response along with the figure number where the data can be found. This table also contains a 11 COmmentS 11 column which gives information reflecting on the usability of the data.
Table VII lists the parameters that were computed from the sensor outputs and other factors; such as"geometrical constants. This table also gives the equations used to compute these parameters, the figure number on which the data can be found, and comments which may reflect on the usefulness of the data.
The data are presented in graphical form, and are arranged two plots per page. The data plots are further divided into five major sections with the individual plots in each section being presented i.n alphanumeric order to facilitate comparison and location of desired parameters. These data sections include:
1. Test Ll-3 Measured Parameters-- Short-Term Plots (Figures 14 through 42) .' . This section contains the detector outputs, including overlays, which ~ere specifically designed for the short-term transient and, therefore, do not exceed 1-second duration.
2. Test Ll-3 Measured Parameters -- 70-Second Plots (Figures 43 through 175).
51
3. Test Ll-3 Measured Parameters -- Long~Term Plots (Figures 176 through 212). This section contains selected detector outputs, including overlays of 175-sec and 500-sec duration.
4. Test Ll-3 Computed Parameters (Figures 213 through 269).
5. Test Ll-3 Erro~ Hand Plnts (Figures 270 through 312). This section contains error band plots for several representative instrument types, l"llnges, anLI fr·equency responses. These error bands are based on 95% (2o) confidence levels.
Time zero for each plot is the average of the times at which each of the QOBVs opened to 17% of its full sleeve travel. This definition for time of blowdown initiation (T
0) was used since (a) a flow area does
not exist through each QOBV until the valve sleeve clears the huddle ·chamber at 17% of its full travel and (b) QOBV-1 commenced opening 2.5
msec sooner than QOBV-2. Determination of T0
, along wit~ valve opening ti~e, is shown pictorially in Figure 13. It should be noted that, while this definition of time zero is adequate for measurment comparisons using time scales on the ~rder of several seconds, the user may wish to utiliz~ a different time zero definition for evaluation of shorter time phenomena. The data are presented prior to the defined time zero to allow for such a comparison.
Pressure data presented in this report are in gauge pressure (psig); barometric pressure at the time of test execution was 12.5 psia.
The scales selected for the graphs were chosen to provide an overview of the test and do not refl~ct the obtainable resolution of the data.
The volume of data contained in this report is large, and although every effort was made to prevent it, an error may have found its way into the report. In the event a user detects an error, prompt notification would be appreciated so that other users may be notified.
52

0
>
20
-- CV-P138-15
---- CV-P138-1
66
12"SCH 160 Pipe
Area Opening
17 '" "
'- " " /
"
/
/ /
/
" "
"---- ---
" " "
Notes
(I) To=(T1 +T2 )/2
(2) CV-P138-1 Opening Time
TQOBV-1=T4-T2 -
(3) CV- P138--15 Opening Tim
TQOBV-15=T3- Tl.
ANC ·A -9429
Fig. 13 Determination df time of rupture (T0
) and valve opening time.
53

TABLE VI
ME~SURED PARAMETERS FOR LOFT T~ST Ll-3
Range Freguenct Res~onse PARAMETER Data. Da,tc
System Acqui s iti on1 · DataUa] Hg. Detector Location Detector System Detector ~yste11 No .• Measurement Conments
VALVE OPENING
Broken Loop Broken loop cold leg betweer 0-100% 0-100% 35 Hz SOD pps 14 QEUD.
CV-Pl38-l break plane and suppressio• tank. 15
Broken Loop Broken loop hot leg betwee• 0-100% 0-100% 35 Hz SOD pps -14 QEUD.
CV-Pl38-15 break plane and suppressio• tank. 16 270
CHORDAL DENSITY (J1 Broken Loop Broken loop cold leg at DT- 0.5-62.4 0.5-62.4 1,000 Hz 1, C•OO Hz QEUD. Filtered to ·4 Hz for +==-
43 DE-BL-lA flange. Beam line 14° 21 min lb/ft3 lb/ft3 10 Hz 50 pps 176 0 to 70 sec plots onl~.
from -lB line [CW looking 271 toward reactor vessel (RVll
Broken Loop Broken loop cold leg at OTT 0.5-62.4 0.5-62.4 1,000 Hz 1 ,COO Hz 43 QEUD. Filtered to 4 Hz for
DE-BL-18 flange. Beam line through f lb/ft3 lb/ft3 10 Hz 50 pps 176 0 to 70 sec plots only. of pipe 45° from vertical · (CCW looking toward RV).
Broken Loop Broken loop cold leg at OTT 0.5-62.4 0.5-62.4 1 ,000 Hz 1 ,COO Hz 43 QEUD. Filtered to 4 Hz for
DE-BL-lC flange. Beam line 22° 7 mi~ lb/ft3 1 b/ft3 10 Hz 50 pps 176 0 to 70 sec plots only.
from -lB line (CCW looking toward RV).
Broken Loop Broken loop hot leg at OTT flange. 0.5-62.4 0.5-62.4 1,000 Hz 1 ,COO Hz 4<1 QEUD. Filtered to 4 Hz for
DE-BL-21\ Beam line 14° 21 min from -213 lb/ft3 1 b/ft3 lO Hz 50 pps U.7 0 to 70 sec plots only.
line (CCW looking toward R\).
Broken Loop Broken 1 oop hot .1 eg at OTT flange. 0.5-62.4 0.5-62.4 1,000 f-\Z 1 ,COO Hz 44 QEUD. Filtered to 4 Hz for
DE-BL-28 Beam line through ~of pipe 45° lb/ft3 lb/ft3 10 H.z ~.o pps 177 0 to 70 ~ec plot~ only.
from vertical (CW coking toward RV).
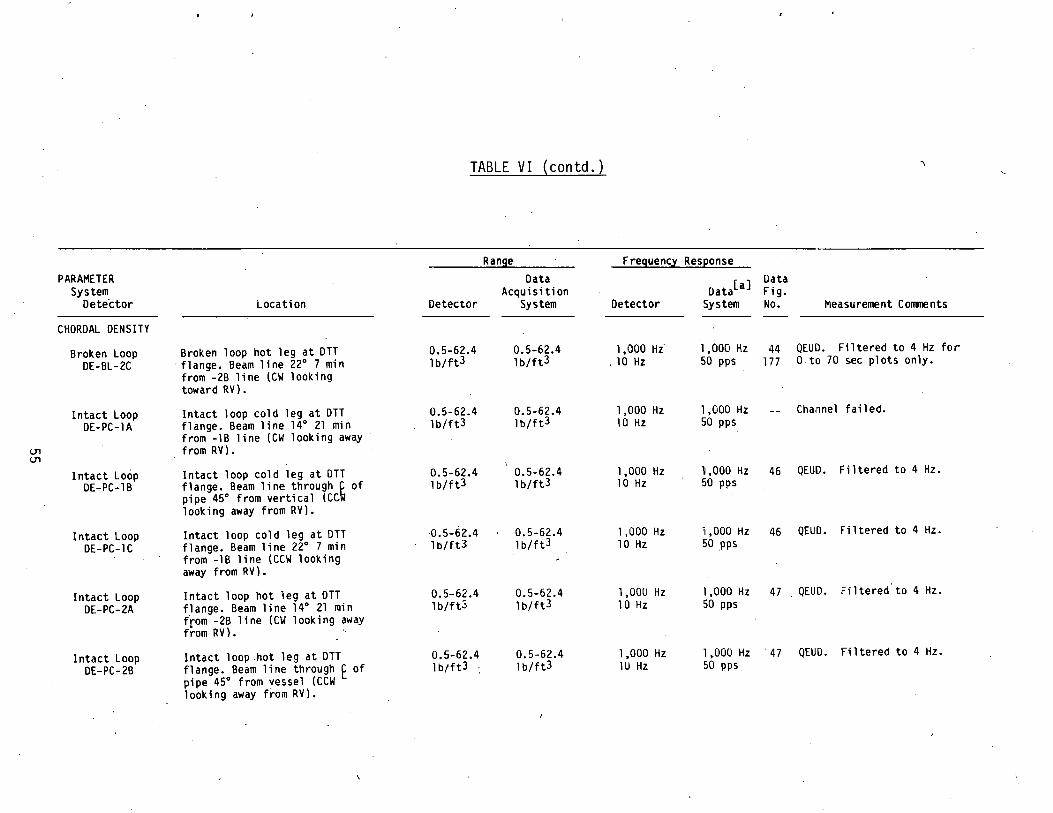
TABLE VI (contd.)
Range Freguencl Res~onse PARAMETER Data Data
System Acquisition Data[ a] Fig. Dete"ctor Location Detector System Detector System No. Measurement Comments
CHORDAL DENSITY
Broken Loop Broken loop hot leg at OTT 0.5-62.4 0.5-62.4 1,000 Hi 1 ,000 Hz 44 QEUD. Filtered to 4 Hz for
DE-BL-2C ·flange. Beam line 22° 7 min lb/ft3 lb/ft3 . 10 Hz 50 pps 177 0 to 70 sec plots only • from -2B line (CW looking toward RV).
Intact Loop Intact loop cold leg at OTT 0.5-62.4 0.5-62.4 1 ,000 Hz 1,000 Hz Channel failed. DE-PC-lA flange. Beam line 14° 21 min lb/ft3 lb/ft3 10 Hz 50 pps
from -lB line (CW looking away (J'I from RV). (J'I
Intact Loop Intact loop cold leg at OTT 0.5-62.4 0.5-62.4 1,000 Hz l,OOO Hz 46 QEUD. Filtered to 4 Hz. OE-PC-lB flange. Beam line through~ of 1 b/ft3 lb/ft3 10 Hz 50 pps
pipe 45° from vertical (CC 1 ook i ng away from RV).
Intact Loop Intact loop cold leg at OTT 0.5-62.4 0.5-62.4 1,000 Hz 1 ,000 Hz 46 QEUO. Filtered to 4 Hz.
OE-PC-lC flange. Beam line 22° 7 min 1 b/ft3 lb/ft3 10 Hz 50 pps from -lB line (CCW looking away from RV).
Intact Loop Intact loop hot leg at OTT 0.5-62.4 .0.5-62.4 1 ,000 Hz 1 ,000 Hz 47 QEUD. Filtered'to 4Hz.
OE-PC-2A flange. Beam line 14° 21 min 1 b/ft3 1 b/ft3 10 Hz 50 pps t'rom -2B line (CW looking away from RV). ·
Intact Loop Intact loop.hot leg at OTT 0.5-62.4 0.5-62.4 1,000 Hz 1.000 Hz . 47 QEUD. Filtered to 4Hz.
DE-PC-2B flange. Beam line through E of lb/ft3 lb/ft3 10 Hz 50 pps pipe 45° from vessel (CCW looking away from RV).

TABLE VI (contd.)
Ran~ Freguenct Res~~nse PARAMETER Data Data.
System Acquisition Data[a] Fig. Detector Location Detector System Detector System No. Measurement Comments
CHORDAL DENSITY
Intact Loop Intact loop hot leg at DT- O.S-62.4 0.5-62.4 1,000 Hz 1,000 1-z 47 QEUD. Filtered to 4 Hz.
DE-PC-2C flange. Beam.line 22° 7 min 1 b/ft3 1 b/ft3 10 Hz 50 pps from -2B line (CCW looking away from RV).
Intact Loop Steam generator (SG) outlet at 0.5-62.4 0.5-62.4 1,000 Hz 1,000 1-z 48 QEUD. Filtered to 4 ~z.
DE-PC-3A DTT flange. Beam line 14c 21 min lb/ft3 lb/ft3 10 Hz SC• pps
(J1 from -3B line (CCW looking down).
"' Intact Loop SG outlet at DTT flange. 0.5-62.4 0.5-62.4 1,000 Hz 1,000 'rz 48 "QEUD. Filtered to 4 Hz.
DE-PC-3B Beam line 65° from flange E 1 b/ft3 lb/ft3 10 Hz 5C pps (CW looking down).
Intact Loop SG outlet at DTT flange. 0.5-62.4 0.5-62.4 1,000 Hz 1,000 Hz 48 QEUD. Filtered to 4 Hz.
DE-PC-3C Beam line 22° 7 min from -2B E lb/ft3 lb/ft3 10 Hz SC pps (CW looking down).
FLUID VELOCITY, All turbine meter measure-ments are unidirectional.
AVERAGED
Broken Loop Broken loop cold leg at DlT 7.5-150 0-190 9 Hz 1 ,'000 HZ 50 Uni nterpreted da.ta. Filtered
FE-BL-1 flange. ft/sec ft/sec SC pps 52 to 4 Hz for 0 to 70 sec plot 178 only. Plot corrected to 272 avera£'€.
Broken Loop Broken loop hot leg at DTT 7.5-150 0-190 9 Hz 1 .tOOO liz 51 Uninterpreted data. Filtered
FE-BL-2 1 flange. ft/sec ft/sec 5C pps 52 to 4 Hz, plot corrected to average.

TABLE VI ( contd.)
Range Freguencl Res~onse PARAMETER Data Data
System Acquisition Data[a] Fig. Detector Location Detector System Detector System No. Measurement Comments
FLUID VELOCITY, AVERAGED
Reactor Ve.ssel Core simulator in instrument l. 5-30 0-60 9 Hz 1,000 Hz 53 Uninterpre-ted data. Fil te~ed FE-CS-1 stalk above orifice. ft/se-c ft/sec 50 pps to 4 Hz, plot corrected to
average.
Intact Loop Intact loop cold leg at OTT 7.5-150 0-180 9 Kz 1 ~000 Hz 54 Uninterpreted data. Filtered FE-PC-1 flange. ft/sec ft/sec 5C pps 57 to 4 Hz, plot corrected to
average •. (.11 ....... Intact Loop Intact loop hot leg at OTT 7.5-150 0-200 9 Hz 1 ,000 Hz 55 Uninterpreted data. Filtered
FE-PC-2 flange. ft/sec ft/sec 50 pps 57 to 41H i, p -~ ot corrected to average.
Intact Loop SG outlet at OTT flange. 7.5-150 0-210 9 Hz 1,000 rlz 56 Unirterpreted data. Filtend FE-PC-3 ft/sec ft/sec 50 pps 57 to 4Hz, ~lot cotrected tc
average.
Reactor Vesse 1 Downcomer stalk 1' 47.1 in. l. 5-30 0-60. 9 Hz 1 ,000 Hz 58 Uninterpreted data. Filte-red FE-lST-1 from RV bottom. ft/sec ft/sec 50 pps 60 to L Hz, plot corrected to
273 average.
Reactor Vessel Downcomer stalk 2' 47-1 in. 1.5-30 0-64 9 Hz 1,000 Hz 59 Uni~terpreted data. Fi 1 tered FE-2ST -1 from RV bottom. ft/sec ft/sec 5) pps 60 to 4 Hz ior 0 to 70 sec plot
179 only. P1ot corrected to average.
FLOW RATE
Emergency core Accumulator A in 6-in. 1 i ne 0-60 in. 0-2000 gpm 5 Hz ~ pps QEU'). Net presented •. ACO:L-Cooling System downstream of orifice. muhtor P.CC-A injection
FT-Pl20-36-l fai~ed to initiate.

TABLE VI (contd.t
Ran~ Freguencl Res~nse PARAMETER Data Data
System Acquisition i:Jata[a] Fig. Detector Location Detector System Detector System No. Measurement Comments
FLOW RATE
Emergency Core Accumulator A in 6-in. 1 i ne 0-600 in. 0-600 gpm 5 Hz :o pps Chaimel failed. Cooling System downstream of .orifice.
FT-Pl20-36-5
Emergency Core LPIS pump A in 4-in. 1 i ne 40-800 g.pm 0-400 gpm 5 Hz :o pps 61 IQEUD. Cooling System between heat exchanger and 184
FT-Pl20-85 orifice. 275
c:.n co Emergency Core HP IS pump A discharge. 2-30 gpm 0-30 gpm 5 Hz 5() !PPS 62 ()EUD. Cooling System 276
FT-Pl28-104
Slowdown Suppres- Suppression tank spray flo·,; 0-100 gpm 0-100 gpm 7 Hz !JO IPPS 180 ~ni~t~~~:~~d ~~~~ ~~~~ io to
sion Tank Spray rate in 60 gpm header. System +0 94 sec to 175 sec. 0
FE-Pl38-138
Slowdown Suppres- Suppression tank spray flow 0-400 gpm 0-400 gpm 7 Hz 50 pps 181 QEUD after the initiation of
si on Tank Spray rate from pump discharge. 274 spray flow at !v T + 94 sec. 0
System FE-Pl38-139
Slowdown Suppres- Suppression tank spray flo~ 0-300 gpm 0-300 gpm 7 Hz 50 pps 182 QEUD. Recorded fi ow rate be-
sian Tank Spray rate in the 220 gpm header. tween T and T + 1 5 sec due
System to mechgnical ~hock.
FE-Pl38-140
Slowdown Suppres- Suppression tank spray flOW! 0-150 gpm 0-150 gpm 7 Hz 5:> pps 183" ~EUD after the initiation of
sian Tank Spray rate in the spray pump spray f]ow at"-· T0
+ 94 sec.
System recirculation line. FE-Pl38-153

TABLE VI (contd.).
Range Freguenct Res~onse PARAMETER Data Data
System Acquisition Uata[a] Fig. Detector Location Detector System Detector System No. Measurement Comments
FLOW RATE
Intact Loop Intact loop hot leg venturi 0.5-5 0-5 5 Hz 1,000 Hz 63 QEUb for initial conditions FT-Pl39-27-l flowmeter (right side mlbm/hr mlbm/hr 50 pps only; data 10t corrected for
facing SG). density changes after T0.
Intact Loop Intact loop hot leg venturi 0-760. 0-760 5 Hz 1,000 Hz QUED for initial conditions FT-Pl39-27-2 flowmeter (left side in. H2o in. H20 50 f.lPS only. Channel failed after
facing SG). T0 (diigital). <..n \.0 Intact Loop Intact loop hot leg 0.5-5 0-5 Hz. 50 Jps 63 QEUD ~or initial conditions
FT-Pl39-27-3 venturi flowmeter (bottom). mlbm/hr mlbm/hr 277 only; data not-corrected for densi:y changes after T0.
LIQUID LEVEL
Reactor Vessel Downcomer 1 with stings 0-162 in. -1-+1 v 0.7 Hz 1,000 Hz 64 QEUD. LE-lST-1 between 200.4 in. and 8.4 in. and -2 above RV bottom.
Reactor Vessel Downcomer 2 with stings 0-162 in. -1-+ 1 v 0. 7 Hz l,COO Hz 65 QEUD. LE-2ST-2~2 channel f~Hed.
LE-2ST -1 between 200.4 in. and 8.4 in. and -2 above RV bottom.
Secondary Coolant SG secondary 1 evel. -143-+57 -143-+57 3 Hz 50 pps 70 Good data - not qualified. ')ata System in. H.20 ~ in. H20 1,000 Hz display instrument ringing from
LT-P4-8B T0 tc "' 5 sec.

0"'1 0
PARAMETER System
Detector
UQUID LEVEL
Emergency Core Cooling System
LIT-Pl20-44
Location
Accumulator A.
Slowdown Suppres- Slowdown suppression tank ·evel sian Tank on north end of tank.
LT-Pl38-33
Slowdown Suppres- Slowdown suppression tank ·evel sian Tank on south end of tank.
LT-Pl38-58
Intact Loop LT-Pl39-6
Intact Loop LT-Pl39-7
Intact Loop LT-Pl39-8
~10NENTU~1 FLUX, AVERAGED
Broken Loop M~-BL-1
Pressurizer level on southeast side.
Pressur-izer level on south~~oest
side.
Pressurizer level on north side.
Broken loop cold leg at DTT flange.
Detector
0-120 in.
0-150 in.
0-132 in.
0-75 in.
0-75 in.
0-75 in.
2.0-50 lQ3lb/ftse~
TABLE VI (contd.)
Range Data
Acquisition System
0-120 in.
0-132 in.
0-132 in.
0-75 in.
0-75 in.
0-75 in.
-460-+460 l03lbm/ftsec2
Frequency Response
Detector
5 ~-z
5 f-z
5 f-z
5Hz
5 H.:
" oJ H~
35 Elz
Data [Jata[a] Fig.
System No.
~-0 PJS
1,000 Hz 66 50 pps 185
204
1,000 Hz 66 50 pps 185
205 27G
1,000 Hz 67 5D P~·s
l,OOC Hz 68 50 p~s
50 PJ:S 69 .279
l ,000 Hz 71 50 pps 73
136 280
Measurement Convnents
QEIJD. Not presented. AccumLlator ACC-A injection failed to initiate.
QEUD. Data display instrument rinaing from T to ~ T + ~: 5 sec. 0 0
QEUD. Data display instrument rinoing from T to ~ T + 2.'5 .. sec. 0 0
QELID from T to T + 13 sec. Uninterpretgd dat9 after T + 13 sec. 0
QE_D from T to T + 13 sec. Uninterpretgd dat~ after T
0 + 13 sec.
QEJD from T to T + 13 sec. Un i1nterpretgd da t9 after T
0 +
i3 sec.
Un'nterpreted datj. Filtered to ~ Hz for 0 to 70 sec plot. Unfiltered for 0 to 175 sec plot. Plot corrected to 3verage. Data temperature sen;itive after ~ T + 50 sec.
0

TABLE VI (contd.)
Range Freguenc~ ResQonse PARAMETER Data Data
System Acquisition Oa-:a[a] Fig. Detector Location Detector System [•etector System No. Measurement COI!Illents
f·10MENTU~1 FLUX, AVERAGED
Broken loop Broken loop hot leg at OTT 2.0-5.0 -420-+460 1,000 Hz 72 Uninterpreted data. Fil-~1E-BL-2 flange. l03lb/ft-. l03lbm/ft- 35 Hz 50 pps 73 tered to 4 Hz for 0 to
sec2 sec2 · 70 sec plot; unfiltered for 0 to 190 sec plot. Plot corrected to average.
Reactor Vessel Core simulator stalk above 200-3,500 -20-+20 l,OJO Hz 74 Uninterpreted data. Fil ter,ed 0"1 ME-CS-1 orifice plates. l b/ft-sec2 1 o3l bm/ft- 3!: Hz· 50 pps to 4 Hz, plot corrected to
sec2 average for 0 to 70 sec.
Intact Loop Intact loop cold leg at OTT 2.0-50 -510-+510 l ,000 Hz 75 Uninterpreted data. Data tern-NE-PC-1 flange. l 031 b/ft- l03lbm/ft- 35 Hz 50 pps 77 perature sensitive after T
sec2 sec2 + 22 s~c. Filtered to 4 Hz~ Plot corrected to average.
Intact Loop Intact loop hot leg at OTT 200-3,500 -2~-+28 l ,000 Hz Channel failed (digital). f~E-PC-2 flange. lb/ft-sec2 10 lbm/ft- · 3S Hz 50 pps
sec2
Intact Loop SG outlet at OTT flange. 2.0-5.0 -440-+440 l,COO Hz 76 Unin~rpreted data. Data ME-PC-3 l03lb/ft- 1 o3l bm/ft- 35 Hz 50 pps 77 temperature sensitive after
'sec2 sec2 T0 + 22 sec. Filtered to 4 Hz. Plot corrected to average.
Reactor Vessel Downcomer l, 45.~ in. above 200-3,500 -19-+19 1,000 Hz 73 Uninterpre:ed data. Filtered ME-lST-1 RV bottom. l b/ft-sec2 -·· l03lbm/ft- 35 Hz 50 pps 281 to 4 Hz, plot corrected to
sec2 averaqe.

TABLE VI (contd::
Range Freguencl Respohse PARAMETER Data
Oc.tc.la] Data
Sy:;tem Acquisition Fig. Detector Location Oetector System Dete-ctor Sy~.te-m llo. Measurement Comments
MOMENTUM FLUX. AVERAGED
Reactor Vessel Downcomer 2. 45.5 ; n. above 200-3.500 -19-+19 l .coc Hz· 79 Uninterpreted data. Filtered ME-2ST-l RV bottom. lb/ft-sec2 l o3l bm/ft- ~5 Hz SJ PI=S 187 to 4 Hz for 0 tJ 70 sec; un-
sec2 filtered for 0 to 175 sec; plot corrected to average.
ELECTRICAL FREQUENCY CT'I Intact Loop Intact loop pump l. 0-75 Hz 0-75 Hz l • OG)() Hz 5) IPPS 238 QEliD. N
PCP-1-F 239
ELECTRICAL CURRENT
lntact Loop Intact loop pump l. 0-1.000 amps 0-1.000 amps 500 pps QE~D. Not presented. PCP-1-I
ELECTRICAL VOLTAGE
Intact Loop Intact loop pump l. 0-600 v . 0-600 v 500 pps QE_D. Not presented . PCP-1-V
ELECTRICAL FREQUENCY
Intact Loop Intact loop pump 2. 0-75 Hz 0-75 Hz 1 .oca Hz 50 pps £•38 QEUD. PCP-2-F 240

TABLE VI (contd.)
Range Freguenc,t Resf!onse PARAMETER Data
Data[aj Data
System Acquisition Fig. )
Detector Location Detector System Detector System No. Measurement Comments
ELECTRICAL CURRENT
Intact-Loop Intact loop pump 2. 0-1,000 amps 0-1,000 amps 500 pps QEUD. Not presented .. PCP-2-I
ELECTRICAL VOLTAGE
Intact Loop Intact loop pump 2. 0-600 v 0-600 v 500 pps QEUD. Not presented. PCP-2-V
~ DIFFERENTIAL w PRESSURE
Broken Loop Broken loop hot leg from flange 0-50 psid -50-+50 E.O Hz '50) pps 80 Uninterpreted data. Filtered PdE-BL-1 in front of SG simulator psid 282 to 4 Hz.
to pipe in front of reflood assist bypass system tee.
Broken Loop Broken loop cold leg from flange o-1,500 psid -50-+50 60 Hz 500 pps 81 QEUD. Filtered to 4 Hz. PdE-BL-2 in front of spool piece to pipe psid 283
in front of reflood assist by-pass system tee.
Broken Loop Broken loop cold leg across 0-1,500 psid -1,500- 1 .2 Hz 5C pps 82 QEUD. PdE-BL-3 break plane. +1 ,500 psid 284
Broken Loop ~Broken loop hot leg across 0-1,500 psid -1,500- 1 .2 Hz 50 pps 82 QEUD. PdE-BL-4 break plane. +1 ,500 psid
Broken Loop Broken loop hot leg across 0-1,500 psid -1,500- 1.2 Hz 1 ,.000 Hz 83 QEUD. · PdE-BL-5 pump simulator. +1 ,500 psid 50 pps

TABLE VI (contd. I
Range Freguencl Re~~onse PARAMETER Data Data
System Acquisition Data[a] Fig. Detector Location Detector System Detector System No. Measurement COITIIlents
DIFFERENTIAL PRESSURE
Broken Loop Broken loop hot leg acro~s 0-50 psid -50-+50 3.5 Hz ~0 pps 84 QEUD. PdE-BL-6 SG simulator outlet flanre. psid 285
Broken loop Broken loop hot leg acr~s 0-100 psid -50-+50 3.5 Hz 1,000 H;;; 85 QEUD. PdE-BL-7 SG simulator. psid EO pps
Broken Loop Bro"ken loop hot leg acr~s 0-50 psid -50-+50 3.5 Hz !:() pp s 86 QEUD. Filtered to 4 Hz.
"' PdE-BL-8 SG simulator inlet flange. psid +=-
Reactor Vessel RV between core simulator :!:_ 50 psid -25-+25 2'. 3 Hz 50 pps 87 OEUD. Filter:d to 4 Hz. PdE-CS-1 instrument stalk and psid
downcomer 2, 24.5 in. frJm \ RV bottom.
Intact Loop Intact loop cold leg acr·J:SS 0-1qo psid -100-+100. 0.7 Hz 1,000 Hz 88 CEUD. PdE-PC-1 primary coolant pumps. psid 5J pps 286
Intact Loop Intac~ loop across SG. 0-100 psid -100-+100 3.5 Hz 5.J pps 89 QEUD prior to T . Uninter-. 0 0
PdE-PC-2 psid 287 preted data' after T . Unex-plained long-:erm p8sitive offset.
Intact Loop Intact loop hot leg piping, :!:_ W psid :!:_ 10 psid 2.3 Hz 5) pps 90 QEUD. Filtered to 4 Hz. PdE-PC-3 RV to venturi. 288
Intact Loop Intact loop hot leg pipi!l·~. :!:_ 10 psid :!:_ 10 psid 2 3 Hz 5·0 pps 91 QEUD prior to T0
. Uninter-
PdE-PC-4 venturi to SG. preted data after T . Unex-plained long-term nggative offset. Filtered to 4 Hz.

PARAMETER System
Detec_tor
DIFFERENTIAL PRESSURE '
Intact Loop Pd~-PC-5
Intact Loop PdE-PC-7
Reactor Vessel PdE-RV-1
Reactor Vessel PdE~RV-3
Reactor Vessel PdE-RV-4
Location
Intact loop cold leg primary coolant pumps to RV nozzle,
Intact loop cold leg RV inlet to broken loop cold
· leg RV in 1 et.
Between downcomer stalk 1 and blowdown suppression tank.
)
Intact loop cold leg inlet to bottom of downcomer.
Upper plenum to the R~ outlet nozzle in the intact loop hot leg.
Slowdown Suppres- Suppression tank across the sian Tank vacuum breaker line.
PdE-SV-·9
Reactor Vessel PdE-2ST.-2
Intact Loop PdT-Pl39-30
Downcomer 2 between 209.4 in. and 24.5 in. above RV bottom.
Across RV just beyond intact loop inlet and outlet nozzles.
TABLE VI (contd.)
Range Frequency Respo1se
Detector
+ 10 psid
+ 10 psid
Data Acquisition
System
+ 10 psid
+ 10 psi d
0-1,500 psid -1,500-
+ 10 ps id
+ 10 psi d
0-25 psid
0-50 psid
+1 ,500 psid
~ 10 psid
+ ·10 psid
-100-+100 in.
-25-+25 psid
0-50 psid
Detector
2.3 Hz
2.3 Hz
1 .2 Hz
2.3 Hz
2.3 Hz
5 Hz
60 Hz
5 Hz
Data [Jata[a] F. lg.
System No. Measurement Comments
50 pps
50 pps
50 pps
50 pps
50 pps
50 pps
50 pps
50 pps
92 QEUD prior to T0 . Uninterpreted date after T . Unexplained long-term nggative offset. Filtered to 4Hz.
93 QEUD. Filtered to 4 Hz.
94 QEUD. Differential press~re 289 exceeds instrument range
prior to T0
.
95 QEUD. Filtered to 4Hz.
96 QEUD prior to T ; uninterpreted data after T 0Unexplained long-term pogitive offset.
97 QEUD. Good data - not
98
99 290
qua 1 Hied.
QEUD prior to T ; uninterpreted data after T
0. 0Unexplained
long-term negative offset. Filtered to 4 Hz.
QEUD-

TABLE VI (contd )
Range F reguenc~ Res~onse PARAMETER Data Data
System Acquisition Data[ a] Fig. Detector Location Detector System Jetector System No. Measurement Comments
PRESSURE
Broken Loop Broken loop cold leg at D\r D-3,000 psig 0-3,000 psig >!iiOO -lz l,OJO Hz 17 QEUD. PE-BL-1 flange. 50 pps 100
l 01
Broken Loop Broken loop hot leg at o:-r 0-3,000 psig 0-3,000 psig >5(•0 -lz l,DJO Hz 18 q::uo. PE-BL-2 flange. 5J Jps 100
102 291
0"1 Broken Loop BrakeD loop hot leg just 0-3,000 psig 0-3;ooo psig >~CO Hz 1.0•)0 Hz Q.::uo. 0"1 18 PE-BL-3 upstream of SG simulator. 50 Jps 102
Broken Loop Broken loop cold leg at inlet 0-3,000 psig 0-3,000 psig >~CO Hz 1.ooo Hz 17 OEUD. PE-BL-4 of spool piece. 50 pps 101
Broken Loop Broken loop hot leg at OL:let 0-3,000 psig 0-3,000 psig >~00 Hz 1,000 Hz 18 C•EUD. . PE-BL-6 of SG simulator. " 50 pps 102
Broken Loop Broken loop cold leg at certer 0-3,000 psig 0-3,000 psig >~00 Hz 1 ,000 Hz 17 CEUO. PE-BL-8 of spool piece. 50 pps 101
Reactor \les~el Core simulator stalk above 0-3,000 psig 0-3,000 psig 4!: Hz l ,000 Hz 103 . CEUD. PE-CS-lA orifice plate (wide ranged- 50 pps 108
3,000 psi). 112 292
Reactor Vessel Core simulator stalk abo~ 0-200 psig 0-200 psig 45 Hz 1,000 Hz 104 QEUD. Pressure .beyond ins tru-PE-CS-1 B orifice plate (narrow ranred- 50 pps 188 ment range until T
0 + 31 sec.
200 psi). 293
Reactor Vessel Core simulator stalk above 0-3,000 psig 0-2,500 psig 4,lJO Hz 1,0(10 Hz 20 Q[UO to T + lJ sec. Instru-PE-CS-lFF orifice plate.
' 50 ~·ps lll ~nt temp~rature sensitive
after ~ T0
_ + lJ sec.
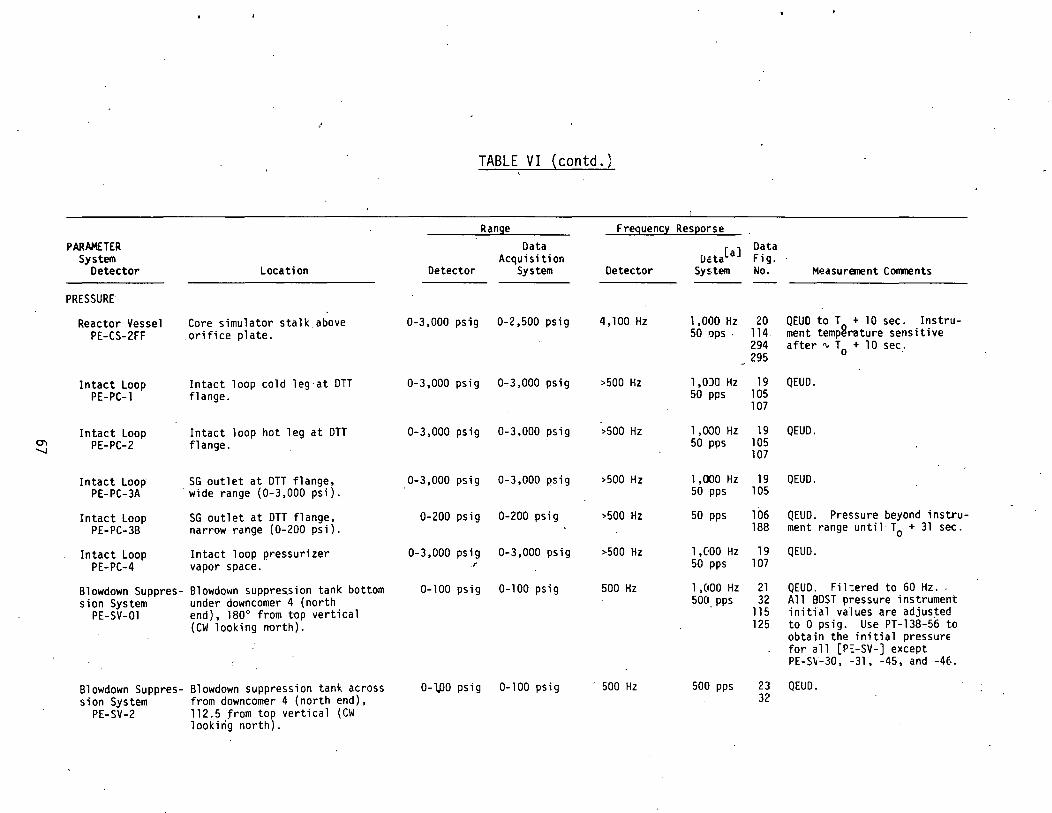
PARAMETER System
Detector
PRESSURE"
Reactor Vessel PE-CS-2FF
Intact Loop PE-PC-1
Intact Loop PE-PC-2
Intact Loop PE-PC-3A
Intact Loop PE-PC-3B
Intact Loop PE-PC-4
Blowdown Suppression System
PE-SV-01
Blowdown Suppression System
PE-SV-2
I
Location
Core simulator stalk_above .orifice plate.
Intact loop cold leg·at OTT flange.
Intact loop hot leg at OTT flange.
SG outlet at OTT flange, wide range (0-3,000 psi).
SG outlet at DTT flange, narrow range (0-200 psi).
Intact loop pressurizer vapor space.
Blowdown suppression tank bottom under downcomer 4 (north end), 180° from t~p vertical (CW looking ~rth).
Blowdown suppression tank across from downcomer 4 (north end), 112.5 from top vertical (CW lookirig north).
TABLE VI (contd.)
Range Frequency Resporse
Detector
0-3,000 psig
0-3,000 psig
Data Acquisition
System
0-2,500 psig
0-3,000 psig
0-3,000 psig 0-3,000 psig
0-3,000 psig 0-3,000 P.Sig
0-200 psig 0-200 psig
0-3,000 psig 0-3,000 psig .r
0-100 psig 0-100 psig
0-l.DO psig 0-100 psig
Detector
4,100 Hz
>500 Hz
>500 Hz
>500 Hz
">500 Hz
>500 Hz
500 Hz
500 ·Hz
Data Uc:ta[a] Fig.
Sy~.tem No.
1 ,000 Hz 20 50 pps . 114
294 295
l,OJO Hz 19 50 pps 105
107
Measurement C011111ents
QEUD to T + 10 sec. Instrument tempgrature sensitive after ~ T + 10 sec. 0 .
QEUD.
1,000 Hz 19 QEUD. 50 pps 105
1,000 Hz 50 'PPS
50 pps
1,000 Hz 50 pps
1,000 Hz 500_ pps
500 pps
107
19 105
106 188
19 107
21 32
115 125
23 32
QEUD.
QEUD. Pressure beyond instrument range until T
0 + 31 sec.
QEUD.
QEUD. Fil :ered to 60 Hz .. All BDST pressure instrument initial values are adjusted to 0 psig. Use PT-138-56 to obtain the initial pressure for all [!>~-SV-] except PE-S~-30, -31, -45, and -46.
QEUD.
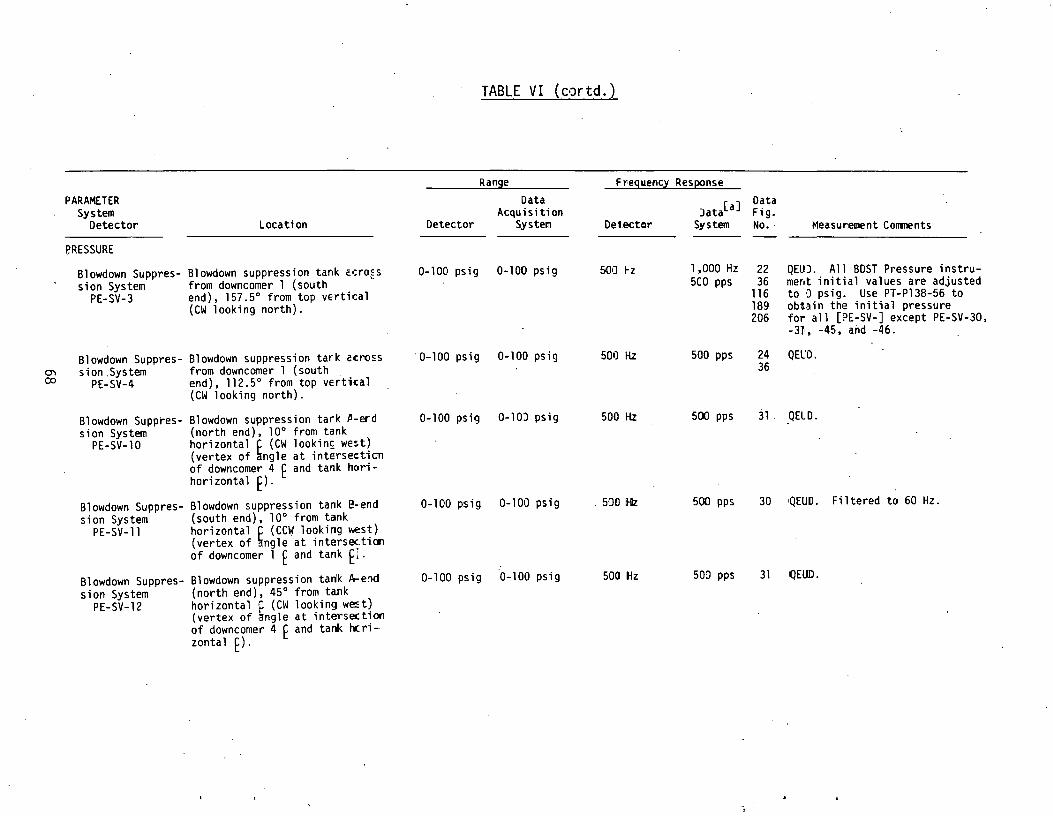
TABLE VI (cortd.)
Range F r·eguencl Response PARAMETER Data Data
System Acquisition Jata[a] Fig. Detector Location Detector System Detector System No. Measurement Comments
I?RESSURE
Slowdown Suppres- Slowdown suppression tank c.r.ro5s 0-100 psig 0-100 psig 500 1-z 1,000 Hz 22 QEUJ. All SDST Pressure instru-sion System from downcomer 1 (south 5CO pps 36 ment initial values are adjusted
PE-SV-3 end), 157.5° from top v~rtical 116 to •) psig. Use PT-Pl38-56 to (CW looking north). 189 obtain the initial pressure
206 for all [PE-SV-] except PE-SV-30, -3J, -45, and -46.
Slowdown Suppres- Slowdown suppression tark ccn:o5s 0-100 psig 0-100 psig 500 Hz 500 pps 24 QEL'D.
"' sion .System from downcomer 1 (south 36 (X) PE-SV-4 end), 112.5° from top vertical
(CW looking north).
Slowdown Suppres- Slowdown suppression tark P-erd 0-100 ps ig 0-lOJ psig 500 Hz 500 pps 31 ' QELD. sion System (north end), 10° from tank
PE-SV-1 0 horizontal ~ (CW looking we~t) (vertex of ngle at intersecticn of downcomer 4 E and tank hori-hori zonta 1 E) .
Slowdown Suppres- Slowdown suppression tank 8-end 0-100 psig 0-100 psig ' 500 1Hz 500 pps 30 IQEUD. Filtered to 60 Hz.
sion System (south end), 10° from tank PE-SV-11 horizontal ~ (CCW looking west}
(vertex of ngle at intersec.tioo of downcomer 1 E and tank E;.
Slowdown Suppres- Slowdown suppression tan'k A-e:'ld 0-100 psig 0-100 psig 500 Hz son pps 31 QEUO.
sion System (north end), 45° from tank PE-SV-12 horizontal ~ (CW looking w~t)
(vertex of ngle at intersection of downcomer 4 E and tali< t.:ri-zontal E).

TABLE VI (contd.)
Range Freguenc~ Res~onie
PARAMETER Data Data System Acquisition liata[a] Fig.
Detector Location Detector System Detector· System No. M~asurenent Comments
PRESSURE
Blowdown Suppres- Blowdown ~uppression tank B-end 0-100 psig 0-100 psig 5JO Hz 500 pps 30 QEUD. All BDST pressure instru-
sian System (south end), 45° from tank ment initial values are adjLsted
PE-SV-13 horizontal ~ (CCW looking west) to 0 psig. Use PT-Pl38-56 t~ (vertex of ngle at intersection obtain the initial pressure for of downcomer 1 E and tank hori- all [PE-SV-] except PE-SV-30, zontal E). -31, -45, ~nd -46.
Blowdown Suppres- Blowdown suppression tank-header 0._ 100 psig 0-100 psig !:00 Hz 500 pps 29 QEUD. ~ sian System above downcomer 4r 327° from top 117 1.0
PE-SV-14 vertical (CW looking nqrth). 127 296 297
Blowdown SuRpres- Blowdown suppression tank across 0-100 psig 0-100 psig 500 Hz 500 ,PPS 28 QEUD.
sian System from downcomer 4, 230° from 33
PE-SV-15 top vert i.ca 1 (CW looking north). . Blowdown Suppres- Blowdown suppression tank across 0-100 psig 0"-100 psig 500 Hz 5CO pps 28 QEUD.
sian System from downcomer 1, 230° from 36
PE-SV-16 top vertical (CW looking north). .,
Blowdown Suppres- Blowdown suppression tank, 0-100 psig 0-100 psig 500 Hz 500 pps 27 QEUD.
sian System 54-1/2 in. nor~h of down- 35
PE-SV-17 ·comer 3 E; 327° from top 118 vert i ca 1 ( CW 1 ook i ng north). 126
B1owdown Suppres- B1owdown suppression tank header 0-100 P.S i g 0-100 psig 500 Hz 500 pps 29 Un-i nterpreted data.
sian System above downcomer 1. 119
PE-SV-18 127

TABLE VI (contd.)
Range Freguencl Res~onse PARAMETER Data Data
System Acquisition Oata[a: Fig. Detector Location Detector System Detector System No. Measurement Comments
PRESSURE
Slowdown Suppres- Slowdown suppression tank t-ot tom, 0-100 psig 0-100 psig 5CO Hz 1,000 H;: 21 QEUD. All SDST pressure instru-sion System 54-l/2 in. north of down- 500 pps 34 ment initial values are adjusted
PE-SV-22 comer 3 E· 120 to 0 psig. ·Use PT-Pl38-56 to· 125 obtain the initial pressure for 189 a1l [PE-SV-] except PE-SV-30,
-31, -45, and ~46.
Slowdown Suppres- Slowdown suppression tank 0-100 psig 0-100 psig 500 Hz 500 pps 23 QEUD. sion System 54-l/2 in. north of down- 34
PE-SV-23 comer 3 E,ll2.5° from top -....J 0 vertical (CW looking north).
Slowdown Suppres- Slowdown suppression tank bottom, 0-100 psig 0-100 psig 500 Hz 500 pps 21 QIEUD. sion System 136.5 in. north of down- 31
PE-SV-24 comer 3 E·
Slowdown Suppres- Slowdown suppression tank, 0-100 psig 0-100 psig 50D Hz 500 pps 23 QEUD. sion System 136.5 in. north of down-
PE-SV-25 comer 3 E• 112.5° from tQ~:' vertical (CW looking nortt).
Slowdown Suppres- Slowdown suppression tank bo~tom, 0-100 psig 0-100 psig 500 Hz 1,000 Hz 22 QEUD. sion System 54.3 in. south of down- 500 pps 121
PE-SV-26 comer 2 E· 125 207
Slowdown Suppres- Slowdown suppression tank b:>ttom, 0-l 00 psi g 0-100 psig 500 Hz 1,000 Hz 22 QEUD.
sion System 136.5 in. south of down- ~-00 pps 30
PE-SV-27 comer 2 [·
Slowdown Suppres- Slowdown suppression tank~ 0-1DO psig 0-100 psig 50) Hz 500 pps 24 QEUD.
sion System 54.5 in. south of down-PE-SV-28 comer 2 E· 112.5° from to.:
vertical (CW looking nort~)~

TABLE VI (contd.)
Range Freguencl Res~onse PARAMETER Data Data
System Acquisition Date[ a] Fig. Detector Location Detector System Detector SystEill No. Measurement Comments
PRESSURE
Slowdown Suppres- Slowdown suppression tank, D-100 psig 0-100 psig 500 Hz 500 pps 24 QEUD ... \11 SCST pressure inst~u-sion System 136.5 in. south of down- ment in~tial values are adjusted
PE-SV-29 comer 2 E• 112.5° from top to 0 psig. Use PT-Pl38-56 to verti c'a 1 ( CW 1 ooki ng north). obtain the initial pressure f~r
all [PE-SV-] except PE-SV-30. -31, -45, and·-46.
Slowdown Suppres- Slowdown suppression tank header 0-3,ooa psig 0-3,000 psig 100 Hz 500 ~·PS 37 Good data - not qualified. -.....J sion System snubber (en~).
PE•SV-30
Slowdown Suppres- Slowdown suppresston tank header 0-3,000 psig 0-3,000 psig 100 Hz 500 pps 38 Good dcta -not qualified. sipn System snubber (end) .
PE-SV-31
Slowdown Suppres- Slowdown suppression tank bottom 0-100 psig 0-100 psig 500 Hz l,OOO.Hz 22 QEUD. sion System under downcomer 2. 500 pps 122
PE-SV-43 125 208
Slowdown Suppres- Slowdown suppression tank bottom 0-100 psig 0-100 psig 500 Hz l,OOJ Hz 21 QEUD. sion System under downcomer 3. 500 pps 20S
PE-SV-44
Slowdown Suppres-'Slowdown suppression tank header 0-3,000 psig 0-3,000 psig 100 Hz 500 IPPS 39 Good d:ita -not qualified. sion System snubber (bend).
PE-SV-45
Slowdown Suppres- Slowdown suppression tank header 0-3,000 p;ig 0-3,000 psig 100 Hz 500 pps 40 Good dlata - not qualified. sion System snubber (bend).
PE-SV-46

TABLE VI (co1td.)
Range Freguenct Res~onse PARAMETER Data
[ atala] Data
System Acquisition Fig. Detector Location Detector System Jetector S:. stein No. Measuremen: Comments
PRESSURE
Slowdown Suppres- Slowdown vacuum relief sys~em 0-100 psig 0-100 psig 50C Hz SOC• ~·ps 41 QEIIJD. All SDST pressure instru-sian System rupture disc standpipe. memt initial values are adjusted
PE-SV-54 to 0 psig. Use PT-Pl38-56 to obtain the initial pressure for al- [PE-SV-] except PE-SV-30, -31 , -45, and -46.
""'-1 Slowdown Suppres- Slowdown suppression tank lt•Op, 0-100 psig 0-100 psig 500 -lz 5DC r;ps 27 - QEIJD.
N sian System 6 in. north of downcomer 33 PE-SV-55 4 E· 123
126 190
Slowdown Suppres- Slowdown suppression tank across 0-100 psig 0-100 psig 5CO Hz 500 pps 26 QE_D. sian System from downcomer 4, 45° f~om 33
PE-SV-57 top vertical ( CW 1 oak i n~1 north) ..
Slowdown Suppres- Slowdown suppression tank across 0-100 psig 0-100 psig 500 Hz 500, p~s 25 QEUD. sian System from downcomer 4, 67.5° 32
PE-SV-58 from top vertical (CW looki1g north).
Slowdown Suppres- Slowdown suppression taNk, 0-100 psig 0-100 psig 500 Hz 500 pJS 26 QEI!ID. sian System 63.5 in. north of down~ 35
PE-SV-59 comer 3, 45° from top vertical (CW looking north:.
Slowdown Suppres- Slowdown suppression tank 'to)p 0-100 psig 0-100 psig 50) 1-2 500 pps 27 QEUJ. sian System above downcomer 1. 36
PE-SV-60 124 ~26 090

....... w
PARAMETER System
Detector
PRESSURE
Slowdown Suppression System
PE-SV-61
Location
Bl owdown ,suppress ion tank across from downcomer 1 67.5° from top vertical (CW looking north).
Slowdown Suppres- Bellows between broken loop sion System and blowdown suppression tank
PE-SV-70 header.
Reactor Vessel PE-lST-lA
Reactor Vessel ~E-lST-lB
Reactor Vessel PE-lST-lFF
Reactor Vessel PE-1ST-3A
Reactor Vessel PE-1ST-3B
Downcomer stalk 1, 24.5 in. above RV bottom, wide range (0-3,000 psi).
Downcomer stalk 1, 24.5 in. above RV bottom, narrow range (0-200 psi).
Downcomer stalk 1, 21.6 in. above RV bottom ..
Downcomer stalk 1, 209.4 in. above RV bottom, wide range (0-3,000 psi).
Downcomer stalk 1, 209.4 in. above RV bottom, narrow range (0-200 psi).
TABLE VI (contd.)
Range Frequency Response
Detector
0.:.100 psig
Data Acquisition
System
0-100 psig
0-500 psig 0-500 psig
0-3,000 psig 0-3,000 psig
0-200 psig 0-200 psig
0-3,000 psig 0-2,500 psig
0-3,000 psig 0-3,000 psig
0-200 psig 0-200 psig
Detector
' 500 Hz
30 Hz
3C Hz
30 Hz
4,100 Hz
47 Hz
47 Hz
Data [lat .[a] F. .. lg.
System No.
500 ~ps 25 36
Measurement Comments
QEUD. All BDST pressure instrument initial values are adjusted to 0 psig. Wse PT-Pl38-56 ta obtain the initial pressure toall [PE~SV-] except PE-SV-30, -31, -45, and -46.
500 pps 42 QEUD .
1,000 Hz 108 QEUD. 50 pJs 129
50 pps 109 QEUD. Pressure beyond i nstr J-
1 ,000 Hz 111 50 pps
ment range until ~ T0
+ 31 s~c.
QEUD (jigital) toT + 10 sec. Instrunent temperat8re sensit~ve after " TR + 10 sec. Channel failed (a aiog).
1,000 Hz 108 QEUD. 50 ~·ps
50 pps 110 QEUD. Pressure beyond instrunent range until ~ T
0 + 30 sec.

PARAMETER System
Detector
PRESSURE
Reactor Vessel PE-lST-3FF
Reactor Vessel PE-2ST-lA
Reactor Vessel PE-2ST-lB
Reactor Vessel PE-2ST-lFF
Reactor Vessel PE-2ST-3FF
Emergency Core Cooling System
PT-Pl20-43
Emergency Core Cooling System
PT-Pl20-54
Emergency Core Cooling System
PT-Pl20-83
Location
Downcomer stalk l, 212.1 in. above RV bottom.
Downcomer stalk 2, 24.5 in. above RV bottom, wide range (0-3,000 psi).
Downcomer stalk 2, 24.5 in. above RV bottom, narrow range (0-200 psi).
Downcomer stalk 2, 21.6 in. above RV bottom.
Downcomer stalk 2, 212.1 in. above RV bottom.
Accumulator A, 27 in. above water outlet.
Emergency core cooling injection into lower plenum.
LPIS pump A discharge line.
TABLE VI (cortd.)
Range =requency Response
D•etector
Data Acquisition
System
0-3,000 psig 0-2,500 psig
0-3,000 psig 0-3,000 psig
0-200 psig 0-200 psig
0-3,000 psig 0-2,500 psig
0-3,000 psia 0-2,500 psig
0~1,000 psig 0-1,000 psig
0-3,00b psig 0-3,000 psig
D-1,000 psig 0-1,000 psig
Detector
4, lC•O Hz
30 rz
30 rz
4,1GO Hz
4, l ({) Hz
5 Hz
5 Hz
5 Hz
Oat a Oata[a] Fig.
System No. Measurement Comments
1,000 Hz 50 pps
20 lll 113
QEJD to T + 10 sec. Instrument te~peratu?e sensitive after "' T
0 + 10 sec.
l,moo Hz 112 QEUO. 50 pps
50 pps Channel failed (digital).
1,000 Hz Channel failed (digital 50 pps and analog).
1,000 Hz ll3 QEUD toT + 10 sec (digital). 50 pps 114 lnstrumen£ temperature sensi-
tive after "' T + 10 sec. Ch~nnel failed0 (analog).
50 pps QEUD. Not presented. Accumula:or ACC-A injection failed to initiate.
50 pps
50 pps
128 Good data - not qualified. 129 191 298
130 Good data - not qualified. 192 299

TABLE VI (contd.)
Range Freguencl Res~onse PARAMETER Data Data
System Acquisition Uata[a] Fig. Detector Location Detector System Detector System No. i"'·easurement Comments
PRESSURE
Blowdown Suppres- Blowdown header, 35 in. south 0-200 psig 0-200 psig 5 Hz 50 pps 131 QEUD. Initial pressure value sion System of downc.omer 1, 5° from adjusted to 0 psig. Use
PT-Pl38-23 bottom vertical (CCW looking PT-Pl38-56 to obtain the south). initial pressure.
Blowdown Suppres- Blowdown suppression tank top, 0-100 psig 0-100 psig 5 Hz 1 ,C•OO Hz 132 QEUD for imitial conditions sion System 48 in. north of downcomer 1. 50 pps 193 only.
PT-138-55 209 300
"'-J (.11
Blowdown Suppres- Blowdown suppression tank top, 0-100 psig 0-100 psig 5 Hz 1,000 Hz 132 QEUD for initial condition5 sion System 49 in. north of downcomer 2. 50 pps 193 only.
PT-Pl38-56 209
Blowdown Suppres- Spray pump BS-P-83 discharge 0-500 psig 0-500 psig 5 Hz 50 pps 194 QEUD. sion Tank Spray pressure. 302 System
PT-Pl38-136
Blowdown Suppres- Spray system cool down heat 0-500 psig 0-500 psig 5 Hz 50 pps 194 QEUD. sion Tank Spray exchanger outlet pressure. System
PT -Pl38-151
Broken Loop Broken loop cold leg QOBV inlet 0-2,000 psig -2,000 - 5 Hz 1,000 Hz 15 QEUD analog data only.
PT -Pl38-lll between isolation valve and QOBV. +2,000 psig 500 pps 301
Broken Loop Broken loop hot leg QOBV inlet .0-2,000 psig -2,000 - 5 Hz 1 ~000 Hz 16 QEUD analog data only. PT-Pl38-112 between isolation valve and QOBV. +2,000 psig 5CO pps
Intact Loop Intact 1 oop hot leg at venturi 0-3,000 psig 0-3,000 psig 5 Hz 1,000 Hz 133 QEUD except during sub-PT-Pl39-2 on bottom. 5(1 pps cooled blowdown.

TABLE VI (co.ntd. :•
Ringe Freguenc~ Res~:mse
PARAMETER Data Data System Acquisition Jata[a] Fig.
Detector Location Detector System D2tector SJstetl No. Measurement Comments
PRESSURE
Intact loop Intact loop hot leg at verturi 0-3,000 psig 0-3,000 psig 5 Hz l ,'000 Hz 133 QEUD for initial condi-PT-Pl39-3 on left side when looking toward 5C ~ps tions. Uninterpreted data
SG. after T . ' 0
PUMP SPEED
Intact loop Intact loop pump l speed. 0-4,500 rpm 0-10,000 rpm 3.5 Hz 50 ~ps 134 QEUD. RPE-PC-1
'-1 en Intact loop Intact loop pump 2 speed. 0-4,500 rpm 0-10,000 rpm 3.5 Hz 50 ~ps 134 QEUD.
RPE-PC-2 303
TEMPERATURE
Broken loop Broken loop cold leg at on 32-2,300°F 0-600°F 1 .a Hz 50 pps 135 QBUO while instrument immersed. TE-Bl-1 flange. 195 Data display h!Jt wall effects
after ~ T0
+ 53 sec.
Broken loop Broken loop ~ot leg at OTT 32-2,300°F 0-600°F 1.3 Hz 50' pps 135 QEUD while ins~rument immersed. TE-Bl-2 flange. 195 Data display hot wall effects
304 after~ T0
+ 40 sec.
Broken loop Reflood assist bypass syst:m 32-2,300°F 0-600°F l .8 Hz 50 pps 135 QEUO. TE-Bl-3 near CV-Pl38-7l.
Broken loop Broken loop cold leg warm-Jp 32-2,300°F 0-600°F 1.! Hz 50 p:>S 136 Go:>d data -not qualified.
TE-Cl-1 line.
Reactor Vessel Core simulator in instrume1t 32-2,300°F 0-1 ,300°F 1 .& Hz . 50 pJS 137 QEJD while instrument immersed.
TE-CS-1 stalk above orifice plate. 196 Data display hot wall effects after ~ 102 sec.

TABLE VI (confd.}
Range Freguenct Res~onse PARAMETER Data Data
System Acquisition Data[ a] Fig. Detector Location Detector System Detector System No. Measure~nt Comments
PUMP SPEED
Broken Loop Broken loop hot leg warm-up 32-2,300°F 0-600°F 1.8 Hz 50 pps 136 .Good data - not qualified.
TE-HL-2 line.
TEMPERATURE
Intact Loop Intact loop cold leg at OTT 32-2,300°F 0-1 ,300°F 1 .8 Hz 1,000 Hz 138 QEUD while instrument immersed.
TE-PC-1 flange. 50 pps 197 Displays hot wall effects after "' T
0 + 30 sec.
""-J ""-J Intact Loop Intact loop hot leg at OTT 32-2,300"F 0-1 ,300°F 1 .8 Hz 50 138 QEUD while instrument immersed.
' Jps
TE-PC-2 flange. 197 Data display hot wall effec~s after "'T
0 + 135 sec.
Intact Loop Intact loop at SG outlet 32-2,300°F 0-1,300°F 1 .8 Hz 50 pps 138 QEUD ~hile instrument immersed.
TE-PC-3 OTT flange. 197 Displays hct wall effects after "' T
0 + 30 sec.
Emergency Core Accumulator A temperature. 0-200°F 0-200°F ., Hz 50 pps QEUD. Not presented since •
Cooling System accumJlator ACC-A injection
TE-Pl20-41 failej to initiate.
Slowdown Suppres- Slowdown suppression tank bottom, 50-300°F 50-300°F 7 Hz 50 pps 139 Uninterpreted data. Thermo-
sion System 24.0 in. north of downcomer 1 . 305 couple located in a stagnant
TE-Pl38-22 fluid zone.
Slowdown Suppres- Slowdown suppression tank top, 50-400°F 50-400°F 1 .8 Hz 50 pps 140 Good data - not qualified.
sion System 51 in. south of downcomer 4. 306
TE-Pl38-34
.Broken Loop Broken loop cold leg QOBV inlet. 32-1400°F 50-650°F 1 .8 Hz 50 pps .141 Good data -not qualified .
TE-Pl38-62 307

TABLE VI {contd.)
ltange iFreguenct ReSJ.!Onse PARAMETER Data
Oata[a] Data
System Acquisition_ Fig. Detector Location Detector Syste11 Detector System No. Measurement Comments
TEMPERATURE
Broken Loop Broken loop cold leg isolati:m 50-650°F 50-650°F 0.06 Hz 50 pps 141 Good data - not qualified. TE-Pl38-63 valve inlet. 308
Broken Loop Broken loop hot leg isolation 5Q-65Q°F 50-650°F 0.06 Hz 50 pps 142 Good data not qual ifi ed. TE-Pl38-65 valve inlet.
Broken Loop ~roken loop hot leg QOBV inl:t. 32-l4Q0°F 5Q-650°F 1 .a Hz 50 pps 142 Good data - not qualified.
........ TE-Pl38-66 (X)
Slowdown Suppres- Temperature of spray in the 0-400°F 0-400°F 7.Kz 50 pps 199 Good data- not qualified. sion Tank Spray 60 gpm header. 309 System
TE-Pl38-l4l
Slowdown Suppre~- Temperature of spray at spray 0-400°F 0-400°F 7 ftz 50 pps 198 Good data - not qualified. sion Tank Spray pump BS-P-83 discharge. System
TE-Pl38-l42
Slowdown Suppres- Temperature of spray in the 0-400°F 0-400°F 7 ftz 50 pps 199 Gbod data - not qualified. s ion Tank Sp_ray 220 gpm header. System
TE-Pl38-l43
Intact Loop Pressurizer vapor temperature, 600-700°F 600-700°F 7 Hz 5o pps 143 QEUD for initial conditions TE-Pl39-l9 34 in. above the heater rods. on~y. Temperature below
instrument range after 23 sec.
Intact LoGp Pressurizer liquid tempera:ure, 50-7006 F 50-700°F 71-tz 50 pps 143 QEUD for initial conditions
TE-Pl39-20 14 in. above heater rods. 310 oniy.

PARAMETER System
Detector
TEMPERATURE
Intact Loop TE-Pl3g-2g
Intact Loop TE-Pl3g-32
Intact Loop TE-Pl3g-33
Intact Loop TE-SG-1
Intact Loop TE-SG-2
Location
Intact loop cold leg just upstream of OTT flange.
Intact loop hot leg in elbow near venturi.
Intact loop hot leg in elbow· near venturi.
Intact loop cold leg SG outlet.
Intact loop hot leg SG inlet.
Secondary Coolant SG secondary side. System . TE-SG-3
Slowdown suppression tank, 12 in. north of downcomer 1,
Slowdown Suppression System
TE-SV-1 21 in. east of tank E• 107.2 in. from t~nk bottom.
Slowdown Suppres- ·slowdown suppress-ion tank, 12 sion System north of downcomer 1, 21 in.
TE-SV-2 east of tank E,93.0 in. from tank bottom.
in.
Detector
-330 -+l,l30°F
-150 +700
TABLE VI (contd.)
Range Freguency Response Data
Acquisition System Detector
0.06 Hz
0.06 Hz
0.06 Hz
0.35 Hz
0.35 Hz
•).07 Hz
.1.8 Hz
1.8 Hz
Data [Jata[a] F. lg.
System No. MeasurEfllE!nt Corrrnents
50 pps 144 QEUD for initial conditions only.·
1,000 Hz 145 50 pps
1 ,000 Hz 145 50 'PPS
50 pps 146 311
QEUD for i~itial conditions only.
QEUD for initial conditions only.
QEUD for initial conditions only.
50 pps 146 QEUD for initial conditions only.
50 pps
1,000 Hz 50 pps
1,000 Hz 50 pps
1
149 QEUD for initial conditions only.
147 151 200 210
147 152 200 210
QEUD while instrument immers,~d. Designed to measure liquid · temperature.
QEUD while instrument immersed. Designed t) measure liquid temperature.

TABLE VI (cJntd.)
Range Freguencl Res~onse PARAMETER Data
Data[a] Data
Systetl Acquisition Fig. Detector Location Detector System Detecr.or System No. Measurement Comments
TEMPERATURE
Blowdown Suppres- Blowdown suppression tank, 12 in. -150 - 0-400°F l.E Hz 1,000 Hz 147 QEUD while. instrument immersed. sian System north of downcomer 1, 21 in. +700°F 50 pps 153 De;igned to measure liquid
TE-SV-3 east of tank E• 74.7 in. from 200 te11pera ture. tank bottom. 210
Blowdown Suppres- Blowdown suppression tank, 12 in. -150 - .0-400°F 1.E Ht 1,000 Hz 148 QEUD while instrument immersed. sian System north of downcomer 1, 21 in. +700°F 50 pps 154 De·;igned to measure li~uid
TE-SV-4 east of tank E• 57.2 in. from 201 te11perature. (X) tank bottom. 211 0
Blowdown Suppres- Blowdown suppression tank, 12 in. -150- 0-400°F 1 .8 Hz 1,000 Hz 148 QEIDD for digital channel. sion System north of downcomer 1, 21 in. +700°F 50 P~·S 155 Channel failed for analog.
TE-SV-5 east of tank E• 39.0 in. from 201 tank bottom. .
Blowdown Suppres- Blowdown suppression tank, 12 in. -150 0-400°F 1.8 Hz 1 ,OOC· Hz 148 QEUD. sion System north of downcomer 1, 21 in. +700F 50 p~s 156
TE-SV-6 east of tank E• 14.7 in. from 201 tank bottom. 211
312
Blowdown Suppres- Blowdown suppression tank, 12 in. -150 - 0-400°F 1.8 Hz 50 PJ:S 149 QEUD while ·instrument irrmersed. sian System north of downcomer 3, 21 in. +700°F 151 De~.igned to measure 1 iquid
TE-SV-7 east of tank E• 107.2 in. from ,202 teraperature. tank bottom.
Blowdown Suppres- Blowdown suppression tank, 12 in. -150 - 0-400°F 1.8 Hz 50 pps '!49 QELID while instrument immersed. sian System north of downcomer 3, 21 in. +700°F 152 De~igne9 to measure liquid
TE-SV-8 east of tank E• 93.0 in. from :202 teraperature. tank bottom.

TABLE VI (contd.l
Range Freguencl Res~onse PARAMETER Data Data
System Acquisition Data[ a] Fig. Detector Location Detector System Detector System No. Mea-surement Convnents
TEMPERATURE
Slowdown Suppres- Slowdown suppression tank, 12 in. -150- 0-400°F 1 .8 Hz 1,000 Hz 149 QEUD while ir.strument immersed .. sian System rtorth of downcomer 3, 21 in. +700°F 50 pps 153 Designej to ~easure liquid
TE-SV-9 east of tank E• 74,7 in. from 202 temperature. tank bottom.
Slowdown Suppres- Slowdown suppression tank, 12 in. -150- 0-400°F 1.8 Hz l,OOC Hz 150 QEUD while instrument immersed-. ' sian System north of downcomer 3, 21 in. +700°F 50 p~s 154 Designed to measure liquid
co TE-SV-10 east of tank E• 57.2 in. from 203 temperature. tank bottom. . 212
Slowdown Suppres- Slowdown suppression tank, 12 in. -150 - 0-400°F 1 .8 Hz 50 Pr•s 150 QEUD. sian System north of downcomer 3, 21 in. +700°F 155
TE-SV-11 east of tank E• 39.0 in. from 203 tank bottom.
Slowdown Suppres- Slowdown suppression tank, 12 in. -150 - 0-400°F l.B Hz 50 pps 150 QEUD. sian System north of downcomer 3, 21 in. T]00oF 156
TE-SV-12 east of tank E• 14.7 in. from 203 tank bottom. ·
Reactor Vessel Downcomer 1, 189.3 in. from 32-2,300°F 0-1 ,300°F 1.8 Hz 50 pps 157 QEUD. TE-lST-1 RV bottom. 162
Reactor Vessel Downcomer 1., 165.3 in. from 32-2,300°F 0-1 ,300°F 1.8 Hz 50 pps 157 QEUD~
TE-lST-2 RV bottom. 163
Reactor Vessel Downcomer 1, 141.3 in. from 32-2,300°F 0-1 ,300°F 1.8 Hz 50 PJS 157 QEUD. TE-lST-3 RV bottom. 164
Reactor Vessel Downcomer 1, 117.3 in. from 32-2,300°-F 0-1 ,300°F 1 .8 Hz 50 p;JS 157 QEUD. TE-lST-4 RV bottom. 165

TABLE VI (corotd.)
Range Freguenct Res(!onse PARAMETER Data Data
System Acquisition Dita[a: Fig. Detector Location Detector System [•etector System No. Measurement Comments
TEMPERATURE
Reactor Vessel Downcomer 1, 93.3 in. fr011 32-2,300°F 0-1,300°F 1 .8 Hz 50 rpps Qhannel failed (digital). TE-lST-5 RV bottom.
Reactor Vessel Downcomer 1, 69.3 in. fr011 32-2,300°F 0-1,300°F 1.8 Hz 50·JPpS 158 QEUD. TE-lST-6 RV bottom. 166
Reactor Vessel Downcomer 1, 33.3 in. fr011 32-2,300°F O-l,300°F 1.8 Hz 50 pps Olannel failed {digital).
(X) TE-lST-7 RV bottom.
N Reactor Vessel Downcomer 1, 29.3 in. fro11 32-2,300°F 0-1,300°F 1 .8 Hz 50 pps 158 !;t:UD.
TE-lST-8 RV bottom. 168
Reactor Vessel Downcomer 1, 25.3 in. fro11 32-2,300°F O-l,300°F 1 .8 Hz 50 pps 158 !;t:UD. TE-lST-9 RV bottom. 169
Reactor Ves?el Downcomer 1, 21.3 in. fro11 32-2,300°F 0-1 ,300°F 8 Hz 50 pps 158 c;t:Uri. TE-lST-10 RV bottom. 170
Reactor Vesse 1 Downcomer l, 17.3 in. from 32-2,300°F. 0-1,300°F 8 Hz 50 pps 159 QEUD. TE-lST-11 RV bottom. 171
Reactor Vessel Downcomer 1, 13.3 in. from 32-2,300°F 0-1 ,300°F 1 8 Hz 50 pps 159 QEUD. TE-lST-12 RV bottom. li2
Reactor Ves se 1 Downcomer 1 , 9.3-in. from 32-2',300°F 0-1,300°F 1 8 Hz 50 pps 159 QEUD.
TE-lST-13 RV bottom. 173
Reactor Vessel Downcomer l, 45.9·in. from 32-2,300°F 0-1 ,300"F 8 Hz 50 pps 159 QC:UD.
TE-lST-14 RV bottom (inside of OTT). 174
Reactor Vessel Downcomer 2, 189.3 in. from 32,2,300°F 0-1,300"F 8 Hz 1 ,OJO Hz .. C1annel faile~ (digital).
TE-2ST-l RV bottom. 50 CJps

TABLE VI (contd.)
Range Freguenci: Res~onse PARAMETER Data Data
System Acquisition Data[ a] Fig. Detector Locati qr,t Detector System Detector System No. Measurement Comments
TEMPERATURE
Reactor Vessel Downcomer 2, 165,3 in. from 32-2,300°F 0-1,300°F 1.8 Hz 5C pps 160 QEU[). TE-2ST-2 RV bottom. 163
Reactor Vessel Downcomer 2, 141 .3 in. from 32-2,300°F 0-1 ,300°F 1 .8 Hz 1,000 Hz Chame 1 failed (digital). TE-2ST-3 RV bottom. 50 pps
Reactor Vessel Downcomer 2, 117.3 in. from 32-2,300°F 0-1,300°F 1 .8 Hz 50 pps 160 QEUC. TE-2ST-4 RV bottom. 165
00 w Reactor Vessel Downcomer 2, 93.3 in. from 32-2,300°F 0-1,300°F 1 .8 Hz 1,000 Hz Charnel fa i1 ed (digital) ..
TE-2ST-5 RV bottom. 50 pps
Reactor Vessel Downcomer 2, 69.3 in. from 32-2,300°F 0-1 ,300°F 1 .8 Hz 50 pps Channel f3iled (digital). TE-2ST-6 RV bottom.
Reactor Vessel Downcomer 2, 33.3 in. from 32-2,3G0°F 0-1,300°F 1 .8 Hz 1,000 Hz lEO QEUD. TE-2ST-7 RV bottom. 50 pps 167
Reactor Vessel Downcomer 2, 29.3 in. from 32-2,300°F 0-1,300°F 1 .8 Hz 5) pps Charme 1 failed (digital).
TE-2ST-8 RV bottom.
Reactor Vessel Downcomer 2, 25.3 in. from 32-2,300°F 0-1 ,300°F l .8 Hz 1,COO Hz 160 QEUD. TE-2ST-9 RV bottom. 50 pps 169
Reactor Vessel Downcomer 2, 21'.3 in. from 32-2,300°F 0-1,300°F 1.8 Hz 50 pps 161 QEU).
TE-2ST-10 RV bottom. 170
Reactor Vessel Downcomer 2, 17.3 in. from 32-2,300°F 0-1 ,300°F 1 .B Hz 1 ,000 Hz Cha>1nel fa i 1 ed (digital)
TE-2ST -11 RV bottom. 50 pps
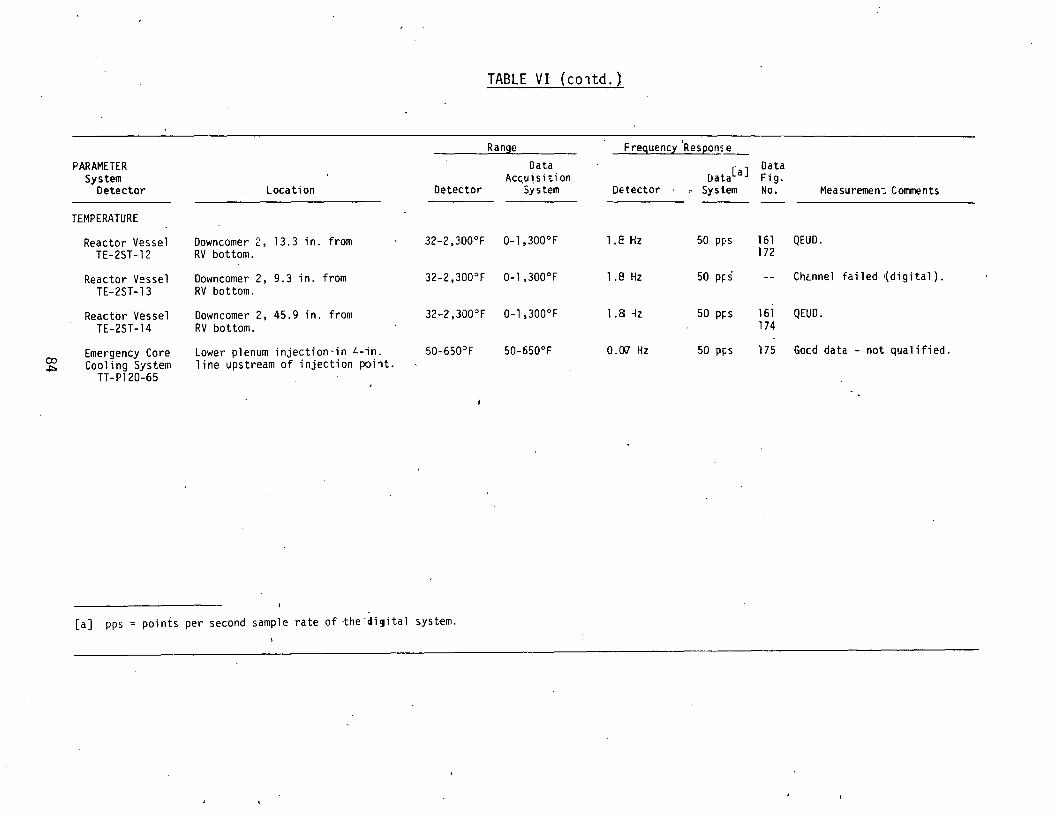
TABLE VI (co1td.)
Range F reguencl 'Res~ons e
PARAMETER Data Uata[a]
Data System Acc.u i. sit ion Fig.
Detector Location Detector System De-tector ' System No. Measuremen-:. Conunents
TEMPERATURE
Reactor Vessel Downcomer 2, 13.3 in. from 32-2,300°F 0-1,300°F l.E Hz 50 P~·S 161 QEUD. TE-2ST-12 RV bottom. 172
Reactor Vessel Downcomer 2, 9. 3 in. from 32-2,300°F O-l,300°F 1.8 Hz 5o p~s Chc.nnel failed (digital). TE-2ST -13 RV bottom.
Reactor Vessel Downcomer 2, 45.9 in. from 32-2,300°F 0-1 ,300°F 1.8 -lz 50 p~s 161 QELID. TE-2ST-14 RV bottom. 174
Emergency Core Lower plenum injection·in ~-in. 50-650~F 50-650°F . O.Ol Hz 50 P!=S i75 Gocd data -not qualified. co Cooling System line upstream of injection poi1t. ~
TT-Pl20-65
[a] pps points per second sample rate of the ·cliCJital ~ystem.

CX> (.]'1
PARAMETER Location
Detectors
DENSITY, AVERAGE
Broken Loop Cold Leg DE-BL-lA (p A) DE-BL-lB (pB) DE-BL-1 C (pC)
Broken Loop Hot Leg D E- B L- 2A ( p A ) DE-BL-2B (pB) DE-BL-2C (pC)
Intact Loop Cold Leg DE-PC-lA (pA) DE-PC-lB (pB) DE-PC-lC (pC)
Intact Loop Hot Leg DE-PC-2A (pA) DE-PC-2B (pB) DE-PC-2C (pC)
Intact Loop Steam Generator Outlet
DE-PC-3A (pA) DE-PC-3B (pB) DE-PC-3C (pC)
TABLE VII
COMPUTED PARAMETERS FOR LOFT TEST Ll-3
Units
1 bm/ft3
1 bm/ft3
1 bm/ft3
1 bm/ft3
Calculation Meth6d
Density, Average P = KlpA + K2pB + K3pC
where: PA' PB' Pc = average den-sity along gamma densitometer beam lines A, B, and C. For stratified flow,
Fig. No.
45
45
p = 0.437pA+0.417p 8+0.146pC. __
For other flow regines, P = o.345pA+0.40lp8=0.254pc.
49
49
Remarks
The individual beam densities were filtered with a 4 Hz filter prior to ~eing used ir the averaging calculation.
Not presented. DE-PC-lA failed.

TABLE VII (contd.~
PARAMETER Location Fig.
Detectors Units Calculation Method No. Remarks
FLOW REGIME AND DENSITY 1 bm/ft3 Homogeneous flow regimes c.re Rapid fluctuation back and indicated by (H) when forth between flow regimes
Broken Loop Cold Leg 1 bm/ft3 PA = PB = Pc· 213 usually indicated slug flow.
DE-BL-lA (p A) The logic table and math-DE-BL-lB (pB) Annular flow regimes are ematical model for this DE-BL-1 C (pC) indicated by (A) w1en regi~e have not yet been
Pc > p B. d~veloped.
Broken Loop Hot Leg 1 bm/ft3 214
DE-BL-2A (p A) Stratified flow regimes are . Broken loop hot leg should 0? DE-BL-2B (pB) indicated by (S) w1en be inverted annular ~ DE-BL-2C (pC) PA > PC' after , ... 24 sec.
Intact Loop Cold Leg 1 bm/ft3 Inverted annular flow regimes Intact loop fOld leg not pre-
DE-PC-lA (pA) are indica ted by (l) wren sented due to failure of DE-PC-DE-PC-lB (pB) PA < PB· lA. DE-PC-1 C (pC)
. Unmodeled flow regimes are Intact Loop Hot Leg
l-bm/ft3 indicated by default (C) 215 Intact loop hot leg should be DE-PC-2A (p A) when none of the above .condi ti o.ns stratified after ~18 sec. DE-PC-2B (pB) are satisfied. DE-PC-2C (pC)
ENTHALPY Btu/1 bm Enthalpy = H = hf + xf~ow hfg Data before T is invalid due to the sa~urated fluid
Broken Loop Cold Leg 216 assumption. PE-BL-1 ( p: hf' hfg) psig:Btullbm
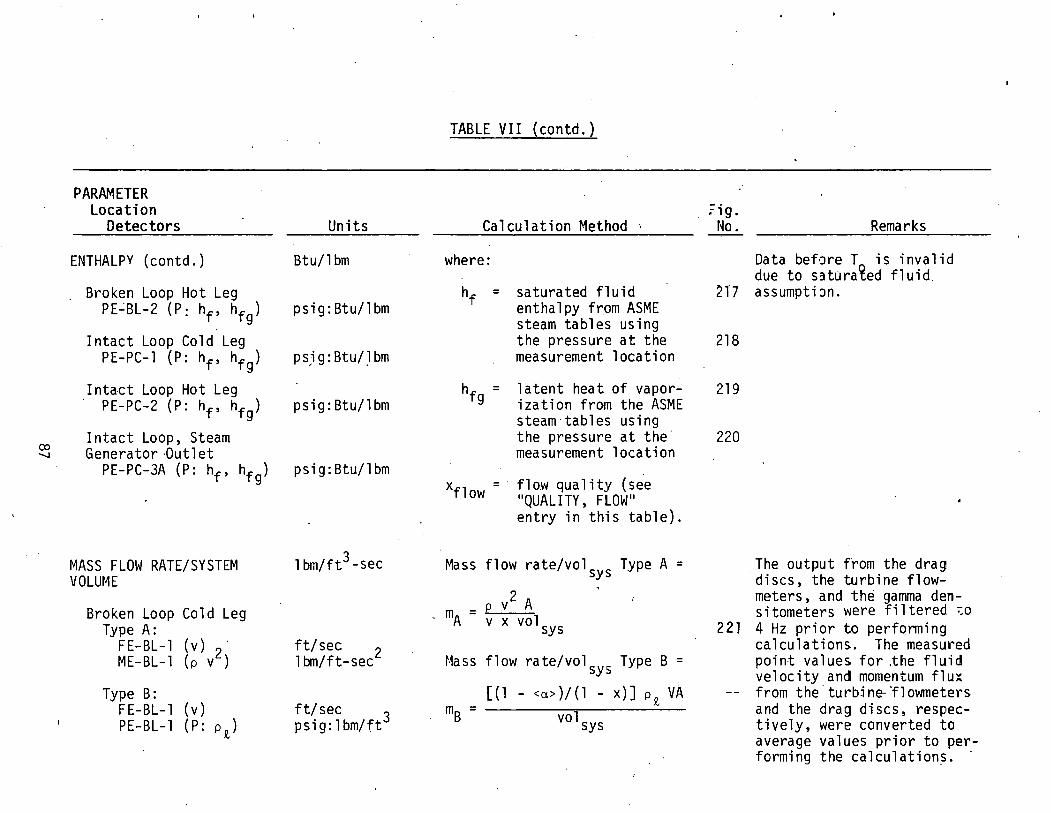
PARAMETER Location
Detectors
ENTHALPY (contd.)
Broken Loop Hot Leg PE~BL-2 (P: hf' hfg)
Intact Loop Cold Leg PE-PC-1 (P: hf' hfg)
Intact Loop Hot Leg
Units
Btu/lbm
psig:Btu/lbm
psi g: Btu/1 bm / .
PE-PC-2 (P: hf' hfg) psig:Btu/lbm
Intact Loop, Steam Generator Outlet
PE-PC-3A (P: hf' hfg) psig:Btu/lbm
MASS FLOW RATE/SYSTEM VOLUt~E
Broken Loop Cold Leg Type A:
FE-BL-1 (v) 2 . ME-BL-1 (p v )
Type B: FE-BL-1 (v) PE-BL-1 {P: p£)
ft/sec 2 1 bm/ft-sec
ft/sec psig:lbm/ft3
TABLE VII (contd.)
Calculation Method '
where:
h = f saturated fluid enthalpy from ASME steam tables using the pressure at the measurement location
= latent heat of vaporization from the ASME steam·tables using the pressure at the· measurement location
xfl ·OW = fl o.w qua 1 ity (see 11 QUALITY' FLOW"
Mass
m = A
entry in this table).
flow rate/volsys Type A =
p v2 A v x volsys
t~ass flow rate/vo\ys Type B =
[(1 - <a>)/(1 - x)] p£ VA m = --------=----~:...._-8 volsys
. ?ig. No.
2T7
218
219
220
Remarks
Data before T is invalid due to s~tura~ed fluid. assumpti :>n.
The output f~om the drag discs, the turbine flowmeters, and the gamma dernsitometers were filtered ~o
2 21 4 Hz prior to perfqrmi ng calculations. The measured point values. for .the fluid velocity and momentum flu~ from the.turbin~rlowmeters and the drag discs, respectively, were converted to average values prior to performing the calculations. ·

00 00
PARAMETER Location
Detectors
MASS FLOW RATE/SYSTEM VOLUME (contd.)
Type C: ME-BL-1 (pi) DE-BL-1 (p)
Type D: · FE-BL-1 {v) DE-BL-1 (p)
Type E: PDE-BL-2 {t~P) DE-BL-1 (p) ·
Broken Loop Hot Leg Type A:
FE~BL-2 ( v) 2 ~1E-Bt"-2 (pv )
Type B: FE-BL-2 (v) PE-BL-2 {P: p£)
Type C: ME-BL-2 (pi) DE-BL-2 (p)
Units
ft/sec 3 1 bm/ft
psid 1 bm/ft3
ft/ sec ·) lbm/ft-!:ec·-
ft/sec psi g: 1 brr./f:3
? 1 bm/ft3sec'-l bm/ft
TABLE VII (contd.)
Calculation Methoj
r1ass flow rate/volsys Type C =
m = [p(pv2)]l/2 h C volsys \
Mass .flow rate/volsys TYpe D =
m = p v A 0 volsys
l1ass flow rate/volsys Tjpe E =
m ='p [(Kt~P)/p]l/ 2 A E vol sys
where:
p = average fluid demsity at measurement location
p = Q,
saturated 1 iquid· density from ASME steam tables ·
/
rto.
2.~2
:223
:224
Remarks
Broken loop co~d leg Type B mass flow rate/system volume not r:resented.
Not presented.
Not presented.

--TABLE VII (contd.)
PARAMETER Location Fig.
Detectors Units Calculation Method No. Remarks
MASS ~LOW RATE/SYSTEM lbm/ft3-sec 2 ! -pV =momentum flux [ME ... ]
VOLUME (contd.) <a> = void fraction (see
Type D: 11 VOID FRACTION 11 entry 226 FE-BL-2 (v) ft/sec 3 in this table) DE-BL-2 (p) lbm/ft
Type E: 227-PDE-BL-1 {l'lP) psid DE-BL-2 (p) · 1 bm/ft3
00 Intact Loop Cold Leg A = flow area for the 1.0 Type A: measurement location 228
FE-PC-1 (v)2 ft/sec 2 ME-PC-1 (pv ) lbm/ft-sec
Type B: 229 FE-PC-1 (v) ft/sec - - 2 -PE-PC-1 (P: pt) psig:lbm/ft3 A . = 0.6485 ft in the
plpes plane of the DTT~ Type C:
lbm/ft~sec 2 K = conversion constant 230 Type C and Type D mass
2 ME-PC-1 (pv ) ' flow rate per- system DE-PC-1 (p) lbm/ft v = velocity of fluid at volume were calculated
measurement location using _DE-PC-lB since Type D: [FE ..... ] 231 DE-PC-lA failed and
FE-PC-1 (v) ft/sec 3 av~rage density co~ld DE-PC-1 (p) 1 bm/ft X = flow quality (see not be calculated.
II QUALITY,_ FLOW" this -Intact Loop Hot Leg tab 1 e).
Type A: Not presented; ME-PC-2 FE-PC-2 (v)2 ft/sec 2 failed. ME-PC-2 (pv· ) 1 bm/ft-sec
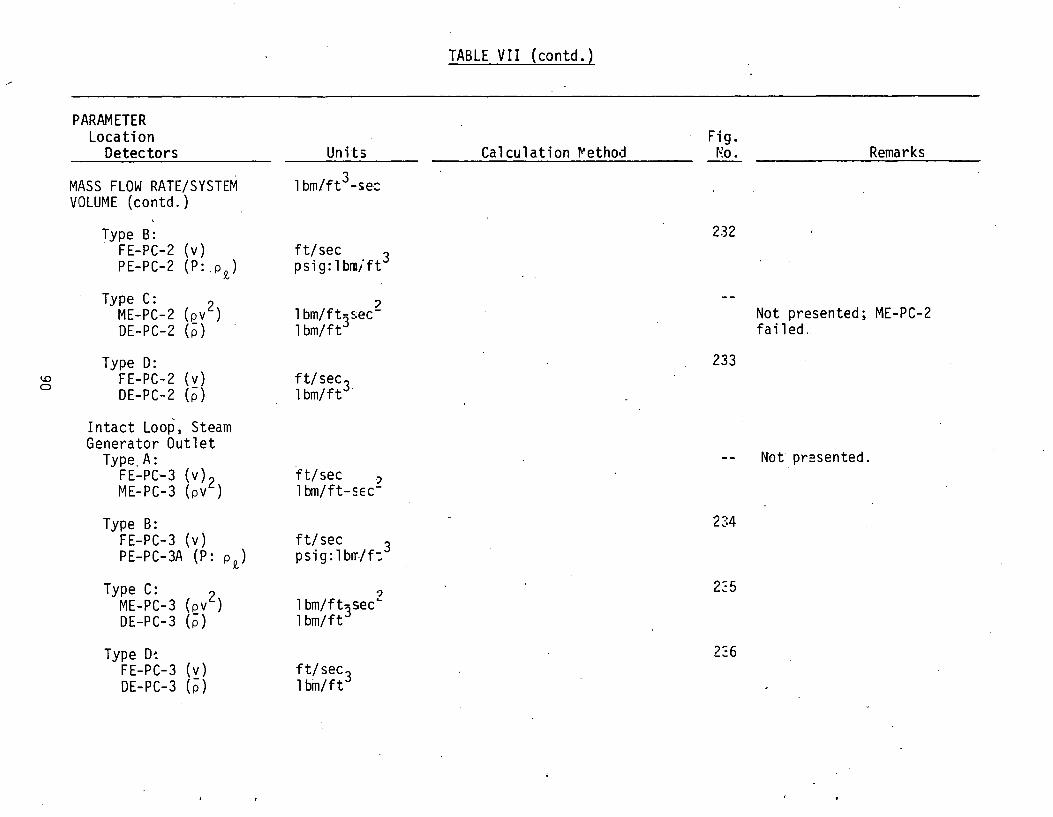
TABLE VII (contd.)
PARAMETER Location Fig.
Detectors Units Calculation ~ethod r~o. Remarks
MASS FLOW RATE/SYSTEM 1 bm/ft3 -sec VOLUME (contd.)
Type B: 2.32 FE-PC-2 (v) ft/sec PE-PC-2 (P: .P_e) psig:lbrD/ft3
Type C: 2 ' ME-PC-2 (pv ) 1 bm/ft3sec- Not presented; ME-PC-2 OE-PC-2 ( p) 1 bm/ft failed.
Type 0: 233 1,() FE-PC-2 (v) ft/sec 3 0
OE-PC-2 (p) 1 bm/ft
Intact Loop, Steam Generator Outlet
Type_ A: Not pr:sented. FE-PC-3 (v)2 ft/sec -')
ME-PC-3 (pv ) 1 bm/ft-sec
Type B: 2~:4
FE-PC-3 (v) ft/sec 3 PE-PC-3A (P: p1
) p s i g : 1 brr/ f:
Type C: 2 ? 2~5
ME-PC-3 (pv ) 1 bm/ftjsec._ OE-PC-3 (p) 1 bm/ft
Type 0-: 2~6
FE-PC-3 ( v) ft/sec 3 OE-PC-3 (p) 1 bm/ft
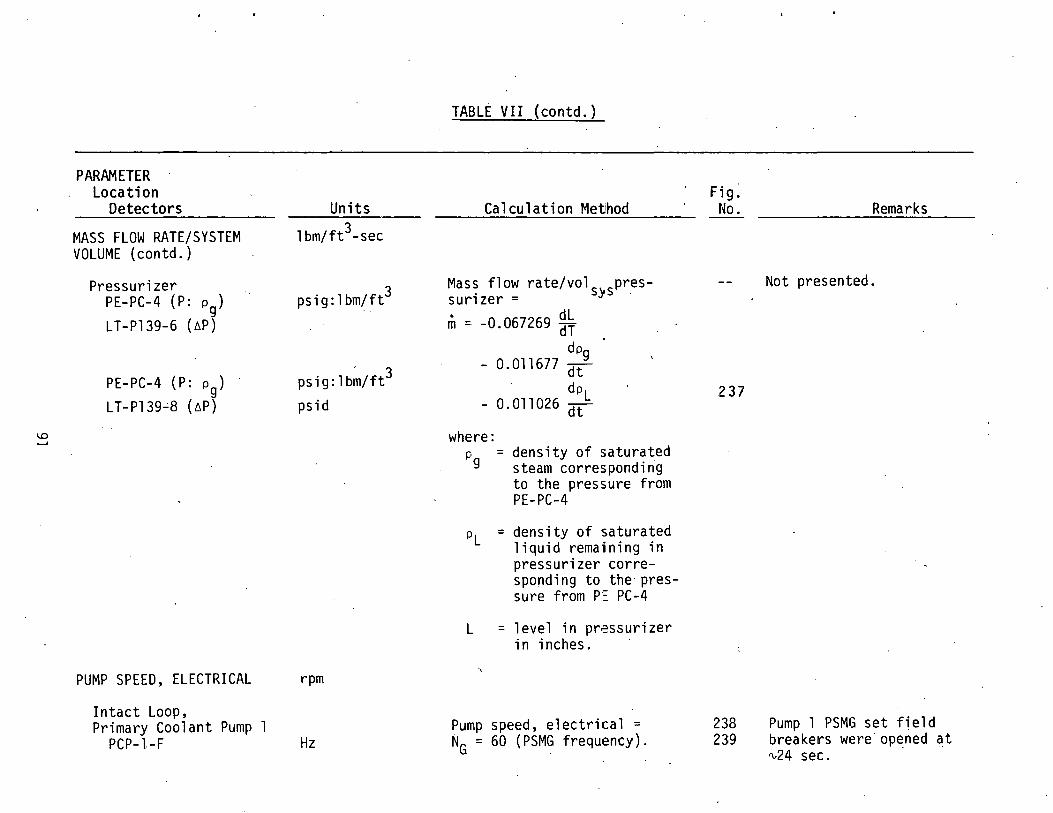
TABLE VII (contd.)
PARAMETER Location Fig:
Detectors Units Calculation Me~hod No. Remarks
MASS FLOW RATE/SYSTEM lbm/ft3-sec VOLUME ( contd. )
Pressurizer psig:lbm/ft3 Mass flow rate/vols pres- Not presented.
PE-PC-4 ( P: Pg) surizer = ys · . dL L T -Pl39-6 {l~P) m = -0.067269 dT
dpg
PE-PC-4 (P: Pg) ' 3 0.011677 crt
psig:lbm/ft dpL 237 LT-Pl39_;8 {t~P) psid 0.011026 crt
1.0 where: p = density of saturated g steam corresponding
to the pressure from PE-PC-4
PL = density of saturated liquid remaining in pressurizer corre-sponding to the pres-sure from P~ PC-4
L = 1 evel in pressurizer in inches.
PUMP SPEED, ELECTRICAL rpm
Intact Loop, Primary Coolant Pump 1 Pump speed, electrical = 238 Pump 1 PSMG set field
PCP-1-F Hz NG = 60 (PSMG frequency). 239 breakers were opened at ·-v24 sec.

1.0 N
PARAMETER Location
Detectors PUMP SPEED, ELECTRICAL rpm (contd.)
Primary Coolant Pump 2 PCP-2-F
PUMP MOTOR SLIP
Intact Loop, Primary Coolant Pump
RPE-PC-1
Primary Coolant Pump 2 RPE-PC-2
PUMP ELECTRICAL HORSEPOWER
Intact Loop, Primary Coolant Pump 1
Hz
None
rpm
rpm
hp
PCP~l-I (I 1) amp
PCP-1-V (V1) V
Primary Coolant Pump 2 PCP-2-I (I 2) amp
PCP-2-V (V2 V
TABLE VII (contd.)
Calculation ~ethod
Pump motor slip =
NG- (RPE-PC-1! -2)
Spurn~ = NG
where: NG = pump speed, electrical
(see "PUMJ SPEED! ELEC~ TRICAL" above).
Pump electrical horse~ower =
p . = 0. 001 3 2 ( V l I l ) ehp1
p· = 0.00132 (V2I2) ehp2
Fig. No.
:238 240
241
242
242
~:emarks
Pump 2 PSMG set field breakers were opened. at "-24 sec.
Pumps 1 and 2 PSMG set field breakers were opened at "-24 sec.

TABLE VII (contd.)
PARAMETER Location Fig.
Detectors Units Calculation Method No. Remarks
PUMP ELECTRICAL HORSE- hp POWER, TOTAL
Intact Loop, Primary Coolant Pump electrical horsepower = 243 Pumps 1 and 2
PCP-1-I (!1) amp p = 0.00132(V1I1 + V2I2) ehptot
PCP-·1-V ( v 1 ) v PCP-2-I (I 2) amp where:
1.0 w PCP-2-V (V2) v I 1, I are the instantaneous
curre~t values as defined in-Column 1
V , V are the instantaneou$ v6lta~e values as defined in Column 1.
PUMP WATER HORSEPOWER hp Pump water horsepower =
Intact Loop,. Pwhp = Ap Vt~P (0.2618) 244 Primary Coolant Pumps and 2 where:
PdE-PC-1 (t~P) psid Ap =_ 0. 6485 ft2
FE-PC-3( V) ft/sec
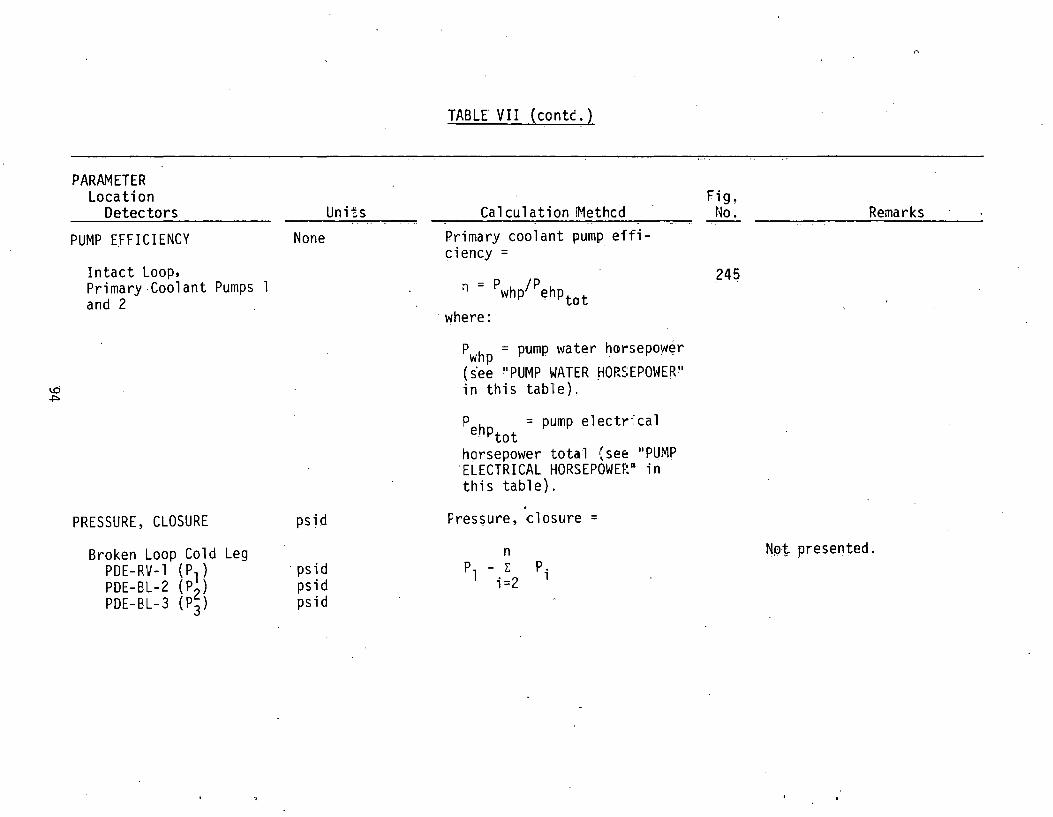
PARAMETER Location
Detectors
PUMP EFFICIENCY
Intact Loop, Primary-Coolant Pumps 1 and 2
PRESSURE, CLOSURE
Broken Loop Cold Leg PDE-RV-1 (P1) PDE-BL-2 ( P 2) PDE-BL-3 ( P 3)
Units
None
psid
· psid psid psid
TABLE VII (cant~.}
Calculation Methcd Primary coolant pump efficiency =
:, = Pwhp/Pehp tot
·where:
Pwhp = pump water horsepow~r (s'ee "PUMP WATER HORSEPOWER" in this table).
P h = pump electr~cal e Ptot
horsepower total {see "PUMP ·ELECTRICAL HORSEPOWERD in this table).
Pressure, closure =
n Pl - E
i=2 P.
1
Remarks
245

TABLE VII (contd.)
PARAMETER Location Fi·~.
Detectors Units Calculation Method No. Remarks
PRESSURE, CLOSURE (contd.)
Broken Loop Hot Leg where: Not presented. POE-RV-1 ( P1) psid P and P. are the PDE-BL-1 ( P ) psid dlfferenfial· pressure POE-BL-4 ( P2) I psid readings for each calcu-POE-BL-5 (P~) psid lation as assigned in POE-BL-6 ( P 5) psid Column 1.
1.0 PDE-BL-7 (P6) psid
<.T1 PDE-BL-8 (P8) psid
Intact Loop 246 PDE-PC-1 ( P1) psid PDE-PC-2 (P2) psid PDE-PC-3 (P3) psid PDE-:PC-4 (P4) psid PDE-PC-S ( P ) psid PDT-Pl39-305(P6) !2-S i d
QUALITY, STATIC None Quality static =
Broken loop Cold Leg xstatic = 1 - [(l-<a>)(p1/~)]
247 PE-BL-1 (P: P1 , Pg) psig:lbm/ft3 where:
<a> = void fraction (see Broken Loop Hot Leg
ps 1 g: 1 bm/ft3 11 VOID FRACTION 11 entry). 248
PE-BL-2 (P: p1
, pg). ·

TABLE VII (contd.)
PARAMETER Location Fig.
Detectors Units Calculation Method No. Remarks
QUALITY, STATIC (contd.) None PQ, = saturated liquid Static ~uality data are re-density from the ASME stricted between values of
Intact Loop Cold Leg psig:lbm/ft3 steam tables us;ng 249 0.0 and 1.0 in the computer
PE-PC-1 (P: pi, Pg) the pressure at :he program. measurement locc:ion
I.ntact Loop Hot Leg psig;lbm/ft3 250 Static quality in the intact
PE-PC-2 (P: pi, pg) p = average density ~rom loop cold leg was calculated gamma densitometer. using DE-PC-lB since DE-PC-lA
Intact Loop, Steam failed and average density Generator Outlet
psi g: 1 bm/ft3 . 251 could nat be calculated.
PE-PC-3A (P: pi, Pg)
1.0 QUAL! TY, FLOW None Qua 1 ity, flow = Flow quality data are restricted 0'1
(Lockhart and Martinelli 1 between values of 0.0 and 1.0 in Correlation) xflow = (1 + N) the computer program.
Broken Loop Cold Leg p-si g: 1 bm/ft3 1/P 1/P 252
PE-BL-1 (P: Pi' Pg) N = {1/A) [(1-<a>)/<c>] TE-BL-1 (T: lli' llg). °F: 1 bm/ft-hr
Broken Loop Hot Leg ( ) -Q/P ( I '-R/P 253 PE-BL-2 (P: p.Q,, pg) psi g : 1 bm/ft 3 Pg/p.Q, lliJllg•
TE-BL-2 (T. ll.Q,' llg) °F: 1 bm/ft-hr \\'here:
Intact Loop Cold Leg 3 254 Flow qua·. i ty was ca 1 cul a ted using PE-PC-1 (P: p.Q,, Pg) psig:lbm/ft <::t.> = void fraction (see DE-PC-lB since DE-PC-lA failed TE-PC-1 (T: ll.Q,' llg) °F: 1 bm/ft-:hr "VOID FRACTI011' e111try) and average dens.-=i ty caul d not
be calcu-ated. Intact Loop Hot Leg
psi g : 1 bm/ ft 3 pl = saturated liquid 255 PE-PC-2 (P: p.Q,, pg) density from the.ASME TE-PC-2 (T. ll.Q,~ llg) °F: 1 bm/ft-hr steam tables u~·ng
the pressure at the measurement location

PARAMETER Location
Detectors Units
QUALITY, FLOW None (Lockhart and Martinelli Correlation) (contd.)
Intact Loop, Steam Generator Outlet
psig:lb~/ft3 PE-PC-3A (P: p~, p ) TE-PC-.3 (T: ~~' ~g) °F: 1 bm/ft-hr g
\.0 ""-~
TEMPERATURE, SATURATION OF
Broken Loop Cold Leg PE-BL-1 psig (TE-BL-1) OF
Broken Loop Hot Leg PE-BL-2 psig (TE-BL-2) OF
"
TABLE VII (contd.)
Fig. Calculation Method No.
Pg = saturated yapor den-sity from the ASME steam tables using the temperature at the measurement location 236
~~ = saturated liquid vis-cosity from tempera-ture
~g = saturated vapor vis-cosity from tempera-ture.
Lockhart and Martinelli Coefficients:
A = 0.28 p = 0.64 Q = 0.36 R = 0.07
Saturat~on temperatures are taken from ASME steam tables for measured pressures. 257. Temperatures are measured by the detectors in parentheses.
258
Remarks
Saturation temperature data are not valid prior toT . TE-BL-1 displays ho~ wal9 effects after ~53 sec.
TE-BL-2 displays hot wall effects after ~40 sec.

0
TABLE VII (contd.)
PARAMETER Location Fig.
Detectors Units Calculation Methcd ·~a. Remarks TEMPERATURE, SATURATION OF (contd.)
Intact Loop Cold Leg 2:39 TE-PC-1 displays hot wall PE-PC-1 psig effects after ~30.sec. (TE-PC-1) OF
' Intact Loop Hot Leg 260 PE-PC-2 psig (TE-PC-2) OF
1.0 Intact Loop, 261 TE-PC-3 displays hot wall co Steam Generator Outlet effects after ~30 sec.
PE-PC-3A psig (TE-PC-3) OF
Reactor Vessel, 262 TE-CS-1 has ~4°F high Core Simulator offset at T
0.
PE-CS-lA psig ( TE-cs=-1) OF
Downc.omer 263 Instrument Stalk
PE-lST-lA psig (TE-lST-9) OF
Down comer 264 Instrument Stalk 2
PE-2ST-1A · psi g (TE-2ST-9) OF

TABLE VII (contd.)
PARAMETER Location F'ig.
Detectors Units Calculation Method rJo. Remarks -
P~, - p
VOID FRACTION None Void fraction = Void fraction data are p - Pg restricted between.the Jl,
Broken Loop Cold Leg 265 values of 0.0 and 1.0 in PE-BL-1 (P: PJI,' Pg) psig the compu:er program. DE-BL-1 (p) 1 bm/ft3 where:
Void fraction for the in-Broken Loop Hot Leg
~
p = saturated liquid den- 256 tact loop cold leg was PE-BL-2 (P: pJI,, pg) psig Jl, s i ty from the .~SME calculated using chordal
1.0 DE-BL-2 (j;) 1 bm/ft3 steam tables u5ing the density measu~·ed by 1.0 pressure at the measure- DE-PC-lB due to the
Intact Loop Cold Leg ment location 267 failure of DE-PC-lA. All PE-PC-1 (P: PJI,' pg) psi g subsequent calculations DE-PC-1 (p) 1 bm/ft3
Pg = saturated vapor density using void fraction at this from the ASME steam location were al5o computed
Intact Loop Hot Leg tables using the pres- 268 using DE-PC-13. PE-PC-2 (P: pJI,, pg) psig sure at the measurement DE-PC-2 (j;) 1 bm/ft3 location
Intact Loop, Steam p = average density from 2.69 Generator Outlet gamma densitometer.
PE-PC-3A (P: pJI,, p ) DE-PC-3 (j;) g
psig 1 bm/ft3

-; '7 .
THIS PAGE
WAS INTENTIONALLY
·. LEFT BLANK

3

1. TEST L1-3 MEASURED PARAMETERS--,
SHORT-TERM PLOTS (1 SECOND OR LESS}
This section of presented data consists of Figures 14 through 42.
101

;= u 0..
:z 8 1-.... ... 0 0..
.... > ~ >
;= u 0..
:z 8 1-.... •n
~ ... > _. < >
100.
.........---8' -.;;;;:
/ /
75. / / /. • PSFT~~8 CV-P138-001 i/
7, ~ PSFTO~~g CV-P138-015 J
50. 7
// '/ .)
-· ,.../~
25. / I "
I J .... I
'1/
o. """"" -/
-25.
-0.02 o.oo 0.02 o.o .. o.oe 0.08 0. 10
TIME AFTER RUPTURE (SEC)
Fig. 14 Valve opening (%) for broken loop QOBV, cold leg valve (CV-Pl38-l), and hot leg valve (CV-Pl38-15).
100. 2500 .
~ -~ / 1 I \ / e PGFTW715 P~~P138-111 2000
\ / o PSFT~It8 CV-PI38-00 -··· ... I <.!)
I I --.
I .PI ..
I
.... "' 0..
60. 1500 "' ~ ., ....
I .• 0:: 0..
iJ 1000
I /\. ........... ..... . I ~ ......... h.. .-. -I ' /_ i -.__..... \........- ...
o. 500
-0.02 o.oo 0.02 o.o .. 0.06 0. 08 . 0. I 0
Fig. 15 TIME AFTER RUPTURE (SEC)
Valve opening (%) for broken loop cold leg QOBV (CV-Pl38-l) and cold leg QOBV inlet pressure ( PT -P138-111).
102

;:: u a.
:z 8 !:: "' 0 a. ...., > .... < :>.
<!l -"' ~ ...., a:: => "' "' ...., a:: a.
100. 2500 -· -- ...,-r........- • PGFTW716 PT-PI38-112 ...._ I D PSFTQ~~g CV-PI38-015
\ p
' I 1/ 2000
f <!l 1\ I
\ I -"' a.
\ J ~ l 50. ....,
1500 a:: =>
"' 1/ "' ...., a:: a. ,
I I 1000
.1
./ L.r"' -- ~ 0. 500
-0.02 o.oo 0.02 o.o~ 0.06 0.08 0: I 0
TIM£ AFTER RUPlURE (SEC)
Fig. 16 Valve opening (%) for broken-loop hot leg QOBV (CV-Pl38-15) and hot leg QOBV inlet pressure (PT-Pl38-112).
noo.
...... rl
2000.
1!500.
1000.
500.
-0.02
Fig. 17
··e 1108Ttel3 P£-BL-001 : o.:"PoeTW'723 PE-8L-OO'f
._... '~A. P08TW'725 PE-&L-008 ~~\
IF ~ ~· IJ v ~
\1 ~ .. hA.. ~ ~£
v LA ~ .. ""\
It\ ~ I'-\. 1 lA ..
... ""'-.
.. J '111\1' ~ . . WIO\ ~ , __
if" • .. Jl' -~ -- ... ........ ~I ._ -~-.,
"" ...... ~ ,
o.oo 0.02 o.o .. o.oe o.oa 0.10 0.12
TIME AFTER RUPTURE (SEC)
Pressure in broken loop cold leg (PE-BL-1, -4, and -8) {filtered to 250Hz).
103

<.!l ~
V> 0..
<.!l ~
V> 0..
2500.
[J
2000.
1500.
1000.
500.
-0.02
\ ~ l ~ -\ UC\ ~ ~ II\ { ~ ::
/
<!I .... V'> c..
w
"" => V'> V'> w
"" c..
<!l .... V'> c..
w
"" => V'>
·~ "" c..
2500.
2000.
1500.
1000.
500.
-0.02
- i\'-~
--
o.oo
• POCT~7 PE-CS-OOIFF a POCT~8 PE-CS-002FF 6 POOTH850 PE-IST-003FF
1'-.. ......... ~ a--..; ... ~ ~
·""''III ~ ~ ~
1 ill.
' ~ -iiiiii;
0.02 O.Oit 0.06 0.08 0. 10 0. 12
TIME AFTER RUPTURE (SEC)
Fig. 20 Pressure in rea~tcr vessel core simulator instrument stalk and downcomer instrument stalk 1 (PE-CS-lFF and -2FF and PE-lST-3FF) (filtered to 258Hz).
ItO.
30.
20.
I 0.
o. -o. 1
Fig. 21
• PGTT0088 PE-5~-001 a PGTTOIOI PE-SV-022 6 PGTT0103 PE-SV-021t 0 PGTT0112 PE-SV-Oitlt
It IN 1\. n all ~
/i' J 1\J
u !I :~ N!' ,_, ~ ul I' -.mJ.
j Jr/QW'!Y '+' I
4 .. I .NOTE: INITIAL SLOWDOWN SUPPRESSION
TANK PRESSURE ADJUSTED TO 0 PSIG, PE-SV-1 FILTERED TO
j 6~ HZ.
I I ... 1 I
o.o 0. I 0.2 0.3 0.'+ 0.5 o.6 o.7 o.e 0.9
TIME AFTER RUPTURE (SEC)
Pressure in blowdown suppression tank bottom, 180° from top vertical reference (PE-SV-1, -22, -24, and -44).
105
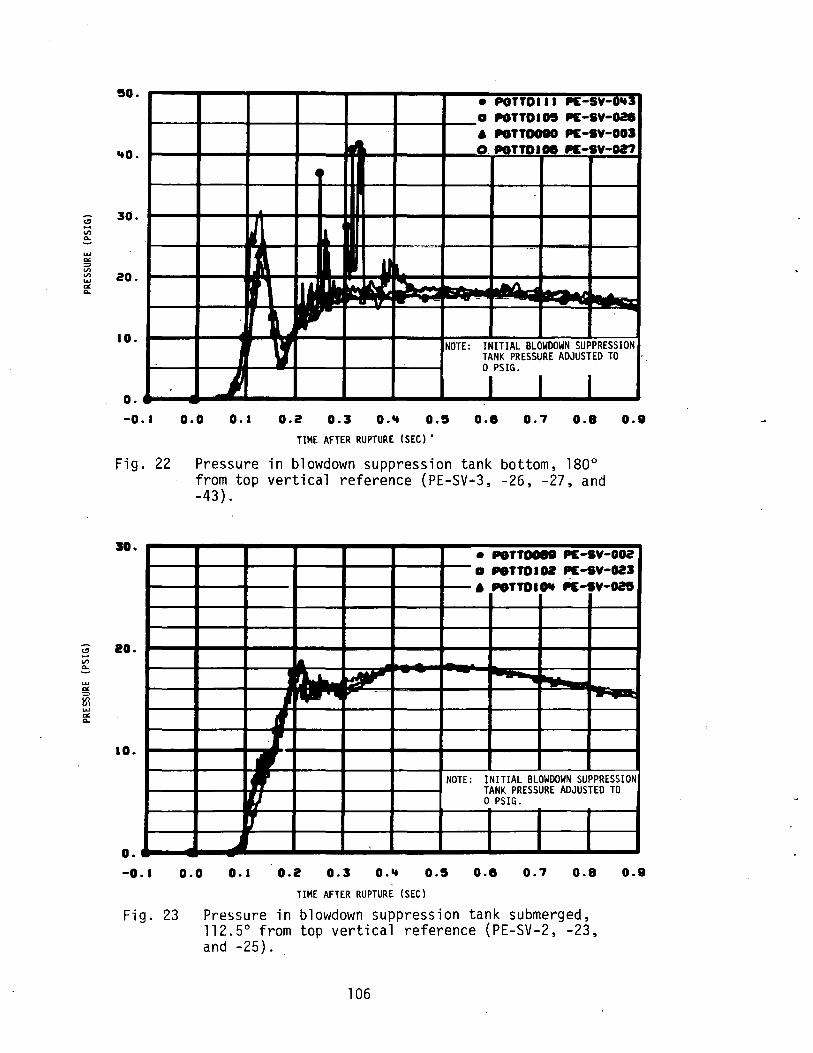
~ -<I) a.
..... "" ::> <I) <I) .... "" a.
<.!) -<I) a.
~ =' ~ .... "" a.
!50.
'tO.
30.
20.
10.
o. -o.a
Fig. 22
so.
20.
10.
o. -o.a
Fig. 23
• POTTDIII PE· .,.. .. ~-a POTTOI05 PE-SV-028 6 PGTTDOIO PE-SV-001 0. -•niiDe- --;,
...
~l g JJl
-~~- .al\ .. ...
fl NOTE: INITIAL BLOWDOWN SUPPRESSION TANK PRESSURE ADJUSTED TO 0 PSIG.
j I I I o.o o. l 0.2 0.3 o ... 0 .!5 o.e 0.7 o.8 o.e
TIME AFTER RUPTURE (SEC) '
Pressure in blowdown suppression tank bottom, 180° from top vertical reference (PE-SV-3, -26, -27, and -43).
o.o
• P8TT0088 ra.·-.,· . .,.,. a P8TTOI02 PE-sY-021 • !'"V••utllt ~-sv-on
& ,... ~ -- ...
..d
t NOTE: INITIAL BLOWDOWN SUPPRESSION
rJ TANK PRESSURE ADJUSTED TO 0 PSIG .
...t
0. I 0.2 0.3 O.'t 0.!5 o.e 0.7 0.8 0.9
TIME AFTER RUPTURE (SEC)
Pressure in blowdown suppression tank submerged, 112.5° from top vertical reference (PE-SV-2, -23, and -25).
106
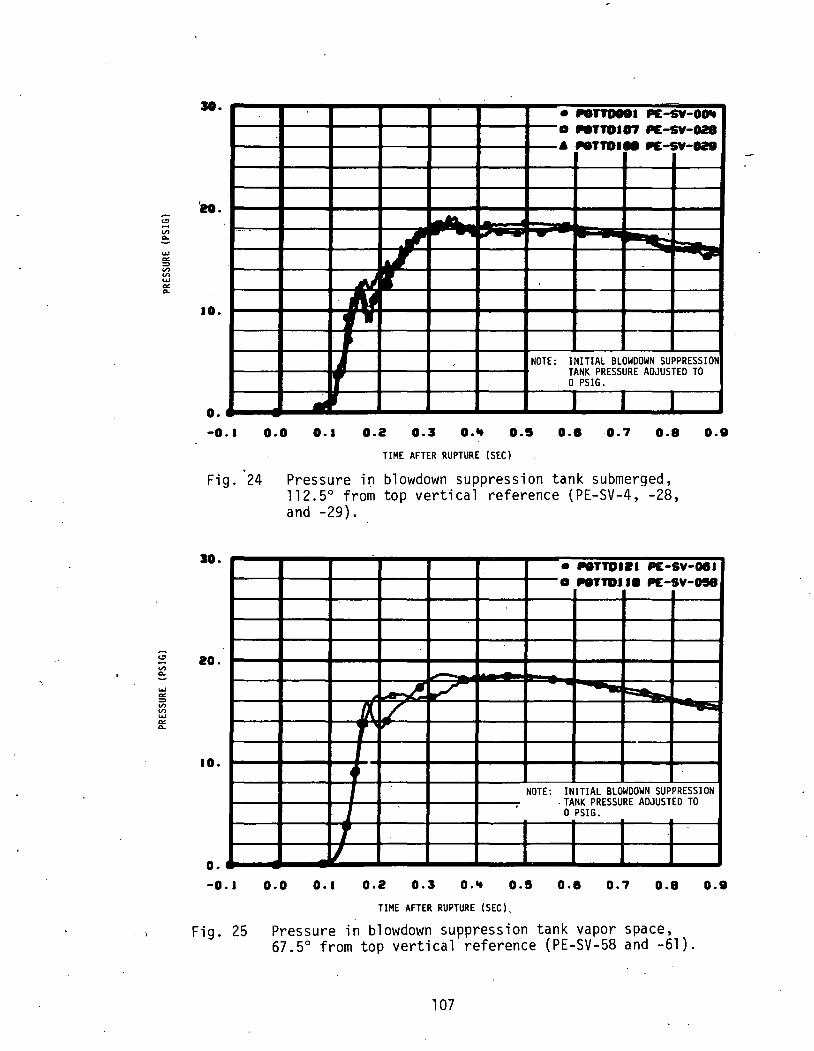
~ -"' ~ "" "" =>
"' V'l
"" "" Q.
<.!1 -"' Q.
"" "" =>
"' V'l L.o,J
"" Q.
••
2o.
10.
o. -0.1
. -
~ r -o.o o.a
·,
• Nnoo81 PE-SY-OOit D NTTDI07 PE-SY-028 A NTTDI- P£-SY-0211
.....M..
"J' .... ,. ~-..._ - ~
, .....
NOTE: INITIAL SLOWDOWN SUPPRESSION TANK PRESSURE ADJUSTED TO 0 PSIG.
0.2 o.s o ... o.s o.e o . ., o.a 0.8
TIME AFTER RUPTURE (SEC)
Fig. 24 Pressure in blowdown suppression tank submerged, 112.5° from top vertical reference (PE-SV-4, -28, and -29).
JO.
20.
10.
o. -o.a
Fig. 25
• NTTDI21 PE-SY-081 D NTTDII8 PE-SY-058
-~ V"
fA 1/ --NOTE: INITIAL SLOWDOWN SUPPRESSION
- TANK PRESSURE ADJUSTED TO 1 0 PSIG.
1 /
o.o 0. I 0.2 0.3 o ... 0.5 o.e 0.7 o.a o.e TIME AFTER RUPTURE (SEC),
Pressure in blowdown suppression tank vapor space, 67.5° from top vertical reference (PE-SV-58 and -61).
107

<!I -V') 0..
w
"" :::> L'l V') .... "" 0..
<!I -V') 0..
w
"" :;;, V') ,,., .... "" ~
so.
n.
10.
o. -o. 1 o.o
.
j , 17
0. I
~ ~ ~
I r
0.2 o.:s o ... TIME AFTER RUPTURE (SEC)
• P8TTDI17 P£-SY-057 a ~T!DII8 PE-SY~058
....... ..... ~
--
NOTE: INITIAL SLOWDOWN SUPPRESSION -TANK PRESSURE ADJUSTED TO 0 PSIG.
o.e 0.1 0.8 n.R
Fig. 26 Pressure in blowdown suppression tank vapor space. 45° from top vertical reference (PE-SV-57 and -59).
10. • POTT0118 P£-SY-085
------ a POTTD018 PE•SY-017 6 POTTOIIO PE·SY-080
20. ... r_ -- r\.... ~
I ~A ~ --
II. 7 --- IJ ~ -,________
10.
J 1 NOTE: INITIAL SLOWDOWN SUPPRESSION
17 TANK PRESSURE ADJUSTED TO -0 PSIG.
o. -0.1 o.o O. I 0.2 0.3 O.'t 0.5 o.e 0.7 o.a 0.8
Fig. 27
TIME AFTER RUPTURE (SEC)
Pressure in blowdown suppression tank top, oo from top vertical reference (PE-SV-17, -55, and -60).
108
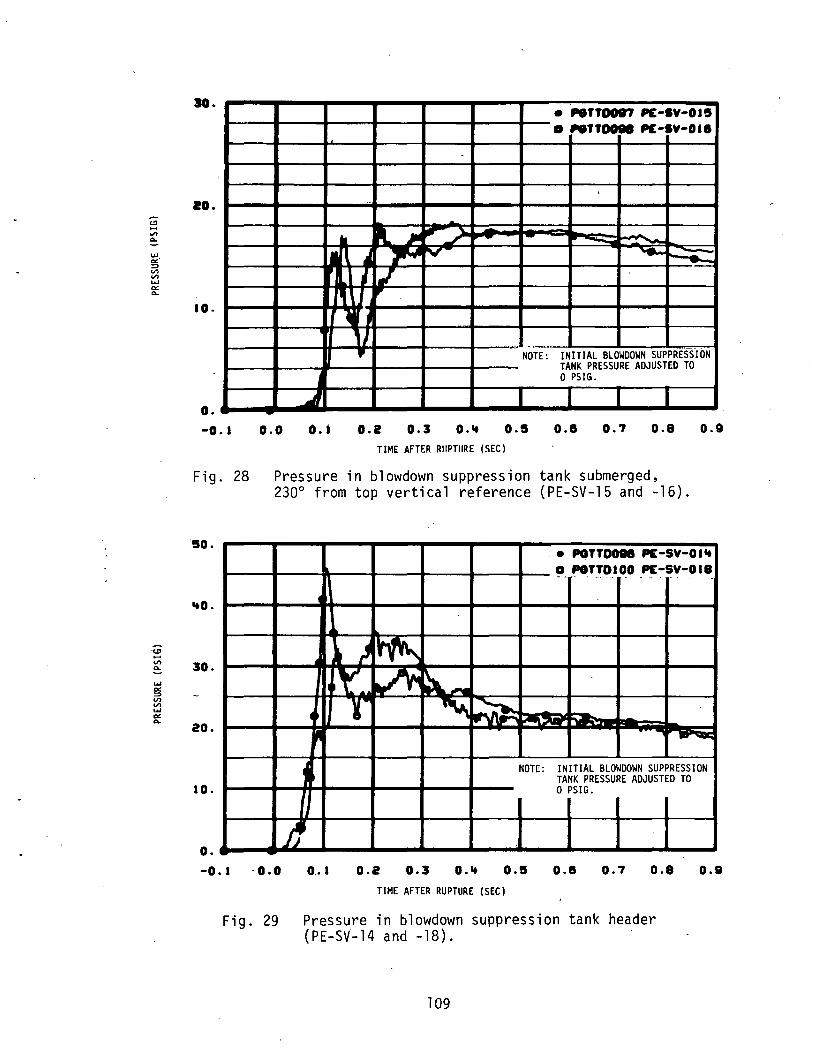
~ -11'1 ~
..... a:' => V> V> ..... "" ~
-t,O -V> ~
..... "" => V> V> ... "" ~
30.
za.
10.
o. -0.1 o.o
.. 1111 ! ~
~
0 .•
--
.._
ll ~ ,..-_;- -J. -,..... .... -r.J ,.
' 1/ •
0.2 0.3 o ... TIME AFTE~. IIIIPTIIRE (SEC)
• P8TT0087 PE-SV-015 a P8TT0081 P£-SV-018
'
- ........ ~ ~ -
_.,. •••-n•••
NOTE: INITIAL BLOWDOWN SUPPRESSION TANK PRESSURE ADJUSTED TO 0 PSIG.
0.5 o.e 0.7 o.a 0.9
Fig. 28 Pressure in blowdown suppression tank submerged, 230° from top vertical reference (PE-SV-15 and -16).
50.
'tO.
30.
20.
10.
A o. -o. 1 · o. o
Fig. 29
. • POTTOHe PE-SV-OI't a PGTTOIOO PE-SV-018 -- . . -··.- - ... -.
~ " I~ ~- ~ ~ 4
-x.., " ~ - ~ .~
...-..::;
NOTE: INITIAL BLOWDOWN SUPPRESSION TANK PRESSURE ADJUSTED TO 0 PSIG.
0 .. I 0.2 0.3 o ... 0.5 o.e 0.7 o.a 0.11
TIME AFTER RUPTURE (SEC)
Pressure in blowdown suppression tank header (PE-SV-14 and -18).
109
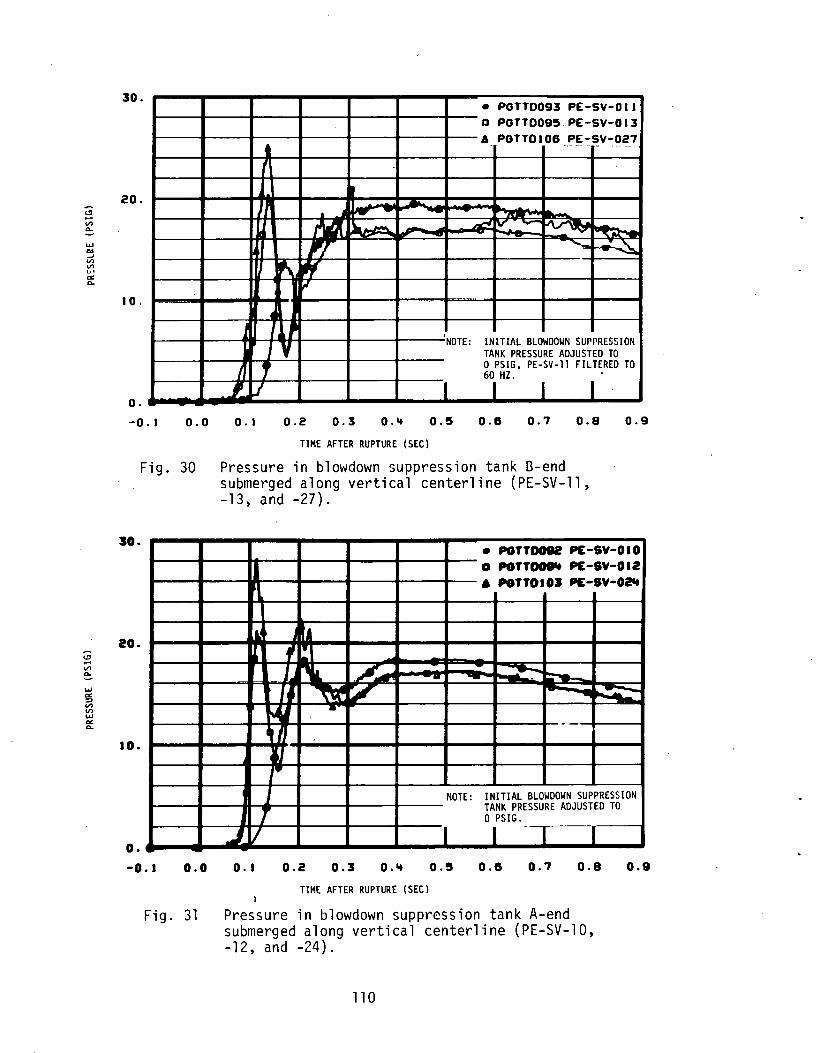
~ -<1'1 0..
..... ... ;;.., <1'1 <1'1 1...•! a: 0..
~ -<1'1 ~
..... a: :::> <1'1 <1'1 ..... a: 0..
30. • POTT0093 PE-SV-011
~----1r-----+------~------~------+-------~--D POTT0095 PE-SV-013
~----1r-----+----t---~----11------+------~- 6 POTTO I 06 --~~ -SV-:()2_7
20.
~ .... ~-
I J J-----1r-----fiiH,_.,vt+------+------+----____;' NOTE: INITIAL SLOWDOWN SUPPRESS I ON J TANK PRESSURE ADJUSTED TO
j r 0 PSIG, PE-SV-11 FILTERED TO
_,_ .I 601HZ. I I 0 ..... ~~ .. ~--~----~--~----L---~--~~--~--~ -o. 1 o.o
Fig. 30
JO.
20.
10.
o. -0.1 o.o
Fig. 31
0. I 0.2 0.3 0.1+ 0.5 0.6 0.7 u.s
TIME AFTER RUPTURE (SEC)
Pressure in blowdown suppression tank B-end submerged along vertical centerline (PE-SV-11, -13, and -27).
0.9
• POTT0012 P£-SV-010 D POTT~ P£-SV-012 6 POTTOIOJ P£-SV-0~
.1.1 JIA I , l!'
J.J ~ l L .. -- :---~ I ~ i./ -
~ - -
J NOTE: INITIAL SLOWDOWN SUPPRESSION
7 TANK PRESSURE ADJUSTED TO 0 PSIG.
---:17 .I I -
0. I 0.2 0.3 0.1+ 0.5 o.e 0.7 0.8 0.9
TIME AFTER RUPTURE (SEC) )
Pressure in blowdown suppression tank A-end submerged along vertical centerline (PE-SV-10, -12, and -24).
110

~ -"' ~ w
"' => "' "' w
"' 0..
~ -"' 0..
w "' => "' "' w "' Q.
'+0.
30.
20.
I 0.
o. -o. 1 o.o
Fig. 32
sa.
n~
a a.
a. -a.a a.a
Fig. ·33
- -
• PGTT0088 PE-SV-001 D PGTT0088 PE-SV-002 6 PGTTOIIS PE-SV-058
I 1\. ., ~ ,.
I
J I. ' J .. na..~. DA a A ~ n..,awr1 .... ~ ••AA'- ~~
A V' - yw ... \,J
II' 4 ., NOTE: INITIAL SLOWDOWN SUPPRESSION
TANK PRESSURE ADJUSTED TO 1..,. 0 PSIG, PE-SV-1 FILTERED TO
I I 60 HZ. . .
..Ill. I/ I I I I
0. I 0.2 0.3 0.'+ 0.5 o.e 0.7 o.a 0.9
TIME AFTER RUPTURE (SEC)
Pressure _in blowdown suppression tank in a transverse plane, 316.5 in. from B-end reference (PE-SV-1, -2, and -58).
• NTTDII7 IP£-sY-0117 a NTTDII8 IP£-s¥-08 A NTTDOe'7 IP£-s¥-015
II
~ r• ~ -- 1-
~ ~_/ -- --- ~ ...__ I& --......., ... ~ ---'1
1
J NOTE: INITIAL SLOWDOWN SUPPRESSION , TANK PRESSURE ADJUSTED TO 0 PSIG.
....1 I
a. a 0.2 0.3 o ... 0.5 o.e 0.7 o.a o.a TIME AFTER RUPTURE (SEC)
Pressure in blowdown suppression tank in a transverse plane, 316.5 in. from B-end reference (PE-SV-15, -55, and -57).
111

<.!) .... V'l 0..
......
"" ::> V'l V'l ...... "' 0..
<.!) .... V'l e; LLI
"" :::::> V'l V'l ......
"' Q.
JO.
20.
10.
o. -o. 1 o.o
rig. 34
JO.
20.
10.
o. -o. 1 o.o
Fig. 35
• NTTDIOI P£-SV-022 D NTT0102 P£-SV-023
' t .. l~
......,. ~ - ...__ ....
·y ._ ~ .... - ...._
r I
~ r 7 NOlE: INITIAL SLOWDOWN SUPPRESSION
1 TANK PRESSURE ADJUSTED TO 0 PSIG.
_.1.
0. I 0.2 0.3 o ... 0.5 o.e 0.7 o.a 0.9
TIME AFTER RUPTURE (SEC)
Pressure in blowdown suppression tank in a transverse plane, 263 in. from B-end reference (PE-SV-22 and -23).
• P8TTDII8 P£-SV-058 D PeT~ P£-SV-017
_..J ,.... ,..
~
I --, J NOTE: INITIA,L SLOWDOWN SUPPRESSION
T TANK PRESSURE ADJUSTED TO 0 PSIG.
iJ I I I O. I 0.2 0.3 o ... o.s o.e 0.7 0.8 o.sa
TIME AFTER RUPTURE (SEC)
Pressure in blowdown suppression tank in a transverse plane, 263 in. from B-end reference (PE-SV-17 and -59).
112
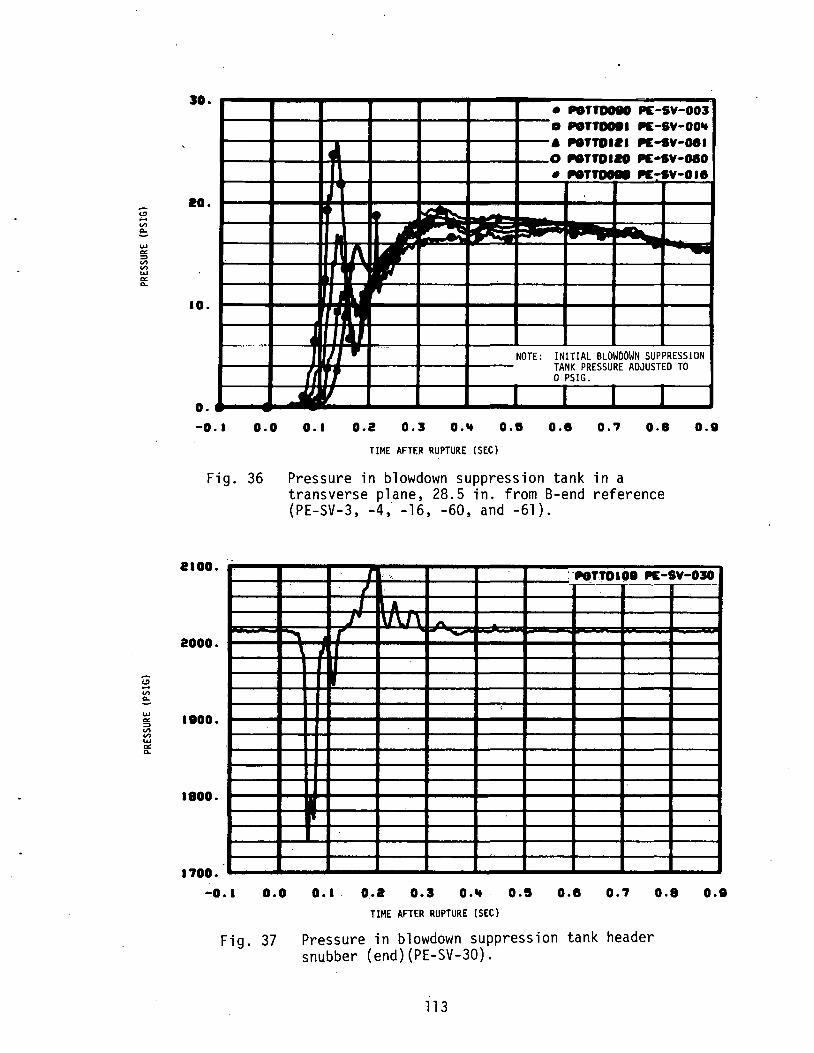
(.!' -V)
~ .... "' ~ V) V) .... "' 0..
30.
-... --
o. -o. 1 o.o
Fig. 36
2100.
2000.
1800.
1800.
1'700.
-0.1 o.o
Fig. 37
• P8fnDOIO P£-SV-003 D P8ff0081 P£-SV-OOit a NJTDaaa P£-sv-oel "' Nff0120 PE•SV-080 • PWTTUII-- ~~ :1e
~ I....~
II - ....,_. ,. r 1\ .....
' ~ H4 lJ
'j • NOTE: INITIAL BLOWDOWN SUPPRESSiON
l ., TANK PRESSURE ADJUSTED TO 0 PSIG. --0. I 0.2 0.3 o ... o.e 0.7 o.a
TIME AFTE_R RUPTURE (SEC)
Pressure in blowdown suppression tank in a transverse plane, 28.5 in. from B-end reference (PE-SV-3, -4,· -16, -60, and -61).
o.e
r : ··: : 'P8TTOI08 P£-SV-030
""
I ... .. --
I l J• \1\.1\ - .
r I'"' -I
'
0.1 o.a o.3 o ... 0.5 o.e 0.7
TIME AFTER RUPTURE (SEC)
Pressure in blowdown suppression tank header snubber (end)(PE-SV-30).
113
o.a o.e
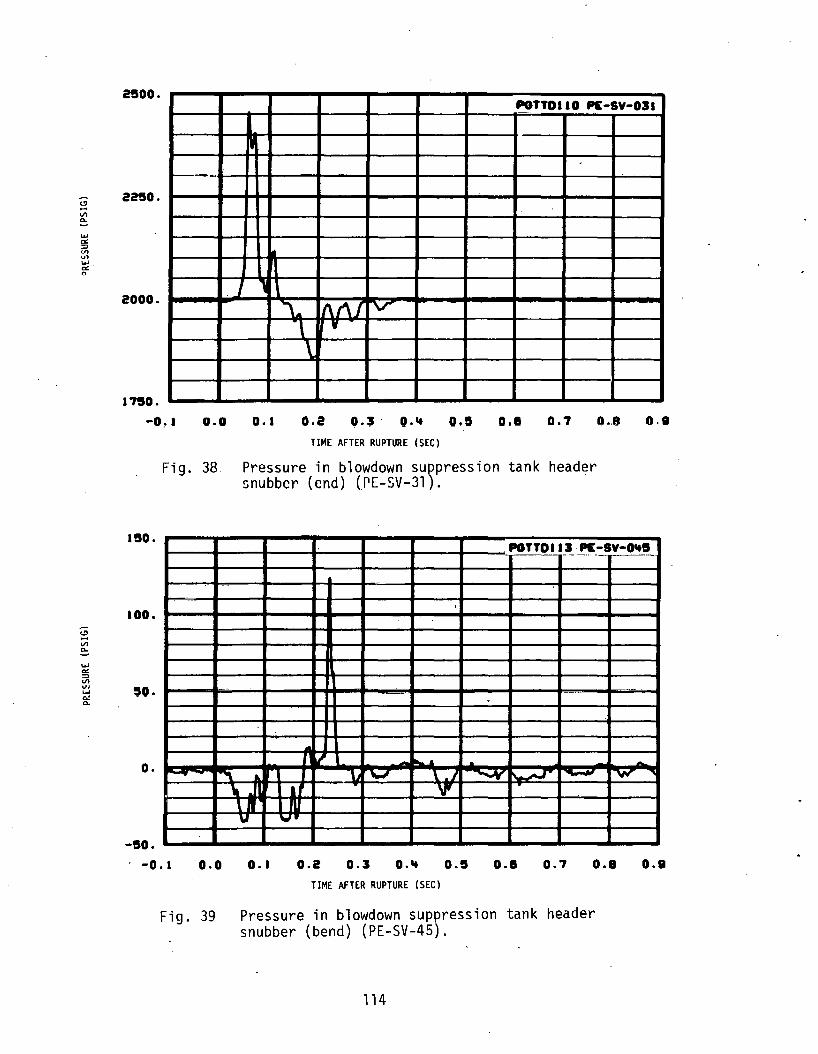
"" a: :::>
'·" "' "" a:· n
~ .... V>
~
"" a: :::> V> VI ..... "" 0..
2500. POTTDIIO PE-SY-OJI
~
---2250.
2000. . 1 ,
\ .. 1\t\J -v-
1 v
\
1750.
-o, a o.o o.a 0.2 o.~ · Q.~ o.e o.e o.7 o~e o.e TIME AFTER RUPTURE (SEC)
Fig. 38
I !SO.
100.
,o .
o. .....
-so .
Pressure in blowdown suppression tank header snubber (end) (rE-SV-31).
POTTDIIJ PE-SY-a-5 ---·- -·-·
'
-·---· -
v .. . ... ~ ... "\ .""" \ I ~ ~ ~ "W """ • n I V'
\ll m v rJiTT
. -0.1 o.o 0.1 0.2 o.J O-~ o.s o.e o.7 o.e o.e TIME AFTER RUPTURE (SEC)
Fig. 39 Pressure in blowdown suppression tank header snubber (bend) (PE-SV-45).
114
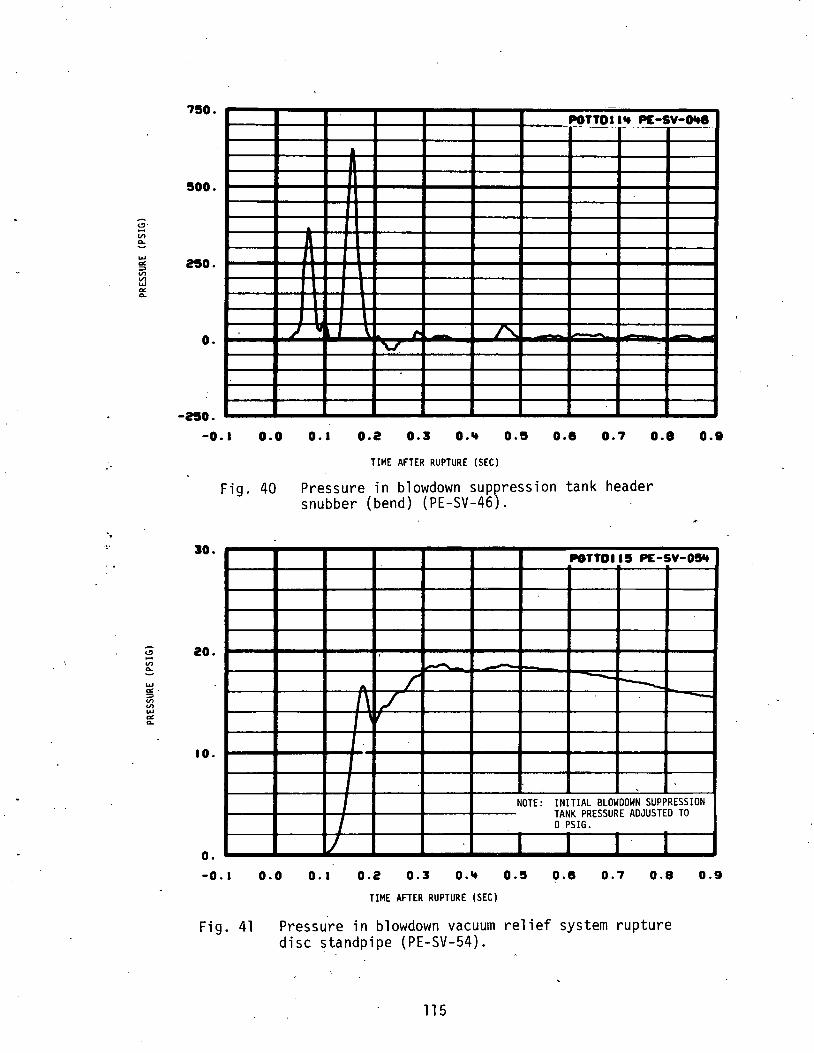
<!>· -VI 0..
.... "" ::> VI
~ "" 0..
~ -"' 0..
.... "". ::>
"' "' .... "" 0..
'750. POTTDIIIt P£-SV-Oite . - .. -·
500.
250.
o. J I I" ~ -'\..I' -
-no. -o. 1 o.o 0. I 0.2 0.3 o ... 0.5 o.e 0.7 0.8 0.1
TIME AFTER RUPTURE (SEC)
Fig. 40 Pressure in blowdown suppression tank header snubber (bend) (PE-SV-46).
30.
20.
10.
o. -o. 1
Fig. 41
POTTDII5 PE-SV-051t
' .-
A / ---r---1\ / -
'
J NOTE: INITIAL BLOWDOWN SUPPRESSION TANK PRESSURE ADJUSTED TO
I 0 PSIG.
J
o.o 0. I 0.2 0.3 o ... 0.!5 o.e 0.'7 o.a 0.9
TIME AFTER RUPTURE (SEC)
Pressure in blowdown vacuum relief system rupture disc ~tandpipe (PE-SV-54).
115

<.!> ..... "' Q.
.... "" ~ "' "' ...... 0! "-
.: NTtDIU -PE~SV-070
~ 1\ 7 ~
50. 7 " l I \. ..
T '\.. I"\_
--~ - .... ---~
25. -·--
r;r .....
o. -o. • o.o o.a 0.2 o.:s o... ·o.s o.e - o.7 o.a o.a
Fig. 42
TIME AFTER RUPTURE (SEC)
Pressure in bellows between broken loop and blowdown suppression tank header (PE-SV-70).
116
(

'
,

2. TEST L1-3 MEASURED PARAMETERS -
MEDIUM - TERM PLOTS (-10 TO 70 SECONDS)
This section of presented data consists of Figures 43 through 175.
117

.., : 1-"-..... ::E .., _, >-1--Vl ., ..... 0 _, < 0
"' 0 ::z:: '-'
.., i<
t-"-..... :E .. _,
>-1-
Vl a 0 _, < 0 a: 0 ::z:: u
!50.0
ltO.O
"" ~~lt • DEBFO'OOI DE-BL-OOIA
-a DEBF'D002 DE-BL-0018 • DEBFD003 DE-BL-OOIC
-30.0
20.0
10.0
o.o
f\ ;: .. Ia.. - ,. --- -
-ao.o o.o 10.0 20.0 :so.o ltO.O !50.0 10.0 70.0
Tli~E AFTER RUPTURE (SEC)
Fig. 43 Density in broken loop cold leg, chordal density (DE~BL-lA, -lB, and -lC) (filtered to 4Hz).
!50.0 • DEIFOOOit DE-BL-002A
'tO.O
.A - • a DEBF000!5 DE-BL-0028 ~ JJ A DEBFOOOI DE-BL-002C
30.0 \
20.0 -~ ~ ...
~ l Vi - .. 10.0 ~ _a
~ A'l , .L.. ,.. ._ "¥ -o.o
J
-10.0 o.o 10.0 20.0 30.0 ltO.O !50.0 ao.o 70.0
TIME AFTER RUPTURE (SEC)
Fig. 44 Density in broken loop hot leg, chordal density (DE-BL-2A, -2B, and -2C} (filtered to 4Hz).
118

"" : 1-LL ...... "" = >-~ VI :z ...., 0
...., <.!) c(
"" ...., > c(
"" .. .. 1-LL ...... ::E
"" = >-1-
~· ...., 0
-' c( 0 'o< 0 X u
"o.o
... o.o
~ • OOBCOOOI DE-IL-001 ._.
~ a OOBCD002 OE-IL-002
~ 411
, ~
1\ It!
30.0 ... \
20.0 ·\ ~ .
~1, k.
10.0
. ·l ~ . ~ A ~ ~
o.o
-10.0 o.o 10.0 20.0 30.0 ltO.O 150.0 eo.o 70.0
TIME AFTER RUPTURE (SEC)
Fig. 45 Density in broken loop, average fluid densities (DE-BL-1 and -2) (filtered to 4Hz) .
. 50 .o
ltO.O
--$t • OEPF0008 OE-PC-0018 a OEPFD008 OE-PC-OOIC r\
l
' 30.0
20.0
10.0 ... ,&, '
r\Jfi o.o "
.a.. •• 1. r- .... r--
-10.0 o.o 10.0 20.0 30.0 ltO.O !50.0 eo.o 70.0
TIME AFTER RUPTURE (SEC)
Fig. 46 Density in intact loop cold leg, chordal density (DE-PC-lB and -lC) (filtered to 4Hz).
. 119

..,
... ... ...... .... ....... :E co --'
>-t: "' :z .... • --' < 0
"" 0 ::r: u
M ... ... ...... .... ....... ::E co --'
>-!::::; •n -.... 0
.....i < 0
"" 0 ::r: u
50.0 ' . . ...ll • OEPFOOIO OE-PC-002A ...... ~ a DEPFOOII DE-PC-0028
'+0.0 6 OEPFOOI2 DE-PC-002C
30.0
ao.o I ~ I .I ·•\
10.0 ~
.~. ~ .... .J If\ - J ~ ~ L -- ~ .. -o.o
-lo.o o.o ao.o 20.0 30.0 '+0.0 50.0 eo.o 70.0
TTMf. AFTER RUPTURE (SEC)
Fig. 47 Density in intact loop hot leg, chordal density (DE-PC-2A. -26, and -2C:) (filtered to 4Hz).
50.0 _....... • DEPFOOI3 DE-PC-003A
'+0.0
-.., ,.,., .. l a OEPFOOI'+ DE-PC-0038 1\ 6 OEPFOOI5 DE-PC-OOSC
~ ,
30.0
20.0
-
10.0 ... ~ ~ ....
~ o.o ...
-10.0 o.o 10.0 20.0 30.0 '+0.0 50.0 eo.o 70.0
TIME AFTER RUPTURE (SEC)
Fig. 48 Density in intact loop at steam ge.nerator outlet, chordal density (DE-PC-3A, -3B, and -3C) (filtered to 4 Hz). ·
120

;:;; i<
"' 1-... ..... a> :::! >-~ V'> :z .... c:> .... <..!> ·ce
"" ... > <
~
u .... V'>
~ ... ~
~ -u 0 .... .... >
50.0 I.. •• OOPCOOIO OE-PC-002
ltO.O
- lrlla. a OOPCOOI3 OE-PC-003
1\ <
'1
30.0
20.0
10.0 \. ~ ... J ~
o.o llr ~ I
.., ~ ~ ~
-10.0
o.o 10.0 20.0 30.0 ltO.O !50.0 eo.o 70.0 TIME AFTER RUPTURE (SEC)
Fig. 49 Density in intact loop, average fluid densities (DE-PC-2 and -3) (filtered to 4 Hz).
150.0 VE8K01t51 .FE-BL-001
__.JI ~V\r ~ ~to.. _}_ )j V\
100.0 If I A'/ \A
Ill l
111 50.0 J
IAAI
""""" ' I / ,..,.
--'-A o.o
i
NOTE: REFER TO SECTION III IN TEXT ON TURBINE CALIBRATIONS. --
-50.0
-10. o. I 0. 20. 30. '+0. 50. 60. 70. TIME AFTER RUPTURE (SEC)
Fig. 50 Average fluid velocity in broken loop cold leq at OTT flange (FE-BL-1) (filtered to 4Hz).
121

~
U· ... VI -1-.... r.:: -u 9 ... >
u ... VI -1-....
!: u 0 -I ... >
30.0
20.0
IQ.Q
o.o -10.
NOTE:
·-
I
J
Fig. 51
150.0 I
I i
100.0 I I
__;__
' 1
50.0 '
REFER TO SECTION III IN aJ lft"'- V£81(0't52 FE -BL -002 TEXT ON TURBINE CALIBRATIONS.
h vv r• \ j
M IIU ff ----11
i
! ! I I
!
I I I I --I ,~ .. - I' ~~ .. I f I
--· or ft._. - '\. I \
I \ \ "~ ! M...J ~
o. I 0. 20. 30. '+0. 50. 60. 70.
TIME AFTER RUPTURE (SEC)
Average fluid velocity in broken loop hot leg at OTT flange (FE-BL-2) (filtered to 4Hz).
• ·vEBK0'+51 FE-BL-001 0 VEBK0'+52 FE-BL-:002
I ,.f/lJ¥\r ~~ II J ~ V\
'' i ~ .l. i ' .,.II
"' .. : AT ~ l i • I
i I nn I -' i J i i fAA/ ~--~---·- f---~- ---- r-v i I 1-a,.,
i ' / v- ~~v -- "" t\ f1"-"'-~ i J. "" \ ' I
0.0 i 7 t:l'll ~ '-..-I
r- -I ! i
! ! i ' ' I NOTE: REFER TO SECTION III IN
~-! ' TEXT ON TURBINE CALIBRATIONS.
-50.0 '
-10. 0. 10. 20. 30. '+0. 50. 60. TIME AFTER RUPTURE (SEC)
Fig. 52 Average fluid velocity in broken loop cold and hot legs at OTT flanges (FE-BL-1 and -2) (filtered to 4 Hz).
122
70.

~
u .... VI ...... ..... ... ~ -u 0 ...J .... >
u .... VI ...... ..... ... ~
~ -u 0 ...J .... >
ao.o
8.0
~ 6.0
4.0
2.0
o.o -ao.o
~ ~
o.o
---
I I Y£CTD't53 J:E-CS-00 I I I I I
NOTE: REFER TO SECTION III IN TEXT ON TURBINE CALIBRATIONS.
, I
·- ~" .... -.... ~
~ "L ...... \ \. t..N "- u 10.0 20.0 30.0 ltO.O 50.0 eo.o 70.0
TIME AFTER RUPTURE (SEC)
Fig. 53 Average fluid velocity in reactor _vessel core simulator instrument stalk (FE-CS-1) (filtered to 4 Hz).
30.
20. ~~ I 0.
o. -10. o.
I tvEP!O .. s .. FE·Pc·ooa I I I I I I
NOTE: REFER TO SECTION III IN TEXT ON TURBINE CALIBRATIONS.
M n ~ J .. ~ r ~M~
, "'
It
' Jt. \.a {'~ ..
\ ~ ~k '~ " 10. 20. 30. ItO. 50. 60. 70.
TIME AFTER RUPTURE (SEC)
Fig. 54 Average fluid velocity in intact loop cold leg at OTT flange (FE~PC-1) (filtered to 4Hz).
123
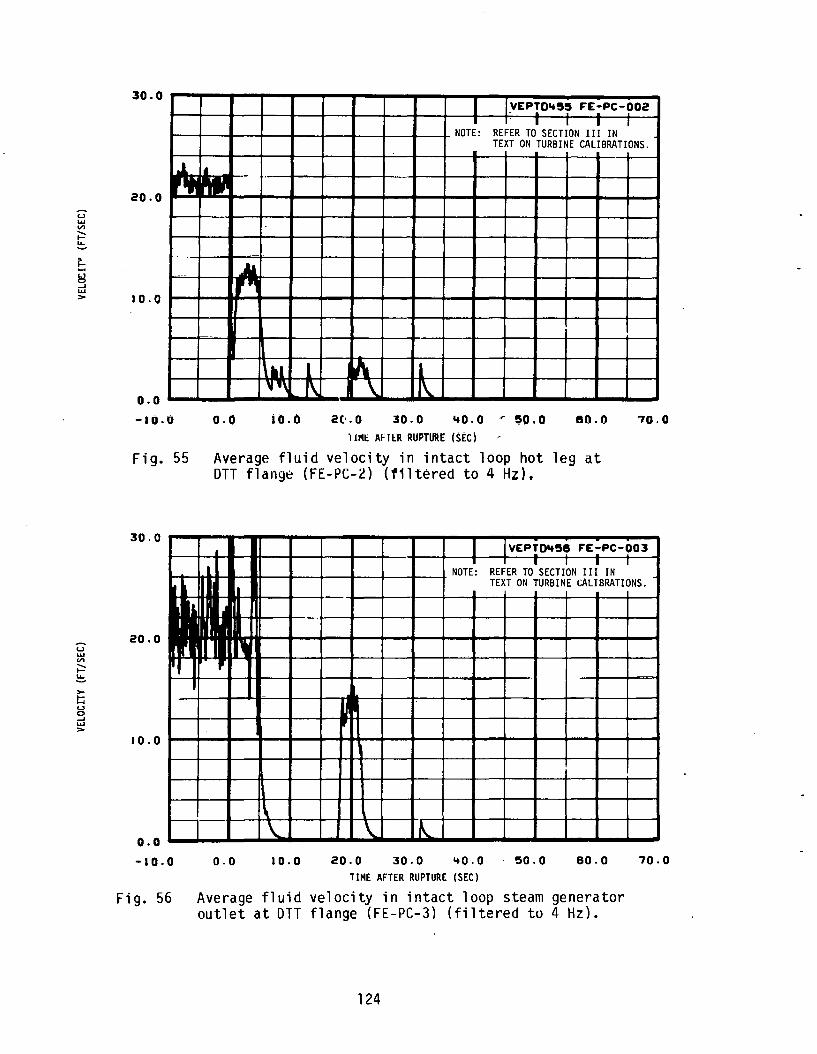
u ..... VI ....... 1-u.
t: ~ ..J ..... >
u ..... VI ....... 1-~ >-t:; u 0 ..J ..... >
30.0
20.0 ~-
10.0
o.o -HJ.O
..
- 4 ,.,
o.o
\Ill l '4~ 1\ iO.O
YEP!D~55 ~£-PC-002 J I I T I T
NOTE: REFER TO SECTION III IN TEXT ON TURBINE CALIBRATIONS.
~ l \ 1\
2(·.0 30.0 .. o.o ,.. ~o.o ao.o 70.0
11Ml AHI::R RUPTURE (SEC)
Fig. 55 Average fluid velocity in intact loop hot leg at DTT flange (FE-PC-2) (filtered to 4Hz).
30.0
20.0
11 1 I
10.0
o.o -10.0
I
ll Jll
\ \
o.o 10.0
iVEPfD~5B ~E.:.PC·003 I I I I I I
NOTE: REFER TO SECTION III IN TEXT ON TURBINE CALIBRATIONS.
lJ II'
\ "-20.0 30.0 ltO.O · !50.0 eo.o 70.0
TIME AFTER RUPTURE (SEC)
Fig. 56 Average fluid velocity in intact loop steam generator outlet at DTT flange (FE-PC-3) (filtered to 4Hz).
124
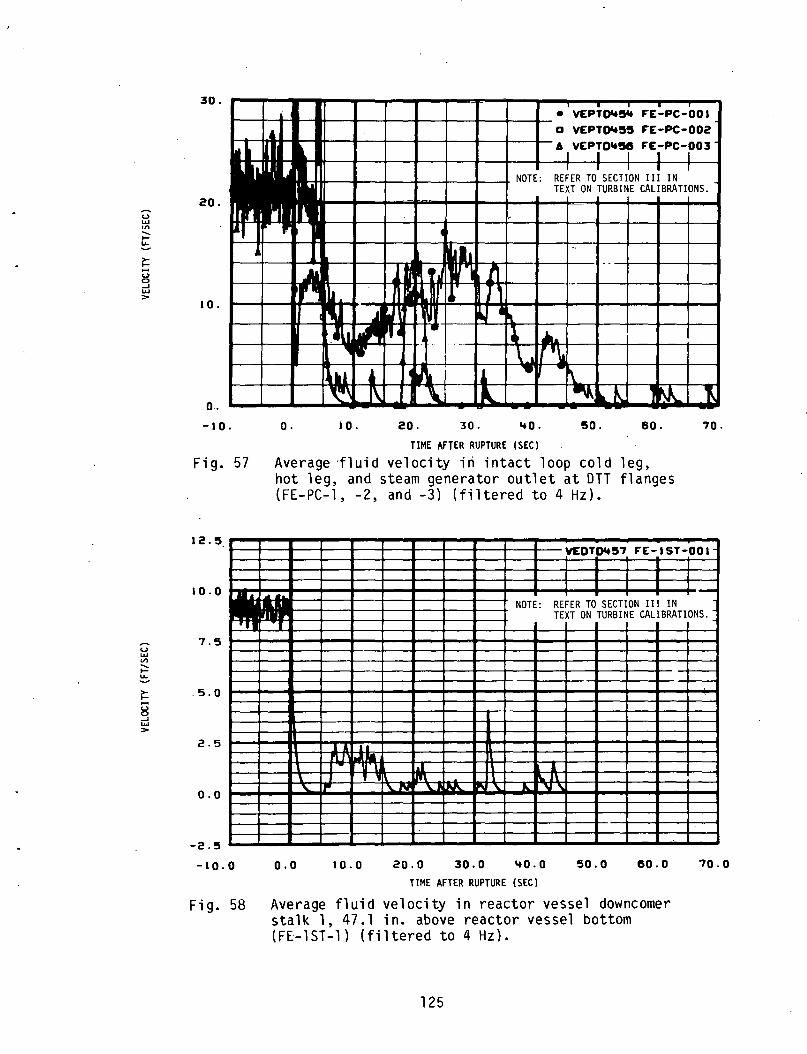
u ...... "' ...... 1-... > !: .., 0 ....I ...... >
u ...... VI ...... 1-... ~
> 1--u 0 ....I ...... >
30.
20.
I 0.
o. -10.
~~ ~
"'
o.
ftl. ·~M -~ ,, , ... ' -~ )\
10.
• VEPT~~ FE:PC-001 o VEPT~55 FE-PC-002
A1VEPrD'ter FEIPC-r03
r I r I I NOTE: REFER TO SECTION III IN
TEXT ON TURBINE CALIBRATIONS.
•• ..
.~ '1 ~
I , ~ ·~ • .... \ .. ,,~
~~. i ,. --~ •
I \J l.: ~ . ... ~ 1 ~ -~ 20. 30. .. o. 50. 60 . 70.
liME AFTER RUPTURE (SEC)
Fig. 57 Average ·fluid velocity iti intact loop cold leg, hot leg, and steam generator outlet at DTT flanges (FE-PC-1, -2, and -3) (filtered to 4Hz).
12.5 ~~~~ ~57 FE ) ST ·.00 I
I I I I I
10.0 I ·-. NOTE: REFER TO SECTION III IN .. · TEXT ON TURBINE CALIBRATIONS.
7.5
5.0
2.5 A ru 1..1! M I . \ r.1 I
\ I 1m 1\.J\
o.o " r,. '-N " lJU\. IP\ " ... ""
-2.5
-10.0 o.o 10.0 20.0 30.0 .. o.o 50.0 60.0
TIME AFTER RUPTURE (SEC)
Fig. 58 Average fluid velocity in reactor vessel downcomer stalk 1, 47.1 in. above reactor vessel bottom (FE-lST-1) (filtered to 4Hz).
125
70.0

u .... VI ....... 1-.... ~ -u 0 -' ..... >
~
u ..... VI ....... 1-.... ~
r-IJ 0 -' ..... >
12.!5 r-~---y--~--,---~--r-~~~--~--~--~--.---~~~-.~~ t---t---t--+--t---f--+--+--+--I----J1- vESTOit!58 F"E-2ST -00 fL I I I I • I I
t---t--+--+-+-+--...._---1--f--+ NOTE: REFER TO SECTION III IN ~ TEXT ON TURBINE CALIBRATIONS. ~
10.0 IL • -!!. ... 7.!5
!5.0
,, 2.5 .A1 tr
-, 1 na IIW ,11
I I tllllr I \ • Ill WlfV'I l.& 1\ 1\
-2.!5 ~~--_.--~--~------._--~_. __ _. ______ ~ __ ._ __ ~--~~---'
-10.0
Fig. 59
o.o 10.0 20.0 30.0 ~+o.o 50.0 eo.o TIME AFTER RUPTURE (SEC)
Average fluid velocity in reactor vessel downcomer stalk 2, 47.1 in. above reactor vessel bottom (FE-2ST-l) (filtered to 4Hz).
70.0
12.5 • VEOT F"E-.IST-001
a YEST~It!58 1 F"E-~ST-~OI 10.0 I
NOTE: REFER TO SECTION III IN f'ltff TEXT ON TURBINE CALIBRATIONS.
7.5
5.0
.... , 2.5 .11 " II .II , ... 1
'Mil- ll 11'1, JllW A • II I , .. , Ill! .A IV\
'- ~ I~ '-A. 'U...'\1 ... -o.o
-2.5
-10. o. 10. 20. 30. '+0. 50. eo. TIME AFTER RUPTURE (SEC)
Fig. 60 Average fluid velocity in reactor vessel downcomer _stalks 1 and 2, 47.1 in. above reactor vessel bottom (FE-lST-1 and FE-2ST-l) (filtered to 4 H~).
126
70.

150.0 I l l l FVFT0'+61 FT-Pl20.:...o85": I ! I ! i
·--I j I
- 1--·
I I ! I l Pt( I --· : ! _! ! / ! 100.0 I ! I :E ! J a. -~ !::. I I v
UJ ---:-- -+--- ·-~
~ i ; I I i --~
3 0 i i -' r----:· .... I I
50.0
1---·-,.- - -· i I ' ! ! i __ .!" ____
-···· !-. -·· .. ....... i-- -· I '-i I
---~ ., I ! i l o.o
. -I 0. o . 10. 20. 30. '+0. 50. 60. 70.
TIME AFTER RUPTURE (SEC) I Fig. 61 Flow rate in ECCS LPIS pump A discharge (FT-Pl20-85).
30.00 FYFT0087 FT-P
1
128-10'+
20.00 1\.
:E a. e UJ t- 10.00 ~ 3 0 -' ....
o.oo
NOTE: INITIAL OVERSHOOT IS DUE TO AUTOMATIC SPEED CONTROL.
-10.00
-10. o. 10. 20. 30. '+0. 50. 60. 70. TIME AFTER RUPTURE (SEC)
Fig. 62 . Flow rate in ECCS HPIS pump A discharge (FT-Pl28-104).
127

~
"' :<: ..... iii -' ~. ..., ..... ~ 3: 0 -' ....
3.0 ..
2.0
I .0
o.o -ao.
Fig. 63
• F'MF'T(*i!fl F"T~PIIG-a7-l -~-F'..-;aoo~o F"T-PllSI-27-3
. I I -.- .. I I I I I
NOTE: FLOW RATE UNCORRECTED FOR _
IW" DENSITY CHANGES.
-·--~ ...... ., -
"'
~ - ''fl!l' - - - ....
o. I 0. 20. 30. '+0. !50. eo. 70.
riME AFTER RUPTURE (SEC)
Flow rate in intact loop hot leg venturi (FT-Pl39-27-l and -27-3).
128

N 1.0
z .... _. ... > ... _. 0 .... ::> ::? _.
LIQUID LEVEL P~OB~ Hl BLmiDOWN DATA TEST
-zoo~~t-·· •xxx xxxxx------------_..,._ .,.._ --,---lila. 4 oxxxxxx 176.4 •xxxxxxxxxxxxxx
-164.4 •xxxxxxxx··-··x-· -------''------~-
152.4 •xxxxxxx xxxxx 140.4 •xxxxxxxx x
--1-2 8;; ,, .. • X XXXX XXXX XX -x· 116.4 •xxxxxxxxxxx l~4.4 ~XXX~AXXXXXX XXX
--··92;. 4··-• X XXXX XX-···· x··-···--··------------·---80.4 •xxxxxxxxxxxxx x 68.4 •xxxxxx
lt-3 09/10/76
----'-·----
-------·--·-----------
--3Z··tv·-* x :o:xx xxxx xxxxxxxx x-· -x- -------- ----·-----------xxxxxxx-x-xxxxxxx-xxxxxxx xx----28.4 ~xxxxxxxxxxxxxxxxxxxxx xxxx xxxxxxxxxxxxxxxxxxxxxxxxxxxxxx 24.4 *XXXXXXXXXXXXXXXXXXX X X XX X X X X XX X XXXXXXXXXXXXXXXXXXXXXXXXlXXXXXXXXXXX
--iO·• 4--• X XX XX XXXY. XXX XXX XX XXX XXX-X·--XX---X-------XX -X-·-·X-·-· XXX XX XXXX XX XX XXX XX:o; XXXXXXXX XXX X X )(XXX.li.X X XXXXXXX xx--16.4 •xxxxxxxxxxxxxxxxxxxx xxxxxx x x x xx xxxxxxx- xxxxxxxxxxxxxxxxxxxxxxxxxxxxxxxxxxxxxxxx~xxxxxxxxxxx 12.4 •xxxxxxxxxxxxxxxxxxxxxxxxxxxxxxxxxxxxxxxxxxxxxxxxxxxxxxxxxxxxx~xxxxxxxx~xxxxxxxxxxxxxxxxxxxxxxxxxxxxxx
--a·.-4-•xxxx-xxxxx·x-x·xxxxx-x-xxxxx-x-xx·xxx-xx-x-x-x-x-x-xx-xxx·xxxxxxxx-xxxxxxxxxxx-xx-xx-x-xu.x·xx·xx·xxx-xx-)(·xxx-xxx-,cx-x·x·xxxxx--••---------•---------•---------•---------•---------*---------•---------~----~----$---------•---------• 0.0 10.0 20.0 30.0 40.0 50.0 60.0 7J.O 80.0 90.0 100.0
Fig. 64
TIME AFTER RUPTURE (SEC)
Liquid level in reactor vessel downcomer instrument stalk 1, bubble plot (LE-lST-1 and -2).
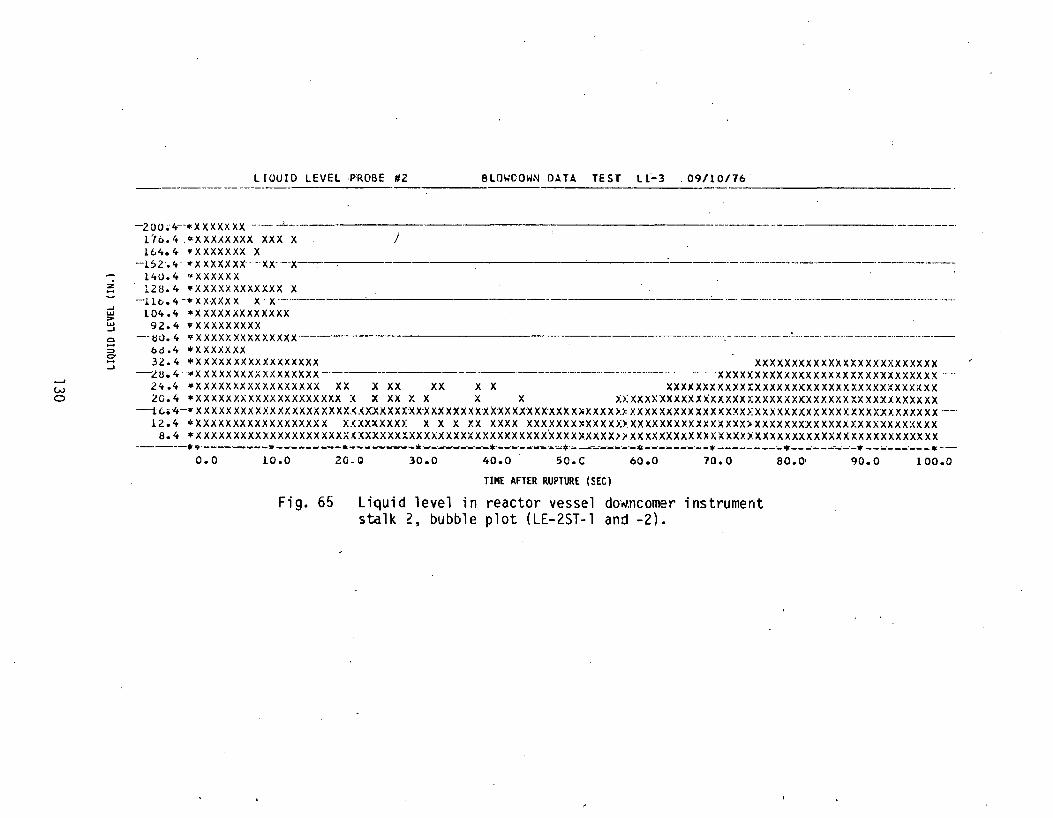
...... ..... > ..... ...... c ..... => CT ..... ......
LIQUID LEVEL ,PROBE #2 BLO~DOWN DATA TEST L1~3 .09/10/76 ------------·-------------- ---------------- -----------------------------zoo~-4--.,xxxxxxx ···- _!._. _____________ _
176.4 ~xxxxxxxx xxx x 164.4 •xxxxxxx x
--15·2·.4- •xxxxxxx·· ·--xx---x 140.4 '~'XXXXXX
128.4 •xxxxxxxxxxxx x -·He,.4-•XXXXXX x·x··-···-------
104.4 *XXXXXXXXXXXXX 92.4 •xxxxxxxxx
--tw.4 •xxxxxxxxxxxxxx·----· bd.4 *XXXXXXX
J ----------·-·---· ------
------·- ·-----
32.4 *XXXXXXXXXXXXXXXXX XXXXXXXXXXXXXXXXXXXXXXXXX -.z 8. 4 .,.. X XX XX XX XX XX XX XX X X------------------------------·-·----·-·---------·---.. - . . X XX XXX X XX X XX: X X X X X X XX X XXX X XXX X X
24.4 •xxxxxxxxxxxxxxxxx xx x xx xx x x xxxxxxxxxxx~xxxxxxx:xxxxxxxxxxxxxxxxxx 2G.4 •xxxxxxxxxxxxxxxxxxxx x x xx x x x x xxxxxxxxxxxxxxxxxxxxxxxxxxxxxxxxxxxxxxxxxxxx
---!. t.;; 4-• X XX XX XXXX >:X XXX XXX XXXX.<.<X:XXXXXXX-XXX XXXXX·xx-XX XX·XXX·XXX X)iXXXX >J: XX XX XXX XX XX X X XXX.>:XX XXX XXX X XXX X XXX XXX XXXX XX ----·· 12.4 *XXXXXXXXXXXXXXXXXX XXXXXXXXX X X X XX XXXX XXXXXXX~XXXXX~XXXXXXXXXXXXXXXX)XXXXXXXXXXXXXXXXXXXXXXXXX
8.4 *XXXXXXXXXXXXXXXXXXXXX~XXXXXXXXXXXXXXXXXXXXXXXXXX~XXX~XXXX>>XXXXXXXXXXXXXXXXXXXXXXXXXXXXXXXXXXXXXXXXXX ------·· ··---------· ---------· ----------· -·-·----------··--·;,.,·--------··-- -------·------· -·-·----·-·--· ----------·-·- -·-----·.-.·-· ------·----. -·-
o.o 10.0
Fig. 65
20-Q 30.0 40.0 so.c 60.0 70.0
TIME AFTER RUPTURE (SEC)
liquid. level in reactor vessel dm•mcomer instrument stalk~' bubble plot (LE-2ST-l and -2).
90.0 1 oo.o

:z --' .... :> .... -' 0 ~· ::> e -'
:z -... .... :> w -' 0 -::> e -'
7U.O
65.0
60.0
55.0
50.0
"+5.0
"+0.0
-10.0
Fig. 66
!50.
.. o.
30.
20.
10.
o. -10.0
Fig. 67
'• UtFT0~66 LT-Pi38-033 0 UtFT0039 LT-PI38-058
1
I; 1. ,, ..
• II , ...
...
NOTE: DATA DISPLAY INSTRUMENT RINGING BETWEEN T
0 AND
T0
+ 2.5 SEC. I I
o.o 10.0 20.0 30.0 "+0.0 50.0 60.0 70.0
TIME AFTER RUPTURE (SEC)
Liquid level in blowdown suppression tank (LT-Pl38-33 and -58).
L~r~e7 LT-Pi3e-ooe
\ NOTE: DATA ARE QUALIFIED UNTIL \ "' T0 + 13 SEC. \ \ \ \ \ \
\ \ \ \ \ \
'-""""'
o.o 10.0 20.0 30.0 ltO.O !50.0 60.0 70.0
TIME AFTER RUPTURE (SEC)
Liquid level in pressurizer, southeast side (LT-Pl39-6).
131

:z
_, w > w d c -"' 0 -_,
-:z -_, w >
"" _, o· ::::> 0 -_,
50.
'+0.
30.
.:o.
I 0.
o. -10.0
Fig. 68
!50.
'+0.
30.
20.
I 0.
0.
-I 0.
LHrTOO'+O LT-P139-007
\ NOTE: DATA ARE QUALIFIED UNTIL
\ "' T0 + 13 SEC. -
I
\ -____ ,_. ~·~
\ ..• ··--- -- ·-·····-··
\ 'N ~ ""\.. A
\ ...
I \ 7 ~ f7
o.o 10.0 2o.o 3o.o '+O.o ~o.o 6o.o 7o.o
liME AH~K RUPTURE !SEt)
Liquid level in pressurizer, southwest side (LT-Pl39-7).
I
LT-Pi3sa-ooe LPW8001tl
-··
\ NOTE: DATA ARE QUALIFIED UNTIL
\ "' T0 + 13 SEC.
\ \
~ J
\ \
"' o. I 0. 20. 30. '+0. 50. 60. 70.
TIME AFTER RUPTURE (SEC)
Fig. 69 Liquid level in pressurizer, north side (LT-Pl39-8).
132
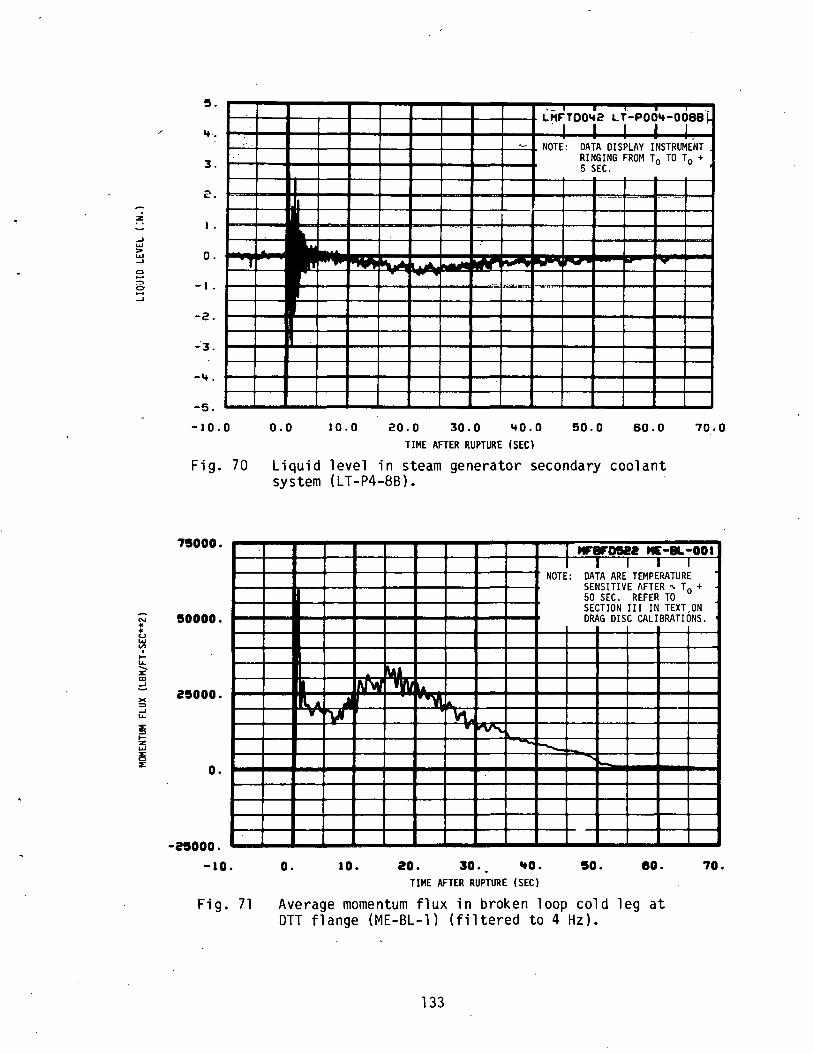
!!1.
'+·.
3.
2.
z I
..J .... > o . .... ....J T 0 ... :::> -I 0' ... ....J
-2.
_.3.
-'+.
-5.
-10.0
Fig. 70
7!000.
"' !0000. .. .. u .... VI
I .... ... ...... ::E
"" = 2!000. X :::> ....J ... ::E :::> .... z .... 25 ::E o.
-nooo. -10.
Fig. 71
'·-,,.; ..... A 0
~-PO~'+ ll I' I 1
NOTE: DATA DISPLAY INSTRUMENT RINGING FROM T0 TD T0 + 5 SEC.
.... ~ .... ~ .... - - .....
---
o.o 10.0 20.0 30.0 '+0.0 50.0 60.0 70.0 TIME AFTER RUPTURE !SEC)
Liquid level in steam generator secondary coolant system (LT-P4-8B).
ttF'BF'D!22 te-IL-001 I I I I I
NOTE: DATA ARE TEMPERATURE - SENSITIVE AFTER~ T0 +
50 SEC. REFER TO SECTION III IN TEXT,ON DRAG DISC CALIBRATIONS.
1\aa l IN"W IV\1 la
I\.. A .. ""ll.A. y '\M \r\. ..
"""' ---o. 10. 20. 30. ItO. !0. eo. 70.
TIME AFTER RUPTURE (SEC)
Average momentum flux in broken loop cold leg at OTT flange (ME-BL-1) (filtered to 4Hz).
133

-N
"' "' u ..... VI
I 1-"-...... ::E cc ....0
>< :::> ....0 "-
~ 1-.. ...... ~ ::E
N .. "' u ...... VI
I 1-"-...... ::E cc ....0
;...: :::>
Li.!
~ 1-:z .... ~ ::E
JOOO.
2000. -~
1000· ·.
o. ...
-aooo. -ao.
Fig. 72
'75000.
50000 .
25000.
o.
-nooo. -10.
I I tFIF'DRJ IC-IL-002 ... ~ I I I I I
rt'1 NOTE: REFER TO SECTION III IN TEXT ON DRAG DISC CALIBRATIONS.
J \ I~ ~ ~ I "' \.N \.
l ,.AJ""
ll\ 1\. l " \I \..r v \. ~
" ~ - r\:
""\: ~-·
~ ---
-·-- - -· .. ~ ......... , .... , ···"""•··-
o. 10. 20. 30. 'tO. eo. eo. '70. TIME AFTER RUPTURE (SEC)
~~er~ge momentum flux in broken loop hot leg at DTT flange (ME-BL-2) (filtered to 4 Hz).
• tFIF'DR2 IC-IL-001 a tFIF'DRJ IC-IL -002 1----.- r- I I
NOTE: REFER TO SECTION III IN TEXT ON DRAG DISC CALIBRATIONS.
- lt.aa
b I~ ~ Ia
~· 'Wlll -- ~
Yl "' .. """ ~--~~ """
o. 10. 20. 30. ItO. 50. eo. '70. TIME AFTER RUPTURE (SEC)
Fig. 73 Average momentum flux in broken loop cold and hot legs at DTT flanges (ME-BL-1 and -2) (filtered to 4 Hz).
134
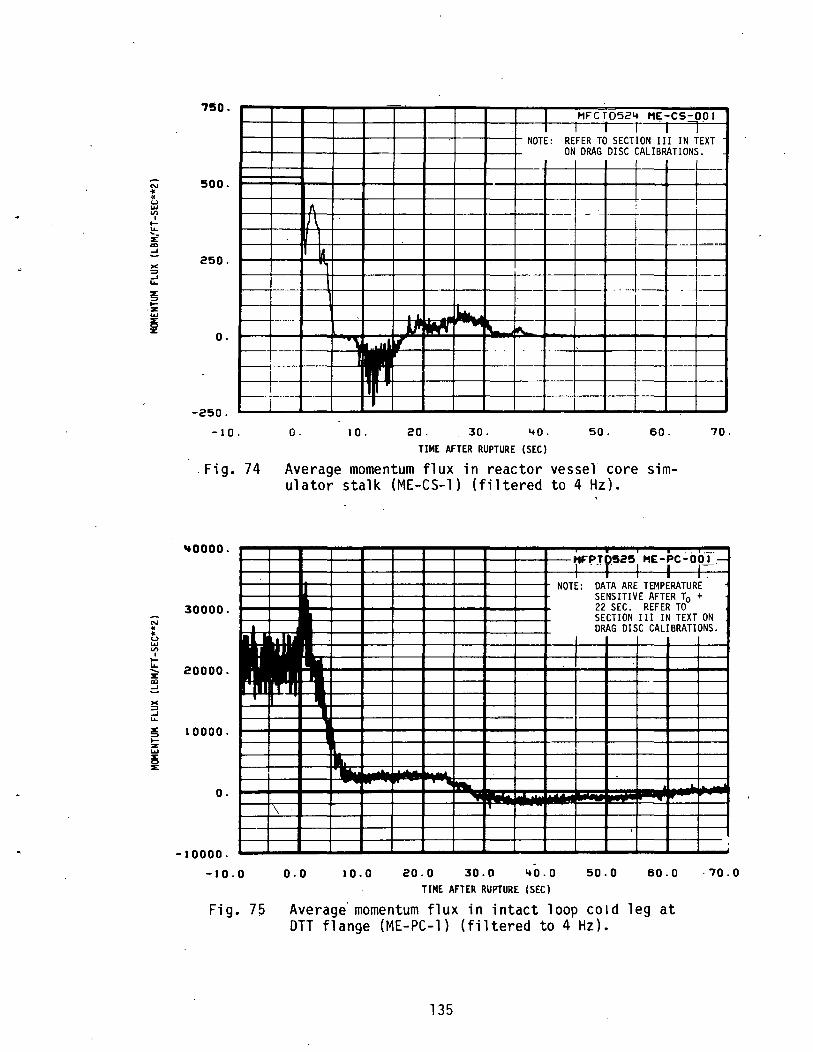
750.
- 500. "' ... « (..) ..... "' I ...... ... -. :E a> ...J
>< 250. :::> ...J ... ~ ...... .:z: ..... ! :E o .
I
-· -250.
-10.
. Fig. 74
ltOOOO.
30000.
"' ... ... (..) ..... "' I ...... ...
20000 . ...... :E .., = . >< 3 ... ~ 10000 . ...... :z: ..... ! ·x
o. \
-10000.
-10.0
Fig. 7 5
I MFC ~0524 ME:-CS :.90 I I I I I I I
NOTE: REFER TO SECTION III IN TEXT ON DRAG DISC CALIBRATIONS.
r---A -J \
- ~·
I& --
..... ·- . . r---
.LJ. .... 11' ..., ..,
\. .,...
• . -
' o. 10. 20. 30. 40. 50. 60. 70.
TIME AFTER RUPTURE (SEC)
Average momentum flux in reactor vessel core simulator stalk (ME-CS-1) (filtered to 4Hz).
~F"~.Tp.525 1 I'IE-!. . .l i ·op~-I I I.
NOTE: DATA ARE TEMPERATURE SENSITIVE AFTER T0 + 22 SEC. REFER TO SECTION III IN TEXT ON DRAG DISC CALIBRATIONS .
•
•• IIIII -.
'
o.o 10.0 20.0 30.0 40.0 50.0 60.0 ·70.0 TIME AFTER RUPTURE (SEC)
Average· momentum flux in intact loop cold leg at OTT flange (ME-PC-1) (filtered to 4Hz).
135

lfOOOO.
30000. N .. .. u w Vl
I 1-LL. 20000 . ...... E
"' -'
>< "' -' I.A~ .. E 10000. "' ... :z ..... ~ E
o.
-10000.
-10.0
Fig. 76
ltOOOO.
30000. N .. .. u w Vl
I 1-LL. 20000 . ...... E
"" -'
>< "' -' lL
~ IOOQO. :z w il5
·E
o.
-10000.
-10.0
Fig. 77
-J-"!~PJD_'O't~ 11E,;-PC NOTE: DATA ARE TEMPERATURE
SENSITIVE AFTER T0 + 22 SEC. REFER TO SECTION I II IN TEXT ON . DRAG DISC CALIBR~TIONS.
I
............ , ... . --~·-·· f--·· • ......... ···"·-··- ......... - -
0 .o. 10.0 20.0 30.0 lfO.O 50.0 60.0 70.0
TIME AFTER RUPTURE (SEC)
Average momentum tlux in intact loop steam generator outlet at OTT flange (ME-PC-3) (filtered to 4 Hz).
• 11F-PToS2S 11E-PC-OO I
D 11F~JQ~~~ 11E;PC-p0~-·
NOTE: DATA ARE TEMPERATURE • SCNSITIVE AFTER T0 + . 22 SEC. REFER TO SECTION III IN TEXT ON DRAG DISC CALIBRATIONS.
.. . ..
~ r- ., I
J , ... ~ ---
o.o 10.0 20.0 30.0 lfO.O 50.0 60.0 70.0
TIME AFTER RUPTURE (SEC)
Average momentum flux in intact loop cold leg and steam generator outlet at OTT flanges (ME-PC-1 and -3) (filtered to 4 Hz).
136

N • • u ..... Vl
I ... .... ..... ::E ul
.::! >< ~ ~ .... ::E ~ ... z ..... ::E 0 E
N' • • u ..... Vl
I
t;: ..... E
"" ~
5000. 1 L L~.Pi051t~ HE ~ .1 !?. .. :;_OJU_
• I
REFER T~ SECT1ION I ;I IN +EXT NOTE:
DRAG DISC CALIBRATIONS.
I ' 2500.
1 _u '
o . ~ 1Ull.. ...... La... ... ....J I rwu rrr " .....
-2500.
-10.0 o.o 10.0 ~o.o · 30.o ltO.O 50.0 60.0 TIME AFTER RUPTURE (SEC)
Fig. 78 Average momentum flux in reactor vessel downcomer stalk 1, 44.5 in. above reactor vessel bottom (ME-lST-1) (filtered to 4Hz).
70.0
5000 .
• 1 ~t_st_p_s.~~ HE;2sr)~9..!
I I I I I I
NOTE: REFER TO SECTION III IN TEXT ' ON DRAG DISC-CALIBRATIONS.
' 2500.
I
•• w·~ .lk .~L. ...L
0. ....... ..... ...U.a. ll. ~ ~~~ -.~ r.
WJII II i'
'
-2500.
-10.0 o.o 10.0. 20.0 30.0 ltO.O 50.0 60.0 TIME AFTER RUPTURE (SEC)
Fig~ 79 Average momentum flux in reactor vessel downcomer stalk 2, 44.5 in. above reactor vessel bottom (ME-2ST-l) (filtered to 4Hz).
137
70.0

Q ~
en ~ LLI
"" ::::> en en LLI
"" 0..
...J < .... ~-· :z LLI
ffi .._ ::= Q
0 -en ~ LLI
"" ::::> en en LLI
"" 0..
' < ... 1-:z .., "" LLI .._ ::= Q
5.0
2.5
o.o ·-·-
-2.5
-10.0
Fig. 80
300.
200.
100.
POBT0052 PDE-BL-001
I--
,1~1 II
I .... , ~ ~~. ,T
r''""" •• "11 ••• 'ttl ~I I .. 11 I
jL
............ ..... ' ... ···-·
o.o 10.0 20.0 30.0 ~0.0 50.0 60.0 70.0 TIME AFTER RUPTURE (SECl
Differential pressure in broken loop hot leg across 14-to-5-in. contraction (PdE-BL-1) (filtered to 4Hz).
POBT0053 POE-BL-002
-"" -----~---~-,...4.- -~,..,...._ ,-~---~--1---+--~1---+--~
~-+-~~~-+-4-~1---+-4-~~-~-~~-
0.
-100. ~_.--~--~_.--~~~_.--~--~_.--~--~_.--~--~~
-10.0
Fig. 81
o.o 10.0 20.0 30.0 ~o.o 50.0 60.0
TIME AFTER RUPTURE (SECl
Differential pressure in broken loop cold leg across 14-to-5-in. contraction (PdE-BL-2) (filtered to 4 Hz).
138
70.0

c -"' ... ..... "' :::> V)
"' ..... "' 0..
...J.
~ 1-z ..... "' ..... ... ~ c
c -"' 0..
..... "' :::>
"' "' ..... "' 0..
...J s .... z ..... "' ..... ... ~ c
500.
• 1Poelco5~ PO~-BL~003
o POBT005'+ POE-BL-00'+
'+00.
300.
200.
tOO.
o. -10.0
""*-
IJ r
""'
o.o
\ ~ ...... .
' ·- -·-
~ ~ ~~~ ~~
~ l \... ~
~
~ II..
~ ~
, ... 10.0 20.0 30.0 '+0.0 !50.0 80.0
TIME AFTER RUPTURE (SEC)
Fig. 82 Differential pressure in broken loop across break planes (PdE-BL-3 and -4).
'+00.
70.0
POBT00!56 POE-BL-005
350. ~
...,.._ ~
\. 300.
\ 250. \
\ -200. \.
\
' 150. i I i\ -~
100. l \. ' ~ !..
50. i " ' I .......... I
0.
-10.0 o.o 10.0 20.0 30.0 '+0.0 50,0 80.0
TIME AFTER RUPTURE (SEC)
Fig. 83 Differential pressure in broken loop hot leg across pump simulator (PdE-BL-5).
139
70.0

0 .... VI Q.
.... "" ::> VI VI .... "" Q.
...J
:3 .... :z .... "" .... ... !!; Cl
c .... ·VI Q.
.... "" ::> VI VI .... "" ..
I
:!; .... :z .... .,. .... ... !!; 0
30.0 POBT~057 POE-BL ·006
I
20.0
.... 10.0 """"'"
''I ... ... "" "'" ' ~ ~ ....... -·········
o.o .........
-10.0
-10.0 o.o 10.0 i:!O.O 30.0 40.0 !50.0 eo.o 70.0 'I'IME 1\HiR RUPTURE (&EC)
Fig. 84 Differential pressure in broken loop hot leg across steam generator simulator outlet flange (PdE-BL-6).
'+0.0
30.0
20.0
10.0
o.o
-10.0
-10.0
Fig. 85
.';"Uti I IU::)tl r-uc.:·DL ·~07 ... •• ..
• • "'. I . I
r
o.o 10.0 20.0 30.0 '+0.0 50.0 eo.o TIME AFTER RUPTURE (SEC)
Differential pressure in broken loop hot leg across the steam generator simulator (PdE-BL-7).
140
70.0
/

-o -'VI
~ .... 0:: :::> VI
~· .... 0:: Q..
...J :!; 1-::z .... 0:: .... .... := c
c -VI Q..
.... 0:: :::> VI VI .... 0:: Q..
...J :!; 1-:z .... 0:: .... .... := c
5.0 P08T0059 POE-BL-008
2.5 ·-
1:--- f-
~-
~ L...
o.o ~ nM Jtlw- rrtvt ~ 'rtJV ~ ·- lA .A
~ --~·· -···-···- -·-- .. ~ ..... - ... ·- . ·-·~ . ..
-2.5
-10.0 o.o 10.0 20.0 30.0 '+0.0 . 50.0 60.0 TIME AFTER RUPTURE (SEC)
Fig. 86 Differential pressure in broken loop hot leg across steam generator simulator inlet flange (PdE-BL-8) (filtered to 4Hz).
10.0
......
70.0
POCT0060 POE-CS-001
~
5.0
o.o
-5.0
-10.0
Fig. 87
. M. ...
-
l
'"' ~ ., ....-
' ~
o.o 10.0 20.0 30.0 '+0.0 50.0 60.0 TIME AFTER RUPTURE (SEC)
Differential pressure in reactor vessel core simulator to downcomer instrument stalk 2, 24.5 in. from reactor vessel bottom (PdE-CS-1) (filtered to 4Hz).
141
I
70.0

Q ~
VI 0..
w
"" ~ VI VI w
"" 0..
..... ::5 1-:z w
"" w .... ~ Q
Q ..... VI 0..
w ... ~ VI VI w "" C!.
~ ... :z w .. w .... != Q
20.0
25.0
~ POPT0081 POE-PC-001
15.0
10.0
5.0
o.o
-~.o
-10.0
Fig. 88
115.0
.. .. ·-10.0
'---
5.0
o.o
I -5.0
-10.0
Fig. 89
, I
~ ~
'-... ...._ ... !'
o.o 10.0 20.0 30.0 ltO.o 50.0 60.0 TIM! A~T!~ RUPTUR! (5!C)
Differential pressure in intact loop cold leg across pr1mary coolant pumps 1 and 2 (Pdc-P~-1).
l 70.0
POPT0062 PO~PC-002 I I I I I
NOTE: DATA ARE QUALIFIED FOR INITIAL CONDITIONS ONLY;
lPYtl ~ONTAIN UNINTERPRETED LONG-TERM OFFSET.
L !1
... ·-
~
' iLa. .• ... ,.... , ... .,. , .... .. &1,
~-.... ..... II"
o.o 10.0 20.0 30.0 1+0.0 50.0 60.0 70.0
TIME AFTER RUPTURE (SEC)
Differential pressure in intact loop across the steam generator (PdE-PC-2).
142
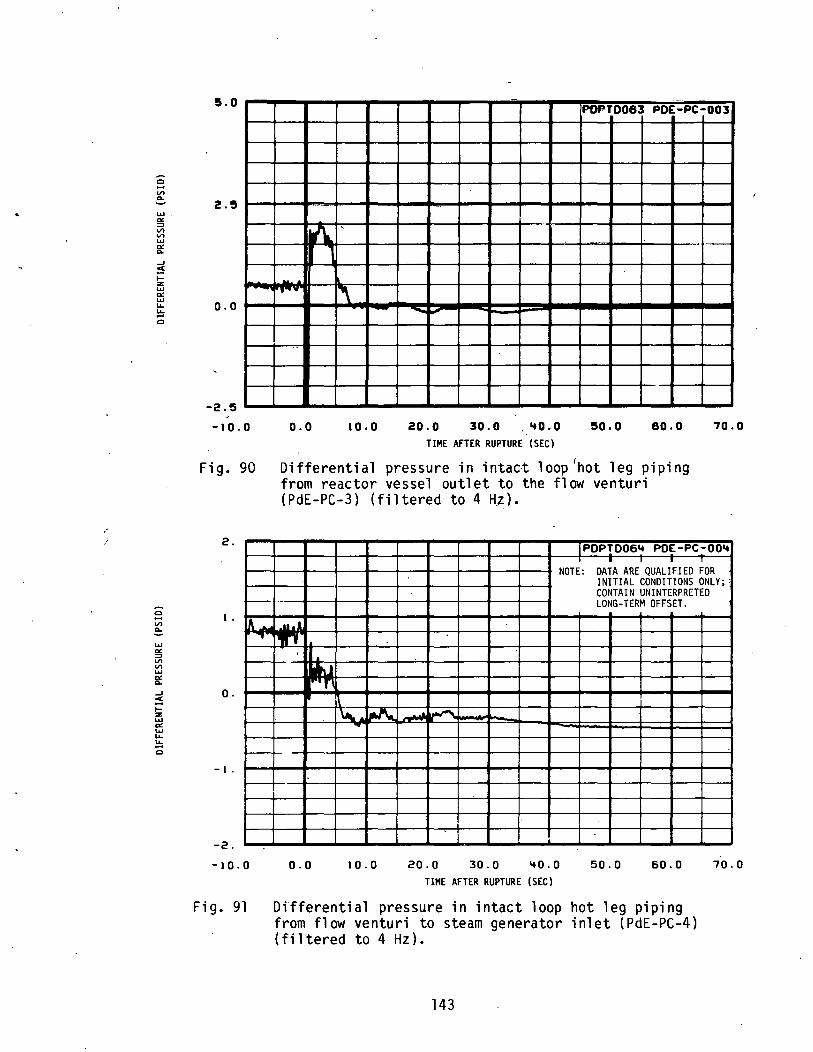
5.0
c .... VI 0.. ...... 2.!5 ... a: ::::> VI ..., ... a: 0..
...J
~ 1-:z ... a: ... o.o ..... := 0
-2.5
-10.0
Fig. 90
. · 2.
-c 1 .... VI 0.. .A ..
-.., ... a: ::::> VI VI ... a: 0..
...J o . ~ 1-:z ... a: ... ..... := 0 r--
-1 .
-2.
-10.0
Fig. 91
~ -
POPT0063 POE-PC-003
r\_' 1
...... ... "' I' -- I""'
~- -
o.o 10.0 20.0 30.0 . ItO .0 50.0 so.o TIME AFTER RUPTURE (SEC)
Differential pressure in intact loop 'hot leg p1p1ng from reactor vessel outlet to the flow venturi ( PdE-PC-3) (filtered to 4 Hz) •
·I-
70.0
POPT0061t POE-PC-OOit I I
NOTE: OATA ARE QUALIFIED FOR INITIAL CONDITIONS ONLY; · CONTAIN UNINTERPRETED LONG-TERM OFFSET.
.u .l ,..,, . ·lL_
11*\J l"'f
" ~ ~ ~ ... r-
o.o 10.0 20.0 30.0 '+0.0 50.0 60.0 TIME AFTER RUPTURE (SEC)
Differential pressure in intact loop hot leg p1p1ng from flow venturi to steam generator inlet (PdE-PC-4) (filtered to 4 Hz).
143
70.0
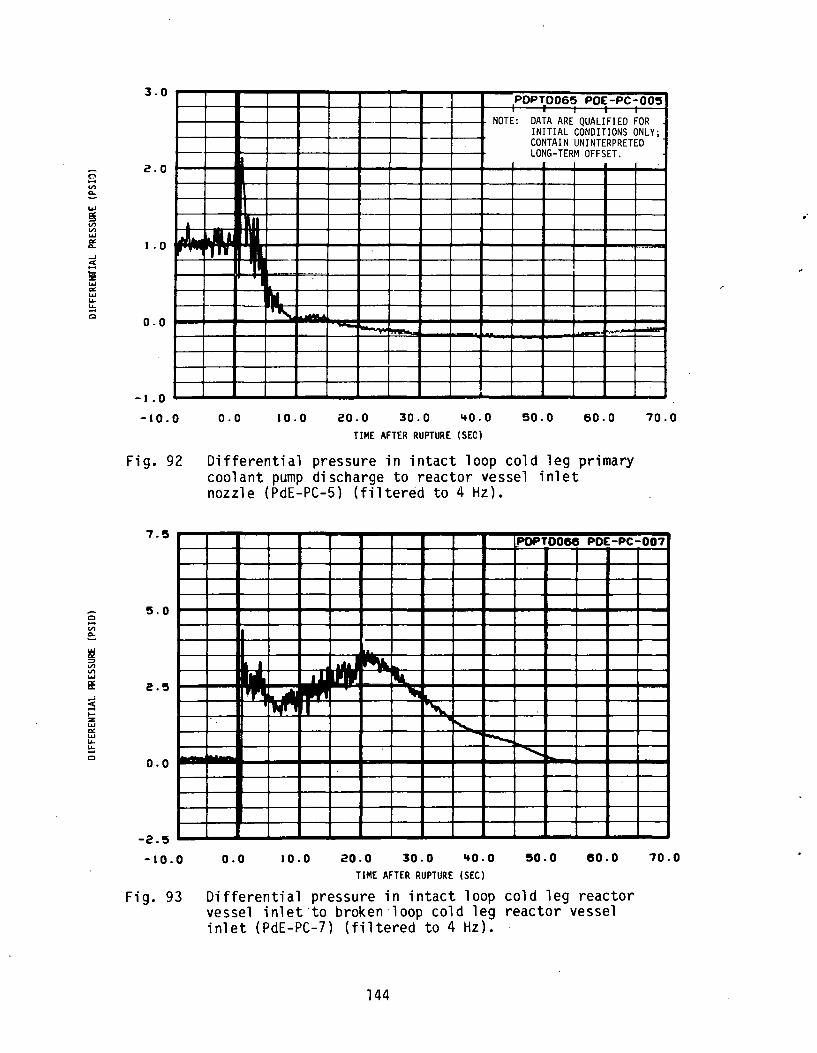
:::: V> 0..
.... gs V> V> .... a: 0..
...J
~ !2 .... a: .... ~
!!; c
c -V> 0..
3.0
2.0
I
~ I. 0
o.o
-I. 0
-10.0
Fig. 92
POPT0065 POE-PC-005 ~ I
NOTE: DATA ARE QUALIFIED FOR INITIAL CONDITIONS ONLY; CONTAIN UNINTERPRETED LONG-TERM OFFSET.
.•. l
··n ' --
-··--- .
II. N "'""'- - .......
o.o 10.0 20.0 30.0 '+0.0 50.0 60.0 70.0 TIME AFTER RUPTURE (SEC)
Differential pressure in intact loop cold leg primary coolant pump discharge to reactor vessel inlet nozzle (PdE-PC-5) (filtered to 4Hz).
··-.. I ···I""-
-2.5 ~_.---L--~--~~--~--~--~--~~--_.--~--._~~_.--~
-10.0 o.o 10.0 20.0 30.0 '+0.0 50.0 eo.o TIME AFTER RUPTURE (SEC)
Fig. 93 Differential pressure in intact loop cold leg reactor vessel inlet·to broken·loop cold leg reactor vessel inlet (PdE-PC-7) (filtered to 4Hz).
144
70.0
.·
r

0 .... V>
~ .... "" :::>
~ .... "" .... -' :!; ... :z ..... "" .... .....
. !;!:; 0
8 V>
£:. .... "" :::> V> V> .... "" .... -' :!; ... :z .... "" .... ..... !;!:; 0
2500.
2000.
1!500. 1--···
1000.
!500.
o. -10.0
...
T' 0 -·~· .. ' ··-
-....: -.......
o.o 10.0
- ~-·
~ORTp0-11 POE-RV-001 ' . ' -
NOTE: DIFFERENTIAL PRESSURE BEYOND INSTRUMENT RANGE BEFORE T 0 •
........... ~
. "-
' .......
........... -~ 20.0 30.0 '+0.0 50.0 60.0 70.0
-TIME AFTER RUPTURE (SEC)
Fig. 94 Differential pressure in reactor vessel downcomer stalk 1 to the blowdown suppression tank (PdE-RV-1) •
... 3.
2.
I .
o.
-I .
-2.
-3.
-'+.
-10.0
Fig. 95
PORTOO&Q POE-RV-003
,,.... 1 .. -. ~
r'k • - r--~
' l/ "- ~ It" .
o.o 10.0 20.0 30.0 '+0.0 50.0 eo.o TIME AFTER RUPTURE (SEC)
Differential pressure in reactor vessel intact loop cold leg inlet to downcomer stalk 2 (PdE-RV-3) (filtered to 4Hz).
145
70.0
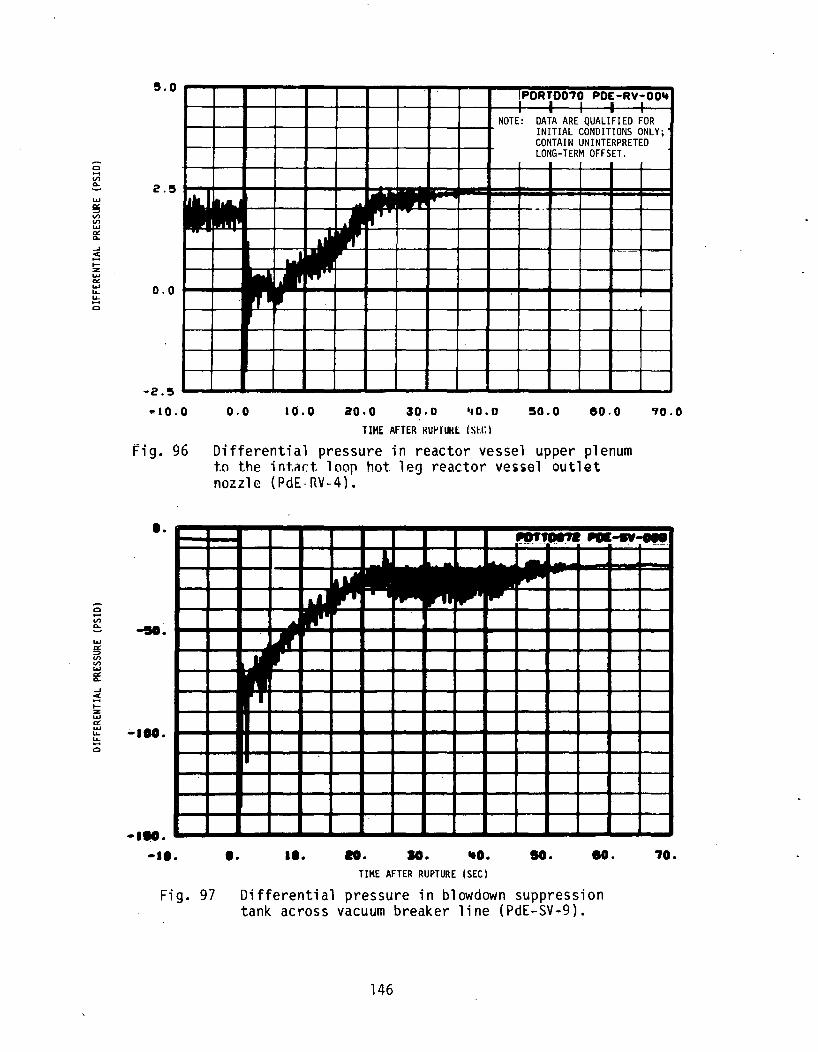
0 .... <I) 0-
..... !!!! <I) <I) ..... "' 0-
...... ;:= 1-:z ..... "' ..... "-!:!:; 0
0 .... <I) 0-
..... "' ~ <I) <I) ..... "' 0-
...... ~ 1-:z ..... "' .., "-!:!:; 0
5.0 [POR~007Q ,..u-; -ru~IJOit . .
NOTE: DATA ARE QUALIFIED FOR INITIAL CONDITIONS ONLY; CONTAIN UNINTERPRETED LONG-TERM OFFSET.
2.5
• o.o
-2.5
•10.0
Fi 9. 96
••
-so .
-···
-···
,
o.o 10.0 20.0 30.0 'tO, 0 50.0 eo.o TIME AFTER KUI'fUKE. (Sf.l:l
Differential pressure in reactor vessel upper plenum to the int~~t loop hot leg reactor vessel outlet nozzle (PdE-~V-4) •
'70.0
I ~ - -~
~ r
•• ••• ... 10 . so . eo. '70 •
TIME AFTER RUPTURE (SEC)
Fi 9. 97 Differential pressure in blowdown suppression tank across vacuum breaker line (PdE-SV-9).
146

c -,,., ~ ..... IX
i;l "' ..... IX 0..
...J
~ 1-:z ..... IX ..... "-!:!; c
c -"' ~ ..... IX ~ V') V') ..... a: 0..
...J
..: i:= :z ..... a: ..... "-!:!; c
~OST~073 POE~2ST-002
NOTE: DATA ARE QUALIFIED FOR INITIAL CONDITIONS ONLY; CONTAIN UNINTERPRETED
·o.o
. u ·~-..
LONG-TERM OFFSET .
" _ . ., ~ ll~aa. --~ / -
" /
"" / -2.5
-· ... _, .•. .... ~-
-5.0
-10.0 o.o 10.0 20.0 30.0 .. o.o 50.0 IISO.O TIME AFTER RUPTURE (SEC)
Fig. 98 Differential pressure in reactor vessel downcomer stalk 2, between 209.4 and 24.5 in. above reactor vessel bottom (PdE-2ST-2) (fi)tered to 4 Hz).
10.0 PO 'TOO 7'+ PpT-P:I39-r'l30 ..... .111....1 I
5.0
o.o
-5.0
-10.0
Fig. 99
I
~ ~
r--
o.o 1(1.0 20.0 30.0 '+0.0 50.0 60.0 TIME AFTER RUPTURE (SEC)
Differential pressure in intact loop across the reactor vessel inlet and outlet nozzles (PdT-Pl39-30).
147
70.0

~ -"' ~ w "' ""' "' "' w "' 0..
~ -"' 0..
w "' ~ "' "' ~ "" 0..
2500.
2000.
1500.
1000.
500.
o. -10.
0
1---
....
0 0 10.
• PGBT0075 PE-BL-001 D PGBT0076 PE-BL-002
-·- f-·
"' .... .........
g
""'- ....... ~
iW'&-
20. 30. 40. 50. 6.0. 70. TIMF AFTnl JIIJIITUR[ (SEC)
Fig. 100 Pressure in broken loop cold and hot legs (PE-BL-1 and -2).
2500.
2000.
1500.
1000.
500.
o. -10.
1\.. --o.
.
- .... "' ~
~ ...
10.
• PG8T0075 PE-BL-001 D PG8T0078 PE-BL-OOif A POBTOOBO PE-BL-008
-
r-...
"" ....... 1'1!1.. .....
...... loo. .........
-.....;;; ["..... ra.-.
20. 30. 40. 50. 60. 70.
TIME AFTER RUPTURE (SEC)
Fig. 101 Pressure in broken loop cold leg (PE-BL-1, -4, and -8).
148
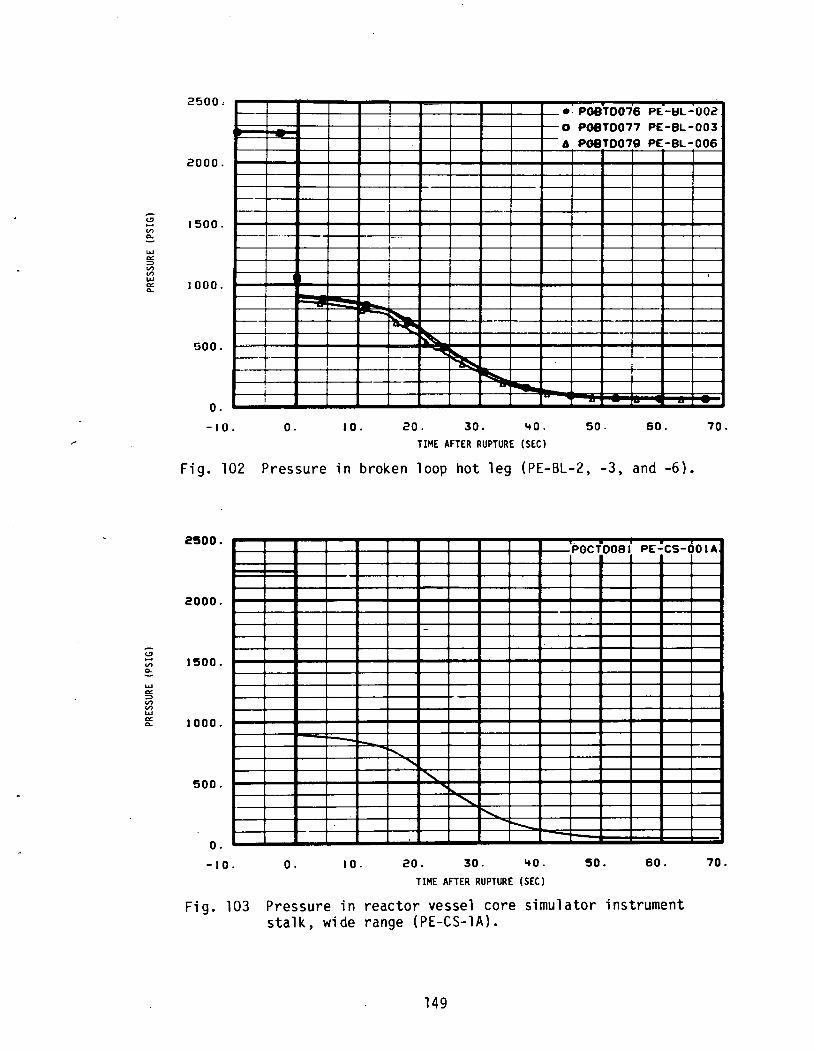
~ -VI a..
UJ
"" ::::> VI VI UJ
"" a..
<.!1 -VI 0-
UJ
"" ::::> VI
~ "" 0-
2500.
2000.
1500.
1000.
500.
o. -10.
---- -· .. ·~- -· -·
--
T l
I
o. I 0.
•-PGBT0076 PE.-I::fL-OOc? 0 P08T0077 PE-BL-003
6 P08T0079 PE-BL-006
--····
'
~ ---~ ~
"""''': ~ ~ -~
20. 30. '+0. 50. 60. 70.
TIME AFTER RUPTURE (SEC)
Fig. 102 Pressure in broken loop hot leg (PE-BL-2, -3, and -6).
2500. POCTOOBI PE-CS-00 l A.
2000.
1500.
1000.
500.
o. -10.
- 1-o.
o. I 0.
-
........
' """
............. .......... ....._
20. 30. '+0. 50. 60.
TIME AFTER RUPTURE (SEC)
Fig. 103 Pressure in reactor vessel core simulator instrument stalk, wide range (PE-CS-lA).
149
70.

<!I ..... VI 0..
.... ~ VI VI .... 0:: 0..
<!I
VI 0..
'" 0::
~ VI .... .. 0..
300.
200.
100.
o. -10.
--
-
o. 10.
fGCr~ P£~.fs-_QJU-f-
1 NOTE: DATA ARE BEYOND INSTRU-
\ MENT RANGE UNTIL T0 + 31 SEC. -
1 \
\ \
' ' '\ '
.
20. 30. ItO. 50. eo. '70. .
TIME AFT~R RUPTURE (tEC)
Fig. 104 Pressure in reactor vessel core simulator instrument· stalk, narrow range (PE-CS-lB).
noo.
aooo.
1'500;
1000 .
500.
o. -10.
·-
·-
- .......
o. 10.
• POPT0083 P£-PC-001 a POPT0081t P£-PC-002 A POPT0085 P£-PC-OOJA
. -- -- .
-- --.
..........
"""-~
"' .............. --.
20. 30. '+0. !50. eo. '70. TIME AFTER RUPTURE (SEC)
Fig. 105 Pressure in intact loop cold leg, hot leg, and steam generator outlet (PE-PC-1, -2, and -3A).
150

<!> -~ .... "" :::>
"' "' "" "" 0.
<!> -"' ~ .... "" :::> V>
"' .... "" 0.
300.
eoo.
100.
o. -10. o. I 0.
·-
P10PTqOB6 PE-f:!C-oq3B
\ NOTE: DATA ARE BEYOND INSTRU-
\ MENT RANGE UNTIL T0 + 31 SEC.
\ \
1\ ... ._.... -.,,.. ....
\ \ r\
'\
""' 20. 30. ItO. 50. 60. 70.
TIME AFTER RUPTURE (SEC)
Fig. 106 Pressure in intact loop steam generator outlet, narrow range (PE-PC-38).
2500.
2000.
1500.
1000.
500.
o. -10.
1\c ~
'
o.
'\..· ~
' \ l ~
\ \ A
......
I 0.
• POPT0083 PE-PC-001 a PGPT008'+ PE-PC-002 A PGPT0'+62 PE-PC-OOI_t
\. ~
-....
""" ~ ""'111:
""' ~ 20. 30. ItO. 50. 60. 70.
TIME AFTER RUPTURE (SEC)
Fig. 107 Pressure in intact loop cold leg, hot leg, and pressurizer (PE-PC-1, -2, and -4).
151
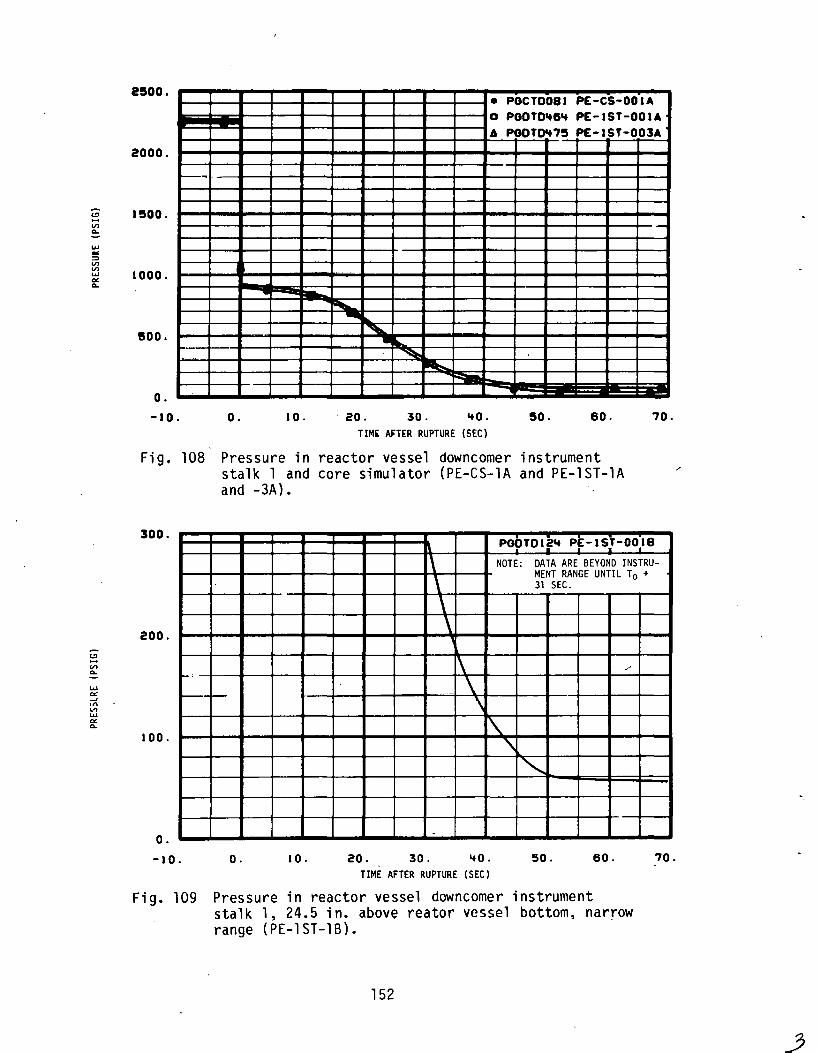
~ -"' 0..
..... .. ~
"' "' ..... Ct! 0..
<.!J -"' 0..
..... Ct! .J II\ VI ..... Ct! 0..
2!500. • Pocrooal ~cs..:ooiA a PODTD~8~ PE-IST-OOIA A ~Ut~7!5 PE-IST-003A
2000.
1!500.
1000 .
soo.
o. -10.
~·
o. 1 0.
"' ... ""' • ...
' ~ . 20. 30. 1+0 . !50. 60.
TIM~ AFTER RUPTURE (SEC)
Fig. 108 Pressure in reactor vessel downcomer instrument stalk 1 and core simulator (PE-CS-lA and PE-lST-lA and -3A).
·-
i! 70.
300. POOT01~1+ PE-15]-0018
\ NOTE: DATA ARE BEYOND INSTRU-
200.
100.
0.
-10. o. 1 0.
\ \ \
\ \ \
1\.
.
20. 30. ItO.
TIME AFTER RUPTURE (SEC)
MENT RANGE UNTIL T0 + 31 SEC.
_.,
'\
""' 50. 60.
Fig. 109 Pressure in reactor vessel downcomer instrument stalk 1, 24.5 in. above reator vessel bottom, narrow range (PE-lST-18).
152
70.

/
300.
~ Pootof2e PE-I:sr-o1o3B I ~. I
\ I
DA~A ARE1
BEYO;D INS+RU-·NOTE:
i MENT RANGE UNIT T0 + 30 SEC.
250.
200. \ <..!> -~/ -· •.. ..... "" ::::>
"' "' ..... "" 0..
<..!> -"' 0..
...... "" ::::>
"' "' ..... "" 0..
1\ \
150.
~ '\
100.
1'-...........
5o:
o. -10.0 o.o 10.0 20.0 30.0 &tO.O 50.0 60.0 70.0
2500.
2000.
1500.
1000.
500.
o. -10.
TIME AFTER RUPTURE (S£C)
Fig. 110 Pressure in reactor vessel downcomer instrument stalk 1, 209.4 in. above reactor vessel bottom, narrow range (PE-lST-38).
• POCT~3 PE-c&-001~~ a ~~5 PE-IST-001~ A PODTOe&te PE-IST-D03F~
I . I I I I -NOTE: INSTRUMENTS DISPLAY
TEMPERATURE SENSITIVITY AFTER ~ T0 + 10 SEC.
""""' • """" ........ ~ --....
-o. 10. 20. 30. ItO. 50. eo. 70.
TIME AFTER RUPTURE (SEC)
Fig. 111 Pressure in reactor vessel core simulator and downcomer instrument stalk 1 (PE-CS-lFF and PE-lST-lFF ~nd -3FF).
153
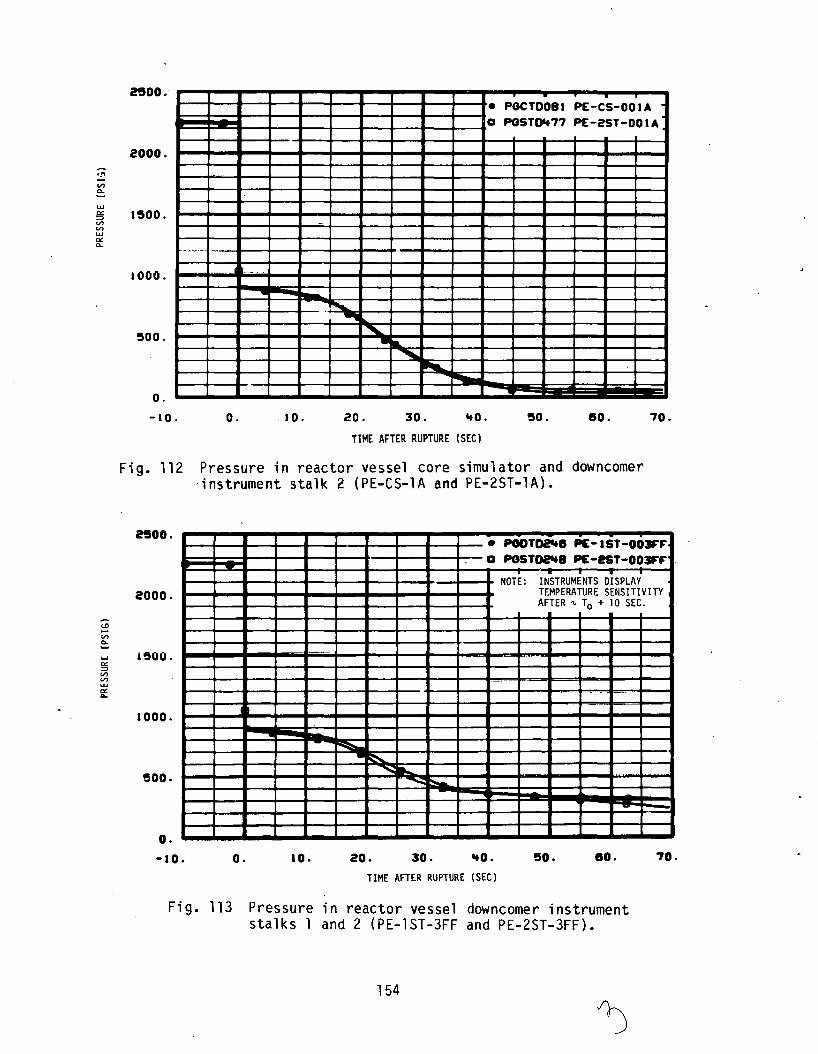
·-~ V) 0...
w § V) V) w c:r:: 0...
<.ll -V) 0...
.... c:r:: :::> V) V) ~
c:r:: ...
2500:
2000.
1500.
1000.
500.
0.
-10.
-
........ , ... _ ··~·~-
o. I 0.
. • POCTDOBI PE-CS-OOIA a PGSTOI+77 PE-2ST-OOIA.
-
,...,.,. .. """"" • ..
"""" ~ ~
20. 30. ItO. 50. eo. 70.
TIME AFTER RUPTURE !SEC)
Fig. 112 Pressure in reactor vessel core simulator and downcomer -instrument stalk 2 (PE-CS-lA and PE-2ST-1A).
2500.
2000.
i~OO .
1000.
!!500.
o. -ao. o. 10.
• PODT~e PE-IST-OOJFF a PGST~B PE-2ST-OOJFF . . •
NOTE: INSTRUMENTS DISPLAY TEMPERATURE SENSITIVITY AFTER ~ T0 + 10 SEC.
- -
- --
--
~ • ~
........:: ..... ......... ~
-=
20. 30. ItO. 50. eo. 70.
TIME AFTER RUPTURE (SEC)
Fig. 113 Pressure in reactor vessel downcomer instrument stalks 1 and 2 (PE-1ST-3FF and PE-2ST-3FF).
154

<; -Vl c..
w 0:: ::::> Vl Vl ...... 0:: c..
<!I -Vl c..
...... 0:: ::::> Vl Vl w 0:: c..
noo.
2000.
1500.
1000.
500.
o. -ao.
r-'
-
•'''""""
o. 10.
• • I _. I
• POCT~~ PE-CS-002FF D POST~& PE-2ST-003FF
NOTE: INSTRUMENTS DISPLAY JTEMPERATURE SENSITIVITY
AFTER ~ T0 + 10 SEC.
~ • -....
"""'''i! .... -- .... -
20. :so. ~o. 50. eo. 70.
TIME AFTER RUPTURE (SEC)
Fig. 114 Pressure in reactor vessel core simulator and downcomer instrument stalk 2 (PE-CS-2FF and PE-2ST-3FF).
50.0
'tO.O
30.0
20.0
10.0
o.o
-10.0
-10.0
Fig. 115
POTTD088 PE-SV-001
~ ,_. ._..,
k..
/ "'" -/ ,
r /_
"" lit I'
' NOTE: INITIAL SLOWDOWN SUP-
PRESSION TANK PRESSURE IS ADJUSTED TO 0 PSIG.
j_ _I .L _I_ _j_
o.o 10.0 20.0 30.0 'tO.O 50.0 60.0 70.0
TIME AFTER RUPTURE (SEC)
Pressure in blowdown suppression tank bottom under downcomer 4, 180° (PE-SV-1) (filtered to 60Hz).
155

~ "' "· ...... "" :::>
"' "' ...... p< P-,
@ ..... "' ... '" p< -VI
"' ...... 0: ...
50.0 POTTOO&O PE-SV-003
~to.o . .- -
L 1 .
30.0 L L
J L ......... , ...... .~-···· ~-
20.0 I ~
~ 1\ ...,j ,. 1 ....
lO.O ................. ., .... ,.,,H, .. ~, _.,._
·-
o.o NOTE: INITIAL BLOIWOWN SUP-
PRESSION TANK PRESSURE IS ADJUSTED TO 0 PSIG.
-10.0 I I I I I
-10. o. I 0. ?.0. 1+0. liO. eo. 70.
TIME AFTER RUPTURE (SEC)
Fig. 116 Pressure in b1owdown suppression tank across from duwm;umer 1, 157. 5'-' ( PE-SV-3).
50.0 POTT0096 PE-SV-0 lit.
ltO.O ~ ........
r""--. -/ -30.0 /
/'
20.0 .;~
~ it'
10.0
o.o NOTE: INITIAL BLO\~DOWN SUP-
PRESSION TANK PRESSURE IS ADJUSTED TO 0 PSIG.
-10.0 I I
-10. 0. I 0. 20. 30. ItO. 50. 60. 70.
TIME AFTER RUPTURE (SEC)
Fig. 117 Pressure in b1owdown suppression tank header above downcomer 4, 321° (PE-SV-14}.
156
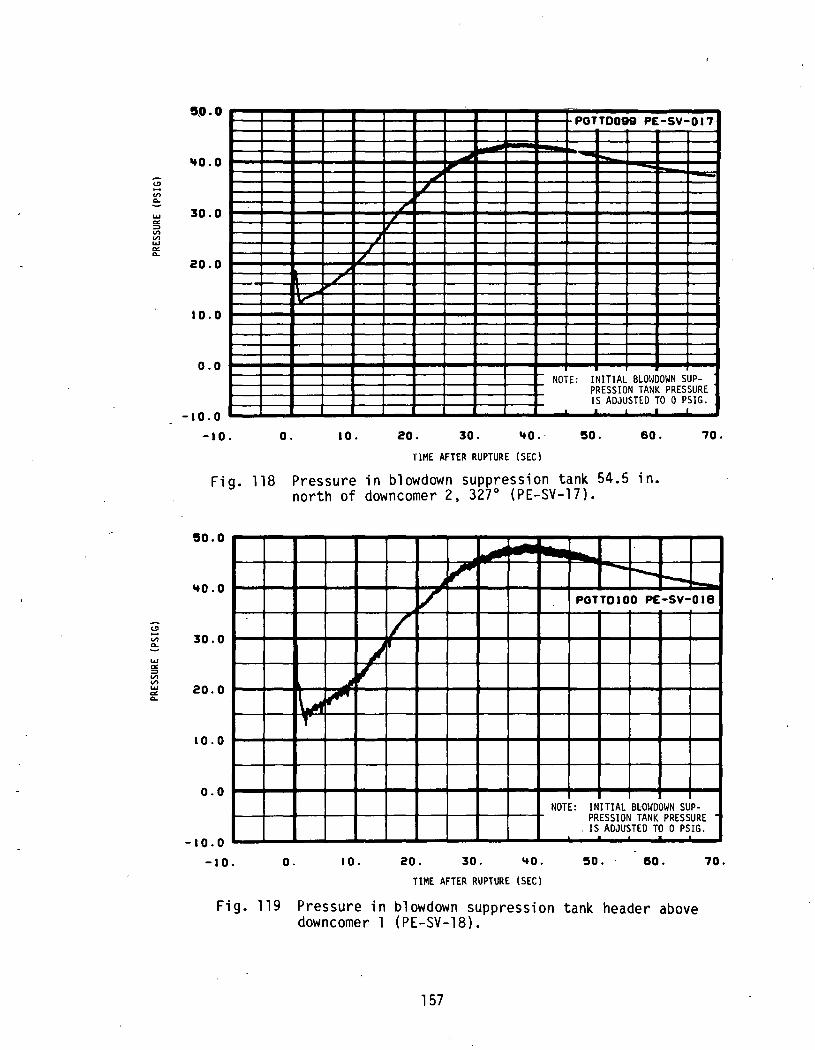
~ -V'> 0..
.... "" ~ V'> V'> .... "" 0..
<.!l -"' 0..
.... "" ~ V'> V'> .... "" 0..
5,P.O
'+0.0
30.0
20.0
-· 10.0
0.0
-10.0
-10.
Fig. 118
50.0
'+0.0
30.0
20.0
10.0
o.o
-10.0
-10.
o.
POTTD099 PE-SV-017
....., - "-, "" -~
L , ~
J L
/
IV'
NOTE: INITIAL BLO\~DOWN SUP-PRESSION TANK PRESSURE IS ADJUSTED TO 0 PSIG •
I I . I
I 0. 20. 30. '+0.· 50. 60. 70.
llME AFTER RUPTURE (SEC l
Pressure in b1owdown suppression tank 54.5 in. north of downcomer 2, 327° (PE-SV-17).
--~,. --. r--.. ...._ lo-...
v POTTDIOO PE-SV-018
/ )'
~ ~
\...1 ;""'
l
NOTE: INITIAL Bl.:OI~DOWN SUP-PRESSION TANK PRESSURE
. IS ADJUSTED TO 0 PSIG.
o. 10. 20. 30. '+0. 50 . . 60. 70.
TIME AFTER RUPTURE (SEC)
Fig. 119 Pressure in b1owdown suppression tank header above downcomer 1 (PE-SV-18).
157
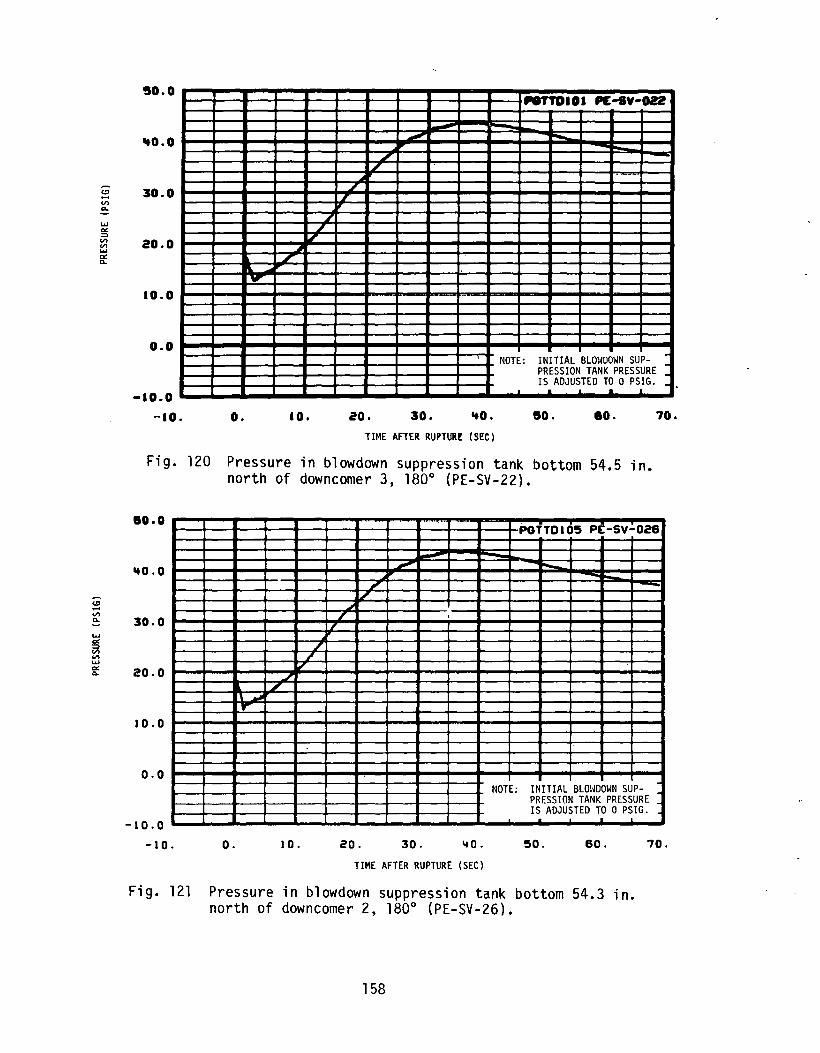
<!l -VI 0..
...... "' => VI VI ... ex 0..
<!l -VI 0..
...... "' ~ ..., ...... "' 0..
50.0 NTTDIOI P£-sv-022 ·
-- ro-... -ltO.O
" " -··-·
30.0 ,
I
~ I
20.0 1£ ~
I
I r 10.0 . -
o.o -NOTE: INITIAL BLOt~DOWN SUP-PRESSION TANK PRESSURE : IS ADJUSTED TO 0 PSIG. _
-10.0 . • L _.a.
-10. o. 10. ao. 30. &tO. so. eo. 10.
TIME AFTER RUPTUR~ (S~C)
Fig. 120 Pressure in b1owdown suppression tank bottom 54.5 in. north of downcomer 3, 180° (PE-SV-22}.
ao.o POTT0105 PE-SV-028
~
'tO.O ~ - -f IL
30.0 ,
' . I,
_, f
20.0 ~ .L
I L \ .Mil ..
10.0
o.o NOTE: INITIAL BLOI~DOWN SUP-
PRESSION TANK PRESSURE IS ADJUSTED TO 0 PSIG .
-10.0 ._.ll ..L
-10. o. 10. 20. 30. ItO. 50. 60. 10.
TIME AFTER RUPTURE (SEC)
Fig. 121 Pressure in b1owdown suppression tank bottom 54.3 in. north of downcomer 2, 180° (PE-SV-26}.
158

"" .... Vl
~ w
"' => Vl Vl w "' 0..
"" .... Vl 0..
w "' => Vl Vl w.
"' 0..
so.o -·
'tO.O
30.0
20.0
10.0
o.o
-10.0
-10.
Fig. 122
so.o
'tO.O
30.0
20.0
10.0
o.o
-10.0
-10.
---POTTOIII PE-SV-O't3
_, -~
/ ./ ,
~ ./ --_L
·--
I
Jr 1\ ...-.....
--
NOTE: INITIAL SLOWDOWN SUP-PRESSION TANK PRESSURE· IS ADJUSTED TO O.PSIG . . .
o. I 0. 20. 30. ItO. 50. eo. 70.
TIME AFTER RUPTURE (SEC)
Pressure in b1owdown suppression tank bottom under downcomer 2, 180° (PE-SV-43}.
POTTOIII!S PE-SV-055
-__... ,
" .<II
.I
L I
/ ......
l/
tiOTE: INITIAL BLOt~DOWN SUP-PRESSION TANK PRESSURE· IS ADJUSTED TO O.PSIG.
o. 10. 20. 30. ItO. 50. 80. 70.
TIME AFTER RUPTURE (SEC)
Fig. 123 Pressure in b1owdown suppression tank top 6 in. north of downcomer 4, 0° (PE-SV-55}.
159
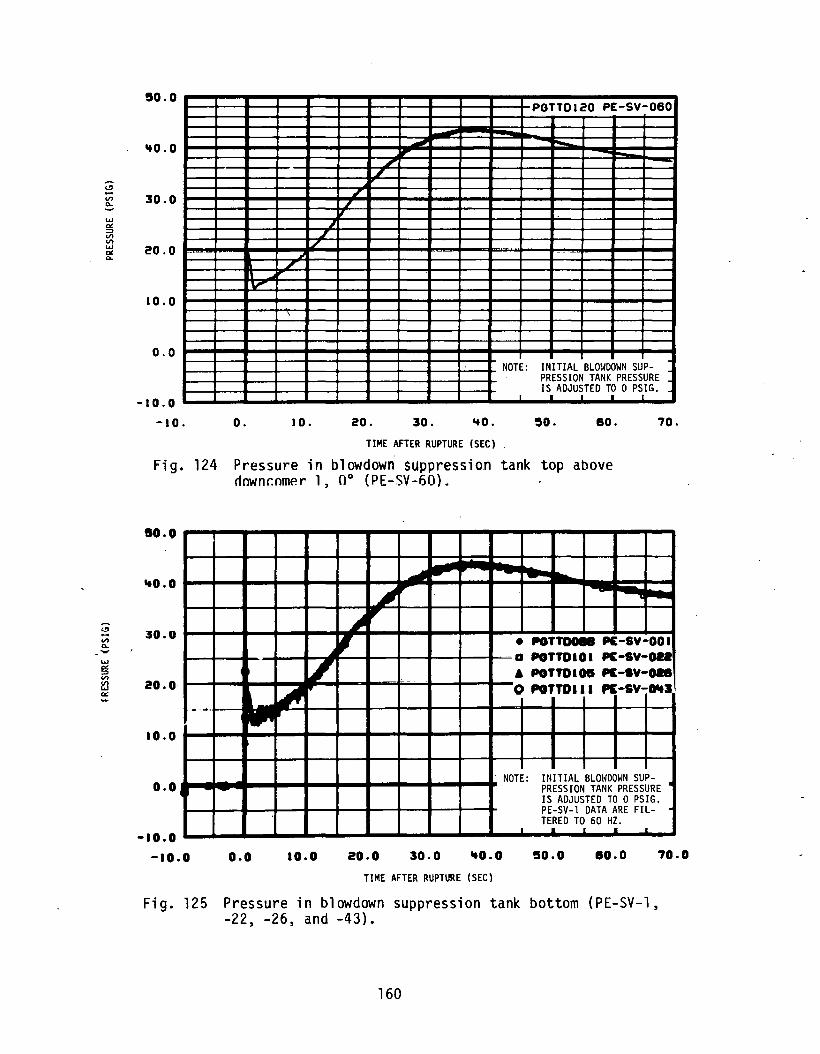
<.!l -V'l ... -..... "" :::::> V'l V'l ..... "' "-
L~ -V'l a.. .... ..... "" :::::>
"' !::] "' ~
50.0 POTT0120 PE-SV-060
ltO.O ~ ~ ..,. / -_,
30.0 ~ I
~ J
20.0 I./ -··---_,
v 10.0
\
o.o ' NOTE: INITIAL BLO\~DOWN SUP-
PRESSION TANK PRESSURE
-10.0 IS. ADJUSTED T~ 0 PS/G·
-10. o. I 0. 20. 30. ItO. 50. 60. 70.
TIME AFTER RUPTURE (SEC)
Fig. 124 Pressure in b1owdown suppression tank top above c1ownr.omf!r 1, 0° (PE-SV-60).
50.0
ltO.O Jj -
~ -30.0
20.0
~ , , • POTTDOIB PE-SY-001
... a POTTDIOI PE-SY-OU
~ A POTTDIOS PI-SY-018 0 POTTDIII PE-SY-:-1111
-_ .. , 10.0
o.o · NOTE: INITIAL BLOHDOWN SUP-PRESSION TANK PRESSURE ' IS ADJUSTED TO 0 PSIG. PE-SV-1 DATA ARE FIL-TERED TO 60 HZ.
• I . . -ao.o -ao.o o.o 10.0 20.0 30.0 50.0 eo.o 70.0
TIME AFTER RUPTURE (SEC)
Fig. 125 Pressure in b1owdown suppression tank bottom (PE-SV-1, -22, -26, and -43).
160
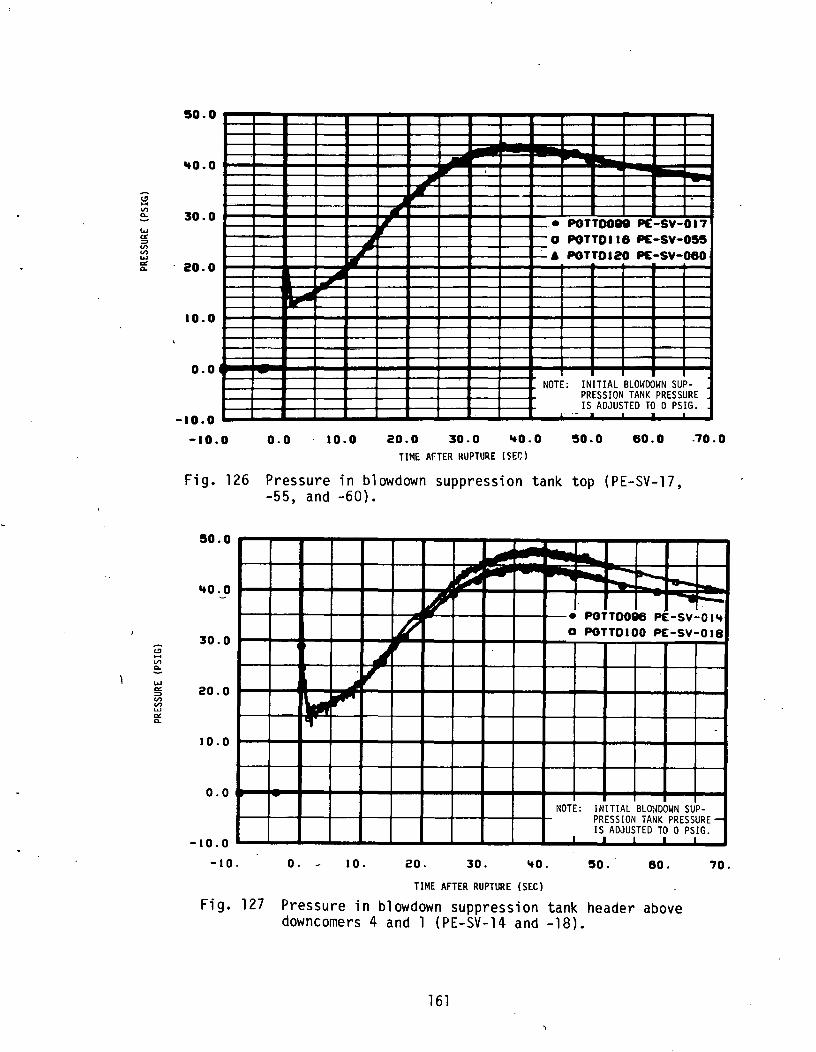
~ VI 0..
w a: :::> VI VI .... "' 0..
<.!1 ... VI 0..
.... "' :::> VI VI w
"' 0..
!50.0 I I I
ltO.O -~ ~ --~
--·- ·-· •.. • I .. POTT0088 P£-SV-017 30.0
~ 0 POTTOil6 PE-SV-0!5!5
" A POTTOI20 PE-SV-060 ... .. 20.0 _, ..... .,
10.0
~----
o.o NOTE: INITIAL BLOWDOWN SUP-
PRESSION TANK PRESSURE IS ADJUSTED TO 0 PSIG.
-1o.o . . --10.0 o.o 10.0 20.0 30.0 ltO.O !50.0 60.0 .70.0
TIME AFTER RUPTURE (SEC)
Fig. 126 Pressure in b1owdown suppression tank top (PE-SV-17, -55, and -60).
!50.0 -IG:
~ ---. II....._ -""""- ~
• POTT0086 PE-SV-OIIt [gJ a POTTOIOO PE-SV-018
~to ._o
30.0
~ ~
, ~ ~
20.0
,. -
10.0
o.o NOTE: I Nl TIAL BLOWDOWN SUP-
PRESSION TANK PRESSURE·-
-10.0 I I S
1 ADJU~TED T~ 0. PS
1IG.
-10. o. - I 0. 20. 30. ItO. !50 .. eo. 70.
TIME AFTER RUPTURE (SEC)
Fig. 127 Pressure in b1owdown suppression tank header above downcomers 4 and 1 (PE-SV-14 and -18).
161

<!) ..... V)
~ ... a: ::. V) V) ... a: ...
<!) -V) C>.
... a: :,::, V) V) ... "" CL.
600. PGFTDi 35 PT-PI2!):Q_~~
r--
501).
'+00.
300.
200.
100.
o. -10.
2500.
eooo.
1500 .
1000.
500.
o. -10.
i"'\
\ 1\
\ \
\
\ ··-'
\
" N -.....;;;;;,:
o. I 0. 20. 30. '+0. 50. 60. 70. TIME AfTER RUPTUR~ (!!C)
Fig. 128 Pressure in ECCS lower plenum injection line (PT-Pl20-64).
• POFTO.I35 PT-PI20-05'+ D POOT0'+5'+ PE-IST-OOIA
-
"
7
··--· ·-·
i"e.... ............ ...
"' -...;~ ~ ~
o. I 0. 20. 30. '+0. 50. 60. 70.
TIME AFTER RUPTURE (SEC)
Fig. 129 Pressure in ECCS lower plenum injection line and lower plenum (PT-Pl20-64 and PE-lST-lA).
162
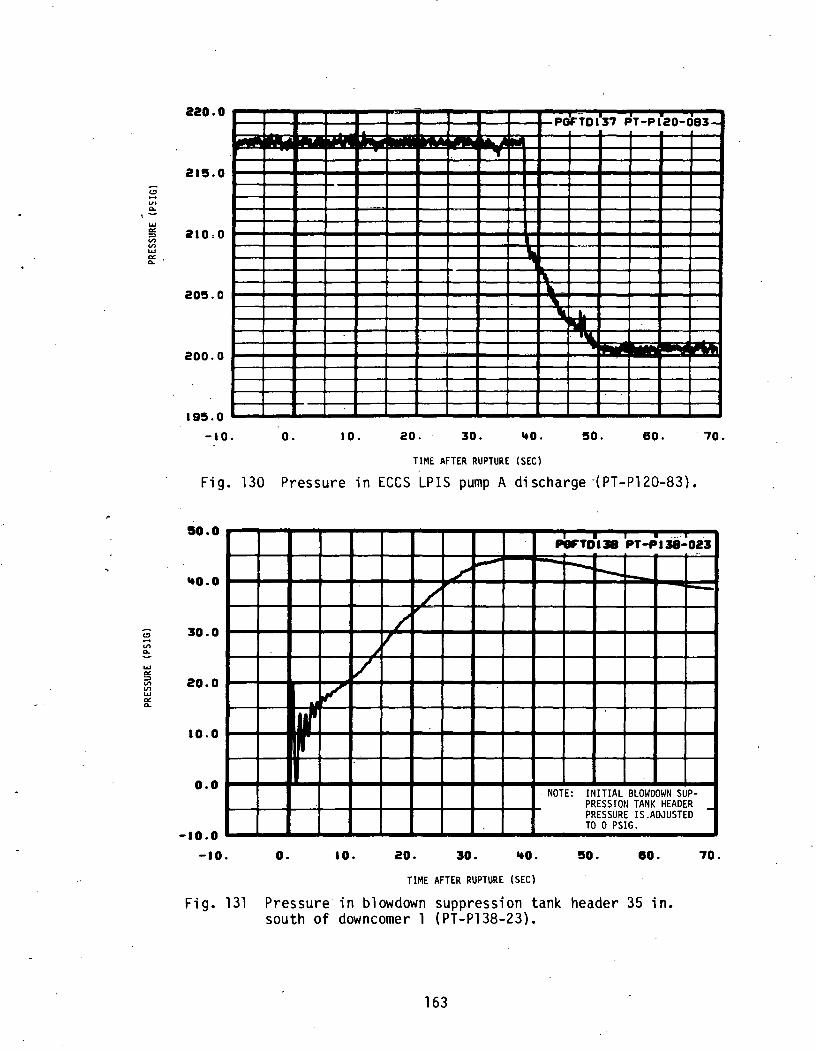
~ -VI .,_ ,~
.... "' => VI VI .... ~-
~ -VI c..
.... "' ~ VI .... "' c..
220.0
21!5.0
210.0
20!5.0
200.0
19!5.0
-10.
-
o. I 0.
I POFTOi37 PT-Pi20-083-j_ .. ...
...
·- ··-• ~
• -" 'Ia •• IW ...... .. -20. 30. ItO. !50. 60. . 70.
TIME AFTER RUPTURE (SEC)
Fig. 130 Pressure in ECCS LPIS pump A discharge -(PT-P120-83).
!50.0 ...,.,o•• 1PT-Pa38·,;o23 ..
'tO.O / .,..- --..
t-- .._
/ -30.0 /
II' ~
20.0 /
&J ,F
10.0
' o.o II NOTE: INITIAL BLOWDOWN SUP-
PRESSION TANK HEADER -PRESSURE IS.ADJUSTED TO 0 PSIG.
-ao.o -ao. o. ao. 20. 30. 'tO. !50. eo. 70.
TIME AFTER RUPTURE (SEC)
Fig. 131 Pressure in b1owdown supp.ression tank header 35 in. south of downcomer 1 (PT-P138-23).
163

A <..!) -V'l 0..
... 0:: ::::> V'l
~ 0:: 0..
·~ '·" ~ ... 0: ::::> VJ V'l .... g:
eo.
eo.
ItO.
so.
20.
I 0.
o. -10.
··-
r-
-, ~
rf 1
o.
~ / • POFT01t71t PT-PI38-055
A a POFT0125 PT-PI38-056
/ ' & .,.
~
I 0. 21). ItO, 50. 60. "10.
TIME AFTER RUPTURE (SEC)
Fig. 132 Pressure in blowdown suppression tank top (PT-Pl38-55 and -56).
2500.
2000.
1500.
1000.
500.
o. -10. o.
-..... --
10.
• POFTOit78 PT-PilQ-002 D POFT0127 PT-PilQ-003
~ ~ ~ ~ -.; ~ ~ .......
--..; ~
20. 30. ItO. 50. 60. 70.
TIME AFTER RUPTURE (SEC)
Fig. 133 Pressure in intact loop hot leg venturi (PT-Pl39-2 and -3).
164

~ "-"" c .... .... "-
.V')
"-~ "-
"-<!I .... c
.... 0< :::> 1-< 0< ..... "-ffi 1-
2000. ; • SRPT~78 AP£-PC-001 ' - "' ;·a SRPT~78 AP£-PC-002 ..
" 1500. ' Ill. ' ... ~
1000. .....
"""' ... - ...
"--.,... ~
500. ""''I! q == --.... I . ....., .... . ..........
o. ' ...
-500.
-10. o. 10. 20. 30. ItO. 50. eo. 70. TIME AFTER RUPTURE (SEC)
Fig. 134 Pump speed for intact loop pumps 1 and 2 (RPE-PC-1 and -2).
600.
500 .
'tOO.
300.
-10.
.. ..
0. 10.
• TEBT0178 TE-BL-001 0 TEST0179 TE-BL-002 6 TE8TD180 TE-BL-003
~ ~
~ \.. NOTE: DATA ARE QUALIFIED
WHILE INSTRUMENT IS '\ IM~1ERSF,D. DATA DIS-
1'- PLAY HOT WALL EFFECTS AFTER "' 40 SEC.
" 1\.. ""-h ~
. ~ ~ L
..... b.... ..... ,;A ~ -"' I"-. I ~ fL'
20. 30. ItO. 50. 60. 70.
TIME AFTER RUPTURE (SEC)
Fig. 135 Temperature in broken loop cold leg, hot leg, and reflood assist bypass system (TE-BL-1, -2, and -3).
165
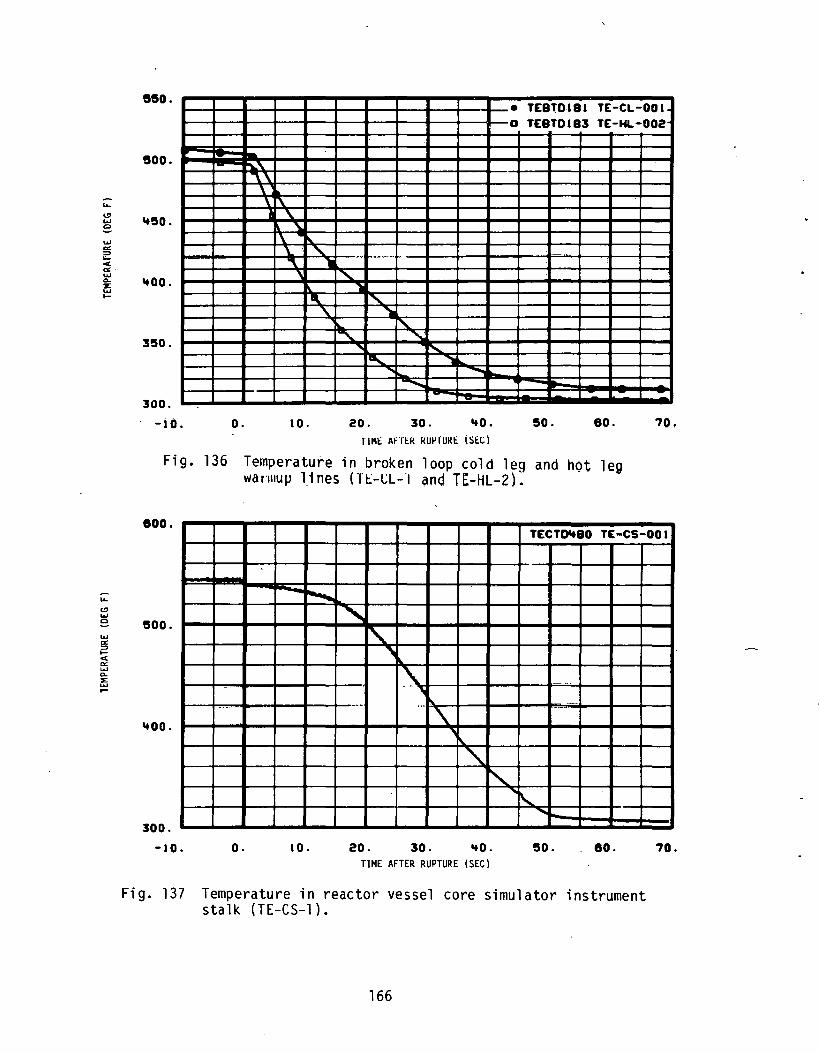
;: <!) w e w 0:: :::> .... < 0:: w 0..
~ 1-
... <!) w e w 0:: :::> 1-< 0:: w 0.. E w ,...
550. • T£81:0181 TE-CL-001 a TEBT0183 TE-HL-002
500.
't50.
&tOO.
3!50.
300.
-iO. o.
"' ~ \ \
) r\:
'" ~ \
'"- ., ~ ... '
Ill
"
I 0.
-.~ .. .................. '
"' " "' ""' "' ""'\.. "' " Ia.... """ii ..... -.........
20. 30. &tO. 50. 60.
liME AfflR RUI'rUKI:: iSH;)
Fig. 136 Temperatute in broken loop cold leg and hot leg wanuup 1_1 nes {TI::-CL-1 ~nd TE-HL-2).
eoo.
-~
70,
TECTD'tBO TE-CS-001
!500.
&tOO.
300.
-10.
--
r--.....
o. I 0.
-
"" f'-" '\. -.' .... ~ ... -,
~ ~
1\.. .....
20. 30. &tO. 50. . eo. TIME AFTER RUPTURE (SEC)
Fig. 137 Temperature in reactor vessel core simulator instrument stalk (TE-CS-1).
166
70 .

i:
"' ..., e ..., c:: ::::> t-C( c:: ..., ~ ..., t-
i:
"' ..., c
..., c:: ::::> t-C( c:: ..., 0-:E: ..., t-
.
eoo.
500·
'tOO.
3oo. -10.
-~
o. 10.
• TEPTOI85 TE-PC-001 a TEPTOI88 TE-PC-002 6 TEPTOI87 T~-PC-003 l _l l I
NJTE: ~ATA A1RE QUlLIFIE~
I' WHILE INSTRUMENT IS
~ IMMERSED. DATA DIS-PLAY HUT WALl, EFFECTS
-~ AFTER "' 3D SEC.
~~ ......
1'-J ,~ L_ n... ~ll ~ ~ -"-
l~ ...........
" ~ --~
" ~ ....._, _.
20. 30. ItO. 50. eo. 70.
TIME AFTER RUPTURE (SEC)
Fig. 138 Temperature in intact loop cold leg, hot leg, and steam generator outlet (TE-PC-1, -2, and -3).
aeo. ' TEF"TD501 TE-PllB-022 -
~ ~ i"""'"
150. lo""
v /
1/ ~
1'+0 . /
/ v
/ , 130. /
~
/ ./
120.
-10. o. I 0. 20. 30. '+0. 50. eo. 70.
TIME AFTER RUPTURE (SEC)
Fig. 139 Temperature in blowdown suppression tank 1 i quid at tank bottom (TE-Pl38-22).
167

..... <!I w 0
w a: ~ t-< a: w 0. ::E w t-
~ <!I w e w a: ~ t-< a: w 0. ::E .... I-
280. TE~T~g TE-P138-03'+
270.
280.
250.
2'+0.
230.
220.
210.
200.
190.
180.
-10.0
·-
.7 .,.,-/
o.o 10.0
-I .......... /
1/ ~
/
7 -
I I
7 7
20.0 30.0 '+0.0 50.0 eo.o TIME AFTER RUPTURE (SEC)
Fig. 140 Temperature in blowdown suppression tank vapor at tank top (TE-Pl38-34).
\
7CJ.o
550. • TE~TD1SMS TE-P138-062 a TE~T0187 TE-P138-083
500.
'+50.
'+00.
350.
JOO. -10.
'
o.
""'iiiitiL
I'll.
""' Ia.
'
10.
.........._ ~
r""'oo..
"- ...... ..... ~ - ........._
llil::
""' ~""'\;...
1"" T "\.:
~
~
-..... ........ ~ -
20. 30. '+0. 50.
TIME AFTER RUPTURE (SEC)
Fig. 141 Temperature in broken loop cold leg QOBV inlet and isolation valve inlet (TE-Pl38-62 and -63).
168
...
-eo. 70.
)

1: ::tl Q
.... 0:
. => 1-« 0: .... c.. ::E .... .....
1: <!l .... e .... 0: => 1-< 0: .... c.. ::E .... 1-
lt!50.
ltOO.
3!50.
300.
-10.
~
o.
'\..
"" "\. '" .:\. .... ._
' ~
'
I 0.
·-
• TEF'TOIQS TE-PI38-965 a TEF'TOISI9 TE-P138-065
~ _)l_
'\..
' '"'\.
' \.. ~ ' "'- '-
A 1'- ' -
..... :".. ~
"""""' .... ~ .A ~ ..., ~ -
20. 30. ItO. !50. eo. 70.
TIME AFTER RUPTURE {SEC)
Fig. 142 Temperature in broken loop hot leg QOBV inlet and isolation valve inlet (TE-Pl38-66 and -65).
700.
8!1).
eoo.
!5!50.
!500.
lt!50.
ltOO.
-ao.
Fig. 143
• TEF'T0201t TE-P138-018 a TEF'T020!5 TE-P138-020
I I I
I I I -- . . . - ....... NOTE: TEMPERATURE IS BELOW i""o..' INSTRUMENT RANGE AFTER ... L " T 0 + 24 SEC . .
"' '" .. '" '"
~
"' • 1'-'-
"""""" .... .....
o. 10. 20. 30. ItO. !50. eo. 70.
TIME AFTER RUPTURE {SEC)
Temperature in intact loop pressurizer vapor and liquid (TE-Pl39-19 and -20).
169
,
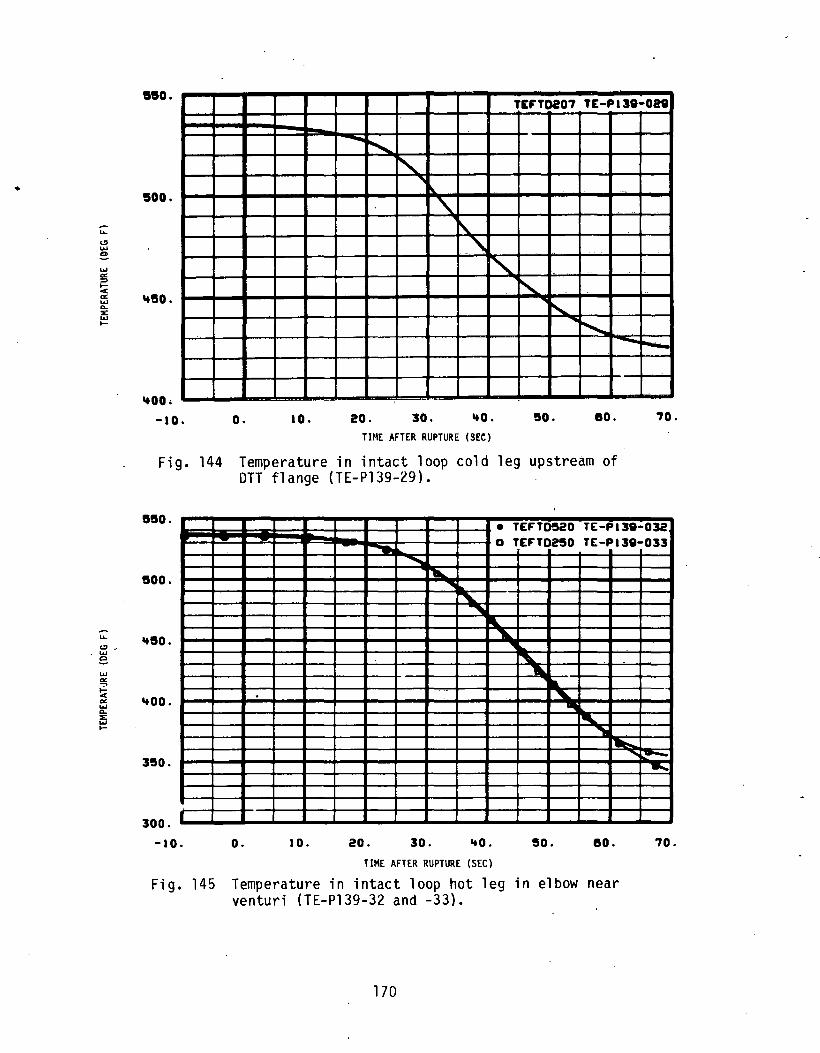
..
... <..!> ... e ... a< :::> ..... < a< ... 0..
ffi .....
... <..!> -... e ... a< ~
!;( a< ... 0.. ::E ... .....
sso. TEFT0207 TE-PI38-028
-' ' ~ soo. '" . ..
'· \.. ' ..
' ' 'tSO . "-
"- --...
'tOO· -10. o. 10. 20. 30. ItO. so. eo.
TIME AFTER RUPTURE (SEC)
Fig. 144 Temperature in intact loop cold leg upstream of OTT flange (TE-Pl39-29).
r--
70.
sso. • TEFT0520 TE-Pl38-032
-.. a TEFT02SO TE-P138-033
soo.
'tSO.
'tOO.
3SO.
I 300.
-10.
.
o. I 0.
.......... "11....
"'IIIo.
' "' ""-'
20. 30. ItO.
TIME AFTER RUPTURE (SEC)
' ' .. ' ... ~
"""" ......
so. eo.
Fig. 145 Temperature in intact loop hot leg in elbow near venturi (TE-Pl39-32 and -33).
170
~ ......;;;;
70.
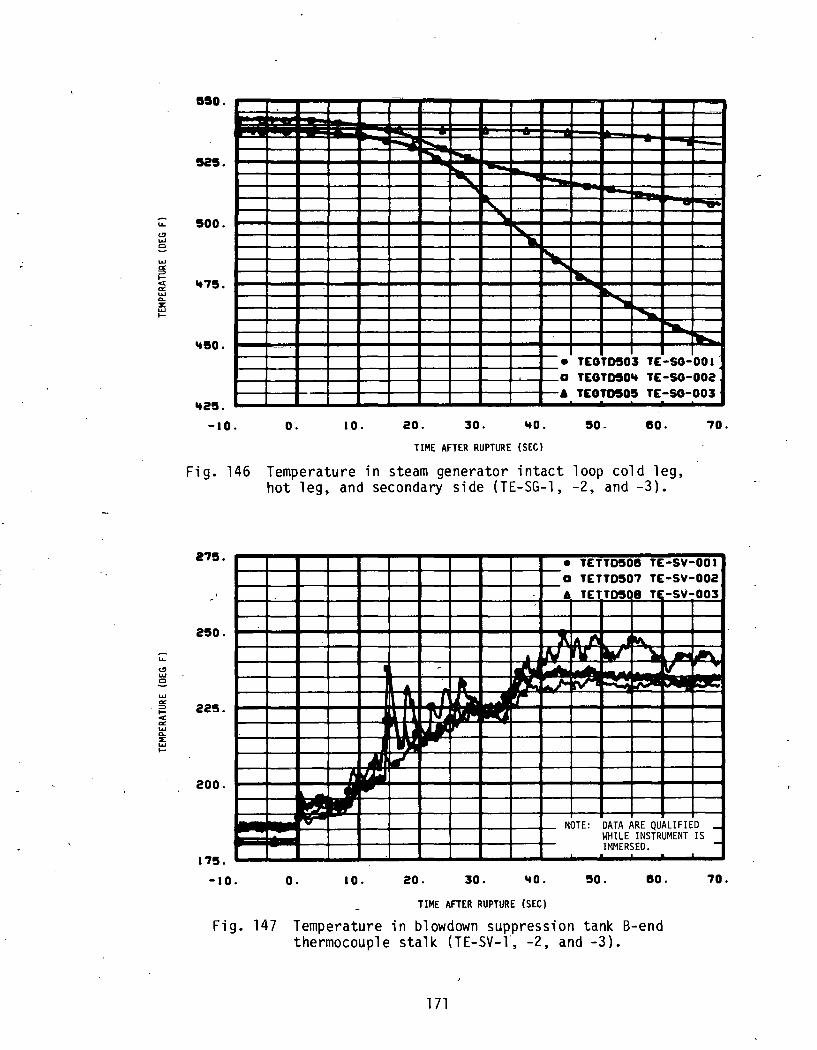
.... CJ ... e ... a:: :::> 1-< a:: ... 0.. ::E: ... 1-
.... <!) ... c
... a:: :::> ... < a:: ... 0.. ::E: ... 1-
550.
525.
500 .
't7!5.
'tiiO.
't2!5.
-10.
Fig. 146
i ..._
,~ """'-~ r-...
llio. ...... ... " ~ - :--~
" -,. ~ ~
r-.. ... ....... ~
r""'a. ~
• TEGTD!503 TE-S0-001 D TEGTD!50't TE-S0-002
·A TEGTD!50!5 TE-S0-003
o. I 0. 20. 30. 'tO. !50. eo. 70.
TIME AFTER RUPTURE (SEC)
Temperature in steam generator intact loop cold leg, hot leg, and secondary side (TE-SG-1, -2, and -3).
27!5. ~~~~----+---~---4----~---~~----+---~-• TETT0!50e TE-SY-001 ~~~~---+---~---4-~~---~~---+---~-D TETT0!507 TE-SY-002
6 TETTD!508 Tl -SY-003
2!50 .
22!5. l\
\ IIJ ""
MK.r' 200. Jtl'f
...'J v-
-
N I.
~ :::..:: ~ - I~ l\f ..,. t n;; W:l'" ir\1""'
NOTE: DATA ARE QUALIFIED -WHILE INSTRUMENT IS IMMERSED. -
17!5. L-~---L--~~~_.--~--._~--~--~~--~----~~-*--~
-ao. o. I 0. 20. 30. 'tO. !50. eo. TIME AFTER RUPTURE (SEC)
Fig. 147 Temperature in blowdown suppression tank B-end thermocouple stalk {TE-SV-l, -2, and -3).
171
70.
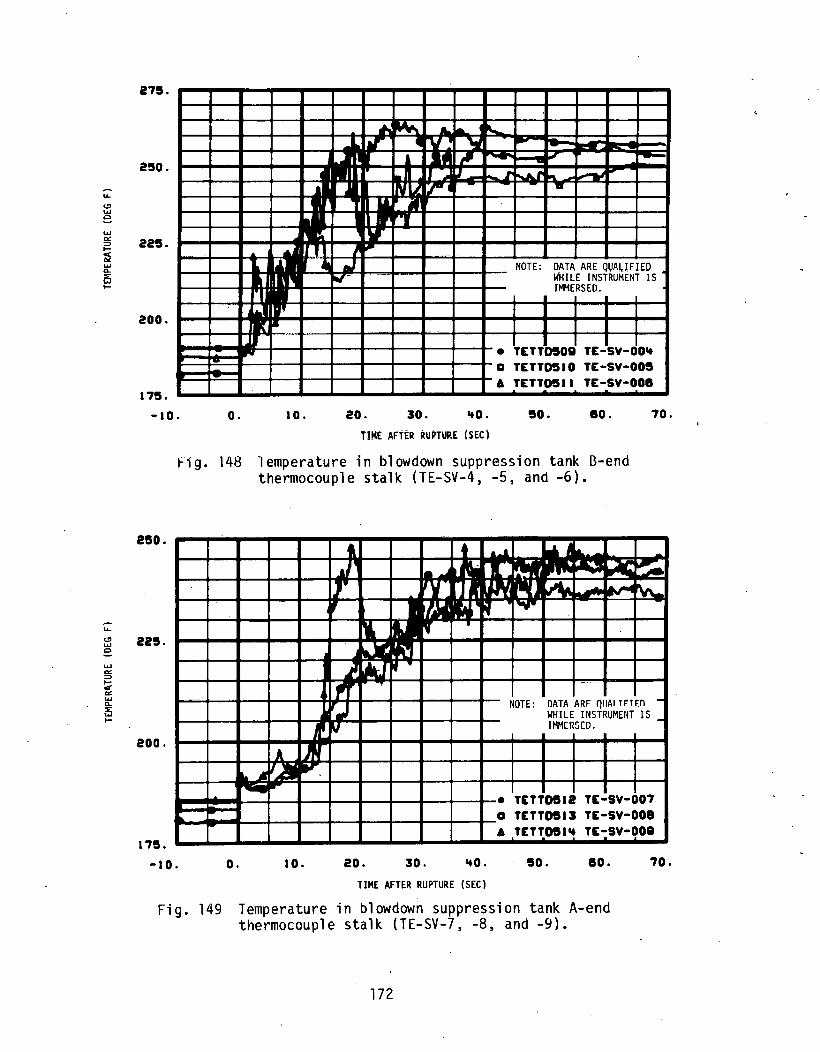
.... <.!> w e w
"" ::::> 1-
~ w Q_
i!J 1-
;:;: <.!> w 0
w
"" ::::> 1-
"" "" w Q_
:E w 1-
27!1.
2!10.
22!1.
200.
175.
-10. o.
J 41
" JJ"
I 0.
"' ~ a.. ia..4 ...... • ItT .. \1 ' 'Jl -
l ... ~ -ill I J I' o,JIJ ~ -1\j ll r •
Ill .I ..rr
"" /4, ~
,.) NOTE: DATA ARE QVALJ.FIED ..,.. WHILE INSTRUMENT IS IMMERSED.
• rE 'ti)Soa TE-SY-~Oit a TETTD510 TE-SY-00!1 6 TETTD511 TE-SY-OOe
20. 30. ItO. 50. eo. 70.
TIME AFTER RUPTURE (SEC)
fig. 148 Temperature in blowdown suppression tank B-end thermocouple stalk (TE-SV-4, -5, and -6).
eso.
225.
200.
175.
-10.
... .. ......
o.
A Jl ~-
I 0.
l t ,....J. iW .... -.J~ •...4-MI ~ ... -..
~ ...... ... 1' ~ ~- ... .- ""-~~if/~: ,
~ " .. ,,. llATA ARF C)IIAI TrTEn -
II" IIIII NOTE:
WHILE INSTRUMENT IS _
~ IMMCR!JCD.
• TETT0512 TE-SY-007 a TETT0513 TE-SY-008 6 ·-.:_oe -- -TET lit T~'";tY"'!'U•
20. 30. ItO. 50. eo. 70.
TIME AFTER RUPTURE (SEC)
Fig. 149 Temperature in blowdown suppression tank A-end thermocouple stalk (TE-SV-7, -8, and -9).
172

... <.!> UJ 0
UJ
"' ::::> 1-< "' UJ a.. ::E UJ 1-
;:: <.!> UJ 0
UJ
"' ::::> 1-< "' UJ a.. ::E ..... 1-
2'75.
aeo.
225.
200.
17e.
-10. o.
I 9 I w- ·-. .. "" II " I -
,_ J"W ~ ~
(]' l II JU' ¥ ~ ~
aJl IT r.7il' ~ • ~I""'·•
~
NOTE: DATA ARE QUALIFIED _ WHILE INSTRUMENT IS IMMERSED. -
·e r&TTJdl! TE-5V-Cl10 D TETTO!I8 TE-SV-011
·a T£TTI)517 TE-SV-012
10. 20. 30. ItO. eo. eo. 70. TIME AFTER RUPTURE (SEC)
Fig. 150 Temperature in blowdown suppression tank A-end thermocouple stalk (TE-SV-10, -11, and -12) •
. ., ...
2eo.
22e.
100.
17e.
-10.
l rw"""'
o.
.n ~ 11r • r..r JIJ
l 0.
• TET TE'"'SV-001 1"1 T~T1 DIU TIE-SV-110'7
~ ~ * A... \1 ,..,....
JtJ ll' I ~ ~:f
I W)ll' ... ~ J-,J ~
NOTE: DATA ARE QUALIFIED WHILE INSTRUMENT IS -IMMERSED. .-
eo. 30. ItO. eo. eo. '70.
TIME AFTER RUPTURE (SEC)
Fig. 151 Temperature in blowdown suppression tank 107.2 in. from tank bottom (TE-SV-1 and -7).
173

.... <.D .... e .... "" :::> ..... cr. '"' .... <>-lE: .... .....
;: ffi e .... ~ ..... < "" ..... <>-lE: .... .....
no.
118 .
200 •
178.
-ao. o.
I
J -~
10.
I 'Wit _.. _ ..... ..
rw ..... ......
,J '
~
NOTE: DATA ARE QUALIFIED -WHILE INSTRUMENT IS
I I IMMERfED. I I -
• TE rTbeoi TE-"sv-o'oa a TETTOSIJ TE-SV-008 . . - .
eo. JO. 'tO. !50. eo. 70.
TIME AFTER RUPTUR~ (SEC)
Fig. 152 Temperature in b1owdown suppression tank 93.0 in. from tank bottom (TE-SV-2 and -8).
250.
225.
200.
175.
-10.
---
o.
1\
AJ 1
..... ~ 1--' ~ ...
10.
' .AI ~ }.
~ w~ \ .,A ~ .......... ""-f I ~
_., If-"" :~ ~ - Ia_,
,_ .... ..,.,
~ -~ I IV' ~
14 ~ ~ ~ '\ ,. -~ II"""'
"
NOTE: DATA ARE QUALIFIED -WHILE INSTRUMENT IS IMMERSED. -
i I I I I
i • 'rEr-losoa TE~SV-003
I 0 1 TET1051~ TE-SV-009 -I I
20. 30. '+0. 50. 60. 70.
TIME AFTER RUPTURE (SEC)
Fig. 153 Temperature in b1owdown suppression tank 74.7 in. from tank bottom (TE-SV-3 and -9)~
174

i: <.!> ..... e ..... a:: => 1-< a:: ..... a.. E ..... 1-
"-<.!> ..... e ..... a:: => !;( a:: ..... a.. E ..... 1-
. ., .. ISO.
··~·
100.
. ., .. -ao.
..... ,..
o.
•
Ia If . 11
11'1'
Ia. •• iiJll ~ I ~
I 0. 10.
' ,.. ·-~ -' "
>
I
NOTE: DATA ARE QUALIFIED • WHILE INSTRUMENT IS • IMMERSED.
• TITTDSOI h -;. .;:.
a TETTDSI TE~Iv-~10 I _l I
10. ItO. eo. 10. TIME AFTER RUPTURE (SEC)
Fig. 154 Temperature in b1owdown suppression tank 57.2 in. from tank bottom (TE-SV-4 and -10) •
. , .. 180.
••••
100.
. ., .. -ao. o.
....
A~ Ill I~
10.
•J n r u• .... ~
ll' I..IU II._ I, INM•
J.l't"lr' ~' •
u
eo. 30. ItO.
TIME AFTER RUPTURE (SEC)
~ ~
r.-' -"" ~
NOTE: DATA ARE QUALIFIED -WHILE INSTRUMENT IS IMMERSED. -
• ·~, ,ug·ao TE-av-ooe D
1 TETIDS18 TE;IV•Oll
so. eo. 'JQ.
Fig. 155 Temperature in b1owdown suppression tank 39.0 in. from tank bottom (TE-SV-5 and -11).
175

.... <.!) .... c
.... 0: j: < 0: .... a.. :£ .... .....
.... <.!) .... ,.....
w ,.. ::0 ..... < rv .... a.. :£ w .....
275.
250.
225.
200.
175.
-10. o.
lVI ,.l IlL
... ~Ill\ l..l n~ IIIII ~ 'I lift IIV v•
I 0.
• TETT0511 TE:..sv-ooe o TETT0517 TE-SV-012
--"' ~
r::r ... - """
rJ.~ ~ ""'- ........., ~ r -, .. ~ J. If I ~
1 '".l ,rr 11 -~
..J ~
NOTE: DATA ARE QUALIFIED WHILE INSTRUMENT IS -IMMERSED • -• .
20. 30. '+0. 50. 60. 70.
l'lME AFTER RUPTURE (SEC)
Fig. 156 Temperature in blowdown suppression tank 14.7 in. from tank bottom (TE-SV-6 and -12).
600.
500.
'+00.
300.
eoo.
-10.
-
o. I 0.
• 'rEOTb518 TE-IST-001 a TEOT02U TE-IST-002 6 n::oroeae TE-a.sr-oo3 0 TEOT0213 TE-IST~OO~
" ----...
' ~ ' ~
' ~ ~ .... -
"'""""""" ....
20. 30. '+0. 50. 60. 70. TIME AFTER RUPTURE (SEC)
Fig. 157 Temperature in reactor vessel downcomer instrument stalk 1 (TE-lST-1, -2, -3, and -4).
176

L: <.!) ...... e ...... "' i= < "' ...... 0.. :E ...... 1-
eoo.
300.
200.
-10.
Fig. 158
600.
500.
'+00.
300.
200.
-10.
• TEOT021!5 TE-IST-008 a TEOT0217 TE-IST-008 6 TEOT0218 TE-IST-008
- lo TEOT021SJ TE-IST-010 ~ ~ ~ ~
' ' " ~ ll ....
"""" ... .......
~ -...'
o. I 0. 20. 30. '+0. !50. eo. 70.
TJMF AFTER RUPTURE (S~C)
Temperature in reactor vessel downcomer instrument stalk 1 (TE-lST-6, -8, -9, and -10).
• TEOT0220 TE-IST-011 a TEOT0221 TE-IST-012 A TEOT0'+59 TE-IST~OI3 0 TEOT0223 TE-IST-01'+ -............ -~---
~ ~
" li! ' ..
' .. ... ~ ... .,.,
' ,._ ~
~
!""-~
o. I 0. 20. 30. '+0. 50. 60. 70.
TIME AFTER RUPTURE (SEC)
Fig. 159 Temperature in reactor vessel downcomer instrument . stalk 1 (TE-lST-11, -12, -13, and -14).
177

..... <.!) .... c
..... c<
i= ..: c< ..... c.. :::E ..... ....
;: t.!) .... c
..... !:!! .... ..: c< ..... c.. :::E ..... -....
800.
500.
'+00.
300.
eoo. -10.
. ..
-
o. l 0.
• TEST022'+ TE-2ST-002 D TEST0228 TE-2ST-00'+ A TEST0229 TE-2ST-007 0 TEST0231 TE-2ST-009.
~ '-. ..
"' " ' ._ '-
"'- -- ~
""- ...
"" ~ -·-. ~
20. 30. '+0. 50. 60. 70.
TIM[ AF-TER P.UPTUP.I:: ( SI::C)
Fig. 160 Temperature in reactor vessel downcomer instrument stalk 2. (TE-2ST-2, -4, -7, and -9).
800.
eoo.
ltOO.
31:\0.
eoo. -ao.
---
o. 10.
• TES1"02R TE..!2ST-OIO· a TEST0238 TE-2ST-OIIt: & TEST~~ TE-25T-DI2
............
'-lil
" ' ~ "' " II .... ~,... -......
~ '-. ..._ ~ ~
20. 30. '+0. 50. 80. 70. TIME AFTER RUPTURE (SEC)
Fig. 161 Temperature in reactor vessel downcomer instrument stalk 2 (TE-2ST-10, -12, and -14).
178
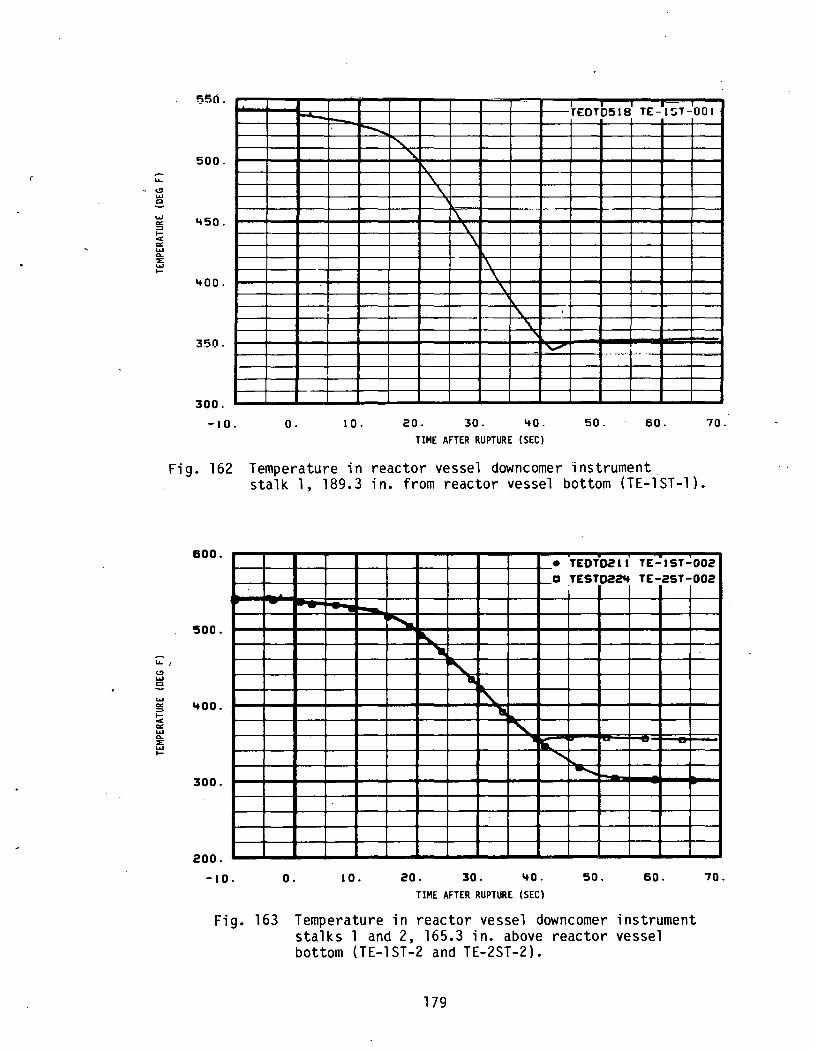
-LL..
<!I ... e ... 0:: => I-< 0:: ... 0.. ::E ... I-
500.
450.
400.
350.
300.
-10.
- -.......
o. 10.
'rEOT0518 TE-lST-001
f'.. "'-.
\. \.
:\. .... --- ~-
\: \.
I' \.
\.
' ' '\.
~ .......... ····· ..
20. 30. 40. 50. 60. 70. TIME AFTER RUPTURE (SEC)
Fig. 162 Temperature in reactor vessel downcomer instrument stalk 1, 189.3 in. from reactor vessel bottom (TE-tST-1).
LL..,
<!I ... c
... 0:: ::> I-< 0:: ... 0.. ::E ... I-
600. • TEOT0211 TE-IST-002 a ,TEST022't TE-2ST-002
500.
400.
300.
200.
-10. o. 10.
~ ~
"" ~ lll
"" --,. ~
lliL
' ........
20. 30. 40. 50. 60.
TIME AFTER RUPTURE (SEC)
Fig. 163 Temperature in reactor vessel downcomer instrument stalks 1 and 2, 165.3 in. above reactor vessel bottom (TE-lST-2 and TE-2ST-2).
179
70.

..... t:J .... e .... "' ::::>
~ "' .... Q.
E .... 1-
~ t:J .... e .... "' ::::> ,... < ...: ..... . .:.. E ..... 1-
eoo. TEOTD212 TE-·IsT-003
500.
'tOO.
300.
-10.
- -.........
o. I 0.
" r\. '\ I' ' \. ' ~
' '""" " 20. 30. ItO. 50. eo.
TiM~ AfH.II RIII'TURE (SFC)
Fig. 164 Temperature in reactor vessel downcomer instrument stalk 1, 141.3 in. above reactor vessel bottom {TE-1ST-3).
70.
eoo. • • TEOT02 a3 TE.: I ST .:OOit a TEST0228 TE-2ST-001t
500.
ltOO.
300.
200.
-10.
-
o. 10.
"""'-.. ~ ~
!'...
"" ""'" """ 1'-
'"' ~ .....
20. 30. ItO. 50. eo. TIME AFTER RUPTURE (SEC)
Fig. 165 Temperature in reactor vessel downcomer instrument stalks 1 and 2, 117.3 in. above reactor vessel bottom (TE-lST-4 and TE-2ST-4).
180.
70.

-.... <.!' ..... e ..... "" :::> 1-< "" ..... a.. ::E ..... 1-
;:: <.!' ..... e ..... "" :::> 1-< "" ..... a.. ::E ..... 1-
~oo.
eoo.
'+00.
300.
-10. o.
-,.._
I 0.
TEOT0215 TE-IST=008
'
K 1\.
' 1\ ... . .
" '" " ' -
' "" "" 20. 30. '+0. 50. 80. 70.
TIME AFTER RUPTURE (SEC)
· Fig. 166 Temperature in reactor vessel downcomer instrument
800.
500.
'+00.
300.
200.
-10.0
Fig. 167
stalk 1, 69.3 in. above reactor vessel bottom (TE-lST-6).
TEST)2H TE-2ST-007
' ' ' i'o..
" r\. ........ ~
" ............
o.o 10.0 20.0 30.0 '+0.0 50.0 eo.o 70.0
TIME AFTER RUPTURE (SEC)
Temperature in reactor vessel downcomer instrument stalk 2, 33.3 in. above reactor-~essel bottom (TE-2ST-7).
181

.... <.!I ..... e ..... "' ::::> 1-o:r: "' ..... ,_ :..: ..... 1-
L: <.!I ..... !::::! ..... a:: ~ < .... ~ ::E ..... 1-
eoo.
500.
'+00.
300.
-10.0
-~
o.o 10,0
TEOTb217 TE~IST-008
~ r\.
'\ 1'\.
' "\.
" "\. ~
"!I.. ""'
20.0 30.0 ltO.O eo.o eo.o 70.0
TIME AFTER RUPTUR~ (StCl
Fig. 168 Temperature in reactor vessel downcomer instrument
eoo.
soo.
'tOO.
300.
eoo. -10.
stalk 1,· l9.3 in. above reactor vessel bottom (TE-1ST-8).
• TEOTOI!18 TE-lST-008 Q TEST023l TE-esT-008
"""-~
'81. ["-. ~~
"-~
- I'--... .., -··- ·-
-.... ~
o. 10. eo. 30. 'tO. so. eo. 70. TIME AFTER RUPTURE (SEC)
Fig. 169 Temperature in reactor vessel downcomer instrument stalks 1 and 2, 25.3 in. above reactor vessel bottom (TE-1ST-9 and TE-2ST-9).
182
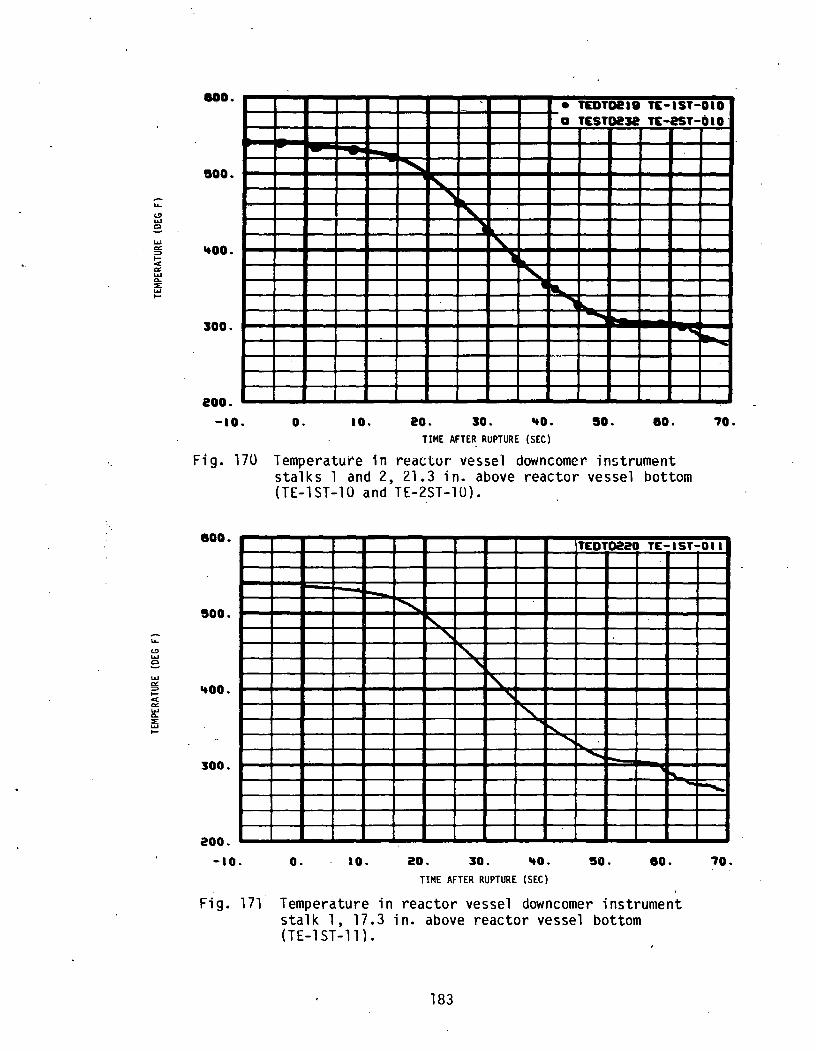
.: ..., ..... e ..... "' :::> I-< "' ..... Q.
::E ..... I-
.: ..., ..... e ..... "' :::> I-< "' ~ ::E ..... I-
eao. • TEDTDel8 TE-IST-DID a TESTD!Je TE-2ST-OID'
r-
SOD. """"' ~ "' ...
~ l
..oo. ' l "" ·--"' ~ .......... 300.
~ ....
200.
-ao. o. 10. 20. 30. .. o. TIME AFTER RUPTURE (SEC)
-
so . eo.
Fig. 170 Temperature 1n reactor vessel downcomcr in!itrument stalks 1 and 2, 21.3 in. above reactor vessel bottom (TE-lST-10 and TE-2ST-10).
'70.
eoo. TEDT0220 TE-lST-011
soo.
.. oo.
300.
200.
-ao. o. 10.
........... ~
' "\..
"' i"-. " "\..
~
"""""" ........ ~
20. 30. ..o. so. eo. TIME AFTER RUPTURE (SEC)
Fig. 171 Temperature in reactor vessel downcomer instrument stalk 1, 17.3 in. above reactor vessel bottom (TE-lST-11).
183
-~
'70.

.... <.!) .... e .... !5 ...., c(
"" .... 0.. ::E .... 1-
~ ·o.!J ....
Q
.... "" ~ c(
"" .... 0.. ::E ,,, 1-
eoo.
500.
&tOO.
300.
200.
-ao.
r-
o. I 0.
• TEOT0221. D TEST0231t
""""'-
' .,. ~
11
' • ' .. ... ,.
-...... -"-
20. 30. &tO. 50.
TIME AFTER nUPTUnC (SEC)
TE-IST-012 TE-2ST-Ol2
• I\\.. - .-~
..
60. 70.
Fig. 172 Temperature in reactor vessel downcomer instrument stalks 1 and 2, 13.3 in. above reactor vessel bottom (TE-lST-12 and TE-2Sf-12).
eoo.
500.
'tOO.
300.
200.
-10.
r--
o. I 0.
' I"-
' ' " " "
' ~ -
20. 30. 'tO.
TIME AFTER RUPTURE (SEC)
TEOTO&t59 TE-IST-013
"'" ....... "" ' -- -
50. 60. 70.
Fig. 173 Temperature in reactor vessel downcomer instrument stalk 1, 9.3 in. above reactor vessel bottom (TE-lST-13).
184

.... Cl .... e .... a: ~ ..... < ·a: .... 0..
ffi .....
.... Cl .... e .... a: ::> ..... < a: .... 0..
ffi .....
eoo. • TEOT0223 TE-IST-OIIt a ~~ST0238 TE-2ST-OI~
$00 .
'tOO.
300.
-10. o.
..... ~
~"' .r.·•
10.
" ~ ~
) ." .,. '\.
--all
"-~ ... "- . ..
20. 30. ItO. so. eo. TIME AFTER RUPTURE (SEC)
Fig. 174 Temperature in reactor vessel downcomer instrument stalks 1 and 2, 45.9 in. above reactor vessel bottom in DTTs (TE-lST-14 and TE-2ST-14).
70.
'tOO. TEF'TD2'tl TT-Pl20-08S
3SO.
300.
2SO.
200.
-10.
-
'
o. I 0.
"'
20. 30. ItO.
TIME AFTER RUPTURE (SEC)
~
' ' \ \ \
~
' ' 1\. '\.
so. 80.
Fig. 175 Temperature in ECCS lower plenum injection line (TT -Pl20-65).
185
" 70.

~~ '7 .
THIS PAGE
WAS INTENTIONALLY
·. LEFT BLANK


3. TEST L1-3 MEASURED PARAMETERS --
LONG - TERM PLOTS (175- AND 500-SECOND PLOTS)
This section of presented data consists of Figures 176 through 212.
187

.., .. .. 1-.... -E
"' ...J
.... ,_ -VI
"" w 0
...J < 0
"' 0 ::t: u
>,_ ..... VI :z w 0
...J < 0
"' 0 ::t: u 10
0
- 1 -25
Fig. 176
I ..
Fig. 177
DE-BL-1A DE-BL-16 DE -BL-1C
TIME AFTER RUPTURE (SEC) EGG-A-372
Density in broken loop cold leg, chordal density (DE-BL-lA, -18, and -lC).
DE-BL-2A DE-BL-28
•..••••••. DE-BL-2C
175
TIME AFTER RUPTURE (SEC) ~GG-A-368
Density in broken loop hot leg, chordal density (DE-8L-2A, -28, and -2C).
188
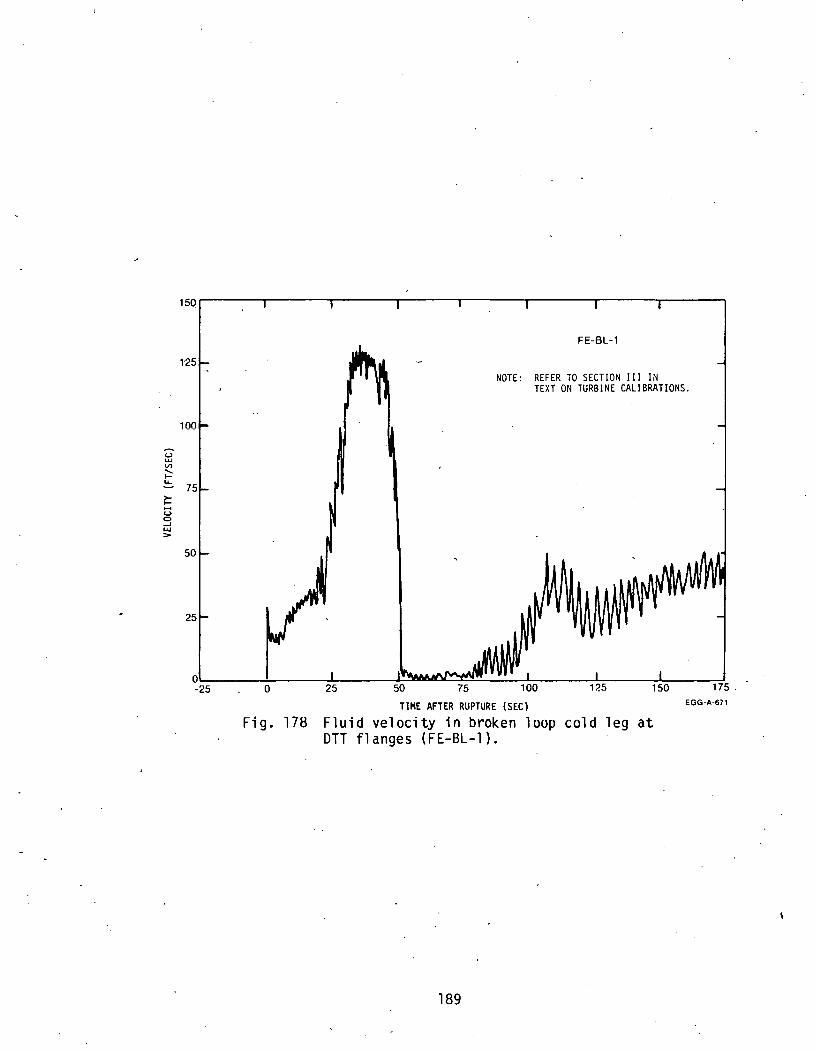
~ t) 0 --' ...... >
FE-BL-1
NOTE: REFER TO SECTION III IN TEXT ON TURBINE CALIBRATIONS.
0~------~------~------~~DA~~~-----L------~~----~------~ -25 0 175 .
TIME AFTER RUPTURE (SEC)
Fig. 178 Fluid velocity in broken loop cold leg at OTT flanges (FE-BL-1).
189
EGG-A-671
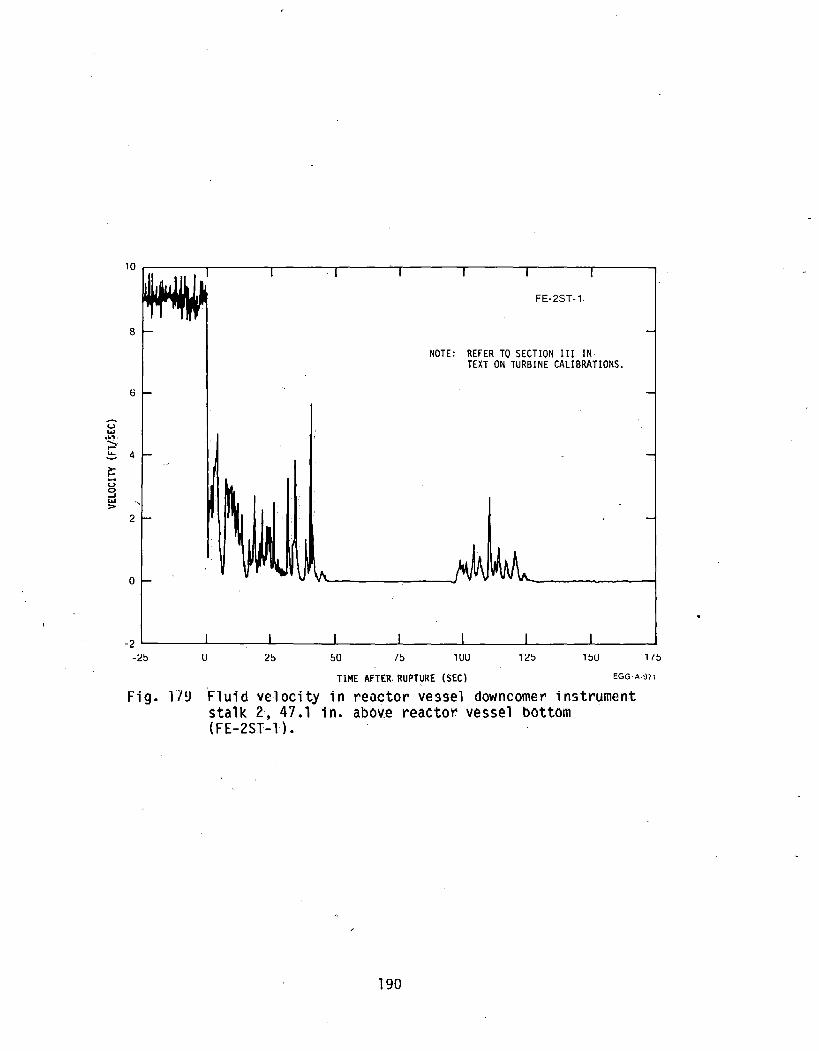
-<..> ..... .. ,
8
FE-2ST-1
NOTE: REFER TO SECTION III IN TEXT ON TURBINE CALIBRATIONS.
;;:r ~ 4
2
0
-2 ~------~~----~------L-------L-------L-------L-------L-----~ -:.1!:> u to 1UU 1ou 1/o
TIME AFTER. RUPTURE (SEC) EGG-A-911
Fig. 119 Fluid velocity in reactor vessel downcomer instrument stalk 2, 47.1 1n. above reactor vessel bottom {FE-2ST-1).
190

9 ...
10 --~-
NOTE: DATA ARE QUALIFIED AFTER T + 94 SEC ONLY. DATA A~E UNINTERPRETED PRIOR TOT +"94 SEC DUE TO MECH~NICAL NOISE.
FE-P138-138
-25 7!i 176 TIME AFTER RUPTURE (SEC) ·eGG-A-390
Fig. 180 Flow rate in blowdown suppression tank spray system 60-gpm header (FE-P138-138).
FE-P138-139
~~25~----~----~~----~~----~----~~----~~----~~----,~75
TIME AFTER RUPTURE (SEC) EGG-A·385
Fig. 181 Flow rate in blowdown suppression tank spray system pump discharge (FE-Pl38-139).
191

UJ 1-
~ 3 0 _. .....
.::E Q.
e w 1-
~ 3 0 _. .....
FE-P138-140
NOTE: RECORDED FLOW RATF. BETWEEN !n AND !a + 15 SEC DVE TO
- Mtt:HANicAL SHOCK.
0~----~~--~----~~--~~----~----~~--~~--~ -25 75 100 175 TIME AFTER RUPTURE (SEC) EGG-A-377
Fig. 182 Flow rate in blowdown suppression tank spray system 220-gpm header (FE-Pl38-140).
120 .....----1---...--1 --,--,--1~--..,.,----,.,--__,1,--------.
FE-P138-153 100 f- -
00 ~ -
~ -60
40 ~ -
-
I I I I . 1\ I I ~L25~----~oL-----~2!5~----~5o~----~7!5~--~,~oo~----~1~25~----~,5~o~--~175
Fig. 183
EGG-1\·389 . TIME AFTER RUPTURE (SEC)
Flow rate in blowdown suppression tank spray system pump recirculation line (FE-Pl38-153) .•
192

:z: .... _, w > ..... _, 8 :::>
8' _,
)
FT-P120-85
TIME AFTER RUPTURE (SEC) EGG-A-391
Fig. 184 Flow rate in ECCS LPIS pump A discharge (FT-Pl20-85).
Fig. 185
-·- LT-P138-33
---- LT-P138-58
NOTE: DATA DISPLAY INSTRUMENT RINGING FROM" T0 TO T0 + 2.5 SEC.
TIME AFTER RUPTURE (SEC)
Liquid level in blowdown suppression tank (LT-Pl38-33 and -58).
193
EGG-A-371
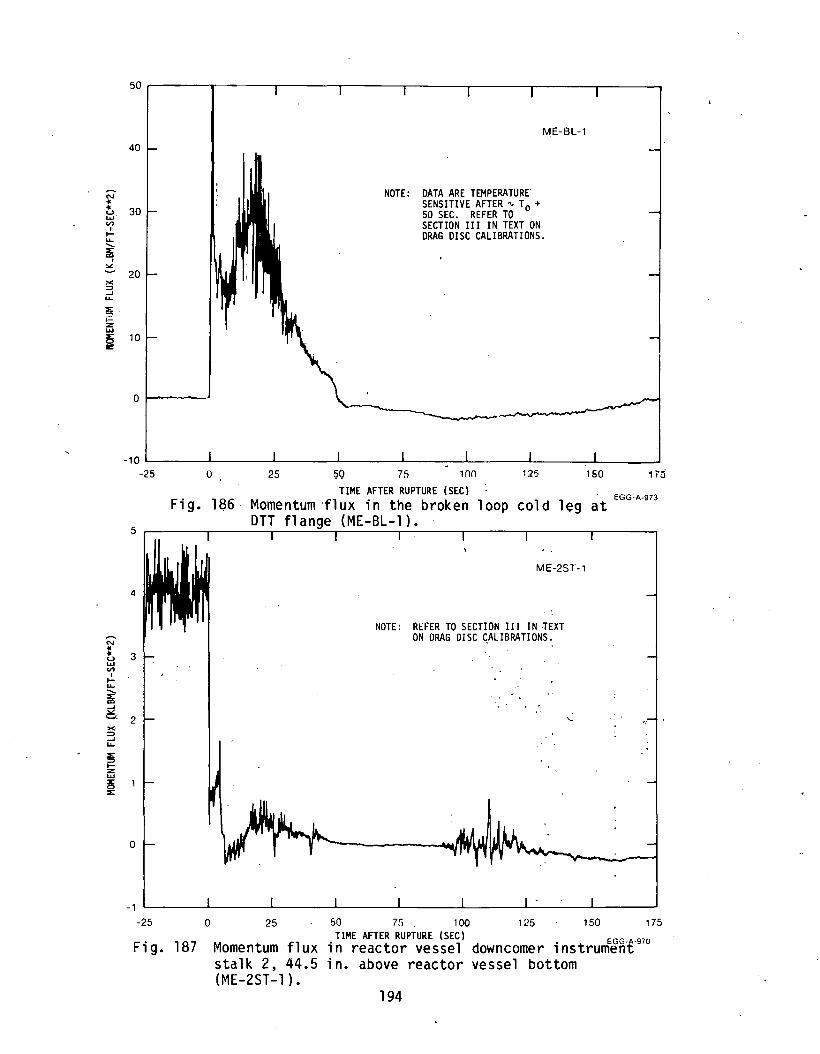
N ... ... ::.:l· VI
I 1-u. ...... ~
I
""' >< ::::> ...J u.
::£ =-1-z: ..... !5 ~
N ... ... u ..... "' I 1-u.
~ ...J
50
ME-BL-1
40
NOTE: DATA ARE TEMPERATURE
30 SENSITIVE AFTER~ T0 + 50 SEC. REFER TO SECTION III IN TEXT ON DRAG DISC CALIBRATIONS.
20
10
0 1---.....---~
-10L-------L-______ L_ ______ L_ ______ i_ ______ i_ ______ L_ ____ ~~----~
-25 0 25 7fi 100 125 160
TIME AFTER RUPTURE (SEC) · EGG-A-973
Fig. 186· Momentum ·flux in the broken loop cold leg at DTT flange (ME-BL-1).
5 r-------r-------r---~~r-------r-------r-------.-------r-----~
4
3
ME-2ST-1
NOTE: REFER TO SECTION III IN ·TEXT ON DRAG DISC GALIBRATIONS.
~- 2
0
-1
-25 0 25 50 7!i 100 125 150 175
• TIME AFTER RUPTURE (SEC) . EGG-~-97o Fig. 187 Momentum flux 1n reactor vessel downcomer 1nstrumen~
stalk 2, 44.5 in. above reactor vessel bottom (ME-2ST-l).
194
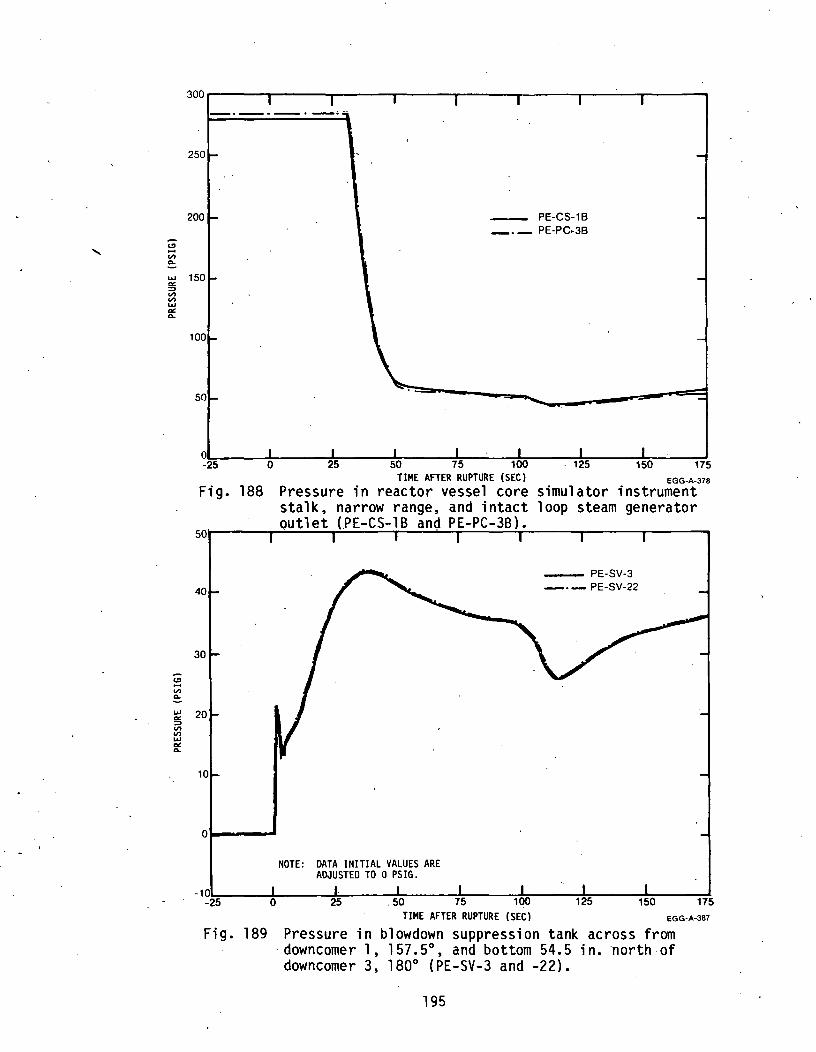
::e V) Q.
..... "" :::> V) V) ..... "" Q.
300r-----r-,----r-,----~.----~,----~,----~,----~,----~
-·-·--·-·-.
250 r-
200 -
150 -
100 -
50-
0 I -25 0
Fig. 188
50
oa----
'
l I 25
Pressure in
NOTE: DATA INITIAL VALUES ARE ADJUSTED TO 0 PSIG.
-
- PE·CS-18 --·- PE-PC·3B
-
-
L I l 125 150 HS
EGG-A-378
simulator instrument loop steam generator
- PE-SV-3 -·- PE-SV-22
-10~-----±-----~----~--~~---~~---~---~~----~ -25 . 50 75 100 HS TIME AFTER RUPTURE (SEC) EGG-A-387
Fig. 189 Pressure in blowdown suppression tank across from · downcomer 1, 157.5°, and bottom 54.5 in. north of downcomer 3, 180° (PE-SV-3 and -22).
195

;..... <!J -VI 0..
o~--..
--- PE-SV-55 -.- PE-SV-60
Note: Data Initial Values Adjusted to 0 psig.
. -1U~----~------~------~----~~----~~--~~~----~~--~ . - -25 175
..
·<!J -. VI ... -
TIME AFTER RUPTURE (SEC) EGC3-A·380
: Fig. 190 Pressure in blowdown suppression tank top north of. downcomer 4 and above downcomer 1 (PE-SV-55 and -60).
soor------T-----~--~~~----~r-----~-------r------,-~~~
PT-P12Q-64
TIME AFTER RUPTURE (SECl EGG-A-384
Fig. 191 Pressure in ECCS lower plenum injection line · (PT-P120-64).
196
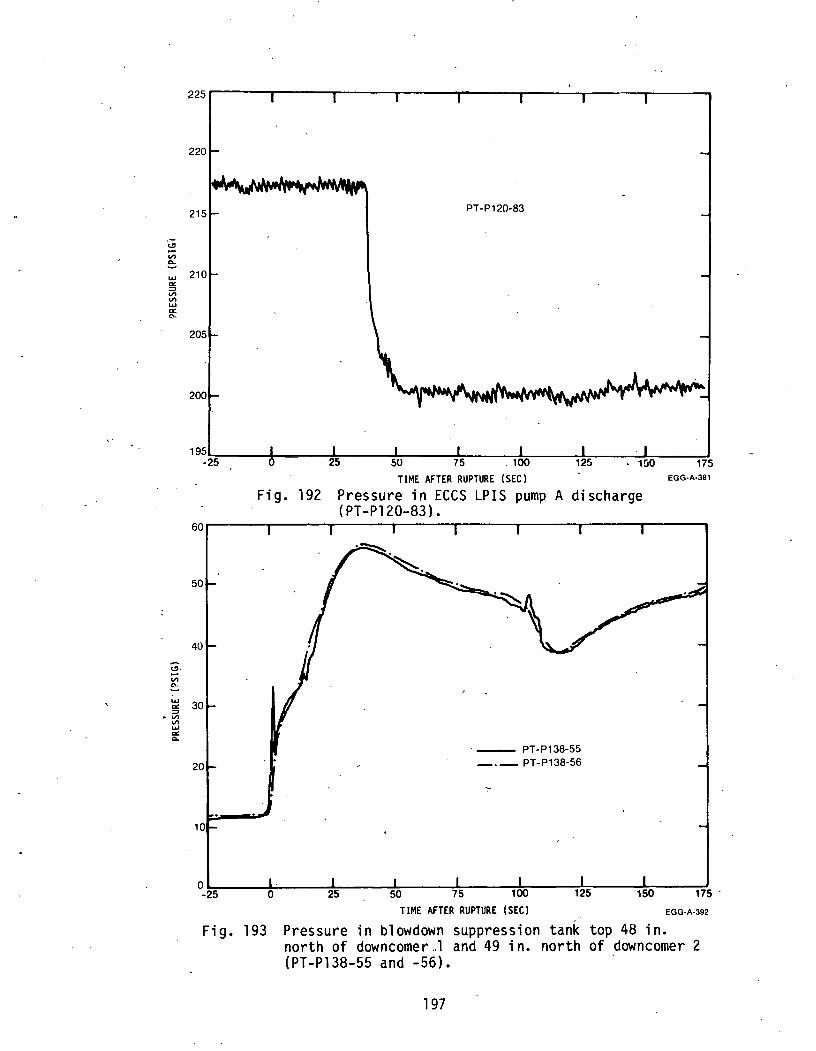
.-<..!> -V'l ~
""· -V'l .,_ ...... "" ::>
- V'l V'l ...... "" ~
PT-P120-83
195~----~------t.o----~~----~----~~----~~--~~----~ -25 50 75 . 100 175
TIME AFTER RUPTURE (SEC) EGG-A-381
Fig. 192 Pressure in ECCS LPIS pump A discharge (PT-P120-83).
·- PT-P138-55 -·- PT-P138-56
TIME AFTER RUPTURE (SEC) EGG-A-392
Fig. 193 Pressure in b1owdown suppression tank top 48 in. north of downcomer .. 1 and 49 in. north of downcomer 2 (PT-P138-55 and -56).
197

<!I .... VI c.
... a: ~ VI VI w a: c.
-... <!I w e w a<
fi ... w 0.. ::E w 1-
- PT-P138-136 -·-- PT-P138-151
1\. ·--·-· .. _.,-
17~~3~--+---....,r----~:w------w .. ==""'-=-... =,~,11:::-:., ..... -=-=---~~-.,..-~:---~,.,!'i
Fig. 194 TIME AFTER RUPTURE (SEC)
Pressure in blowdown suppression pump discharge and coo1down heat (PT-Pl38-136 and -151).
EGG-A-369
tank spray system exchanger outlet
55o~-----?-----~---~---~~---~---~---,-~--__,
500
450
350
300
'/ . '/ \ . \.}
-·- TE-BL-1 --- TE-BL-2
NOTE: DATA ARE QUALIFIED WHILE INSTRUMENT IS IMI>IERSED. DATA DISPLAY HOT WALL EFFECTS AFTER "' 40 SEC.
250~----~~----~~----~----~~----~b.-----~~----~~-~~ - 5 75 175
TIME AFTER RUPTURE (SEC) EGG-A-382
Fig. 195 Temperature in broken loop cold leg and hot leg (TE-BL-1 and -2).
198
-I
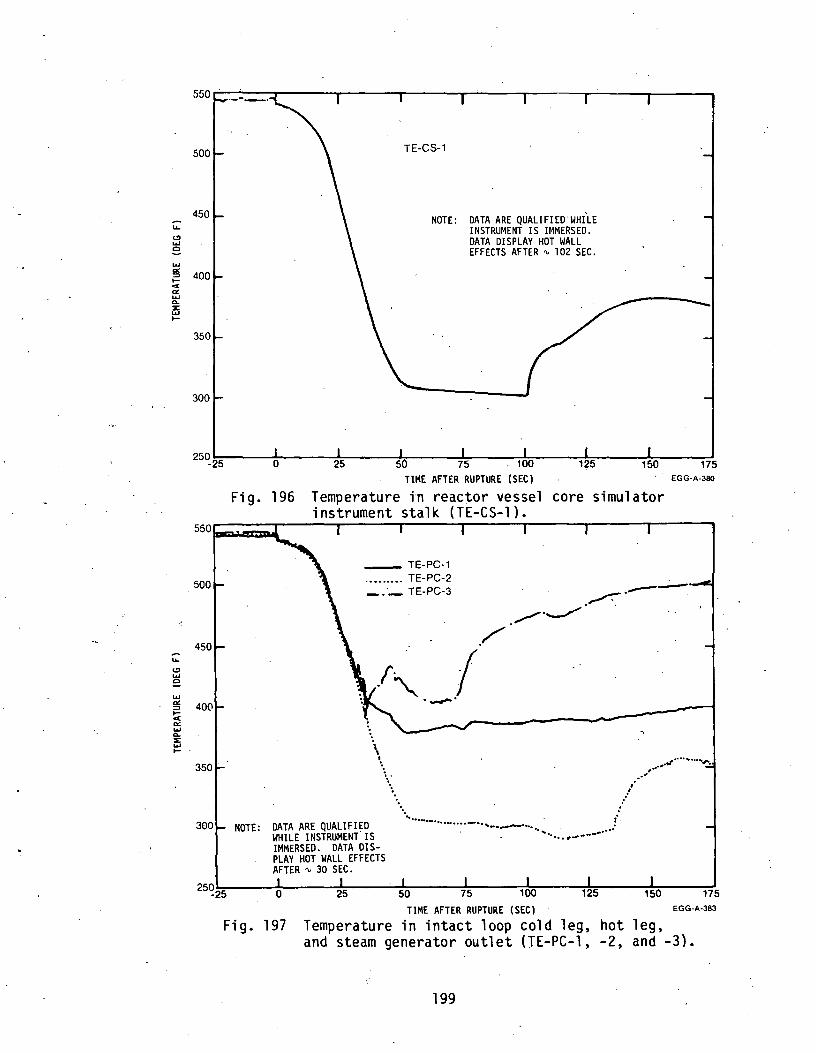
... <!I ..... Q
.....
450
~ 400 -..; a: ..... 0..
ffi ,_
300
TE-CS-1
NOTE: DATA ARE QUALIFIED.WHILE INSTRUMENT IS UIMERSED. DATA DISPLAY HOT WALL EFFECTS AFTER~ 102 SEC .
25~~25~----~------~~----~~----~~----~~----~~----~~-----1~75
... <!I ..... Q
TIME AFTER RUPTURE (SEC) EGG·A-380
Fig. 196 Temperature in reactor vessel core simulator
NOTE:
instrument stalk (TE-CS-1).
- TE-PC-1 ......... TE-PC-2 --·- TE-PC-3 ---· ,...,..:-. .
/"''__,.,· .
. /·
r f· . '"" .
\
\ .. ~
DATA ARE QUALIFIED WHILE INSTRUMENT.IS IMMERSED. DATA DISPLAY HOT WALL EFFECTS AFTER~ 30 SEC.
·-·
--···--··········-·· ..... -. .....,-. ..... .... .... ·.,.-----····
TIME AFTER RUPTURE (SEC) EGG-A-383
Fig. 197 Temperature in intact loop cold leg, hot leg, and steam generator outlet (TE-PC-1, -2, and -3).
199

..... <!l a·
TE-P138-142
..... 150 ~ 1-< a:: ..... 0..
ffi 1-
..... <!l ..... 0
w a:: .. ~ a:: ... 0.. ::E ..... 1-
~2~5~----~~~~~~--~~----~----~~----~~----~~----~175
Fig. 190 TIME AFTER RUPTURE (SEC) EGG-A-379
Temperature in b 1 ow down SUIJ~H'ess·i uu tank spray system pump discharge (TE-P138-142).
---·- TE-P138-141 TE-P138-143
125~---------------------------------------
·---·---·---·---·---·-----
- 109 5 175 TIME AFTER RUPTURE CSECl EGG-A-388
Fig. 199 Temperature in b1owdown suppression tank spray system 60-gpm header and 220-gpm spray header (TE-P138-141 and -143).
200
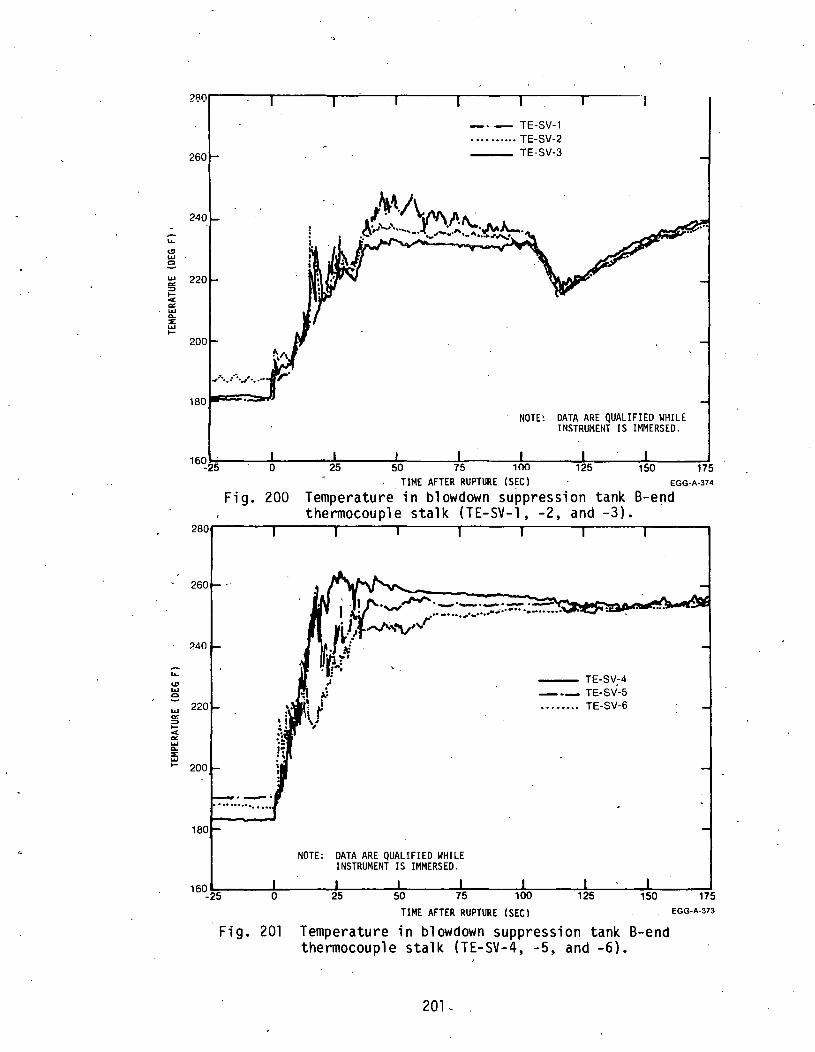
.... <..!1 .... c
.... <..!1 .... c
.... "' :::::> 1-< a: .... 0.. ::E .... 1-
-·- TE-SV-1 .......... TE-SV-2
--- TE-SV-3
NOTE: DATA ARE QUALIFIED WHILE INSTRUMENT IS IMMERSED.
16q2~5~· --~~~----~~----~~----~~----7100~----~b-----~~----~17~5
240
Fig. 200 TIME AFTER RUPTURE (SEC) EGG-A-374
Temperature in blowdown suppression tank B-end thermocouple stalk (TE-SV-1, -2, and -3).
NOTE: DATA ARE QUALIFIED WHILE INSTRUMENT IS IMMERSED.
----- TE-SV.-4 -·- TE·SV-5 ........ TE-SV-6
TIME AFTER RUPTURE (SEC) EGG-A-373
Fig. 201 Temperature in blowdown suppression tank B-end thermocouple stalk (TE-SV-4, -5, and -6).
201~
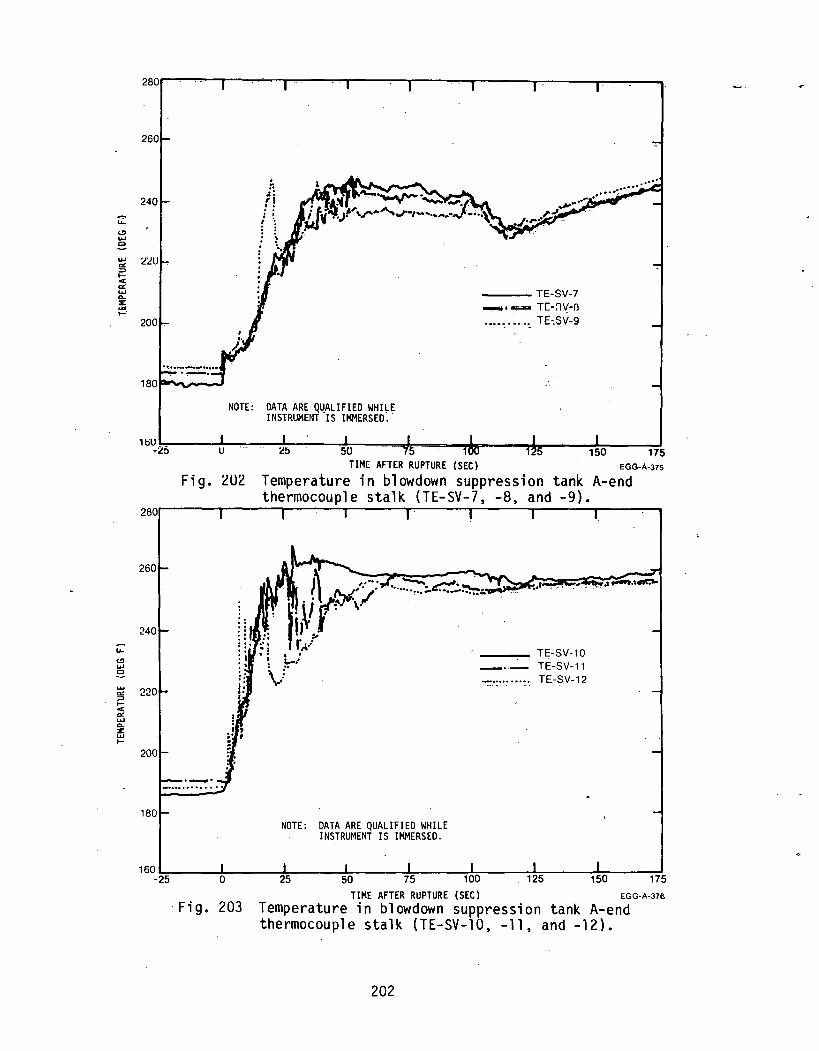
w
"" :::> I< "" ...... 0-
~ 1-
...... <!I ...... 0
...... "" :::> 1-< "" ...... 0-
ffi 1-
--- TE-SV-7 -·- TC-;J\(-0 ····~ ... -~ TE~sv-9
NOTE: DATA ARE QUALIFIED WHILE INSTRUMENT IS IMMERSED.
loU~-----~~~~±-----~~---~~==~~~------~~----~~----~ -:l'5 50 175 TIME AFTER RUPTURE (SEC) EGG-A-375
Fig. 202 Temperature in blowdown suppression tank A-end thermocouple stalk (TE-SV-7, -8, and -9).
280~--~~---,-~-~------r~-----r------~------,-----~,
NOTE: DATA ARE QUALIFIED WHILE INSTRUMENT IS IMMERSED.
--~ TE-SV-10 TE-SV-11
-·········· TE-SV-12 ...... .
160~------~-----~------~------~------~~----~~----~n-----~ -25 100 175
TIME AFTER RUPTURE (SEC) EGG-A-37€.
·Fig. 203 Temperature in blowdown suppression tank A-end thermocouple stalk (TE-SV-10, -11, and -12).
202

z -.... ..... ... ,.. ... ..... s ~
~ .....
z -..... ... ,.. ... ..... 0 -~ a -.....
''1.0-;~~b-~-~- -- --- - -···- --- ·-- ---.-----
:.t-+---1-,>~·· -+-+--+-+--+---+--+--f---+-J~~· . . dr~~: (i~· -
~ La
60.0
50.0
.. T
i
! I
I_ ~F'T"593 .LT -PI_ ~-B-t!3,3 ~o.o ~~~~~~~--~--~~._._._~~~--------~~------~
70/0
60.0
50.0
~o.o
0. 1 oo. __a_o_o_,_ ..3Jl.(L_ ~oo. 5oo. T.IME AFTU .. RUPTURE. (SEC\
Fig. 204 Liquid level in blowdown.suppression tank north end (LT-Pl38-33).
l.;"n~g~ \_T-:-_P_I38~-~~L -,
.... .. ... ... lit" r-'
taN! .,, rr I
-
I
i
j I I i
o.. 100. 200. 300. 400. 5(l0.
TIME AFTER RUPTURE (SEC) Fig. 205 Liquid level in blowdown suppression tank
south end (LT-Pl38-58).
203

';j -V'> c.
! ~.J
"" => ~ .... "" c.
~ -V'> c.
.... "" => V'> V'> .... "" c.
60.
50.
1+0.
30.
20.
10.
o. o.
J l
I 1/
'\,11'1
r I '\.
If If
:
, .... , .•. ....... ~.~
-·.
' f"""o, ....... /
1\ ~
\ / ' \
I i I I l ' I
!
'!_tll'lo!'"d. ·~
100.
~ ~ I ~ I I I I
POTTI'tl558 P£-SY-003
-l.o-""
\ '\. ··-- -
~
' /
""' I .......
""' II'
"'
'
NOTE: DATA INITIAL VALUES ARE -ADJUSTED TO 0 PSIG. -
I --
200. 300. 1+00. 500. TIM[ A~T[R RUPTURE (S!C)
Fig. 206 Pressure in blowdown suppression tank across from duwnCOirn::r· 1, 157.5n (PE-SV-3).
60.
50.
'+0.
30.
20.
I 0.
0.
o.
-
I
I 1/
:
I" I \.
IT
: '
'
Fig. 207
"
T T T T T I T T T I T
POTTft6&1t PE-SV-026
!
'
I -"" I I--' ..,
II v I I / \ '
I \ 1/ i ! \.I +-' ' --p.. \ I --' I . I
I I I """'"' I i ! "'-- /
' i I I I
I ' I I I
NOTE: DATA INITIAL VALUES ARE -ADJUSTED TO 0 PSIG. -
"T
100. 200. 300. 1+00. 500.
TIME AFTER RUPTURE (SEC) Pressure in blowdown suppression tank bottom 54.3 in. south of downcomer 2, 180° (PE-SV-26).
204

<!I ~· "' a..
.... "' :::>
"' "' .... "' a..
<!I -"' a..
.... "' :::>
"' "' .... "' a..
'
eo.
50.
'+0.
30.
20.
I 0.
o. 0.
60.
50.
'+0.
30 .
20.
I 0.
0.
o.
I . • POTTI1668 PE-SV-0'+3 a POTTI1669 PE-SV-Oiflf
1--
• ~ " ..
1!1.. "'I! ..,. -"'-1 -.. ""' /
'/' /. \\.. .... 1- \. .,.,...
\'-" ::"'.. _/ :;..-
"' ......... l!o ../ v -1 ... """ 1r~
~ uo... ...... r1 '-· --··· ........... ..... . ,.,_ --
NOTE: DATA INITIAL VALUES ARE --
"""- ADJUSTED TO 0 PSIG. --J
100. 200. 300. '+00. TIME AFTER RUPTURE (SEC)
Fig. 208 Pressure in b1owdown suppression tank bottom under downcomer 2 and under downcomer 3, 180° (PE-SV-43 and -44).
~~~... • POF'TI1615 PT-P138-055 11' ~" 1 a POF'TI16U5 PT-P138-056 • -" ~ .. ._Ill., ~ rL
....... ..... -..... ../ .,. '7' '\\
u .. ~
rr ~ /
"1lii.: r-o... ~
"' ~ /A ~ ..... !loL ....... M
.J .... ... , """
-
"'"
NOTE: DATA INITIAL VAlUES ARE -ADJUSTED TO 0 PSIG. -
I
100. 200. 300. lfOO. 500. TIME AFTER RUPTURE (SEC)
Fig. 209 Pressure in b1owdown suppression tank top 48 in. north of downcomer 1 and 49 in. north of downcomer 2 (PT-P138-55 and -56).
205

~
1.&.
<.!1 ..... e ..... !5 ..... < a: ..... <>. %: ..... .....
~ <.!1 ..... e ~ :::> I
~ ..... <>. E ..... .....
250. • TETTI1658 TE-SV-001
IJlAI ... a TETTI1659 TE-SV-002 ,., ~
... ~ I"'" 6 TETTH660 TE-SY-003 ,.,.., .,. l I I I I I I I I ~ ~ (Y Iff 'l I 225.
~ 1,_ M I I I I I I I I I ,., ., NOTE: DATA ARE QUALIFIED WHILE
• ll. INSTRUMENT IS IMMERSED •
200 .
4 175.
150.
0.
275.
250.
.225.
200.
175.
o.
a lN ~
I ll .. " ~ ~ 11 L I '1ft: ... ~ ,. ~ ~J' ~ r_~ ~ ~ • ~"Y fll it...
.,.....
'..:; .... " -100. 200. 300. lfOO. 500.
TIME AFTER RU~TURE I~£Cl
F·ig. 210 Temperature 1n b1owdown suppression tank B-end thermocouple stalk (TE-SV-1, -2, ~nd -3),
• TETTI1661 TE-SY-00'+
a TETTI1663 TE-SY-006
ru. lllo.. .... 1 -- !'-.... - .. ll'r ._
, __ ... -~ ~ •• .~~~~ L.A. •"-
Jj .. • I, Lnn'!Lt I" Ill ,. l ' r.ll 4 ' . •
·--
'
NOTE: DATA ARE QUALIFIED WHILE INSTRUMENT IS IMMERSED .
I I • 100. 200. 300. &tOO. 500.
TIME AFTER RUPTURE (SEC)
Fig. 211 Temperature in blowdown suppression tank B-end thermocouple stalk (TE-SV-4 and -6).
206

..... <.!1 LLI e LLI
"" :::> ..... < "" .. LLI 0. E LLI .....
r
C!7!5.
C!!50.
C!C!!5.
C!OO.
17!5.
o.
TETTH&e7 TE-SV-010
F# -"1111. 1-""""' ""' ~ ~
-
..
NOTE: DATA ARE QUALIFIED WHILE INSTRUMENT IS IMMERSED.
I I I I I I I I I
100. 200. 300. !tOO. '!500. TIME AFTER RUPTURE (SEC)
Fig~ 212 Temperature in blowdown· suppression tank A-end thermocouple stalk (TE-SV-10).
207

~- . '7 .
THIS PAGE
WAS INTENTIONALLY
LEFT BLANK


4. TEST Ll-3 COMPUTED PARAMETERS
This section of presented data consists of Figures 213 through 269.
209

60 58 !)t)
54 52 50 48 H. 46 AA 44 .A 42 .A 40 AS
- 38 :.
_ .. ' .... :, :..- •• <dl !-}~ ..
. ( .:.~.
H = Homogeneous
S = Stratified
A= Annular
I = Inverted Annular
c:.., 36 s ~ 34 s ..8 32 .:::. 30 >- 28 !::::; 26 ~ 24 ~ 22
20 18 16 14 12 10 8 b 4 2 0
0
s. SSI.
II ·r ·u
·r ir
IS ·Isss
SSSSSASSS S ~SSSSSSSSSSSSSSSSSSISSSSSSSSSSSSS~
10 20 30 40 50
TIME AFTER RUPTURE (SEC)
Fig. 213 Flow regime and average density in broken loop co 1 d 1 eg.
210
60
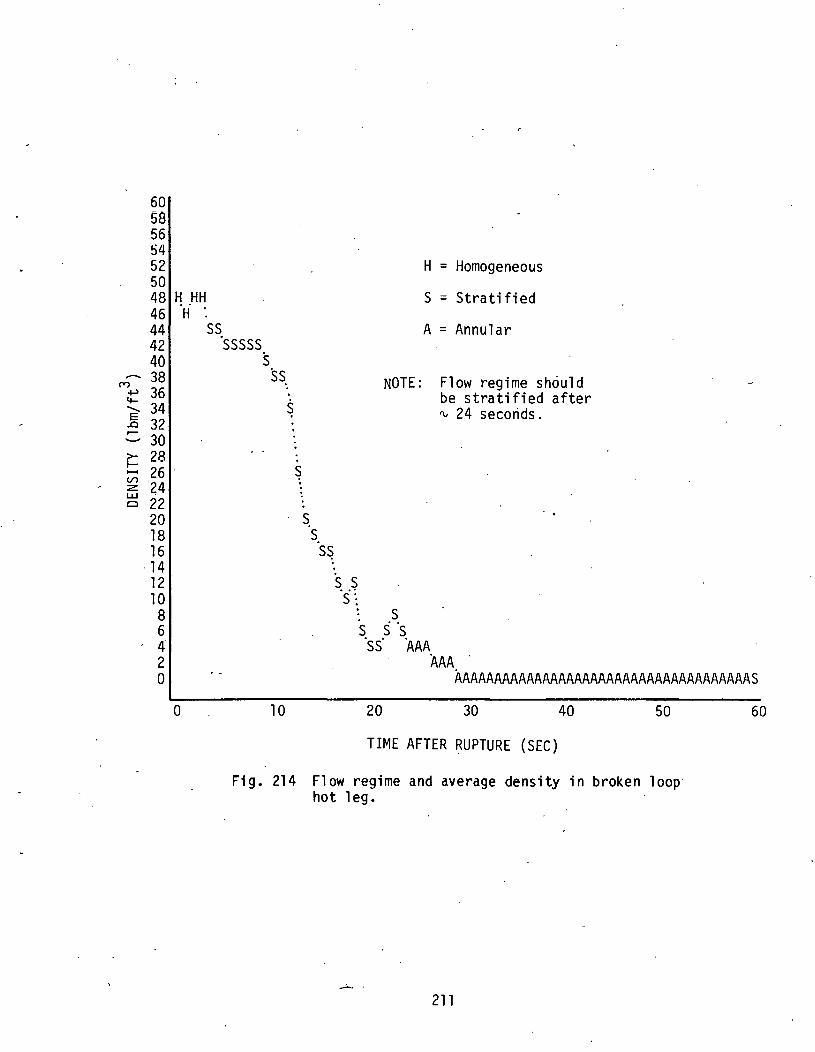
60 58 56 !54 52 50 48 H HH 46 .H ..
44 ss 42 ·sssss 40 s
.-. 38 ss ~ 36 ~ 34 ..8 32 .:::. 30 i: 28 ...... 26 . ~ 24 ~ 22
20 18 16
. 14 12 10 8 6 4 2 0
0 10
. ~
. . s
s. s. s~
~ .S s:
H = Homogeneous
S = Stratified
A = Annular
NOTE: Flow regime should be stratified after rv 24 seconds .
. s s s ·s ·ss· .AAA
AAA AAAAAAAAAAAAAAAAAAAAAAAAAAAAAAAAAAAAAS
20 30 40 50 60
TIME AFTER RUPTURE (SEC)
Fig. 214 Flow regime and average density in broken loop· hot leg.
--""-- .
211
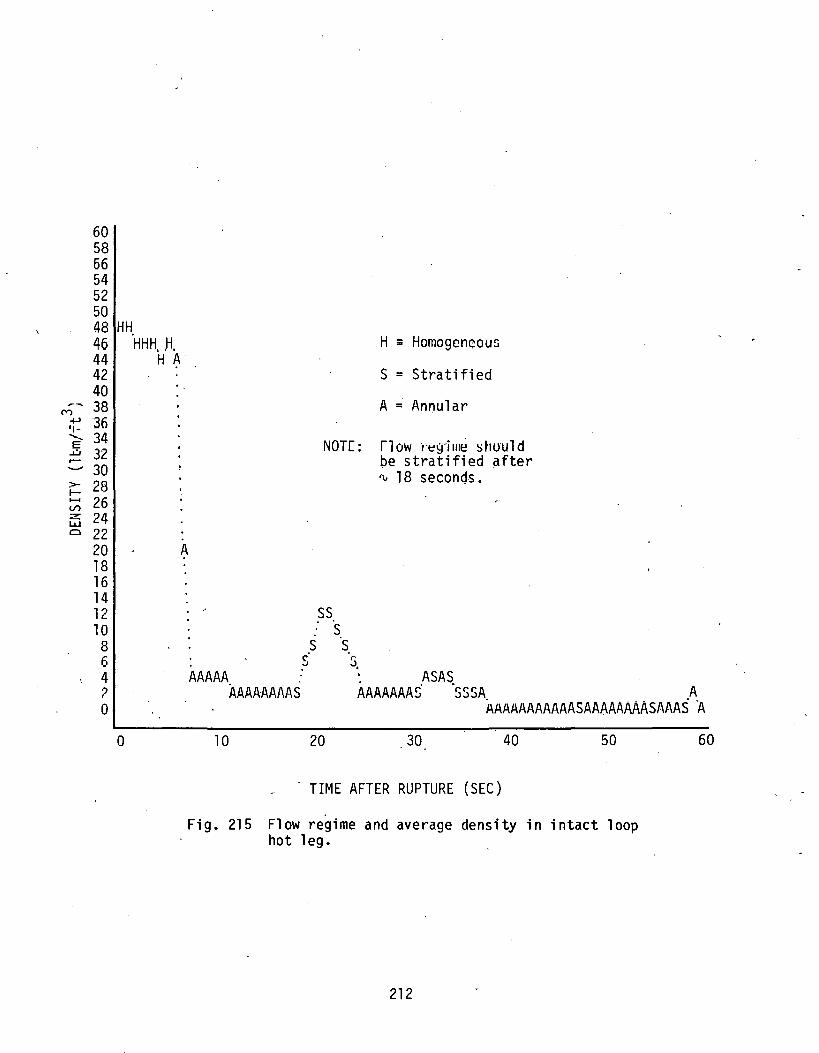
60 58 66 54 52 50 48 HH. 46 HHH, .H. 44 H A 42 40
M 38 .jJ 36 .,_ ......... 34 E .u 32 ..-- 30 >- 28 1-....... 26 (/)
z 24 LLJ Cl 22
20 A 18 16 14 12 10 8 6 4 ? 0
0
AAAAA AAAA·AAAAS
H = Homogeneous
S = Stratified
A = Annular
NOTC: rl ow rt!~f"i rm::! s huu 1 d be stratified after '" 18 seconds.
ss. s ·s
·!J. ·. ASAS AAAAAAA:; 'sssA. __ . .A.
AAAAAAAAAAASAAAAAAAASAAAS A
10 20 30 40 50
TIME AFTER RUPTURE (SEC)
Fig. 215 Flow regime and average density in intact loop hot leg.
212
60

. ~ c:c _. .._ ;;J .... c:c
>-<>-_. < :J: .... :z ....
~ c:c _. .._
1250.
1000 .
750.
500.
-10.
1250.
i= I 000. c:c
750.
500.
-10.
-
EN81(007!» PE-BL-1-EN ..
J\ r- -~
' ,A
r " I"' II .I ~
If l ~w ~
V\\ . l
r_ t'
I / NOTE: DATA BEFORE T~ ARE INVALID
./ DUE TO SATURA ED FLUID ASSUMPTION. -
o. 10. 20. 30. '+0. 50. . 60. 70 .
TIME AFTER RUPTURE (SEC)
Fig. 216 Enthalpy in broken loop cold leg.
_E_N_BK0078 PE-BL-2-EN ····-·.
fV ~ .. I~
\ ll .aL '-..tAl 'I ~r
., r
~ I'
1'\J J_ NOTE: DATA BEFORE Ty ARE INVALID
DUE TO SATURA ED FLUID ./ ASSUMPTION.
- -··-- ··- ··-
o. I 0. 20. 30. '+0. 50. 60. 70.
TIME AFTER RUPTURE (SEC)
Fig. 217 Enthalpy in broken loop hot leg.
213

:::;: co -' -:::::> .... m
>-CL. -' < "' .... :z ....
~ co -' -:::::> .... co
,.. CL. -' < ::t: 1-:z ,,,
1250.
1000.
750.
500.
250.
1250.
1000.
750.
500.
-10.
ENPK0083 PE-PC-1-EN , ..
L l -·
1 I . r--~
I .. - - tlOTt: DATA ARE INVALID PRIOR TO
Tp DUE TO SATURATED FLUID AJSUMPTION. DATA WERE CALCULATED USING CHORDAL DENSITY FRDr~ DE-PC-lB.
o.o 10.0 20.0 30.0 ltO.O 50.0 60.0 70.0
TIME A.I"TER RUPTURE !SEC l
Fig. 218 Enthalpy in intact loop cold leg.
ENPK0081t PE-PC-2-EN .. - ··-
r wr h. ... a.
I •• ··~ l,4 1.
~ IMtN Ia
, ~,IL.t J' I . u ~
11'
I
•• - ---
ll \~ NOTE: DATA BEFORE Ty ARE INVALID
DUE TO SATURA ED FLUID ASSUMPTION.
o. I 0. 20. 30. ItO. 50. 60. 70.
TIME AFTER RUPTURE (SEC)
Fig. 219 Enthalpy in intact loop hot leg.
214

~ "" .... ·-:::J .... "" >-0.. .... <( X .... :z .....
u ..... VI
I .., .. .. .... .... ....... ::E
"" .... ..... ~ .... 0 >
15 .... VI >-VI ....... 3: 0 .... .... VI VI
~
1250. tNrkooos rc ·- rc- 3-.:..tN
aj
tv• , 1000. ~
IJ ~·
750.
I NOTE: DATA BEFORE Ty ARE INVALID
DUE TO SATURA EO FLUID
500.
-10. o.
~
10.
I
20. 30. '+0. TIME AFTER RUPTURE (SEC)
,. ASS~MPTI 0~. I
50. 60.
Fig. 220 Enthalpy in intact loop at steam generator outlet.
!5.0 F'E81<0'+!51 F'E-1'1E-BL-001
'+.0
3.0 -. NOTE: REFER TO TEXT IN SECTION v ON MASS BALANCE. DATA
2.0
\ Ia I ARE IRRATIC BEFORE Te
J\t:!\, \A a AND AFTER Tg + 50 SE 111A. DUE TO DIVI ION BY
' NUMBERS NEAR ZERO.
II .... w ••
VI I .0
11 r "1 II
la u ~ u ~
o.o o.o 10.0 20.0 30.0 '+0.0 50.0 60.0
TIME AFTER RUPTURE (SEC)
Fig. 221 Mass flow rate per system volume in broken loop cold leg calculated from FE-BL-1 and ME-BL-1.
215
70.
' \ \A
1
70.0

u ... VI
I <"'> .. .. ...... ..... ...... ::E 0:0 -'
... !!5 -' 0 > ::E ... ...... VI >-VI ...... :X 0 -' ..... VI VI < ::E
u ... VI
I <"'> .. .... ...... ..... ...... ::E
"" -'
... !§ -' 0 > ::E ... ...... VI ,_ VI
~· 0 -' ..... VI VI < ::E
5.0 F'RBIC0002 ttE-OE-BL-001
'+.0
!.0
It
'" .. 2.0 ' V\
l NOTE: REFER TO TEXT IN SECTION 1\ua, A.. ON MASS BALANCE. DATA
1 . 0
' '~ VALUE PRIOR TO T IS \a' DUE TO SMALL INS9RUMENT "'\ft OFFSET.
"""-"""" ·v -o.o
o.o 10.0 20.0 30.0 'tO.O ~o.o 00,0 7Q.Q TIME AFTER RUPTURE (SEC)
Fig. 222 lv1ass flow rate per system volume in broken loop cold leg calculated from DE-BL-1 and ME-BL-1.
5.0 F'OBF'0'+51 F'E-OE-BL-001
'+.0
3.0
2.0 I. ·~
1 . 0
1.. NOTE: REFER TO TEXT IN SECTION \...,. ON MASS BALANCE. ,..._ " ~
""'lA
o.o o.o 10.0 20.0 30.0 '+0.0 50.0 60.0 70.0
TIME AFTER RUPTURE (SEC)
Fig. 223 Mass flow rate per system volume in broken loop cold leg calculated from DE-BL-1 and FE-BL-1.
216

u ... "' I .., .. .. 1-...... ....... ::E a:> ...J
... !!5 ,J 0 >
ffi ...... "' >-
"' ....... :z 0 ...J ......
"' "' ~
;:; ... "' I .., .. .. 1-...... ....... ::E a:> ...J
.... !5 ...J 0 > ::E ... 1-
"' >-
"' ....... ~ ...J ......
"' "' ~
5.0
... o
3.0
a.o
1.0
o.o -10.
L.a....
~
o. 10.
....
\
' .... " ~ ~
C!O. 30. 'tO.
TIME AFTER RUPTURE (SEC)
FTBICOOOC! POE-OE-&L-01
NOTE: REFER TO TEXT IN SECTION ON MASS BALANCE.
---1 - I I 50. eo. 70.
Fig. 224 Mass flow rate per system volume in b·roken loop cold leg calculated from DE-BL-1 and PdE-BL-2.
1.0 FRBKD003 HE-OE-BL-OOC!
0.8 L 9\,. ... ""'\: 1...
' 0.6 \ \
' \ \
0.'+ II.. \A
a
0.2
]\ NOTE: REFER TO TEXT IN SECTION f I
r,1 \1 ON MASS !lALANCE.
' ' "' .• 1111 a 1""'- ~ .r , ....... o.o .... Ill I "'--
o.o 10.0 20.0 30.0 '+0.0 50.0 60.0 70.0 TIME AFTER RUPTURE (SEC)
Fig. 225 Mass flow rate per system volume in broken loop hot leg calculated from DE-BL-2 and ME-BL-2.
217

u ... II')
I
"" ... ... ..... "-....... ::E
"" ...J
... ~ ...J 0 > ::E ... ..... ~ ~ ~ ...J "-II') VJ
~
u ... '1 "" ... ... ... "-...... ::E
"" ...J
... ~ ...J
~
ffi ..... "' >' "' ...... 2 • ...J "-II') VJ
~
1.0 ~08~0'+52 ~E-OE-BL-002
'
o.s
o.e '\ ~
'r'l O.'+ ... I -
111 \ II r I NOTL R£FER TO T~XT IN 5[CTION
o.a l I II 'I ON MASS BALANCE.
I
' \J "\ ·- "'\j ~ o.o o.o 10.0 20.0 30.0 '+0.0 50.0 eo.o 70.0
TIME AFTER RUPTURE (SEC)
Fig. 226 Mass flow rate per system volume in broken loop hot leg calculated from DE-BL-2 and FE-BL-2.
1.0
o.a
o.e
0.'+
o.e
o.o -10.
l ....
l!l~ o.
r-4\ ~ L~ -
10. 20. 30. '+0. TIME AFTER RUPTURE (SEC)
,., --- ·0'2 r-w.· ... -
NOTE: REFER TO TEXT IN SECTION ON MASS BALANCE. DATA VALUE PRIOR TO T IS DUE TO SMALL INS~RUMENT OFFSET.
-
50. 60. 70.
Fig. 227 Mass flow rate per system volume in broken loop hot leg-calculated from DE-BL-2 and PdE-BL-1.
218

u ..... V'>
I .... .. .. 1-..... ...... ::E
"' _, ..... ~ _, S! ~· 1-V'> >-V'> ...... 3 0 _, ..... V'> V'>
~
u ..... V'>
I ..., .. .. 1-..... ...... ::E
"' _, ..... ; _, 0 >
ffi 1-V'> >-V'> ......
·3 0 _, ..... V'> V'>
~
3.0
l ... ·-· ~&If F'E -HE~~ ;~O I_ r-
J\ ,a a. " \f rtvr l 2.r' ' 1
\
' ~ \. "1
1.0
o.o
!all f\A NOTE: REFER TO TEXT IN SECTION l1j • 91 All\
ON MASS BALANCE. DATA .. a ARE VALID ONLY UNTIL To v ,_V\ + 8 SEC; DATA AFTER
T9 + 8 SEC ARE AFFECTED B THE TEMPERATURE
I""\_ SENSITIVITY OF ME-PC-1. ~
..
V\ .&
rt M ll
-1.0
\ J ~ ... ~ \ II ' -
o.o I o .. 0 20.0 30.0 ltO.O 50.0 eo.o 70.0
TIME AFTER RUPTURE (SEC)
Fig. 228 Hass flow rate per system volume in intact loop cold leg calculated from FE-PC-1 and ME-PC-1. ·
3.0
2.0
"V
I . 0
o.o
-1.0
Fig: 229
F'QPK0083 PE-PC-1-F'Q
" \ l :-~~
\ s;.-·· ·,.~
\ IVVV '
1 \.
I"'
NOTE: REFER TO TEXT IN SECTION ON MASS BALANCE. DATA PRIOR TO T ARE NOT VALID DUE Yo THE SATURATED FLUID ASSUMPTION.
o.o 10.0 20.0 30.0 ltO.O 50.0 80.0 70.0
TIME AFTER RUPTURE (SEC)
Mass flow rate per system volume in intact loop cold leg calculated from FE-PC-1, PE-PC-1, and DE-PC-1~.
219
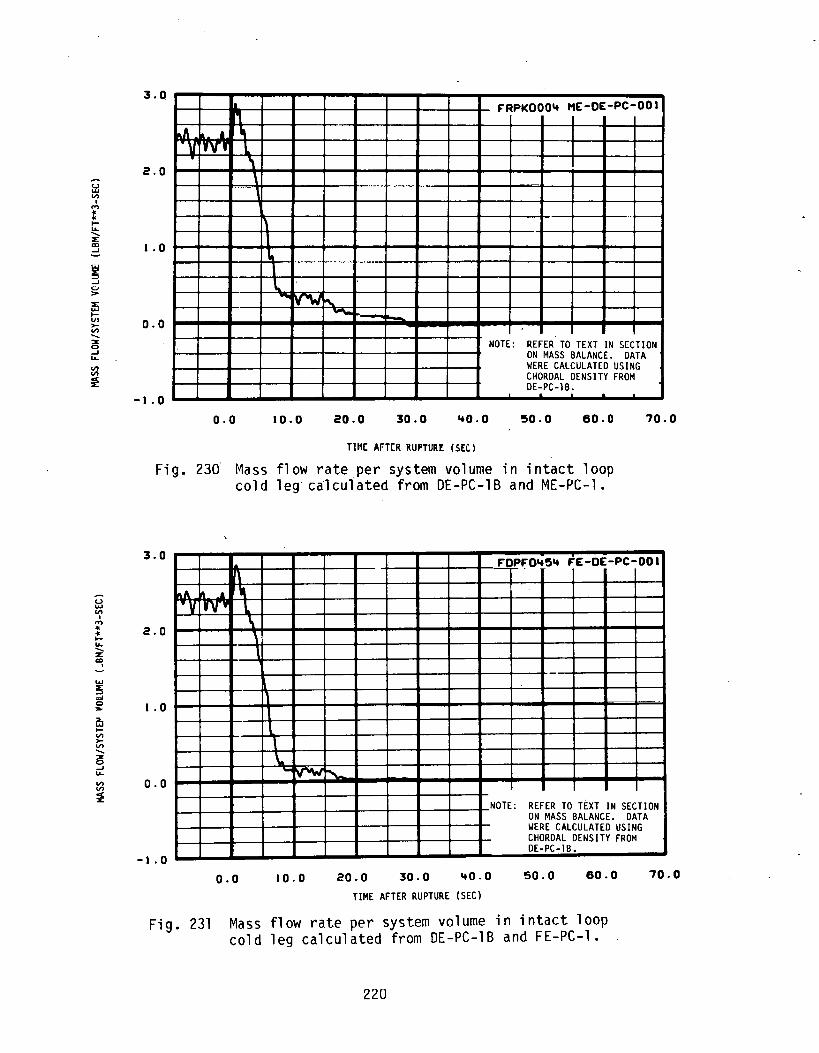
~ VI
I M
t ~ ... ...... E
"" ...J
~ ...J 0 > E w tli >-VI ...... :31: 0 ...J ... ~ ~
'-' w
"' I M ... ... ~ ... ...... E "'l
w ;5 =' 0 .... ~ ~ VI >-VI ...... :31: 0 ...J ... VI VI
~
3.0
"' F'RPKOOO'+ HE-OE-PC-001
,A I ~ V' 'VVJ l
2.0 \ \
~
-"'U"'"'
l ........ _.
-~
1.0
" ··-··~ .... ·- .... - .... -~
____ ,
' \. ....... ~ ~ ~
o.o NOTE: REFER TO TEXT IN SECTION
ON MASS BALANCE. DATA WERE CALCULATED USING CHORDAL DENSITY FROM
-1.0 DE:PC-1B.
o.o 10.0 20.0 30.0 '+0.0 !50.0 60.0 70.0
TIME AfTER RUPTUR[ (SEC)
Fig. 230 Mass flow rate per system volume in intact loop cold leg· calculated from DE-PC-lB and ME-PC-1.
3.0 F'Of)f:"0'+5'+ F'E-DE-PC-001
r\ •A " _a -"V lfV'' l
2.0 \
' ' -~·
I. 0
\ \..
vow- I""\. o.o NOTE: REFER TO TEXT IN SECTION
DN MASS BALANCE. DATA WERE CALCULATED USING CHORDAL DENSITY FROM DE-PC-1B.
-I. 0
o.o 10.0 20.0 30.0 '+0.0 50.0 60.0 70.0
TIME AFTER RUPTURE (SEC)
Fig. 231 Mass flow rate per system volume in intact loop cold leg calculated from DE-PC-lB and FE-PC-1.
220
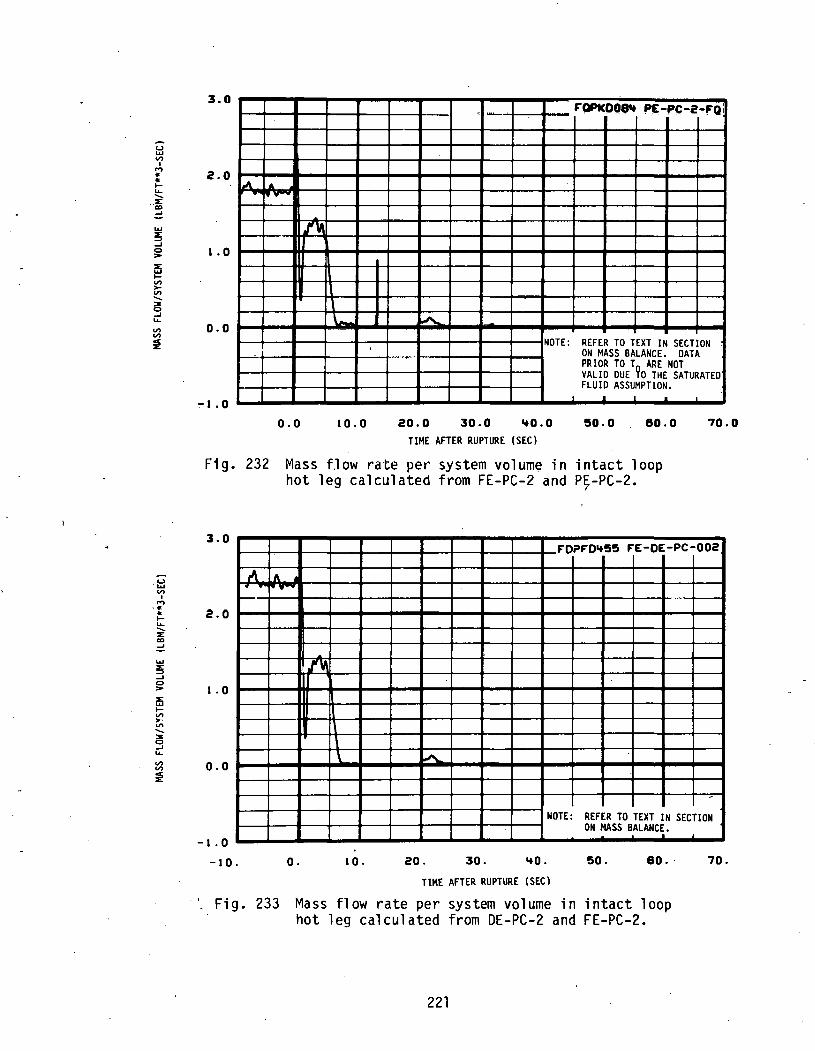
u ... II)
I .., .. .. ..... ... ....... ::E ... ~
... !!!; ~ 0 >
ffi ..... II)
>-II) ....... :X 0 ~ ... V) V)
~
u ... V)
I .., ... .. ..... ... ....... ::E ... ~
... !i ~ 0 >
ffi ..... V) ,... VI ....... :X 0 ~ ... VI V)
~
3.0 c-· f"QPI(OOG't ~-PC-2-FO!
2.0 lA .A
..~
rv. 1.0
o.o \-. """ NOTE: REFER TO TEXT IN SECTION ·- . ·-····-··· -· ON MASS BALANCE. DATA
PRIOR TO T ARE NOT VALID DUE 9o THE SATURATED FLUID ASSUMPTION.
~ l. 0 I .
o.o 10.0 20.0 30.0 &tO.O 50.0 80.0 70.0
TIME AFTER RUPTURE (SEC)
F1g. 232 Mass f.low rate per system volume in intact loop hot leg calculated from FE-PC-2 and P~-PC-2.
3.0 FO?FO&t55 FE-OE-PC-002
A lA .. ... ,,. ... 2.0
. J''lt
l. 0
o.o t ""' -
NOTE: REFER TO TEXT IN SECTION ON MASS BALANC~.
-1.0
-10. o. I 0. 20. 30. &tO. 50. 80 .. 70.
TIME AFTER RUPTURE (SEC)
· ·. Fig. 233 Mass flow rate per system volume in intact loop hot leg calculated from DE-PC-2 and FE-PC-2.
221

(..) ...... V>
I .., .. • ..... ..... ...... :E a::o -'
~ -' 0 > :E ...... ..... V>
~ ...... ~ -' ..... V> V>
~
(..) ...... V>
I .., • .. ..... ..... X' a::o ~ ...... !5 -' i z: !:!! V> >-V> ...... ::0: 0 -' ..... V> V>
~
3.0 ~QPK0085 PE-PC-3-~Q
2.0
~ ~ ~~ ~ . l . 0
' ' '
' o.o \.: .. NOTE: REFER TO TEXT IN SECTION
ON MASS .BALANI>E. DATA PRIOR TO T ARE NOT VALID DUE ~0 THE SATURATED ; FLUID ASSUMPTION .•
···I . 0 ..
o .. o I 0. 0. 20.0 30.0 a.o.o 50.0; oo.o TIME AFTER RUPTUR~ (SEC)
Fig. 234 Mass flow rate per system volume in intact 1 oop, st_eam generator outlet calculated from FE-PC-3, PE-PC-3A, and DE-PC-3 ..
70.0.
3 .. 0 ~RPK0006 HE-OE-PC-003
AI lal~ I"LJII ~~
2.0 1 Ill
,- ~-·,- .. .. . .. . --
'(
1 • n ·". . ---- - ·--- ~ ----- -----· . ..
\ ~ I-.
o.o
NOTE: REFER TD TEXT IN SECTION ON MASS BALANCE.
-1.0
-10. . o. l 0 . 20. 30. ItO. 50. 60. 70.
TIME AFTER RUPTURE (SEC)
Fig. 235 Mass flow rate per system volume in intact loop steam generator outlet calculated from DE-PC-3 and ME-PC-3.
222

u ... V'l
I .., • • 1-.... ...... ::E
"" ..J
... !i ..J 0 >
C5 1-V'l >-"' ...... 3 0 . ..J .... "' V'l
~
~ "' I .., • • I-.... ...... ::E
"" ..J
... !i ..J 0 >
C5
3.0 -f"oPf"Dif58 F'E-OE-PC-003
l1a r '\ I -
2.0
\ -
I. 0
o.o i\..._
- ' ........
NOTE: REFER TO TEXT IN' SECTION ON MASS BALANCE.
-I. 0
-10. o. 10. 20. 30. ItO. 50. eo. TIME AFTER RUPTURE (SEC}
Fig. 236 Mass flow rate pe·r system volume in intact loop steam generator outlet calculated from DE-PC-3 and FE-PC-3.
0.3
0.2
70.
:;:; 0.1 >V'I ...... ~ ..J .... V'l
"' ~ 0 1---"' NOTE: CALCULATIONS WERE NOT
PERFORMED BEYOND TO + lB SEC. ·
-0.1L------L------~------L-----~-------L------~------L-----~ -10 0 10 20 30 40 50 60 70
TIME AFTER RUPTURE (SEC} EGG-A- 505
Fig. 237 Mass flow rate per system volume in intact loop pressurizer calculated from LT-Pl39-8 and PE-PC-4.
223
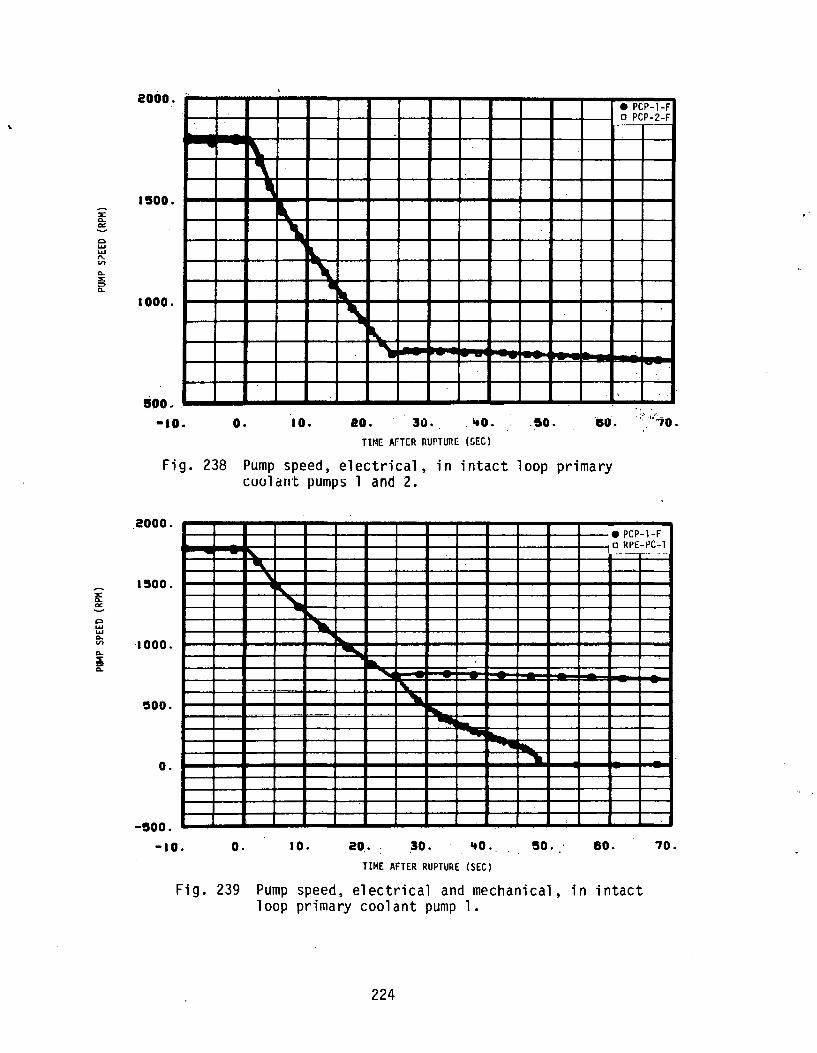
:E 0.. rx:
c ...... ...... "· en 0.. :E: :::> 0..
~ rx: ~
c ..... ...... 0.. en 0..
~ 0..
2000 .
1!500.
1000.
eoo. ·10.
..
..
o.
\.
' " .. '-. ~
""' •
10.
e PCP-1-F o PCP-2-F
lk
' ~ ..... - r--
'
ao. 30. . 'tO. . .so. TIME AfTER RUPTURE (5EC}
Fig. 238 Pump speed, electrical, in intact loop primary coolant pumps 1 and 2 •
. 2000. e PCP-1-F o RPE-PC-1
!'- ·---- .. ··-· W\.
1!500. ' "" """ .,.,_
·1000. ..._,_ llr..
.. -- .. .. I'\..
!500. ,._
....... .... lliloL ~ ...
....... ... o.
..,._
-!500.
-10. o. 10. 20 .. _30. 'tO. 50._· 60. 70.
TIME AFTER RUPTURE (SEC)
Fig. 239 Pump speed, electrical and mechanical, in intact loop primary coolant pump 1.
224

if IX
c LU LU 0..
"' 0..
!i 0..
2000.
1500.
1000.
500.
o. -to.
~-- -- ~
~ ""\ ..
o.
\.
' ... ' .. 1111..
tO.
e PCP·2-F --a:~- o RPE-PC-2 ·-- ----
-
111. ~ - _,...
~
~ .....
~ ..... .... .... ~ ... ~-
I
I
20. JO. 'tO. eo. 80. 70.
TIME AFTER RUPTURE (SEC)
Fig. 240 Pump speed, electrical and mechanical, in intact loop primary coolant pump 2.
1.5 e PCP-1 SLIP c PCP-2 SLIP .. ··- ,-·-
" _. -II ~ ""' .........
•
1.0
0.5
o.o ..
-o.e -ao. o. ao. 20 . . 30. 'tO. so. ao. 70.
TIME AFTER RUPTURE (SEC)
Fig. 241· Pump motor slip in intact loop primary coolant pumps 1 and 2.
225

"' ...... 3 0 0.. ...... "' "' 0
"' -' ex: ~ "' f-u ...... -' ......
"' ...... ::.: 0 0.. ...... "' "' 0
"' -' ;3 ~
"' f-u ...... -' w
-' ex: f-0 1-'-
125.0 • PCP-I o PCP-2
100.0 ~ •• ~ -:1..
Ia.
75.0 .Ia
1\. I'M
• 50.0 •
~\
25.0 • ~ o.o ~
-25.0
-10. o. I 0. 20. 30.
TIME AFTER RUPTURE (SEC)
Fig. 242 Pump motor inidividual electrical horsepower in intact loop primary coolant pumps 1 and 2.
200.0 ~ ....
' 1!50.0 ' ll u 'I
100.0 ''l
!50.0 Ji ~ ~ -....
" -o.o ~
-!50.0
-10. o. 10. 20. 30.
TIME AFTER RUPTURE (SEC)
Fig. 243 Pump motor total electrical horsepower in intact loop primary coolant pumps 1 and 2.
226
'+0.
'+0.

"" LLI ..,. 0 ~ LLI V>
"" 0 :I:
"" LLI 1-<C 3 _. <C 1-0 1-
>-L) z ~ L)
......
...... LLI
~ :i:
2
·100.
ao.
eo.
'+0.
20.
o. -1o.o
II 1
IIU II
II ' lL MJJr
I
..
, .. 1/ I
r.J. -,u
, o.o 10.0 20.0 30.0
TIME AFTER RUPTURE (SEC)
Fig. 244 Pump total water horsepower in intact loop primary coolant pumps 1 and 2.
I. 0
o.e
0.6
O.'+ n
""' .I.IW ol ... 1U I 1.111
T
ll L
0.2 [1, .111'1
"I" \I I
..o.o
-.
I ~ o.o \o.
1ft r
-0.2 __IIL_ft I • I
-10.0 o.o 10.0 20.0 30.0
TIME AFTER RUPTURE (SEC)
Fig. 245 Pump combined efficiency in intact loop primary coolant pumps 1 and 2.
227
'+0.0

<!> -VI c..
w
"' :::;> VI
"' w
"' c..
>-I--...J ...: ::::. 0
8 I--c I-V>
3.
2.
f--·- .....
I
0. --T
"""" I····
I . I II ~ I .a I I -•-a
-I ...
I'' IT ''T TT ,..., T
I -. 'I
1·----·- I -2.
-3.
o.o 10.0 20.0 30.0 '+0.0 50.0 60.0
TIME AfT(R RUPTUR[ (5[C)
Fig. 246 Pressure, closure, in intact loop (filtered to 4 Hz).
1.0
' 0.8
o.e
.~: , O.'t
J~ 1111
tl .,_ r• ~
..
' l/ ~
0.2
...
---;-:~
"fWII """"T
70.0
~,..
1/ v QIIICD0'75 PE-IL-1-QS o.o
o.o 10.0 20.0 30.0 ltO.O 50.0 eo.o 70.0
TIME AFTER RUPTURE (SEC)
Fig. 247 Static quality in broken loop cold leg.
228

>" ::; -' :§ 0'
~ 1-
~ VI
>-1---' < ::::>. 0'
~ 1-
~ VI
1.0
0.8
-o.e
o ...
0.2
o.o -ao.
1.0
0.8
0.6
0.'+
0.2
-
I
\ II .., \ ..Jl_.:..~ AI
V' ., 1""'"11 .. • ·-
N
/ ~ ' I I
, ,. P£-a.-e~os
o. ao. eo. JO. ItO. so. . eo. 70.
TIME AFTER RUPTURE (SEC)
Fig. 248 Static quality in broken loop hot leg.
!r QSPK0083 PE-PC-1-SQ
-J
·-
1- ~ NOTE: DATA WERE CALCULATED
} USING CHORDAL DENSITY FROM DE-PC-lB. . I I
a.o 10.0 20.0 30.0 '+0.0 50.0 60.0 70.0
TIME AFTER RUPTURE (SEC)
Fig. 249 Static quality in intact loop cold leg.
'
229

>-1--...J < ::> 0
u ,: ~ "'
>-1--..... ~ 0
" 1-< 1-V)
1.0
o.e
o.e M~ O.lt ......
" ~ II ·w !1 .. fi
fl. ~ ,.. "\ atl rr
"J ... o.a
...., :-2-SQ
j -o.o o.o 10.0 20.0 30.0 !50.0 eo.o '70.0
TIME AFTER RUPTUR~ (SEC)
Fig. 250 Static quality in intact loop hot leg.
1.0
:N II I II I I I L 1~008!5 ~-~-3~~
o.e I
o.e ··- II
o ... ~
j I
0.2
I o.o J
o.o 10.0 20.0 30.0 ltO.O !50.0 eo.o '70.0 TIME AFTER RUPTURE (SEC)
Fig. 251 Static quality in intact loop at steam generator outlet.
230

>-!::: ...J < ::::> CT
::0: 0 ...J ...
>-!::: ...J < ::::> CT
::0: 0 ...J u.
I. U
0.8
o.&
o ...
0.2
o.o -10.
I. 0
0.8
0.6
0.'+
0.2
o.o -10.
"' ff' ..... ";
.)'
~~ J .N ·vy.
-OGBKD075 PE-BL-1-QG . -- . -=--- ~- ..
• ~ I
jl L
,r
o. 10. 20. 30. ItO. 50. 60. 70.
TIME AFTER RUPTURE (SEC)
Fig. 252 Flow quality in broken loop cold leg.
r I~ .. 1-\ • l. &;'-.& " .. aa
~ .,
""' ""l"' r
., QG8K0076 PE-8~-2-QG
A.
\j
J II'
o. I 0. 20. 30. '+0. 50. 60. 70.
TIME AFTER RUPTURE !SEC)
Fig. 253 Flow quality in broken loop hot leg.
231

1.0
o.a
~ o.e -...J c( :::> 0'
7. 0 ...J .... o ...
>-!:; ...J c( :::> a ~ ..J ...
0.2
o.o
1.0
o.s
o.e
0.'+
0.2
o.o -10.
r
11 OOPKDOIJ P£-PC-1·00
-t----
I ----+ ....
i i
. -- --· I ---~--I- -
l .,....
I NOTE; DATA WERE CALCULATED
] USING CHORDAL DENSITY FROM DE-PC-18.
o.o 10.0 20.0 JO.O '+O.o 50.0 eo.o 70.0
TIME AFTER RUPTURi (SiC)
Fig. 254 Flow quality in intact loop cold leg.
~r, ~~ I
' "' rJ" 'IIIII"''
~ ~ ~ ' ~ ,. QGP1<008'+ PE-PC-2-QO
I y ' ..
~
o. I 0. 20. 30. '+0. 50. 60. 70.
TIME AFTER RUPTURE (SEC)
Fig. 255 Flow quality in intact loop hot leg.
232

>-t:; ...J < :::::> 0
3 0 -' ...
... <!> ... e ... a: :::::> !;:( a: ... Q.
Q ......
1.0
aN QOPK0095 PE-PC-3-QO
0.8
o.s
0.'+
0.2
o.o -10.
1
o.
I ~
.I I
I 0.
-
. -
-- --
20. 30. '+0. 50. 60.
TJME AFTER RUPTURE (SEC)
Fig. 256 Flow quality in intact loop at stea~ generator outlet.
700. • TE8T0178 TE-SL-001
' -- -D TE8C0178 TE-PE-SL-1 \L 1-3 COPERA:
I~ ~
600 . NOTE: DATA DISPLAY HOT WALL
70.
EFFECTS AFTER ~ T0 + 53 SEC .
500.
'+00.
300.
-10.
1-
-.
o. 10.
~r-.,.
~ ~
" ~ I' ....,
1'-. -t-..
20. 30. '+0.
TIME AFTER RUPTURE (SEC)
_..A _,... ,. -.... J.
50. 60.
Fig. 257 Saturation temperature in broken loop cold leg overlaid with TE-BL-1.
233
--
-
70.

.... <!! ... "" ... "" :::> ,_ cC a: ..... 0.. ::E .... ,_
....
..!J ... e ... "" :::> ,_ cC
"" ... 0.. ::E ..... t-
700.
600.
500.
'+00.
300.
-to.
Fig.
700.
·-600 .
1-
500.
--'--f-·
'+00.
300.
-10.
-
-
o.
258
-
o.
. ~ .. TEBTO I 7g"· TE -BL- o"o2 I .. ·a TEBCD179 TE-PE-6L-2,LI-3 COPERA
.
--- --
NOTE: DATA DISPLAY HOT WALL EFFECTS ---AFTER~ T0 + 40 SEC. ---- .. --- ..
r-.. ~--· ·--~ -·
" ._ lx ...... .. v .,__ -- I-'"'
r-...~ .......
""' 1.0. 20. 30. '+0. 50. 60. 70.
TIM~ ArT£R RUPTURE (5[C)
Saturation temperature in broken overlaid with TE-BL-2.
loop hot 1 eg
•
1
TEPTOIBS TE~PC-001 l I
0 T~P.C0185 TE-PE-PC-lill-3 COPERA
-·
NOTE: DATA DISPLAY HOT WALL EFFECTS -
~ . AFTER ~ T
0 + 30 SEC . -
~
"'Ia. ~ ' [',
a..• ..._ " -~ -X - -~ ·-
....,~
10. 20. 30. '+0. 50. 60. 70. TIME AFTER RUPTURE (SEC)
Fig. 259 Saturation temperature in intact loop cold leg overlaid with TE-PC-1.
234

LL
<.!) ...., e ...., 0:: ::::> ..... <( 0:: ...., 0.. lE: ...., .....
~ <.!) ...., c
...., IX ::::> ..... <( 0:: ...., c.. lE: ...., .....
700. • TFPTOiAS "''E:_:PC-OUc I 0 TEPC0186 TE-PE-PC-2 Ll-3 COPERA - ·- --·-· ·,--·
600.
500 . ~
"-"" i'-
" 400. ' ' " '' ... ____ .• ···-··-r...
..... ~
300.
-10. o. 10. 20. 30. 40. 50. 60.
. 700.
600.
TIME AFTER RUPTURE (SEC)
Fig. 260 Saturation t~mperature in intact loop hot leg overlaid with TE-PC-2 .
• TEPT0187 TE.:.PC-003 I o TEPC0187 TE-PE-PC-3A;L1-3 COPERA
-
.... ~ .. -
70.
- NOTE: DATA DISPLAY .HOT WALL EFFECTS -
500 .
'+00.
300.
-10. o. 10.
'"' AFTER ~ T0 + 30 SEC .
"-'I
I"'--"1:1 .A... ...,..
'"\-.. ~ ~ ---..
l ~ ~ ~
20. 30. 40. 50. 60.
TIME AFTER RUPTURE (SEC)
Fig. 261 Saturation temperature in intact loop steam generator outlet overlaid with TE-PC-3.
235
-
-
70.
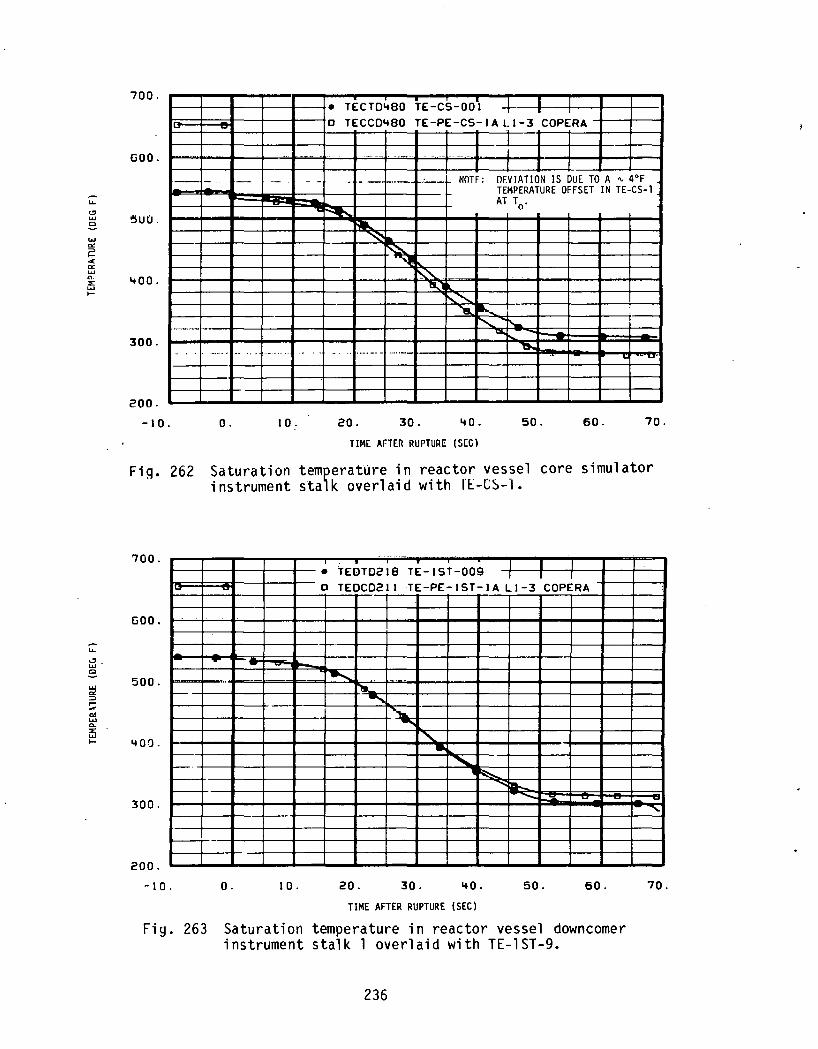
;:
"" w c
w
"" :::> ,. ... "" w
" 2: w 1-
;: .., w c
~ :::> ,... ~
"" w c. ~ ....
700.
GOO.
'!>UU.
'+00.
300.
200.
-10.
. ..
-- - --
.. .. .... .... .. --~ ...
o.
. .. ...
-- -
-
··- ... -
10.
• TECTO'+BO TE-CS-001 I I I
0 TECCO'+BO TE-PE-CS IAL.I-3 COPERA
i -- --·---·
I - . ·-· -··-- ·--·· NOTF: flEVTATION IS DUE TO A "' 4°F
TEMPERATURE OFFSET IN TE·CS·l
.... ~ AT T
0 •
Ia. ~ .. ~
"" ""'"' a..u.
"'' '& ~ 1-
" I'-. ~
'b.. ... . ... . .... --- ·····-·- -- ~ "V"
20. 30. '+0. 50. 60. 70.
TIME AFTER RUPTURE (SEC)
Fig. 262 Saturation temperature ~n r~act~r ~essel core simulator instrument stalk overla1d w1th IE-C~-1.
700.
600.
500.
'+00 .
300.
200.
-10.
1--
f-·
1---t-
.
... -..
o. I 0.
.. I . T T r • TEOT0218 TE-IST-009 I I I
0 TEOC0211 TE-PE-IST-IA Ll-3 COPERA
-
r-.... !'Is.
-..;,
""' ..... ''-. ..
"""-1~
....... ID-._ ..........::
20. 30. '+0. 50. 60.
TIME AFTER RUPTURE (SEC)
Fig. 263 Saturation temperature in reactor vessel downcomer instrument stalk 1 overlaid with TE-lST-9.
236
""'
70.
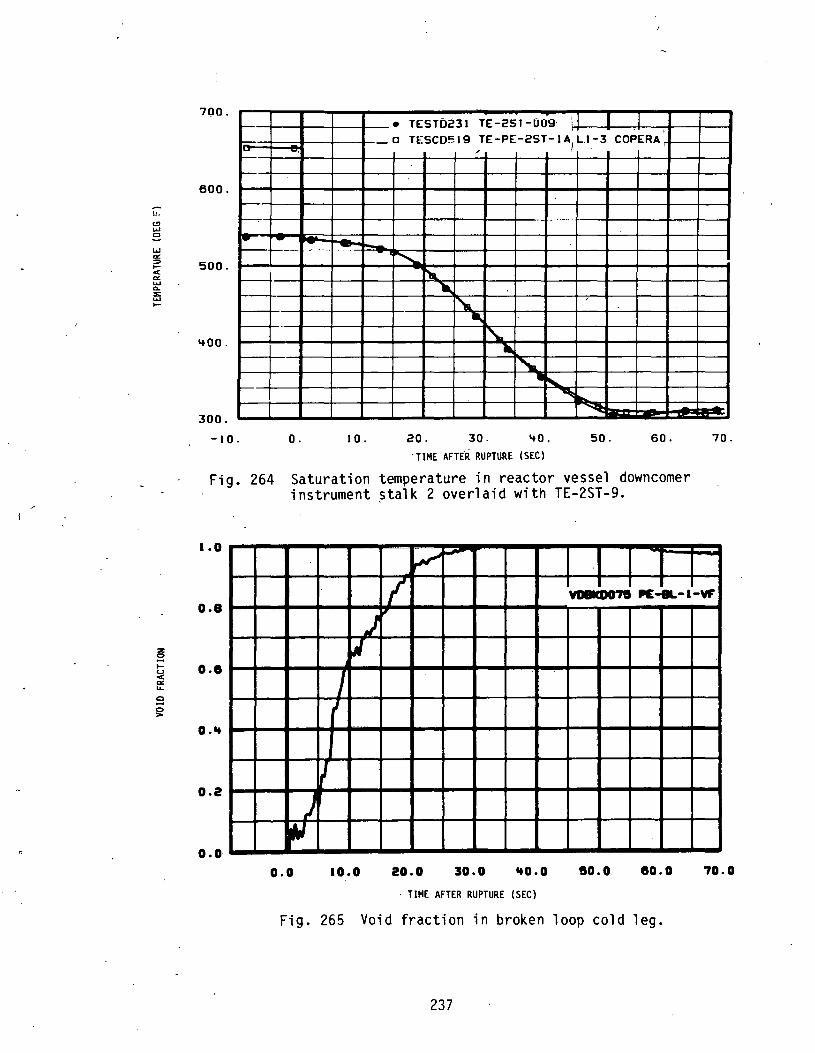
La~
<.!> .... e w a:: ~ ~ < c< .... 0.. ::0:: .... ~
:z 0 -~ u < c< ... c -0 >
700.
600.
500.
'+00.
300.
-10.
1-~
i•
I
~
-N<O- '"' ........ ..
0. 10.
• TEST0231 TE -25 T- 009· I I I
' 0 TESC0519:E-PE-2ST-I~LI_-3 COPERA
·- ........ "
~ ~
--1"- ' .. ~ -' 11
" ~~ ~ 20. 30. '+0. 50. 60.
TIME AFTER RUPTURE (SEC)
Fig. 264 Saturation temperature in reactor vessel downcomer instrument ?talk 2 overlaid with TE-2ST-9.
1.0 ~
,.......
70.
7 VDBICDO'N P£-81.-1-VF' o.e
J ~
I o.e
I I
o ... ..
J 0.2
) ~
o.o o.o 10.0 20.0 JO.O ltO.O 50.0 eo.o 70.0
· TIME AFTER RUPTURE (SEC)
Fig. 265 Void fraction in broken loop cold leg.
237

:z 8 1-u < a:: .... c -"" >
:z 8 1-u < a:: .... e 0 ::-
1.0
o.e
o.e
o ...
0.2
o.o -ao.
1.0
o.e
0.6
Q.lot
0.2
o.o
!\.~ r VD81C0071 PE-k-2-VF
.. ......,
J
I
~ ~ ..
/ .I
o. 10. 20. 30. 50. eo. '70.
TIME AFTER RUPTURE (SEC}
Fig. 266 Void fraction in broken loop hot leg.
M') VDPKD083 PE-PC-1-VF
l~ ~ rv A.
I - ~·
I i I i
I I I ! I j i
I I
i i '
i I I ·r-
I
I NOTE: DATA WERE CALCULATED USING
}!I I CHORDAL DENSITY FROM DE-PC-lB.
I I I I I I
o.o 10.0 20.0 30.0 '+0.0 50.0 60.0 70.0
TIME AFTER RUPTURE (SEC}
Fig. 267 Void fraction in intact loop cold leg.
238

1.0
o.a
o.e :z 0 -~ c..> < "" ..... o ... s 0 >
0-2
o.o
1.0
o~a
:z o.e s ~ c..> < "" .....
r 0 -0 .O.It >
o.a
. o.o
~ { \ ..
~ ~ ~ aj
r VOfiiC008It P£-PC-2-VF
~
J -
o.o 10.0 20.0 10.0 ~to.o '50.0 eo.o 70.0 ' TIME AFTER RUPTURE (SEC)
Fig. 268 Void fraction in intact loop hot leg.
/ :,VOPICDOeS .PE-Pc-1-VF L --··-·- ·-·-- ···-.
.. . ---.
J
'
L I
o.o 10.0 20.0 10.0 ltO.O so.o eo.o TIME AFTER RUPTURE (SEC)
Fig. 269 Void fraction in intact loop at steam generator outlet.
239
'
70.0

-, . ., .
THIS PAGE
WAS INTENTIONALLY
·. LEFT BLANK

SlO
ld Q
NVS ~0~~3
£-1
1S31

5. TEST Ll-3 ERROR BAND PLOTS
This section of presented data consists of Figures 270 through 312.
241

1-u 0..
z 0 -~ Vl 0 .... .... > ..... < >
.., .. ~ LL ...... ~ .....
>-t.. Vl :z .... 0
..... < 0
"" 0 ::.:: u
12!5. "
100. ---~ ~ ~
-~ ~
7!5. /~_/ • PSFTI)It'tlit CV-PIH-01!5
ff,.
rH a UPPRBNO ~ r7
6 LNRSNQ. AI F/~
!50. /.F/ .,,, ., .. . ... '• --- ...... """' Irk
/}
ff/·· .. 2!5.
,, ~
-.
/L.
o. "//
-2!5. . . . .
-0.02 o.oo 0.02 o.o ... , o.oe o.oa o.ao IIMI:. lifTER RUP:t'URf (SEC)
Fig. 270 Valve opening (%) in broken loop hot leg QOBV with, error bands (CV-Pl38-15).
50. o.
~~. .. OEBTOOOI DE 81;--00IA
II" "1 a UPPRBNO 6 LWRBNO
'+0.0 .. I~
30.0
·-
20.0 "' . ''t(" -··. -·· 0
10.0 "' ~ >
~ ,_ ..... .~ . o.o ..
-10.0
•.
.'
-I 0 0 o. I 0. 20. 30. '+0. !50. 60. 70.
TIME AFTER RUPTURE (SEC)
Fig. 271 Chordal density in broken loop cold leg with error bands (DE-BL-lA) (filtered to 4Hz).
242

--150.
• YEB"TO't!S I F'E-BL-001 II
a uPPRBNO p.,~ ~! ,~ ~i.L A LwAeNo .dill ~~ ~~ ~~ I I
_ _j ~ ~lJJ. -~ ~~ I i
i I l ~ I .-.. 100. I ' I ! ! <..> .... Cl) ........ 1-u.
~ ..... u 0 -I .... >
..... u .... Cl) ........ 1-u.
> !::::; <..> 0 -I .... >
50.
NOTE: REFER TO SECTION Ill IN -- ---+-TEXT ON TURBINE CALIBRATIONS.·, ! i I
···-~-·-- 1-·-'-·- ~- ; -· . -~ -·-·- ----!---
r---+ I I 11&1 I I i i I ----r--- -·
~ ~· I I I -~- I : _J.
I ~ N I ' I I ' ....... IJ:
..J . .,_ .. i ~ !A,.., IJ I
:~ ,Jj ~
-A .. ._., ~ ... ~ -~
~ ~ ~ -o. -10. o. 10. 20. 30. 1+0. 50. 60. 70.
TIME AFTER RUPTURE (SEC)
Fig. 272 Average velocity in broken loop cold leg at OTT flange with error bands (FE-BL-1) (filtered to 4Hz).
15.0 • YEOT01+57 F'E-IST-001 a UPPRBNO A LWRBND
10.0 .A4Vt ~ aA JIM .. NOTE: REFER TO SECTION III IN •• 'Jd't TEXT ON TURBINE CALIBRATIONS. ..&
Ill' r·~ ,.
5.0 ~~ .Jil ·--
~ r v· ~1 I lA l ~! '-',( .J. A
\..}JJ ~ ~ , 1\. ~ II \1 \ ...
• u rn •• ' \. I~. ' \.-r~, w. .. l\ __ .A. N\
-
o.o -10. o. I 0. 20. 30. 1+0. 50. eo. 70.
TIME AFTER RUPTURE (SEC) ,
Fig. 273 Average velocity in reactor vessel downcomer instrument stalk 1 with error bands (FE-lST-1) (filtered to 4Hz).
243

~
::£ c.. ~ w 1-
:a 3 0 ...J u.
3 0 ...J u.
100.
'7S.
•o.
"·
- - -" - ····- - . - - -II -t---+--+--+--+---+--+--+--+---1-- -•' ~--:~_ n-Pa•-•• t--+--+--+---f--+-+----if---+--+-___;· a "''••iD t-~-+----t---t--t--+---11'--+-+-~-, &·. L.,._
J, • ....
o. -ao. o. 10. eo. so. . so. ao. -70~
TIME AFTfl! RIIPTIIRF (SFt \
Fig. 274 Flow rate in blowdown suppression tank spray system pump discharge with error bands (FE-Pl38-139).
ISO. • F'WTO'Iel F'T-PIH-oes
a "''•.o .. &L...._., ~ ::::.. ..
r I . _l j_ I ~ --r-
I I I / --NOTE: ERROR BANDS ARE UNDEFINED ./
100. DURING THE TRANSIENT. ; fl'
......
~ ·- ·-!10.
o.
-so. i
-ao. o. 10. eo. so. eo. TIME AFTER RUPTURE {SEC)
Fig. 275 Flow rate in ECCS LPIS pump A discharge with error bands (FT-Pl20-85).
244
. ~
--

::E D..
e w 1-
~ 3 0 ..... Lo-
,. 2 ::z:: ...... iS ..... ~ .... 1-
~ 3 0 ..... Lo-
30.0 -
• ~V~T0087 F"T-Pl28-101t 0 UPPA8NO 6 LWA8NO
-
20.0 .. " -
'
10.0
o.o
NOTE: ERROR BANOS ARE UNDEFINED DURING THE TRANSIENT .
-10.0 .•. ·-·-· ··- .. - .. ----. -
-ao.o o.o 10.0 20.0 30.0 ltO.O eo.o eo.o 70.0
TIME AFTER RUPTURE (SEC)
Fig. 276 Flow rate in ECCS HPIS pump A discharge with error bands (FT-Pl28-104).
3.
2.
I .
o. -10.
Fig. 277
• F"HF"80020 F"T-P139-27-3
D UPPRBNO fa' LWABNO -.,..
NOTE: ERROR BANDS ARE DEFINED PRIOR TO T
0 ONLY.
·---- -·
LA ."
- - - - - - -o. 10. 20. 30. "+0. 50. 60. 70.
TIME AFTER RUPTURE (SEC)
Flow rate in intact loop hot leg venturi with error bands (FT-Pl39-27-3).
245

z -...J
~ LoJ ...J
0 -:::> CT -...J
z
...J LoJ > LLI ...J
0 -:::> CT -...J
70.0 r-~----~~--r-~--~--~--~~~----------------------~
65.0
60.0
55.0
50.0
e L"FT0038 LT-PJ38-058 a UPPRBNO 6 LWRBNO
~5.0 ~~--_.------~~----------------~--~--~--------_.--~ ··10. o. 10·. 20, 30. ~0. 50. 60.
TIME AFTER RUPTURE (SECi
Fig. 278 Liquid lev~l in blowdown suppression tank south end with error bands (LT-Pl38~58),
~o.
70.
- • L"FBOO~I LT-P139-008 a UPPRBNO 6 LwRBNO
30.
t----+--+---tlH--+----l--+--+---+--1-- NOTE: ERROR BANDS ARE UNDEFINED -AFTER T0 + 13 SEC. . -
20.
I 1 v.
, l---+--+·--l-----t--+---1f---+--+---t--t--f--+---t--+---t
0.
-10. o. I 0. 20. 30.
TIME AFTER RUPTURE (SEC)
~0. 50. 60.
Fig. 279 ~iquid level in pressurizer north side with error bands (LT-Pl39-8).
246
70.

"' ... ... u ... V>
I I-u. ...... ::e:: "" -' ><:
>< => -' ... ::E => I-z ... ~ :E
"' ... ... u ... V>
I I-LL ...... :E
"" -' ><:
>< => -' LL
:E => I-z ... ~ :E
100, • MFBT0522.ME-BL-OOI D UPPRBNO
f- A LI.IRBNO 75. -- [ I j_ I I
I I I [
- I I I I I ·-NOTE; REFER TO SECTION III IN TEXT
ON DRAG DISC CALIBRATIONS. 50.
I
1---f-J
"· I, I~
25 . I ':\A ~ :~ ., .... •,t'l ~ i\ II ··~ J ftJ LIA t-Ill ,
~ . .- ..... vr ~ ~-. .. ..~~ ~ .... ~ • AJ4 ' \ ... I''Y""'t --,.. 11 "'- ... lrll .A.
-.... ~
o. '~'-- .... ~
~
-25.
-I 0. o. I 0. 20. 30. 40. so. 60. 70 ..
TIME AFTER RUPTURE (SEC)
Fig. 280 Momentum flux in broken loop cold leg at OTT flange with error bands (ME-BL-1) (filtered to 4Hz).
7.:5 • ~OT~5 HE-IST-001 a UPPAINO A LWAINO
!5.0
2.!5 • ~l
NOTE: REFER TO SEC~ION III IN TEXT ON DRAG DISC CALIBRATIONS.
I
-- --
..._ .iJ\.; ... n.. .A . .... o.o ~- "l¥"' lt lo.A.. ~ _ ..
... J'\ ~A "'
... .. - -~ .A ....
~ .. ~ IJJf¥ ll"'_!_- -"' -...
-ao. o. I 0. 20. 30 .. ItO. 50. 60. 70.
TIME AFTER RUPTURE (SEC)
Fig~ 281 Momentum flux in reactor vessel downcomer instrument stalk 1 with error bands (ME-lST-1) (filtered to 4Hz).
247

0 ..... v> ~ ..... "' :::> v> v> ..... "' 0..
-' < -.... :z ..... "' ..... "· ~ 0
0 ..... v> e:. ..... "' :::::>
'" v> ..... "' 0..
-' ~ I-:z ~ ..... .... := 0
!5.0 .,I\-:?;., • P08T0052 POE-IL-001 "j .... a UPPI8G
• I A UIBG
.. lit 2.!5 I .l
~· it
.I JL
o.o - -
-2.!5
-10. o. I 0. 20. 30. '+0. !50. 60. 70.
TIMi AFTER RUPTURE (SEt)
Fig. 282 Differential pressure in broken loop hot leg at 14-to-5-in. reduction with error bands (PdE-BL-1) (filtered to 4Hz).
300. • POBT0053 POE-BL-002 a UPPABNO 6 LWABNO
200 .
l(l(l tJl ~
~ lilllo.. -...... c.
-100.
-I 0. o. I 0. 20. 30. litO. 50. eo. TIME AFTER RUPTURE (SEC)
Fig. 283 Differential pressure in broken loop cold leg at 14-to-5-in. reduction with error bands (PdE-BL-2) (filtered to 4 Hz).
248
_._
70.
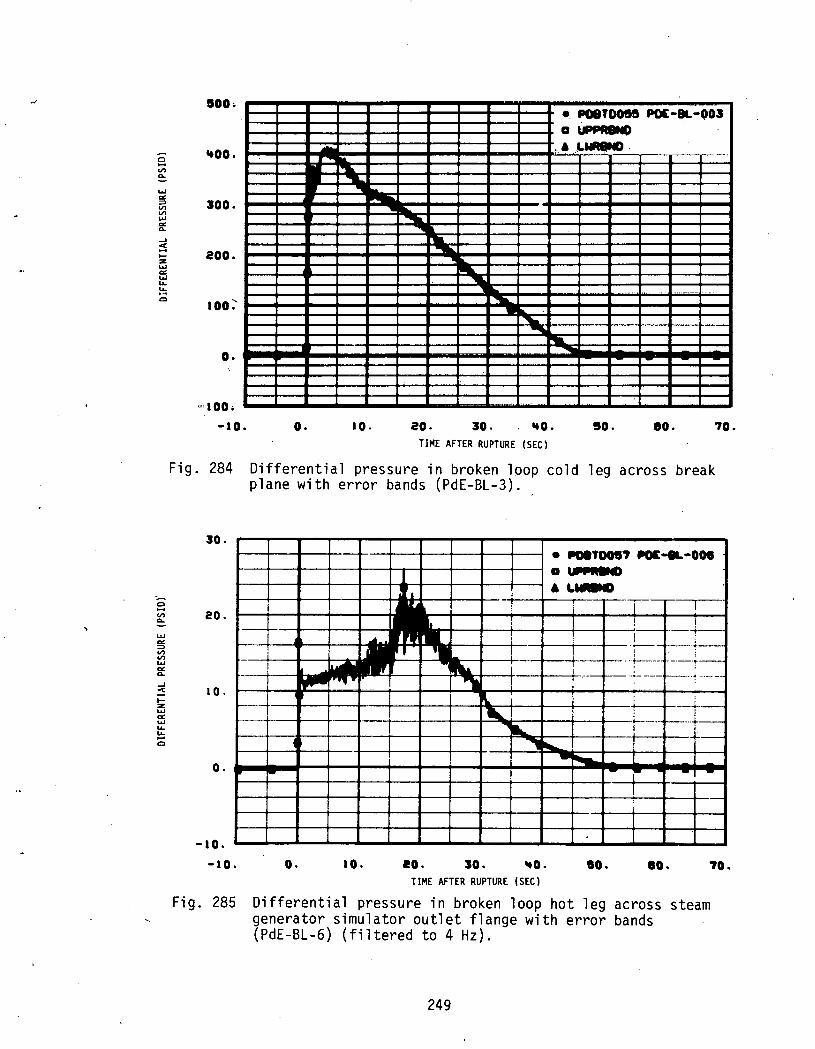
0 .... "' Q.
...... "' ~ "' "' ...... "' Q.
....J := 1-z ...... "' ...... .... .... ... 0
..... 0 .... "' Q.
.... "' ~ "' "' ......
"' Q.
....J
:::5 ...... z ...... "' ...... .... !!; 0
soo.
ltOO.
300.
200.
100:-
o.
'"100·
-10.
.... ~
o.
• POBTOOH 110£-BL-003 a UPPRBHO
.a L......n .... ~ ..... .. ~ ....
r-.a -~
=»-----""" ~ !'Ill.
ao. 20. 30. . ItO. so. eo. 70. TIME AFTER RUPTURE (SEC)
Fig. 284 Differential pressure in broken loop cold leg across break plane with error bands (PdE-BL-3).
lQ.
• ~,ooe., POC-a-ooe 1 a .,.," • ., ... .....,
20.
! i
I i
10.
II i ; ,.,... "I -~ ---···--
l ' :
' : .... ( ..,
~ -,.._ Q.
. -10.
-10. o. 10. ao. JO. ItO. so. eo. '70. TIME AFTER RUPTURE (SEC)
Fig. 285 Differential pressure in broken loop hot leg across steam generator simulator outlet flange with error bands (PdE-BL-6) (filtered to 4Hz).
249
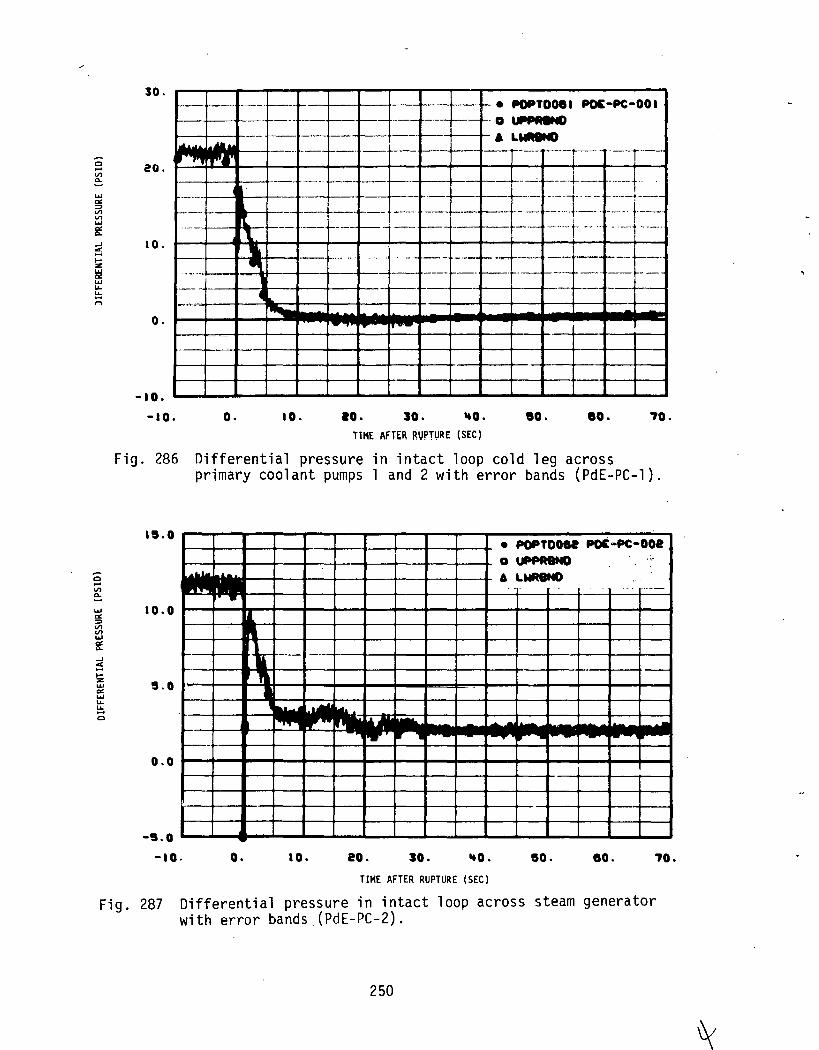
c .... V'l 0..
.... "' ;:;)
"' "' .... "' 0..
-' ~ ,_ z ~ .... ..... ~ n
c ..... "' ~ .... "' ;:;) V'l V'l .... "' 0.
-' ~ 1-z w
""' .... ..... ..... .... c
30. t-·- f----·- ---- +----- t--+-----1--+---- t------ -+ • POPTD08 I PDE-PC-00 I --·+---1t-·- 1---- ---1---~- ---- ---~---J...- D UII'PRIND 1-·
----+--~--1----+--1- A LWR8ND 1 ... , .. ...... , IT''• ••••r--t----- ---1---- -~----'---+----1~-- --- ,__. -r--
i 20 .
f----
l 0. f--·
·--· 1--- - ~-- -----~ ~--+--- ------f· +--~--+--_-+-_ ----+-_ ..=-_+ =r.= =--::=~ := -=--=~~~:l~-~- ::=~~F---~-
-+-------1+--- ---1----· f--+ -- 1--·-- --- -----·-t --. -·- -----
-~-If----·· "111=1+--i---- ...... .. ---- = =-f.--~ ~= f-~3-= ----~ ~=--
-o.
-10.
-ao. o. 10. ao. JO. 'tO. so. eo. '70.
TIME AFTER RUPTVRE (SEC)
Fig. 286 Differential pressure in intact loop cold leg across primary coolant pumps 1 and 2 with error bands (PdE-PC-1).
18.0 • POPTDOal POE~PC-002 a uPPRINO .. , A LWR&ND
·----
10.0
·-5.0
~ ~ - ..... .... .... - ..... r--
o.o
-s.o -ao. o. 10. eo. JO. 'tO. so. eo. '70.
TIME AFTER RUPTURE (SEC)
Fig. 287 Differential pressure in intact loop across steam generator with error bands_(PdE-PC-2).
250

c -VI 0..
~ VI VI ..... EE ...J
~ 1-:z ..... ot! ..... "-~ c
c -VI 0..
..... ot! ::> VI VI ..... ot! 0..
...J
~ 1-:z ..... ot! ..... "-~ c
3.0 • POPTOOIJ POE-PC-OOJ
·-·---f- a uPPRBNO
• LWA&NO --- --- -··-·- ---
2.0 I , t ·-1-· " ---
._
1.0 ,. ~
o.o ~ ~ "it'R ~ ... ...- ~ .. ... -· '& v- -- .. .. _ . .....!
-a.o -10. o. 10 . . 20. JO. ItO. !50. eo. '70.
TIME AFTER RUPTURE (SEC)
Fig. 288 Differential pressure in intact loop hot leg reactor vessel outlet to flow venturi with error bands (PdE-PC-3).
2!500. • PORTD0'71 POE-AY-001 a UfiPABNO
·~ooo. • LWR8NO - -
1!500 . --NOTE: ERROR BANDS ARE DEFINED -
AFTER T0 ONLY. --1000 . I
-.........
....... soo. ....
"11IL. roo...
~ --o.
-soo. .
-10.0 o.o 10.0 20.0 30.0 ~to.o !50.0 eo.o '70.0
TIME AFTER RUPTURE (SEC)
Fig. 289 Differential pressure from reactor vessel downcomer stalk 1 to blowdown suppression tank with error bands (PdE-RV-1).
251
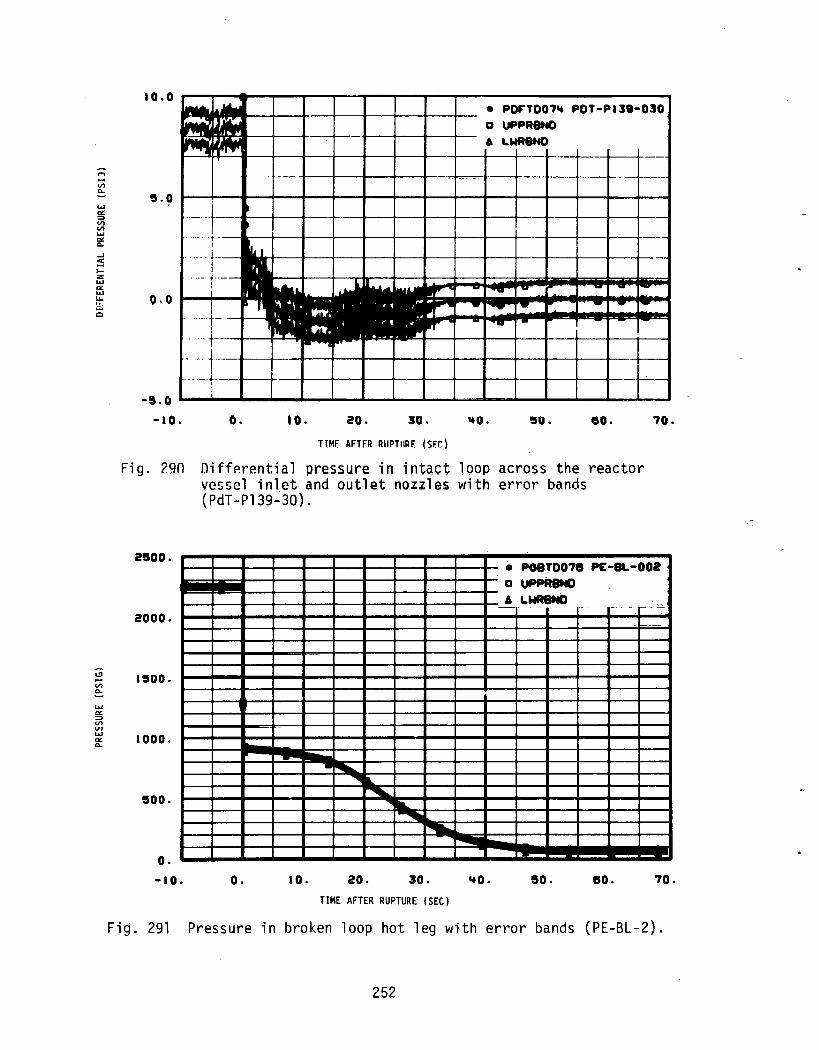
~ -V')
~
"' "' :::> V') V')
"' "' 0..
...J
~ 1-:z ..... "' w lA. ~ Q
~ -V') 0..
"' "' :::> V') VJ
"' "' 0..
10.0 .-.. ... • POf:T00'71t POT-PIJSI-030 ...... a UPPRBNO ...... 6 LWRBNO ....
oo,_,,_
!5. 0
··-
···-·. --l ·-· ...
.. ··- .... - """"a" - - - -
C).O ~ ... -.....- - - - ~
....... f- ~- ---
r· ....
........ i
-s.o -10. o. lO. 20 .. :so. ItO. so. eo. '70.
TIM!: AFTF.R RIIPTIIRF. (SF,C)
Fig. ?90 OiffP.rential pressure in intact loop across the reactor vc~scl inlet and outlet nozzles with error bands (PdT-Pl39_:30).
2500.
2000.
1soo.
1000.
500.
o. -10. o. 10.
.. ~ """'''IL
......... .... _......... ~
20. 30.
TIME AFTER RUPTURE (SEC)
• POBT00'78 PE-BL-002. a uPPR8NO 6 LWR8ND .. - -·---
---
ItO. so. eo. '70.
Fig. 291 Pressure in broken loop hot leg with error bands (PE-BL-2).
252
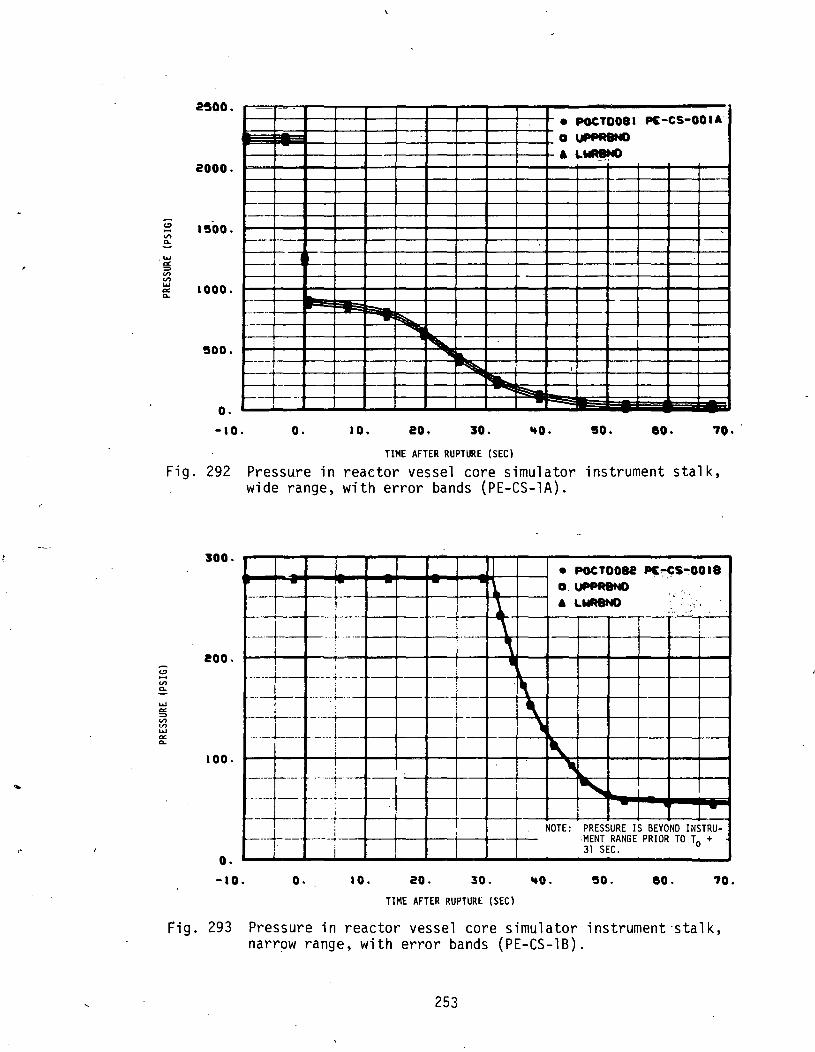
c:; -V) ... ·"' ""' ::::>
V) V)
"' ""' ...
2SC)O.
2000.
1!500.
1000.
!500.
o. -ao.
-· . ---; r-
-·
.. -
r---· --· -·--r-- -·
o. I 0.
-
• POCTD081 P£-CS-OOIA a uPPA8ND
• L~ ..
-·-
,.:
~ ~ 'IIlii. ~ I -...
"""'' ~
eo. JO. ItO. !50. eo. '70. >
TIME AFTER RUPTURE (SEC)
Fig. 292 Pressure in reactor vessel core simulator instrument stalk, wide range, with error bands (PE-CS-lA).
<!> -V) 0..
"' ""' ::::> V) ._, "' ""' ...
JQO.
200.
100.
o. -10.
--·
---+-j
·---+·-____ j__ I ---t-
·-··- --·-
-··- r-··-.
-.---- -
------___ .J ___
I I" i
o.
I • POCTOOH PC~~s~ooaa
F - - - a . uPPA81C) .. l • LWA8ND ·.';'
-··· _., -·-·t--
I ____ \ ! I f--·· t ·-·
l ' ····-
i I .. ~-- +- ··- I
i 1 ., ··- -···:-+--··· -1 \ -·--+- t--
I
' ; ·-······-·
; " I
" .. ___ _.. __ i '' I -·- ---·-- -· -I
---·t i '
NOTE: PRESSURE IS BEYOND INSTRU----~- -MENT RANGE PRIOR TO To +
i 31 SEC.
10. eo. 30. ItO. !50. eo. '70.
TIME AFTER RUPTUR£ (SEC)
~ig. 293 Pressure in reactor vessel core simulator instrument·stalk, narrow range, with error bands (PE-CS-18).
253

c:D ~
V')
0..
... ~ V') V') w
"" 0..
2500.
2000.
1!500.
I 01)0.
soo. -0.02
• POCTH8~8 PE-CS-002FF a UPPR8NO
~ A LWR8NO
~~ ~ .... ~ ~ ...
~ ... k ~L ~
'l:: ~ ·- .......
o.oo o.o2 o.o~ o.oe o.oa 0. I 0 o. 12
TIME AFTER RUPTURE ISECl
·Fig. 294 Pressure in reactor vessel core simulator instrument stalk, short-term plot, with error bands (PE-CS-2Ff).
<!:1
V')
0..
... "" -, V') V') ... "' 0..
2500.
2000.
1500.
1000.
500.
o.-ao. o. I 0.
.. r--.... .. ....... -loo..
20. 30.
TIME AFTER RUPTURE (SEC)
• POCT~~ PE-CS-002FF o UPPRBHO
•• LWR&ND
I I I I I I T T
I
NOTE: ERROR BANDS ARE UNDEFINED AFTER T0 + 10 SEC.
I
~o. 50. eo. 70.
Fig. 295 Pressure in reactor vessel core simulator instrument stalk, 70-second plot, with error bands (PE-CS-2FF).
254

<!I -v>. D..
w 0: ~ v> v> w 0: D..
<!I -v> D..
w
!3 "' v> w 0: D..
...
50.0 • PGTT0096 PI::-SV-01'+ o UPPRBND
'+0.0 A LWRBND
~ ~ ~ I 30.0
Q,lr' ~ ~ ~ ~ .... ~~~ vy: ~ ~ """'-. ra.. Ia..
~ -20.0
V' I~ ........ r.... I.a.
._ I-.,.,... .
rtt.. ~ .. .....
10.0 I
o.o ~' ~ NOTE: DATA INITIAL VALUES ARE
ADJUSTED TO 0 PSIG.
-10.0 l I I I I I l
-0.10. o.oo 0.10 o.2o o.3o o.'+o o.5o o.eo o.7o o.ao o.ao
Fig. 296
50.0
'tO.O
30.0
20.0
10.0
o.o
-10.0
-10.0
TIME AFTER RUPTURE (SEC)
Pressure in blowdown suppression tank header above downcomer 4, short-term plot, with error bands(PE-SV-14).
~ ~ -. / ~ - --
/ / ~ _.... - ---"/ ~ --~
/'_.~ 'l • POTT0088 PE-SY-OI't
~ "" ... ,r/ D UfiPAatG • L.WI8tD
~ ~..,. ,
J
~ ,.,.
NOTE: DATA. INITIAL VALUES ARE ADJUSTED TO 0 PSIG.
I I _l l I -o.o 10.0 20.0 30.0 'tO.O 50.0 eo.o 70.0
TIME AFTER RUPTURE (SEC)
Fig. 297 Pressure in blowdown suppression tank header above downcomer 4, 70-second plot, with error bands (PE-SV-14).
255
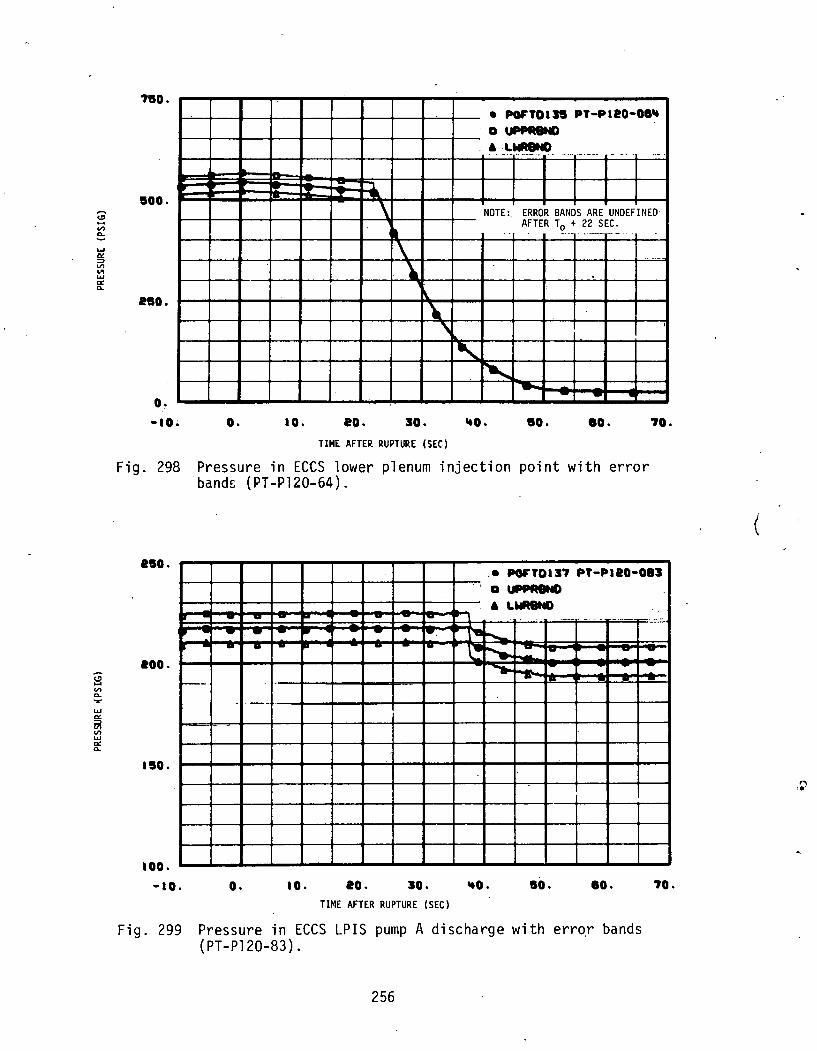
~ -V)
~ ... 0! :::> V) ... ...... a: Cl..
s V)
Cl.. .,... ...... a: til V) ...... a: Cl..
'7SO.
• PvTDIJS PT-PII0-0811t a uPPRIIC) A -LWR8ND . . ... --··- ···- ----- - -.. --- .
~ "'1 soo. --\ NOTE:. ERROR BANDS ARE UNDEFINED·
lit AFTER T0 + 22 SEC.
---- ··- -
\ \
eso. 1\. .. '
I
' ' --- -o. -10• o. 10. eo. 30. litO. so. ao. '70.
TIME AFTER RUPTURE (SEC)
Fig. 298 Pressure in ECCS lower plenum injection point with error ·bands (PT-Pl20-64).
eso. •• POI'TDI3'7 PT-PII0-083
-eoo.
1----
ISO.
100.
-10.
--·
---
·-
o.
- --- -- -..
~ - 1-
Ill' - - - r-. ~ - I•
-
10. eo. 30. TIME AFTER RUPTURE (SEC)
. ; a uPPRIIC)
• LMR8tt0 ·- . ----- - ...
[,. r-.-_ ..... r...,;. r-- ... -~ .,..
1-..--
'tO. so. ao.
Fig. 299 Pressure in ECCS LPIS pump A discharge with erro,r bands (PT-Pl20-83).
256
. --
'70.
(
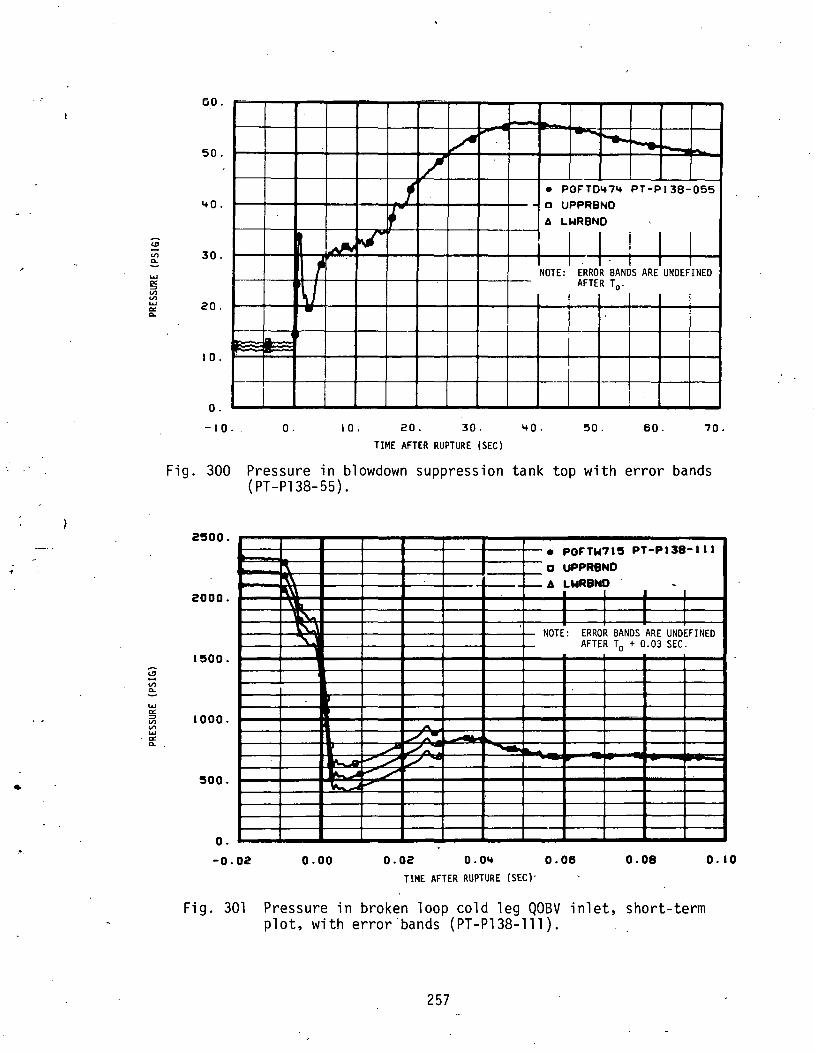
<!J
V) 0..
..... IX :::> V) V) ..... IX 0..
<!J .... V) 0..
..... 0:: :::> V) V) .....
. IX 0..
•
. •
60.
50.
40.
30.
20.
I 0.
o. -IQ.
-
-
r ~J -
1 ...
o.
·-·
~ I"'"
/ 1
~-
~ ~
I 0. 20. 30.
TIME AFTER RUPTURE (SEC)
.__, ~
• POF'T0474 PT-PI38-055 • D UPPRBND
A LI.IRBND
i I I I I I 1NOTE: I ERRO~ .BANcis ARE
1 UNOEF
1INED
AFTER TQ.
I
I I
40. !50. 60. 70.
Fig. 300 Pressure in blowdown suppression tank top with error bands ( PT -Pl38-55).
2500.
2000.
1500.
1000.
500.
o . -0.02
~ ~ "\.
W\......a-~.A ~......t
o.oo
• POFTW715 PT-PI38-III
a UPPRBNO ~A LWRBNO -
I I I I I I I I I I I I
NOTE: ERROR BANOS ARE UNDEFINED AFTER T0 + 0.03 SEC.
A ./A._ -.,... /A.
.._ f-""' ./ './-"" ./' r"
0.02 o.o~t o.oe o.oe 0. 10
TIME AFTER RUPTURE (SEC)·
Fig. 301 Pressure in broken loop cold leg QOBV inlet, short-term plot, with error·bands (PT-Pl38-lll).
257
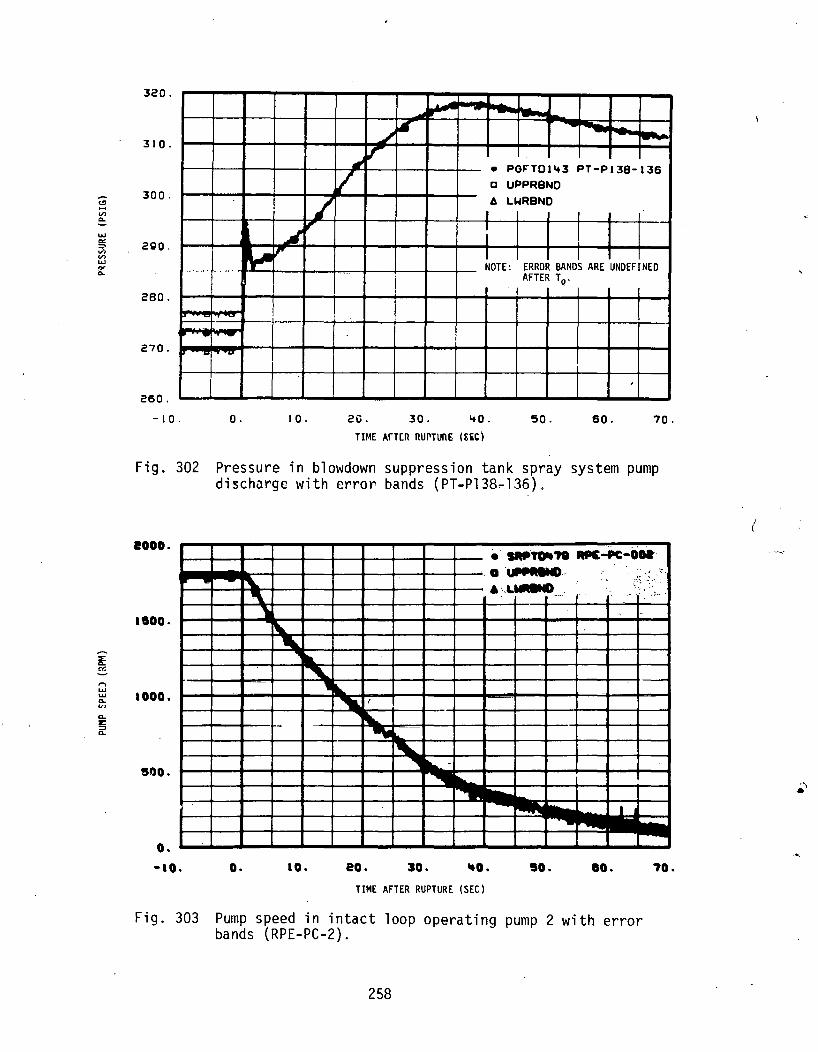
<!I .... "' "" ..... a: =' .,., "' ..... "" ""
::£
"" tY.
1""1 ..... ..... 0.. Vl
0.. ~ :::> 0..
320.
310.
300.
2gQ,
280.
270.
260.
-10.
--~- ...
~
-..
" ... ,. ~
rr ... . ..... ~
--~
·w
o. I 0.
....... -~
..,/ ~ r- ....
,I r
v • POF' T 0 I'+ 3 PT-P138-136 0 UPP~SNO
6 LW~BNO
' l I NOTE: ERROR BANDS ARE UNDEFINED
AFTER Tq.
'
20. 30. ~0. 50. 60. 70.
TII~E Arrcn nuroTunE (SiC)
Fig. 302 Pressure in blowdown suppression tank spray system pump discharge with error bands (PT-Pl38-136).
aooo.
ISOO.
1000 .
SQO.
o. -10.
... 1'-
' l
o.
• SRPTOit.,. RPC-PC-OM· . a UPP•G- , . ·--~
• .. L .... . :_!~.-{·.· ..
····· .- -~ .....
...::.
~
' Ill. '- ·~
~~ (
' l"-. ~
~ I
~ I 1
10. eo. 30. so. eo. 'PO.
TIME AFTER RUPTURE (SEC)
Fig. 303 Pump speed in intact loop operating pump 2 with error bands (RPE-PC-2).
258
(
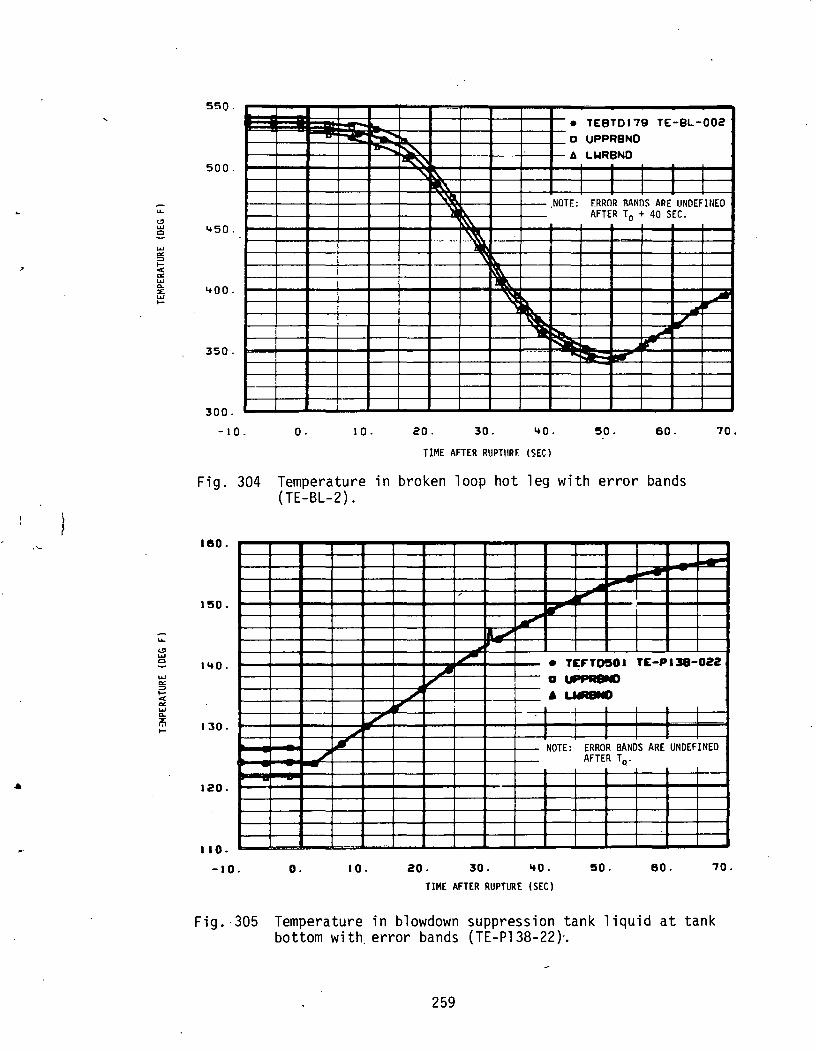
-u..
"' ...... 0
...... o< :::> 1-< o< ...... a.. :E ...... 1-
L:
"' ...... 0
...... o< :::> 1-< o< ...... a.. z: "' 1-
550.
500.
'+50.
'+00.
350.
300.
-I 0. o.
--..:: ~ ...... ~~
I 0.
• II. a "--"" 6 I~
~ ~ ~'\
"'\.X\ .NOTE: "',}
1.\.'\.
.. ,,~ "" -~ ··-~ ~ !IlK
'~ '~ ~
""'\111
~
20. 30. '+0.
TIME AFTER RUPTliRF. (SEC)
TEBT0179 TE-BL-002 UPPRBND LWRBND
I I I I I I I I
F.RROR RANI)$ ARE liNOEFIIIED AFTER T0 + 40 SEC.
~ .Mrt'"
v _.. .... r
~o. so. 70.
Fig. 304 Temperature in broken loop hot leg with error bands (TE-BL-2).
uso.
1~0.
1'+0.
130.
120.
110.
-10.
Fig. 305
-~
-.... ,....
, ~ .,. .,
IIJ
,...,.,.,. • TE~T0501 TE-PI38-022
.A v a UfiPR&IC)
/ A LYI8NO W" I
./ •• 1 I I ~ I I I I I
~ NOTE: ERROR BANDS ARE UNDEFINED J AFTER T0. -
.. -
o. I 0. 20. 30. '+0. ~o. eo. 70.
TIME AFTER RUPTURE (SEC)
Temperature in blowdown suppression tank liquid at tank bottom with. error bands (TE-Pl38-22)·.
259
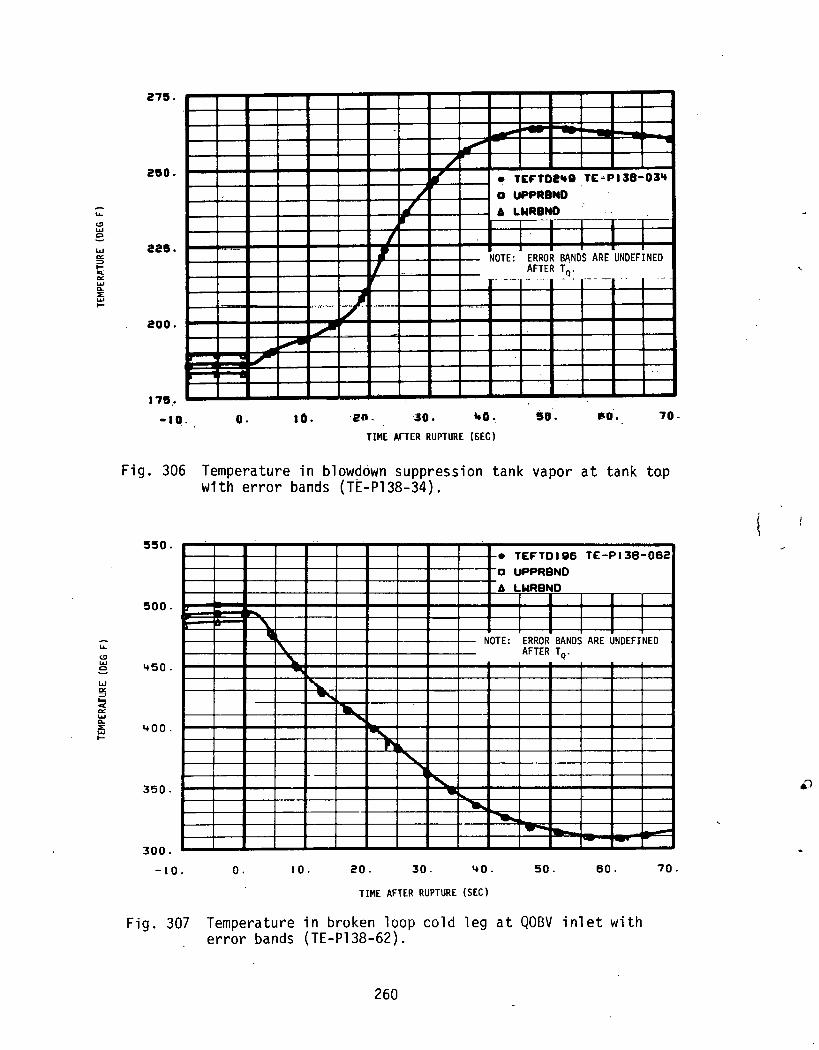
..... <.!1 ..... e w "" => ..... ..: "" ..... Q.
::E ..... ...
;;: <.!1 ..... e w IX :;, ... < "" ..... Q.
::E ..... .....
275.
2!50.
22!5.
200.
17!5 ..
•IQ.
...
o.
.•--•1•'>••
_,. -~ ~
ao.
/_ .. ./ ., • TEF"TD2 .. 8 TE~Pll8-0J1t
/ a uPPRIND L • LNRBND . . ... I
I I I 1 , NOTE:' ERROR BANDS ARE "uNDEFINED
I AFTER TQ . . ---- ·- 040 --- -· ·- .
~ . ..... -- .
en. ~o. ~o. !SD. 1'11:1. 70-
TIME AFTER RUPTURE (SEC)
Fig. 306 Temperature in blowdown suppression tank vapor at tank top w1th error bands (TE-Pl38-34).
550.
500.
450.
400.
350.
300.
-10.
f--
Fig. 307
• TEF"TOI86 TE-P138-062 0 UPPRSNO A LWRBNO
'-• NOTE: ERROR BANDS ARE UNDEFINED '- AFTER TQ. "'--.
........ _ ~ .. ...
..... '- ·-
1"'1 "'- ....
"--"' """ --.. --
o. I 0. 20. 30. 40. 50. eo. 70.
TIME AFTER RUPTURE (SEC)
Temperature in broken loop cold leg at QOBV inlet with error bands (TE-Pl38-62).
260

~ <.!1 .... c
.... a: ::::> ..... < a: .... 0.. lE .... .....
~ <.!1 .... e .... a: ::::> ..... < a: ....
. 0.. :z: .... .....
_j
!52!5.
• TEF'T0197 n:-Pl3B-063 o UPPRBNO
500. A LrRB~O
I I .......... ~- I I I I
"""''l I I I I
'+75.
~ NOTE: ERROR BANDS ARE ·uNDEFINED
' _AFTER T0
. '
"-' I'll.
'-I
'+50. '-"" '-
="" .... '+25.
..... ... ......,.,_ ~ ~
'tOO.
-I 0 .. o. l 0. 20. 30. '+0. 50. 60. 70.
TIME AFTER RUPTURE (SEC) .
Fig. 308 Temperature in broken loop cold leg isolation valve inlet with error bands (TE-Pl38-63).
1!50.
100.
!50.
o. -10.
Fig. 309
• TEF"T0201 TE-Pil8-11tl :a UPPR8ND
6 La,t~BND ..
"':" "':" "':" "':" "':" "':" "':" "':"
o. I 0. 20. 3(1. ItO. !50. eo.
TIME AFTER·RUPTURE (SEC)
Temperature in blowdown suppression tank spray system 60-gpm header with error bands (TE-Pl38-141).
261
"':"
70.

... <!I .... c
.... "" :::> ..... ~ .... D. :IE; .... .....
~ <!I .... L..l
.... ,... :::> ..... < a:. .... D. ::E .... .....
700.
650.
eoo.
550.
500.
'+50.
'+00.
-10.
---·
r---
·--···-·1-· .. ·-·--............ , t-~~
---·
==t== r----
o.
- ........... .... " ... -
Ill.. ··-...... " --
-· --- I "Ill
" -·----t----- ------ .... .-~,- 1=-=-- -- " '
--1- ! ·------ --
I 0. 20. 30.
TlMi: ~.HER. P.i.JPTIJP.E (SFI::)
• TEF"T0205 TE-P139-020 0 UPPRBND A LI.IRBND
~
NOTE: ERROR BANDS ARE UNDEFINED AFTER TQ.
··---·
lt.. -.,._
"""'- ... -'+0. 50. 60. 70.
Fig. 310 Temperature in intact loop pressurizer liquid with error bands (TE-Pl39-20).
sso.
en.
-soo.
't'7S .
'ISO.
't2S.
-10.
Fig. 311
• TCOTDSOJ TC-S0-001 a uPPRilC) - - • i"""oa.. a LWR8ND
ra.. I -· Ill. I I I I I '- I I I I I
] NOTE: ERROR BANDS ARE UNDEFINED "- AFTER TQ. ..
r.. ·-... ·-·-- -· ~
........ --"""-
1-.. ~ ....,..,.
~ ....... ..
o. 10. ao . JO. 'tO. so. eo. '70. . TIME AFTER RUPTURE (SEC)
Temperature in intact loop cold leg at steam generator inlet ~lenum with error bands (TE-SG-1).
262
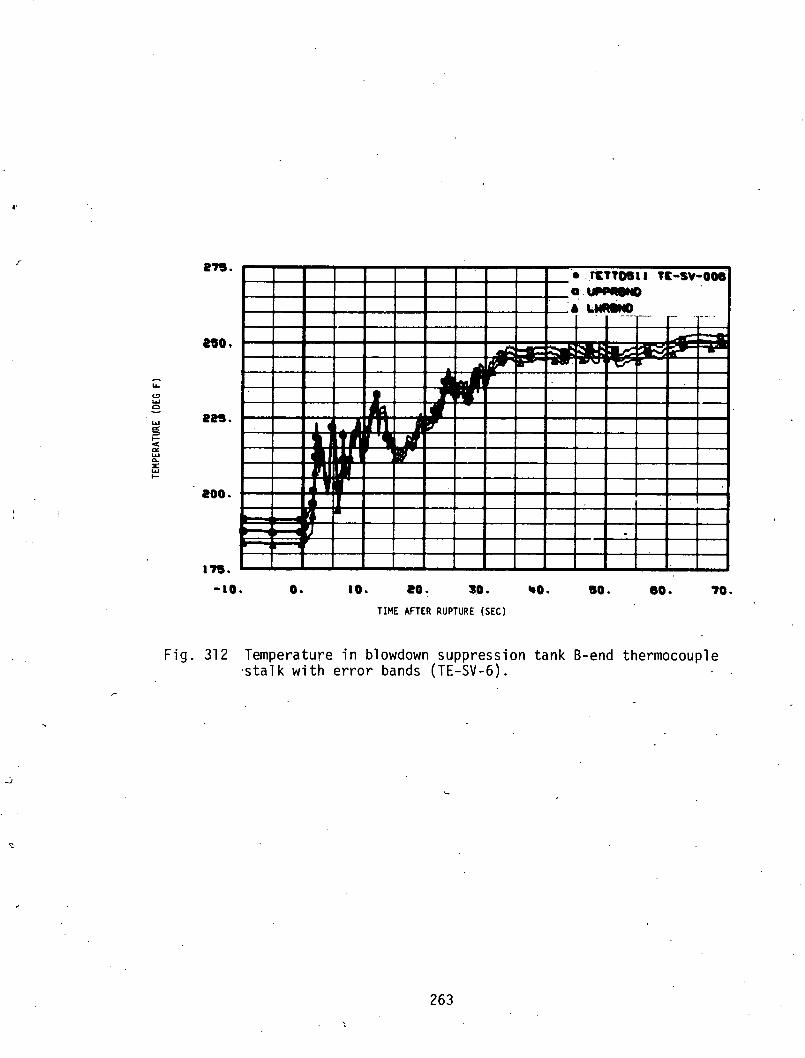
. ••
..
L: <!> ...... c
...... IX ::::> ..... < "' w c.. ::E ...... .....
2'7S.
no.
en.
eoo.
1'7S.
-ao.
II ~
o.
' r•
t.t~ .JII u·•\! ~ ' • II
1-
10. eo. 10.
TIME AFTER RUPTURE (SEC)
• rtnosaa Tc-sv-ooe a U'P•tD &L....,
--- r- r . ---.
~ ~. -1-"' ~~
·-
.
so. eo. '70.
Fig. 312 Temperature in blowdown suppression tank B-end thermocouple ·stalk with error bands (TE-SV-6).
263

VIII. REFERENCES
1. T. K. Samuels, Conformed Copy of LOFT Experimental Operating Specification, Volume 2, Nonnu.clear Test Series Ll Experiment 3 and 3A, NNE Ll-3 dn~ 3A, Aerojet Nuclenr Compnny. EOS Volume 2. NNE Ll-3 and 3A Revision 2 (September 1~76).
2. J. R. White, Experiment Prediction for LOFT Experiment Ll-3, Aerojet Nuclear Company, EP Ll-3 (June 1976).
3. J. R. Chappell, Quick Look Report on Loss of Coolant Experiment. Ll-3, Aerojet Nuclear Company, QLR-76-4 (July 1976).
4. H. C. Robinson, LOFT System and Test Description (Loss of Coolant Experiments Using a Core Simulator), TREE-NUREG-1019 (November 1976).
5. J. R. Chappell, Experiment Data Report for LOFT Nonnuclear Test Ll-1, TREE-NUREG-1025 (December 1976).
6. H. C. Robinson, Experiment Data Report for LOFT Nonnuclear Test Ll-2, TREE-NUREG-1026 (December 1976).
7. G. M. Millar, Experiment Data Report for LOFT Nonnuclear fest Ll-3A, TREE-NUREG-1027 (December 1976).
8. F. S. Miyasaki, Digital Data Acquisition Program, ANCR-1250 (August 1975).
9. N. L. Norman, LOFT Data Reduction, ANCR-1251 (August 1975).
10. G. L. Biladeau et al, LOFT Experimental Measurements Uncertainty Analysis, Aerojet Nuclear Company, LTR 141-39 (September 1975).
264
·•

11. S. N~ Zender, Experimental Data Report for Semiscale MOD-1 Test S-01-03 (Isothermal Slowdown with Core Resistance Simulator), ANCR-1195 (March 1975).
265
'I
l.
)
ac Ace. BL BDST BDSTSS BWST CL cs DAVDS DC de Deg. DP OTT ECC ECCS EOP EOS ESF
FF Fig. FM Freq. ·
a FTS2 g
gpm HL HPIS hr HX Hz in. INEL Instr. lb
lbm LOCA LOCE LOFT
IX. LIST OF ABBREVIATIONS AND ACRONYMS , I
Alternating ~urrent Accumulator Broken Loop Blowdo~n Suppression Tank Slowdown Suppression Tank Spray System Borated Water Storage Tank
Cpld Leg Core Simulator Data Acquisition and Visual Display System Down comer Direct current Degree Differential Pressure Drag Disc-Turbine Flowmeter Emergency Core Cooling or Coolant Emergency Core Cool~nt System Experimental Qperating Procedure Experimental Operating Specificat1on Engineered Safety Features Degrees Fahrenheit Free Field Figure FrPf111Pnr.y Mnclulator Frequency Feet Feet-second2
Acceleration due to gravity Gallons per minute llot Leg
High-Pressure Injection System Hour Heat Exchanger Hertz Inch ( s) Idaho National Engineering I ~hnr~tory
Instrument Puund(s) Pounds mass Loss-of-Coolant Accident Loss-of-Coolant Experiment Loss of Fluid Test
·)
267
LP LPIS LPWR msec MW
N2 p
PC PCP PCS PCT ppm pps psi psi a psid psig PSMG QEUD
QOBV RABV RMS rpm RTD RV scs sec SG Snuh. TAN Temp. UP JJSec v
v volsys p
p
<>
Lower Plenum Low-Pressure Injection·system Large Press~rized Water Reactor (~1000 MW) Milliseconds Megawatt Nitrogen Pressure Primary Coolant · Primary Coolant Pump Primary Coolant System Percent Parts per million Points per second Pounds per square inch Pounds per square inch - absolute Pounds per square inch differential Pounds per square inch - gauge Primary System Motor Generator (Sets) Qualified Engineering Units Data Quick-Opening Slowdown Valve · Reflood Assist Bypass Valve Root Mean Square Revolutions.per minute Resistance Temperature Detector Reactor Vessel Secondary Coolant System Second(s) Steam.Generator Snubber Test Area North Temperature Upper Pl_enum Microseconds Velocity Volt(s) Volume of system Density Average density Density of saturated vapor Density of saturated liquid Averaged over a specified cross-sectional are.a

DISTRIBUTION RECORD FOR TREE-NUREG.,-1 065 ' - ~ • ' • . j •
lnternal Distribution
1 - Chicago Patent Group - ERDA 9800 South Cas·s Avenue ·
2-4 -
5 -6 ...,
] -·
8 -
A.r96nne, ~ 1 1 i:noi s: ·6'04,39<
A. T. Mo~phew. Classifi-cation and Technical Information Officer Idaho Operations o·ffice - ERDA Idaho rall~. IQ 6J40l
R. J. Beers., ID
P. E. ~ i ttene,ker '· ID
R. E. Tille,r, ID
R. E. Wo.od, ID
~..., H. P~ Pearson, Supervi~or Technical· Information
10-19 .,._ INE.L Techni ca 1 Library
20:-154. ~- Au.thc;>.rs
155.,.274 - sp~¢1al rnt~rnal
External Oi~tribution
275. 276 - Saul Levine, Dir~ctor Office pf Nuclear Regulatqry Research, N,RC Wo~~ington, ·qc 2DPGD · · ·· ·· · · '·
277~~?1 - Special External
322-625 .,. Distribution under NRC-2, Water Reactor ~afety Research Sys terns Engineering ·· · · . · · · · ·
~ ,.
(