Exergetic Analysis of a Cryogenic Air Separation Unit - MDPI
21
Citation: Bucsa, S.; Serban, A.; Balan, M.C.; Ionita, C.; Nastase, G.; Dobre, C.; Dobrovicescu, A. Exergetic Analysis of a Cryogenic Air Separation Unit. Entropy 2022, 24, 272. https://doi.org/10.3390/ e24020272 Academic Editor: Jean-Noël Jaubert Received: 27 December 2021 Accepted: 9 February 2022 Published: 13 February 2022 Publisher’s Note: MDPI stays neutral with regard to jurisdictional claims in published maps and institutional affil- iations. Copyright: © 2022 by the authors. Licensee MDPI, Basel, Switzerland. This article is an open access article distributed under the terms and conditions of the Creative Commons Attribution (CC BY) license (https:// creativecommons.org/licenses/by/ 4.0/). entropy Article Exergetic Analysis of a Cryogenic Air Separation Unit Sorin Bucsa 1 , Alexandru Serban 1 , Mugur C. Balan 2 , Claudia Ionita 1 , Gabriel Nastase 1 , Catalina Dobre 1, * and Alexandru Dobrovicescu 1, * 1 Department of Engineering Thermodynamics, University Politehnica of Bucharest, 060042 Bucharest, Romania; [email protected] (S.B.); [email protected] (A.S.); [email protected] (C.I.); [email protected] (G.N.) 2 Department of Thermodynamics, Technical University of Cluj-Napoca, 400114 Cluj-Napoca, Romania; [email protected] * Correspondence: [email protected] (C.D.); [email protected] (A.D.) Abstract: This case study analyzes a cryogenic air separation unit (ASU) with a production of . V O 2 = 58, 300 h m 3 N h i of gaseous oxygen with a concentration greater than 98.5%, operating in Romania on a steel plant platform. The goal of the paper is to provide an extensive model of exergetic analysis that could be used in an optimization procedure when decisional parameters are changed or structural design modifications are implemented. For each key part of the Air Separation Unit, an exergetic product and fuel were defined and, based on their definition, the coefficient of performance of each functional zone was calculated. The information about the magnitude of the exergetic losses offers solutions for their future recovery. The analysis of the exergy destructions suggests when it is worth making a larger investment. The exergetic analysis of the compression area of the ASU points out an exergy destruction and loss of 37% from the total plant’s electrical energy input. The exergy loss with the heat transferred to the cooling system of compressors can be recovered; for the exergy destruction portion, the challenge between investment and operating costs should be considered. The exergy destruction of the air separation columns found the High Pressure Column (HPC) to be more destructive than the Low Pressure Column. The share of the exergy destruction in the total plant’s electrical energy input is 8.3% for the HPC. The local COP of the HPC, calculated depending on the total exergy of the local product and fuel, is 62.66%. The calculus of the air separation column is performed with the ChemSep simulator. Keywords: chemical exergy; rectification column; compression unit 1. Introduction On a large scale, the cost of separating oxygen and other air gases, such as nitrogen, argon, krypton, and neon, is far cheaper and the purity of the products is far higher when using the cryogenic distillation route. A growing application for oxygen today is for dealing with polluted rivers which have been deoxygenated. Nitrogen is the other main component of the air. Today, the overall demand for nitro- gen gas exceeds that for oxygen. Since nitrogen is inert and non-toxic, it has found many uses ranging from food preservation to the blanketing of chemical engineering and other industrial processes. In particular, the semiconductor industry uses large quantities; its de- mand for higher and still higher purity nitrogen arises from the increasing miniaturization and complexity of the integrated circuit chips being manufactured. These ultra-high levels of purity can be easily achieved by cryogenic distillation of air. Argon is, chemically, totally inert, even at high temperatures. The demand for argon, as a shield gas, in arc-welding and in the high technology metallurgical industry has grown even more than the demand for nitrogen. Entropy 2022, 24, 272. https://doi.org/10.3390/e24020272 https://www.mdpi.com/journal/entropy
-
Upload
khangminh22 -
Category
Documents
-
view
0 -
download
0
Transcript of Exergetic Analysis of a Cryogenic Air Separation Unit - MDPI

�����������������
Citation: Bucsa, S.; Serban, A.; Balan,
M.C.; Ionita, C.; Nastase, G.; Dobre,
C.; Dobrovicescu, A. Exergetic
Analysis of a Cryogenic Air
Separation Unit. Entropy 2022, 24, 272.
https://doi.org/10.3390/
e24020272
Academic Editor: Jean-Noël Jaubert
Received: 27 December 2021
Accepted: 9 February 2022
Published: 13 February 2022
Publisher’s Note: MDPI stays neutral
with regard to jurisdictional claims in
published maps and institutional affil-
iations.
Copyright: © 2022 by the authors.
Licensee MDPI, Basel, Switzerland.
This article is an open access article
distributed under the terms and
conditions of the Creative Commons
Attribution (CC BY) license (https://
creativecommons.org/licenses/by/
4.0/).
entropy
Article
Exergetic Analysis of a Cryogenic Air Separation UnitSorin Bucsa 1, Alexandru Serban 1, Mugur C. Balan 2 , Claudia Ionita 1, Gabriel Nastase 1 , Catalina Dobre 1,*and Alexandru Dobrovicescu 1,*
1 Department of Engineering Thermodynamics, University Politehnica of Bucharest, 060042 Bucharest,Romania; [email protected] (S.B.); [email protected] (A.S.); [email protected] (C.I.);[email protected] (G.N.)
2 Department of Thermodynamics, Technical University of Cluj-Napoca, 400114 Cluj-Napoca, Romania;[email protected]
* Correspondence: [email protected] (C.D.); [email protected] (A.D.)
Abstract: This case study analyzes a cryogenic air separation unit (ASU) with a production of.
VO2 = 58, 300[
m3 Nh
]of gaseous oxygen with a concentration greater than 98.5%, operating in
Romania on a steel plant platform. The goal of the paper is to provide an extensive model of exergeticanalysis that could be used in an optimization procedure when decisional parameters are changed orstructural design modifications are implemented. For each key part of the Air Separation Unit, anexergetic product and fuel were defined and, based on their definition, the coefficient of performanceof each functional zone was calculated. The information about the magnitude of the exergetic lossesoffers solutions for their future recovery. The analysis of the exergy destructions suggests when it isworth making a larger investment. The exergetic analysis of the compression area of the ASU pointsout an exergy destruction and loss of 37% from the total plant’s electrical energy input. The exergyloss with the heat transferred to the cooling system of compressors can be recovered; for the exergydestruction portion, the challenge between investment and operating costs should be considered.The exergy destruction of the air separation columns found the High Pressure Column (HPC) to bemore destructive than the Low Pressure Column. The share of the exergy destruction in the totalplant’s electrical energy input is 8.3% for the HPC. The local COP of the HPC, calculated dependingon the total exergy of the local product and fuel, is 62.66%. The calculus of the air separation columnis performed with the ChemSep simulator.
Keywords: chemical exergy; rectification column; compression unit
1. Introduction
On a large scale, the cost of separating oxygen and other air gases, such as nitrogen,argon, krypton, and neon, is far cheaper and the purity of the products is far higher whenusing the cryogenic distillation route.
A growing application for oxygen today is for dealing with polluted rivers which havebeen deoxygenated.
Nitrogen is the other main component of the air. Today, the overall demand for nitro-gen gas exceeds that for oxygen. Since nitrogen is inert and non-toxic, it has found manyuses ranging from food preservation to the blanketing of chemical engineering and otherindustrial processes. In particular, the semiconductor industry uses large quantities; its de-mand for higher and still higher purity nitrogen arises from the increasing miniaturizationand complexity of the integrated circuit chips being manufactured. These ultra-high levelsof purity can be easily achieved by cryogenic distillation of air.
Argon is, chemically, totally inert, even at high temperatures. The demand for argon,as a shield gas, in arc-welding and in the high technology metallurgical industry has growneven more than the demand for nitrogen.
Entropy 2022, 24, 272. https://doi.org/10.3390/e24020272 https://www.mdpi.com/journal/entropy

Entropy 2022, 24, 272 2 of 21
The products of the industrial gas industry have also become featured in biologicaland medical advances. Oxygen is well known for its life-supporting role in hospitals.
Cryogenic Air Separation Units (CASU) are large electrical energy consumers. In thegeneral concern of how to make such systems more efficient, the thermodynamic approachplays a crucial role when estimating the performance of any functional zone. A close-to-realistic assessment of the product and fuel of every operating area provides the chance toidentify opportunities for optimization.
An analysis based on the first and second principles of thermodynamics and theexergy concept provides the instrument for pointing out the location and magnitude ofmalfunctions associated with the operating processes.
The production of pure oxygen efficiently and at industrial scale is a topic of greatinterest.
Ebrahim et al. [1] recognizes that the most economical method of producing largequantities of oxygen and nitrogen is by cryogenic air separation. Authors focus theiranalysis on a two column ASU and use as an investigation instrument the exergetic analysiscombined with economics. The exergoeconomic analysis reveals that in order to provideprofit, such a system should have a larger production than 9 kg/s of O2.
Ghorbani et al. [2] conducted an exergetic and exergoeconomic analysis of a naturalgas separation installation, calculating the exergy destruction and loss in the key parts ofthe system. In terms of thermoeconomic costs, they found the compression area to be themost expensive.
Tesch et al. [3] integrated a natural gas liquefaction system with a cryogenic airseparation system. The analysis of the benefits of such a combined system is based onan advanced exergy study. The introduction of the natural gas liquefaction increases theoverall exergetic efficiency of the ASU alone by 10%.
Konoghe [4] undertook an exergetic analysis of a natural gas liquefaction unit operat-ing in cascades. The author developed relationships for calculating the exergy destructionin the key parts of the system. The exergetic analysis indicates a great potential for im-provements. The paper offers a correlation between the properties of the incoming andoutgoing natural gas streams that indicates the minimum work input for liquefaction.
The subject of integrating a liquefying natural gas with an ASU has also been analyzedby Chen et al. [5]. Based on the first and second laws of thermodynamics, a comparativeanalysis involving different types of rectification columns in the ASU was performed.The coupling of the ASU with the LNG system improved the overall performance of thecomposed system.
Acikkalp et al. [6] realized the case study of an ASU based on energy and exergyanalysis. Two indicators were used—the energetic improvement potential rate (EIP) andthe exergetic improvement potential rate (ExIP). The plant was found to reach an energeticefficiency of 45% and an exergetic efficiency of 13%.
Tesch, Morosuk and Tsatsaronis [7] performed an advanced exergy analysis of theregasification of the liquid natural gas as a part of a more complex ASU. Options for newdesigns were suggested by the results given by the exergetic analysis.
Rong at al. [8] analyzed an air separation unit in an attempt to recover as muchas possible from the exergy loss, with the heat transferred to the cooling system of thecompressor’s zone. A part of this potential will run an organic Rankine cycle. the rest beingused for the dehumidification area of the ASU.
Banaszkiewicz [9] suggested recovering the exergy expended for the liquefaction ofLNG, lost in the regasification process, for the separation of oxygen from the air in anadsorption system. The latent heat of vaporization of the LNG was used for cooling theadsorption bed and increasing, in this way, its adsorptive capacity.
The above review reveals the general understanding that only a method based on theexergetic analysis [10] offers major insights into the true operation of the system that willenable decisions for improvement.
Entropy 2022, 24, 272 3 of 21
The present work succeeds in deeply analyzing each technological process. The noveltyrepresents the splitting of total exergy into its thermo-mechanical and chemical compo-nents [11–13] that aids in analyzing the formation of the local product and fuel offerings.In addition, variants of estimating the performance of each operating area are reviewed.
Estimating the local COP as close to reality as possible represents the major opportunityin the search for an optimum operating regime or constructive solution [14].
The intention of this article is not to critically analyze and compare different tech-nologies of gas mixture separation. The main goal of the paper is to provide a logicaland explicit exergy analysis model that could be applied in any strategy of structural andfunctional optimization of a cryogenic air separation unit.
2. Installation Description. Functional Scheme
The case study analyzes a cryogenic air separation unit (ASU) with a production of.
VO2 = 58, 300[
m3 Nh
]of gaseous oxygen with a concentration greater than 98.5%, operating
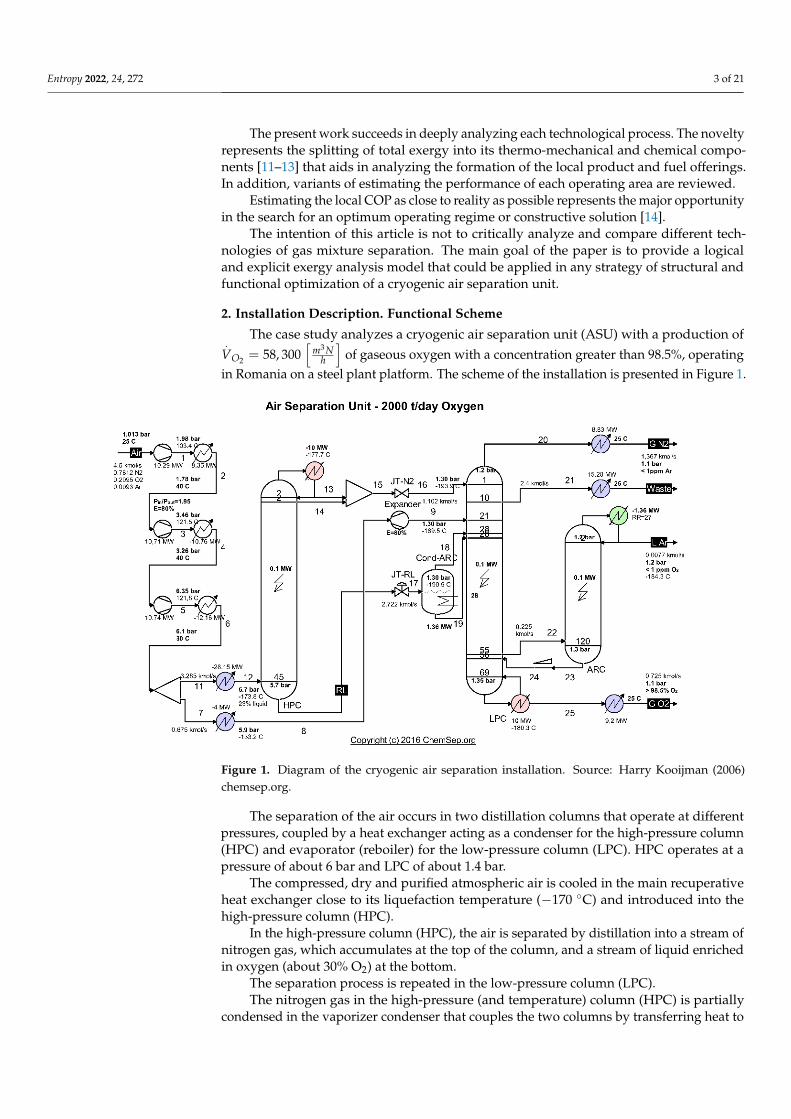
in Romania on a steel plant platform. The scheme of the installation is presented in Figure 1.
Entropy 2022, 24, 272 3 of 21
The present work succeeds in deeply analyzing each technological process. The novelty represents the splitting of total exergy into its thermo-mechanical and chemical components [11–13] that aids in analyzing the formation of the local product and fuel offerings. In addition, variants of estimating the performance of each operating area are reviewed.
Estimating the local COP as close to reality as possible represents the major opportunity in the search for an optimum operating regime or constructive solution [14].
The intention of this article is not to critically analyze and compare different technologies of gas mixture separation. The main goal of the paper is to provide a logical and explicit exergy analysis model that could be applied in any strategy of structural and functional optimization of a cryogenic air separation unit.
2. Installation Description. Functional Scheme The case study analyzes a cryogenic air separation unit (ASU) with a production of = 58300 of gaseous oxygen with a concentration greater than 98.5%, operating in
Romania on a steel plant platform. The scheme of the installation is presented in Figure 1.
Figure 1. Diagram of the cryogenic air separation installation. Source: Harry Kooijman (2006) chemsep.org
The separation of the air occurs in two distillation columns that operate at different pressures, coupled by a heat exchanger acting as a condenser for the high-pressure column (HPC) and evaporator (reboiler) for the low-pressure column (LPC). HPC operates at a pressure of about 6 bar and LPC of about 1.4 bar.
The compressed, dry and purified atmospheric air is cooled in the main recuperative heat exchanger close to its liquefaction temperature (−170 °C) and introduced into the high-pressure column (HPC).
In the high-pressure column (HPC), the air is separated by distillation into a stream of nitrogen gas, which accumulates at the top of the column, and a stream of liquid enriched in oxygen (about 30% O2) at the bottom.
The separation process is repeated in the low-pressure column (LPC). The nitrogen gas in the high-pressure (and temperature) column (HPC) is partially
condensed in the vaporizer condenser that couples the two columns by transferring heat
Figure 1. Diagram of the cryogenic air separation installation. Source: Harry Kooijman (2006)chemsep.org.
The separation of the air occurs in two distillation columns that operate at differentpressures, coupled by a heat exchanger acting as a condenser for the high-pressure column(HPC) and evaporator (reboiler) for the low-pressure column (LPC). HPC operates at apressure of about 6 bar and LPC of about 1.4 bar.
The compressed, dry and purified atmospheric air is cooled in the main recuperativeheat exchanger close to its liquefaction temperature (−170 ◦C) and introduced into thehigh-pressure column (HPC).
In the high-pressure column (HPC), the air is separated by distillation into a stream ofnitrogen gas, which accumulates at the top of the column, and a stream of liquid enrichedin oxygen (about 30% O2) at the bottom.
The separation process is repeated in the low-pressure column (LPC).The nitrogen gas in the high-pressure (and temperature) column (HPC) is partially
condensed in the vaporizer condenser that couples the two columns by transferring heat to

Entropy 2022, 24, 272 4 of 21
the liquid enriched in oxygen in the low-pressure column (LPC) which vaporizes at about−180 ◦C.
Part of the liquid nitrogen at the top of the high-pressure column ensures the refluxcurrent and the remaining N2 liquefy together with the nitrogen gas and are throttled in athrottling valve to the pressure of the low-pressure column, feeding in the LPC on the topat the liquid state.
From the HPC base, the liquid enriched in O2 is throttled and introduced in the middleof the low-pressure column where the distillation process is continued.
Distillation products (separate gases) are discharged from the low-pressure column.To supplement the cold capacity of the installation, a fraction of about 15% of the
compressed air is expanded into an expander before being introduced into the low-pressurecolumn.
The simulation of the operation of air separation columns was performed using theChemSep simulator [15].
The modeling of the operating of the ASU is based on the exergetic analysis.
3. Exergetic Analysis
Looking at the installation as a whole (Figure 1), products, exergetic fuel and globalsystem losses can be identified (Figure 2).
Entropy 2022, 24, 272 4 of 21
to the liquid enriched in oxygen in the low-pressure column (LPC) which vaporizes at about −180 °C.
Part of the liquid nitrogen at the top of the high-pressure column ensures the reflux current and the remaining N2 liquefy together with the nitrogen gas and are throttled in a throttling valve to the pressure of the low-pressure column, feeding in the LPC on the top at the liquid state.
From the HPC base, the liquid enriched in O2 is throttled and introduced in the middle of the low-pressure column where the distillation process is continued.
Distillation products (separate gases) are discharged from the low-pressure column. To supplement the cold capacity of the installation, a fraction of about 15% of the
compressed air is expanded into an expander before being introduced into the low-pressure column.
The simulation of the operation of air separation columns was performed using the ChemSep simulator [15].
The modeling of the operating of the ASU is based on the exergetic analysis.
3. Exergetic Analysis Looking at the installation as a whole (Figure 1), products, exergetic fuel and global
system losses can be identified (Figure 2).
Figure 2. Diagram of interactions with the external environment of the global system of the cryogenic air separation plant.
The exergetic performance coefficient of the whole system is: = = + + (1)
Since the compression zone is provided by a three-stage compression compressor: = + + (2)
The terms of the product of the installation are calculated as follows: = + (3)= ℎ , ) − ℎ , ) − , ) − , ) (4)
= ∙ ∙ ∙ (5)
Figure 2. Diagram of interactions with the external environment of the global system of the cryogenicair separation plant.
The exergetic performance coefficient of the whole system is:
COPex =PF=
.ExTOT
GN2+
.ExTOT
LAr +.ExTOT
GO2.Eel
(1)
Since the compression zone is provided by a three-stage compression compressor:
.Eel =
.W1 +
.W2 +
.W3 (2)
The terms of the product of the installation are calculated as follows:
.ExTOT
GN2=
.ExTM
GN2+
.ExCH
GN2(3)
.ExTM
GN2= nGN2
{hN2(T, p)− hN2(T0, p0)− T0
[sN2(T, p)− sN2(T0, p0)
]}(4)
.ExCH
GN2= nGN2 ·R·T0·ln
xN2
x0N2
(5)

Entropy 2022, 24, 272 5 of 21
The reference state is characterized by t0 = 25 ◦C, p0 = 1.013 bar and air compositionxN2 = 0.7812; xO2 = 0.2095; xAr = 0.0093.
.ExTOT
GO2=
.ExTM
GO2+
.ExCH
GO2(6)
.ExTM
GO2= nGO2
{hO2(T, p)− hO2(T0, p0)− T0
[sO2(T, p)− sO2(T0, p0)
]}(7)
.ExCH
GO2= nGO2 ·R·T0·ln
xO2
x0O2
(8)
.ExTOT
LAr =.ExTM
LAr +.ExCH
LAr (9).ExTM
LAr = nLAr
{hAr(T, p)− hAr(T0, p0)− T0[sAr(T, p)− sAr(T0, p0)]
}(10)
.ExCH
LAr = nLAr·R·T0·lnxAr
x0Ar
(11)
The values of the fuels and products of the global system are presented in theTables 1 and 2.
Table 1. Compressors input powers.
Compressor |.
W|[kW]
1 10,292
2 10,712
3 10,751
Global fuel of the installation F 31,755
Table 2. Values of the exergetic products.
Substance.ExTM[kW]
.ExCH[kW]
.ExTOT[kW]
GO2 377.4 2752 3129.4
GN2 279 835.8 1114.8
Lar 151.5 89.53 241
Global installation product P 4485.2
The value of the exergetic performance coefficient (Equation (1)) is COPex = 0.14.The exergetic balance equation of the global installation is:
F = P + L + I (12)
in which L represents losses of exergy thrown into the external environment and I destruc-tion (consumption) of exergy caused by internal irreversibilities.
From the exergetic balance Equation (12) it follows that
COPex =PF= 1 − L + I
F(13)
It further follows that the efficiency of the installation can be achieved by reducinglosses and destruction of exergy from fuel consumption.
It is noted that
ψj =(L + I)j
F(14)
as the share in fuel consumption of the loss and destruction of exergy in a functional area.

Entropy 2022, 24, 272 6 of 21
The total exergy current of the gaseous nitrogen discharged in the form of WASTE(Figures 1 and 2), together with the exergies of the heat flows discharged to the outsidethrough the cooling system of the compressors, represents losses for the global system,losses which we will try to recover during the optimization procedure.
The share of this total loss in the total fuel consumption of the global installation is:
ψL =
.ExTOT
Waste +∣∣∣ .ExQ1
∣∣∣+ ∣∣∣ .ExQ2
∣∣∣+ ∣∣∣ .ExQ3
∣∣∣∣∣∣ .W1
∣∣∣+ ∣∣∣ .W2
∣∣∣+ ∣∣∣ .W3
∣∣∣ ·100 (15)
To identify the place where losses and destructions take place, the installation isdivided into functional areas (Figure 3).
Entropy 2022, 24, 272 6 of 21
through the cooling system of the compressors, represents losses for the global system, losses which we will try to recover during the optimization procedure.
The share of this total loss in the total fuel consumption of the global installation is: = + + ++ + ∙ 100 (15)
To identify the place where losses and destructions take place, the installation is divided into functional areas (Figure 3).
Figure 3. Scheme of the cryogenic air separation installation—functional areas. Source: Harry Kooijman (2006) chemsep.org.
3.1. Compression Area The compression zone as part of the cryogenic air separation installation is shown in
Figure 4.
Figure 3. Scheme of the cryogenic air separation installation—functional areas. Source: HarryKooijman (2006) chemsep.org.
3.1. Compression Area
The compression zone as part of the cryogenic air separation installation is shown inFigure 4.
The exergetic balance equation of the compression zone is:
∑.Exi = ∑
.Exe +
..I (16)
In the energy balance Equation (16), both the input and output energies are in absolutevalue.
.ExAIR +
∣∣∣ .W1
∣∣∣+ ∣∣∣ .W2
∣∣∣+ ∣∣∣ .W3
∣∣∣ = .Ex11 +
.Ex7 +
∣∣∣ .ExQ1
∣∣∣+ ∣∣∣ .ExQ2
∣∣∣+ ∣∣∣ .ExQ3
∣∣∣+ .I (17)
Equation (17) written with an economic connotation becomes:
Fcp = Pcp + (L + I)cp (18)
The scheme of the interactions of the compression zone with the outside is presentedin Figure 5.

Entropy 2022, 24, 272 7 of 21Entropy 2022, 24, 272 7 of 21
Figure 4. Compression zone of the air separation installation.
The exergetic balance equation of the compression zone is: = + (16)
In the energy balance Equation (16), both the input and output energies are in absolute value. + + + = + + + + + (17)
Equation (17) written with an economic connotation becomes: = + + ) (18)
The scheme of the interactions of the compression zone with the outside is presented in Figure 5.
Figure 4. Compression zone of the air separation installation.Entropy 2022, 24, 272 8 of 21
Figure 5. Scheme of interactions with the external environment of the compression zone of the cryogenic air separation installation.
Where F is the fuel of the area equal to the fuel of the overall system = = + + (19)
and P is the product of the area and represents its net exergy increase. = + − (20)= + + (21)
has the significance of the loss of energy, with the heat evacuated to the outside in the intermediate coolers and the final cooler of the compression zone.
İ is the destruction of exergy in the compression process. Equation (18) becomes: + + = + − + + + + (22)
Exergetic quantities are calculated as follows: = ℎ , ) − ℎ , ) − [ , ) − , )] (23)= ℎ , ) − ℎ , ) − [ , ) − , )] (24)= ℎ , ) − ℎ , ) − [ , ) − , )] (25)+ = ℎ , ) − ℎ , ) − [ , ) − , )] (26)+ = ℎ , ) − ℎ , ) − [ , ) − , )] (27)+ = ℎ , ) − ℎ , ) − [ , ) − , )] (28)
The exergy destruction inside each compression stage due to the irreversibility of friction is calculated based on the Gouy-Stodola theorem [16] that accounts for the entropy generation that accompanies any irreversible process. = + + (29)
Figure 5. Scheme of interactions with the external environment of the compression zone of thecryogenic air separation installation.

Entropy 2022, 24, 272 8 of 21
Where F is the fuel of the area equal to the fuel of the overall system
Fcp = F =∣∣∣ .W1
∣∣∣+ ∣∣∣ .W2
∣∣∣+ ∣∣∣ .W3
∣∣∣ (19)
and P is the product of the area and represents its net exergy increase.
Pcp =.Ex11 +
.Ex7 −
.ExAIR (20)
Lcp =∣∣∣ .ExQ1
∣∣∣+ ∣∣∣ .ExQ2
∣∣∣+ ∣∣∣ .ExQ3
∣∣∣ (21)
has the significance of the loss of energy, with the heat evacuated to the outside in theintermediate coolers and the final cooler of the compression zone.
I is the destruction of exergy in the compression process.Equation (18) becomes:∣∣∣ .W1
∣∣∣+ ∣∣∣ .W2
∣∣∣+ ∣∣∣ .W3
∣∣∣ = ( .Ex11 +
.Ex7 −
.ExAIR
)+∣∣∣ .ExQ1
∣∣∣+ ∣∣∣ .ExQ2
∣∣∣+ ∣∣∣ .ExQ3
∣∣∣+ ..I (22)
Exergetic quantities are calculated as follows:
.Ex11 = n11
{h11(T11, p11)− h11(T0, p0)− T0[s11(T11, p11)− s11(T0, p0)]
}(23)
.Ex7 = n7
{h7(T7, p7)− h7(T0, p0)− T0[s7(T7, p7)− s7(T0, p0)]
}(24)
.ExAIR = nAIr
{hAIR(TAIR, pAIR)− hAIR(T0, p0)− T0[sAIR(TAIR, pAIR)− sAIR(T0, p0)]
}(25)∣∣∣ .
ExQ1
∣∣∣+ .Icp1 = nAIR
{h1(T1, p1)− h2(T2, p2)− T0[s1(T1, p1)− s2(T2, p2)]
}(26)∣∣∣ .
ExQ2
∣∣∣+ .Icp2 = nAIR
{h3(T3, p3)− h4(T4, p4)− T0[s1(T3, p3)− s4(T4, p4)]
}(27)∣∣∣ .
ExQ3
∣∣∣+ .Icp3 = nAIR
{h5(T5, p5)− h6(T6, p6)− T0[s5(T5, p5)− s6(T6, p6)]
}(28)
The exergy destruction inside each compression stage due to the irreversibility offriction is calculated based on the Gouy-Stodola theorem [16] that accounts for the entropygeneration that accompanies any irreversible process.
.Icp =
.Icp1 +
.Icp2 +
.Icp3 (29)
.Icp1 = nAIR·T0(s1 − s0) (30).Icp2 = nAIR·T0(s3 − s2) (31).Icp3 = nAIR·T0(s6 − s5) (32)
The share of exergy losses and damage in the total fuel consumption of the installationis:
ψcp =(L + I)cp∣∣∣ .
W∣∣∣1+∣∣∣ .W∣∣∣2+∣∣∣ .W∣∣∣3
(33)
3.2. High Pressure Distillation Column (HPC)
The area of the HPC distillation column, separated from the rest of the plant, is shownin Figure 6.

Entropy 2022, 24, 272 9 of 21
Entropy 2022, 24, 272 9 of 21
= ∙ − ) (30)= ∙ − ) (31)= ∙ − ) (32)
The share of exergy losses and damage in the total fuel consumption of the installation is: = + )+ + (33)
3.2. High Pressure Distillation Column (HPC) The area of the HPC distillation column, separated from the rest of the plant, is shown
in Figure 6.
Figure 6. The area of the high-pressure distillation column of the air separation plant.
To specify the membership in the fuel (F) or product (P) of the heat discharged from the condenser of the high pressure and temperature column and transferred to the reboiler (evaporator) of the low-pressure column, write the exergetic balance equation of the HPC in its general algebraic form (in which each term contains its sign) (Figure 7).
Figure 6. The area of the high-pressure distillation column of the air separation plant.
To specify the membership in the fuel (F) or product (P) of the heat discharged fromthe condenser of the high pressure and temperature column and transferred to the reboiler(evaporator) of the low-pressure column, write the exergetic balance equation of the HPCin its general algebraic form (in which each term contains its sign) (Figure 7).
∑.ExQ = ∑
.Exe − ∑
.Exi + ∑
.W +
.I (34)
Entropy 2022, 24, 272 10 of 21
Figure 7. Scheme of interactions with the external environment of the high-pressure distillation column (HPC) area.
= − + + (34)
The effect of heat penetration from the environment is neglected in a first phase and it is considered that the heat exchange with the outside in the HPC is performed only in the condenser. Equation (34) becomes: = + + − − + (35)
The exergy of the condensing heat is: = 1 − (36)
It is observed that: The HPC column yields heat < 0, = − The scheme of the interactions of the HPC area with its exterior can be found in
Figure 7. Heat is released at a temperature level < , 1 − < 0 In the end, = − 1 − = − 1 = (37)
Substituting in the exergetic balance equation of the high-pressure column (35) and rearranging the terms results in: + + = + + + (38)
We can consider that the product (purpose) of the distillation column is to change the chemical composition of the inlet streams. The product is therefore the increase in the chemical exergy of the input currents.
To highlight the chemical component of the exergy, the exergy of the substance currents is split into the thermo-mechanical (physical) and the chemical component.
The exergetic balance Equation (38) becomes: + + + + = + + + + + + (39)
Figure 7. Scheme of interactions with the external environment of the high-pressure distillationcolumn (HPC) area.

Entropy 2022, 24, 272 10 of 21
The effect of heat penetration from the environment is neglected in a first phase and itis considered that the heat exchange with the outside in the HPC is performed only in thecondenser. Equation (34) becomes:
.Excd
Q =.Ex16 +
.Ex9 +
.Ex17 −
.Ex12 −
.Ex8 +
.I (35)
The exergy of the condensing heat is:
.Excd
Q =
..
Q(
1 − T0
T
)(36)
It is observed that:The HPC column yields heat
.Q < 0,
.Q = −
∣∣∣ .Q∣∣∣.
The scheme of the interactions of the HPC area with its exterior can be found inFigure 7.
Heat is released at a temperature level T < T0,(
1 − T0T
)< 0
In the end,
.Excd
Q = −∣∣∣ .Q∣∣∣(1 − T0
T
)=∣∣∣ .Q∣∣∣(T0
T− 1)=∣∣∣ .Excd
Q
∣∣∣ (37)
Substituting in the exergetic balance equation of the high-pressure column (35) andrearranging the terms results in:∣∣∣ .
ExcdQ
∣∣∣+ .Ex12 +
.Ex8 =
.Ex16 +
.Ex9 +
.Ex17 +
.I (38)
We can consider that the product (purpose) of the distillation column is to changethe chemical composition of the inlet streams. The product is therefore the increase in thechemical exergy of the input currents.
To highlight the chemical component of the exergy, the exergy of the substance currentsis split into the thermo-mechanical (physical) and the chemical component.
The exergetic balance Equation (38) becomes:∣∣∣ .Ex∣∣∣cd
Q+
.ExTM
12 +.ExCH
12 +.ExTM
8 +.ExCH
8 =.ExTM
16 +.ExCH
16 +.ExTM
9 +.ExCH
9 +.ExTM
17 +.ExCH
17 +.I (39)
The product is to increase the chemical exergy on the inlet-outlet path of the distillationcolumn.
PCHHPC =
.ExCH
16 +.ExCH
9 +.ExCH
17 −.ExCH
12 −.ExCH
8 (40)
Currents 8 and 9 are not processed in the distillation column, so that.ExCH
9 =.ExCH
8 .Conseqently:
PCHHPC =
.ExCH
16 +.ExCH
17 −.ExCH
12 (41)
FCHHPC =
∣∣∣ .Ex∣∣∣cd
Q+
.ExTM
12 +.ExTM
8 −.ExTM
16 −.ExTM
9 −.ExTM
17 (42)
COPHPCex_CH =
PCHHPC
FCHHPC
=
.ExCH
16 +.ExCH
17 −.ExCH
12∣∣∣ .Ex∣∣∣cd
Q+
.ExTM
12 +.ExTM
8 −.ExTM
16 −.ExTM
9 −.ExTM
17
(43)
Exergy destruction in HPC is:
.IHPC = FCH
HPC − PCHHPC (44)

Entropy 2022, 24, 272 11 of 21
Exergy destruction can also be calculated based on the Gouy–Stodola theorem:
.IHPC = T0·
.S
HPCgen (45)
in which
.S
HPCgen = ∑
.Se − ∑
.Si −
.QcdTcd
=.n16·s16 +
.n9·s9 +
.n17·s17 −
.n12·s12 −
.n8·s8 +
∣∣∣ .Qcd
∣∣∣Tcd
(46)
The values of the state quantities at the characteristic points are extracted from theresults of the ChemSep simulation.
The share of exergy destruction in HPC in the total fuel consumption of the installationis:
ψHPC =
.IHPC∣∣∣ .
W1
∣∣∣+ ∣∣∣ .W2
∣∣∣+ ∣∣∣ .W2
∣∣∣ (47)
3.3. Low Pressure Distillation Column (LPC)
The area of the low-pressure distillation column, separated from the rest of the instal-lation, is shown in Figure 8.
Entropy 2022, 24, 272 12 of 21
Figure 8. Area of the low-pressure distillation column of the air separation plant.
The scheme of the interactions of the LPC area with its exterior can be found in Figure 9.
Figure 9. Scheme of interactions with the external environment of the area of the low-pressure distillation column (LPC).
Figure 8. Area of the low-pressure distillation column of the air separation plant.
The scheme of the interactions of the LPC area with its exterior can be found inFigure 9.

Entropy 2022, 24, 272 12 of 21
Entropy 2022, 24, 272 12 of 21
Figure 8. Area of the low-pressure distillation column of the air separation plant.
The scheme of the interactions of the LPC area with its exterior can be found in Figure 9.
Figure 9. Scheme of interactions with the external environment of the area of the low-pressure distillation column (LPC).
Figure 9. Scheme of interactions with the external environment of the area of the low-pressuredistillation column (LPC).
To determine the senses of the heat exergy exchanges in the reboiler and the interme-diate bottle (flash tank), write the general exergetic balance equation in algebraic form (34).
.Exib
Q +.Exrb
Q =.Ex20 +
.Ex21 +
.Ex22 +
.Ex25 −
.Ex16 −
.Ex9 −
.Ex17 −
.Ex24 +
.I (48)
The heat exergy in the intermediate bottle is:
.Exib
Q =.
Qib
(1 − T0
Tib
)(49)
It is observed that:
(a) The LPC column receives the heat.
Qib > 0
(b) Heat is received at a temperature level Tib < T0,(
1 − T0Tib
)< 0.
In the end,.Exib
Q < 0,.Exib
Q = −∣∣∣ .Exib
Q
∣∣∣ (50)
The heat exergy received in the reboiler is calculated as follows:
.Exrb
Q =.
Qrb
(1 − T0
Trb
)(51)
It is observed that:
(a) The LPC column receives the heat.
Qrb > 0
(b) Heat is received at a temperature level Trb < T0,(
1 − T0Trb
)< 0.
In the end,.Exrb
Q < 0,.Exrb
Q = −∣∣∣ .Exrb
Q
∣∣∣ (52)
Replacing and rearranging the terms in Equation (48), we obtain:
.Ex16 +
.Ex9 +
.Ex17 +
.Ex24 =
.Ex20 +
.Ex21 +
.Ex22 +
.Ex25 +
∣∣∣ .Ex∣∣∣ibQ+∣∣∣ .Ex∣∣∣rb
Q+
..I (53)

Entropy 2022, 24, 272 13 of 21
The product of the low-pressure column can be considered as the increase in thechemical exergy of the streams of substance passing through the distillation column and theexergies of the heat offered in the reboiler and the intermediary bottle (flash tank). Theseheat exchangers are used to extract heat from the high-pressure column (HPC) condensersand the argon column.
Splitting the exergies of the substance currents into the thermo-mechanical and chemi-cal components results in:
.ExTM
16 +.ExCH
16 +.ExTM
9 +.ExCH
9 +.ExTM
17 +.ExCH
17 +.ExTM
24 +.ExCH
24
=.ExTM
20 +.ExCH
20 +.ExTM
21 +.ExCH
21 +.ExTM
22 +.ExCH
22 +.ExTM
25 +.ExCH
25 +∣∣∣ .Ex∣∣∣ibQ+∣∣∣ .Ex∣∣∣rb
Q(54)
The product of the low-pressure column, defined as the increase in chemical exergiesof the substances passing through the contour of the low-pressure column, is:
PCHLPC =
.ExCH
20 +.ExCH
21 +.ExCH
22 +.ExCH
25 −.ExCH
16 −.ExCH
9 −.ExCH
17 −.ExCH
24 +∣∣∣ .Ex∣∣∣ibQ+∣∣∣ .Ex∣∣∣rb
Q(55)
Low pressure column fuel when the product is characterized only by upgrading ofchemical exergies is defined by decreasing the thermo-mechanical exergies of the processedcurrents:
FCHLPC =
.ExTM
16 +.ExTM
9 +.ExTM
17 +.ExTM
24 −.ExTM
20 −.ExTM
21 −.ExTM
22 −.ExTM
25 (56)
Exergy destruction in LPC is:
.ILPC = FCH
LPC − PCHLPC (57)
It is observed that the value of the exergy destruction deriving from the balanceEquation (48) is unique regardless of the way in which the fuel and the product of thecolumn are interpreted.
The different methods of interpreting the product—(a) as the increase in the chemicalpart of the inlet streams exergies or (b) as the increase in the total exergies—represents thepoint of view of the researcher in the desire to approach reality.
Estimating the performance as close to reality as possible allows opportunities for theimprovement of the system.
The coefficient of exergetic performance of the low-pressure column, depending onthe different ways of estimating the fuel and product, is:
COPCHLPC =
PCHLPC
FCHLPC
= 1 −.ILPC
FCHLPC
(58)
or
COPTOTLPC =
PTOTLPC
FTOTLPC
= 1 −.ILPC
FTOTLPC
(59)
The destruction of exergy in the low-pressure column can also be calculated with theGouy-Stodola theorem.
.ILPC = T0·
.S
LPCgen (60)
.S
LPCgen = ∑
.Se − ∑
.Si − ∑
.QT
(61)
.S
LPCgen =
.n20·
−s 20 +
.n21·
−s 21 +
.n22·
−s 22 +
.n25·
−s 25 −
.n16·
−s 16 −
.n9·
−s 9 −
.n17·
−s 17 −
.n24·
−s 24−
.QrbTrb
−.
QbiTib
−.
QizTLPC
(62)

Entropy 2022, 24, 272 14 of 21
3.4. Results
The modeling of the operation of the air separation system called upon the ChemSepsimulator for the calculation of the separation columns.
The simulation with ChemSep provides, for each main state, the values of flow rates,pressure, temperature, concentration of components O2, N2 and Ar, values of entropies andmolar enthalpies and the phase in which the substance is.
For the other parts of the air separation system that are not involved in a change in thechemical composition of the stream of substances, the calculus is performed based on theEEs program.
3.4.1. Compression Area
The increase in air pressure is achieved in a three-stage compression system withintermediate cooling between stages and final cooling.
To evaluate the performance of the area, attention was focused on exergy losses, withthe heat discharged to the outside in the compression system coolers, and on the destructionof exergy due to the irreversibility of compression processes.
The product of the area is the net increase in the total exergy of the air between theinlet and the outlet, and the fuel (resource used) is represented by the electric energy fordriving the compressors.
It should be noted that in the conditions of neglecting the consumption of electricityto drive the pumps, the resource used in the compression zone is also the fuel of the globalcryogenic air separation installation.
The part of the technological scheme that represents the compression zone is shown inFigure 4.
The values of the total exergies of the inlet and outlet currents in the area as well as ofthe electrical energies (mechanical compression work) and the exergies of the dischargedheat in the cooling system are presented in Table 3.
Table 3. The values of the total exergies of the air currents, of the driving power of the compressorsand of the exergies of the heat evacuated by the cooling system.
Exergy Current Exergy [MW]
AIR 0∣∣∣ .W1
∣∣∣ 10.29∣∣∣ .W2
∣∣∣ 10.71∣∣∣ .W3
∣∣∣ 10.75∣∣∣ .ExQ1
∣∣∣+ .I∆p1
−2.3∣∣∣ .ExQ2
∣∣∣+ .I∆p2
−2.32∣∣∣ .ExQ3
∣∣∣+ .I∆p3
−2.161.ExTOT
6 −20.015.Icp = ∑
.Exi − ∑
.Exe 4.954
The exergy values of the input currents and the absolute values of the mechanicalworks received the plus sign (+) and the values of the exergies of the output currents andthe absolute values of the heats transferred to the cooling water were assigned the minussign (−). In this way, by summing them up, the value of the exergy destruction due to theirreversibility of the compression process was obtained.
If the exergy destructions in each compressor are of interest, they can be calculatedwith the Gouy–Stodola relation (Equations (29)–(31)). The results are shown in Table 4.

Entropy 2022, 24, 272 15 of 21
Table 4. Exergy destruction in the compression stages.
Compression Stage Destruction of Exergy.Icp[MW]
1 1.659
2 1.647
3 1.652
Total.Icp 4.958
The losses with the exergies of the heat evacuated through the cooling system in theenvironment are presented for each cooler in Table 5.
Table 5. Losses with heat exergies evacuated in the coolers of the compression stages.
Cooler Exergy Heat Loss |.ExQ|+
.I∆p [MW]
1 2.3
2 2.32
3 2.161
Total LQ 6.781
The sum of exergy losses and destruction in the compression zone gives:
.IZ,cp =
.Icp + LQ = 4.958 + 6.781 = 11.739 MW
The share of exergy losses and destruction in the compression zone in the fuel con-sumption of the global installation is:
ψcp =
.IZ,cp∣∣∣ .
W1
∣∣∣+ ∣∣∣ .W2
∣∣∣+ ∣∣∣ .W3
∣∣∣ = 11.73931.75
= 0.37
It follows that 37% of the power input of the cryogenic air separation plant is lost ordestroyed in the compression zone.
3.4.2. High Pressure Distillation Column
Figure 6 shows the part of the technological scheme of the air separation plant occupiedby the high-pressure distillation column (HPC).
The contour of the area also includes the throttling valves and the expander.The exergetic balance Equation (34) is unique, but the rearrangement of terms from one
member of the equation to another is at the discretion of the researcher in his interpretationof the actual product and fuel of the area.
At first glance, the essential role of the column is to separate the components of themixture, which is related to the increase in the chemical exergy of the output currentscompared to those entering the column.
This approach requires the splitting of any total exergy into its thermo-mechanicaland chemical parts (
.ExTOT =
.ExTM +
.ExCH). A mathematical model solved with EES was
used in this purpose.The computation results are given in Table 6.The definition of the product of the HPC zone, considering the increase in the chemical
component of the currents from inlet to outlet and of the corresponding fuel, according toEquations (41) and (42), and the specification of the corresponding exergetic coefficient ofperformance Equation (43), leads to the results presented in Table 7.

Entropy 2022, 24, 272 16 of 21
Table 6. Values of thermo-mechanical and chemical exergies of the flows entering and leaving thecontrol volume of the HPC (Figures 6 and 7).
The Current.ExTM[MW]
.ExCH[MW]
12 31.409 0
8 5.366 0∣∣∣ .Excd
Q
∣∣∣ 31.622
16 23.132 0.674
9 3.690 0
7 15.222 0.142
Table 7. Values of the product, fuel and exergetic coefficient of performance of the HPC consideringthat its purpose is to increase the chemical component of the currents by separation.
PCHHPC[MW] FCH
HPC[MW] COPCHex_HPC%
0.816 26.353 3
From the results registered in Table 7, it is observed that after the interpretation thatthe product of the column is only the increase in the chemical exergy, HPC appears as atechnological area with an extremely low exergetic performance, which would lead us toconsider another technical solution.
Nevertheless, what really matters is how to manage resources within the area toachieve the desired separation process, or the destruction of exergy within the area doesnot depend on the interpretation of the product and the zonal fuel (Equation (38)).
If the product and fuel are defined considering the total exergies which, in addition tothe chemical part, also consider the pressure and temperature of each stream of substance,elements which count in the devices following the high-pressure column (HPC) in thetechnological flow and for which the product of this column PHPC becomes fuel, the resultsgiven in Table 8 are obtained.
Table 8. Values for product, fuel and coefficient of performance when it is considered that the purposeof HPC is to increase the total exergy by separating the streams of substance.
PTOTHPC[MW] FTOT
HPC[MW] COPTOTex_HPC%
42.86 68.397 62.66
To calculate the exergy destruction in the HPC, the Gouy–Stodola theorem was usedin which the entropy values calculated with ChemSep were used (Equation (45)).
The values of the quantities given by Equation (45) are registered in Table 9.
Table 9. Entropy values and molar flow rates of the substances at the boundary separating the HPCfrom the outside.
Condition ¯s [ kJ
kmol K ] [.n] kmol
s.S[ kW
K ]
8 −41.919 0.675 −28.3
9 −39.4896 0.675 −26.66
12 −55.4484 3.825 −212.1
16 −96.496 1.102 −106.4
17 −93.125 2.723 −253.6

Entropy 2022, 24, 272 17 of 21
Entropy transferred from or to the outside associated with heat penetration due toincomplete insulation and heat transferred to the condenser is shown in Table 10.
Table 10. Entropy flux values transferred between HPC and outside.
Device Transferred Entropy.
QT [ kW
K ]
Condenser −156.1
Heat penetration from the outside 1.048
Entropy generated in the high-pressure column (Equation (46)) and the destruction ofassociated exergy (Equation (45)) are:
.S
HPCgen = 8.861 kW
.IHPC = 2640 kW
That leads to a share of exergy destruction in the overall consumption of the installation(Equation (47)) of ψHPC = 8.3%
3.4.3. Low Pressure Distillation Column
Figure 8 shows the part of the technological scheme of the installation occupied by thelow-pressure separation column (LPC).
The calculation of the exergy destruction from the LPC was made based on the Gouy–Stodola theorem and the calculation of the column entropy generation (Equation (60)).
The entropy values of the streams of substance in the input and output states of theseparation column are calculated with the ChemSep simulator and presented in Table 11.
Table 11. Entropy and molar flow rates values at the boundary separating the LPC from the outside.
Condition ¯s [ kJ
kmol K ] [.n] kmol
s.S[ kW
K ]
9 −39.4896 0.765 −26.66
16 −96.496 1.102 −106.4
17 −93.125 2.723 −253.6
20 −40.08 1.367 −55.78
21 −36.82 2.4 −88.37
22 −32.247 0.225 −7.256
24 −105.262 0.2173 22.87
25 −107.998 0.7251 −78.31.
QrbTrb
−160.7.
QbiTbi
−16.59.
QizTLPC
−1.079.Sgen 2.464 [kW]
Multiply the value of the total entropy.
S[
kWK
]by (+1) for the output currents and (−1)
for the input currents so that the sum results in the entropy flow generated.Due to the entropy flows transferred from the outside to the reboiler, the intermediate
bottle, and due to the penetration of heat through the incomplete insulation,.
QrbTrb
,.
QibTib
,.
QizTLPC
will be multiplied by (−1), thus decreasing Equation (62) from the entropy variation in

Entropy 2022, 24, 272 18 of 21
the system, so that by omitting the entropy transfer, only the entropy generated, as anexpression of the exergy destruction, remains.
The destruction of exergy in LPC becomes Equation (60):
.ILPC = 734.27 kW
The share of LPC exergy destruction in the overall electricity consumption of theinstallation is:
ψLPC =
.ILPC∣∣∣ .
W1
∣∣∣+ ∣∣∣ .W2
∣∣∣+ ∣∣∣ .W3
∣∣∣100 =734.2731750
100 = 2.3%
4. Discussion
The energetic analysis accounts only for the losses of energy thrown out into theenvironment of the system. The energetic analysis does not account for the quality of thelost energy.
Only the exergetic analysis that couples the first and second principles of thermody-namics reveals not only losses but also destructions (consumption) of useful energy, therebymaking the correlation between the intensive parameters of the system and those of theenvironment.
In cryogenic systems analysis, the use of exergetic analysis is almost compulsory,because the lowest is the operating temperature and the highest is the entropy generationdue to an irreversibility.
The splitting of the total exergy of each current of substance into its physical andchemical components makes it possible to define, in different ways, the product and thefuel of every functional zone and, finally, the local COP. In this way, more alternatives ofdiscussion are found, enriching the knowledge about the operation of the system.
The analysis found that the most inefficient part of the ASU is the compression area.The loss and the destruction of the compression area in relation to the fuel of the entire
plant is 37%.The second destructive area is represented by the separation columns [17,18]. The
local coefficient of performance of the HPC is 62.66%. The exergy destruction in the localfuel of the HPC is 37.34%, but when calculated as a share of the total input of the entireplant, is only 8.3%.
The results are comparable to other studies [19–25]. All studies performed on airseparation units with cryogenic distillation columns report that about one third of theglobal system’s power input is consumed in the compression stage. As in the present work,Cornelissen and Hirs [21] and Spali et al. [25] reported much less exergy destruction in thedistillation column compared to the compression unit.
In the present work, the model of exergy analysis refers to specific boundaries ofthe compression unit (Figure 4) and of the high-pressure (Figure 6) and low-pressure(Figure 8) distillation columns; the throttling valves and the condenser-reboiler connectingthe two distillation columns is not included. This last heat exchanger introduces significantdestruction due to heat transfer at a finite difference of temperature
5. Conclusions
This paper presents a model of a detalied exergetic analysis of some key parts of acryogenic air separation unit, a model that could be integrated into a functional or designoptimization procedure.
The exergetic method is particularly productive in low temperature operating systemswhere any irreversibility due to the low temperature level leads to a large generation ofentropy and, consequently, a large exergy consumption (destruction).

Entropy 2022, 24, 272 19 of 21
Exergy analysis reveals the real measure of losses and exergy destruction, enablingthe discovery of methods for waste energy recovery or better investments for lowering theinputs.
The exergy analysis discusses the different ways in which the coefficient of perfor-mance of a key part of the system could be viewed in the aim of getting close to reality.
The paper points out that, for the analyzed installation, the compression unit is byfar the most destructive part, suggesting in this way the use of better compressors and therecovery of the heat transferred to the compressors’ cooling system.
Further analysis should be developed on the recuperative internal heat exchanger thatplays, at its turn, a leading part in the economy of the system.
Author Contributions: Conceptualization, S.B., A.S. and A.D.; methodology, A.S. and A.D.; software,S.B., M.C.B. and C.I.; validation, S.B., C.D. and A.D.; formal analysis, M.C.B. and C.I.; investigation,S.B. and C.D.; resources, G.N.; data curation, G.N.; writing—original draft preparation, S.B., G.N.and A.D.; writing—review and editing, S.B. and A.S.; visualization, G.N. and C.I.; supervision,A.D.; project administration, A.S.; funding acquisition, C.D. All authors have read and agreed to thepublished version of the manuscript.
Funding: This research was funded by the Romanian Ministry of Education and University Po-litehnica of Bucharest through the PubArt programme.
Institutional Review Board Statement: Not applicable.
Informed Consent Statement: Not applicable.
Data Availability Statement: Not applicable.
Conflicts of Interest: The authors declare no conflict of interest.
Nomenclature
ASU air separation unitCp compressor.Eel current of electrical energy (exergy), kW.Ex current of exergy, kWF exergetic fuel, kWGN2 current of gaseous Nitrogen, kmol/sGO2 current of gaseous oxygen, kmol/sHPC high-pressure column of distillationLPC low-pressure column of distillationLAr current of liquid Argon, kmol/s.
Q current of heat, kWP exergetic product, kW
.W mechanical power, kW.ExTM current of thermo-mechanical exergy, kW.ExCH current of chemical exergy, kWh molar enthalpy, kJ/kmol.I current of exergy destruction due to internal irreversibility, kWL current of exergy loss, kWn current of substance, kmol/sp pressure, PaR universal constant of gases, J/kmol/Ks molar entropy, kJ/kmolT temperature, Kx molar composition

Entropy 2022, 24, 272 20 of 21
Subscripts0 environment, in equilibrium with the environmentCd condensercp compressore exitex exergeticHPC high-pressure columni inletiz insulationL lossLPC low-pressure columnrb reboilerQ heatSuperscriptCd condenserTOT totalCH chemicalib intermediary bottlerb reboilerTM thermo-mechanicalGreek SymbolΨ share of an exergetic loss or destruction in the fuel consumption
References1. Ebrahimi, A.; Meratizaman, M.; Reyhani, H.A.; Pourali, O.; Amidpour, M. Energetic, exergetic and economic assessment of
oxygen production from two columns cryogenic air separation unit. Energy 2015, 90, 1298–1316. [CrossRef]2. Ghorbani, B.; Salehi, G.R.; Amidpour, M.; Hamedi, M.H. Exergy and exergoeconomic evaluation of gas separation process. J. Nat.
Gas Sci. Eng. 2012, 9, 86–93. [CrossRef]3. Tesch, S.; Morosuk, T.; Tsatsaronis, G. Exergy analysis of a novel cryogenic concept for the liquefaction of natural gas integrated
into an air separation process. In Proceedings of the ASME International Mechanical Engineering Congress and Exposition 2016,Phoenix, AZ, USA, 11–17 November 2016; Volume 6A. Article Number V06AT08A030.
4. Kanoglu, M. Exergy analysis of multistage cascade refrigeration cycle used for natural gas liquefaction. Int. J. Energy Res. 2002,26, 763–774. [CrossRef]
5. Chen, S.Q.; Dong, X.Z.; Xu, J.; Zhang, H.L.; Gao, Q.; Tan, C.Q. Thermodynamic evaluation of the novel distillation column of theair separation unit with integration of liquefied natural gas (LNG) regasification. Energy 2019, 171, 341–359. [CrossRef]
6. Acikkalp, E.; Yamik, H.; Caner, N.; Acikkalp, E. Energy and Exergy Evaluation of an Air Separation Facility: A Case Study. Sep.Sci. Technol. 2014, 49, 2105–2113. [CrossRef]
7. Tesch, S.; Morosuk, T.; Tsatsaronis, G. Advanced exergy analysis based on the parametric study of the regasification of LNGintegrated into an air separation process. In Proceedings of the ASME International Mechanical Engineering Congress andExposition 2015, Houston, TX, USA, 13–19 November 2015; Volume 6A. Article Number V06AT07A027.
8. Rong, Y.Y.M.; Zhi, X.Q.; Wang, K.; Zhou, X.; Cheng, X.W.; Qiu, L.M.; Chi, X.L. Thermoeconomic analysis on a cascade energyutilization system for compression heat in air separation units. Energy Convers. Manag. 2020, 213, 112820. [CrossRef]
9. Banaszkiewicz, T. The Possible Coupling of LNG Regasification Process with the TSA Method of Oxygen Separation fromAtmospheric Air. Entropy 2021, 23, 350. [CrossRef] [PubMed]
10. Moran, M.J.; Shapiro, H.N.; Boettner, D.D.; Bailey, M.B. Fundamentals of Engineering Thermodynamics, 9th ed.; Wiley: Hoboken, NJ,USA, 2018; pp. 225–253.
11. Palazzo, P. Chemical and Mechanical Aspect of Entropy-Exergy Relationship. Entropy 2021, 23, 972. [CrossRef] [PubMed]12. Ohijeagbon, I.O.; Waheed, M.A.; Jekayinfa, S.O. Methodology for the physical and chemical exergetic analysis of steam boilers.
Energy 2013, 53, 153–164. [CrossRef]13. Michalakakis, C.; Fouillou, J.; Lupton, R.C.; Hernandez, A.G.; Cullen, J.M. Calculating the chemical exergy of materials. J. Ind.
Ecol. 2021, 25, 288–304. [CrossRef]14. Thengane, S.K.; Hoadley, A.; Bhattacharya, S.; Mitra, S.; Bandyopadhyay, S. Exergy efficiency improvement in hydrogen
production process by recovery of chemical energy versus thermal energy. Clean Technol. Environ. Policy 2016, 18, 1391–1404.[CrossRef]
15. ChemSep. Available online: http://www.chemsep.org (accessed on 26 December 2021).16. Reini, M.; Casisi, M. The Gouy-Stodola Theorem and the derivation of exergy revised. Energy 2020, 210, 118486. [CrossRef]17. Xie, L.J.; Wu, H.Q.; Sun, S.Y. The exergy analysis of the practical rectification column of oxygen plant. In Cryogenics and Refrigeration,
Proceedings of the ICCR’2003, Hangzhou, China, 22–25 April 2003; Chen, G.B., Hebral, B., Chen, G.M., Eds.; International AcademicPublisher: Hangzhou, China, 2003; pp. 853–857.

Entropy 2022, 24, 272 21 of 21
18. Wang, S.J.; Gu, X.J.; Chen, X.Y.; Hao, M.L.; Liu, F.R. Simulation and optimization of low temperature rectification column inliquefaction process of rich-N-2 coalbed gas. In Cryogenics and Refrigeration, Proceedings of the ICCR’2003, Hangzhou, China, 22–25April 2003; Chen, G.B., Hebral, B., Chen, G.M., Eds.; International Academic Publisher: Hangzhou, China, 2003; pp. 188–191.
19. Fu, C.; Gundersen, T. Using exergy analysis to reduce power consumption in air separation units for oxy-combustion processes.Energy 2012, 44, 60–68. [CrossRef]
20. Rizk, J.; Nemer, M.; Clodic, D. A real column design exergy optimization of a cryogenic air separation unit. Energy 2012, 37,417–429. [CrossRef]
21. Cornelissen, R.L.; Hirs, G.G. Exergy analysis of cryogenic air separation. Energy Convers. Manag. 1998, 39, 1821–1826. [CrossRef]22. Yao, L.; Tong, L.G.; Xie, Y.F.; Shen, J.B.; Li, H.Z.; Li, S.Q. Exergy Analysis of Air Separation Unit Products. In Proceedings of the
International Conference On Materials For Renewable Energy And Environment (ICMREE), Chengdou, China, 19–21 August2013; Volumes 1–3, pp. 843–846.
23. Van der Ham, L.V.; Kjelstrup, S. Exergy analysis of two cryogenic air separation processes. Energy 2010, 35, 4731–4739. [CrossRef]24. Ghazikhani, A.; Rahimi, A.B.; Mamourian, M. Exergy analysis of an industrial air separation unit for liquefied natural gas
production. Int. J. Exergy 2020, 31, 172–185. [CrossRef]25. Sapali, S.N.; Raibhole, V.N. Exergy Analysis of Cryogenic Air Separation Unit Integrated with Biomass Gasifier. In World Congress
on Engineering and Computer Science, Proceedings of the WCECS 2013, San Francisco, CA, USA, 23–25 October 2013; Ao, S.I., Douglas,C., Grundfest, W.S., Burgstone, J., Eds.; Newswood Limited: Hung To Road, Hong Kong, 2013; Volume II.