Exercise, Protein and Vitamin D for Type 2 Diabetes Mellitus
429
Exercise, Protein and Vitamin D for Type 2 Diabetes Mellitus By Eliza Grace Miller Bachelor of Food Science and Nutrition (Honours) School of Exercise and Nutrition Sciences Faculty of Health Deakin University Submitted in fulfilment of the requirements for the degree of Doctor of Philosophy May 24, 2017
-
Upload
khangminh22 -
Category
Documents
-
view
0 -
download
0
Transcript of Exercise, Protein and Vitamin D for Type 2 Diabetes Mellitus

Exercise, Protein and Vitamin D for Type 2 Diabetes Mellitus
By
Eliza Grace Miller
Bachelor of Food Science and Nutrition (Honours)
School of Exercise and Nutrition Sciences
Faculty of Health
Deakin University
Submitted in fulfilment of the requirements for the degree of
Doctor of Philosophy
May 24, 2017

sfol
Retracted Stamp

sfol
Retracted Stamp

Acknowledgements
It is with utmost gratitude that I acknowledge the endless support, guidance and
patience of my principal supervisor, Professor Robin Daly. Without his wealth of
knowledge and experience this thesis would not have been possible. His belief and
confidence in not only me but all his students along with his resolve in fostering the
development of the next generation of researchers is to be commended. I consider it
a tremendous honour to have been fortunate enough to work with Professor Robin
Daly.
I am additionally indebted to my co-supervisors, Professor Caryl Nowson and
Professor David Dunstan for their academic support and willingness to provide
assistance when requested.
To Belinda De Ross, your invaluable assistance with the implementation and
management of REVAMP-IT along with data collection is greatly appreciated.
Further, to all the members of the Daly research team, my fellow PhD students, other
staff and colleagues within the School of Exercise and Nutrition Sciences, I am
thankful to all of you for your everlasting encouragement, friendship and guidance.
To the directors, practice managers and Exercise Physiologists and Scientists at
Kieser Training Australia your hard-work and diligence was crucial to the successful
completion of REVAMP-IT and I cannot thank-you enough for this effort.
Finally, thank-you to my greatest supporters and the most wonderful people in the
entire world- my parents Fiona and Robert Miller and my two younger sisters April
and Charlotte. There are simply not enough words for me to express my love and
gratitude for your eternal support, encouragement, love, friendship and the belief you
have in me that I can achieve anything I set out to in my life. Each of you inspire me
each day with the enthusiasm, dedication and commitment you show to your own
work/studies and life in its entirety.

List of Original Publications
Chapter 3
Miller. E.G., Sethi. P., Nowson. C.A., Dunstan. D.W., Daly. R.M. 2016 ‘Effects of
Progressive Resistance Training and Weight Loss versus Weight Loss alone on
Inflammatory and Endothelial Biomarkers in Older Adults with Type 2 Diabetes.’
European Journal of Applied Physiology. 117(8): 1669.
Chapter 4
Daly. R.M., Miller. E.G., Dunstan. D.W., Nowson. C.A., Kerr. D., Solah. V.,
Menzies. D. 2014 ‘The Effects of Progressive Resistance Training Combined with a
Whey-Protein Drink and Vitamin D Supplementation on Glycaemic Control, Body
Composition and Cardiometabolic Risk Factors in Older Adults with Type 2 Diabetes:
Study Protocol for a Randomised Controlled Trial.’ Trials. 15(1): 431.
Chapter 5
Miller. E.G., Dunstan. D.W., Nowson. C.A., Kerr. D., Solah. V., Menzies. D, Daly.
R.M, 2016 ‘Recruitment of older adults with type 2 diabetes into a community-based
exercise and nutrition randomised controlled trial.’ Trials. 17(1):467.

List of Accepted Conference Abstracts
September 2014
Challenges of Recruiting Type 2 Diabetes Mellitus Patients into a 6-Month
Randomised Controlled Trial
Deakin University Higher Degree by Research Symposium
Melbourne, Australia
September 2015
Exercise, Weight Loss and Inflammation in Older Adults with Type 2 Diabetes: A 12-
Month Randomised Controlled Trial
Deakin University Higher Degree by Research Symposium
Melbourne, Australia
June 2016
Effects of Progressive Resistance Training and Weight Loss versus Weight Loss
alone on Inflammatory and Endothelial Biomarkers in Older Adults with Type 2
Diabetes: A 12-month Randomised Controlled Trial
World Congress on Active Ageing
Melbourne, Australia
September 2016
Exercise Plus Protein and Vitamin D for Adults with Type 2 Diabetes
Deakin University Higher Degree by Research Symposium
Melbourne, Australia

Page | I
Table of Contents
Table of Contents I Abbreviations VII List of Tables X List of Figures XIV List of Appendices XXI
Chapter 1 Introduction
1.1 Research Problem 2 1.2 Thesis Aims 6 1.3 Thesis Hypothesis 7 1.4 Significance of this Research 7
Chapter 2 Review of the Literature
2.1 Type 2 Diabetes – A Global Health Problem 10 2.2 The Economic Burden of Type 2 Diabetes 12 2.3 Pathophysiology of Type 2 Diabetes 13 2.4 Defining Pre-Diabetes and Type 2 Diabetes 14 2.5 Risk Factors for the Development of Type 2 Diabetes 15 2.6 Prevention of Type 2 Diabetes 22 2.7 Exercise for the Management of Type 2 Diabetes 24
2.7.1 Aerobic Training and Type 2 Diabetes 25 2.7.2 Progressive Resistance Training and Type 2 Diabetes 25
2.7.2.1 Effects of PRT on Body Composition 26 2.7.2.2 Effects of PRT on Glycaemic and Insulinaemic Outcomes 35 2.7.2.3 Effects of PRT on Markers of Inflammation 38 2.7.2.4 Effects of PRT on Blood Pressure and Blood Lipids 40
2.7.3 Efficacy of Community-Based Resistance Training Programs 42 2.8 Nutrition for the Management of Type 2 Diabetes 44
2.8.1 High Protein Diets for the Management of Type 2 Diabetes 45
2.8.1.1 Effects of a High Protein Diet on Glycaemic and Insulinaemic Outcomes 45
2.8.1.2 Effects of a High Protein Diet on Body Composition 47
2.8.1.3 Effects of High Protein Diets on Lipids, Blood Pressure and Markers of Inflammation
49
2.8.1.4 Potential Problems with Prescribing High Protein Diets 50 2.8.2 Protein Supplements for the Management of Type 2 Diabetes 51
2.8.2.1 Effect of Whey Protein on Weight and Fat Mass 54

Page | II
2.8.2.2 Effect of Whey Protein on Lean Mass 55
2.8.2.3 Effect of Whey Protein on Glycaemic and Insulinaemic Outcomes
58
2.8.2.4 Effect of Whey Protein on Markers of Inflammation 61 2.8.2.5 Effect of Whey Protein on Serum Lipids and Blood Pressure 63
2.9 Vitamin D 65 2.9.1 Metabolism of Vitamin D 66 2.9.2 Recommended Serum 25(OH)D Levels 67 2.9.3 Vitamin D and Type 2 Diabetes: Proposed Mechanisms of Action 68
2.10 Vitamin D Supplementation for the Management of Type 2 Diabetes
70
2.10.1 Effect of Vitamin D on Glycaemic and Insulinaemic Outcomes 70 2.10.2 Effect of Vitamin D on Body Composition 71 2.10.3 Effect of Vitamin D on Markers of Inflammation 73 2.10.4 Effect of Vitamin D on Serum Lipids and Blood Pressure 75
2.11 Exercise, Protein and Vitamin D for the Management of Type 2 Diabetes
78
2.11.1 Effects of Exercise and Protein or Exercise and Vitamin D on Lean Mass
78
2.11.2 Effects of Exercise Combined with Protein and Vitamin D on Lean Mass
91
2.11.3 Effects of Exercise, Protein or Vitamin D on Glycaemic and Insulinaemic Outcomes
93
2.11.4 Effects of Exercise, Protein and Vitamin D on Cardiovascular Health
102
2.12 Summary 107 Chapter 3
Exercise, Weight Loss and Inflammation in Type 2 Diabetes 3.1 Declaration Statement 110 3.2 Abstract 111 3.3 Introduction 113 3.4 Methods 115
3.4.1 Participants 115 3.4.2 Study Design 115 3.4.3 Ethics 117 3.4.4 Intervention 117 3.4.5 Measurements 121
3.4.5.1 Cytokine and Endothelial Inflammatory Markers Measurements
121

Page | III
3.4.6 Statistical Analysis 122 3.5 Results 122
3.5.1 Changes in Inflammatory Cytokines 124 3.5.2 Change in Adiponectin 128 3.5.3 Changes in Endothelial Markers 131
3.6 Discussion 134 3.7 Limitations 139 3.8 Conclusion 140 3.9 Acknowledgements 140
Chapter 4 Methods for a 6-month Randomised Controlled Trial Investigating The Effects
of Progressive Resistance Training, Whey-Protein and Vitamin D
Supplementation on Glycaemic Control, Body Composition and Cardiovascular
Risk Factors in Older Adults with Type 2 Diabetes
4.1 Declaration Statement 142 4.2 Abstract 143 4.3 Methods 144
4.3.1 Study Design 144 4.3.2 Ethics 144 4.3.3 Funding 145 4.3.4 Participants 145 4.3.5 Recruitment 145 4.3.6 Screening and Eligibility 145 4.3.7 Consent 147 4.3.8 Randomisation 147 4.3.9 Intervention 147
4.3.10 Sample Size Calculations 151 4.3.11 Outcome Measures 151
4.3.11.1 Anthropometry 155 4.3.11.2 Body Composition 155
4.3.11.3 Biochemical and Hormonal Assessment and Measures of Markers of Inflammation
158
4.3.11.4 Blood Pressure 160 4.3.11.5 Muscle Strength 161 4.3.11.6 Dietary Assessment 163 4.3.11.7 Habitual Physical Activity 165 4.3.11.8 Medical History, Health Status, Medication Use 165

Page | IV
4.3.11.9 Compliance Assessment 166 4.3.11.10 Adverse Events 166
4.3.12 Statistical Analysis 167 Chapter 5
Lessons Learned Recruiting Older Adults with Type 2 Diabetes into a Community-based Exercise and Nutrition Randomised Controlled Trial
5.1 Declaration Statement 169 5.2 Abstract 170 5.3 Introduction 172 5.4 Methods 173
5.4.1 Study Overview 173 5.4.2 Ethics 174 5.4.3 Funding 175 5.4.4 Sample Size Calculations 175 5.4.5 Screening Procedure and Inclusion/Exclusion Criteria 175 5.4.6 Recruitment Strategies 176 5.4.7 Data Collection and Analysis 181
5.5 Results 182 5.5.1 Recruitment 182 5.5.2 Response Rates and Reasons for Ineligibility or Non-participation 182 5.5.3 Recruitment Return by Recruitment Strategy 184 5.5.4 Recruitment Return by Gender and Age 185 5.5.5 Recruitment Timeline 186 5.5.6 Recruitment Cost 188
5.6 Discussion 190 5.6.1 Eligibility Rate 190 5.6.2 Success of Recruitment Strategies 191 5.6.3 Recruitment Cost 193 5.6.4 Reasons for Ineligibility 194 5.6.5 Reasons for Choosing Not to Participate 194
5.7 Limitations 194 5.8 Conclusion 195
Chapter 6 The Effects of Progressive Resistance Training Combined with a Whey-Protein
Drink and Vitamin D Supplementation on Glycaemic Control, Insulin Sensitivity, Body Composition and Cardiovascular Risk Factors in Older Adults
with Type 2 Diabetes 6.1 Declaration Statement 198

Page | V
6.2 Abstract 199 6.3 Introduction 201 6.4 Methods 203
6.4.1 Study Design 203 6.4.2 Participants 203 6.4.3 Ethics 203 6.4.4 Funding 203 6.4.5 Randomisation 204 6.4.6 Intervention 204
6.5 Outcome Measures 206 6.5.1 Anthropometry 206 6.5.2 Blood Pressure 206 6.5.3 Body Composition 206 6.5.4 Muscle Strength 207 6.5.5 Biochemical, Hormonal and Inflammatory Cytokine Measurements 207 6.5.6 Dietary Assessment 208 6.5.7 Habitual Physical Activity 209 6.5.8 Medical History, Health Status and Medication Use 209 6.5.9 Compliance Assessment 209
6.5.10 Adverse Events 210 6.5.11 Statistical Analyses 210
6.6 Results 212 6.6.1 Participant Characteristics 212 6.6.2 Study Attrition 214 6.6.3 Compliance 217 6.6.4 Adverse Events 218 6.6.5 Physical Activity and Diet 220 6.6.6 Glycaemic and Insulinaemic Outcomes 228 6.6.7 Body Composition and Muscle Strength 235 6.6.8 Cardiovascular Health 242 6.6.9 Other Medication Use and Change 250
6.6.10 Inflammatory Cytokines, Hormonal and Biochemical Factors 250 6.6.11 Per Protocol Analysis 257
6.7 Discussion 260
6.7.1 Effects of PRT, Whey Protein and Vitamin D on Lean Mass, Muscle Size and Strength
261
6.7.2 Effects of PRT, Whey Protein and Vitamin D on Fat Mass and Body Weight
267

Page | VI
6.7.3 Effects of PRT, Whey Protein and Vitamin D on Glycaemic and Insulinaemic Outcomes
269
6.7.4 Effects of PRT, Whey Protein and Vitamin D on Blood Pressure and Lipids
278
6.7.5 Effects of PRT, Whey Protein and Vitamin D on Markers of Inflammation
282
6.8 Strength and Limitations 285 6.9 Conclusion 288
Chapter 7 Summary, Implications, Future Recommendations and Conclusions
7.1 Summary 291
7.2 Key Research Findings, Limitations and Directions for Future Research
293
7.2.1 Recruiting ‘at risk’ older adults with T2DM into exercise and nutrition intervention trials is challenging and expensive
294
7.2.2 Structured and supervised as well as community-based PRT results in relevant cardiometabolic health improvements important to those with T2DM
297
7.2.3 The most effective diet or nutritional approach for the management of T2DM remains unclear
299
7.3 Conclusions and Public Health Implications 302 References 305 Appendices 353

Page | VII
Abbreviations
1,25(OH)2D: 1,25-dihydroxyvitamin D
25(OH)D: 25-hydroxyvitamin D
ACSM: American College of Sports Medicine
ACE: Angiotensin converting enzyme
ADA: American Diabetes Association
AHA: American Heart Association
AIHW: Australian Institute of Health and Welfare
ALM: Appendicular lean mass
ANCOVA: Analysis of covariance
AUC: Area under the curve
AUD$: Australian Dollars
AusDiab: Australian Diabetes, Obesity and Lifestyle BCAAs: Branched chain amino acids
BDA: British Diabetic Association
BMI: Body mass index
BMRest: Estimated Basal Metabolic Rate
CCK: Cholecystokinin
CHAMPS: Community healthy activities model program for seniors
CI: Confidence interval
cm: Centimetre(s)
CSA: Cross-sectional area
CV: Co-efficient of variation
CVD: Cardiovascular disease
CYP27B1: 1-alpha- hydroxylase
DBP: Diastolic Blood Pressure
DPP: Diabetes Prevention Study
DPP-4: Dipeptidyl peptidase 4
DXA: Dual-energy X-ray absorptiometry
EAAs: Essential amino acids
eGFR: Glomerular filtration rate
EI: Energy Intake

Page | VIII
EOI: Expression of interest
FGF-23: Fibroblast growth factor 23
FPG: Fasting plasma glucose g: Gram(s)
GI: Gastrointestinal
GLUT4: Glucose transporter type 4
GP: General practitioner
HbA1c: Glycated haemoglobin
HDL: High-density lipoprotein
HOMA: Homeostasis model assessment
hs-CRP: High sensitive C-reactive protein
HRmax: Heart rate maximum
HRR: Heart rate reserve
ICAM-1: Intercellular Adhesion Molecule 1
IDF: International Diabetes Federation
IFG: Impaired fasting glucose
IGT: Impaired glucose tolerance
IGF-1: Insulin like growth factor-1
IOM: Institute of Medicine
IL-6: Interleukin 6
IL-8: Interleukin 8
IL-10: Interleukin 10
IU: International Units
kg: Kilogram(s)
kJ: Kilojoule(s)
LDL: Low-density lipoprotein
MDRD: Modification of Diet in Renal Disease
ml: Millilitre(s)
mmHg: Millimetres of mercury
mmol/L: Millimole per litre
MPB: Muscle protein breakdown
MPS: Muscle protein synthesis
mTOR: Mammalian target of rapamycin

Page | IX
NDSS: National Diabetes Support Scheme
NHANES: National Health and Nutrition Examination Survey
NHMRC: National Health and Medical Research Council
nmol/L: Nanomoles per litre
NSAIDs: Nonsteroidal anti-inflammatory drugs
OGTT: Oral glucose tolerance test
PAL: Physical activity level
Pmol/L: Picomoles per litre
pQCT: Peripheral quantitative computed tomography
PRT: Progressive resistance training
PTH: Parathyroid hormone
QA: Quality assurance
RAAS: Renin angiotensin aldosterone system
RCT(s): Randomised controlled trial(s)
REVAMP-IT: Resistance Exercise, Vitamin D and Muscle Protein Intervention Trial
RM: Repetition maximum
RPE: Ratings of perceived exertion
RRR: Relative risk reduction
SBP: Systolic blood pressure
SD: Standard deviation
SEM: Standard error of the mean
TNF-α: Tumour necrosis factor alpha
T2DM: Type 2 diabetes mellitus
US$: United States dollars
VAT: Visceral adipose tissue
VDR: Vitamin D receptor
VLCD: Very low calorie diet
VO2max: Maximal oxygen consumption
VO2R: VO2 reserve
WHO: World Health Organization
WL: Weight loss

Page | X
List of Tables
Number Title Page
Chapter 2 Table 2.1 Diagnostic criteria for pre-diabetes and type 2 diabetes. 15 Table 2.2 Major risk factors for type 2 diabetes. 17 Table 2.3 Minimum exercise recommendations for patients with type 2
diabetes. 25
Table 2.4 Summary of the main findings (between-group differences) in RCTs investigating the effects of PRT or the combination of PRT and aerobic training under supervised gymnasium-based settings in older adults with type 2 diabetes.
28
Table 2.5 Analysis of effect size for change in HbA1c stratified by characteristics of the PRT program.
38
Table 2.6 Macronutrient recommendations for the management for type 2 diabetes by the British and American Diabetes Association and the American Heart Foundation.
45
Table 2.7 Types of commercially available whey protein. 53 Table 2.8 Recommended serum vitamin D targets and classes of
deficiency as recommended by the IOM. 68
Table 2.9 Summary of RCTs which have examined the interactive effects of various protein supplements with PRT or exercise on lean mass in older and elderly adults.
85
Table 2.10 Summary of RCTs which have examined the interactive effects of increased dietary protein or protein supplements with PRT or exercise on glycaemic and/or insulinaemic outcomes in older and elderly adults.
98
Chapter 3 Table 3.1 Baseline descriptive characteristics of the PRT+WL and WL
group. 122
Table 3.2 Mean baseline values and the percentage change relative to baseline for serum IL-10, IL-6 and TNF-α for the PRT+WL and WL groups after 3-, 6-, 9- and 12-months.
126
Table 3.3
Mean baseline values and the percentage change from baseline for serum adiponectin in the PRT+WL and WL groups after 3-, 6-, 9- and 12-months.
129
Table 3.4 Mean baseline values and the percentage change from baseline for serum ICAM-1 and resistin for the PRT+WL and WL groups after 3-, 6-, 9- and 12-months.
132
Chapter 4 Table 4.1 Ineligibility criteria for the 24-week Lift for Life® RCT. 146

Page | XI
Table 4.2 Summary of the primary and secondary outcome measures collected and methods of collection.
152
Chapter 5 Table 5.1 Reasons participants were deemed ineligible for the trial. 183 Table 5.2 Number and proportion (percentage) of expressions of interest
who chose not to participate in this trial and the reasons provided for non-participation.
184
Table 5.3 Number and proportion (percentage) of expressions of interest and participants deemed eligible for the trial based on the various recruitment strategies.
185
Table 5.4 Number and proportion of men and women screened and deemed eligible or ineligible for the trial.
186
Table 5.5 The total costs, proportion of total recruitment costs, the number of eligible participants plus cost per participant for each recruitment strategy in this trial.
189
Chapter 6 Table 6.1 Baseline characteristics of participants in the PRT+ProD and
PRT groups. 213
Table 6.2 Number and proportion of musculoskeletal complaints reported by participants in the PRT+ProD and PRT groups that were deemed to be associated with the PRT program. Categorised by skeletal/muscular site.
219
Table 6.3 Physical symptom(s) and number of adverse events related to the whey protein supplement in the PRT+ProD supplement group.
220
Table 6.4 Baseline values and absolute within-group changes in the PRT+ProD and PRT group and the net between-group differences for the change at 12- and 24-weeks relative to baseline for moderate-vigorous physical activity.
223
Table 6.5 Baseline values and absolute within-group changes in the PRT+ProD and PRT groups and the net between-group differences for the change at 12- and 24-weeks relative to baseline for all macronutrients, excluding protein intake and the protein-vitamin D supplements.
224
Table 6.6: Baseline values and absolute within-group changes in the PRT+ProD and PRT groups and the net between-group differences for the change at 12- and 24-weeks relative to baseline for habitual protein intake and protein intake inclusive of supplemental protein on non-training and training days in g/day and g/kg/day.
226

Page | XII
Table 6.7 Total number and proportion of participants taking oral hypoglycaemic medications and the changes at baseline, 12- and 24-weeks in the PRT+ProD and PRT groups.
229
Table 6.8 Total number and proportion of participants taking oral hypoglycaemic medications at baseline, 12- and 24-weeks in the PRT+ProD and PRT groups.
230
Table 6.9 Baseline values and absolute within-group changes in the PRT+ProD and PRT groups and the net between-group differences for the change relative to baseline for HbA1c, fasting plasma glucose, insulin, insulin sensitivity and C-peptide.
232
Table 6.10 Baseline values and absolute within-group changes in the PRT+ProD and PRT groups for weight, body mass index (BMI) and waist circumference and the net between-group differences for the change relative to baseline.
237
Table 6.11 Baseline values and absolute within-group changes in the PRT+ProD and PRT groups and the net between-group differences for the change at 24-weeks from baseline for total body and regional (arms and legs) lean mass, fat mass and appendicular lean mass.
238
Table 6.12 Baseline values and absolute within-group changes in the PRT+ProD and PRT groups and the net between-group differences for the change at 24-weeks from baseline for 25% femur muscle cross-sectional area (CSA), muscle density, intermuscular and subcutaneous fat CSA.
240
Table 6.13 Baseline values and within-group changes in the PRT+ProD and PRT groups and the net between-group differences for the change relative to baseline in leg press and seated row one-repetition maximum muscle strength and knee extensor isometric muscle strength.
241
Table 6.14 Total number and proportion of participants prescribed anti-hypertensive and/or lipid-lowering medications at baseline, 12- and 24-weeks in the PRT+ProD and PRT groups.
243
Table 6.15 Types of anti-hypertensive medications participants were prescribed at baseline, 12- and 24-weeks in the PRT+ProD and PRT groups.
244
Table 6.16 Number and proportion of participants in the PRT+ProD and PRT groups presenting with hyperlipidaemia.
245
Table 6.17 Baseline values and absolute within-group changes in PRT+ProD and PRT groups and the net between-group differences for the change at 12- and 24-weeks relative to baseline for systolic and diastolic blood pressure.
247

Page | XIII
Table 6.18 Baseline values and absolute within-group changes in the PRT+ProD and PRT groups and the net between-group differences for the change at 12- and 24-weeks relative to baseline for serum total, HDL and LDL cholesterol and triglycerides.
248
Table 6.19 Total number and type of other medications prescribed to participants at baseline, 12- and 24-weeks in the PRT+ProD and PRT groups.
250
Table 6.20 Baseline values and percent changes in the PRT+ProD and PRT groups and the net between-group differences for the change at 12- and 24-weeks relative to baseline for serum levels of interleukin (IL)-10, IL-6, IL-8, tumor necrosis factor-alpha (TNF-α), adiponectin and high-sensitive C-reactive protein (hs-CRP).
252
Table 6.21 Baseline values and absolute within-group changes in the PRT+ProD and PRT groups and the net between-group differences for the change at 12- and 24-weeks relative to baseline for serum creatinine, estimated glomular filtration (eGFR), 25-hydroxyvitamin D (25(OH)D) and insulin-like growth factor-1 (IGF-1).
255
Table 6.22 Baseline characteristics of participants included in the per protocol analysis of the PRT+ProD and PRT groups.
258

Page | XIV
List of Figures
Number Title Page
Chapter 2 Figure 2.1 Percentage of Australian adults with or at risk of developing
T2DM as assessed by fasting plasma glucose in 2011-12. 11
Figure 2.2 Common aetiological pathways and the metabolic links shared between sarcopenia and type 2 diabetes.
20
Figure 2.3 Protein fractions and types of whey protein derived from whole milk.
52
Figure 2.4 The serum glucose and insulin responses to a high-glycaemic index breakfast meal following a whey protein (white circles) or placebo (black circles) pre-load in 15 participants with type 2 diabetes.
59
Figure 2.5 Metabolism of vitamin D from the sun and dietary sources. 67
Figure 2.6 Proposed role of vitamin D in the pathophysiology of type 2 diabetes.
69
Figure 2.7 Mean ± SD absolute changes (in kg) in total body weight, fat mass and lean mass after 16-weeks on a hypocaloric high protein (33% energy from protein) or hypocaloric control diet (19% energy from protein) with and without PRT.
80
Figure 2.8 Mean (± SD) absolute changes in fasting insulin (pmol/L), glucose (mmol/L) and HbA1c (%) following a 16-week high protein (33% energy from protein) or control diet (19% energy from protein) with or without participation in PRT (3 days/week 70-85% 1-RM).
94
Figure 2.9 Absolute percentage change in total cholesterol, HDL cholesterol, LDL cholesterol and triglycerides following a 12-week intervention of multi-modal exercise, multi-modal exercise plus 1,200 IU/day of vitamin D, 1,200 IU/day of vitamin D alone or control.
105
Chapter 3 Figure 3.1 CONSORT flow diagram of participants through the trial. 117 Figure 3.2 Mean percentage change with 95% CI from baseline for
serum A) IL-10, B) TNF-α, C) IL-6 and D) Adiponectin following the gymnasium-based (3- and 6-months) and home-based (9- and 12-months) training for the PRT+WL (●) and WL (○) groups.
130
Figure 3.3 Mean percentage change with 95% CI from baseline for serum A) ICAM-1 and B) Resistin following the gymnasium-
133

Page | XV
based (3- and 6-months) and home-based (9- and 12-months) training for the PRT+WL (●) and WL (○) group.
Chapter 4 Figure 4.1 Flow diagram of the progress through the 24-week PRT
program used in this trial modelled from the Lift for Life® program.
148
Figure 4.2 Single use sachet of protein supplement and shaker cup used for protein supplement preparation.
150
Figure 4.3 Sub-regions within the whole body DXA scan. 156 Figure 4.4 Peripheral quantitative computed tomography (pQCT) scan
at the 25% femur site. 157
Figure 4.5 Participant positioning for the knee extensor strength test. 162
Chapter 5 Figure 5.1 Example of the study advertisement in state print media
(newspaper). 177
Figure 5.2 Example of the study advertisement for local print media (newspaper).
178
Figure 5.3 An example of the study recruitment flyer. 180
Figure 5.4 The number of male and female participants eligible for this trial and the recruitment strategies they responded from.
186
Figure 5.5 Number of participants randomised to this trial each month for the duration of the recruitment period.
187
Figure 5.6 Timeline and timing of recruitment strategies implemented during 2014 and 2015.
188
Chapter 6 Figure 6.1 Flow diagram of the progress through the 24-week PRT
program used in this trial modelled off the Lift for Life® program.
205
Figure 6.2 CONSORT flow diagram of participants through the trial. 216
Figure 6.3 Histogram of the percentage exercise compliance by participants in the PRT+ProD and PRT group.
217
Figure 6.4 Histogram of the percentage compliance with the whey protein drink (panel A) and vitamin D supplements (panel B) in the progressive resistance training plus protein and vitamin D supplementation (PRT+ProD) group.
218
Figure 6.5 Total dietary protein intakes (habitual plus supplemental) in older adults with type 2 diabetes at baseline, 12- and 24-weeks.
228
Figure 6.6 Mean absolute changes from baseline (95% CI) in HbA1c (%) (A), fasting glucose (mmol/L) (B), fasting insulin (pmol/L)
234

Page | XVI
(C) and HOMA2%S (D) in the PRT+ProD (●) and PRT (○) groups.
Figure 6.7 Mean percentage change from baseline (95% CI) in log transformed serum interleukin (IL)-6 (A), IL-10 (B), IL-8 (C), TNF-α (D), adiponectin (E) and high sensitive hs-CRP (F) in the PRT+ProD (●) and PRT (○) groups.
254

Page | XXI
List of Appendices
Number Title Page
1 Mean baseline and the absolute change from baseline and the net differences for the change for HbA1c and body composition measurements in the PRT+WL and WL groups at 3, 6, 9 and 12-months
362
2 Mean values ± SD in various inflammatory markers for the PRT+WL and WL groups at 3-, 6-, 9- and 12-months
363
3 Mean values ± SD in endothelial markers for the PRT+WL and WL groups at 3-, 6-, 9- and 12-months
364
4 Deakin University Human Research Ethics Committee Approval Letter
365
5 Telephone Screening Questionnaire 366 6 GP Letter and Recommendation to Participate Form 367 7 Plain Language Statement and Consent Form 370
8 National Diabetes Support Scheme Recruitment Letter Mail-Out
379
9 Baseline values and absolute within-group changes in the PRT+ProD and PRT group and the net between-group differences for the change at 12- and 24-weeks relative to baseline for habitual protein intake plus the protein from the whey protein supplement
381
10 Per Protocol Results Tables 383

Page | 1
Chapter 1
Introduction

Chapter 1
Page | 2
1.1 Research Problem
Type 2 diabetes mellitus (T2DM) is one of the most prevalent chronic metabolic
diseases of the 21st century (1, 2). In 2011, 366 million people were diagnosed with
diabetes globally, and by the year 2040 it is predicted that 642 million adults will
have diabetes (3). The human and economic burden of illness associated with T2DM
contributes significantly to ill health, disability and premature death, and is further
exacerbated by the onset of micro- and macrovascular complications, which appear
to be driven in part by the presence of an underlying chronic low-level of systemic
inflammation in adults with this condition (4). Thus, there is a need to develop safe,
effective and sustainable population-based prevention and management strategies
that collectively improve glycaemic control, insulin sensitivity and the multiple risk
factors associated with this disease.
Lifestyle modification combining energy restriction, weight loss and physical
activity remains the cornerstone of T2DM management (5, 6). While a reduction in
body weight and improvements in glycaemic control have been observed following
energy restriction, weight loss and aerobic or endurance activity, a concomitant loss
in lean mass also tends to occur (7, 8). Lean mass is critical for people with T2DM,
as it is the largest mass of insulin-sensitive tissue and the predominant reservoir for
glucose disposal (9). Losses in muscle mass can negatively impact metabolic rate,
compound the problems of insulin resistance and lead to reduced physical function
and quality of life (10, 11). As a result, current international consensus exercise
guidelines recommend that progressive resistance training (PRT) be incorporated
into the overall physical activity plan for people with T2DM (6).
Previous research has demonstrated that high-intensity PRT conducted within a
controlled setting is safe and effective for improving glycated haemoglobin (HbA1c)
levels and lean mass in older adults with T2DM (12-14). Furthermore, exercise and
to a lesser extent PRT has also been shown to play a role in lowering chronic low-
grade inflammation, particularly in people who are overweight or obese and/or have
a diagnosed chronic disease (15-18). Chronic low-grade inflammation has been
linked to accelerated muscle loss and has emerged as the common denominator
linking T2DM, metabolic syndrome and cardiovascular disease (19-22). This chronic

Chapter 1
Page | 3
state of inflammation has also been associated with a decrease in beta-cell insulin
secretion and a subsequent deterioration in insulin resistance (19-22). However,
whether improvements in markers of inflammation are associated with improvements
in glycaemic control remain to be observed.
Whilst there has been considerable research into the effects of PRT on body
composition, HbA1c, insulin sensitivity and to a lesser degree inflammation, many of
the randomised controlled trials (RCTs) have commonly occurred under tightly
controlled and structured clinical laboratory settings. The translation of this research
into practice and whether similar benefits can be achieved from participation in
community based-programs, where there is often less supervision and more
independence in performing the training, remains uncertain. Improvements in health
outcomes following community-based exercise programs, even if modest, are still
important from a public health perspective given small improvements at an
individual level can translate to substantial changes within the population (23).
Further, community-based physical activity programs are a key avenue for assessing
the relevance and real-world applicability of research-to-practice programs. Previous
research measuring the economic value of research-to-practice programs in
community-settings has also found participation in such programs may reduce total
healthcare costs for older adults, society and the national healthcare system (24).
Since nutritional management is also an important component in the treatment of
T2DM, combining PRT with dietary modification may offer an incremental effect on
glycaemic control, insulin sensitivity as well as body composition and cardiovascular
risk factors. Traditionally, caloric restriction has been prescribed to adults with
T2DM largely due to the well-documented benefits on glycaemic control, blood
pressure and serum lipid levels as well as fat mass and overall weight loss (25-27).
However, weight reduction remains a difficult-to-reach goal for many and long-term
maintenance of caloric restricted diets and the resultant weight loss often fails to be
maintained (28-30). Aerobic or endurance training is also often combined with
caloric restriction but this approach does not appear to attenuate the muscle loss
arising from weight loss. However, a limited number of studies in overweight and
obese adults (31, 32) and those with T2DM (33-35) have reported that exercise,

Chapter 1
Page | 4
primarily aerobic training, combined with weight loss/caloric restriction is more
effective at improving glycaemic control and various inflammatory markers than
either exercise or diet alone. A study which combined calorie restriction with PRT
compared to calorie restriction alone also found that the combination was effective at
improving glycaemic control, fat mass, lean mass and upper body strength to a
greater degree than weight loss alone (12). However, the effects of PRT combined
with caloric restriction on circulating inflammatory markers has not been examined
in adults with T2DM. This is an important question given the role that systemic
inflammation plays in the pathogenesis of T2DM and related co-morbidities
including cardiovascular disease.
While the optimal macronutrient composition of the diet for the management of
T2DM remains uncertain, emerging evidence suggests that there are health benefits
associated with high-protein diets in overweight and obese adults and those with
T2DM (36, 37). For instance, a meta-analysis of nine RCTs ranging from four to 24-
weeks reported that high-protein diets had beneficial effects on weight loss and
HbA1c levels and tended to reduce blood pressure in people with T2DM, with no
adverse effects on blood lipids (38). Despite these positive findings, dietary studies
controlling for macronutrient composition are often difficult to implement in the
‘real-world’ as they require an individual to follow a prescribed meal plan.
Therefore, the addition of a protein supplement might be a more practical and
effective approach, as it does not require individuals to make marked changes in their
usual dietary habits.
Acute studies have shown that both whey protein and PRT stimulate muscle protein
synthesis (MPS) (39). A number of long-term (>10 weeks) human intervention trials
in healthy older adults have also reported that ingestion of high-quality protein can
enhance the effects of PRT on muscle mass and strength (40-42), although these
findings are not consistent (34, 43). The inconsistent findings may be due to a
number of factors, including the type of protein, the dose, timing of intake and the
distribution throughout the day (44, 45). In terms of the type of protein, there is
considerable evidence showing that whey protein is particularly effective for
stimulating an acute increase in MPS, which is likely due to the fact that it contains

Chapter 1
Page | 5
all the essential amino acids, particularly leucine, which is crucial for triggering the
initial MPS response (46-48). While there is still ongoing research into defining
whether there is an optimal dose of protein, particularly in older adults or those with
chronic disease, to elicit a synergistic anabolic muscle response with PRT, several
recent studies and reviews have recommended that 20 to 40g of high-quality, rapidly
digested, leucine-rich protein, such as whey protein, be consumed soon after each
bout of PRT to maximally stimulate MPS and promote muscle hypertrophy whilst
concomitantly reducing muscle protein breakdown (MPB) (49-51). Furthermore,
previous studies have demonstrated that whey protein and its bioactive components
may offer insulinotropic (52-56), muscle-sparing (57) and cholesterol-lowering
effects (58) in adults with T2DM. Presently, however, the long-term effects of whey
protein supplementation in combination with PRT on body composition, glycaemic
control, insulin sensitivity and inflammation along with serum lipid levels and blood
pressure in older adults with T2DM remains unknown.
There are also other lifestyle factors that might have beneficial effects on skeletal
muscle. For instance, there is mounting evidence that vitamin D may act as a
modifier of diabetes risk and that deficiency in serum 25(OH)D, the circulating
marker of vitamin D, is associated with impaired beta-cell function, glucose
intolerance and insulin resistance and reduced muscle function, strength and size (22,
59-62). Whilst an inverse association exists between serum 25(OH)D levels and
T2DM (22, 63, 64), the role that vitamin D exerts on insulin resistance and
glycaemic control remains controversial with mixed findings from a limited number
of RCTs conducted in older adults with T2DM (65-68). Nevertheless, there is some
evidence that vitamin D supplementation can improve glycaemic control and insulin
sensitivity in adults with or at high risk of this disease, including those with
prediabetes and T2DM (69-71).
In summary, there is overwhelming evidence to support a positive role for supervised
and structured PRT in older adults with T2DM, however, whether the addition of
certain nutritional factors, particularly whey protein and vitamin D, can act
synergistically to enhance the health benefits of a community-based PRT program

Chapter 1
Page | 6
remains unknown. One of the key aims of this thesis is to conduct a high quality
RCT to address this question.
1.2 Thesis Aims
The primary aim of this thesis is to investigate if lifestyle strategies such as caloric
restriction to promote weight loss or nutritional supplementation with protein and
vitamin D, in combination with PRT, can promote greater improvements in
glycaemic and insulinaemic outcomes, body composition, cardiovascular risk factors
and systemic inflammation in older overweight adults with T2DM compared to PRT
alone.
The specific aims are:
1. To compare the effect of PRT plus a moderate weight loss program versus
weight loss alone on systemic and endothelial markers of inflammation in older
overweight adults with T2DM (Chapter 3).
2. To describe the challenges related to recruiting older adults with T2DM into a 6-
month community-based exercise and nutrition research intervention, and to
assess the costs associated with the recruitment methods used (Chapter 5).
3. To investigate whether ingestion of a daily whey-protein drink in combination
with vitamin D supplementation can enhance the effects of a community-based
PRT program on glycaemic control and insulin sensitivity in older adults with
T2DM (Chapter 6).
4. To examine whether a community-based PRT program combined with a whey-
protein drink and vitamin D supplementation is more effective for enhancing
total body and regional lean mass, muscle cross-sectional area (CSA), muscle
strength and reducing inter-/intra-muscular fat infiltration, than PRT alone in
older adults with T2DM (Chapter 6).
5. To compare the effects of a community-based PRT program combined with
whey-protein and vitamin D supplementation versus PRT alone, on
cardiovascular risk factors, including blood pressure and blood lipid levels, and
pro-inflammatory and anti-inflammatory cytokines. (Chapter 6).

Chapter 1
Page | 7
1.3 Thesis Hypotheses
It is hypothesised that in older adults with T2DM:
1. Supervised high-intensity PRT combined with weight loss will lead to greater
improvements in various inflammatory and endothelial markers than weight loss
alone.
2. A community-based PRT program combined with a daily whey-protein drink
and vitamin D supplements will lead to greater improvements in glycaemic
control and insulin sensitivity compared to PRT alone.
3. A community-based PRT program combined with a whey-protein drink and
vitamin D supplementation will augment the anabolic effects of PRT alone on
total body and regional lean mass, muscle cross-sectional area, muscle strength
and reduce inter-/intra-muscular fat infiltration.
4. A community-based PRT program combined with a whey-protein drink and
vitamin D supplementation will be associated with greater improvements in
cardiovascular risk factors, including circulating total, high-density lipoprotein
(HDL) and low-density lipoprotein (LDL) cholesterol levels, triglycerides and
blood pressure and a reduction in the catabolic milieu as reflected by a decrease
in pro-inflammatory cytokines and an increase in anti-inflammatory markers
compared to PRT alone.
1.4 Significance of this Research
The International Diabetes Federation (IDF) estimates 415 million adults currently
suffer a form of diabetes (3). The most recent predictions, which are based on the
present growth of this disease, suggest that by the year 2040 642 million adults will
have diabetes (3). The rapid rise and predicted continued increase in the prevalence
of this condition is largely due to T2DM (3), which accounts for up to 91% of all
total cases of this condition in high-income countries (72, 73). The human and
economic burden of illness associated with T2DM is further exacerbated with the
onset of micro- and macro-vascular complications, highlighting the need for
sustainable population-based prevention and management approaches that can
improve multiple risk factors for T2DM and its associated micro- and macrovascular

Chapter 1
Page | 8
complications. In older adults with T2DM the most effective combined exercise and
nutrition strategy to improve glycaemic control, body composition and
cardiovascular outcomes, and concomitantly reduce the risk for micro- and
macrovascular complications, remains unknown. If successful, the findings from this
thesis will make an important contribution to the development of evidence-based and
accepted community-based exercise and nutrition treatment approaches effective for
improving multiple health outcomes implicated in the development and progression
of this disease. Of note, an increase in circulating levels of pro-inflammatory
cytokines with concomitant lower levels of anti-inflammatory markers is a common
finding in older adults with T2DM. Such an inflammatory profile can have
particularly deleterious consequences for older adults with T2DM given that it has
been associated with an increased risk of cardiovascular disease and various
diabetes-related micro- and macro-vascular complications. This thesis will provide
an insight into whether combining calorie restriction (for weight loss) with PRT may
result in an additive effect on augmenting markers of inflammation in older adults
with T2DM than either strategy alone. As an extension of this work, this thesis will
also investigate whether a community-based PRT program combined with whey
protein and vitamin D supplementation can enhance the effects of PRT alone on
body composition, glycaemic control, insulin sensitivity and cardiovascular health
outcomes including systemic inflammation, lipids and blood pressure in older adults
with T2DM. The results of the studies that make up this thesis will assist in
answering many important questions about the most appropriate lifestyle strategy for
the management of T2DM in older adults. Further, the results of the studies in this
thesis will provide critical insight into the effectiveness of community-based PRT
programs for older adults with T2DM on a range of important health outcomes. More
specifically, this thesis will identify whether nutritional factors in combination with a
community-based PRT program can enhance the recognised and established health
benefits of PRT alone in older overweight and obese adults with T2DM.

Page | 9
Chapter 2
Review of the Literature

Chapter 2
Page | 10
2.1 Type 2 Diabetes – A Global Health Problem
Globally, type 2 diabetes mellitus (T2DM) currently represents one of the largest and
most prevalent chronic, non-communicable diseases of the 21st century (3). The
International Diabetes Federation (IDF) estimates 415 million adults currently suffer
a form of diabetes (3). There has been an unrelenting increase in the global
prevalence of this chronic condition in recent decades, due largely to the rise in
prevalence of T2DM (3). It is believed that T2DM accounts for up to 91% of the
total cases of this condition in high-income countries (72, 73). In addition, the most
recent predictions, based on the current growth of this condition, project by the year
2040 approximately 642 million adults will have diabetes (3). A further 318 million
adults are currently estimated to suffer the pre-diabetic conditions of impaired
glucose tolerance (IGT) or impaired fasting glucose (IFG), both intermediary points
between normoglycaemia and T2DM (74-77).
Advancing age is associated with increased rates of diabetes prevalence across all
regions of the world (78). At present the highest observed age-specific prevalence of
T2DM is in people aged 60-79 years, however, the largest total number of
individuals with T2DM are those aged 40-59 years where 184 million people
globally have been diagnosed (78). It is expected that this prevalence pattern will
persist and by the year 2035 the largest total number of individuals will be those aged
60-79 years as people transition into old age (78).
In Australia, statistics from the 2010-11 follow-up investigation of the population-
based, prospective Australian Diabetes, Obesity and Lifestyle (AusDiab) study
revealed that the prevalence of T2DM was 12% in adults aged 25 years and over
(79). Recent figures published by the Australian Institute for Health and Welfare
(AIHW) reported the prevalence of T2DM in Australian adults aged 18 years and
over to be 4.7% (849,000 people) (80). This disagreement and underestimate in the
AIHW figures is likely due to the fact this data was self-reported data (80). Like
global figures, the prevalence of this chronic condition has been steadily increasing
for decades, and currently in Australia 280 new cases of diabetes are diagnosed every
day (79). More men compared to women are affected by T2DM (14.8% versus
9.8%), with yearly incidence rates also higher in men (0.8% compared to 0.6%) (79).
Chapter 2
Page | 11
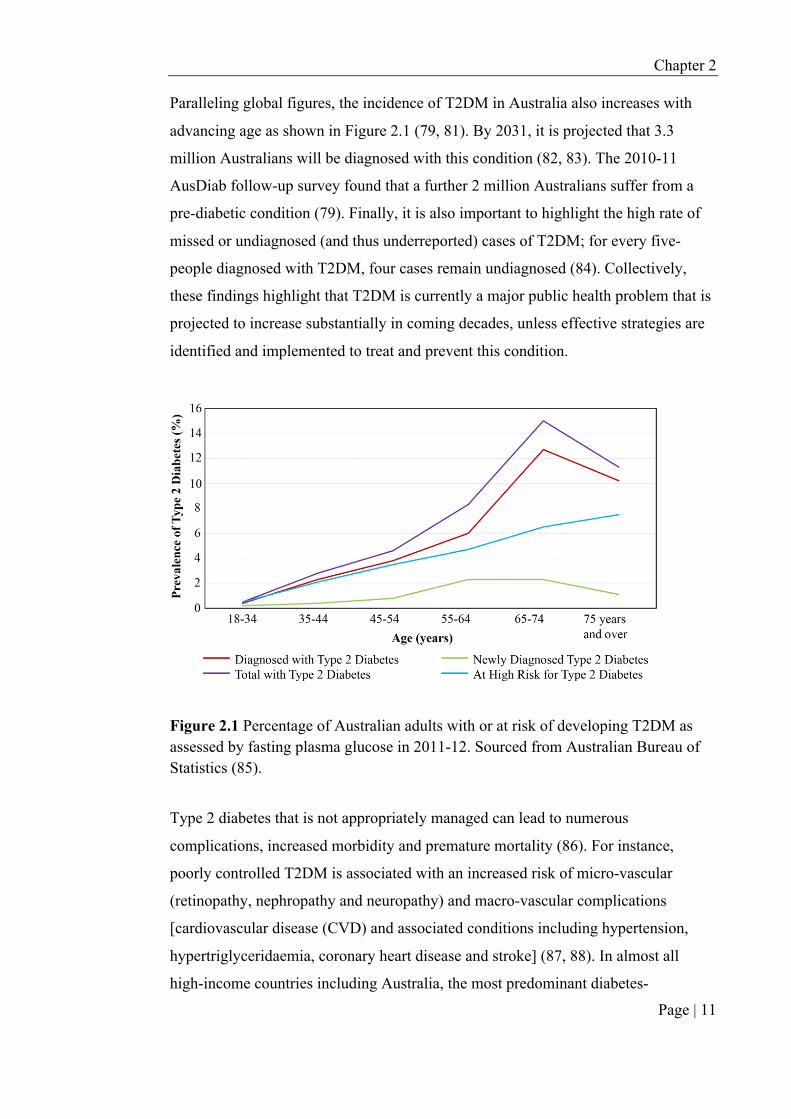
Paralleling global figures, the incidence of T2DM in Australia also increases with
advancing age as shown in Figure 2.1 (79, 81). By 2031, it is projected that 3.3
million Australians will be diagnosed with this condition (82, 83). The 2010-11
AusDiab follow-up survey found that a further 2 million Australians suffer from a
pre-diabetic condition (79). Finally, it is also important to highlight the high rate of
missed or undiagnosed (and thus underreported) cases of T2DM; for every five-
people diagnosed with T2DM, four cases remain undiagnosed (84). Collectively,
these findings highlight that T2DM is currently a major public health problem that is
projected to increase substantially in coming decades, unless effective strategies are
identified and implemented to treat and prevent this condition.
Figure 2.1 Percentage of Australian adults with or at risk of developing T2DM as assessed by fasting plasma glucose in 2011-12. Sourced from Australian Bureau of Statistics (85).
Type 2 diabetes that is not appropriately managed can lead to numerous
complications, increased morbidity and premature mortality (86). For instance,
poorly controlled T2DM is associated with an increased risk of micro-vascular
(retinopathy, nephropathy and neuropathy) and macro-vascular complications
[cardiovascular disease (CVD) and associated conditions including hypertension,
hypertriglyceridaemia, coronary heart disease and stroke] (87, 88). In almost all
high-income countries including Australia, the most predominant diabetes-

Chapter 2
Page | 12
complications are CVD, retinopathy, kidney disease and lower limb amputations
(89). To further compound this issue, many of these conditions do not exist
exclusively; the presence of one comorbid condition is frequently associated with
one or more other co-morbidities or additional complications.
The most predominant cause of morbidity and mortality in people with T2DM is
CVD (90-92). Mortality from CVD is more than double in those with T2DM
compared with age-matched healthy adults (93). The risk of CVD is strongly
associated with and rises with increases in fasting plasma glucose (FPG) levels, even
prior to reaching levels sufficient for a diagnosis of diabetes (94). In Australia in
2011-12, over two-thirds of people with diabetes (68%) reported suffering a form of
CVD; the most common and serious types including coronary heart disease, stroke
and heart failure (95). The reasons and exact mechanisms which contribute to the
high prevalence of CVD in people with T2DM have not been fully elucidated, but
have been postulated to be due to conventional risk factors which contribute
similarly to both conditions, such as obesity, hyperglycaemia, a sedentary lifestyle
and chronic systemic inflammation (4, 96).
2.2 The Economic Burden of Type 2 Diabetes
The continual and rapid growth of T2DM prevalence and related complications and
the associated increased risk of premature mortality associated with this disease is
imposing a substantial burden on national health care budgets globally. In 2015,
healthcare expenditure associated with the treatment and management of this
condition was estimated to be $673 million or 12% of total global health expenditure
(3). By 2040, universal expenditure is estimated to exceed $US802 billion for the
prevention and treatment of diabetes and its complications (3). In Australia, the
Australian Institute of Health and Welfare (AIHW) reported that the total national
healthcare expenditure on diabetes alone in 2008-09 was approximately $1,507
million or 2.3% of total health-care expenditure, placing diabetes 14th out of 200
diseases (97). This value was an increase of 86% from the year 2001-02, with the
largest increase in diabetes health-care expenditure being for hospital admitted
patient services, where diabetes expenditure more than doubled from $300 million to
$647 million (97). By 2051, health care costs are predicted to increase 2.5-fold, due

Chapter 2
Page | 13
predominantly to our ageing population. When including both obesity and physical
inactivity, both risk factors for T2DM discussed in section 2.5, the financial burden
accompanied with treating this disease is set to quadruple over this period (98).
Consequently, there is an urgent need to both prevent and develop better strategies to
manage this condition in Australia and globally.
It is important to note these aforementioned cost estimates are based on calculations
involving direct and non-direct health care costs which are both quantifiable. A
limitation of these estimates is the inability to estimate the indirect or intangible costs
associated with T2DM. This includes pain, anxiety, inconvenience, losses in
productivity in the work force and a reduced quality of life, all of which can have a
significant impact on the lives of people with this disease and their families and
contribute further to the overall economic burden associated with this condition.
Thus, the estimates do not provide a complete picture of diabetes related health
expenditure but do capture approximately 70% of health dollars spent on diabetes as
a disease (97).
2.3 Pathophysiology of Type 2 Diabetes
The pathophysiology of T2DM is complex and typically involves three basic
metabolic defects; insulin resistance, diminished beta-cell functioning and an
increase in hepatic glucose production (99). While there is an ongoing debate
regarding the contributions of each of these factors, and which precedes the other,
there is a general consensus that insulin resistance is the primary defect in T2DM and
is responsible for the impairment in insulin-stimulated glucose metabolism (100,
101). Insulin is the key hormone for regulating plasma glucose levels and
normoglycaemia is maintained by a complex and tightly regulated interplay between
secretion and action of insulin at various target tissues, including skeletal muscle,
liver and adipose tissue (102). In individuals with T2DM, hepatic glucose production
is excessive and remains high when in a post-prandial state, even though
concentrations of plasma insulin can be two to four-fold higher than normal (103,
104). In addition, the ability of endogenously secreted insulin to enhance glucose
uptake at the site of muscle is diminished in these individuals and causes plasma

Chapter 2
Page | 14
glucose levels to remain chronically high with eventual weakened beta-cell
functioning and reduced insulin secretion (103).
Over more recent decades it has become apparent that low-grade systemic
inflammation, closely associated with obesity and insulin resistance, precedes and is
able to predict the development of T2DM (105). Adipocytes, or fat cells, particularly
in those who are overweight/obese secrete a number of pro-inflammatory cytokines
(105). Some of these cytokines are recognised to directly inhibit insulin signalling.
Such an effect has several negative consequences in the human body including an
augmentation and perpetuation of this already low-level of inflammation, a
worsening of insulin sensitivity and can also alter the cardiovascular system with
some cytokines established to result in vasoconstriction, potentially progressing the
onset and development of CVD .
2.4 Defining Pre-Diabetes and Type 2 Diabetes
Type 2 diabetes is diagnosed based on the presentation of chronic hyperglycaemia
resulting from impaired insulin secretion, insulin resistance or both (88). The
intermediate condition between normal glucose tolerance and overt T2DM is termed
pre-diabetes, which includes both IGT and IFG. Diagnosis of pre-diabetes and
diabetes is made by an oral glucose tolerance test (OGTT) and/or fasting plasma
glucose (FPG) assessment. Table 2.1 outlines the diagnostic cut-offs for T2DM and
pre-diabetes as defined by the World Health Organization (WHO) report on the
Diagnosis and Classification of Diabetes Mellitus and adopted by the National
Health and Medical Research Council (NHMRC) of Australia (75, 106). Once
diagnosis of a pre-diabetic condition is made, around 50% of those diagnosed will
progress to develop T2DM within a 10-year period (77, 107). The cut-off values
employed for the diagnosis of T2DM are based on associations with diabetes related
microvascular and macrovascular complications (108-110). For instance,
microvascular risk increases significantly with plasma glucose concentrations ≥7.0
mmol and macrovascular disease risk increases with fasting values ≥7.0 mmol (108,
109, 111).

Chapter 2
Page | 15
Table 2.1: Diagnostic criteria for pre-diabetes and type 2 diabetes. Sourced from Stumvoll et al. (102).
Diagnosis Plasma glucose (mmol/L)
Fasting glucose OGTT HbA1c%
Pre-diabetes
IGT <7.0 and 7.8-11.0
IFG 6.1-6.9 and <7.8
Type 2 diabetes ≥7.0 or ≥11.1 ≥6.5
IGT, Impaired glucose tolerance; IFG, Impaired fasting glucose; OGTT, Oral glucose tolerance test. In recent years, the measurement of glycated haemoglobin (HbA1c), reflective of the
average blood glucose concentration over the previous two to three-month period,
has been recommended as an alternative test to diagnose T2DM. The use of HbA1c as
a diagnostic test has been endorsed by WHO, the IDF and the American Diabetes
Association (ADA) (106, 112, 113). An expert committee established by the
Australian Diabetes Society has recommended that an HbA1c value ≥6.5% be used as
the cut-point for diagnosis T2DM (113). While this cut-point has been derived based
on data showing an association between HbA1c and prevalent retinopathy (114), there
is also evidence that a 1% reduction in HbA1c is associated with a 21% relative risk
reduction (RRR) for any clinical end point or death related to diabetes, 14% for
myocardial infarction and 37% for microvascular complications (109, 115).
However, a recent study that used HbA1c for the sole identification of individuals
with T2DM in population based health surveys failed to identify a substantial
proportion of previously undiagnosed individuals who would be considered as
having diabetes using a glucose-based test (116). These findings highlight the
importance of glucose-based tests for the detection of T2DM when calculating
national and global prevalence of this disease (116).
2.5 Risk Factors for the Development of Type 2 Diabetes
Common risk factors for T2DM include a range of non-modifiable (genetics, age,
gender, ethnicity) and modifiable (obesity, physical inactivity, poor diet quality)

Chapter 2
Page | 16
factors, which can form a complex interaction with one another (Table 2.2) (117). A
brief discussion of some of these risk factors is presented below.
Non-modifiable risk factors
Genetics / Family History While T2DM is often considered a lifestyle-related disease, twin and family studies
estimate that disease risk is increased up to three-fold in those with first degree
relatives with T2DM and five to six-fold in those with both maternal and paternal
disease history (102, 118). A genetic predisposition to T2DM, if present, may be
triggered in the presence of a “diabetogenic” environment such as high-calorie
consumption and a sedentary lifestyle (119, 120). Others have suggested that specific
genes may be implicated in the development of T2DM. At present, 88 genes have
been identified to potentially play a role in the genetic or inbred component of
T2DM risk (121). This genetic heritability remains poorly understood with limited
evidence available on how the identified genes specifically interrelate with
environmental factors that have been linked to T2DM. Thus, it presently remains
impossible to estimate an individual’s risk for T2DM through genetics alone (121,
122).

Chapter 2
Page | 17
Table 2.2: Major risk factors for type 2 diabetes. Adapted from Chen et al. (1).
Non-modifiable risk factors
§ Age greater than 45 years
§ Gender; males at higher risk
§ Ethnicity; Hispanic, Native American, African American, Asian American, or Pacific Islander descent
§ First degree relative or family history of T2DM (e.g. parent or sibling)
§ History of gestational diabetes or delivering a baby with a birth weight of over 9 pounds
§ Polycystic ovary syndrome
Modifiable risk factors
§ Body fat mass
§ High BMI
§ Reduction in lean mass
§ Physical inactivity
§ Poor diet
§ Smoking
§ Previously diagnosed IGT or IFG
§ Low serum 25(OH)D
§ Chronic low grade systemic inflammation
§ Hypertension (>140/90 mmHg) or dyslipidaemia (HDL <1.0 mmol/L for men and <1.3 mmol/L in women or triglyceride level >2.0 mmol/L)
BMI, Body mass index; IGT, Impaired glucose tolerance; IFG, Impaired fasting glucose; HDL, High-density lipoprotein cholesterol
Age Age per se is not a risk factor for T2DM, however, the chances of being diagnosed
increase with advancing age with incidence greatest after 45 years (79). However,
over the last decade there has been a concerning trend for an increasing incidence in
younger adults, and even adolescents, which is likely driven by rising obesity rates
(123).

Chapter 2
Page | 18
Gender The reason males have a greater risk for T2DM has been proposed to be related to
differences in the anatomical distribution of fat relative to females (124-126). Males
have a predisposition to distribute their fat centrally which is a recognised and
independent risk factor for insulin resistance, glucose intolerance and several
cardiovascular risk factors (127-129). In contrast, women tend to store fat
peripherally which has not been found to be strongly associated with such metabolic
defects (126). Other proposed reasons for the gender differences include the effects
of the sex hormones oestrogen and testosterone (126). Oestrogen has been proposed
to have beneficial effects on insulin sensitivity via several possible mechanisms,
including directly effecting insulin and glucose homeostasis, involvement in adipose
tissue metabolism and body composition and/or effects on pro-inflammatory markers
(130-132).
Ethnicity Ethnic differences in the prevalence of T2DM remain well documented (133, 134),
with a higher prevalence (and incidence) observed in Asians, Hispanics and Blacks
compared to Caucasians, even after adjusting for recognised lifestyle factors (133).
In 2001 in Australia, approximately 35% of individuals who reported a diagnosis of
diabetes were born overseas (135).
Modifiable risk factors
Overweight and Obesity There is consistent and compelling evidence demonstrating that excessive body
weight is a major risk factors for the development of T2DM, with 60-90% cases
worldwide directly related to obesity (136-138). In a meta-analysis of prospective
cohort studies which included 18 trials in adults aged 18-80 years (total sample size
of 590,251), it was established that the relative risk of diabetes diagnosis if
overweight and obese was 2.92 (95% CI, 2.57 to 3.32) and 7.28 (95% CI, 6.47 to
8.28), respectively (139), independent of age, family history of T2DM and physical
activity. Additionally, the distribution of adipose tissue has been identified as an
important risk factor for T2DM, with central visceral adipose tissue (VAT) carrying
a greater degree of risk compared to subcutaneous fat distribution (140, 141). This

Chapter 2
Page | 19
has been attributed in part to the fact that VAT releases several bioactive molecules
and hormones, such as non-esterified free fatty acids and several pro-inflammatory
factors, which possesses unique characteristics that negatively influence a range of
metabolic complications and abnormalities, including insulin resistance, glucose and
lipid metabolism, which can lead to endothelial dysfunction, all of which have been
found to directly precede the development of T2DM (142, 143).
Loss of Muscle / Sarcopenia Losses in skeletal muscle are particularly detrimental for people at risk or diagnosed
with T2DM as skeletal muscle is the predominant (~80%) site of glucose disposal
under insulin stimulated conditions and is the major reservoir for glucose storage
(144, 145). It is well established that ageing is accompanied with a natural
progressive decline in skeletal muscle mass, most adults with T2DM appear to
experience this loss in muscle mass, strength and function, termed sarcopenia, at an
accelerated rate in comparison to healthy peers (146-148). Originally, this was put
down to a greater degree of type II muscle fibre atrophy (146, 147) however, others
have shown no difference in muscular myotype between healthy older adults and
those with T2DM (148). Instead, insulin resistance and reduced glycaemic control
both of which are independently associated with muscle loss, are believed to be
responsible (Figure 2.2) (149, 150). Further, several cross-sectional studies have
demonstrated an association between low muscle mass and insulin resistance,
impaired insulin secretion leading to a deterioration in glycaemic control and thus an
increased risk for T2DM, independent of central and visceral adiposity (6, 151-154).
This was confirmed in the third National Health and Nutrition Examination Survey
(NHANES) which reported a 10% increase in skeletal muscle mass was associated
with an 11% reduction in insulin resistance and a 12% decrease in the diagnosis of
pre-diabetes (10).

Chapter 2
Page | 20
Figure 2.2: Common aetiological pathways and the metabolic links shared between
sarcopenia and type 2 diabetes. Adapted from Landi et al. (155).
Physical Inactivity and Sedentary Behaviour Physical inactivity, defined as not meeting the current recommended level of
physical activity, is a fundamental modifiable risk factor for T2DM (156). Physical
inactivity results in reduced energy expenditure, facilitates weight gain and is
associated with abnormal glucose tolerance (157). It can also lead to increased levels
of pro-inflammatory cytokines and promote the development of an atherogenic lipid
and cholesterol profile, termed dyslipidaemia (157-160). Whilst the role of exercise
for the management of T2DM will be discussed in greater detail later in this thesis, a
considerable body of evidence indicates that physically active or regularly exercising
individuals have a 30-50% reduced risk for T2DM compared to their physically
inactive counterparts (157, 161). Further, recent observational and epidemiological
studies strongly suggest that irrespective of physical activity participation, sedentary
behaviour, defined as any waking activity characterised by an energy expenditure ≤
1.5 metabolic equivalents and a sitting or reclining posture, may also be a direct and
independent risk factor for T2DM (157, 162-164).

Chapter 2
Page | 21
Poor Diet Quality A large degree of uncertainty remains concerning specific macronutrients which may
modulate T2DM risk (165, 166), yet previous research reports indicate that Western
type diets, characteristically reflective of heightened consumption of processed,
energy dense foods (i.e. large amounts of red meat, processed meat, high fat dairy
products, sugar-sweetened beverages, sweets and desserts) are associated with
increased prevalence and incidence of T2DM, independent of age, BMI or physical
activity (167-169). Chronic excess energy consumption and increased dietary
saturated and trans fatty acid intake have all been associated with increased T2DM
risk (170-172). As such, nutrition recommendations made by peak health bodies such
as the NHMRC, Diabetes Australia and the ADA, advocate those at risk of T2DM to
reduce total calorie and saturated fat intake, achieve the recommended daily intake
for dietary fibre and consume foods containing wholegrains (166). More specific
details about the role of nutrition for the management of T2DM is discussed in
section 2.8.
Low Serum 25(OH)D A review of longitudinal, prospective and small-scale intervention studies provide
evidence that low levels of serum 25-hydroyxvitamin D (25(OH)D), the main
circulating form of vitamin D, are associated with future T2DM development (173).
In a recent meta-analysis which included 76,220 participants and had 4,996 incident
T2DM, each 10 nmol/L increment in serum 25(OH)D was associated with a 4%
reduced risk of T2DM (linear trend P<0.0001) (174). However, the findings from
several randomised controlled trials (RCTs) have largely found no effect of vitamin
D supplementation on glycaemia or T2DM incidence (22, 65, 175-180). As pointed
out in a recent review, a concrete conclusion cannot be determined from these trials
as the majority were designed for other primary outcomes with T2DM examined
post-hoc (181). More detailed information about the role of vitamin D in the
management of T2DM will be presented in section 2.9.
Chronic Low-grade Systemic Inflammation There is accumulating evidence from both in vitro, in vivo and epidemiological
studies suggesting that chronic low-grade systemic inflammation, defined as a two-

Chapter 2
Page | 22
to four-fold age-related increase in circulating inflammatory cytokines and acute
phase reactants, is implicated in a number of metabolic processes that contribute to
the development and progression of insulin resistance which plays a crucial
intermediary role in the pathogenesis of T2DM (16, 182-184). The quantifiable risk
posed by the presence of inflammation has not yet been confirmed with further
research in this area presently required. The effects of chronic inflammation in those
with T2DM will be discussed in further detail below.
2.6 Prevention of Type 2 Diabetes
Since T2DM is considered to be a lifestyle related disorder, numerous RCTs have
examined whether lifestyle interventions aimed at reducing weight, increasing
physical activity and improving dietary habits can reduce the risk for this disease.
Overall the findings from these studies indicate that T2DM is largely preventable,
even in those at high risk for this condition (27, 86, 185-190). For instance, the
Diabetes Prevention Study (DPP), the largest RCT conducted to date in this area,
randomised 3,234 participants with IGT to one of three interventions: 1) standard
lifestyle and metformin; 2) standard lifestyle plus placebo, or 3) an intensive lifestyle
program for four-years, with re-assessments conducted annually (191). Those in the
standard lifestyle intervention were provided written information on what constitutes
a healthy lifestyle. The intensive lifestyle intervention was goal oriented, with
participants encouraged to achieve at least 150 min/week of moderate-intensity
physical activity and a 5-10% reduction in weight. Participants in this group were
also advised to cease smoking, limit alcohol intake and reduce total and saturated fat
intake. To enhance successful achievement of the above recommendations,
participants were enrolled in a 16-session education program covering topics such as
exercise, nutrition and behaviour modification (191). After a mean follow-up of 3.2
years, there was a 58% relative risk reduction (RRR) in the incidence of T2DM in
the intensive lifestyle compared to standard lifestyle group, which was greater than
the 31% RRR in the metformin group (27, 192). Furthermore, the intensive lifestyle
intervention induced a greater reduction in HbA1c compared to either metformin or
control (27). A number of other RCTs have also reported favourable results with
similar lifestyle interventions (186, 193, 194). Collectively, these findings suggest

Chapter 2
Page | 23
that a lifestyle approach to prevent and manage this disease may be more effective
than pharmacological strategies.
In recent years, several systematic reviews and meta-analyses have examined the
effects of the above lifestyle interventions for the prevention of T2DM. Gillies et al.
(193) aimed to quantify the effectiveness of lifestyle and pharmacological
interventions on the delay or prevention of T2DM in those with IGT. Of the 17 trials
evaluated, seven focused on a combined lifestyle intervention (exercise and diet)
with the remaining ten either focussing on the effects of diet or exercise alone or the
combined effects of these with pharmaceutical agents. The lifestyle interventions
utilised in these seven studies examined the individual and combined effects of diet
and physical activity in comparison to a control group and were all implemented for
greater than six-months. Type 2 diabetes incidence was the primary outcome
measure in all studies included (193). The pooled effect for all types of lifestyle
interventions provided a hazard ratio of 0.51 (P<0.001), indicative of a 49%
reduction in risk of T2DM (193). When considering each intervention separately
(diet, exercise and diet and exercise), there was a similar reduction in risk [hazard
ratios 0.67 (95% CI, 0.49 to 0.92), P=0.013; 0.49 (95% CI, 0.32 to 0.74), P=0.001;
and 0.49 (95% CI, 0.40 to 0.59), P<0.001, respectively] (193). Pharmacological
interventions were also found to be as effective as lifestyle in reducing T2DM
incidence [hazard ratios 0.70 (95% CI, 0.62 to 0.79), P<0.001] (193). However, there
is evidence that the lifestyle interventions may offer a long-term risk reduction in that
they may reduce the incidence of T2DM beyond the active intervention phase (189).
For instance, in a 20-year follow-up of the Da Qing study population, a 43% reduced
risk of developing T2DM was observed in those in the combined intervention
compared to control group (189). In summary, the available evidence suggests that
long-term interventions targeting lifestyle behaviours are safe, feasible, and effective
at reducing the risk for developing T2DM, with the benefits extending beyond just
the intervention period.
The following sections of this literature review will discuss the results of human
intervention studies, with a focus on RCTs, which have examined solely or in

Chapter 2
Page | 24
combination the effects of exercise and/or nutrition modification on glycaemic
control, insulin sensitivity, body composition and cardiovascular risk factors in older
adults with T2DM.
2.7 Exercise for the Management of Type 2 Diabetes
Physical activity is central to the management of T2DM. The contractile muscle
activity associated with regular exercise produces a multitude of physiological,
biochemical and molecular changes within muscle cells which play an important role
in regulating blood glucose levels (195). These metabolic responses associated with
single bouts of exercise, which generally last 24-48 hours, can be translated to long-
term beneficial metabolic adaptations, which are largely ascribed to the accumulative
effects of repeated single-bouts of exercise (196). While it is beyond the scope of this
thesis to discuss in detail all the cellular responses to exercise, in people with T2DM
acute bouts of exercise have been shown to increase glucose transport through the
increase in number of glucose transporter type 4 (GLUT4) proteins and translocation
of these proteins to the muscle cell surface, which results in enhanced regulation,
utilisation and uptake of plasma glucose from the circulation into muscle,
subsequently reducing plasma glucose levels (157). In response to regular exercise
training, the flux through these muscle glucose uptake processes, which are
controlled by several insulin-independent signals generated within working muscles
and which are heavily dependent on levels of circulating insulin, are boosted in
individuals with T2DM (157). Importantly, long-term exercise performance has been
consistently shown to result in favourable effects on FPG, fasting insulin, HbA1c and
low grade systemic inflammation as well as cholesterol, blood pressure and body
composition, all important for the management of T2DM and the prevention or delay
in development of chronic complications (6, 23, 185). Indeed, the current Australian
exercise prescription guidelines for individuals with or at risk of T2DM recommend
a combination of aerobic and resistance training (Table 2.3) (185, 197). These
recommendations are consistent with the recent position statement from the
American College of Sports Medicine (ACSM) (197) and are included in the most
recent Standards of Care for Diabetes Patients published by ADA (198). Despite
these recommendations and the well-established health benefits, there is still some

Chapter 2
Page | 25
controversy surrounding the optimal dose (intensity, frequency, duration) that is most
beneficial for people with T2DM.
Table 2.3: Minimum exercise recommendations for patients with type 2 diabetes. Adapted from Hordern et al. (185).
Type of Exercise Intensity Duration/week Frequency
Aerobic Training (E.g. walking,
running, cycling, swimming)
Moderate 40-59% VO2R or HRR
55-69% HRmax RPE 12-13
OR
210-minutes No more than two
consecutive days without
exercising Vigorous
60-84% VO2R or HRR 70-89% HRmax
RPE 14-16
125-minutes
Progressive Resistance Training
Moderate to vigorous 8-10 exercises
2-4 sets 8-10 repetitions
1—2 min rest intervals
60-minutes (included in totals above)
2 or more times/week
VO2R= VO2 reserve, HRR=Heart rate reserve, HRmax=Heart rate maximum, RPE=Ratings of perceived exertion
2.7.1 Aerobic Training and Type 2 Diabetes
Aerobic or endurance exercise (running, brisk walking, swimming and/or cycling) is
recommended for the management of T2DM due largely to its positive effects on
reducing weight and improving cardiovascular risk factors (8, 199, 200). However,
such programs alone may not be the most efficacious to prescribe to individuals with
T2DM given that as many as 80% are overweight or obese and may suffer from any
number of long-term complications including CVD, impaired mobility or visual
impairment, that may make it challenging for these individuals to reach the required
volume and/or intensity of training to achieve health benefits (201). Additionally,
such training has little effect on lean mass and strength. For instance, some studies
have reported a loss in lean mass following participation in aerobic-type training,

Chapter 2
Page | 26
particularly when combined with weight loss induced by caloric restriction (7, 8).
Since skeletal muscle plays a critical role in glycaemic control and metabolic
homeostasis and accounts for up to ~80% of glucose disposal under insulin
stimulated conditions (145), losses in lean mass can negatively impact metabolic rate
and further compound the problems of insulin resistance and glycaemic control (6,
154). As a result, PRT is included in current exercise guidelines for people with
T2DM because it is widely recognised as a safe and viable mode of training that can
significantly improve lean mass, size and strength in older adults, including those
with T2DM. The following section will provide an overview of the available
evidence regarding the efficacy of PRT for improving glycaemic control, insulin
sensitivity, body composition, inflammation and cardiovascular health in adults with
T2DM.
2.7.2 Progressive Resistance Training and Type 2 Diabetes
2.7.2.1 Effects of PRT on Body Composition
As summarised in Table 2.4, a number of RCTs conducted over a period of 12- to
52-weeks have reported positive effects of PRT on lean mass and/or size, with gains
of up to ~1-2 kg (absolute net differences) reported after some trials (202) and
reductions in fat mass in the range of ~1 kg (12, 157, 202-208). It has been suggested
that the intensity of PRT is one of the most important parameters determining clinical
outcomes including change in weight and fat mass in those with T2DM (209, 210).
Many early resistance training studies which focused on light- to moderate-intensity
circuit type resistance training (50-59% of 1-repetition maximum (RM)) reported
modest or no marked effects on measures of body composition (205, 211). In
contrast, moderate- to high-intensity (≥ 60-80% 1-RM) PRT programs have typically
observed beneficial effects on both fat mass and lean mass (203). For instance, a 16-
week RCT in 62 adults with T2DM (mean ± SD; age 66 ± 8 years) found that thrice
weekly moderate to high-intensity (60-80% 1-RM) supervised PRT resulted in a
mean gain of 1.2 kg (P=0.04) in whole-body lean mass and a reduction of 0.7 kg
(P=0.01) in trunk fat mass in comparison to standard care (no exercise) (203). A
meta-analysis in older adults with T2DM which included 626 adults involved in 12
trials of eight to 12-week duration found that PRT was associated with a mean 1.5%

Chapter 2
Page | 27
reduction in total body fat percentage when compared to baseline (212). Ten of the
12 studies in this meta-analysis prescribed training intensity above 60% of 1-RM
(212). Collectively, the available evidence indicates that PRT programs which are of
moderate to high-intensity appear to be best for improving lean mass and reducing
fat mass in older adults with T2DM. Indeed, most current exercise prescription
guidelines for adults with T2DM recommend PRT programs consisting of 2 to 3 sets
of 8 to 12 repetitions at 50-75% 1-RM and containing 8-10 exercises targeting major
muscle groups of the body with training be performed 2 to 3 times per week (213).

Page | 28
Table 2.4: Summary of the main findings (between-group differences) in RCTs investigating the effects of PRT or the combination of PRT and aerobic training under supervised gymnasium-based settings in older adults with type 2 diabetes.
Reference Subjects Intervention Period,
Intervention and Training Frequency
Training Volume and Intensity Main Results and Adverse Events
PRT Training Alone
Church et al. 2010 (7)
n=262 Age (years) PRT: 56.9 ± 8.7 COMB: 55.4 ± 8.3 AE: 53.7 ± 9.1 CON: 58.6 ± 8.2 Men and women
36-weeks PRT, AE and combination of PRT and AE compared to controls 3 sessions per week
PRT: n=73 2- sets x 10-12 reps upper and lower body; 2 sets x 10-12 reps of 2 core exercises AE: n=72 Treadmill walking 150 min per week at 50-80% VO2 max. COMB: n=76; AE and PRT: PRT 2 sessions per week with only one set of above PRT program completed. CON: n=41 Non-exercise controls.
Fat mass: PRT ↓ 1.4 kg vs CON (P<0.05) Lean mass: PRT ↑ 0.8 kg vs COMB and AE (P<0.05) 21 adverse events with prevalence similar across groups (CON, 3 events; PRT, 8 events; AE, 6 events; and COMB, 4 events).
De Lade et al. 2016 (214)
n=23 Age (years) PRT: 57 ± 12 AE: 54 ± 9 Men and women
20-weeks Comparisons of PRT to AE
PRT: n=11 2-3 sets x 12-15 reps; moderate-intensity (established as 11-13 on the Borg scale of RPE) AT: n=12
No between-group differences in any outcomes including HbA1c, FPG, lipid or cholesterol levels, body weight, height, waist circumference. Lean mass and fat mass not assessed.

Page | 29
40 minutes of cycling, walking or elliptical machine use. Intensity controlled within 60-70% predicted HRmax or by utilising the Borg scale of RPE
No adverse events reported
Plotnikoff et al. 2010 (215)
n=48 Age (years) PRT: 55 ± 12 CON: 54 ± 12 Men and women
16-weeks PRT compared to control. 3 sessions per week
PRT: n= 27; Weeks 1-9 70-85% of 1-RM 3 sets x 10-12 reps Weeks 10-16 70-85% of 1-RM 3 sets x 8-10 reps CON: n=21 Non-exercise controls
HDL cholesterol: PRT ↑ 0.1 mmol/L vs CON (P=0.049) 1-RM muscle strength: PRT ↑ 9.3 kg bench press, ↑ 41.0 leg press, ↑ 12.4 kg upright row vs CON (all P<0.01). Fasting insulin in PRT reduced significantly compared to baseline only. No adverse effects reported.
Honkola et al. 1997 (216)
n=38 Age (years) PRT: 62 ± 2 CON: 67 ± 2 Men and women
20-weeks PRT compared to control. 2 sessions per week
PRT: n=18 Moderate-intensity circuit style PRT (intensity NS) CON: n=20 Non-exercise controls
HbA1c: PRT ↓ 0.5% vs CON (P<0.05) No reported adverse events.
Castaneda et al. 2002 (203)
n=62 Age (years) PRT: 66 ± 2 CONT: 66 ± 1 Men and women
20-weeks PRT performed 3 sessions per week
PRT: n=31 Weeks 1–8; 60–80% of 1-RM Weeks 10–14; 70–80% 1-RM CON: n=31
Lean mass: PRT ↑ 1.2 kg vs CON (P=0.04) HbA1c: PRT ↓ 1% (absolute reduction) vs CON (P=0.01)

Page | 30
Non-exercise controls SBP: ↓ 17.4 mmHg PRT vs CON (P=0.05) No complications or injuries reported.
Cauza et al. 2005 (202)
n=39 Age (years) PRT: 56.2 ± 1.1 AE: 57.9 ± 1.4 Men and women
16-weeks PRT performed 3 sessions per week
PRT: n=22 Moderate-intensity (No % of 1-RM supplied), training targeted towards muscle hypertrophy 3 sets x 10-15 reps AE: n=17 Cycle ergometer at 60% VO2max
HbA1c: PRT ↓ 0.9% vs AE (P=0.04) Blood glucose: PRT ↓ 56 mg/dL vs AE (P=0.002), HOMA-IR: PRT ↓ 3.5 vs AE (P=0.009) TC: PRT ↓ of 78 mg/dL vs AE (P=0.002) Body composition was not assessed. No adverse effects reported.
Dunstan et al. 2002 (12)
n=29 Age (years) PRT: 66.9 ± 5 PRT+WL: 67.6 ± 5 Men and women
24-weeks PRT combined with a weight loss (WL) program compared to sham exercise and WL 3 times per week
PRT+WL: n=16 75-85% 1-RM 3 sets x 8-10 reps plus moderate WL diet WL: n=13 Sham exercise (stretching) plus moderate WL
HbA1c: PRT+WL ↓ 0.8% (absolute reduction) vs WL (P<0.05) Lean mass: PRT+WL ↑ 0.9 kg vs WL No adverse events
Sigal et al. 2007 (8)
n=251 Age (years)
26-weeks PRT: n=64 HbA1c: PRT ↓ 0.38% vs CON (P=0.038)

Page | 31
PRT: 54.7 ± 7.5 AE: 53.9 ± 6.6 COMB: 53.5 ± 7.3 CON: 54.8 ± 7.2 Men and women
PRT, AE and the combination were compared to controls 3 times per week
2-3 sets x 7-9 reps maximal weight that could be lifted (no % of 1-RM training rate supplied) AE: n=60 60-75% HRmax on treadmills and bicycles COMB: n=64 Both the PRT and AE programs completed CON: n=63 Non-exercise controls
Thigh muscle CSA: PRT ↑ 8.0 cm2 vs CON (P<0.001) Four individuals, all in the AE group, withdrew because of adverse events; 38% of exercise group participants and 14% of control reported an adverse event.
Mavros et al. (217)
n=103 Age (years) PRT: 67.1 ± 4.8 CON: 68.9 ± 6.0 Men and women
48-weeks PRT program compared to sham exercise 3 sessions per week
PRT: n=47 80% of 1-RM with concentric explosive force. 3 sets x 8 reps CON: n=53 Sham exercises (no load and no progression)
Mid-thigh muscle CSA: PRT ↑ 5.6 cm2 vs CON (P<0.01) No adverse effects reported
Kwon et al. 2010 (208)
n=28 Age (years) PRT: 55.7 ± 6.2 CONT: 57.0 ± 8.0 Women only
12-weeks PRT compared to controls 3 sessions per week
PRT: n=13 Light resistance building to 40-50% 1-RM (Thera-bands) by week 12 CON: n=15 Non-exercise control group
Lean mass: PRT ↑ ~2 kg vs CON (P=0.007) Fat mass: PRT ↓ ~1 kg vs CON mass (P=0.039) No adverse effects reported.
Jorge et al. 2011 (218)
n=48 Age (years) PRT: 54.1 ± 8.9
12-weeks Comparisons of PRT, AE and combination to controls
PRT: n=12 Whole body program (no intensity or rep information provided)
No differences between the groups for insulinaemic or glycaemic outcomes, blood

Page | 32
AE: 52.1 ± 8.7 COMB: 57.9 ± 9.8 CON:53.4 ± 9.8 Men and women
3 sessions per week AE: n=12 Cycling at a heart rate corresponding to lactate threshold COMB: n=12 PRT interchanged with AE performed at same intensity and half the volume of the AE and PRT groups. CON: n=12 Sham (Light stretching)
pressure or lipid profile. Body composition not assessed. No adverse events reported.
Combination Training
Balducci et al. 2012 (219)
n=606 Age (years) COMB: 59.0 ± 8.9 CON: 61.9 ± 8.0 Men and women
52-weeks Combination of PRT and AE compared to a usual care program. 2 sessions per week
COMB: n=303 AE: 55–70 % of VO2max using a treadmill, step, elliptical, arm, or cycle-ergometer. PRT: 60–80% of 1-RM (no sets or reps information was provided) CON: n=303 Non-exercise (received usual care)
HbA1c: COMB ↓ 0.3% vs CON (P<0.001) Fasting insulin: COMB ↓ 1.18 pmol/L vs CON (P<0.001) HOMA-IR: COMB ↓ 0.36 vs CON (P=0.047) SBP and DBP: COMB ↓ 4.2 and 1.7 mmHg vs CON (both P<0.01) LDL: COMB ↓ 9.6 mg/dL vs CON (P<0.003) HDL: COMB ↑ 3.7 mg/dL vs CON (P<0.001) BMI: COMB ↓ 0.78 kg/m2 vs CON (P<0.001)

Page | 33
Adverse effects related to training were more frequent (not significant) in COMB than in CON subjects.
Cuff et al. 2003 (220)
n=28 Age (years) COMB: 59.4 ± 1.9 AE: 63.4 ± 2.2 CON: 60.0 ± 2.9 Women only
16-weeks Combination of PRT and AE compared to AE and controls 3 sessions per week
COMB: n=10 PRT: Light – moderate 2 sets x 10-12 reps AE: 60-75% heart rate reserve using mixed aerobic equipment (treadmills, bicycles etc.) AE: n=9 60-75% heart rate reserve using mixed aerobic equipment (treadmills, bicycles etc.) CON: n=9 Non-exercise control group
Body weight: COMB ↓ 4.9 kg vs CON (P<0.05) No complications or adverse events reported
Tan et al. 2012 (221)
n=25 Age (years) COMB: 65.9 ± 4.2 CON: 64.8 ± 6.8 Men and women
24-weeks Combination training versus control 3 sessions per week
COMB: n=15 AE: 30 minutes of walking/running intensity controlled within the individualised 55-70% predicted HRmax PRT: 2 sets x 10-12 reps 50-70% of 1RM CON: n=10 Maintenance of daily activities without commencing exercise
HbA1c: COMB ↓ of 0.61% vs CON (P<0.05) % Body Fat: COMB ↓ 2.3% vs CON (P<0.05) Total cholesterol: COMB ↓ 1.35 mmol/L in TC (P<0.001) TG: COMB ↓ 0.83 mmol/L vs CON (P<0.05)

Page | 34
No reported injuries or adverse effects of training
Liu et al. 2015 (222)
n=48 Age (years) COMB: 52.6 ± 11.4 CON: 51.2 ± 11.3 Men and women
12-weeks Combination of AE and PRT compared to controls 3 sessions per week
COMB: n=21 AE: The exercise intensity for each patient set at 40–60% of VO2max. PRT: 50–60% 1-RM CON: n=17 Conventional therapy
HbA1c: COMB ↓ 0.52% vs CON (P<0.001) Postprandial blood glucose: COMB ↓ 1.9 mmol/L vs CON (P<0.01) Postprandial insulin: COMB ↓ 22.6 mmol/L vs CON (P<0.05) TG: COMB ↓ 0.79 mmol/L vs CON (P<0.05) No adverse events reported.
Note-Only significant changes relative to controls (between-group differences) are reported. Data reported as net differences. Age is mean ± SD. Abbreviations: PRT, Progressive resistance training; AE, Aerobic exercise; COMB, Combination of PRT and AE; CON, control; WL, weight loss; CSA, Cross-sectional area; SBP, systolic blood pressure; DBP, diastolic blood pressure; TC, total cholesterol; TG, total triglycerides; ↓ decrease; ↑ increase; HRmax, heart rate maximum; 1-RM, 1 repetition maximum; VO2max, maximal oxygen uptake, RPE, ratings of perceived exertion; NS, not stated

Chapter 2
Page | 35
2.7.2.2 Effects of PRT on Glycaemic and Insulinaemic Outcomes
In those with T2DM there is consistent evidence from RCTs and meta-analyses of
these trials demonstrating that structured and supervised PRT is effective at
improving FPG, insulin sensitivity (HOMA-IR) and HbA1c as shown in Table 2.4
(12, 203, 205, 212, 223-228). Similarly, there is evidence that PRT can improve
glucose disposal rates, increase glycogen storage capacity and increase the number of
GLUT4 receptors on muscle, which is important because glucose uptake by
contracting skeletal muscle occurs by facilitated diffusion, dependent on the presence
of GLUT4 in the surface membrane and an inward diffusion gradient for glucose
(229). Despite these favourable findings, what remains less clear is the specific
characteristics of a PRT program (intensity, frequency and duration) that are most
effective. While it is beyond the scope of this thesis to review all the studies
conducted in this area, the following section will focus on training intensity and its
effects on glycaemic control and insulin sensitivity as as mentioned previously,
training intensity is proposed to be a key influencing factor determining the success
or failure of exercise programs to affect a range of clinically relevant health
outcomes in those with T2DM.
One of the first studies to examine the glycaemic and insulinaemic changes in adults
with T2DM following participation in PRT utilised a supervised low to moderate-
intensity (~50-55% of 1-RM) circuit resistance training program (205). Fifteen
previously sedentary adults (mean age, 51 years) performed supervised circuit
resistance training three times per week for eight-weeks (205). Significant reductions
were observed in both glucose and insulin area under the curve (AUC) in the training
group compared to controls as assessed from OGTT (205). There was no change in
HbA1c, which may be related to the relatively short intervention period of only 8-
weeks and/or the low-moderate training intensity (205). Assessment of HbA1c is best
made at three-monthly intervals due to the long lifespan of red blood cells. In
contrast to these findings, a five-month trial which included supervised modest
intensity PRT (2 sets, 12-15 reps, intensity monitored with the Borg scale) performed
twice per week in 18 adults with T2DM reported a significant net 0.5% absolute
benefits to HbA1c in the training compared to control group (216). However, it is
important to note that there was no change in HbA1c in the PRT group (7.5 ± 0.3% to

Chapter 2
Page | 36
7.4 ± 0.2%), and so the net difference was largely driven by a deterioration in HbA1c
levels in the control group (7.7 ± 0.3 to 8.1 ± 0.3%, P<0.01) (216). The lack of an
improvement in the PRT group in this study may be related to the modest training
dose (twice per week, 2 sets of 12-15 reps) and/or intensity (modest as assessed by
the Borg scale). Based upon the findings presented here and the results of others
(214), low- to moderate-intensity PRT programs appear to have little or no marked
effects on improving HbA1c levels. In a meta-analysis of 23 studies comprising 954
patients with T2DM which aimed to define the characteristics of PRT that might be
most effective for improving glycaemic control, it was reported that there was no
relationship between training intensity and HbA1c reduction (Table 2.5) (228).
However, it should be noted that most of the included trials in this meta-analysis
prescribed similar training programs and intensities (50-80% of 1-RM) and thus there
was potentially not enough heterogeneity between the studies to detect differences.
Several studies have found that high-intensity PRT in which the training load is 75-
85% of 1-RM is safe, well-tolerated and effective for improving HbA1c and insulin
sensitivity in older adults with T2DM (12, 203, 230). For instance, a 16-week RCTs
in 62 older adults with T2DM (mean age ± SE, 66 ± 2 years) compared the effects of
supervised moderate- to high-intensity (60-80% 1-RM) PRT versus standard care on
glycaemic control, FPG and insulin sensitivity (203). Participants allocated to the
PRT program who completed three supervised 45-minute training sessions per week
demonstrated a significant improvement in HbA1c (8.7 ± 0.3% to 7.6 ± 0.2%) when
compared to control (8.4 ± 0.3% to 8.3 ± 0.5%, P = 0.01) (203). Additionally, in
subsequent analysis of this same study insulin resistance (HOMA-IR) was found to
improve in the PRT group (median reduction 0.7%, P=0.05) and deteriorate in the
controls (mean increase 0.8%, P=0.05) (230). No significant change was observed in
FPG or insulin for either group (203, 230). Importantly, of the 62 individuals who
participated in this trial, all but two completed the PRT program with exercise
compliance reported above 90% in the PRT group. This demonstrates that high-
intensity PRT was safe and well-tolerated by older adults with T2DM (203).
In recent years several meta-analyses have investigated the effects of training dose
on measures of glycaemic control and insulinaemic outcomes following PRT in

Chapter 2
Page | 37
people with T2DM (212, 227, 228). While these meta-analyses have consistently
reported beneficial effects of PRT on HbA1c (effects size -0.32 to -0.64), they have
been unable to find any association between training intensity, frequency or number
of exercises performed and an improvement in HbA1c. However, in the meta-analysis
by Ishiguro et al. (228) they reported that completing ≥21 sets of PRT per session
was associated with a greater improvement in HbA1c compared to <21 sets (Table
2.5). While this suggests that the total dose of training may be more important than
the intensity, it is important to note that many of the RCTs included in this meta-
analysis used a similar training frequency (3 sessions per week) and intensity (60-
80% 1-RM), which is what is commonly recommended for adults with T2DM. Thus,
the effects of PRT programs greater than this volume on HbA1c remain inconclusive
(228).
In summary, the literature reviewed above and presented in Table 2.4 suggests that
moderate to high-intensity supervised and structured PRT performed three times per
week is safe, manageable and results in clinically meaningful improvements in
glycaemic control in older adults with T2DM (12, 202, 203, 212, 227, 228). This
aligns with the current physical activity guidelines for individuals with T2DM by
bodies such as the ADA and Exercise Sports Science Australia (ESSA) who
recommend PRT at a moderate- to high-intensity be incorporated into a physical
activity plan and performed at least twice a week, including all major muscle groups
(185, 231).

Chapter 2
Page | 38
Table 2.5: Analysis of effect size for change in HbA1c stratified by characteristics of the PRT program. Adapted from Ishiguro et al. (228).
Program Characteristic
Number of RCTs
Effect size (%) (95% CI)
I2 P-valuea
P-valueb
Intervention Period ≥12-weeks 12 -0.33 (-0.60 to -0.06) 84.9 <0.001
<12-weeks 11 -0.39 (-0.62 to -0.17) 46.5 0.04 0.72
Frequency ≥3-weeks 17 -0.25 (-0.44 to -0.06) 77.8 <0.001
<3-weeks 6 -0.66 (-0.88 to -0.44) 11.7 0.34 0.09
Number of Exercises ≥9 items 10 -0.54 (-0.90 to -0.19) 49.7 0.04
<9 items 13 -0.25 (-0.47 to -0.04) 84.1 <0.001 0.24
Intensity ≥75% 1-RM 10 -0.41 (-0.72 to -0.09) 86.8 <0.001 <75% 1-RM 10 -0.30 (-0.51 to -0.09) 53.3 0.02 0.60
Interval (time between exercises) ≥1.5 min 8 -0.47 (-0.88 to -0.06) 91.3 <0.001
<1.5 min 5 -0.38 (-0.97 to -0.21) 0.0 0.95 0.85
Total sets per session ≥21 sets 10 -0.65 (-0.97 to -0.32) 62.7 0.004
<21 sets 13 -0.16 (-0.38 to 0.05) 79.8 <0.001 0.03
Total sets per week ≥60 sets 14 -0.32 (-0.58 to -0.06) 80.9 <0.001
<60 sets 9 -0.40 (-0.70 to -0.09) 72.6 <0.001 0.09 a P-value for heterogeneity b P-value for difference between strata. 1-RM, 1 repetition maximum; CI, confidence interval; RCTs, Randomised controlled trials.
2.7.2.3 Effects of PRT on Markers of Inflammation
Some, but not all, cross-sectional and longitudinal studies have demonstrated that
regular physical activity, with or without weight loss, can reduce circulating levels of
inflammatory markers (232-235). While the vast majority of interventional research
in this area has focused on the effects of aerobic training or general physical activity,
there is some, albeit limited, evidence that participation in PRT can improve

Chapter 2
Page | 39
circulating inflammatory markers in older healthy adults, with only limited
favourable evidence in adults with T2DM (218, 222, 230, 236-240). For example, 26
overweight/obese older adults (mean aged 61 years) with T2DM who performed
moderate-to-high intensity (60-80% 1-RM) PRT three times per week (236) for 12-
weeks experienced a non-significant 0.52 mg/L reduction in hs-CRP in comparison
to a control program (P=0.189) (236). The lack of significance observed was
proposed to be due to either the lack of fat mass reduction or that the volume of
training required to reduce inflammation is greater than what was prescribed in this
trial. In another trial, the change in IL-6 and hs-CRP was assessed in 102 sedentary
middle-aged and older adults (40-65 years of age) performing either; PRT (n=35, 70-
75% 1-RM) or aerobic training (n=41, 70-75% HRmax) or no exercise (controls,
n=25) for 10-weeks (240). A 3.7% reduction in total body fat mass and a 32.7%
reduction in hs-CRP in the PRT group compared to baseline (P<0.05) was observed
in the PRT group (240). Post-hoc analyses demonstrated there was a trend towards a
difference in hs-CRP in the PRT group compared to the post-intervention aerobic
and control group (P=0.11 and P=0.08, respectively) which authors suggested to be
due to the significant pre-post reduction in percentage fat mass, although a
significant pre-post reduction in percentage fat mass was observed in the aerobic
group without the same trend towards a significant reduction in hs-CRP (240). As
this trial, and the previous study by Kadoglou et al. (236) prescribed similar training
interventions the contrasting results suggest that improvements in inflammation are
likely related to changes in fat mass.
Mechanistically, it has been suggested that reductions in fat mass are required to
reduce inflammatory gene expression in visceral adipose tissue (241, 242). Others
have suggested that the improvements in inflammation following weight loss are due
to a shift in the activity of lipolysis; adipocyte lipolysis is known to increase adipose
tissue inflammation (243). Whilst the mechanism(s) remain undefined, evidence
from some RCTs demonstrate an association between reductions in fat mass and/or
increases in lean mass and improvements in inflammation. In a recent trial in which
older (mean age 68 years) diabetic adults were randomised to 12-months of high-
intensity PRT (80% 1-RM) or a sham exercise program (low-intensity, non-
progressive exercise), performed three days per week (238), it was found that hs-

Chapter 2
Page | 40
CRP levels tended to decrease more in the PRT group when compared to sham
(P=0.087) (238). Further analysis of these results revealed that reductions in hs-CRP
were associated with both increases in muscle mass (r=-0.48, P=0.01) and reductions
in total fat mass (r=0.45, P=0.02) in the PRT group, but not in the sham group (238).
This suggests that the greatest benefits on inflammation may be achieved with
exercise-induced fat loss combined with muscle gain. Despite these positive results, a
limitation of this trial was that they only assessed one inflammatory marker and as
such further studies are needed to not only confirm these results but to also examine
the effects of PRT on other inflammatory markers. Recently, findings from a meta-
analysis of exercise interventions on inflammatory markers that included 14 RCTs in
people with T2DM, three of which included PRT, found that mostly aerobic but
some PRT programs of longer duration or which had a larger number of total training
sessions were associated with the greatest benefits for circulating IL-6 levels (244).
This suggests that the duration and dose of training may play an important role in
improving systemic inflammation (244).
In summary, epidemiologic studies demonstrate that exercise plays a role in reducing
inflammation, and whilst the body of evidence is small from intervention studies in
adults with T2DM, there are some studies which have observed an improvement
which may be explained by the duration or dose of the training program or
concomitant changes in body composition.
2.7.2.4 Effects of PRT on Blood Pressure and Blood Lipids
There is some evidence that PRT can also lower blood pressure in adults with T2DM
(245, 246), although others have also observed no marked benefits (8). For example,
6-months of high-intensity PRT (75-85% 1-RM, 3 sessions per week, 3 sets of 8-10
repetitions) in 29 older (mean age, 67 years) obese (mean BMI, 31.5 kg/m2) adults
with T2DM lowered systolic blood pressure (SBP) and diastolic blood pressure
(DBP) by 6.7 and 4.4 mmHg, respectively (P<0.01) (12). However, since this 6-
month program also involved a moderate weight-loss diet the improvements in blood
pressure may not have been the result of PRT alone. However, 12-weeks of PRT (3
times per week, 60 minutes per session) in 48 older overweight adults (age ± SD 54.1
± 8.9 years, BMI ± SD 30.9 ± 4.1 kg/m2) with T2DM significantly lowered both SBP

Chapter 2
Page | 41
and DBP (10 and 2.5 mmHg, respectively P<0.05) compared to baseline but not
when compared to controls or aerobic or combined aerobic and PRT (218). A recent
meta-analysis of ten RCTs in 403 participants which aimed to determine the effects
of structured PRT on blood pressure changes in adults with T2DM, Figueria et al.
(247) reported that PRT performed on average three times per week ranging from
eight to 26-weeks was associated with significant 4.44 mmHg (95% CI, -6.76, -2.11)
and 2.84 mmHg (95% CI, -3.88, -1.81) (both P<0.05) reductions in SBP and DBP
respectively, compared to controls (247). Sensitivity analysis also demonstrated that
the greatest reductions in blood pressure occurred in those with hypertension at
baseline (247). Analyses of data according to the weekly amount of exercise found
the improvements in blood pressure were greatest when PRT was performed for
more than a total of 150 minutes per week (247).
Dyslipidaemia, like hypertension, is common among those diagnosed with T2DM
and is significantly associated with CVD (93). While there is some evidence that
PRT can have a positive effect on lowering lipids levels in adults with T2DM (218,
248-251), some studies have observed no effect (12, 252, 253). Studies as short as 8-
weeks have demonstrated improvements in triglyceride and/or cholesterol levels
(248) while others have observed long-standing improvements in serum lipids with
training interventions up to 12-months (249). For instance, a study conducted in 236
older men and women (mean age 74 years) who performed 12-weeks of PRT (3
times per week; 3 sets, 6-8 repetitions at 75-80 % of the 1-RM) demonstrated
significant reductions in LDL cholesterol (mean change 0.47 mmol/L), total
cholesterol (mean change 0.67 mmol/L) and triglycerides (mean change 0.14
mmol/L) (all P<0.05). The positive effects of PRT on cholesterol and lipid levels has
been suggested to be due to reductions in cholesterol formation and/or increases in
lipid oxidation via an increase in lipoprotein lipase, although this remains to be
confirmed (249, 254). As stated above, not all studies have observed a favourable
response of PRT on blood lipids. A 6-month trial of high-intensity PRT (3 days per
week, 80% 1-RM) was found not to alter levels of triglycerides, total, LDL or HDL
cholesterol in 16 older adults (mean age ± SD, 67.6 ± 5.2 years) with T2DM who
were also on a moderate weight loss diet (-500 calories/day) in comparison to sham
exercise and weight loss alone (n=13, mean age ± SD, 66.9 ± 5.3 years) or even

Chapter 2
Page | 42
baseline (12). The lack of an effect may have been due to participants presenting
with relative normal lipid levels at baseline and/or the fact that both groups in this
study lost a similar amount of weight and fat mass (12). A recent meta-analysis
which included 12 intervention trials ranging from 8- to 12-months and which
compared aerobic and resistance exercise in adults with T2DM, provided important
clinical insights into cardiovascular health outcomes following such training
programs (212). A total of 422 participants from ten of the 12 trials examined
provided within-group pre-post change data on serum triglycerides and HDL levels
(212). Improvements in serum triglycerides were pooled from aerobic and PRT
interventions and found to be significant [triglycerides −0.33 mmol/L (95% CI
−0.47, −0.18), all P<0.05] (212). Within this meta-analysis pooled data from nine
PRT trials found that this mode of training resulted in significant reductions in both
LDL [mean change: -0.05 mmol/L (95% CI −0.09 to −0.01)] and total cholesterol
[mean change -0.22 mmol/L (95% CI −0.30 to −0.14)] (212).
In summary, there is a growing body of evidence from a number of RCTs and even a
few meta-analyses in older adults with T2DM which report significant beneficial
effects of structured and clinically controlled PRT programs PRT on serum lipids
and blood pressure levels. While the findings from some studies may be confounded
by the addition of weight loss via caloric restriction, these effects appear to be
magnified in those with hypertension and dyslipidaemia at baseline.
2.7.3 Efficacy of Community-Based Resistance Training Programs
Most research examining the health benefits of PRT in people with T2DM have been
conducted in tightly-regulated, structured and supervised clinical exercise
laboratories where both participants and research conditions are highly controlled.
The effectiveness of less controlled community-based training programs on body
composition changes in older adults with T2DM is less clear, but from a public
health perspective it is important to understand just how effective PRT programs are
when undertaken in the community (255). Community settings provide an optimal
avenue for assessing the relevance and applicability of research-to-practice
programs. Intervention studies in older adult’s show that group-based community
exercise programs can increase time spent exercising and frequency of exercise (256,

Chapter 2
Page | 43
257). Furthermore, previous research measuring the economic value of research-to-
practice programs in community settings has found participation in such programs
may reduce total healthcare costs for older adults (24).
In a retrospective analysis of a 24-week community based research-to-practice PRT
program called Lift for Life® (75-85% 1-RM, 3 sets of 8-10 reps performed 3 times
per week), in which training was supervised but performed in small groups (not one-
on-one supervision) in a community setting, 86 adults with or at risk for T2DM
demonstrated significantly lower central obesity following 8-weeks of training [mean
reduction in waist circumference: -1.9cm (95% CI, -2.8 to -1.0)]. By 24-weeks, the
mean reduction in waist circumference -4.9 cm (95% CI, -6.7 to -3.0; P<0.001 for a
time effect) in those individuals (n=36) who completed the full training program
(255). Although this study did not include assessment of other common clinically
relevant outcomes (e.g. HbA1c, lean mass, blood pressure, lipids etc.) these results
highlight that community-based PRT programs, with less supervision than a clinical
exercise laboratory-based trial, may be effective in improving health and body
composition measures in older adults with T2DM.
A recent meta-analysis further supports community-based exercise programs as
effective methods for managing T2DM (23). Pooling 11 studies examining
community-based physical activity interventions, largely performed using exercise
machines or group physical activity education programs, yoga classes, telephone
counselling or motivational techniques with some interventions also based in social-
cognitive theories or interventions that were tailored based on such theories,
demonstrated that such interventions were effective in reducing HbA1c levels (0.32%
absolute reduction) which only approached statistical significance (P=0.06) possibly
because four of the studies included in this meta-analysis reported no change in
HbA1c (23). This meta-analysis further demonstrated that community-based physical
activity programs were also effective in reducing weight and waist circumference
and increasing habitual physical activity levels (23). Collectively, these findings
indicate that community-based physical activity programs can provide important
health improvements in adults with T2DM (23). Additionally, such programs have
been found to be cost-effective for individuals with T2DM and there is also evidence

Chapter 2
Page | 44
of lower health care utilisation in individuals with T2DM who attain minimum
physical activity guidelines (258, 259). Despite this evidence, a number of
unanswered questions still remain in relation to other outcomes of relevance to older
adults with T2DM such as effects on insulin sensitivity, lipids and cholesterol,
inflammation and the longer-term maintenance of such programs over periods of
time greater than 2-months. Further, little is known about the enhanced effect
nutrition may provide in addition community-based PRT interventions on these
aforementioned outcomes.
2.8 Nutrition for the Management of Type 2 Diabetes
Traditionally, nutrition recommendations made by peak medical and/or nutrition
authorities around the world for people with T2DM have recommended a percentage
energy contribution from carbohydrate, fat and protein of 50-60%, ≤30% and 10-
20%, respectively (Table 2.6). In addition, these recommendations suggest
consuming moderate amounts of polyunsaturated fat whilst restricting saturated fat
intake due to the apparent adverse effects on CVD and related outcomes (260-262).
The rationale for such a macronutrient distribution was based on preventing
excessive spikes in chronic and post-prandial glycaemia and improving plasma lipid
profiles to reduce CVD risk (263). While less attention has been given to dietary
protein, there is emerging evidence to support an important physiological role of
dietary proteins and constituent amino acids as part of an overall diet in the
management of T2DM (264-267). However, questions remain as to what proportion
of energy intake should be derived from dietary protein for adults with T2DM. The
following sections will provide an overview that the role dietary protein may play in
modulating important metabolic and physiological health outcomes in adults with
T2DM.

Chapter 2
Page | 45
Table 2.6: Macronutrient recommendations for the management for type 2 diabetes by the British and American Diabetes Association and the American Heart Foundation. Sourced from Ajala et al. (268).
Variable Diabetes UK (262) ADA (260) AHA (261)
Carbohydrate (%) 50-55 50-60 45-55
Fat (%) 30-35 35-35 <30
Protein (%) 10-15 15-20 12-20
ADA, American Diabetes Association; AHA, American Heart Association
2.8.1 High Protein Diets for the Management of Type 2 Diabetes
The following section provides a brief overview of the effects of diets high in protein
(i.e. 30% energy from protein) on glycaemic and insulinaemic outcomes, change in
body composition, triglycerides, cholesterol, blood pressure and markers of
inflammation in older overweight adults and those with T2DM. Subsequent to this
section is a more in-depth discussion about the role and potential health benefits of
protein supplementation (i.e. whey protein) for adults with T2DM.
2.8.1.1 Effects of a High Protein Diet on Glycaemic and Insulinaemic Outcomes
Previous research has shown that short-term diets higher in protein can have
favourable influence on glycaemic measures in overweight adults (265, 269) as well
as those with T2DM (263, 267, 270-272). For instance, in eight men with T2DM
who were randomly assigned to consume a high (30% total energy) or low (15%
total energy) protein diet for 5-weeks there was a 29% (P<0.003) reduction in FPG in
the high protein group by week 5; HbA1c was significantly reduced by week 3 and
22% lower than the low protein group by week 5 (P<0.05) (272). However, longer-
term (at least 12-months) dietary intervention trials examining the effects of
increased dietary protein provide mixed evidence regarding the effects on glycaemic
control in adults with T2DM (273, 274). For instance, a study of 419 adults with
T2DM aged 30–75 years with a BMI >27 kg/m2 who were randomised to
hypocaloric diets of either high protein (30% of energy) or lower protein (15% of
energy) for 12-months found no significant differences in FPG or HbA1c (274).
However, in this study only 6% of the high protein diet group attained the target
protein intake (25% energy from protein) with the remainder consuming < 21%

Chapter 2
Page | 46
energy from protein (274). The authors of this study suggested that the null findings
were likely attributed to the difficulty participants had in achieving the prescribed
protein intake over an extended period. Nevertheless, the findings from a meta-
analysis of nine RCTs ranging in duration from 4- to 24-weeks and including 418
adults with T2DM (mean age 46–63 years and BMI 31–39 kg/m2) revealed that high
protein (25-32% of total energy) compared to normal or low protein (15-20% of total
energy) diets led to significant reductions in HbA1c [mean difference, 0.52% (95%
CI, -0.90, -0.14)] (38). Based on these findings, increasing dietary protein intake may
play a valuable role in optimising glycaemic control in adults with T2DM. Questions
remain as to whether such an approach is feasible and sustainable in the long-term
and, what the optimal dietary protein intake is to achieve clinically meaningful
benefits in glycaemic control.
Dietary protein and specific amino acids, particularly arginine, leucine and
phenylalanine, have also been reported to offer acute insulinotropic effects, a
phenomenon observed in several acute postprandial trials and which has been
observed to occur in older adults with long-standing T2DM (275-277). Whilst the
exact mechanism(s) behind this process have not yet been fully identified, it appears
amino acids promote the secretion of insulin from the pancreatic beta-cell (278-280).
For instance, one study in 60 older adult males with T2DM found that protein (0.3
g/kg) or protein hydrolysate (0.3 g/kg) with co-ingestion of carbohydrate was
associated with a 99 and 110% postprandial increase in insulin in comparison to
carbohydrate ingestion alone, whilst attenuating the postprandial rise in glucose by
22% (281) with other researchers reporting similar observations in acute settings
observing similar in an acute setting (275-277). Despite these positive acute effects
on insulin, the effects of longer-term (≥12-weeks) high protein diets on fasting
insulin and insulin sensitivity in older overweight adults (282-285) and in older
adults with T2DM (286-288) remain mixed. Indeed, several of the studies conducted
to date in those with T2DM are confounded by the incorporation of caloric restriction
which has led to weight loss. For example, in the study by Brinkworth et al. (288) 66
obese adults with T2DM were randomised to a high protein (30% energy) or low
protein (15% energy) diet plus energy restriction for 8-weeks followed by 4-weeks of
energy balance. At the end of the 12-week period the high protein diet resulted in a

Chapter 2
Page | 47
22% reduction in HOMA-IR and a 14% reduction in fasting insulin levels (both
P<0.01) when compared to baseline (288). This reduction was no different to the low
protein group likely explained by the fact both groups lost a similar amount of
bodyweight (288). As there was no high protein diet group without energy restriction
in this trial, the effects of a higher protein diet in the absence of weight loss remains
uncertain in older adults with T2DM. However, recently an improvement in HOMA-
IR independent of weight loss in overweight and obese women without T2DM (mean
age ± SD, 44.0 ± 9.1 years and BMI 37.7 ± 3.4 kg/m2) was observed when
consuming a diet providing 27 and 35% energy as protein. The same improvement in
HOMA-IR relative to baseline was not seen in those consuming only 20% energy
from protein in the same trial (289). In summary, the effects of high protein diets on
fasting insulin and insulin sensitivity/resistance appear to be favourable in older
adults with T2DM yet the studies conducted to date are confounded by the
prescription of caloric restriction to induce weight loss. Further trials are required
which prescribe a high protein diet in the absence of caloric restriction to investigate
whether a high protein diet without weight loss can improve insulinaemic outcomes
in older adults with T2DM.
2.8.1.2 Effects of a High Protein Diet on Body Composition
Dietary protein and its constituent branched chain amino acids have been found to
play an important role in stimulating muscle protein synthesis (MPS) and reducing
muscle protein breakdown (MPB) in both young and older adults (290-292). In
healthy or overweight/obese adults, long-term exposure to such stimuli (protein) has
been shown to preserve and in some instances, increase muscle mass whilst
concomitantly reducing weight and fat mass (293-296). Maintenance of skeletal mass
is of relevance for older adults and those with T2DM because of the important role
muscle plays in insulin-stimulated glucose uptake and storage, as discussed
previously in this review.
There are a number of mechanisms which have been proposed to explain how greater
reductions in fat mass can be achieved on a high protein diet. Explaining at length
many of these proposed mechanisms is beyond the scope of this review. Briefly
however, proposed mechanisms include the thermic effect of feeding which is

Chapter 2
Page | 48
greater in those with T2DM consuming high protein diets compared to low protein
diets (297-299). Additionally, high protein diets have been found to blunt the
reduction in resting energy expenditure commonly observed following weight loss
from an energy restrictive diet in obese non-diabetic and lean populations (300, 301),
but this remains unconfirmed in adults with T2DM and. Furthermore, protein
increases secretion of satiety hormones gastric inhibitory polypeptide (GIP) and
glucagon-like peptide-1 (GLP-1) and reduces secretion of the orexigenic hormone
ghrelin (302-304).
The effects of increased protein on fat mass and total weight reductions in the short
and longer-term appear favourable with reductions from 2 to 9 kg observed
depending on the length of the intervention (38, 264, 267, 305-307). However, the
number of trials of longer duration are limited in older adults with T2DM. A meta-
analysis conducted by Dong et al. (38) comprising nine studies ranging in duration
from 4- to 24-weeks, including 418 T2DM patients (mean age 46–63 years and mean
BMI 31–39 kg/m2) revealed high protein diets (25-32% of total energy) compared to
normal or lower protein (15-20% of total energy) diets lead to greater reductions in
weight [mean difference -2.08 kg (95% CI, -3.25, -0.90)] (38). However, the authors
highlighted the lack of evidence for longer term trials with most of the interventions
examined being ≤ 6-months and thus the long-term efficacy of such diets is not yet
known (38).
Ingestion of protein has been shown in the young, elderly and those with T2DM to
successfully stimulate a MPS response, which in the long-term may translate to
maintenance or enhancement of muscle mass (308-312). However, it has been
suggested that older adults with T2DM may be less responsive to such anabolic
stimuli (313, 314), although recent data indicates that the MPS response to protein is
not impaired in adults with T2DM (308). Ageing muscle also appears to be less
sensitive to lower doses of protein/amino acids, with reductions in lean mass
occurring rapidly with low protein intake, subsequently suggesting older adults with
T2DM may require higher quantities of protein to acutely stimulate an equivalent
MPS response above basal (310, 312). For instance, 17 obese men and women with
T2DM (mean age ± SD, 46 ± 3 years) who followed a low protein diet (15% energy)

Chapter 2
Page | 49
for 4-weeks were found to lose ~1 kg of lean mass (P=0.004) when measured with
bioimpedance, whereas when these same adults (after a 3-week washout) consumed
a high-protein (30% energy) diet there was no loss in lean mass (315). Trials of
longer duration in older adults with T2DM generally corroborate the short-term
findings although the maintenance of such diets appears to falter after a few months.
For example, in a parallel clinical intervention conducted by Brinkworth et al. (306)
58 older (mean age 50.2 years) adults who were hyperinsulinaemic but not diagnosed
with T2DM followed a 12-week energy-restricted weight loss diet either high in
protein (30% energy as protein) or low in protein (15% energy) following this the
high and low protein diet was continued but energy intake was balanced without
restriction (306). Protein intake was significantly greater in the high protein group
during the initial 16 weeks (P<0.001), but decreased in the high protein and increased
in low protein groups during 52-weeks of follow-up (306). Subsequently, there was
no difference between the groups in protein intake at week 68, indicating poor long-
term dietary adherence behaviour to both dietary patterns.
In summary, high protein diets appear to translate to relevant reductions in total body
weight and fat mass in older adults with T2DM. Such diets show promise for
maintaining or enhancing muscle mass, but long term maintenance of these diets
appears to be difficult with marked deviations from prescribed diets evident in some
studies. Long-term maintenance of such diets may be enhanced with the use of a
protein supplement which will be discussed in section 2.8.2.
2.8.1.3 Effects of High Protein Diets on Lipids, Blood Pressure and Markers of Inflammation
Higher protein diets, with a low intake of fat, have been associated with
improvements in blood lipids, blood pressure and to a smaller degree inflammation
in overweight/obese adults with limited evidence in adults with T2DM (267, 306,
316). Proposed mechanisms for improvements in serum lipids include increased
hepatic bile acid synthesis (317, 318), enhanced faecal sterol excretion (319, 320),
decreased hepatic de novo cholesterol biosynthesis (319, 321) or reduced uptake of
cholesterol through reductions in LDL receptor activity (321-323). The interactions
between protein-digested products (bioactive peptides) and gut hormones including

Chapter 2
Page | 50
GLP-1 are thought to drive blood pressure improvements (324) with an attenuation
in adipose tissue oxidation and inflammatory responses or suppression of
inflammatory synthesis pathways to drive improvements in inflammatory factors
(325).
Studies in older adults with T2DM examining the effects of high protein diets on
lipids, blood pressure and inflammatory cytokines remain limited. In the 64-week
trial in obese older adults with T2DM conducted by Brinkworth et al. (306)
discussed above, the high protein weight reduction diet led to a significant reduction
in plasma level of hs-CRP (baseline vs 64-weeks; 5.0 ± 1.0 vs 3.8 ± 0.8 mg/L,
P<0.05). Those in the higher protein group also had greater improvements in blood
pressure plus total and LDL cholesterol however, like inflammation these
improvements were not different to those on the low protein diet, possibly explained
by the similar amount of weight lost in both groups (306). In the meta-analysis by
Dong et al. (38) discussed in section 2.7.2.3 of this review, the pooled treatment
effects found high protein diets did not alter triglycerides, total, HDL or LDL
cholesterol, but there was a trend for an improvement in SBP (-3.13 mmHg (95 % CI
-6.58, 0.32) P-value not reported) and DBP (-1.86 mmHg (95 % CI -4.26, 0.56) P-
value not reported) (38). Further, in another more recent systematic review and meta-
analysis of nine RCTs ranging from six to 36-weeks in duration with participant
numbers from 20 to 190 obese, hypertensive adults largely with metabolic syndrome,
no significant effect of higher protein diets on circulating levels of hs-CRP were
observed. However, the authors noted that their results were limited by considerable
heterogeneity across all included trials (326). Differences in trial duration and the
level of professional (i.e. dietetic) support made available to participants as well as
differences in the macronutrient composition of the diets make any conclusions about
the effects of high protein diets on blood lipids, blood pressure and/or inflammation
difficult with further research required.
2.8.1.4 Potential Problems with Prescribing High Protein Diets
Whilst many of the trials presented above provide support for a beneficial role of a
high protein diet for the management of T2DM and improvement of cardiovascular

Chapter 2
Page | 51
risk factors, there remains insufficient data to conclusively recommend such a diet.
Conducting large scale RCTs which control for macronutrient content are habitually
difficult to implement and adherence to dietary recommendations is rarely sustained
(327). Such interventions typically require participants to follow prescribed meal
plans which over an extended period of time can become tedious and burdensome,
often leading to high dropout rates and poor adherence to the prescribed diet (286,
307). In addition, adherence often relies on self-reported dietary intake, which in
obese and T2DM populations may not be appropriate as under-reporting of food
intake is widely acknowledged to occur in these groups (328). To account for these
issues, the use of a protein supplement may be a more appropriate strategy to
increase dietary protein intake and to encourage greater compliance, particularly over
a longer period of time.
2.8.2 Protein Supplements for the Management of Type 2 Diabetes
Protein supplements can be broadly categorised according to their nutrient profile as
providing protein as a single source protein or as a multi-ingredient supplement i.e.
protein and carbohydrate. For example, whey protein derived from milk is one such
example of a single source protein; others include casein, soy, pea or egg protein. Of
all single source protein supplements available, whey protein has received the
greatest amount of attention due to its high nutritional value as it contains all
essential amino acids, it is rapidly absorbed compared to other sources of protein like
casein, and has been shown to have positive effects on insulin secretion, lowering the
postprandial glycaemic response and stimulating MPS (329, 330). The evidence
available for these effects is discussed in greater detail below (329, 330).

Chapter 2
Page | 52
Figure 2.3: Protein fractions and types of whey protein derived from whole milk.
Whey proteins are derived from whole milk and are a by-product of cheese and curd
manufacturing (Figure 2.3) (331). Several advancements in processing technology
such as ultrafiltration, microfiltration, reverse osmosis and ion-exchange have
resulted in development of several different whey products (331). These condensed
products include whey concentrate, isolate and hydrolysate (332, 333). These
condensed forms of whey protein preserve the favourable components such as the
protein and amino acid content whilst reducing other components such as fat and
lactose, Table 2.7 describes these various whey protein products (333, 334). Whey
protein concentrate contains approximately 35-80% protein, with the remainder
consisting of fat, lactose and minerals (331). Whey protein isolate contains
approximately 85-90% protein and minimal fat or lactose (331). Both whey protein
concentrate and isolate are manufactured from whey using ultrafiltration, spray
drying and evaporation techniques (335). Whey protein hydrolysates are peptides
derived from hydrolysing the proteins in whey in a process that includes their
fermentation with proteolytic enzymes (336). Both whey protein isolate and
hydrolysate are more expensive in comparison to whey protein concentrate, which is
an important consideration should whey protein supplements be made commercially
available as a nutritional approach for the management of T2DM.

Chapter 2
Page | 53
Mortensen et al. (337) observed the first phase insulin response (assessed from AUC)
to be greater after whey protein hydrolysate consumption in comparison to other
types of whey protein including whey isolate and mixed whey products (whey
protein plus alpha-lactalbumin and whey protein plus casein), when consumed with a
high fat/carbohydrate meal. However, whey protein hydrolysates, have been found to
be less palatable than whey concentrate or isolate, detracting from their potential
therapeutic use (332). Further, the available data to date indicates that over the long-
term there is no convincing evidence that one form of whey protein can stimulate
insulin secretion or has better glycaemia lowering effects than another (332).
Therefore, whey protein concentrate which is more cost-effective for a consumer,
combined with its enhanced palatability and beneficial health properties, is most
commonly used.
Table 2.7: Types of commercially available whey protein. Adapted from Marshall et al. (331).
Product Description Protein Concentration Fat, Lactose and
Mineral Content
Whey Protein Concentrate
Most commonly available as 80%. Can range from 25-89%
Some fat, lactose, and minerals. As the protein concentration increases, fat, lactose, and mineral content decreases.
Whey Protein Isolate
90-95% Little if any
Whey Protein Hydrolysate
Variable hydrolysis used to cleave peptide bonds. Larger proteins become smaller peptide fractions. Reduces allergy potential of whey protein.
Varies with protein concentration
As mentioned above, whey protein supplements have received considerable attention
largely because of their role in stimulating MPS which may help to preserve or
increase muscle mass (338-340). Their use as a functional food in the management of
chronic diseases including T2DM has also begun to receive considerable attention. A
growing number of studies in adults with T2DM highlight that whey protein

Chapter 2
Page | 54
supplementation can have insulinotropic and glycaemia lowering effects (341-343).
Studies in healthy and/or overweight and obese adults have also demonstrated that
whey protein can enhance thermogenesis, aid in satiety and reduce subsequent
energy intake, which may be of value in supporting an energy deficit to facilitate
weight loss (344-348). Whey protein is also a more robust stimulator of MPS and has
been found to be more effective than other protein sources such as casein and soy
(340, 349). Others have shown that whey protein can have beneficial effects on blood
pressure, vascular function, inflammation, lipids and lipoproteins levels (333, 346,
350). Collectively these findings indicate that whey protein may have an important
role in managing weight, muscle mass and cardiovascular health in older adults and
those with T2D, but the longer-term effects of whey protein in older adults with
T2DM on these aforementioned outcomes has received less attention. The following
section will provide an overview of the effects of whey protein on weight
management, glycaemic control and insulin sensitivity, markers of inflammation,
serum lipids and cholesterol and blood pressure in individuals with T2DM. Where
possible this review only included studies or interventions that were conducted in
older adults diagnosed with prediabetes or T2DM.
2.8.2.1 Effect of Whey Protein on Weight and Fat Mass
Long-term whey-protein supplementation in older overweight/obese adults has been
associated with reductions in fat mass and total body weight (351-356). However, the
findings from some of these studies are confounded as some included caloric
restriction or included a low-fat dietary component (352). Nevertheless, in one 23-
week intervention trial in which 73 older overweight (mean BMI 31 kg/m2) adults
followed an ad-libitum diet and were randomised to one of three supplements (whey
protein or soy protein both containing 26 g/serve of protein or an isoenergetic
carbohydrate supplement consumed twice daily – breakfast and lunch), Baer et al.
(353) reported that those who consumed the whey protein supplement had a mean
1.8 kg and 2.3 kg significantly lower total body weight and fat mass than the
carbohydrate group at the completion of the study, respectively (both P<0.006)
(353). Lean mass did not differ between groups (353). In contrast, a 12-week
intervention in 45 middle-aged overweight (mean ± SD, BMI 32.1 ± 3.0 kg/m2) men
who consumed either 65 g of whey protein (80% WPC) or 60 g of soy protein isolate

Chapter 2
Page | 55
30-minutes prior to their largest meal of the day (midday-meal) found that there was
also a greater reduction in total body weight (6.4 ± 1.1 kg versus 3.5 ± 0.3 kg,
P=0.008) and percentage body fat (9.2 versus 3.1%, P<0.001) in the whey protein
compared to soy group after 12-weeks (355). The differences in magnitude of
reductions in weight and fat mass when comparing these two trials may have been
due to the greater single bolus of protein consumed in the second study compared to
the first or as will be discussed below the effects on satiety of the two different doses
of protein.
The mechanism(s) proposed for the greater reductions in body weight and fat mass
from whey protein compared to soy protein (and other sources of protein) might be
due to differential effects among protein sources on energy intake or body weight
regulation (353). For instance, and drawing upon the two previous studies discussed
above, the first study, unexpectedly observed a greater increase in serum grehlin
levels, a hormone which serves as a hunger signal and has been found to strongly
increase food intake (353, 357). This could explain the smaller reduction in body
weight and fat mass compared to the second study where a significantly greater
reduction in total calorie intake in the whey compared to soy protein groups was
observed (355). Suggesting that the whey protein had a more profound effect on
appetite suppression (355). Reductions in energy intake following whey protein
supplementation have previously been observed (348, 358) and are believed to be
associated with the ability of protein or amino acids to elevate peripheral
concentrations of the anorexogenic hormones glucagon-like polypeptide-1 (GLP-1),
and cholecystolinin (CCK), the satiety related gastrointestinal hormones (348, 354,
359, 360). No studies have specifically examined the independent effects of whey
protein on body composition in adults with T2DM.
2.8.2.2 Effect of Whey Protein on Lean Mass
With advancing age, rates of MPS in response to an anabolic stimulus such as
physical activity and food consumption decline, which contribute to age-related
losses in skeletal muscle mass (275, 361). It is well established that the balance
between MPS and MPB largely determines any loss or gain in muscle mass.
Maintenance or gains in muscle mass occur as a result of a net positive protein

Chapter 2
Page | 56
balance, which is largely determined by consumption of an adequate dose of protein
and/or exercise (361-363). There has been extensive research into determining the
optimal type, dose, timing and distribution of protein intake for muscle health, and it
appears that doses of whey protein <15 g are largely ineffective at stimulating MPS
in older adults. In contrast, a number of acute studies have shown that doses of 20-40
g of whey protein increases MPS compared to basal (51, 312, 339, 364). For
instance, in a study of 33 healthy older men (mean age ± SD, 73 ± 2 years) who were
randomised to receive either a 10, 20 or 35 g single bolus of whey protein, Pennings
et al. (364) reported that consumption of a 20 and 35 g dose of whey protein resulted
in the greatest increase in whole body MPS compared to the 10 g dose (P<0.01);
there was no differences between the 20 and 35 g doses (364). Since a similar dose of
whey protein has been found to provide an additive effect on the acute MPS response
when older adults perform PRT, a dose of 20-40 g of high quality protein (e.g. whey)
is likely to provide the greatest MPS benefits to older adults (51). The additive effect
protein has on an acute MPS and over the longer-term on lean mass will be discussed
in section 2.11.
In addition to the dose of protein, the amino acid content of a protein bolus or
supplement is integral to whether it is effective at eliciting an anabolic response (47,
363). The MPS effects of whey protein are largely believed to be due to the high
leucine (~10%) and other branched chain amino acid content along with its fast-
digestion rate (275, 365, 366). Leucine is reported to be the key regulator of muscle
protein metabolism as it possesses the power to activate the mammalian target of
rapamycin (mTOR) pathway which is necessary for cellular protein synthesis
regulation (367, 368). Older adults appear to require a leucine dose of ~2-3 g to
initiate MPS (361). This has been termed the ‘leucine threshold’ or ‘trigger’ point
(39, 369). Importantly, leucine provided alone appears to be ineffective in promoting
an anabolic muscle response whereas leucine co-ingested with other amino acids, as
is the case in whey protein, enhances the postprandial MPS response (370).
Randomised controlled trials which have investigated the long-term (>12-weeks)
effects of whey protein supplementation alone on muscle outcomes in older adults
have produced conflicting results (41, 371, 372). This may be explained by

Chapter 2
Page | 57
differences in population groups (e.g. older adults, older obese middle-aged adults,
elderly, sarcopenic) examined or differences in the methodological prescription of
the whey supplement (as a pre-meal, pre-load or once or multiple times/day). For
example, in a multi-centre 18-month RCT, 106 older adults (~70 years) were
supplemented with 45 g/day of whey protein with another 102 older adults provided
with a maltodextrin control supplement (41). Baseline protein intakes were self-
reported to be between 0.6 to 1.0 g/kg/day (41). Following the 18-month intervention
a significant between-group difference was observed for the change in total body
lean mass in favour of the whey protein supplemented group (0.33 kg, P<0.05) as
assessed via DXA (41). However, two other studies investigating the effects of whey
protein supplementation alone on muscle mass have failed to observe any beneficial
effects (371, 372). In a two-year randomised, double-blind, placebo controlled trial,
elderly post-menopausal women aged 70-80 years (mean 74.3 ± 2.7 years) were
randomly assigned to either a daily high protein drink containing 30 g of whey
protein (n=109) or a placebo drink containing only 2.1 g of whey protein (n=110)
daily (371). At both 1- and 2-years follow-up there were no differences between the
groups and no within-groups changes for total body or appendicular lean mass
(ALM) (371). The authors proposed that the null effect was due to participants
baseline protein intakes being quite high at 1.2 g/kg/day. This theory is supported by
the results of another RCT where protein replete well-nourished older individuals
(mean baseline protein intake >0.8 g/kg/day) experienced no gain in total body lean
mass following whey protein supplementation (28 g) twice/day for 23-weeks (353).
Based on this limited evidence, it appears that the effectiveness of a daily whey
protein supplement to improve muscle mass or prevent loss in healthy older adults is
limited and may depend on the existing habitual protein intake (371).
The timing or spread of whey supplementation throughout the day combined with the
habitual protein intake are also important considerations for maximising gains in lean
mass in older adults. Indeed, there is emerging research that a more uniform pattern
of protein consumption throughout the day (i.e. doses of ~20-30 g protein consumed
at breakfast, lunch and dinner) may allow for greater optimisation of the postprandial
MPS response translating to positive effects on lean mass (373-376). While the
current evidence from long-term human intervention trials is limited, a study in 80

Chapter 2
Page | 58
mobility-limited older adults (aged 70 to 85 years) randomised to consume two
serves of 20 g of whey protein/day or an isocaloric control supplement whilst
performing high-intensity PRT three times per week for 6-months found whey plus
PRT increased lean mass by 1.3% and muscle cross-sectional area (CSA) by 4.6%
compared to baseline (377). Whilst the magnitude of change in these muscle
measures was greater than that observed in the control group (0.6% and 2.9%,
respectively) there was no significant difference observed between the groups (377).
Which was suggested to be due to changes in dietary protein intake from ad-libitum
foods during the 6-months, as when taking into consideration the compliance with
the supplement the increase in protein intake averaged only 18 g/day (377).
In summary, there is consistent evidence showing that acute ingestion of whey
protein and the essential amino acid leucine, particularly at a dose of 20-40 g (2-3 g
leucine) are key factors in stimulating MPS in older adults. However, the findings
from trials investigating the long-term effects of daily whey protein supplementation
on lean mass remains mixed. Furthermore, there is little or no research into the long-
term effects of whey protein on body composition in older adults with T2DM.
2.8.2.3 Effect of Whey Protein on Glycaemic and Insulinaemic Outcomes
Nutritional strategies which effectively stimulate early phase and long-term insulin
secretion in those with T2DM may serve to improve daily and long-term glycaemic
control. Several acute studies and to a lesser extent longer-term intervention trials
have shown that consumption of whey protein has a positive effect on improving
insulin secretion, insulin sensitivity and postprandial glucose levels (52, 337, 341-
343, 351, 378, 379), but questions remain with regard to the optimal type and dose
required. Further, the degree of improvement in these outcomes from the available
literature is inconsistent, largely explained by methodological differences between
the studies. For instance, of the studies conducted some have used different delivery
methods (as a pre-load to a meal or as a stand-alone supplement), a wide range of
whey protein doses (4.5 to 50g) and different forms of whey protein (concentrate,
isolate, hydrolysate).

Chapter 2
Page | 59
Whey protein consumed as a pre-load to a meal or consumed in conjunction with a
meal is established to have an insulinotropic effect (52, 337, 343, 379). Whey protein
has also been found to confer glucose-lowering effects in those with T2DM (379).
For example, 15 individuals with well-controlled T2DM, consumed on two separate
days either a whey protein drink (50 g mixed with 250mls of water) or placebo
(250ml of water), followed by a standardised high glycaemic-index breakfast (379).
The AUC in serum glucose immediately following breakfast (0-30 minutes) was
significantly lower in the whey than placebo group (Figure 2.4) (379). Similarly
spikes in plasma glucose levels were significantly lower during the 60- to 120-
minute period and for the overall measured period (154 ± 8.5 vs 213.6 ± 13.8
mmol/L x min P=0.001) (379). Conversely, insulin levels were significantly higher
during the postprandial early insulin release phase (0-30 minutes), remained higher
and increased more rapidly in the whey group compared to the placebo pre-load for
the entire post meal intervention as shown in Figure 2.4 (379). This study
successfully demonstrated that a whey protein pre-load reduces both the peak and
AUC for post meal glucose which was associated with a rapid and significantly
enhanced early and late postprandial insulin response in adults with T2DM (379).
Doses of whey protein ranging from 17 g to as high as 55 g have also been found to
offer similar effects on glucose and insulin levels (52, 337, 343). Collectively these
studies highlight that a pre-meal dose of protein may be optimal for those with
T2DM to improve daily insulin and glucose parameters.
Figure 2.4: The serum glucose and insulin responses to a high-glycaemic index breakfast meal following a whey protein (white circles) or placebo (black circles) pre-load in 15 participants with type 2 diabetes. Sourced from Jakubowicz et al. (379). Values are means ± SEM. *p<0.05 vs placebo for the same time point.

Chapter 2
Page | 60
The acute insulinotropic properties of whey protein are believed to be due to the
branched chain amino acids present in whey which exert direct effects on stimulating
pancreatic beta-cells to produce insulin (53, 275). In addition, the amino acids and
bioactive peptides present in whey may facilitate the rise of the incretin hormones
gastric inhibitory peptide (GIP) and GLP-1, which both exert strong insulinotropic
effects (380). In fact, following a bolus of oral glucose, approximately two thirds of
the plasma insulin response can be attributed to the effects of GIP and GLP-1 (332).
The incretin hormone GLP-1 is also recognised to play a role in the management of
postprandial glycaemia in adults with T2DM largely through its effects on slowing
gastric emptying (380, 381). Delayed gastric emptying reduces postprandial
glycaemic increases whereas rapid gastric emptying has the opposite effect (381).
The results of acute studies demonstrating beneficial effects on both insulinaemic
and glycaemic outcomes has led some researchers to propose that whey protein
supplements should be considered as a long-term management strategy in adults with
T2DM.
At present, there is limited data from intervention trials with regard to the long-term
effects of whey protein on insulin sensitivity and HbA1c in adults with T2DM (341).
Seven older overweight/obese adults (mean age and BMI ± SEM, 60 ± 2 years and
31 ± 2 kg/m2) were randomly assigned to consume a chocolate-flavoured whey
protein pre-load (100 ml water with 25 g whey protein) or placebo (25 g chocolate-
flavoured ‘diet’ sauce), 30-minutes before each main meal for 4-weeks, followed by
a 2-week washout, and then the alternative pre-load for 4-weeks (341). At the start
and end of each treatment period participants were provided the meal pre-load
following by a high glycaemic index breakfast meal with the glucose response
measured for next 240 minutes (341). Following the 4-weeks of whey protein pre-
load, postprandial blood glucose was lower after whey compared to placebo (P<0.05)
(341). However, HbA1c was not changed from baseline or different between the
groups likely explained by the short intervention period. In overweight and obese
adults, the effects of longer-term whey protein supplementation on insulin outcomes
show some promise. For example, Pal et al. (351) investigated the effects of a twice
daily whey protein supplement (27g of protein per drink) on insulin and glucose
parameters in 89 overweight and obese women (BMI ± SEM, 31.3 ± 0.8 kg/m2) in

Chapter 2
Page | 61
comparison to a supplement containing either casein (27g of protein per drink) or
glucose control (27g of glucose per drink) over a period of 12-weeks (351).
Participants were asked to consume these drinks 30-minutes prior to a breakfast and
an evening meal (351). At the end of the 12-week period fasting plasma insulin
levels and HOMA-IR were decreased by 11% and 10%, respectively, in the whey
protein group compared with baseline (P=0.012 and P=0.046, respectively) which
was significantly different from the change in the controls (between-group difference
P=0.049 and P=0.034, respectively) (351). Fasting plasma glucose and HbA1c were
not assessed. Importantly, the benefits were independent of changes in body
composition (including visceral fat). However, further studies are required to
determine why acute consumption of whey protein, as a pre-meal supplement, can
have insulinotropic effects but in the long term can decrease plasma insulin levels yet
improve insulin sensitivity (351).
Despite the overwhelming evidence for the positive effects of whey protein on
insulin and glucose levels in adults with T2DM in an acute setting, and some
evidence for beneficial effects in the longer-term in overweight/obese adults, there
remains no long-term intervention trials which have examined if these same benefits
can be observed in adults with T2DM, with a clear need for these interventions to be
performed.
2.8.2.4 Effect of Whey Protein on Markers of Inflammation
According to Hayes et al. (382) bioactive peptides from milk and present in whey
protein which have an impact on the human body can be categorised into anti-
hypertensive, anti-thrombotic, anti-microbial and even immunomodulatory Further,
whey has been identified to have anti-oxidant and potentially anti-inflammatory
properties (383). Whilst limited evidence exists, a mechanism by which whey protein
may positively alter anti-oxidant or anti-inflammatory levels includes inhibiting
angiotensin-converting-enzyme activity (329, 384, 385). It has also been suggested
that the peptides in whey along with specific proteins including α-lactalbumin may
inhibit the production of several inflammatory cytokines including TNF-α and IL-6
(386, 387).

Chapter 2
Page | 62
To the best of my knowledge there are no studies which have examined whether
whey protein is able to modify levels of circulating inflammatory markers in adults
with T2DM. Of the studies conducted in healthy adults, only a few small studies
have demonstrated an improvement in levels of inflammation (as assessed from hs-
CRP) following whey supplementation in an acute (388, 389) or chronic (one month)
setting (390). For example, in a randomised, crossover trial, 11 obese non-diabetic
subjects (aged: 40-68 years, BMI: 30.3-42.0 kg/m2) were provided a fat-rich mixed
meal supplemented with 45 g of one of four proteins (cod, whey isolate, gluten or
casein) with blood samples collected for 4-hours during the postprandial phase (388).
Notably, a significant reduction in AUC of the inflammatory marker chemokine
ligand 5 was observed following the whey protein supplemented meal when
compared to the casein and the cod supplemented meal, but not the gluten meal
(P<0.05 for both) (388). The inflammatory marker chemokine ligand 5 has been
observed to be positively related to the development of T2DM, and has also been
implicated in the onset and progression of atherosclerotic heart disease (388, 391).
No significant differences between meals were observed for other inflammatory
cytokines including adiponectin, macrophage inflammatory protein-1β, platelet-
derived growth factor and IL-1ra (388). Whilst providing some positive evidence for
an anti-inflammatory effect of whey protein, this study was acute and only small in
design and whilst participants were obese they were otherwise healthy.
Studies which have used older adult populations or population groups with metabolic
conditions also provide mixed evidence for the effects of whey protein on
inflammation. Only four small RCTs have examined the effects of whey protein on
inflammation in older adults, with considerable variation among the populations
studied making conclusions difficult (one in healthy active older adults, two with
stable chronic obstructive disorder and one recruited hospitalised stroke patients)
(386, 392-394). Of these four studies, two demonstrated a favourable effect of whey
protein on various markers of inflammation (e.g. hs-CRP, IL-6, IL-8, and TNF-α)
(386, 392), whereas the other two observed no benefit (393, 394). Studies among
adults with obesity or other metabolic conditions have mostly reached the same
conclusion, that is, whey protein intake was not associated with a decrease in serum
hs-CRP levels in individuals with obesity (285, 384), hypertension (395) and even
metabolic syndrome (396). The reasons for this lack of effect may have related to a

Chapter 2
Page | 63
range of factors, including limited follow-up periods, small sample sizes or even the
composition of the whey supplements provided to the intervention groups (397).
A recent meta-analysis including nine RCTs in adults aged 48 to 77 years ranging
from four to 36-weeks and sample sizes of 20 to 190 investigated the inflammatory
mediating effects of whey protein (326). Of these nine trials, six were conducted in
adults with prehypertension, mild hypertension, chronic obstructive pulmonary
disease or metabolic syndrome (326). Whilst there was considerable heterogeneity in
the design of these trials and the dose of whey protein prescribed (doses ranged from
0.7 to 60 g/day), the meta-analysis concluded that there was not enough evidence to
support the hypothesis of an active modulation of inflammation by whey protein in
adults (326). However, sub-group analysis in those who presented at baseline with
serum levels of hs-CRP ≥ 3 mg/L, which is often reported in adults with T2DM
(398), found that whey protein had a small yet non-significant effect in reducing hs-
CRP (326). Whether long-term whey protein supplementation can reduce markers of
inflammation in older adults with T2DM, particularly in the presence of increased
inflammation, remains to be determined.
2.8.2.5 Effect of Whey Protein on Serum Lipids and Blood Pressure
Human and animal models suggest that whey protein may favourably alter serum
lipids and cholesterol and improve blood pressure (319, 384, 399-402). Biologically
plausible mechanisms by which whey protein may improve these measures include
the promotion of hepatic lipid metabolism, inhibiting the absorption of fatty acids
and cholesterol in the intestine and increasing the excretion of faecal sterol (403).
Evidence from in vitro studies demonstrates the bioactive peptides found in whey
protein are effectively able to inhibit enzymatic angiotensin converting enzyme
(ACE) activity (404), which is a rate limiting step in the conversion of angiotensin I
to angiotensin II and is responsible for vasoconstriction therefore playing a role in
hypertension (405).
There is limited evidence for the independent effects of acute or chronic whey
protein supplementation on blood pressure with no studies conducted in adults with
T2DM. However, studies in young normotensive and hypertensive overweight adults

Chapter 2
Page | 64
have investigated such effects over acute (385) and chronic settings (351, 406) with
conflicting results. For example, 12-weeks of whey protein supplementation (27 g
twice/day) in 70 overweight (BMI ± SEM, 31.3 ± 0.8 kg/m2, mean age ± SEM 48 ±
1.9 years), normal and hypertensive men and women improved blood pressure when
compared to a baseline (SBP; 119.3 ± 3.2 mmHg vs 114.5 ± 3.1 mmHg; P=0.020 and
DBP; 64.1 ± 1.9 mmHg vs 62.0 ± 1.7 mm Hg; P = 0.038) (384). Compared to
controls there was a greater reduction in DBP at 12-weeks (384). In contrast, in
young (~20 years of age) men and women 28 g/day of either hydrolysed or non-
hydrolysed whey protein over 6-weeks had no effect on SBP or DBP (406).
However, when subgroup analyses were performed in those with elevated SBP (≥120
mmHg) and DBP (≥ 80 mmHg) it was found that whey protein supplementation
significantly reduced SBP and DBP by 8.0 and 8.6 mmHg respectively in
comparison to baseline (P<0.001) (406). In summary, the current body of evidence,
although limited, suggests that whey protein supplementation may have a positive
effect on blood pressure in non-diabetic adults, but further trials are needed in adults
with T2DM and there is a need to determine if there is an optimal type and dose of
whey protein that is most effective.
The health benefits of acute and longer-term whey protein ingestion may also extend
to lowering blood lipids levels yet few studies in overweight/obese older adults or
those with T2DM have investigated this with inconsistent results (351, 378). To my
knowledge, only one acute study has been conducted in adults with T2DM (378). In
this study, 12 men and women with T2DM (mean ± SD, age 64.6 ± 3.3 years and
BMI 28.9 ± 3.7 kg/m2) were randomised to receive a high-fat meal supplemented
with either 45g of whey, casein, cod or gluten protein (378). For 6-hours following
the ingestion of the meals it was observed that the AUC of plasma triglycerides were
significantly lower in the whey supplemented meal when compared to the three other
meals (mean ± SD, whey, 205 ± 86 mmol/L vs casein, 282 ± 132 mmol/L; cod, 296
± 11 mmol/L; gluten, 299 ± 75 mmol/L all P<0.05) (378). There are several factors
which control the circulating concentrations of triglycerides including intestinal
chylomicron secretion, hepatic very low density cholesterol secretion, conversion of
triglyceride-rich lipoproteins to triglyceride-depleted lipoproteins, and tissue uptake
of triglyceride-depleted lipoproteins, all of which may have influenced the

Chapter 2
Page | 65
postprandial triglyceride response (407). Whilst this study was only conducted in a
very small number of adults (n=12) with T2DM, importantly, the findings align with
the results observed in a study of 89 overweight and obese individuals (385). In this
other study, 89 overweight and obese adults (mean BMI 31.3 kg/m2) to 12-weeks of
whey, casein or glucose supplementation (351). Following the 12-week intervention
fasting triacylglycerol levels were significantly lower in those receiving the whey
compared with the control supplement (P=0.035) (351). There was also a
significantly greater reduction in total cholesterol in the whey group when compared
to both the casein and control groups (P<0.05 for both) (351). Whilst chronic effects
of whey protein supplementation in adults with T2DM remain unexamined, the
authors of this study highlighted that most participants displayed at least one or two
metabolic syndrome risk factors at baseline (351).
In summary, the effects of whey protein supplementation on blood pressure in
normotensive and overweight/obese adults appears favourable, however, no studies
have been conducted in adults with T2DM. Acute studies also support improved
triglyceride levels in adults with T2DM following whey supplementation, although
no chronic studies have been conducted. Given these findings and the proposed
mechanisms by which whey protein may improve blood pressure, serum lipids and
cholesterol, further long-term trials with different types and doses of whey protein
supplementation in adults with T2DM are warranted to determine the efficacy of
such a nutritional approach.
2.9 Vitamin D
While vitamin D is widely recognised for its importance in bone and mineral
metabolism, over the past two decades there has been considerable interest in the role
that vitamin D may play in several extra-skeletal health outcomes, including T2DM
(408). The renewed interest stems from the discovery that most body tissues and
cells possess vitamin D receptors (VDR) and the required enzymes to convert the
primary circulating form of vitamin D [25-hydroxyvitamin D (25(OH)D)], to the
active form 1,25-dihydroxy vitamin D (408). Vitamin D is a fat-soluble vitamin that
exists in two major forms. Vitamin D2 or ergocalciferol, which is available from
plant based foods such as mushrooms, and vitamin D3, or cholecalciferol, which is

Chapter 2
Page | 66
produced endogenously following exposure of the skin to ultraviolet light (sun
exposure) and is present in small amounts in certain foods (salmon, tuna, mackerel
and fish liver oils) and in some fortified products and supplements (409). Previously
it was thought there was an age-related decline in some of steps of vitamin D
metabolism (410, 411). However, it has been subsequently shown that intestinal
absorption of vitamin D does not decrease with advancing age (412, 413).
Nevertheless, vitamin D obtained from the sun or consumed through food must
undergo two hydroxylation reactions to become active as discussed below and shown
in Figure 2.5. Below is a discussion of the most recent evidence investigating the
potential health benefits of vitamin D supplementation on glycaemic control, insulin
sensitivity, muscle health, serum lipids and blood pressure in adults with T2DM.
Prior to that a brief overview of the metabolism of vitamin D and the current
recommended serum targets is provided.
2.9.1 Metabolism of Vitamin D
Vitamin D3 (cholecalciferol) is synthesised in the skin from 7-dehydrocholesterol by
ultraviolet irradiation, the subsequent production of vitamin D is dependent on the
intensity of UV irradiation which varies with season and latitude (414).
Cholecalciferol obtained from the sun or directly from food is then metabolised in
the liver to 25(OH)D by the enzyme vitamin D-25-hydroxylase to produce 25-
hydroxyvitamin D, the major circulating concentrations of vitamin D that serve as
the primary biomarker of vitamin D status (408). This metabolising step is not
enough to produce the biologically active vitamin D, and thus in the kidneys
25(OH)D undergoes further metabolism by the enzyme 1,25-dihydroxyvitamin D-
1α-hydroxylase also called 1-OHase (CYP27B1) producing 1,25-dihydroxyvitamin
D (1,25(OH)2D), which is the biologically active hormone (also called calcitriol)
(408). Even though the kidney is the primary site of CYP27B1 expression, several
other tissues also express this enzyme including the epithelial cells in the skin, lungs,
breast, intestine, prostate and endocrine glands including the parathyroid gland,
pancreatic islet cells, thyroid, ovary, placenta and some cells of the immune system
including macrophages. However, the contribution of these tissues to calcitriol
formation is yet unknown (415). The renal production of 1,25(OH)2D is tightly
controlled primarily by two hormones, one which up-regulates calcitriol production

Chapter 2
Page | 67
(parathyroid hormone (PTH)), and another which down regulates production via
fibroblast-like growth factor (FGF23). Calcitriol, following synthesis in the kidneys,
binds to vitamin D binding protein where it is transported to target organs and exerts
its actions (408). Calcitriol increases the expression of the enzyme 25-
hydroxyvitamin D-24- hydroxylase (24-OHase) to catabolise 1,25(OH)2D to
calcitroic acid, a biologically inactive water soluble compound which is excreted in
bile (408). A summary of this process is provided below in Figure 2.5.
Figure 2.5: Metabolism of vitamin D from the sun and dietary sources. Adapted from Holick. (408). Enzymes for the relevant metabolic conversions are written in italic text. The dotted arrow line reflects the two hormones which are responsible for controlling the renal production of 1,25(OH)2D.
2.9.2 Recommended Serum 25(OH)D Levels
Currently there is ongoing debate globally as to the optimal serum 25(OH)D
concentrations for health benefits, particularly for older adults. Position statements

Chapter 2
Page | 68
released by the Endocrine Society of Australia, Osteoporosis Australia and the
Working Group of the Australian and New Zealand Bone and Mineral Society and
the Institute of Medicine (IOM) proposed that serum 25(OH)D concentrations >50 to
60 nmol/L year-round should be considered adequate/sufficient (Table 2.8) (416,
417). In contrast, the International Osteoporosis Foundation (IOF) and the
Endocrine Society Guidelines suggest a proposed a cut-off of >75 nmol/L be used to
define vitamin D sufficiency (418, 419). The main difference between these
guidelines relates to the population groups of reference; the IOM guidelines relate to
the general population whereas the Endocrine Society guidelines are targeted
towards a clinical population (420). While it is beyond the scope of this thesis to
debate the relative merits of whether 50 or 75 nmol/L should be considered
sufficient, for this thesis the Australian/IOM criteria will be adopted. It is important
to note however, that such reference guidelines are recommended based on
effectiveness of calcium absorption and bone metabolism and that such levels may or
may not also translate to beneficial effects on non-skeletal outcomes.
Table 2.8: Recommended serum vitamin D targets and classes of deficiency as recommended by the IOM (416).
Serum Vitamin D Classification Serum Vitamin D Target Range Adequate/Sufficient ≥ 50-60 nmol/L at the end of winter Mild Deficiency 30–49 nmol/L
Moderate Deficiency 12.5–29 nmol/L Severe Deficiency < 12.5 nmol/L
1 nmol/L = 0.4 ng/mL
2.9.3 Vitamin D and Type 2 Diabetes: Proposed Mechanisms of Action
Whilst poorly understood, low serum 25(OH)D status is thought to play a role in the
diminishment of normal glucose metabolism due to the presence of the vitamin D
receptor (VDR) in all tissues receptive to insulin, including skeletal muscle, adipose
tissue and pancreatic beta-cells (Figure 2.6) (421). Mechanistically, the active form
of vitamin D (1,25(OH)2D) can bind directly to VDR in beta-cells, and stimulates the
expression of insulin receptors and promotes insulin-mediated glucose transport via
the translocation of GLUT4 proteins to the cell surface of insulin receptive tissues

Chapter 2
Page | 69
(Figure 2.6) (422). It has also been shown that 1a-hydroxylase, the key enzyme
regulating the conversion of 25(OH)D to 1,25(OH)2D, is expressed in pancreatic
beta-cells which further supports a role for vitamin D in regulating blood glucose
levels (423). Several other potential mechanisms may also explain the link between
vitamin D and T2DM, including regulation of calcium homeostasis and inflammation
(22). Vitamin D deficiency can alter circulating calcium levels and affect calcium
influx to beta-cells (22). Calcium is a crucial ion in insulin secretion and action, with
large deviations in calcium concentration (hypo- or hypercalcemia) known to impair
the proper function of pancreatic beta-cells and alter insulin sensitivity of target
tissues (22, 421). Further, vitamin D may regulate inflammation as 1,25(OH)2D
decreases the production of inflammatory cytokines, which is important as increased
inflammation can impair both beta-cell function and insulin sensitivity (22, 421, 422,
424). However, the role of vitamin D and its ability to modulate inflammation related
to T2DM or other chronic diseases remains to be confirmed with some studies
observing effects to the contrary (425).
Figure 2.6: Proposed role of vitamin D in the pathophysiology of type 2 diabetes
Type 2 diabetes is characterised by increased insulin resistance followed by beta-cell dysfunction. Consequential to this, insulin is no longer able to block lipolysis in fat tissue, glucose production in the liver or able to stimulate glucose absorption in the muscle. Biologically active vitamin D, 1,25(OH)2D (shown as Vitamin D) may reduce beta-cell dysfunction by restoring insulin production/secretion, thereby reducing insulin resistance and improve glucose uptake in the muscle. Additionally, vitamin D may also lessen inflammation in the pancreas by reducing inflammatory cytokine production. The negative effects of vitamin D deficiency are depicted with the red arrows.

Chapter 2
Page | 70
2.10 Vitamin D Supplementation for the Management of Type 2 Diabetes
2.10.1 Effect of Vitamin D on Glycaemic and Insulinaemic Outcomes
Several prospective epidemiological studies have demonstrated an association
between serum 25(OH)D concentrations and the incidence of T2DM (22, 61, 174,
426, 427). For example, data from the 5-year prospective AusDiab study involving
>5,000 adults aged ~51 years (199 incident cases of diabetes were diagnosed)
showed that a median 25(OH)D level of 70 nmol/L at baseline was associated with a
57% reduced risk of developing T2DM (61). Low serum 25(OH)D levels have also
been associated with impaired insulin sensitivity and reduced beta-cell function
(428). Direct evidence from RCTs examining the effects of vitamin D
supplementation on insulin sensitivity and glycaemic control in those with T2DM is
continuing to expand yet the studies completed to date remain inconclusive (71, 429-
433). Much of this heterogeneity is likely due to the methodological differences in
terms of the dose of vitamin D prescribed, the baseline serum 25(OH)D level and the
population group examined (e.g. normoglycaemic, IGT or diagnosed with T2DM).
While it is beyond the scope of this review to examine all the intervention studies
conducted on this topic, data from the most recent systematic review and meta-
analysis is provided. This systematic review and meta-analysis included 23 RCTs
representing 1,797 adults with T2DM with interventions ranging from 4-weeks to
12-months and doses of vitamin D from 400 IU/day to 300,000 IU as a single dose
over 3-months (434). The overall finding from this systematic review was that
supplemental vitamin D had no significant effect on any parameters of glycaemic
control or insulin outcomes (HbA1c, fasting glucose or HOMA-IR) in patients with
T2DM (434). Furthermore, they found that the results remained unchanged when
separating the studies into those sufficient or deficient in vitamin D at baseline (434).
A number of reasons may explain the findings, including the short duration of some
of the interventions, the lack of an appropriate vitamin D dosage or change in serum
25(OH)D levels, the lack of a control comparison group and baseline 25(OH)D
levels (434, 435). Interestingly, one 12-week RCT in adults with T2DM reported
small but significant beneficial effects of high dose (50,000 IU weekly) vitamin D
supplementation on glycaemic parameters, even in those with sufficient (>50

Chapter 2
Page | 71
nmol/L) baseline serum 25(OH)D levels (436). Similarly, another 6-month trial in 54
adults with T2DM found that treatment with 300,000 IU vitamin D3 intramuscularly
improved insulin sensitivity and HbA1c (437). Despite these positive finding, others
have reported no benefits of high dose supplementation on glycaemic control (438).
It is evident from the available data that further work in this area is required to
elucidate whether supplementation with vitamin D in adults with T2DM serves as an
appropriate strategy to improve glycaemic and/or insulinaemic outcomes.
2.10.2 Effect of Vitamin D on Body Composition
There is some evidence that low serum vitamin D concentrations (<50 nmol/L) are
associated with increased adiposity (439, 440) and reduced lean mass in older adults
and those with T2DM (441, 442). Numerous hypotheses have been proposed to
explain how inadequate vitamin D status may influence fat mass or vice versa, and
include sequestration of vitamin D to adipose tissue, and/or that overweight/obese
adults are inactive and thus less likely to perform outdoor activities (443). Another
proposed mechanism is that higher intakes of vitamin D can repress fatty acid
synthase enzyme activity by decreasing intracellular Ca2+ in adipocytes (444, 445).
Proposed mechanisms which explain the relationship of vitamin D supplementation
with improvements in skeletal muscle mass, strength and function may be through
calcium handling and signalling and accumulation in the sarcoplasmic reticulum
(influencing the involvement of calcium in muscle contraction) or through the
activation of vitamin D receptors found in the cell nuclei of muscle cells (446-450).
At present, the available evidence from RCTs investigating the effects of vitamin D
supplementation on change in fat mass in middle-aged to older adults have largely
been equivocal (177, 451-453). For example, Salehpour et al. (452) successfully
demonstrated that 42 middle-aged overweight/obese women (mean ± SD, age 38 ±
8.1 years, BMI 29.8 ± 4.1 kg/m2) with low serum 25(OH)D levels (<40 nmol/L)
supplemented with 1,000 IU/day of vitamin D for 12-weeks experienced a greater
reduction in fat mass compared a placebo control group (mean change -2.7±2.1 vs -
0.5 ± 2.1 kg; P<0.001). In contrast, a study in overweight men and women (mean age
49 years) with 25(OH)D levels <30 nmol/L who were randomised to receive 3,320
IU/day of vitamin D3 (n=82) or a placebo (n=83) and participated in a healthy

Chapter 2
Page | 72
weight-reduction program for 12-months showed that there was no difference for the
change in weight between the groups (mean ± SD change: vitamin D -5.7 ± 5.8 kg vs
placebo -6.4 ± 5.6 kg)] (177). The authors suggested that the lack of an effect of
vitamin D treatment in this study may have been confounded by a greater reduction
and subsequent lower intake in total energy, carbohydrate, protein and fat intake in
the placebo group as opposed to the vitamin D group (177). Nevertheless, these
findings are in accordance with a recent systematic review and meta-analysis which
found that supplementation with vitamin D had no effect on adiposity measures,
including fat mass and BMI, in adults aged 60 years from 26 RCTs including 42,430
participants with vitamin D doses ranging from 400 IU to 12,695 IU/day and with a
mean follow-up of 12-months (454).
In older adults with T2DM, there are also mixed findings from intervention trials
with regard to the effect of vitamin D supplementation (or vitamin D plus calcium)
on fat mass (455, 456). In one 12-week RCT, 118 older adults with serum 25(OH)D
levels <75 nmol/L and diagnosed with T2DM were randomly assigned to one of four
groups (1) 50,000 IU per week of vitamin D plus a calcium placebo; (2) 1000 mg per
day calcium plus vitamin D placebo; (3) 50,000 IU per week vitamin D plus 1,000
mg of calcium/day; or (4) vitamin D placebo plus calcium placebo (456). Participants
in the vitamin D plus calcium group had a greater reduction in BMI (mean ± SD -
0.17 ± 0.12 kg/m2) when compared to all other groups (P=0.03), which was
attributed to reductions in waist circumference (mean ± SD, -0.83 ± 0.44 cm) (456).
These same improvements were not observed in the vitamin D and placebo group,
suggesting improvements in these outcomes may have been related to the additional
calcium (456). Few other studies have examined if vitamin D can alter measures of
fat mass in older adults with T2DM, and largely these studies fail to corroborate the
positive findings reported above (457, 458). In summary, given the limited studies
available, the marked heterogeneity in populations studied (ethnicity, age,
geographical location), differences in the duration of interventions and the dose of
supplemental vitamin D prescribed, it remains uncertain as to whether vitamin D
supplementation can improve fat mass in older adults with T2DM.
Several recent trials have investigated the effects of vitamin D supplementation on
lean mass with doses of vitamin D ranging from 800 IU/day to a mega-dose of

Chapter 2
Page | 73
50,000 IU in healthy older adults or those with T2DM (453, 459-461). These recent
trials found there was no effect found of vitamin D supplementation on lean mass
outcomes (453, 459-461). Consistent with these trials a systematic review and meta-
analysis of 30 RCTs with 5,615 participants (mean aged 61 years) and
supplementation periods ranging from 1-month to 5.5 years with vitamin D doses
ranging from 400 IU/day up to ~3,500 IU/day, found no evidence for a beneficial
effect on lean mass (462).
In summary, intervention trials which have examined the effects of vitamin D
supplementation on measures of fat and lean mass in older adults with T2DM or
overweight/obese adults show very little support for any improvement on such
outcomes. It is possible that the results of these trials are confounded by aspects of
trial designs including the dose of vitamin D provided, the baseline serum 25(OH)D
level of participants plus differences in the length of interventions and other
micronutrients provided at the same time (i.e. calcium). It is also possible that the
paucity of trials in this area, the great degree of heterogeneity in studies conducted to
date and participants changes in energy intake during these interventions explains the
lack of effect observed. It is evident that further research in this area is required.
2.10.3 Effect of Vitamin D on Markers of Inflammation
There is some evidence that supplementation with vitamin D may mediate and
attenuate inflammation as seen in in vivo, in vitro and in animal studies (463-465).
Indeed, the findings from predominantly in vitro studies, has expanded our
understanding of the mechanisms by which vitamin D may alter cytokine production
and although not conclusive, there is some suggestion that the coupling of
1,25(OH)2D to vitamin D receptors located in several immune cells including
monocytes, macrophages, T-cells and beta-cells, reduces the production of
inflammatory cytokines including TNF-α, IL-6, IL-12 and IL-23 while increasing the
production of various anti-inflammatory cytokine such as IL-1 and IL-4 (466). As a
result, considerable interest exists in investigating if treatment with vitamin D exerts
anti-inflammatory effects in humans.

Chapter 2
Page | 74
In adults without T2DM, a recent systematic review and meta-analysis found no
association between vitamin D supplementation and improved inflammatory
biomarkers (467), however, evidence from prospective studies suggests there may be
a role for vitamin D in ameliorating systemic inflammation in high risk groups with
various chronic diseases, including T2DM (468). However, intervention studies
which have investigated the effects of vitamin D supplementation on various
circulating inflammatory markers in those with T2DM remain largely negative (463,
464, 469, 470). One 16-week trial which randomised 64 older adults (mean age
53.5 ± 9.5 years) with T2DM who had 25(OH)D levels <50 nmol/L to 4,000 or 2,000
IU of vitamin D (depending on baseline serum 25(OH)D status) or placebo found
that there were no changes in hs-CRP (463). Similarly, the findings from another 12-
week RCT in 100 adults with T2DM observed no change in hs-CRP following 12-
weeks of 5,000 IU of vitamin D compared to placebo (471). A limitation of both
studies was the measurement of only a single inflammatory marker (463, 471). In
another 12-week trial in older adults (mean age >55 years) with T2DM who were
supplemented with vitamin D (11,200 IU daily for 2-weeks followed by 5,600 IU
daily for 10-weeks), Kampmann et al. (469) failed to observe any significant within
group changes or between group differences in hs-CRP, IL-6, IL-10 or TNF-α in
comparison to placebo (469). Collectively, these findings indicate that vitamin D
supplementation has little effect on various inflammatory biomarkers, but it is
important to note that from the available studies there is considerable heterogeneity
in the dose of vitamin D provided, the starting level and change in serum 25(OH)D
concentrations.
There is some evidence that the combination of vitamin D and calcium
supplementation may be associated with improvements in inflammation (472). In an
8-week RCT in 118 adults (mean age 51.2 years) with T2DM who were randomised
to receive placebo, calcium (1,000 mg calcium carbonate), vitamin D (50,000
IU/week) or calcium plus vitamin D supplements (50,000 IU vitamin D per week
plus 1,000 mg calcium carbonate/day) for 8-weeks, Tabesh et al. (472) found that
those who received both vitamin D and calcium plus vitamin D supplements
experienced significant reductions in serum IL-6, TNF-α and leptin, compared to
placebo (472). Whilst significant reductions in markers of inflammation were also

Chapter 2
Page | 75
seen with calcium supplementation alone, all observed reductions in the vitamin D
alone group were of greater magnitude, except for leptin, where no difference
between-groups was observed (472). The reason for the positive finding in this study
compared to previous trials is difficult to explain, but the authors noted that this
study was conducted during summer where endogenous production of vitamin D
may have increased the total amount of vitamin D received during this period.
Furthermore, compliance with the supplements was excellent (almost 100%) (472).
Studies in adults with T2DM which have used vitamin D fortified food products such
as milk and yogurt have also observed improvements in various inflammatory
markers, including hs-CRP, IL-6, IL-1 and adiponectin (473, 474). Despite these
positive findings, it remains unknown whether it is the vitamin D alone or the
combination of vitamin D with other ingredients in the food which is responsible for
the beneficial effect.
In summary, there are mixed findings regarding the sole effects of vitamin D
treatment on markers of inflammation in adults with T2DM. To date, most studies
have typically been of short duration with considerable heterogeneity in the
population groups examined as well as the dose of vitamin D used. Of the studies
which have found a favourable effect most have co-supplemented with calcium or
used fortified-food products making it difficult to determine the independent benefits
of vitamin D. As such, high-quality RCTs with large numbers of participants over an
extended period are still required to investigate if vitamin D supplementation confers
a positive effect on markers of systemic inflammation in this population group.
2.10.4 Effect of Vitamin D on Serum Lipids and Blood Pressure
Several cross-sectional and prospective studies propose an association between
serum 25(OH)D, hypertension and dyslipidaemia (408, 475-477). For example, in a
meta-analysis of 18 studies (4 prospective and 14 cross-sectional), every 40 nmol/L
increase in serum 25(OH)D levels was associated with a 16% reduced risk of
hypertension, However, most studies included in this meta-analysis had a cross-
sectional design, which cannot exclude the possibility of reverse causality (477).
Nevertheless, these observations are supported by the potential biological
mechanisms by which vitamin D may affect blood pressure and the suppressive

Chapter 2
Page | 76
effects it can exert on the renin-angiotensin-aldosterone system (RAAS) (478). The
RAAS is a key regulator of blood pressure via its regulation of renin activity (478).
Renin cleaves angiotensin I to angiotensin II and once bound to the receptor it exerts
regulatory effects on blood pressure (478). Activation or stimulation of RAAS is
established to proceed the development of hypertension, therefore the suppression of
RAAS by vitamin D may lower blood pressure (478). Others suggest the presence of
vitamin D receptors on the endothelium may be play a role in the anti-hypertensive
effects of vitamin D (479). Improvements in serum lipid profiles with vitamin D may
be due to increases in calcium absorption which reduces triglyceride formation or
secretion (480-482). Other potential mechanisms include mediation of parathyroid
hormone levels which are known to suppress lipolysis (482). Despite these proposed
yet unconfirmed mechanisms, results of intervention trials examining the effects of
vitamin D supplementation on lipid profiles and blood pressure are contradicting in
those with T2DM which will be discussed below.
At present, there are mixed findings with regard to the effects of vitamin D
supplementation on blood lipids in adults with T2DM. A recent meta-analysis which
included 17 RCTs ranging from eight to 48-weeks and a total 1,365 participants
aimed to assess the effects of supplemental vitamin D on serum triglyceride and
cholesterol levels in adults with T2DM (483). While there was trend towards vitamin
D treatment reducing triglyceride levels in those with serum 25(OH)D levels <50
nmol/L at baseline (P=0.089), there was no effect in those with basal serum
25(OH)D levels between 50 and 75 nmol/L (P=0.631) (483). Other factors which
may influence the effects of vitamin D supplementation on lipid outcomes is the dose
prescribed and the duration of the intervention. In the meta-analysis above, it was
found that doses less than 2,000 IU/day for a minimum of 12-weeks were
significantly associated with improvements in triglycerides and total cholesterol, but
not HDL or LDL cholesterol (483). Interestingly, doses greater than 2,000 IU/day of
vitamin D were not associated with any such improvements (483). The reason for
these contrasting results remains uncertain, but could relate to differences in
dyslipidaemia management and the delivery of vitamin D in such studies i.e. fortified
food products or tablet forms (483). In terms of the duration of the intervention, the
same meta-analysis reported that only interventions less than 12-weeks were

Chapter 2
Page | 77
associated with significant improvements in LDL cholesterol; there were no
significant effects of duration on triglycerides or total cholesterol (483). In contrast,
it was found that interventions less than 12-weeks had a negative effect on HDL
cholesterol, although interventions longer than 12-weeks were not significantly
associated with improvements in HDL cholesterol either (483). While the findings
from this meta-analysis suggest that vitamin D treatment may help to improve the
lipid profile of adults with T2DM, it is clear that further long-term trials are needed
to confirm such an effect.
A recent systematic review and meta-analysis which evaluated the effects of
micronutrients, specifically vitamin D supplementation, on blood pressure in adults
with T2DM found vitamin D to be effective at reducing both SBP and DBP (484).
Pooling data from seven interventions in 542 older adults with T2DM aged 50 to 66
years led to a significant reduction of 4.6 mmHg in SBP (95% CI, −7.65, −1.47,
P=0.004) and a reduction in DBP of 2.44 mmHg (95% CI, −3.49, −1.39, P < 0.001)
(484). The authors of this systematic review and meta-analysis however, pointed out
that these findings should be interpreted with caution given the small number of trials
included and that another recent systematic review found no effect of vitamin D
supplementation on SBP in older adults with T2DM when including 15 studies and
1,134 participants with T2DM. As such, the evidence of vitamin D supplementation
on blood pressure in older adults with T2DM appears to be mixed depending on the
trials examined and the differences in population groups and study design (e.g.
baseline serum 25(OH)D level variation, varying sun exposure and different dosing
regimens) with further trials required.
In summary, there are biologically plausible mechanisms by which vitamin D
supplementation may improve plasma lipids and blood pressure, and along with an
expanding body of evidence from RCTs and meta-analyses vitamin D
supplementation may be important for improving SBP and DBP, triglycerides, total
and LDL cholesterol in older adults with T2DM. Whether there is an optimal dose
and/or achieved serum 25(OH)D level to improve these measures remains unknown.

Chapter 2
Page | 78
2.11 Exercise, Protein and Vitamin D for the Management of Type 2 Diabetes
As discussed above, there is evidence that PRT, whey protein and vitamin D each
may have a beneficial effect on glycaemic control, body composition and
cardiovascular risk factors in older adults with T2DM. In recent years, there has been
interest in whether combining PRT with various nutritional factors may provide
additive or synergistic health benefits in older adults and those with T2DM. The
following section will provide an overview of the evidence regarding the combined
effects of exercise and nutritional supplementation, with a focus on protein and/or
vitamin D supplementation, on body composition, glycaemic control, insulin
sensitivity/resistance, and cardiovascular risk factors including serum lipids,
inflammation and blood pressure, in older adults and/or those with chronic diseases,
including T2DM.
2.11.1 Effects of Exercise and Protein or Exercise and Vitamin D on Lean Mass
Over the past two decades, there has been a growing number of RCTs which have
investigated whether PRT or multi-modal exercise programs combined with
additional protein can produce added benefits on muscle compared to PRT alone in
healthy older adults. As a result, there have been at least three meta-analyses and
systematic reviews on this topic (485-487). These three meta-analyses and systematic
reviews demonstrate the literature in this area is currently inconclusive with
inconsistent findings, which could be due to different trial inclusion criteria used in
these meta-analyses. For example, Cermak et al. (486) classified older adults as >50
years and included 22 RCTs and 680 participants, whereas Finger et al. (485)
selected a cut point of >60 years and included six RCTs with 334 adults. In the most
recent meta-analysis, Thomas et al. (487) chose >70 years to reflect an elderly
population and included 15 RCTs and 917 participants. The first two listed
systematic reviews reported that increased dietary protein or protein supplementation
enhanced the effects of PRT on fat-free mass [(0.69 kg (95% CI, 0.47, 0.91),
P=0.00001) and (0.23 kg (95% CI, 0.05, 0.42)], respectively; there was no significant
effect on muscle CSA or muscle mass (485, 486). In contrast, the most recent meta-
analysis by Thomas et al. (487) failed to detect any added benefits of protein or
essential amino acid supplementation combined with PRT on muscle mass in the

Chapter 2
Page | 79
elderly (487). These contrasting results may have been due to the fact, as touched
upon above, there was considerable variability in the characteristics of the trials
included in each of these meta-analyses, including differences in the source/quality
of protein, the quantity of protein provided, the baseline dietary protein intake, the
inclusion of other ingredients such as vitamin D, leucine and other essential amino
acids plus the timing of supplementation relative to the PRT programs. Nevertheless,
in healthy older adults aged 50 to 80 years, long-term participation in PRT (> 6-
weeks) combined with increased dietary protein, predominantly dairy derived such as
whey protein, appears to provide a small (~0.5 kg) but significant additive effect on
fat-free mass (485, 486).
To date, little consideration has been given to whether increased dietary protein
concomitant to PRT in older adults with T2DM can offer an additive effect on
muscle mass. In the only study to date, Wycherley et al. (286) conducted a 2x2
factorial design RCT that compared isocaloric energy-restricted diets of either
standard control (19% energy from protein) or high protein (33% energy as protein)
with or without supervised PRT (3 days/week, 70-85% 1-RM) for a period of 16-
weeks in 83 overweight/obese men and women (mean age ± SD, 56.1 ± 7.5 years,
BMI ± SD, 35.4 ± 4.6 kg/m2). To facilitate good dietary compliance, a combination
of dietary advice and some food products and recipes were provided by a qualified
dietitian (286). Protein intake averaged 1.12 g/kg/day in the high protein groups and
participants demonstrated good compliance with their intervention diets (mean
percent energy from protein: control and control plus PRT ~18% vs high protein and
high protein plus PRT ~32%, P<0.001 diet and treatment effect) (286). There were
no improvements in total body lean mass in any of the groups and in fact an overall
non-significant reduction in total body lean mass was observed across groups, which
is likely explained by the calorie restricted diet (Figure 2.7) (286). Total body weight
loss was greater in the high protein plus PRT groups compared to the control and
high protein diet (P<0.05) but statistical significance was not reached when
compared to the control diet plus PRT (286). Similarly, fat mass reduced in all
groups yet was greatest in the high protein plus PRT compared to both the control
and high protein diet groups (P<0.05) yet again was not different to the control plus
PRT group (Figure 2.7) (286). The lack of an effect of the high protein diet

Chapter 2
Page | 80
concomitant to PRT on total body lean mass could be related to a number of factors,
including the level of protein intake achieved (dose in g/kg/day), the quality of the
protein used, the timing of consumption relative to participation in the PRT program,
the change in protein intake from baseline and/or the PRT load prescribed. The
following section will review the available evidence with regard to the influence of
the dose, distribution and timing of protein intake regarding PRT or multi-modal
exercise programs in older adults or those with T2DM.
Figure 2.7: Mean ± SD absolute changes (in kg) in total body weight, fat mass and lean mass after 16-weeks on a hypocaloric high protein (33% energy from protein) or hypocaloric control diet (19% energy from protein) with and without PRT. Taken from Wycherley et al. (286). * P<0.05, # P<0.01 vs high protein plus PRT
While there is considerable evidence from acute studies indicating that the dose of
whey protein and leucine are important factors that can influence the MPS response
to exercise, there are mixed findings from long-term human intervention trials.
Several longer-term human intervention trials have shown that there is little or no
added benefits when PRT is combined with doses of whey protein < 20 g (and < 2 g
of leucine) (284, 488-493), but there also mixed findings from a number of trials that
used higher doses of protein (285, 377, 494). In one study, it was observed that when

Chapter 2
Page | 81
327 middle to older aged overweight participants (age ± SD 48.0 ± 7.9 years)
consumed whey protein supplements at a dose of either 0, 10, 20 or 30 g per serve
twice per day and participated in a 9-month resistance and aerobic exercise program
(3 days/week) there was no additive effect of whey protein on exercise induced gains
in DXA-measured lean muscle (285). In a secondary analysis of this same study,
when participants were stratified by total protein intake (<1.0, ≥1.0-<1.2 and ≥1.2
g/kg/day) rather than dose of supplement there was still no difference between the
groups for the change in total body lean mass (494). While another 6-month trial in
80 70- to 85-year-old adults found that 40 g/day of whey protein (20 g at breakfast
and dinner) increased total body lean mass by 1.3%, this change was not significantly
different to the 0.6% increase observed in the isocaloric placebo group (377). The
lack of enhanced effect of whey protein on PRT induced improvements in lean mass
in these two studies was likely due to the baseline protein intakes of the participants,
which exceeded 1.0 g/kg/day.
As summarised in Table 2.10, there are few long-term human intervention trials in
older adults which have shown that the combination of PRT with additional dietary
or supplemental protein enhance the effects of PRT on muscle mass or size. As
already indicated, many of the studies where protein intake at baseline has been ~1.0
g/kg/day or higher did not observed an enhanced effect of additional protein in
conjunction with PRT or exercise on lean mass or size (284, 377, 492). This is
perhaps not unexpected given that most current international guidelines recommend
that older adults (65+ years) have a daily protein intake of at least 1.0 to 1.2 g/kg/day
of protein for the maintenance of physical function and optimal health. However, it is
also recommended that higher levels (>1.2 g/kg/day) are needed for those that
regularly participate in exercise (495). In part support of the above recommendation,
there is some evidence for an additive effect of protein with PRT on lean mass in
those with initial protein intakes <1.0 g/kg/day and those who have poor health for
example are sarcopenic (284).
The terms ‘protein spread’ and ‘protein change’ were proposed several years ago and
have subsequently been suggested other potential factors that may explain the
discrepant findings amongst some studies investigating effects of PRT with protein

Chapter 2
Page | 82
on muscle (373). Protein spread refers to the magnitude of difference in protein
intake between the groups during an intervention, whereas protein change refers to
whether there is a sufficient change in total protein intake from baseline during the
intervention (373). Signifying the importance of these factors was a review of 17
intervention trials which examined the effects of additional protein intakes combined
with PRT in both young and older adults (373). Interestingly it was found that in the
studies which did observe an added benefit of protein with PRT on lean mass the
average percent increase (change) in habitual protein intake (g/kg/day) was 59.5% as
opposed to only 6.5% in the studies which saw no added benefit (373). Additionally,
in those studies which concluded that higher protein interventions were effective
there was an average 66% g/kg/day between group difference (spread) compared to
only a 10% g/kg/day spread in the studies which were unsuccessful in observing an
additive effect (373).
The timing of protein intake relative to participation in a PRT program and the
distribution of protein intake, that is, dispersing protein more evenly throughout the
day, may be important factors influencing the effects of additional protein in
combination with exercise on lean mass (49). For instance, a 12-week study in 13
men (mean age ± SEM, 74 ± 1 years, mean baseline protein intake 1.1g/kg/day)
found 10 g of protein consumed immediately (within 5-minutes) of PRT completion
amounted to greater gains in total body lean mass compared to the men consuming
the protein supplement 2-hours following PRT (496). However, others have failed to
detect any added benefits of protein consumed either before or after PRT on muscle
hypertrophy (282, 497), and thus questions remain as to whether there is an optimal
time for protein intake relative to exercise. More recently however, there is some
evidence indicating that studies which have dispersed protein intake more evenly
throughout the day alongside a PRT program may provide some added benefits to
lean mass (0.5 to 1 kg) (refer to Table 2.9) (42, 283). It has been suggested that PRT
(exercise) may sensitise skeletal muscle to the anabolic effects of amino acids for up
to 24-hours, and thus this even protein distribution (at a sufficient dose) throughout
the day could enhance gains in skeletal muscle mass (498-501). However, others
following a similar protocol have not observed a favourable effect (377), which may
be related to the fact that repeated intake of supplements could act as a partial meal

Chapter 2
Page | 83
replacement as the study by Chalé and colleagues found that habitual dietary protein
intake reduced throughout the intervention (377). In summary, there is some
evidence that dispersing protein intake throughout the day may enhance the effects of
PRT on muscle, but further studies are still needed to address this question.
Few studies have examined whether combining PRT or exercise with vitamin D
supplementation can have an additive effect on muscle mass in older adults or those
with T2DM. Previously, 52 older women (mean age >68 years) with T2DM who had
insufficient serum 25(OH)D levels (<40 nmol/L) were randomised to either circuit
training (3-4 times per week comprising PRT and aerobic exercise), circuit training
plus 1,200 IU of vitamin D/day, vitamin D alone (1,200 IU/day) or control (502).
Significant improvements were observed in total body weight (-2.1%), fat mass (-
4.9%), percent body fat (-2.1%), total abdominal fat area (-9.1%) and subcutaneous
fat area (-9.2%) in those who completed the circuit training program with vitamin D
supplementation compared to vitamin D and control yet these results were not
different to those who performed circuit training alone (502). Additionally, there was
a 1.5% improvement in lean mass resulting from the vitamin D plus circuit training
program however, this improvement was no different to any of the other arms of the
study (502). In another 16-week RCT, 20 older men (aged 60-75 years) with serum
25(OH)D levels >50 nmol/L consumed ~2,000 IU/day of vitamin D with PRT
performed three days per week (70-75% 1-RM) in the final 12-weeks of the
intervention (503). Again, no significant additive effect of vitamin D with PRT on
changes in DXA-derived total body lean mass and magnetic resonance imaging-
derived muscle size was observed in comparison to control (503). It is unclear to
what extent baseline and target vitamin D concentrations, vitamin D dose and
treatment duration may influence the outcomes of such intervention trials, however,
any one or a combination of these factors could explain the lack of an enhanced
effect. For instance, the precise serum 25(OH)D level which may be associated with
improved muscle health or body composition outcomes remain unknown, but we do
know that vitamin D deficiency [serum 25(OH)D <25-30 nmol/L] is associated with
muscle weakness (504, 505). Thus, in older adults with serum levels >25-30 nmol/L
there may be little impact on muscle mass Additional, well-designed RCTs
supplementing vitamin D to older adults with a range of baseline serum 25(OH)D

Chapter 2
Page | 84
levels are required to fully elucidate if there is any additive effect on total body lean
mass or other body composition benefits when combined with exercise/PRT.

Page | 85
Table 2.9: Summary of randomised controlled trials which have examined the interactive effects of various protein supplements with PRT/ exercise and those which have examined the additive effects of protein and vitamin D supplements with PRT/exercise on lean mass in older and elderly adults. Adapted from (370).
Reference Study Characteristics Baseline Protein
(g/kg/day)
Supplement Details (Dose, ∆ Protein
Intake and Timing of Intake)
Comparison Group
Outcome and Method of Assessment
Milk and Dairy-based protein supplements
Campbell et al. 1995 (506)
n=12 healthy sedentary adults aged ~64 years. 2 days/week, 3 sets, 8-12 reps, 80% 1-RM for 12-weeks.
0.6
Dose: 1.6 g/kg ∆ Protein: 1.0 g/kg/day Timing: NS
Low-protein (0.8 g/kg)
Lean mass: Significant increase (~1 kg) compared to baseline but no difference between groups as assessed by total body weighing using the three compartment model of Siri.
Rosendahl et al. 2006 (507) plus Carlsson et al. 2011 (508).
n=191 living in residential care adults aged 85 years. Multi-modal program 5 times per fortnight for 12- weeks.
NS Dose: 7.4 g/day ∆ Protein 6.1 g/day Timing: After exercise
Ex + placebo, milk or control plus placebo
No difference between groups as measured using a bioelectrical impedance spectrometer.
Iglay et al. 2009 (492)
n=36 healthy untrained adults aged 61 years. 3 days/week, 3 sets, 8 reps, 80 % 1-RM for 12-weeks.
1.1
Dose: 1.6 g/kg ∆ Protein 0.1 g/kg/day Timing: At meal times
Low protein (0.9 g/kg)
Lean mass: Significant increase of ~1kg compared to baseline. No difference between groups as measured by DXA.

Page | 86
Kukuljan et al. 2009 (493)
n=180 healthy untrained males aged ~60 years 3 days/week, 2–3 sets, 8–20 reps, 60–85 % 1-RM 72-weeks.
~1.3
Dose: 13 g/day ∆ Protein: 11.9 g/day Timing: Morning and afternoon/evening
Ex, fortified milk or usual
care
Lean mass: Significant within-group increase of ~1 kg as assessed by DXA. No difference between-groups.
Tieland et al. 2012 (283)
n=62 frail elderly adults aged 78 years. 2 days/week, 3–4 sets, 8–15 reps, 75 % 1-RM for 24-weeks.
1.0
Dose: 30 g/day ∆ Protein: 0.3 g/kg/day Timing: After breakfast and lunch
Flavoured CHO drink
Lean mass: 1.3kg significant within group increase in the intervention group. Significant net difference of 1.6 kg as measured by DXA.
Leenders et al. 2013 (284)
n=60 healthy untrained adults age=d 70 years. 3 days/week, 3–4 sets, 8–15 reps, 75–80 % 1-RM for 24-weeks.
~1.1
Dose: 15 g/day ∆ Protein: 0.18-0.24 g/kg/day Timing: After breakfast
Lactose and calcium drink
Lean mass: Similar significant ~1 kg increase but no differences between the groups as assessed by DXA.
Buhl et al. 2016 (509)
n=29 acutely ill adults aged 72-73years. 3 days/week, 3 sets, 8–12 reps (intensity NS) for 12-weeks.
0.74 Dose: 18.8 g/day ∆ Protein 14.1 g/day Timing: After exercise
Standard care
Lean mass: Significant ~0.5 kg reduction compared to baseline. No difference between the groups in as measured by DXA.

Page | 87
Whey Protein
Candow et al. 2006 (497)
n=29 mobility limited adults aged 63-66 years. 3 days/week, 3 sets, 10 reps, 70 % 1-RM for 12-weeks.
NS
Dose: 0.3 g/kg ∆ Protein: 0.3 g/kg/day Timing: Before or after exercise
Chocolate CHO drink
Lean mass: Similar significant increase in lean mass in all groups compared to baseline with no differences between-groups as measured by air-displacement plethysmography.
Chale et al. 2013 (377)
n=80 healthy untrained adults aged 77-78, M/F 3 days/week, 2–3 sets, 10–12 reps, 80 % 1-RM for 24-weeks.
~0.9
Dose: 40 g/day ∆ Protein: 18 g/day Timing: After breakfast and evening meal
Maltodextrin Lean mass: No between-group differences in lean mass as assessed by DXA.
Arnarson et al. 2013 (510)
n=161 obese untrained adults aged 73-74 years. 3 days/week, 3 sets, 6–8 reps, 75–80 % 1-RM for 12-weeks.
1.1
Dose: 20 g/day (7 g EAA) ∆ Protein: 0.06 g/kg/day Timing: Immediately after exercise
Carbohydrate control
beverage
Lean mass: No change in lean mass as assessed by DXA. No between-group differences.
Soy-based protein
Fiatarone et al. 1994 (511)
n=100 frail elderly adults aged 87 years. 3 days/week, 3 sets, 8 reps, 80 % 1-RM for 10-weeks.
NS Dose: 15 g/day, ∆ Protein: 15 g/day Timing: Evening
Ex, low energy beverage or
control
No within-group changes in lean mass and no between-group differences measured by whole body potassium as an index of body cell mass.

Page | 88
Casein
Verdijk et al. 2009 (282)
n= 26 healthy untrained males aged 72 years. 3 days/week, 4 sets, 8-15 reps, 75-80% 1-RM for 12-weeks.
1.1
Dose: 20 g/day ∆ Protein: 20 g/day Timing: Prior to and following exercise
Flavoured water
Significant similar (~0.6 kg) increases in lean mass in both groups, no group by time interactions as measured by DXA.
Leucine
Trabal et al. 2015 (490)
n= 30 adults living in residential care, aged 84-85. Three days/week, 2 sets, 15 reps, 65% 1-RM for 12-weeks.
1.2
Dose: 5 g/day (twice) ∆ Protein: 0.03 g/kg/day Timing: After lunch and dinner
Maltodextrin
No differences within or between-groups for calf circumference and triceps skin-folds (assessment of lean mass).
Essential amino acids
Godard et al. 2002 (488)
n= 17 healthy untrained males aged 71-72 years. 3 days/week, 3 sets, 10 reps 80% 1-RM or fatigue for 12-weeks.
1.1
Dose: 12 g/day ∆ Protein: 2% increase in energy from protein Timing: After exercise or at same time each day
Usual care
Similar (7 and 6%) increases in muscle CSA in intervention and control groups. No differences between the groups from CT measured thigh cross-sectional area.
Kim et al. 2012 (489)
n= 155 sarcopenic women aged 79 years. 2 days/week, 1 set, up to 8
NS Dose: 3 g/day (twice) ∆ Protein: 6 g/day
Exercise, EAA only or health
education
No within-group changes or between-group differences in ALM. Protein plus PRT was significantly better than health education for improving leg

Page | 89
reps, 14-16 RPE for 12-weeks.
Timing: Twice a day (no statement on time)
lean mass (P<0.010). 2 and 3% increases in leg lean mass in protein plus PRT and PRT alone vs baseline (P<0.05). Measurements conducted with BIA.
Multi-nutrient supplements (Protein plus Vitamin D)
Verreijen et al. 2015 (512)
n= 80 obese older adults aged 63 years. PRT 3 times/week, 3 sets, 10 reps (intensity NS) for 13-weeks. All followed a hypocaloric diet (-600 calories/day).
NS
Dose: 21 g whey, 3 g leucine, 800 IU vitamin D per supplement ∆ Protein: 1.11 g/kg/day of protein was consumed during the intervention by the intervention group Timing: Every morning and immediately following training on training days
Isocaloric control plus
exercise
Significant interaction (P=0.03) between the groups. Driven by a 0.4 kg gain in the PRT plus protein group with a 0.5 kg reduction in the control group.
Rondanelli et al. 2016 (513)
n= 130 sarcopenic elderly adults aged 80 years. Multi-modal exercise program of moderate-intensity 5 times/week for 12-weeks.
0.9
Dose: 1 x 32 g (22 g whey, 4 g leucine, 100 IU vitamin D) ∆ Protein: 1 g/day Timing: NS
Maltodextrin plus exercise
1.4 kg increase in lean mass in the intervention group, (P<0.001) compared to baseline as measured by DXA. This change led to a significant between-group difference (P<0.001).

Page | 90
Holm et al. 2008 (514)
n= 38 healthy untrained women aged 55 years. PRT 2-3 times/week, 3 x 15 reps at 20-RM weeks 1-2, 3 x 10 reps at 10-RM 3-12 and 5 x 8 reps at 8-RM weeks 13-24.
1.0
Dose: 10 g of whey protein 200 IU of vitamin D ∆ Protein: Timing: One/day immediately after training on training days
Placebo plus PRT
No between-group difference for change in lean mass. A 0.8 kg increase in lean mass was observed in the intervention group compared to baseline. Body composition measured with DXA.
NS, Not stated; DXA, Dual energy X-ray absorptiometry; CT, computed tomography; IU, International units; EAA, essential amino acids; BIA, Bioelectrical impedance analysis; RPE, ratings of perceived exertion

Chapter 2
Page | 91
2.11.2 Effects of Exercise Combined with Protein and Vitamin D on Lean Mass
Several recent interventions have investigated whether multi-nutrient supplements
including protein and vitamin D, when combined with exercise can enhance the
effects of exercise on muscle mass and strength in older adults (Table 2.9) (512-515).
In one trial, 80 obese older adults (mean age ± SD, 63.0 ± 5.6 years) performed PRT
(3 times per week), followed a hypocaloric diet (-600 calories) and were randomised
to either a high whey protein, leucine and vitamin D rich supplement (150 calories,
21 g of protein, 2.8 g leucine, 800 IU of vitamin D) or an isocaloric control for 13-
weeks (512). All supplements were consumed prior to breakfast and after training
sessions on training days (512). During the intervention period and inclusive of the
supplement, protein intake was 1.1 g/kg/day in the intervention group. Baseline
protein intake was not reported. Baseline serum 25(OH)D status was not reported nor
was the change in serum 25(OH)D level. After 13-weeks, similar reductions in total
body weight and fat mass in the intervention and control groups were observed (total
body weight; 3.4 ± 3.6 kg vs 2.8 ± 2.8 kg; fat mass 3.2 ± 3.1 kg vs 2.5 ± 2.4 kg, all
P<0.001, respectively) which was likely due to the hypocaloric diets followed by all
participants (512). Following the 13-week weight loss intervention, the change in
ALM and leg muscle mass was significantly different between the intervention and
control group [mean change in ALM ± SD; intervention, +0.4 ± 1.2 kg and control, -
0.5 ± 2.1 kg, P=0.03 and mean change in leg muscle mass ± SD; intervention, +0.3 ±
1.2 kg and control -0.6 ± 1.8 kg, P=0.01] (512). This suggests that a multi-nutrient
supplement containing whey protein, leucine and vitamin D concurrent with PRT can
enhance the effects of PRT on muscle mass in older adults (512). In another study,
Rondanelli et al. (513) examined the effects of a 12-week multi-nutrient supplement
(22 g of whey protein, 4 g of leucine and 100 IU of vitamin D) or placebo combined
with a moderate-intensity physical activity program (aerobic and strength based
training) performed 5 days per week on muscle mass in 130 sarcopenic elderly men
and women (513). The combination of the multi-nutrient supplement and exercise
program increased total body lean mass compared to placebo plus exercise [mean net
difference 1.7 kg (95% CI, 0.9, 2.5), P<0.001 for the between-group interaction]
(513). The greater magnitude improvement in this trial may be due to the differences
in population groups examined (e.g. sarcopenic elderly adults compared to obese

Chapter 2
Page | 92
older adults). Nevertheless, the findings from these two trials demonstrate an
integrated intervention combining a multi-nutrient supplement containing protein and
vitamin D in addition to a PRT or a multi-modal exercise program can lead to greater
improvements in muscle mass in older adults when compared exercise alone (512,
513).
Despite the positive findings from two trials, not all interventions have observed an
enhanced effect of PRT combined with a multi-nutrient supplement containing
vitamin D and protein on muscle mass in older adults. For instance, the findings from
a 24-week RCT in which early postmenopausal women (mean age 55 years) were
provided a multi-nutrient supplement (n=16) containing 10 g of protein (no report of
leucine content), 31 g of carbohydrate, 250 mg of calcium and 200 IU of vitamin D
or a placebo product (n=13) consumed immediately following PRT (five 20 minute
sessions per week of moderate-intensity) showed there were no additive benefits on
DXA assessed lean or fat mass (514). The only significant result was a small increase
in lean mass compared to baseline in the multi-nutrient intervention group (514). As
baseline protein intake were on average >1.0 g/kg/day, it is likely that the additional
10g of protein was not sufficient to enhance the anabolic effects of the exercise
program. Another possible reason for the lack of an additive effect is that the
participants in this trial were middle aged women, a time around which reductions in
muscle mass due to ageing are just beginning to commence (516, 517), greater
improvements may have been observed had participants been sarcopenic as seen
previously (513). The authors of this study also posited that the lack of an interactive
effect on gains in muscle may have been related to the moderate-intensity and
moderate volume of the PRT program (514).
Drawing conclusions from the studies conducted to date is difficult as the design of
the trials, prescription of exercise/PRT programs, the doses of protein and vitmain D
prescribed, the starting levels of vitamin D, protein status (deficient or replete),
intervention protein prescribed (large dose or modest dose) and the age/gender
characteristics of these trials were all different. Despite these factors, there is some
positive evidence that PRT/exercise combined with increased protein intake and
vitamin D supplementation may enhance the improvement in lean mass offered from

Chapter 2
Page | 93
PRT/exercise alone. Whether the same benefits would also be observed in older
adults with T2DM is not known.
2.11.3 Effects of Exercise, Protein or Vitamin D on Glycaemic and Insulinaemic Outcomes
Whether the combination of PRT and increased protein enhances the glycaemic and
insulinaemic improvements typically associated with PRT in older adults and those
with T2DM remains unknown. Studies which prescribe weight loss/energy
restriction alongside increased dietary protein and PRT have been associated with
improvements in glycaemic control and insulin sensitivity as summarised in Table
2.10 yet the inclusion of energy restriction/weight loss may confound the findings as
weight loss/energy restriction is commonly associated with improvements in these
outcomes. For instance, the only study to examine the effects of increased dietary
protein in conjunction with PRT on glycaemic and insulinaemic outcomes in older
adults with T2DM also prescribed a hypocaloric diet to induce weight loss, as
described previously (Table 2.10) (286). Briefly, in this 16-week RCT, 83
overweight/obese men and women (mean age 56.1 ± 7.5 years) with T2DM were
randomly assigned to a hypocaloric high (33% energy from protein) or low protein
(19% energy from protein) diet with or without PRT (3 days/week, 70-85% 1-RM)
(286). After 16-weeks all groups experienced a similar significant reduction in
plasma glucose (reductions ranged from 1.9 to 2.5 mmol/L) and HbA1c (reductions
ranged from 1.1 to 1.8%) (286). Interestingly, there was a significant reduction in
insulin in the high protein plus PRT group compared to baseline (P<0.001), which
was two-fold greater than the other groups, but again no interaction was observed
(P=0.11) (Figure 2.8) (286). Secondary analysis and pooling of the groups in this
study found the change in insulin was significantly correlated with changes in both
total body weight (r=0.35, P<0.01) and fat mass (r=0.36, P=0.005), which is perhaps
not surprising as body fat has been found to predict insulin sensitivity in older people
(518). This may explain the greater reduction in insulin in the PRT plus high protein
group as this group experienced the greatest reduction in fat mass (mean reduction -
11.4 kg, P>0.01) (286). Other studies have also failed to demonstrate the
combination of increased dietary protein with PRT is more effective than PRT alone

Chapter 2
Page | 94
on improving glycaemic and insulinaemic outcomes (285, 519), this is believed to be
attributed to the fact that all participants experienced similar reductions in weight.
Figure 2.8: Mean (± SD) absolute changes in fasting insulin (pmol/L), glucose (mmol/L) and HbA1c (%) following a 16-week high protein (33% energy from protein) or control diet (19% energy from protein) with or without participation in PRT (3 days/week 70-85% 1-RM). Taken from Wycherley et al. (286).
Several studies examining the effectiveness of increased dietary protein alongside
PRT, independent of a hypocaloric or weight loss diet, have failed to clearly
demonstrate the value of such an approach on improving glycaemic control, insulin
sensitivity and insulin levels (283-285, 519-521). For instance, 16-weeks of whey
protein supplementation (21 g, three times per day) combined with high-intensity
PRT performed four times per week in 27 healthy middle-aged adults (mean age 47
years) resulted in significant reductions in glucose (21%), insulin (14%) and HOMA-
IR (31%) when compared to baseline (all P<0.05), but these improvements were no
different to the protein only intervention without exercise (520). Potentially this was
because both groups experienced similar significant mean reductions in body weight
(1.4 kg), percent body fat (0.7%) and abdominal fat (0.3 kg) respectively, compared
to baseline. Only the protein plus PRT group experienced a significant increase in
percent total body lean mass (mean ± SD, 0.9 ± 0.3%, P<0.05) yet this increase was
no different to those in the protein only group (520). Several possible reasons for the

Chapter 2
Page | 95
lack of effect were proposed and include participants at baseline were consuming
upwards of 1.1 g/kg/day of protein, the supplements were prescribed to provide an
extra 60 g of protein per day on top of habitual protein intake yet the mean increase
was only 34 g, suggesting displacement of habitual protein intake (520). The
proposed displacement of protein intake following the addition of the protein
supplements may have been both a consequence and a limitation of the study design
where supplements were prescribed to be consumed in-line with the three daily main
meals. Had the protein supplements successfully been consumed in addition to the
habitual diet of participants (rather than replacing) this would have raised daily
protein intakes to ~1.8 g/kg and percentage energy to well above 30%. Indeed, the
findings from another study in middle-aged (mean age 48.4 years) overweight and
obese adults showed that increasing total protein intake from ~20% to 35%, with the
use of whey protein supplements, significantly improved insulinaemic outcomes,
independent of PRT, weight loss or gains in total body lean mass (351). While a few
other intervention trials in older adults have also used a protein supplement to
investigate glycaemic outcomes, again these findings remain inconclusive which
may be related to a number of factors, including the type and dose of protein. Table
2.10 provides an overview of these interventions (283-285, 519, 521).
Whether there is an optimal dose of protein to enhance the effects of PRT on
glycaemic and insulinaemic outcomes remains uncertain. The closest study to
investigate a dose response relationship was conducted in 220 healthy adults (mean
age 48 years) who all performed 36-weeks of high-intensity combined resistance and
aerobic training and were randomly assigned to one of four twice daily doses of
whey protein (0g (placebo), 10g, 20g or 30 g of whey protein) (285). Whilst the
primary outcome of this study was to examine change in body composition, changes
in glucose, HOMA-IR and insulin sensitivity were also assessed. At the end of the
intervention no differences were observed between the groups in terms of the gains
in total body lean mass or any glycaemic or insulinaemic measures (285). However,
pooling of the data found an overall reduction in insulin AUC of 2.6 ± 32% (-7.5 ±
29 nmol/L × 3 h, P = 0.01), which coincided with an overall 1.9 ± 2.8% (P<0.001)
increase in total body lean mass (285). The lack of a greater magnitude gain in lean
mass was likely due to participants in this trial being relatively healthy (albeit

Chapter 2
Page | 96
overweight) with sufficient intakes of protein at baseline (~1.0-1.1 g/kg/day).
Another study also observed no beneficial effect of PRT combined with a twice daily
milk protein concentrate supplement on glycaemic or insulinaemic outcomes in 62
older frail but metabolically healthy adults (mean age ~78 years) who had intakes of
protein at baseline of ~1.0 g/kg/day. Participants in this study also presented with
FPG and insulin levels in the healthy normal range (mean glucose 5.3 ± 0.5 mmol/L
and mean insulin 130.6 ± 47 pmol/L) which did not change following twice daily
(breakfast and lunch, 15 g per serve) milk protein concentrate supplementation with
PRT (twice per week) (283). Other possible reasons for the lack of an additive effect
may have been due to the type of protein used (e.g. milk protein) or the level of total
protein intake not being significantly different from the control group (supplement
83.5 g/day vs control 77.7 g/day, P=0.61), combined with the lack of a marked
change in protein intake from baseline (mean increase of only 6 g/day) (283).
In summary, studies investigating the combined effects of PRT with increased
protein on insulinaemic and glycaemic outcomes remain inconclusive, largely
confounded by the incorporation of energy restriction/weight loss in these trials
which is well established to be a potent method to improve glycaemic control and
insulin sensitivity. Nevertheless, several studies have demonstrated the importance of
independent participation in PRT for improving glycaemic control and to a lesser
extent levels of insulin as discussed in section 2.7.2.2 of this literature review.
It is possible that other nutrients such as vitamin D in addition to PRT and increased
protein consumption may interact to improve glycaemic control and insulin
sensitivity in older adults with T2DM. However, no studies appear to have
specifically addressed this question. The closest study to do so randomised 52 elderly
(mean age 70 years) women deficient in vitamin D with T2DM to vitamin D
treatment (1,200 IU/day) or placebo with and without circuit training (moderate-
intensity PRT and aerobic training) for 12-weeks (502). Following the intervention,
no significant differences were observed between the groups for the change in FPG,
insulin or HOMA-IR, but greater non-significant improvements in the combined
group relative to controls was observed (-10.7% vs 4.1% fasting insulin; -35.8% vs
29.2% and HOMA-IR; -42.8% vs 28.9%) (502). The lack of a significant interaction

Chapter 2
Page | 97
may have been due to the intervention period not being long enough, the lack of
change in lean mass, the insufficient training intensity and/or the dose of vitamin D
being low. Whilst the dose of vitamin D and serum 25(OH)D level which may offer
glycaemic and insulinaemic improvement remains unknown, a study which did find
a significant positive effect of vitamin D supplementation on insulin outcomes in
middle-aged women with T2DM, yet without exercise or PRT, provided a dose four
times as high (4,000 IU/day) (65). Clearly further research is need to determine if
there is in fact an optimal serum level of 25(OH)D and/or dose of vitamin D that may
produce an additive effect with PRT on glycaemic and insulinaemic outcomes.

Page | 98
Table 2.10: Summary of RCTs which have examined the interactive effects of increased dietary protein or protein supplements with PRT or exercise on glycaemic and/or insulinaemic outcomes in older and elderly adults.
Reference Study Characteristics
Baseline Protein Intake
(g/kg/day)
Supplement/Diet Details
(Dose/Intake, ∆ Protein
Intake, Type)
Comparison Group
Change in insulin or glycaemic parameters
Adults with Type 2 Diabetes
Wycherley et al. 2010 (286)
n= 83 adults aged 56 ± 7.5 years. PRT 3 days per week, 3 sets 8-12 reps 70-85% 1-RM
NS
Dose: 1.12 g/kg ∆ Protein Intake:
Unknown Type: High protein food sources (not specified)
Control diet, high protein
diet and control diet plus PRT
Glucose and HbA1c similarly and significantly reduced in all groups no difference between groups. Insulin reduced to a greater degree in the high protein plus PRT group (two-fold) but was not significant compared to other groups.
Healthy Older or Elderly Adults
Tieland et al. 2012 (283)
n= 62 adults aged 78 ± 7 years PRT completed 2 days/week for 24-weeks 3-4 sets, 8-10 reps 75% 1-RM for 24-weeks
~1.0
Dose: 15 g twice/day (breakfast and lunch) ∆ Protein Intake: 0.3
g/kg/day Type: Milk protein
concentrate 80
Placebo plus PRT
Plasma glucose and insulin did not change in either group.

Page | 99
Layman et al. 2005 (305)
n= 48 women aged ~47 years 2 d/week 30 min of stretching and PRT. PRT program, 7 exercises, minimum one 12-rep set on each machine with weight set to fatigue by final rep. Plus 5 days/week 30 min walking for 16-weeks.
~0.8-0.9
Dose: 1.6 g/kg/day (30% energy)
∆ Protein Intake: ~30 g/day in both higher
protein groups Type: Greater intake of
high protein food sources (meat, eggs, dairy and
nuts)
Lower protein diet of 0.8
g/kg/day with exercise or
lower protein only or higher protein with no
PRT.
Insulin fell by ~50 pmol/L in both exercising groups (higher and lower protein) compared to baseline with no differences between the groups.
Meckling et al. 2007 (519)
n= 60 women aged 43 years performed 3 days/week of PRT (within a circuit training program), 80% max heart rate for 12-weeks.
~0.8
Protein intake: 1g:1g of protein:carbohydrate.
∆ Protein Intake: 15g in higher protein only and
50g/day in higher protein plus PRT
Type: Greater intake of high protein food sources
(meat, eggs, dairy and nuts)
Higher protein alone or control diet plus PRT or control diet only. Control diet protein: carbohydrate ratio 1g:3g.
* All participants
randomised to
No within group changes or between group differences observed in fasting plasma glucose or insulin.

Page | 100
hypocaloric (-500 calories)
Iglay et al. 2007 (521 )
n=36 adults aged ~61 years performed PRT 3 days/week 3 sets 8 reps 80% 1-RM for 12-weeks.
~1.0
Dose: 1.2 g/kg/day higher protein diet.
∆ Protein Intake: ~6 g or 0.1 g/kg/day
Type: Higher intake of egg and dairy proteins
0.9 g/kg/day lower protein diet plus PRT.
Insulin AUC reduced in the control group but did not change in the higher protein group (group by time interaction P<0.05). No changes or between group differences observed for FPG, glucose AUC, HOMA or HbA1c.
Leenders et al. 2013 (284)
n= 60 adults mean age ~70 years. PRT 3 days/week, 3–4 sets, 8–15 reps, 75–80 % 1-RM for 24-weeks.
~1.1
Dose: 15 g/day ∆ Protein Intake: 0.18-
0.24 g/kg/day Type: Milk protein
concentrate 80
Lactose and calcium drink
No change in fasting glucose or insulin, HbA1c, HOMA-IR.
Arciero et al. 2014 (520)
n= 51 adults mean age ~50 years. PRT performed 4 days/week, 2-3 sets 7-9 reps 80% 1-RM for 16-weeks. Multi-modal exercise: 4 days/week PRT+aerobic and functional training,
~1.0-1.1
Dose: All whey protein was consumed 20 g 3
times/day (upon waking, mid-afternoon/following
exercise and within 2 hours of bed)
∆ Protein Intake: 25-35 g/day for all groups
Whey protein alone or whey protein plus multi-modal
exercise.
No change from baseline in fasting glucose or insulin or HOMA-IR and no difference between the groups.

Page | 101
yoga/pilates and stretching exercises.
Type: Whey protein (no further details provided)
Weinheimer et al. 2012 (285)
n=220 adults aged 48 ± 7.9 years performed PRT 2 days/week, 3 sets of 8-10 reps ~80% 1-RM plus 1 day per week a 60-minute aerobic training, ~70% maximum heart rate for 36-weeks.
Range 0.97-1.12
Dose: 10, 20 or 30 g whey protein
∆ Protein Intake: 0.16-0.72 g/kg/day
Timing: Breakfast and lunch
Type: Whey protein concentrate 80
Placebo beverage
Insulin AUC fell by 2.6 ± 32%, P =0.01 when all participants were pooled. No between group interactions observed. Fasting glucose, glucose AUC and HOMA-IR no change.
Data is presented as mean ± SD. NS, Not stated; PRT, Progressive resistance training; 1-RM, one repetition maximum; AUC, area under the curve.

Chapter 2
Page | 102
2.11.4 Effects of Exercise, Protein and Vitamin D on Cardiovascular Health
The interactive effect of PRT with high protein diets or protein supplementation on
cardiovascular health outcomes in older adults with T2DM has not been thoroughly
examined. In the only intervention trial conducted to date in older adults with T2DM
by Wycherley and colleagues which has been discussed extensively above in section
2.11.1 page 78, they found increased dietary protein alone and in combination with
PRT was associated with significant improvements in blood pressure, lipids and hs-
CRP, but there were no between group differences for any of these outcomes (286).
This may be explained by the fact that participants in this intervention did not present
with elevated levels of lipids, cholesterol or blood pressure (286). Indeed, more
favourable changes in serum lipid and cholesterol levels in response to greater
protein intake or increased protein intake plus PRT in those with adverse levels at
baseline have been found in other studies (522, 523). Secondly, although participants
in the high protein diet groups (with or without PRT) were reported to be consuming
approximately 118 g/day or 1.3 g/kg of protein during the intervention the baseline
protein intake was not reported and thus the change in protein intake may not have
not been sufficiently large enough (286). As previously discussed, the change in
protein intake from baseline is an important factor which could explain why no effect
was observed as another study found raising protein intake (via the prescription of a
high protein diet) by 50 g/day for 10-weeks from 0.9 g/kg to 1.6 g/kg resulted in
significant improvements in total cholesterol (5.80 ± 0.16 to 5.38 ± 0.21 mmol/L,
P<0.05), LDL (3.81 ± 0.17 to 3.45 ± 0.19 mmol/L, P<0.05) and triacylglycerol levels
(1.31 ± 0.21 to 0.98 ± 0.16 mmol/L, P<0.05) compared to baseline (305). These
improvements were likely due to the significant reductions in total fat and saturated
fat that were observed to occur in those receiving protein supplements with or
without PRT, suggesting that the increased intake of protein was associated with
displacement of fat intake in the habitual diet of these participants (305).
Studies using a protein supplement (as opposed to a high protein diet) in combination
with PRT in middle-aged and older adults have observed mixed effects on
cardiovascular risk factors. In a 24-week RCT, 60 healthy elderly men and women
(mean age ± SEM, 70 ± 1 year) were randomly assigned to a PRT program combined

Chapter 2
Page | 103
with 15 g/day of milk protein concentrate or placebo (284). Triglyceride levels were
within normal ranges at baseline (<1.7 mmol/L) and did not change during the
intervention in any group (284). In contrast, total and LDL cholesterol levels were
elevated (<5.2 and <2.6 mmol/L, respectively) at baseline in all participants and by
12-weeks both placebo plus PRT and protein plus PRT groups experienced similar
significant reductions in total cholesterol [(range 0.13 to 0.26 mmol/L, P<0.001)] and
reductions in LDL cholesterol by 12-weeks (range, 0.16 to 0.32 mmol/L, P<0.001)
and 24-weeks (range 0.7 to 0.16 mmol/L P<0.05)] (284). Significant (~6 mmHg)
reductions in SBP and DBP were also observed with no differences between the
groups (284). The findings from this study indicate that PRT was effective at
lowering cholesterol, lipid and blood pressure levels, but the additional milk based
protein did not provide any enhanced benefits (284). Several other studies using PRT
or exercise in combination with protein supplementation have observed mostly a null
effect on blood pressure, lipids or cholesterol and markers of inflammation in
comparison to placebo (285, 393, 524). For example, the findings from a study in 26
older (mean age ± SD, 65 ± 5 years) overweight, sarcopenic men who were
randomised to 4-months of PRT (three times per week, 80% 1-RM) with post
exercise consumption of a either a dairy based protein supplement (13.5 g protein
and 3.5 g of leucine), soy based protein supplement (12 g of protein and 3.5 g of
leucine) or a placebo product (0.6 g of protein) found no within group changes (in
any groups) or between-groups differences in triglycerides, LDL and HDL
cholesterol or inflammatory markers (TNF-α, IL-6 or hs-CRP) (524). This was
despite above 90% compliance with the supplements in each of the groups. There
were no marked changes in weight or fat mass which has been associated with
improvements in triglycerides and cholesterol levels along with blood pressure and
likely explains the null findings.
Further research is still required to ascertain if increased dietary protein/protein
supplements can enhance the cardiovascular benefits of PRT in older adults and/or
those with T2DM. Given the studies conducted to date have prescribed relatively low
doses of protein that have resulted in only modest increases in dietary protein along
with the discrepancies in trial designs and population groups studied, there is a clear

Chapter 2
Page | 104
need for further large scale RCTs investigating the cardiovascular health benefits of
PRT combined increased protein/protein supplements in older adults with T2DM.
The effects of combining PRT (and aerobic exercise) with vitamin D (and protein
supplements) on cardiovascular risk factors may provide a greater beneficial effect
than either alone. However, the available evidence in this area is limited with only
one study conducted in older women with T2DM assessing cardiovascular risk
factors as discussed extensively in section 2.11.1 (502). In comparison to controls,
women allocated to the PRT and vitamin D supplemented group experienced
significantly greater reductions in serum triglyceride (-17.2 vs 20.3%, P<0.05), total
cholesterol (-12.5 vs 3.5%, P<0.001) and LDL cholesterol levels (-9.7 vs 6.4%,
P<0.001) whilst improving HDL cholesterol levels (8.5 vs -16.5%, P<0.001) (502).
Significant improvements in these same parameters were not observed in those
receiving only the vitamin D supplements (502). Whilst only small in sample size
and failing to report important information, including baseline and follow-up serum
25(OH)D levels, this study demonstrated the combination of PRT plus vitamin D
supplementation may have a positive effect on cardiovascular health outcomes not
seen with vitamin D treatment alone. It is possible these benefits were due largely to
the PRT program as opposed to the additive effect of vitamin D supplements. PRT
alone only significantly improved total cholesterol (-7.4%), LDL (-8.7%) and HDL
(6.7%) cholesterol levels, but not triglycerides (502). These improvements were also
of a lower magnitude than the PRT and vitamin D group (Figure 2.9).

Chapter 2
Page | 105
Figure 2.9: Absolute percentage change in total cholesterol, HDL cholesterol, LDL cholesterol and triglycerides following a 12-week intervention of multi-modal exercise, multi-modal exercise plus 1,200 IU/day of vitamin D, 1,200 IU/day of vitamin D alone or control. Taken from Kim et al. (502). *P<0.05 †P<0.01 significantly different from baseline. Values without a common letter are significantly different.
Excess adiposity has a negative effect on blood pressure, inflammation and other
cardiovascular health risk factors, including serum lipid and cholesterol levels (525).
Conversely, reductions in fat mass resulting from participation in exercise can
improve these outcomes (526). All participants in the previous study by Kim et al.
(502) performing the PRT and aerobic training, irrespective of receiving vitamin D
or a placebo, experienced similar significant reductions in total abdominal fat area
compared to baseline. It is thus possible that the improvements in serum lipids and
cholesterol levels observed in this study were influenced by the reductions in fat
mass resulting from the exercise program as opposed to the combined effect of
exercise and vitamin D. The limited evidence in this area makes conclusions about
the effects of exercise/PRT and vitamin D on serum lipid and cholesterol levels
difficult and thus it is evident that further studies prescribing a range of vitamin D
doses to participants with varying baseline serum 25(OH)D status with or without
PRT remain warranted due to the limited evidence available, some confounding in

Chapter 2
Page | 106
the available evidence and limited reporting in the studies conducted (i.e. baseline
serum 25(OH)D status and final serum level) to decisively establish if greater
improvements in lipid, cholesterol, blood pressure and/or inflammation can occur
from the combined effects of PRT and vitamin D.
In recent years, there has been some interest into whether multi-nutrient supplements
such as protein and vitamin D combined with PRT can improve various health
outcomes of older adults. However, few studies have included cardiovascular health
measures in their trial design (42, 513, 527). In one of the only studies to include
such measures, Abizanda et al. (527) examined the effects of a multi-nutrient
supplement (2x200 ml bottles containing 500 IU of vitamin D, 20 g of protein and
480 mg of calcium/day) plus resistance, function and balance training (performed 5
days per week) on inflammation and cholesterol in 91 elderly adults (>70 years). No
changes were detected following the 12-week intervention on total cholesterol or hs-
CRP, which may have been due to factors such as participants presenting with
normal total cholesterol levels at baseline, the relatively low dose of vitamin D used
(possibly not altering serum 25(OH)D status), the short duration of the intervention
or that the training program/intensity was insufficient to illicit a change in
cardiovascular health outcomes in these frail older adults. A limitation of this trial
and the reporting of the results was that the source/type of protein used in the
supplement was not identified thus its quality is unknown, the baseline and change in
habitual protein intake was also not reported. Further, baseline serum 25(OH)D
status (or the magnitude of the change in 25(OH)D levels) was not reported
numerically although we were informed most of the participants were deficient in
vitamin D. One or a combination of these factors could have influenced the findings
of this trial. Additionally, this study was not a RCT so the results were not compared
to a control or exercise alone group. Another trial, provided a once daily nutritional
supplement containing 22 g of whey protein and 100 IU of vitamin D to frail older
(mean age 80.3 years) adults whilst participating in a supervised multi-modal
exercise program (20 minutes per session, 5 times per week, moderate-intensity of 12
to 14 on the Borg scale) for 12-weeks and reported a non-significant reduction in hs-
CRP [−0.19 mg/dL (95% CI, −0.57, 0.19) P=0.329] and a non-significant increase
[0.44 mg/dL (95% CI, −0.02, 0.90) P=0.06] in the control group (placebo plus

Chapter 2
Page | 107
exercise) such that there was a significant between-group difference (P=0.038) (513).
Unfortunately, other parameters such as triglyceride, cholesterol and blood pressure
levels were not assessed in this study.
Whilst only scarce, and far from compelling, there is some promising evidence of an
additive effect of PRT or multi-modal exercise, protein and vitamin D supplements
on improving some cardiovascular risk factors in older adults. Yet given the paucity
of this data, there is a pronounced need for trials to examine the additive effects of
protein and vitamin D supplements in addition to PRT to ascertain if this novel
combination provides a more pronounced effect on a combination of these risk
factors in older adults with T2DM. Should the combination of these strategies prove
to be beneficial for a range of cardiovascular outcomes, such a strategy could play a
significant role in reducing risk for CVD morbidity and mortality experienced by
many older adults with T2DM.
2.12 Summary
Skeletal muscle mass is of critical importance to those with T2DM as it is the largest
mass of insulin sensitive tissue and the primary site for glucose disposal. Losses in
muscle mass can negatively impact metabolic rate further compounding the problems
of insulin resistance and glycaemic control as well as exacerbate cardiovascular risk
factors. PRT is one of the few approaches that can simultaneously have beneficial
effects on almost all the above factors, but most trials to date have been conducted in
a tightly-controlled clinical exercise laboratory environments with little examination
of the ‘real-world’ effectiveness of such an exercise program. Nutritional
modification and/or caloric restriction are also recognised as primary elements in the
ongoing management of T2DM. Combining PRT with dietary modification may
offer an additive effect on glycaemic and insulinaemic outcomes, body composition
and cardiovascular risk factors compared to either strategy alone. Historically,
caloric restriction has been recommended to adults with T2DM with the goal to
reduce weight and fat mass, but such an approach has been associated with a loss in
skeletal muscle mass. However, few long-term trials have examined the effects of
PRT combined with calorie restriction on glycaemic control, muscle mass and
markers of systemic inflammatory in adults with T2DM.

Chapter 2
Page | 108
Over the past two decades, there has been a growing body of evidence indicating that
an increase in dietary protein, particularly rapidly digested proteins rich in leucine,
such as whey protein, can enhance the anabolic effects of PRT on muscle.
Favourable acute effects of whey protein alone on insulin and glucose have also been
observed in those with T2DM. However, no studies have examined the long-term
benefits of PRT combined with daily whey protein supplementation on lean mass,
size and strength, glycaemic control, insulin resistance or cardiovascular risk factors
in older adults with T2DM. Additionally, there is mounting evidence that vitamin D
supplementation may offer several skeletal and non-skeletal health benefits of
relevance to those with T2DM, including improvements in glucose tolerance and
insulin resistance. However, the findings from intervention trials to date have been
mixed with little consistency in the dose of vitamin D provided or the population
groups examined.
Given that the prevalence of T2DM is projected to reach ~ 584 million by the year
2040, there is an urgent need to develop evidence-based management programs for
older adults with T2DM that can simultaneously improve skeletal muscle mass,
glycaemic control and cardiovascular risk factors whilst being safe, practical and
widely accessible for people with this disease. Evaluating the efficacy of a lifestyle
approach that incorporates PRT in combination with a protein enriched supplement
and vitamin D has the potential to underpin more precise exercise and nutrition
guidelines for the management of glycaemic control, insulin sensitivity, body
composition and cardiovascular risk factors along with the ongoing refinement of
community-based initiatives for the management of this condition.

Page | 109
Chapter 3
Effects of Progressive Resistance Training and Weight Loss versus
Weight Loss alone on Inflammatory and Endothelial Biomarkers in
Older Adults with Type 2 Diabetes:
A 12-month Randomised Controlled Trial

Chapter 3
Page | 110
3.1 Declaration Statement
The findings from this chapter represent secondary analysis of a previous 12-month
RCT in which the primary aim was to investigate the effects of high-intensity
progressive resistance training with moderate weight loss compared to weight loss
alone on glycaemic control, body composition and blood lipids in older overweight
and obese adults with type 2 diabetes (T2DM). As a result, some findings presented
within this chapter have previously been published, however, these have been
appropriately cited. The aim of this study (and the analysis retrospectively performed
as part of my thesis)) is to investigate the effects of the 6-month supervised PRT plus
weight loss intervention compared to weight loss alone and the subsequent 6-month
home-based training on systemic and endothelial markers of inflammation, including
serum IL-6, TNF-α, ICAM-1, resistin, IL-10 and adiponectin in older overweight
adults with T2DM.

Chapter 3
Page | 111
3.2 Abstract
Circulating markers of inflammation and endothelial function are often increased in
people with type 2 diabetes mellitus (T2DM), and have been associated with
increased risk of cardiovascular disease and diabetes-related complications. Aerobic
exercise has been shown to improve these biomarkers in adults with T2DM, but
whether high-intensity progressive resistance training (PRT) with weight loss (WL)
is effective remains uncertain. In this 12-month randomised controlled trial (RCT)
we investigated the effects of PRT+WL versus WL alone on systemic and
endothelial markers of inflammation, including serum interleukin-10 (IL-10), IL-6,
tumour necrosis factor (TNF)-α, adiponectin, intercellular adhesion molecule-1
(ICAM-1) and resistin, in older overweight adults with T2DM. Sedentary,
overweight adults aged 60-80 years with poorly controlled T2DM were randomised
to 6-months of supervised PRT+WL (n=19) or a supervised stretching (sham)
program plus WL (n=17) followed by 6-months of home-training without dietary
modification. DXA was used to assess total body fat mass and lean mass. Fasted
blood samples were collected at baseline and subsequent 3-month intervals. Markers
of inflammation were measured using a Milliplex immunoassay assay kit. Exercise
compliance was similar between groups (phase 1, 86%; phase 2, 75%). Both groups
lost similar amounts of weight and fat mass (P<0.01) during the supervised training,
but PRT+WL had a net 0.9 kg gain in lean mass compared to WL (P<0.05) over the
initial 6-months. These results were not maintained during the home-based training
with similar significant increases in both groups for weight and fat mass (P range
<0.05-0.01) compared to the 6-month mark. There were no significant within-group
changes or between-group differences detected for any inflammatory or endothelial
biomarker following the 6-month supervised exercise and WL phase. There was a
greater reduction in IL-10 at 9-months in the PRT+WL relative to WL group
(P=0.033). There was also a greater reduction in TNF-α at 9- and 12-months in the
PRT+WL relative to WL group (P=0.026 and P=0.024, respectively). Serum
adiponectin increased in the PRT+WL relative to WL group after 12-months
(P=0.036). All results were adjusted for baseline values, age, weight, sex, diabetes
duration, medication use and any change in medication. In conclusion, the main
finding from this 12-month trial was that a 6-month moderate weight loss program
with and without high-intensity gymnasium-based PRT did not change any markers

Chapter 3
Page | 112
of systemic inflammation or endothelial function in older overweight adults with
T2DM during weight loss. However, a further 6-months of continued home-based
PRT independent of change in weight can result in some improvements in certain
inflammatory markers in older overweight adults with type 2 diabetes compared to
sham-exercise.

Chapter 3
Page | 113
3.3 Introduction
Type 2 diabetes is a common chronic disease that is currently estimated to affect 373
million people globally (528). Although type 2 diabetes is considered a multifactorial
disease caused by a combination of genetic and lifestyle-related factors, it has also
been associated with an increase in circulating levels of pro-inflammatory cytokines
including tumour necrosis factor-α (TNF-α), interleukin-6 (IL-6) and high sensitive
C-reactive protein (hs-CRP) with concomitant lower levels of anti-inflammatory
markers such as interleukin-10 (IL-10) and adiponectin (529, 530). Clinically these
changes in inflammatory cytokines are important as they have been associated with a
decrease in beta-cell insulin secretion and an increase in insulin resistance (19, 20),
along with the development and progression of various micro- and macro-vascular
complications (16, 531). Thus, there has been considerable interest in identifying
strategies that can improve the inflammatory profile of adults with type 2 diabetes.
It is widely recognised that adipose tissue is an endocrine organ that can secrete a
variety of inflammatory proteins (adipokines). As such, obesity has been associated
with subclinical systemic inflammation, which may explain in part its link to insulin
resistance and the development of T2DM (532, 533). To counter this increase in
chronic systemic inflammation, weight loss or dietary modification are often
recommended. In obese adults without diabetes and to a lesser extent people with
T2DM, there is some evidence that diet induced weight loss can positively affect
circulating pro-inflammatory cytokines and increase anti-inflammatory markers such
as adiponectin (17, 33, 534, 535), but the findings remain mixed likely related to the
magnitude of the weight loss (536, 537). Indeed, two studies have suggested the most
consistent improvements in inflammatory markers are observed with at least a 10%
reduction in weight (538, 539).
Exercise training has also been shown to have a role in lowering chronic low-grade
inflammation, particularly in people who are overweight or obese and/or have been
diagnosed with a chronic disease (15). In a meta-analysis that included 14 RCTs in
people with T2DM, Hayashino et al. (244) reported that exercise was associated with
a significant decrease in circulating levels of hs-CRP and IL-6, but not adiponectin or
resistin. It was also observed the greatest benefits were apparent following aerobic
training, but only three resistance training trials were included and all were short-

Chapter 3
Page | 114
term (12- to 16-weeks). A recent 12-month intervention in older adults with T2DM
found that progressive resistance training (PRT) alone was associated with a
significant reduction in hs-CRP levels compared to sham exercise (238).
Interestingly, the exercise-induced improvements in hs-CRP in this study were found
to be mediated by both a reduction in fat mass and an improvement muscle mass
(238). This suggests that the greatest benefits on inflammation may be achieved with
fat loss combined with muscle gain. Recently, a limited number of studies in
overweight and obese adults and those with T2DM have reported that exercise,
primarily aerobic training, combined with weight loss arising from caloric restriction,
is more effective at improving various inflammatory markers than either exercise or
caloric restriction alone (31, 33, 34, 523, 540). However, the effects of PRT
combined with weight loss on circulating inflammatory markers has not been
examined in adults with type 2 diabetes.
This study is a secondary analysis using archived blood samples and existing data
from a 12-month RCT that was originally designed to examine the effects of PRT
plus weight loss on glycaemic control and body composition compared to weight
loss alone in older adults diagnosed with T2DM (12, 14). As previously reported, 6-
months of high-intensity PRT performed within a controlled and supervised research
setting (gymnasium) in combination with weight loss was found to be effective for
improving glycated haemoglobin (HbA1c), total body lean mass and muscle strength
compared to weight loss alone in older adults with poorly controlled T2DM; both
groups lost a similar amount of weight and fat mass. In addition, following a further
6-months of home-based training with no further recommendations for weight loss,
PRT performed at home was effective for maintaining the benefits on muscle mass
and strength, but both groups experienced similar significant increases in weight, fat
mass and HbA1c although overall body weight remained significantly lower than
baseline levels in both groups (14). Building on these findings, the aim of this study
is to investigate the effects of the 6-month supervised PRT plus weight loss
intervention compared to weight loss alone and the subsequent 6-month home-based
training on systemic and endothelial markers of inflammation, including serum IL-6,
TNF-α, ICAM-1, resistin, IL-10 and adiponectin in older overweight adults with
T2DM. It was hypothesised that PRT combined with weight loss would lead to

Chapter 3
Page | 115
greater improvements in various inflammatory and endothelial markers than weight
loss alone in older adults with T2DM.
3.4 Methods
3.4.1 Participants
As previously described (12, 14), men and women aged between 60-80 years, with
treated (diet and/or oral hypoglycaemic medications) T2DM, were recruited from the
International Diabetes Institute clinics and a local media campaign. Detailed
information on the recruitment methods and screening procedures have been
previously published (12, 14). Participants were eligible for the study if they were:
(1) overweight or obese (BMI>27 kg/m2 and ≤40 kg/m2); (2) not engaged in regular
PRT and undertaking less than 150-minutes of brisk walking or moderate exercise
per week or undertaking > 60-minutes of vigorous exercise per week in the preceding
6-months; (3) had established but not optimally controlled T2DM (HbA1c range 7-
10%); (4) were not prescribed insulin and were non-smokers. Any prescribed anti-
diabetic and anti-hypertensive medications were continued during the study period.
3.4.2 Study Design
This study was a two arm, 12-month RCT that was separated into two distinct phases
as previously reported and discussed in greater detail below (12, 14). Phase 1
consisted of 6-months of supervised and structured gymnasium-based training (PRT
or sham exercise) with moderate weight loss (WL). Phase 2 consisted of a further 6-
months of home-based PRT or sham-exercise training without specific dietary
advice. Participants were randomised to one of the two groups by an independent
staff member not involved in the study using a computer generated random numbers
table (Microsoft Excel, Office 97). As shown in Figure 3.1, of the 36 participants
initially randomised to either PRT+WL (n=19) or WL (n=17), 20 had a history of
hypertension, three had a history of neuropathy, one had a history of retinopathy, and
seven reported a history of arthritis. During phase 1, two participants from the
PRT+WL group and four participants from the WL group withdrew from the study
during the first 8-weeks. The reasons for withdrawal included health problems not
related to the intervention (n=2) or other commitments that precluded ongoing

Chapter 3
Page | 116
participation (n=4). One participant from the PRT+WL group was placed on insulin
treatment within the first 6-weeks of the trial and was not included in any analysis.
Thus, 29 participants [16 PRT+ WL (84%) and 13 WL (76%)] successfully
completed phase 1 of the intervention (12, 14). During the home-based training, a
further three participants withdrew from the study (PRT+WL, n=2; WL, n=1). All
withdrawals occurred within the first 2-weeks of the home-based training. Reasons
for withdrawals included overseas travel, continued pain associated with
osteoarthritis of the knee and personal problems unrelated to the study. Thus, 72% of
the participants [PRT+WL, n=14 (74%); WL, n=12 (71%)] completed the 12-month
intervention. Outcome assessments for all participants were performed by the same
research staff, but not all staff were blinded to the group allocation.

Chapter 3
Page | 117
Figure 3.1: CONSORT flow diagram of participants through the trial.
Progressive resistance training plus weight loss (PRT+WL); weight loss (WL).
3.4.3 Ethics
The study was approved by the International Diabetes Institute and Deakin
University Human Research Ethics Committees. Written informed consent was
obtained from all participants prior to their participation in the research program.
3.4.4 Intervention
This study was a 12-month RCT with measurements performed at baseline and
subsequent 3-month intervals. As reported above, the intervention was divided into
two distinct phases (supervised gymnasium based and home-based) which are
described in detail below.

Chapter 3
Page | 118
Phase 1: Supervised gymnasium-based training plus weight loss program
Participants were randomly assigned to either PRT+WL (n=19) or a moderate weight
loss group plus ‘sham’ exercise program (flexibility exercise) (WL, n=17). All
training was conducted within a controlled exercise laboratory and participants were
asked to train on three non-consecutive days per week. Those in the PRT+WL group
performed a 5-minute warm up and 5-minute cool-down period of low-intensity
stationary cycling and approximately 45-minutes of high-intensity PRT (dynamic
exercise involving concentric and eccentric contractions). During the first and second
weeks of training, the resistance was set at 50-60% of an individual’s 1-repetition
maximum (RM). The 1-RM was defined as the maximum amount of resistance that
could be moved through the full range of motion of an exercise for no more than one
repetition. Thereafter, the goal for each training session was to lift a weight
consistently between 75 and 85% of 1-RM. Participants followed an individually
supervised PRT program using free weights and a multiple station weight machine.
Nine exercises were used for training which included bench press, leg extension,
upright row, lateral pull-down, standing leg curl (ankle weights), dumbbell seated
shoulder press, dumbbell seated bicep curl, dumbbell triceps kickback and abdominal
curls. All participants were instructed to perform each repetition in a slow, controlled
manner, with a rest of 90- to 120-seconds between sets. Three sets of 8 to 10
repetitions were performed for all exercises with the exception of abdominal curls at
each training session. All sessions were supervised to ensure correct technique and to
monitor the appropriate amount of exercise and rest intervals. The training work load
was increased regularly as tolerated for each muscle group after participants had
successfully achieved three sets of 10 repetitions with appropriate technique. Every
12-weeks the 1-RM testing was repeated to establish a new baseline to maintain
training intensity between 75-85% of 1-RM. Exercise compliance was computed
from the exercise cards completed by the participants at each gym visit and checked
by the research staff after each session. During the supervised gymnasium-based
training phase compliance with the exercise program was 88% and 85% for the PRT
+ WL and WL groups respectively.
The ‘sham’ exercise program with WL was designed to only provide participative
involvement but not elicit change in muscle strength, mass or cardiovascular fitness.

Chapter 3
Page | 119
Each session involved stationary cycling with no workload for 5-minutes, followed
by a series of static stretching exercises for approximately 30-minutes. Participants
were not blinded to the treatments and were informed that improved flexibility was
an expected outcome of the study.
Weight loss/Healthy eating plan
A healthy eating program was implemented under the supervision of a qualified
dietitian four weeks prior to the commencement of phase 1. All participants were
placed on a healthy eating plan supplying 30% or less of the total energy intake from
fat (<10% from saturated fat), with the remainder distributed between carbohydrates
and protein (12, 14). The healthy eating component of the study was designed to
elicit a moderate weight loss of approximately 0.25 to 0.50 kg per week over the
course of phase 1. All eating plans were individually prescribed by a dietitian
calculated by utilising two separate 3-day food records performed during the initial
4-week baseline period. The macronutrient breakdown of the diets was as follows:
carbohydrate 55-60%, protein at least 0.8 g/kg, fat < 30%, cholesterol < 300 mg/day
and fibre 40 g/day. Compliance with the healthy eating program was assessed via
dietitian lead interviews every 2-weeks thereafter and by completion of a weekly
food checklist. A 3-day food record was obtained at all subsequent assessments in
order to evaluate changes in nutrient intake. Nutritional information obtained from
food records was analysed by a dietitian using nutrient analysis software (Foodworks
V2.10, Xyris Software, Queensland, Australia).
Phase 2: Home-based Training
At the completion of the gymnasium-based training, all participants were provided
with individualised instructions and equipment (dumbbells/ankle weights or a
flexibility wall chart) to continue the training at home or a commercial/community
facility 3-days per week. No participants in the PRT+WL group continued their
training programs within commercial or community facilities during this phase. To
accommodate the transition from supervised gymnasium-based to home-based
training, participants in the PRT+WL group completed their home-based exercise
programs within the supervised gymnasium-based training phase for the final 4-
weeks of phase 1. The home-based exercises were similar to those used in the

Chapter 3
Page | 120
gymnasium-based program, with the exception that dumbbells and ankle weights
replaced the exercises performed on the multi-station weight machines. As reported
previously in (14), the dumbbells provided for the home-based training provided
capacity for workloads between 2.5 and 30 kg, and the ankle weights provided
workloads between 0.5 and 20 kg. Additional weights were provided periodically to
facilitate progression. The nine-home-based exercises included lying dumbbell flies,
seated single leg-extension (ankle weighted), dumbbell shoulder press, dumbbell
bent-over row, standing leg curl (ankle weights), dumbbell upright row, dumbbell
triceps kickback and abdominal curls. Participants were also provided with detailed
instruction booklets containing detailed descriptions on each resistance training
exercise and how to safely perform these exercises, and were asked to follow an
individually prescribed training program (3 sets of 8-10 repetitions) with the goal to
exercise at an intensity corresponding to approximately 60-80% of the current 1-RM.
However, it was estimated previously (14) that the volume of training reduced by
~52% from the gymnasium-based program to the home-based program largely
explained by the reduction in the amount of weight lifted. During the home-based
training program, it was impossible to retain the absolute workload of the gym-based
program as various exercises performed using machine weights had a total workload
capacity much larger than that provided or available from hand or leg weights.
During the first week of the home-based training, home visits were conducted to
ensure the training environment was appropriate and safe. Participants were
telephoned weekly for the first 4-weeks and every fortnight thereafter to monitor
compliance, answer any questions and provide program feedback. In addition,
participants recorded their training in training diaries each week and were asked to
attend the gymnasium monthly to perform the home-based training program so that
technique and progression could be monitored. During phase 2, participants were not
required to follow a healthy eating plan, the monitoring and compliance with
dietitians was ceased and participants were free to consume food ad-libitum.
The sham exercise group was provided with a stretching wall chart and was asked to
continue with the stretching program at home. Participants were telephoned weekly
for the first 4-weeks and every 2-weeks thereafter to monitor compliance, answer
questions and provide individualised feedback. All participants also completed
Chapter 3
Page | 121
weekly training diaries and were required to attend Deakin University monthly to
perform the home-based training so that technique and progression could be
monitored. During the home-based training phase, exercise compliance was similarly
reported at 73% and 78% in the PRT + WL and WL groups respectively.
3.4.5 Measurements
Detailed information about the methodology related to the key outcomes, including
glycated haemoglobin, fasting plasma glucose (FPG), fasting insulin, insulin
sensitivity, body composition and muscle strength, as well as height, weight, habitual
physical activity and medication use, have previously been reported (12, 14).
3.4.5.1 Cytokine and Endothelial Inflammatory Markers Measurements
In order to measure cytokine and endothelial markers of inflammation morning blood
samples were obtained from each participant following an overnight fast at baseline,
3-, 6-, 9- and 12-months. All samples were collected at least 48-hours post-exercise.
Of the 29 participants at baseline, two participants had insufficient serum available
for analysis at baseline and 3-months with a further seven at 6-months. During the
home-based training, five participants at 9-months and six participants at 12-months
had insufficient serum available for analysis. The following parameters were
measured by Cardinal Bio-research Pty Ltd (Australia) approximately 10-years after
the trial was completed with the serum samples stored at -80º C during this time.
Serum concentrations of IL-6, IL-10 and TNF-ɑ were measured in duplicate using a
Millipore high sensitive cytokine immunoassay assay kit (Millipore Corp, Billerica,
Massachusetts, USA) as per the manufacturer’s instructions. The mean intra and
inter-assay CVs for IL-6, IL-10 and TNF-ɑ were <12%. The mean intra and inter-
assay CVs for adiponectin, ICAM-1 and resistin were <8%. Adiponectin, ICAM-1
and resistin were assayed using an in-house multiplex immunoassay. Reagents were
prepared as per previously described (541). Capture and detection antibodies were
obtained from R&D Systems (Minneapolis, MN USA). The mean intra- and inter-
assay CV was <8%. Samples with results below the lowest detectable limits of the
assay were allocated the minimum detectable concentration: IL-6 = 0.1 pg/mL; IL-10

Chapter 3
Page | 122
= 0.1 pg/mL; TNF-ɑ = 0.8 pg/mL; adiponectin = 0.01 µg/mL; ICAM-1 = 0.3 ng/mL
and resistin = 0.05 ng/mL.
3.4.6 Statistical Analysis
Statistical analysis was conducted using Stata statistical software release 14 (College
Station, TX: StataCorp LP.). All data was checked for normality and the cytokines
IL-10, IL-6 and TNF-α, and the endothelial marker ICAM-1 were log-transformed
prior to analysis to improve normality. The data was analysed on a modified
intention-to-treat basis, including all randomly assigned participants with at least one
follow-up observation. Linear mixed models with random intercepts were fitted for
each outcome including fixed effects for time, group, and an interaction between
group and time. The models were adjusted for baseline values (model 1) and
baseline, age, weight, sex, diabetes duration, medication use and any change in
medication during the intervention (model 2). Between-group differences were
calculated by subtracting within-group changes from baseline for the PRT+WL
group from within-group changes for the WL group after 3-, 6-, 9- and 12-months.
Results from all models are reported as marginal means with 95% confidence
intervals, back-transformed for any log transformed variables. No data imputation
was used for missing data as one of the strengths of the linear mixed model is that it
can handle missing data points without excluding participants. The percentage of
change in results Figures 3.1 and 3.2 represents the absolute difference from baseline
in the log transformed data multiplied by 100. P<0.05 was used to determine
statistical significance. Data presented as mean ± SD unless otherwise specified.
3.5 Results
Baseline characteristics for the 29 participants included in the 12-month intervention
have previously been reported and are shown in Table 3.1 (12, 14). There were no
group differences in age, weight, BMI, diabetes duration, use of oral hypoglycaemic
medication, energy intake or physical activity. Similarly, the groups were well
matched for total body fat and lean mass (Table 3.1).

Chapter 3
Page | 123
Table 3.1 Baseline descriptive characteristics of the PRT+WL and WL group. Reported previously in (12).
PRT + WL WL
n 16 13
Age (years) 67.6 ± 5.2 66.9 ± 5.3
Sex (M/F) 10/6 6/7
Duration of diabetes (years) 7.6 ± 5.4 8.8 ± 7.9
Oral hypoglycaemic medication use (n) 15 10
Weight (kg) 88.7 ± 10.9 89.5 ± 12.1
Total body lean mass (kg) 33.1 ± 7.4 35.6 ± 6.8
Total body fat mass (kg) 51.8 ± 8.1 49.7 ± 9.5
BMI (kg/m2) 31.5 ± 3.4 32.5 ± 3.8
HbA1c (%) 8.1 ± 1.0 7.5 ± 1.1
Total energy intake (kcal/day) 1,783 ± 349 1,815 ± 431
Estimated energy expenditure (kcal/day)1 3,022 ± 413 3,109 ± 428
Values represent mean ± SD or number. 1 Calculated from 7-day recall.
As already stated, the primary outcomes of the original trial have previously been
published (12, 14). A brief summary of these published results is provided below for
the reviewer’s benefit. Following the 6-month supervised training program, both the
PRT+WL and WL groups experienced a similar significant reduction in weight
(mean change ± SD; PRT+WL -2.5 ± 2.9 kg; WL -3.1 ± 2.1 kg) and total body fat
mass (PRT+WL -2.4 ± 2.7 kg; WL -2.7 ± 2.5 kg) (12). In contrast, there was a net
benefit of 0.9 kg (95% CI, 0.05–1.8) in total body lean mass to the PRT+WL group
(group-by-time interaction, P<0.05). This was due to an increase in lean mass in the
PRT+WL group (mean change, 0.5 kg (0.3, 0.7)) and decreased in the WL group
(mean change, -0.4.kg (-0.7, -0.1)) (12). The PRT+WL program was also associated
with a significant reduction in HbA1c [mean absolute change; -1.2% (95% CI, -1.7, -
0.7)] following supervised training relative to the WL group [-0.4% (95% CI, -0.9,
0.1)] (group-by-time interaction, P<0.05) (12). As expected, the PRT+WL group
experienced a significantly greater increase in both upper and lower body strength
throughout the supervised training intervention compared to the WL group
(interaction terms P<0.01) (12). Following home-based training, both groups

Chapter 3
Page | 124
experienced similar significant increases in body weight compared to the end of the
supervised-training [mean change (kg): PRT+WL, 1.4 kg (95% CI, 0.5, 2.3), WL,
1.5 kg (95% CI, 0.4, 2.6)] and fat mass [PRT+WL, 1.8 kg (95% CI, 0.7, 2.7); WL,
2.0 kg (95% CI, 0.8, 3.0)]. However, weight remained significantly lower than
baseline in both groups (14). Lean mass did not change significantly in either group
during the home-based training (6- to 12-months), but a significant 0.6 kg (95% CI, -
0.9, -0.4) reduction was observed in the WL group from baseline to 12-months
(P<0.05). HbA1c levels increased significantly in both groups during the home-based
training (both P<0.05), and the net benefit observed in the PRT+WL after the
supervised training was not maintained following the 6-month home-based training.
However, the improvements in upper and lower-body strength observed following
supervised training in the PRT+WL group were maintained at the completion of the
home-based training (14).
3.5.1 Changes in Inflammatory Cytokines
The baseline values and the percentage change from baseline in serum IL-10, IL-6
and TNF-α for both groups across the supervised and home-based training are
presented Table 3.2 and Figure 3.2. At baseline, serum IL-6 was higher in the
PRT+WL compared WL group at baseline (P=0.05).
Overall, there were no within-group changes or between-group differences for the
change over time in serum IL-6, TNF-α or IL-10 after 3-, 6-, 9- or 12-months, with
the exception of the following: 1) there was a significant decrease relative to baseline
in TNF-α in the PRT+WL group at both 9-months [mean change, -1.26 pg/ml (95%
CI, -2.37, -0.15); P=0.026] and 12-months [2.09 pg/ml (95% CI, -3.13, -1.06);
P=0.001], which resulted in a significant difference for the change over time relative
to the WL group [mean difference: 9-months, 2.37 pg/ml (95% CI, -4.37, -0.37);
P=0.020; 12-months, 2.22 pg/ml (95% CI, -4.06, -0.38); P=0.018)] which remained
unchanged after adjustment for age, sex, weight, duration of diabetes, use of oral
hypoglycaemic medication and any change in medication 2) there was a meaningful
between-group difference for the change in IL-10 after 9-months [mean difference, -
2.20 pg/ml (95% CI, -5.12, -0.71); P=0.138], which became significant after
adjusting for confounders (P=0.033) including age, sex, weight, duration of diabetes,

Chapter 3
Page | 125
use of oral hypoglycaemic medication and any change in medication. This was
driven by a non-significant reduction in the PRT+WL group [mean change, 0.94
pg/ml (95% CI, -2.23, 0.34); P=0.150] and non-significant increase in the WL group
[1.26 pg/ml (95% CI, -1.32, 3.84); P=0.337].

Page | 126
Table 3.2 Mean baseline values and the percentage change relative to baseline for serum IL-10, IL-6 and TNF-α for the PRT+WL and WL groups after 3-, 6-, 9- and 12-months.
Baseline Values and Within Group Changes
PRT+WL WL Intervention Effects
Mean ± SD or (95% CI) P-value Mean ± SD or
(95% CI) P-value Net Difference (95% CI)
P- values Model 1 | Model 2
IL-10
Baseline (pg/ml) 14.12 ± 19.17 ‡ 4.20 ± 5.67
∆ 3-month -0.80 (-2.10, 0.50) 0.227 -0.60 (-2.06, 0.87) 0.424 -0.20 (-2.20, 1.79) 0.840 | 0.524
∆ 6-month -0.89 (-2.18, 0.40) 0.172 0.54 (-1.63, 2.70) 0.628 -1.43(-3.98, 1.12) 0.272 | 0.081
∆ 9-month -0.94 (-2.23, 0.34) 0.150 1.26 (-1.32, 3.84) 0.337 -2.20 (-5.12, 0.71) 0.138 | 0.033
∆ 12-month 0.13 (-1.82, 2.09) 0.894 -0.12 (-1.98, 1.74) 0.896 0.25 (-2.47, 2.99) 0.854 | 0.651
IL-6
Baseline (pg/ml) 3.65 ± 3.06 ‡ 1.61 ± 1.78
∆ 3-month -0.41 (-0.94, 0.12) 0.126 0.24 (-0.58, 1.05) 0.571 -0.65 (-1.67, 0.37) 0.213 | 0.750
∆ 6-month -0.17 (-0.80, 0.47) 0.605 0.33 (-0.57, 1.22) 0.472 -0.50 (-1.64, 0.65) 0.395 | 0.885
∆ 9-month -0.48 (-1.02, 0.06) 0.084 0.99 (-0.19, 2.18) 0.101 -1.47 (-2.83, -0.12) 0.033 | 0.127
∆ 12-month -0.07 (-0.80, 0.66) 0.853 0.79 (-0.33, 1.91) 0.168 -0.86 (-2.25, 0.53) 0.227 | 0.624

Page | 127
TNF-α
Baseline (pg/ml) 8.23 ± 3.64 7.10 ± 5.02
∆ 3-month -0.30 (-1.50, 0.91) 0.629 -0.04 (-1.37, 1.28) 0.947 -0.26 (-2.05, 1.55) 0.784 | 0.820
∆ 6-month 0.14 (-1.19, 1.47) 0.834 0.84 (-0.75, 2.43) 0.299 -0.70 (-2.78, 1.38) 0.508 | 0.552
∆ 9-month -1.26 (-2.37, -0.15) 0.026 1.11 (-0.54, 2.77) 0.188 -2.37 (-4.37, -0.37) 0.020 | 0.026
∆ 12-month -2.09 (-3.13, -1.06) 0.001 0.13 (-1.39, 1.64) 0.871 -2.22 (-4.06, -0.38) 0.018 | 0.024
Baseline values represent mean ± SD and within group changes and net differences represent means with 95% confidence intervals (CI). Intervention effect refers to the within group change from baseline in the intervention group minus the within group change from baseline in the control group. All change values and net differences were derived from model 1 – adjusting for baseline values. Significant differences are highlighted in bold. a P<0.05 vs WL at baseline. Model 1 represents the P-values after adjusting for baseline values. Model 2 represents the P-value after adjusting for baseline values, age, weight, sex, diabetes duration, medication use and any change in medication.

Chapter 3
Page | 128
3.5.2 Change in Adiponectin
At baseline adiponectin was lower in the PRT+WL compared WL group (P=0.004).
Adiponectin levels remained unchanged in the both the PRT+WL and WL group
across the supervised-gymnasium-based training program (Table 3.3 and Figure 3.2).
During the home-based phase, levels of adiponectin in the PRT+WL group increased
by an average of 0.49 µg/ml [(95% CI, 0.03, 0.96); P=0.036] relative to baseline after
12-months, such that there was a significant group-by-time interaction when
adjusting for potential confounders (Model 2, P=0.036).

Page | 129
Table 3.3 Mean baseline values and the percentage change from baseline for serum adiponectin in the PRT+WL and WL groups after 3, 6, 9 and 12-months.
Baseline Values and Within Group Changes
PRT+WL WL Intervention Effects
Mean ± SD or
(95% CI) P-value
Mean ± SD or
(95% CI) P-value
Net Difference
(95% CI)
P- values
Model 1 | Model 2
Adiponectin
Baseline (µg/ml) 1.68 ± 0.66 ‡ 2.67 ± 0.95
∆ 3-month 0.08 (-0.32, 0.48) 0.700 0.27 (-0.15, 0.70) 0.206 -0.19 (-0.80, 0.42) 0.534 | 0.722
∆ 6-month 0.23 (-0.19, 0.64) 0.278 0.25 (-0.21, 0.70) 0.287 -0.02 (-0.66, 0.62) 0.958 | 0.813
∆ 9-month 0.47 (0.03, 0.90) 0.034 0.49 (0.05, 0.94) 0.030 -0.02 (-0.67, 0.61) 0.933 | 0.789
∆ 12-month 0.49 (0.03, 0.96) 0.036 -0.10 (-0.57, 0.36) 0.661 0.59 (-0.07, 1.27) 0.081 | 0.036
Baseline values represent mean ± SD and within group changes and net differences represent means with 95% confidence intervals (CI). Intervention effect refers to the within group change from baseline in the intervention group minus the within group change from baseline in the control group. All change values and net differences were derived from model 1 – adjusting for baseline values. Significant differences are highlighted in bold. a P<0.05 vs WL at baseline. Model 1 represents the P-values after adjusting for baseline values. Model 2 represents the P-value after adjusting for baseline values, age, weight, sex, diabetes duration, medication use and any change in medication.

Page | 130
Figure 3.2: Mean percentage change with 95% CI from baseline for serum A) IL-10, B) TNF-α, C) IL-6 and D) Adiponectin following the gymnasium-based (3 and 6-months) and home-based (9 and 12-months) training for the PRT+WL (●) and WL (○) groups. The percentage changes in log transformed IL-6, IL-10 and TNF-ɑ represent the absolute differences from baseline multiplied by 100. * P<0.05, † P<0.01 for within-group change from baseline; # P<0.05 for between-group difference for the change from baseline. All P-values are based upon results adjusted for covariates.

Chapter 3
Page | 131
3.5.3 Changes in Endothelial Markers
In both the PRT+WL and WL group, there were no significant within or between-
group differences (group-by-time interactions) in either resistin or ICAM-1 at any
time during the study (Table 3.4 and Figure 3.3), with the exception that resistin
decreased significantly in the WL group relative to baseline at 12-months [mean
change -20% (95% CI, -40, 1), P= 0.01]. All results remained unchanged following
adjustment for age, sex, duration of diabetes, use of oral hypoglycaemic medication
and any change in medication.

Page | 132
Table 3.4 Mean baseline values and the percentage change from baseline for serum ICAM-1 and resistin for the PRT+WL and WL groups after 3, 6, 9 and 12-months.
Baseline Values and Within Group Changes PRT+WL WL Intervention Effects
Mean ± SD or
(95% CI) P-value
Mean ± SD or (95% CI)
P-value Net Difference
(95% CI) P- values
Model 1 | Model 2 ICAM-1 Baseline (ng/ml) 134.86 ± 59.58 142.38 ± 69.44 ∆ 3-month 2.37 (-9.36, 14.10) 0.692 1.78 (-10.34,13.90) 0.773 0.59 (-16.25, 17.44) 0.945 | 0.970 ∆ 6-month 0.18 (-11.71, 12.06) 0.977 -8.76 (-20.72, 3.19) 0.151 8.94 (-7.90, 25.79) 0.298 | 0.355 ∆ 9-month -7.81 (-19.29, 3.66) 0.182 -0.80 (-13.61, 12.02) 0.903 -7.02 (-24.22, 10.18) 0.424 | 0.462 ∆ 12-month -12.64 (-24.58, -0.70) 0.038 -10.03 (-22.37, 2.31) 0.111 -2.61 (-19.79, 14.56) 0.766 | 0.797 Resistin Baseline (ng/ml) 10.54 ± 5.64 10.99 ± 3.86 ∆ 3-month 1.16 (-0.14, 2.46) 0.080 0.59 (-0.71, 1.89) 0.373 0.57 (-1.27, 2.41) 0.542 | 0.417 ∆ 6-month 0.53 (-0.82, 1.87) 0.441 -0.02 (-1.42, 1.38) 0.979 0.55 (-1.40, 2.49) 0.581 | 0.267 ∆ 9-month -0.23 (-1.57, 1.11) 0.736 0.39 (-1.01, 1.80) 0.584 -0.62 (-2.57, 1.32) 0.530 | 0.921 ∆ 12-month -1.97 (-3.44, -0.50) 0.008 -0.84 (-2.31, 0.63) 0.263 -1.13 (-3.21, 0.95) 0.286 | 0.618
Baseline values represent mean ± SD and within group changes and net differences represent means with 95% confidence intervals (CI). Intervention effect refers to the within group change from baseline in the intervention group minus the within group change from baseline in the control group. All change values and net differences were derived from model 1 – adjusting for baseline values. Significant differences are highlighted in bold. Model 1 represents the P-values after adjusting for baseline values. Model 2 represents the P-value after adjusting for baseline values, age, weight, sex, diabetes duration, medication use and any change in medication.

Chapter 3
Page | 133
Figure 3.3: Mean percentage change with 95% CI from baseline for serum A) ICAM-1 and B) Resistin following the gymnasium-based (3- and 6-months) and home-based (9- and 12-months) training for the PRT+WL (●) and WL (○) group. The percentage changes in log transformed ICAM-1 represent the absolute differences from baseline multiplied by 100. All P-values are based upon results adjusted for covariates.

Chapter 3
Page | 134
3.6 Discussion
It is well established that obesity is associated with subclinical systemic
inflammation (542) and that dietary-induced weight loss can lower circulating
inflammatory cytokines (543, 544) including in people with T2DM (545). There is
also evidence that regular exercise training including aerobic training, PRT and the
combination, can lower pro-inflammatory cytokines and increase anti-inflammatory
markers in overweight and obese adults (15) and those with T2DM (33, 34, 244). On
this basis, we hypothesised that combining PRT with weight loss would lead to more
favourable changes in circulating markers of inflammation compared to weight loss
alone. However, we found no evidence that moderate diet-induced weight loss alone
or in combination with supervised high-intensity PRT influenced any marker of
inflammation in older overweight and obese adults with T2DM, despite significant
reductions in weight and fat mass (12). Whilst there is some evidence to suggest
inflammatory cytokines undergo some degradation when stored for longer than three
years (546), all inflammatory markers in this study were analysed at the same time
and thus were all under storage for a similar length of time.
Previous studies examining the combined effects of weight loss and exercise training
on inflammatory markers in older obese adults with T2DM are scarce. Nevertheless,
the findings from a 16-week intervention in 34 obese women aged 40-60 years
revealed neither diet alone nor diet plus PRT performed twice per week led to any
changes in circulating levels of IL-6 or CRP and the soluble receptors of TNF-α,
despite a 6 to 8% reduction in total body weight (523). It is difficult to explain our
results and these findings given that a number of interventions in overweight and
obese adults (31, 534, 547, 548) and a larger intervention in adults with T2DM (34)
reported that diet-induced weight loss, alone or in combination with exercise, was
associated with a significant reduction in various inflammatory cytokines. For
instance, the findings from a 12-month multi-centre RCT in 593 individuals with
newly diagnosed T2DM revealed that diet-induced weight loss alone or in
combination with regular physical activity (30 minutes of brisk walking) was
associated with a significant 21-22% reduction in hs-CRP levels (and an
improvement in adiponectin) after 6-months compared to usual care (34). However,

Chapter 3
Page | 135
there was no differences in the magnitude of the change in hs-CRP between the
weight loss alone and weight loss plus exercise group. Subsequent analysis found
that the change in weight mediated around 40% of the total effect on hs-CRP (34).
Although there is evidence that regular exercise can lower systemic inflammation,
independent of changes in body composition (534), this finding is consistent with a
number of previous trials which found that changes in circulating inflammatory
cytokines in response to lifestyle interventions were largely related to weight loss
and not exercise (31, 549).
In our study, the moderate weight loss diet resulted in similar significant reductions
in body weight of 2.8% and 3.5% in the PRT+WL and WL alone groups
respectively. While it has been previously suggested that at least a 10% reduction in
body weight is required to induce a reduction in various inflammatory markers (538),
others have demonstrated that a 5% decrease in body weight can improve the
inflammatory profile in obese adults or those with T2DM (17, 544). The healthy
eating plan was expected to reduce body weight by almost double the amount
observed in our trial, as such it is plausible the lack of significant change in any of
the inflammatory markers in either group in our study during the initial 6-month
period is explained, at least in part, by the smaller reduction in body weight .
Secondary to this, another possible explanation may be the absence of change in
visceral fat. Visceral fat is widely recognised to be a key secretory source for various
systemic inflammatory markers or adipokines, and thus is it possible that the
magnitude of the change in visceral fat in our participants was not enough to improve
inflammation. This is only speculative given that visceral fat was not directly
quantified in our study, however, both groups experienced a similar and significant
6.7 to 7.0 cm reduction in waist circumference after 6-months, which is often used as
surrogate estimate of visceral adiposity (550, 551). A more likely explanation for the
lack of any changes in any of the inflammatory markers in our study is the relatively
modest (mean 2.5 to 3.0 kg) reductions in overall weight (and fat mass).
Interestingly, another study in obese adults with T2DM reported no improvements in
inflammation (hs-CRP) following a 5-6 kg diet-induced weight loss over an 8-week
period, but improvements were observed after 12-months (288). Similarly, a 4-month

Chapter 3
Page | 136
trial in 27 obese adults with T2DM failed to detect any changes in any markers of
inflammation (CRP, IL-1, IL-2, IL-6, IL-8, IL-10, TNF-a) following a very low
caloric diet (VLCD) or VLCD plus exercise, with the exception of a reduction in hs-
CRP in the combination group (35). However, in this study the mean reduction in
weight was 25 kg, and at subsequent follow-ups (6- and 18-months) whereby
participants were in a eucaloric state, significant beneficial effects were observed for
nearly all inflammatory markers. These findings suggest that the duration of the
study or follow-up period may be an important factor in determining the
inflammatory response to lifestyle-related interventions.
Following the 6-month supervised gymnasium-based training plus weight loss
program, we found that 6-months of continued home-based resistance training
resulted in modest improvements in the inflammatory markers TNF-α and
adiponectin, yet a reduction in the anti-inflammatory marker IL-10. This was
somewhat unexpected given that this phase was eucaloric and associated with a 1.3
to 1.5 kg weight regain in both groups. Nevertheless, the improvements in various
inflammatory markers following the home-based maintenance phase supports the
notion that there may be a delay in the inflammatory response to exercise and/or
weight loss. Although there is evidence of acute or short-term changes
(improvements) in markers of inflammation following exercise and/or weight loss, as
discussed above the findings from our 12-month intervention are consistent with the
results from several trials which observed a delayed improvement in inflammatory
markers in both overweight and obese adults and those with T2DM (35, 539). While
the underlying mechanism(s) explaining these findings remain unknown, several
other studies observing a delay in inflammatory marker improvements following
exercise and/or weight loss have proposed this to be due to the effects of such
lifestyle interventions on adipose tissue lipolysis (35, 552). The components of total
lipolysis are the sum of “basal lipolysis”, which appears elevated in the presence of
adiposity and is greater in visceral adipose tissue compared to subcutaneous adipose
tissue, plus “demand lipolysis”, which is a consequence of nutritional demand (35).
It has been suggested that in the early stages of weight loss, adipocyte size does not
change and therefore basal lipolysis remains high, yet following continued weight

Chapter 3
Page | 137
loss (and during a eucaloric phase), demand lipolysis is reduced with lower local free
fatty acid levels (35). This lower level of local free fatty acids is proposed to be
associated with a reduced number of adipose tissue macrophages and a decrease in
the free fatty acid-driven cytokine production, and consequentially a reduction in
circulating cytokines (35). A study in mice found that this does occur (553), yet this
hypothesis requires further investigation in humans but does provide a plausible
explanation for the observations made during the second phase of our intervention.
While there is some evidence that long-term exercise training, including PRT, can
improve circulating levels of inflammatory markers (554-556), we found no
evidence that our program of high-intensity PRT combined with weight loss
improved any marker of inflammation in overweight and obese adults with T2DM.
However, as reported above we found that during the less intense home-based
training there were modest improvements in circulating levels of TNF-α and
adiponectin, compared to sham-exercise. This is consistent with the findings from
previous studies which have also reported mixed findings with regards to the effects
of PRT on inflammatory cytokines in adults with T2DM (523, 540). Although
factors such as age, fitness level, degree of adiposity, as well as the presence of other
comorbid conditions are likely to have contributed to the mixed findings in various
interventions, there is also evidence that differences in exercise duration, intensity
and frequency can influence the inflammatory response to exercise. Indeed, the
findings from a meta-analysis of exercise interventions on inflammatory markers in
adults with T2DM found that mostly aerobic, but some PRT programs of longer
duration or which had a larger number of total training sessions, were associated with
the greatest benefits for circulating IL-6 levels (244). Similarly, it has been reported
that interventions of 16-weeks or longer and/or with training intensities of at least
80% of 1-RM may influence the inflammatory responses to PRT (557, 558). In light
of these findings, it is somewhat surprising that our 6-month high-intensity PRT
program, where training was prescribed three times per week at an intensity of 75-
85% 1-RM and compliance was high averaging 2.8 out of three sessions per week,
did not have an effect on markers of inflammation assessed, particularly given the
significant beneficial effects on HbA1c and the improvements in fat mass and lean

Chapter 3
Page | 138
mass in the PRT+WL group. In part support of these findings, another meta-analysis
of eight RCTs found that there were no differences between the PRT and control
group for the change in serum concentrations of adiponectin, leptin, IL-6 and TNF-ɑ,
but PRT was associated with a significant reduction in circulating CRP relative to
controls (559). In addition, meta-regression revealed no dose-response relationship
between PRT intensity and changes in inflammatory response. It is evident from the
above findings that there is considerable heterogeneity across studies concerning the
effects of PRT on inflammatory biomarkers, and thus further studies remains
warranted.
Like systemic inflammatory markers, endothelial markers such as ICAM-1 and
resistin are also significantly elevated in adults with T2DM (560). In our study, we
observed no changes in either ICAM-1 or resistin following the supervised
gymnasium- or home-based resistance training. This is consistent with the findings
from several previous trials which also examined the effects of resistance training on
endothelial functioning in older adults with T2DM yet observed no effect (561, 562).
For example, Kwon et al. (562), investigated the effects of aerobic or resistance
training on endothelial function as assessed by flow-mediated dilation, in 40 older
overweight women with T2DM compared to a control program (562). Participants
randomised to aerobic or resistance training completed 60 minutes of training, 5 days
per week for 12-weeks, whilst the control program did not exercise (562). At the
completion of the intervention, endothelial function was improved in the resistance
and aerobic training group, however, the improvement was only significant for the
aerobic training group (2.2 ± 1.9%, P=0.002 compared to control) (562). Whilst the
exact mechanisms by which exercise training can improve endothelial function
remain unknown, it has been suggested that the mode of training is an important
factor. For instance, there is evidence for a positive effect on various endothelial
markers following aerobic training in adults with chronic disease such as chronic
heart failure, which has been related to the more consistent increase in blood flow
and laminar shear stress associated with this mode of training (563, 564).
Furthermore, aerobic training also results in greater improvements in
cardiorespiratory fitness which may translate into improved vascular endothelial

Chapter 3
Page | 139
functioning and in turn reduce the endothelial expression of cellular adhesion
molecules (561, 562, 565, 566). Therefore, the lack of any changes in any endothelial
marker in either group in our study may be due to the absence of an aerobic
component in the exercise program. As the precise mechanism(s) responsible for any
improvements in endothelial function in older adults with T2DM remain unidentified
and there is only limited evidence that PRT either with or without weight loss
confers improvements in endothelial markers in older adults with T2DM (567),
further research in this area is required.
3.7 Limitations
There are a number of limitations associated with this study which must be
considered when interpreting the findings. First, although multiple cytokines
reflective of systemic inflammation were assessed, hs-CRP, a more global and
universal inflammatory marker for which there is clinical reference values, was not
measured. Second, our study was limited to an assessment of circulating
concentrations of various cytokines which have a short half-life, and a measure
cytokine soluble receptors may be more representative of the inflammatory response
(568). Third, a key goal of the healthy eating program was to reduce body weight by
0.25-0.5 kg per week totalling approximately 6 kg over the duration of phase 1. The
total amount of weight lost was only approximately half this which may in part
explain the lack of significant improvement in levels of inflammatory markers
assessed in this study. Further, our study was a secondary analysis and limited by a
relatively small sample size, and given the known variability in inflammatory
cytokines, it is likely that our study was underpowered to detect any potential
between group differences. Finally, when interpreting our findings, it is important to
acknowledge the long-time period (10-years) that the serum samples were stored
prior to analysis. Thus, it is possible that there was degradation in the various
cytokines during this time as there is some evidence that inflammatory markers
degraded by up to 50% over a period of 2-3 years. Few studies have examined the
stability of serum samples and the inflammatory markers measured in this trial,
however, de Jager et al. (568) measured the effects of long time storage (up to 4
years) on IL-6 and IL-10 and observed these inflammatory markers degraded by 50%

Chapter 3
Page | 140
or less of the baseline value within 2-3 years of storage. A strength of our analysis
though was that all samples were stored for the same amount of time and thawed and
analysed simultaneously. It is also worth noting that a comparison of the mean
baseline values of the participants in our study was similar to that previously
published in our laboratory in healthy older men where samples were stored for only
12- to 24-months using the same methodology (42, 569).
3.8 Conclusion
The main finding from this 12-month trial was that a 6-month moderate weight loss
program with and without high-intensity gymnasium-based PRT did not change any
markers of systemic inflammation or endothelial function in older overweight adults
with T2DM. However, a further 6-months of continued home-based PRT
independent of weight loss did result in modest improvements in the inflammatory
markers TNF-α, IL-10 and adiponectin, compared to sham-exercise. These
improvements may be beneficial to overweight older adults with T2DM given the
close association of adverse CV health and systemic inflammation. Future trials
remain necessary to optimise PRT prescription for the improvement of markers of
inflammation in overweight older adults with T2DM. In addition, future trials with
larger sample sizes are required to investigate if an improvement in inflammation as
a result of participation in a PRT program is related to improvements in glycaemic
control, insulin sensitivity and/or changes in body composition.
3.9 Acknowledgements
This study was financially supported by a grant from the Victorian Health Promotion
Foundation (VicHealth). Funds for the purchase of exercise equipment were kindly
provided by the Rotary Club of Kew, Victoria, Australia and by Soroptimist
International, Brighton Division. With great thanks to Elena Lekhtman and Lucy
Robinson for their kind assistance in the clinical management of the volunteers. Most
importantly, all authors are indebted to the volunteers whose cooperation and
dedication made this study possible.

Page | 141
Chapter 4
Methods for a 6-month Randomised Controlled Trial Investigating
the Effects of Progressive Resistance Training, Whey-Protein and
Vitamin D Supplementation on Glycaemic Control, Body
Composition and Cardiovascular Risk Factors in Older Adults with
Type 2 Diabetes
Chapter 4
Page | 142
4.1 Declaration Statement
The PhD student was responsible for developing the intervention testing and protocol
booklet which outlined the specific methodology to be used for each of the outcome
measures assessed. The student was also responsible for developing questionnaires,
screening forms, trainer guide books/exercise cards, compliance calendars, monthly
phone call forms and co-ordinating the 21-month recruitment campaign for the RCT
outlined in this Chapter. The student was also responsible for co-ordinating several
training sessions of qualified personal trainers/exercise physiologists who were not
Lift for Life® accredited under Fitness Australia. The student commenced her PhD
studies on a grant which had already been awarded funding and thus was not
involved in the conceptualisation of this project thus was not first author on the
methodology publication.

Chapter 4
Page | 143
4.2 Abstract
While physical activity, energy restriction and weight loss are the cornerstone of type
2 diabetes mellitus (T2DM) management, less emphasis is placed on optimising lean
mass. As muscle is the largest mass of insulin-sensitive tissue and the predominant
reservoir for glucose disposal, there is a need to develop safe and effective evidence-
based lifestyle management strategies that optimise lean mass as well as improve
glycaemic control and cardiovascular risk factors in people with this disease,
particularly older adults who experience accelerated muscle loss. Using a two-arm
randomised controlled trial (RCT), this 6-month study builds upon the community-
based progressive resistance training (PRT) programme Lift for Life® to evaluate
whether ingestion of a whey-protein drink combined with vitamin D supplementation
can enhance the effects of PRT on glycaemic control, body composition and
cardiovascular health in older adults with T2DM. Approximately 200 adults aged 50
to 75 years with T2DM, treated with either diet alone or oral hypoglycaemic agents
(not insulin), were recruited. All participants were asked to participate in a
structured, supervised PRT programme based on the Lift for Life® programme
structure, and randomly allocated to receive a whey-protein drink (20 g daily of
whey-protein plus 20 g after each PRT session) plus vitamin D supplements (2,000
IU/day), or no additional powder and supplements. The primary outcome measures
collected at baseline, 3- and 6-months were glycated haemoglobin (HbA1c) and
insulin sensitivity (homeostatic model assessment). Secondary outcomes included
changes in: muscle mass, size and intramuscular fat; fat mass; muscle strength; blood
pressure; levels of lipids, adipokines and inflammatory markers, serum insulin-like
growth factor-1 and 25-hydroxyvitamin D; renal function and change in diabetes
medication. The findings from this study will provide new evidence as to whether
increased dietary protein, achieved through the ingestion of a whey-protein drink,
combined with vitamin D supplementation, can enhance the effects of PRT on
glycaemic control, muscle mass and size, and cardiovascular risk factors in older
adults with T2DM.

Chapter 4
Page | 144
4.3 Methods
4.3.1 Study Design
The Resistance Exercise, Vitamin D and Muscle Protein Intervention Trial
(REVAMP-IT) was a 24-week two-arm parallel, RCT. Participants with established
T2DM who were suitable for the current community-based Lift for Life® resistance
training program and met trial inclusion criteria (refer to section 4.2.6 Screening and
Eligibility) were randomised to one of two groups: 1) the Lift for Life® program
combined with a whey-protein drink and vitamin D supplementation or 2) the Lift for
Life® program alone. The participants randomised to Lift for Life® alone did not
receive placebo supplements. A placebo product was not used in this trial as it
became evident through consultation with the manufacturer of the whey-protein
drink that ingredients used to develop a placebo for use in this trial (e.g. using
maltodextrin as a food additive) had the potential to alter blood glucose levels or
influence muscle mass, which are two key outcomes for this trial. Thus, to avoid any
potential adverse (or positive) effects on blood glucose levels of the participants
assigned to this group, no placebo products were prescribed. We believed this would
not compromise trial outcomes and that there was a strong justification for not
including a matched placebo in this trial. It should also be noted that the selection of
a two-arm design (e.g. lack of a true ‘non-exercise’ control arm) was consistent with
our primary research objectives which sought to examine the effectiveness of the
addition of whey-protein and vitamin D to an existing community-based PRT
program (Lift for Life®). All research staff, except the project manager, were blinded
to the intervention groups. The project manager was solely responsible for the
distribution of whey-protein and vitamin D supplements to those in the Lift for Life®
program plus protein and vitamin D arms. The study was coordinated from the
Melbourne metropolitan campus of Deakin University (Melbourne, Victoria,
Australia).
4.3.2 Ethics
Ethics was approved by the Deakin University Human Research Ethics Committee:
Project number EC2013-050, Does a whey-protein enriched drink and vitamin D
enhance the health benefits of the Lift for Life® resistance training program in older

Chapter 4
Page | 145
adults with type 2 diabetes? (Appendix 4). This study was also registered with the
Australian New Zealand Clinical Trials Registry, registration number
ACTRN12613000592741.
4.3.3 Funding
This project was funded by a grant from the National Health and Medical
Research Council Project (APP1046269). The whey-protein powder was provided by
OmniBlend (Campbellfield, Victoria, Australia) and the vitamin D supplements
(Ostelin) by Sanofi-Aventis Australia Pty Ltd (Macquarie Park, New South Wales,
Australia).
4.3.4 Participants
Men and women aged 50 to 75-years with established T2DM, treated with diet alone
or any oral hypoglycaemic agents (except insulin), were invited to participate in this
study.
4.3.5 Recruitment
Recruitment methods used for this RCT are extensively discussed in Chapter 5 of
this thesis. Briefly, recruitment occurred via targeted mail-outs to registrants of The
National Diabetes Support Scheme (NDSS) database. Recruitment for this trial was
further supplemented by a number of State and local media campaigns including
newspaper advertisements, web-based media and notices at current Lift for Life®
facilities, recruitment was also further supplemented by referrals from general
practitioner (GP) and other allied health professionals including dieticians,
endocrinologists, diabetes educators and local support groups.
4.3.6 Screening and Eligibility
A two-step screening process was employed in this study. Firstly, a telephone
screening questionnaire (Appendix 5) was used to assess an individual’s eligibility.
Participants were eligible if aged 50-75 years, had been diagnosed with established
T2DM and were treating their condition with diet or oral hypoglycaemic medication
only. Participants were excluded from the trial based on the criteria outlined in Table

Chapter 4
Page | 146
4.1. Those who passed the telephone screening were then required to gain GP
approval prior to randomisation and participation in the Lift for Life® program
(second screening step). Medical clearance was deemed to have been approved by
the participants GP upon completion of a Lift for Life® Recommendation to
Participate Form based on guidelines published by the Australian College of Sports
Medicine (ACSM) (refer to Appendix 6). All enrolled participants were encouraged
and monitored to keep constant the use of lipid-lowering or anti-hypertensive
medication throughout the trial and were additionally instructed to not modify their
lifestyle habits other than necessary for the trial. In order to increase the external
validity of this study and due to the lack of consensus regarding optimal serum
vitamin D concentration, vitamin D status was not used as exclusion or inclusion
criteria but was measured as part of the biochemical analysis post-randomisation.
Table 4.1: Ineligibility criteria for the 24-week Lift for Life® RCT.
Health-related
Not diagnosed with T2DM
Any medical condition contraindicated to PRT
BMI >40kg/m2
HbA1c >10%
Presence or indication of kidney disease
Current smoker
Physical Activity Status
Meeting or exceeding National Physical Activity Guidelines
Medication or Supplement Use
Prescribed insulin for management of T2DM
Taking vitamin D supplements >500IU/day
Taking dietary protein supplements
Travel
Travel plans which impeded participation in the trial
Other
Aged <50 or >75 years of age

Chapter 4
Page | 147
4.3.7 Consent
Following completion of the telephone screening questionnaire, eligible participants
were provided with a Plain Language Statement (PLS) and Consent Form (refer to
Appendix 7). Participants who wished to proceed with their involvement in this RCT
were invited to complete baseline testing at Deakin University. Following baseline
testing, participants were randomised to the Lift for Life® PRT program plus whey-
protein and vitamin D group or the Lift for Life® PRT program only group.
4.3.8 Randomisation
Randomisation occurred at the level of the individual participant, stratified by gender
and diabetes treatment (diet or oral hypoglycaemic medication), in blocks of 4-8
using a computer-generated random number sequence (Microsoft Excel 97) by an
independent researcher. As mentioned previously, all research staff except the
project manager were blinded to the intervention groups. The project manager was
solely responsible for the distribution of protein and vitamin D supplements to those
in the Lift for Life® program plus whey-protein and vitamin D arms.
4.3.9 Intervention
Lift for Life®: A community-based progressive resistance training program
All participants involved in this trial were required to follow a training program
modelled off the structure of the Lift for Life® PRT program. The Lift for Life®
program is an evidence-based PRT program designed for people with diabetes or
those at risk of developing T2DM. The program was developed based upon a series
of previous laboratory and community-based exercise intervention trials (12, 204,
205). Lift for Life® is a commercial program with a limited number of accredited
training sites in Melbourne licensed and currently running the program which is
overseen by Fitness Australia in collaboration with Baker IDI Heart and Diabetes
Institute. The Lift for Life® program comprises moderate-intensity PRT (2-3 sets of
8-12 repetitions at 60-75% of maximum strength of 8-10 exercises) involving
dynamic concentric and eccentric contractions, focusing on the major muscle groups
of the body. Some examples of the exercises used throughout the program include
bench press, leg extension, upright row, lateral pull down, standing leg curl,

Chapter 4
Page | 148
dumbbell seated shoulder press, dumbbell seated biceps curl, dumbbell triceps
kickbacks and abdominal curls. Training was made incrementally more challenging
at a rate of 2-10% per week to meet the principles of progressive overload with the
Borg Rating of Perceived Exertion (RPE) scale used to validate training intensity. An
appropriate training intensity level for this trial was established as 12 to 15 (moderate
to high-intensity) on the RPE scale. The RPE scale has previously been validated for
use in older adults with T2DM and found to appropriately measure exercise intensity
(570).
Due to the limited number of accredited Lift for Life® program providers in
Melbourne Australia, the trial was expanded to include training locations such as
commercial gymnasiums that were not accredited as a Lift for Life® program
provider but which did allow participants to safely perform a PRT program under the
guidance of qualified Certificate IV personal trainers. In such instances, the structure
of the training programs for these participants replicated that of the Lift for Life®
program. The same progressive overload and training principles were applied,
consequently, all trial participants followed the same training program as discussed
below.
Figure 4.1: Flow diagram of the progress through the 24-week PRT program used in this trial modelled from the Lift for Life® program.

Chapter 4
Page | 149
The 24-week Lift for Life® program is divided into three distinct phases (Bronze,
Silver and Gold), each running for a period of eight weeks as shown above in Figure
4.1. During the initial phase (Bronze), participants were asked to attend two PRT
sessions per week. After eight weeks, participants commenced the second eight-week
phase (Silver), but with the aim to participate in one additional PRT session to
achieve the goal of three PRT sessions per week. The final phase (Gold) was a
replication of the Silver phase. Throughout the program all completed exercises, sets
and reps for each session were documented on Lift for Life® training cards. All
training cards were collected and reviewed at the completion of the first four weeks
of training with programs modified as required by the trainers. Subsequently, every
eight weeks training programs, reported intensity and progressive overload were
reviewed by Lift for Life® trainers or Certificate IV personal trainers and if required
a new program was developed to maintain the training intensity at 12-15.
To enhance participation in and retention of participants in this 24-week program
participants received monthly follow-up phone calls from the research staff to
enquire about their experiences at their respective training locations and discuss any
issues or concerns they had experienced with the training program or with their
trainers. Finally, to further promote adherence to the Lift for Life® PRT program all
participants were eligible to receive up to AUD$240 by way of vouchers to cover the
costs associated with their participation in the Lift for Life® program. The full
reimbursement was provided to all participants who achieved 80% or above
compliance with the exercise program, calculated from the Lift for Life® self-
completed exercise cards (see below section 4.2.11.9 Compliance Assessment for
further information). Costs of the PRT program ranged from $3-$12 per session and
were set by the training location.
Whey-Protein and Vitamin D Supplementation
Participants randomised to the Lift for Life® plus whey-protein and vitamin D
supplementation group received a 12-week supply of a whey-protein enriched
powder and vitamin D supplements at baseline testing and again after 12-weeks of
training. Supplements were provided in single use sachet form with a number code

Chapter 4
Page | 150
(OmniBlend, Campbellfield, Victoria, Australia) (Figure 4.2). Participants were
instructed to mix one sachet containing 20 g of whey-protein concentrate 80%
(WPC80), containing 2.4 g of leucine, with 150ml of water every morning of the trial
and consume an additional supplement within two hours of each Lift for Life® PRT
session on training days. This dosage raised the total supplemental protein dose on
training days to ~40 g, providing ~32 g of whey-protein. Participants received a
marked shaker cup with instructions on how to reconstitute the whey-protein powder
in water (1 sachet per ~150 ml of cold water) along with appropriate storage
instructions for the supplements. Participants were offered two flavours to select
from either vanilla or mocha coffee. Each protein drink will provide approximately
335 kJ of energy, 2 g of lactose, 1 g of fat and 5 g of fibre.
Figure 4.2: Single use sachet of protein supplement and shaker cup used for protein supplement preparation.
In addition to the whey-protein supplements, participants randomised to this
treatment group were also asked to take two 1,000 IU capsules of vitamin D3
(Ostelin, Melbourne, Victoria, Australia) each day for the duration of the study. The
goal of vitamin D3 treatment was to raise serum 25(OH)D concentrations to at least
75 nmol/L. Previously, in a 6-month RCT in 95 overweight and obese adults it has
been shown that daily supplementation with 2,000IU was effective in raising serum
25(OH)D levels to greater than 75nmol/L within 2-months of treatment and greater
than 95nmol/L after 6-months in 91% of the trial population (571). Consistent with
the double-masked design, the target goal of ≥75 nmol/L was not checked prior to
randomisation.

Chapter 4
Page | 151
4.3.10 Sample Size Calculations
The calculated sample size for this trial was based on the following power
calculations from previously published studies of PRT in older adults (including
those with T2DM) (12-14, 204), and work of others that have assessed the
independent or combined effects of protein, vitamin D and PRT on the outcome
measures (351, 425, 572). It was estimated that 168 participants would provide 90%
power (P<0.05 two-tailed) to detect a 0.5% difference for the change in HbA1c levels
between the groups, assuming a conservative SD of 1.1%. For insulin sensitivity, a
sample size of 140 would be required to detect an 0.7 difference for the change in
HOMA-2 insulin resistance between the groups at a power of 90%, assuming a
conservative SD of 1.2. To compensate for a projected 20% drop-out, a recruitment
target of 202 participants for this trial was established. Participants were randomised
1:1 to the two groups (101 per group). This recruitment target allowed for sufficient
power (80-90%, P<0.05, two-tailed) to detect the following intervention effects on
our secondary outcome measures: 0.6 kg for lean mass; 4 mmHg in SBP; 15% in
serum IL-6 and IGF-1, and 12% in homocysteine levels.
4.3.11 Outcome Measures
Participants attended Deakin University a minimum of twice throughout the duration
of the study for assessment (baseline and 24-weeks). All outcome measures were
assessed within the School of Exercise and Nutrition Sciences at Deakin University,
Burwood campus with the exception of fasted blood sample collections which
occurred at local pathology clinics at baseline, 12- and 24-weeks. Research staff
conducted on-site testing at each health and fitness centre after 12-weeks for a subset
of the measures (weight, waist circumference, blood pressure, knee-extensor strength
assessment and questionnaire collection).
The primary outcome measures for this study were glycaemic control as measured by
HbA1c and insulin sensitivity (estimated from the HOMA-2) which was assessed
using FPG and insulin measured at ≥48-hours after the last Lift for Life® PRT
session. Secondary outcome measures included: changes in body composition (total
body and regional lean mass, 25% femur muscle cross-sectional area (CSA) and

Chapter 4
Page | 152
intramuscular fat), blood pressure, blood lipids, adipokines, inflammatory markers,
IGF-1, muscle strength, renal function and diabetes medication (purpose, variety and
dosage). Other covariates and variables of interest assessed included: anthropometry,
physical activity, diet, use of lipid-lowering and blood pressure medication and
serum 25(OH)D. A summary of all the outcome measures and their assessment
methods is shown below in Table 4.2.

Page | 153
Table 4.2: Summary of the primary and secondary outcome measures collected and methods of collection.
Variables Data Collection Method Data Collection Points
Primary Outcome Measures Baseline 12-weeks 24-weeks
HbA1c Overnight fasted serum sample x x x
HOMA-2 Insulin Sensitivity Overnight fasted serum sample, HOMA-2 calculator x x x
Secondary Outcome Measures
Anthropometry Height, weight and waist circumference x x x
Body Composition DXA total and regional lean and fat mass x x
pQCT scan at 25% femur site x x
Biochemistry Measures Routine biochemistry x x x
HOMA-2 beta-cell function Overnight fasted serum sample, HOMA-2 calculator x x x
Serum 25(OH)D Levels Overnight fasted plasma collection x x x
Markers of Inflammation Overnight fasted plasma collection x x x
Blood Lipids Overnight fasted plasma collection x x x
Blood Pressure Automated measurement x x x
Muscle Strength 3-Repetition Maximum leg press and seated row x x
Isometric knee extensor strength x x x

Page | 154
Table 4.2 continued
Physical Activity CHAMPS questionnaire x x x
Dietary Assessment 24-hour Food Recalls x x x
Diabetes and Other Medication Monthly Phone Calls
Adverse Events Monthly Phone Calls
Lift for Life® Program Adherence Calculated from exercise cards collected every 4-weeks
Supplement Compliance Calculated from supplement sachets and vitamin D capsules returned at 12 and 24-weeks

Chapter 4
Page | 155
4.3.11.1 Anthropometry
All participants’ height was measured to the nearest 0.1 cm with a wall-mounted
stadiometer (Holton Limited. Crymmych, Pembs, U.K.). Body weight was measured
to the nearest 0.1 kg using calibrated electronic digital scales (AND Personal
Precision Scale UC-321). Waist circumference was measured on a horizontal plane,
halfway between the lowest lateral portion of the ribcage and the iliac crest.
4.3.11.2 Body Composition
Dual Energy X-Ray Absorptiometry
Total body and regional (arms and legs) lean mass, fat mass and percentage body fat
was measured from total body scans performed using Dual X-ray Absorptiometry
(DXA) (Lunar Prodigy, GE Lunar Corp., Madison WI), using software version
12.30.008. To obtain total body scans all participants were instructed to wear loose
fitting clothing free of any metal and to remove all metal objects (e.g. jewellery, bras
and belts) for the scanning process. Patient positioning followed standardised
procedures for whole body scanning (573). Briefly, participants were instructed to lie
supine within the delineated boundaries of the scanning table, with their arms placed
beside them and palms facing down, ensuring minimal contact was made between
the upper limb and trunk soft tissue. The participant’s legs were positioned slightly
apart and internally rotated. Participants were informed of the approximate length of
the scan and were alerted of the mid-way point of the scan to assist with comfort.
Participants were instructed to remain still for the duration of the scan with the image
monitored for evidence of movement. If the image showed evidence of excessive
movement the scan was aborted and repeated. For analysis, the total body scans were
divided into sub-regions of interest to isolate the different body regions. The
following standardised criteria, as provided in the manufacturer’s manual were used
to define each body region (Figure 4.3).
All scans and follow-up scans were performed by a sole researcher blinded to the
randomisation. All follow-up measurements were analysed using the ‘comparison’
feature of the Lunar Prodigy program. Quality assurance (QA) using phantom
scanning procedures were performed prior to each measurement as part of regular

Chapter 4
Page | 156
clinical practice. The short-term co-efficient of variation (CV) for repeated
measurements of total body lean mass and fat mass within the laboratory ranges from
1.0% to 1.7%.
Head: The cut line was placed just below the chin;
Left and right ribs: The cut lines around the ribs were positioned lateral to the spine
and superior to the pelvis;
Left and right arm: The cut lines were placed on the most medial border of the
humeral head and care was taken to make sure that no trunk or leg soft tissue was
placed within the arm region;
Left and right leg: The cut lines were angled mid-way through each femoral neck,
and care was taken to include all leg soft tissue within the leg region border;
Pelvic: The cut lines were just above the most superior point of the pelvis and
through the mid-point of each femoral neck, creating a triangular pelvic region.
Figure 4.3: Sub-regions within the whole body DXA scan.

Chapter 4
Page | 157
Peripheral Quantitative Tomography
A peripheral quantitative computed tomography (pQCT) scanner (XCT 3000, Stratec
Medizintechnik GmbH, Pforzheim, Germany) was used to measure muscle CSA,
subcutaneous fat CSA and muscle density, as a surrogate measure of intermuscular
adiposity at the 25% femur site (Figure 4.4). The protocol used followed what has
been previously reported (574). After performing a scout view of the distal end of the
femur, the scanner reference line was placed midway over the most proximal aspect
of the distal femur epicondyle. Images were acquired at 4% and 25% of the femur
site proximal to the reference line. Slice thickness was set at 2.3 mm, and voxel size
set at 0.3 mm with a scanning speed of 10 mm/s. Image quality was visually assessed
following scan acquisition. Scans were rejected and repeated if the cortical shell was
irregular due to movement artifacts. Subcutaneous fat CSA was determined by
selecting the area with thresholds -40 to +40 mg/cm3 HA density (contour mode 3,
peel mode 1), and muscle CSA was determined by subtracting the total bone CSA
(threshold, 280 mg/cm3; contour mode 1, peel mode 2) and subcutaneous fat CSA
from the total area of the distal femur (threshold, -40 mg/cm3, contour mode 3, peel
mode 1) (574). Stratec XCT scanners are factory calibrated against the European
Forearm Phantom for single energy which was performed prior to each scan. For
consistency, all pQCT scans were performed and analysed by a single investigator
blinded to the randomisation. The CV for femur muscle CSA within the laboratory is
1.3%.
Figure 4.4: Peripheral quantitative computed tomography (pQCT) scan at the 25% femur site.

Chapter 4
Page | 158
4.3.11.3 Biochemical, Hormonal and Inflammatory Markers
Following an overnight fast, a rested morning (8-10am) venous blood sample was
collected from each participant’s antecubital vein at a National Association of
Testing Authorities Royal College of Pathologists Australasia accredited pathology
laboratory in each participant’s local area. The following series of parameters were
all assessed by the pathology lab using standardised techniques: glycated
haemoglobin (HbA1c), fasting plasma glucose (FPG), blood lipids (total cholesterol,
high density lipoprotein (HDL) cholesterol, low density lipoprotein (LDL)
cholesterol and triglycerides), high-sensitive C-reactive protein (hs-CRP), estimated
glomerular filtration rate (eGFR), creatinine, calcium. LDL cholesterol was
calculated by using the Friedewald formula. eGFR, as a measure of kidney function,
was calculated using the participants’ serum creatinine, age and gender according to
the abbreviated Modification of Diet in Renal Disease (MDRD) formula, which is
now used by most laboratories in Australia:
eGFR (mL/min/1.73m2)=175 x [Serum Creatinine (umol/L) x 0.0113]-1.154 x
Age(years)-0.203(x 0.742 if female)
A series of serum aliquots (5 x 1.5 ml) were collected and stored at -80°C so that the
following hormonal and inflammatory parameters could be assessed in a single batch
at the completion of the study including serum 25(OH)D and insulin-like growth-
factor 1 (IGF-1), tumour necrosis factor α (TNF-α) and interleukins 6, 8 and 10 (IL-
6, IL-8 and IL-10).
Measurement of Fasting Insulin and HOMA-IR
Fasting insulin was assessed from stored serum using the ARCHITECT® insulin
assay (Abbott Laboratories, Abbott Park, IL 60064 USA). This assay is a 1-step
chemiluminescent microparticle immunoassay. Samples were prepared as instructed
in the immunoassay kit. The 1-step immunoassay uses paramagnetic microparticles
coated with an anti-insulin monoclonal antibody and acridinium-labelled insulin
monoclonal antibody conjugate. Addition of the pre-trigger reagent leads to
acridinium-produced chemiluminescence. This Acridinium-produced

Chapter 4
Page | 159
chemiluminescence was measured as relative light units on the ARCHITECT
immunoassay optical system. The relative light units are directly proportional to the
insulin concentration in the serum sample. In our lab, the imprecision in CV% was
3.65, 3.22 and 3.41% for low (107.6 pmol/L), medium (434.8 pmol/L) and high
(1080.6 pmol/L) insulin levels respectively. All samples were tested in duplicate and
the mean values have been reported.
Insulin sensitivity (%S) and steady state beta-cell function (%B) were measured
using the updated HOMA Calculator© as available for download from The
University of Oxford Diabetes Trials Unit (https://www.dtu.ox.ac.uk/
homacalculator/). This updated model considers variations in hepatic and peripheral
glucose resistance, increases in the insulin secretion curve for plasma glucose
concentrations above 10 mmol/L (180 mg/dL) and the contribution of circulating
proinsulin (575).
Measurement of serum IGF-1
Serum IGF-1 was measured using a 1-step sandwich chemiluminescense
immunoassay kit. The kit was a LIAISON® IGF-1 kit (DiaSorin, Saluggia (VC),
Italy) with the protocol published in the kit instructions and adhered to directly. A
monoclonal antibody is used for coating magnetic particles (solid-phase) and another
monoclonal antibody is liked to an isoluminol derivative (isoluminol-antibody
conjugate). During the incubation period, any IGF-1 present in samples, calibrators
or controls binds to the solid phase and to the conjugate. After the incubation, the
unbound material is removed with a wash cycle. Following this, started reagents are
added to induce a chemiluminescence reaction. The light signal, and the amount of
isoluminol conjugate is measured as relative light units on a LIAISON® Analyser.
The relative light units measured indicate the concentration of IGF-1 present in
calibrators, samples and controls. In our lab, the imprecision in CV% was 4.60, 4.00
and 3.50% for low (8.26 nmol/L), medium (26.05 nmol/L) and high (33.54 nmol/L)
IGF-1 levels respectively. All samples were tested in duplicate and the mean values
have been reported.

Chapter 4
Page | 160
Measurement of Serum 25(OH)D
Serum 25(OH)D was analysed at Monash Health, Melbourne, Australia. This
laboratory is National Association of Testing Authorities, Australia (NATA) certified
and subscribes to the Vitamin D External Quality Assessment Scheme. Samples were
measured on the AbSciex Q Trap 5500 MS by liquid chromatography-tandem mass
spectrometry (LC-MS/MS). This system used a Phenomenex Kinetex
Pentafluorophenyl (PFP) column that achieves baseline separation of 25(OH)D. The
assay was calibrated with the Chromsystems, 3 Plus1 Multilevel Calibrator for 25-
OH-Vitamin D3 (part number: 62029). The inter-assay CVs for the quality control
analysed in each assay was 6.5-9.0% for 25(OH)D.
Measurement of Serum Inflammatory Markers
The measurement of the inflammatory parameters, IL-6, IL-8, IL-10, TNF- ɑ and
Adiponectin was conducted by Cardinal Bio-research Pty Ltd (Australia). Serum
concentrations of IL-6, IL-10, IL-8 and TNF-ɑ were measured in duplicate using a
Millipore high sensitive cytokine immunoassay assay kit (Millipore Corp, Billerica,
Massachusetts, USA) as per the manufacturer’s instructions. Plates were read on the
Bioplex (V.5.0, Bio-Rad Laboratories, Hercules, CA). Adiponectin was assayed
using an in-house multiplex immunoassay with capture and detection antibodies
obtained from R&D Systems (Minneapolis, MN USA). Antibodies were coupled to
Luminex xMAP beads using standard Luminex protocols and as previously
described (541). The mean intra and inter-assay CVs for IL-6, IL-10, IL-8, TNF-ɑ
and Adiponectin was <12%. Samples with results below the detectable limits of the
assay were allocated the minimum detectable concentration for each assay: IL-6=
0.19 pg/mL; IL-10= 0.03 pg/mL; IL-8= 0.08 pg/mL; TNF-ɑ = 0.03 pg/m;
Adiponectin = 0.01 µg/mL.
4.3.11.4 Blood Pressure
Following a 5-minute rest period where all participants were seated in a quiet room,
SBP and DBP was measured using an automated blood pressure monitor (AND Vital
Sensor, Model number TM-2551P, Abingdon, Oxford). Four measurements were

Chapter 4
Page | 161
taken on the left arm with a 2-minute interval between readings; the mean of the final
three readings were used in the analysis.
4.3.11.5 Muscle Strength
Knee Extensor Strength
Isometric knee extensor strength (force in kg) was measured on the participant’s
dominant leg using Lord's strap assembly incorporating a strain gauge (Neuroscience
Research Australia, Sydney, Australia). Participants were stabilised in a seated
position with one Velcro strap wrapped around the dominant leg and connected to
the spring-loaded strain gauge ensuring the hip and knee joint were both supported at
90°. The Velcro strap was positioned approximately 5cm above the ankle joint
allowing dorsiflexion of the ankle (Figure 4.5). Participants were instructed to leave
the contralateral leg free of pressing against a chair leg or supporting arm on the
chair, however, participants could hold on to the chair with their hands for support.
Participants executed 3-4 submaximal concentric contractions with a 10 second rest
between each sub-maximal contraction. Following a 60 second rest participants then
performed one maximal concentric effort, holding this maximal force for 3-seconds
followed by another 60 second rest. Following a second rest another maximal
contraction was repeated. The two readings from the two maximal contractions were
recorded with the peak force used in the analysis. This test has been shown to have
excellent test-retest reliability ICC=0.97 (576).

Chapter 4
Page | 162
Figure 4.5: Participant positioning for the knee extensor strength test.
3-Repetition Maximum Assessment
Maximal muscle strength of the lower limbs and back was estimated by employing
three-repetition maximum strength (3-RM) tests for the bilateral leg press (Synergy
Omni Leg Press S-31 OPD, QLD, AUS) and the seated row (Nautilus F3 Adjustable
Tower Pulley System F3ATFS, Nautilus, Vancouver, WA). A 3-RM is the greatest
weight that can be lifted for three complete repetitions of an exercise whilst
maintaining correct form and technique. A 3-RM test corresponds to ~85% of an
individual’s 1-RM (577). The 3-RM rather than the 1-RM test was chosen for use in
this trial as previously it has been found that 1-RM testing can lead to injuries (578).
The protocol employed is presented below but follows what has previously been
published (578). Prior to 3-RM testing beginning participants completed a 5-minute
warm-up on an exercise bike. To determine 3-RM, each participant initially
performed a warm-up set of 8-10 repetitions with a light load. After the successful
completion of a further 6-8 repetitions at an incrementally heavier weight selected by
the instructing researcher and following a brief rest (~2 to 3 minutes), the workload
was increased incrementally until only three repetitions with correct technique could

Chapter 4
Page | 163
be completed. For each participant, the below formula, as employed by Wathen et al.
(579) and used previously in older adults (580), was used to calculate participants leg
and back strength 1-RM:
1-RM = 100 x (3-RM load) / (48.8 + 53.8 x e (0:075x3))
The short-term CV for repeated measurements of strength testing in our laboratory
was 2.04% for leg and 1.1% for back strength.
4.3.11.6 Dietary Assessment
Dietary data was collected through 24-hour dietary recalls at all time-points.
Participants were provided two blank food diaries a minimum of one week prior to
their testing appointment. Participants were asked to record all food and drink
consumed on a regular weekday and one weekend day. At the 12- and 24-week
assessments participants were instructed to complete the two dietary recalls on non-
training days. At the respective testing appointments completed food diaries were
reviewed using the ‘triple pass’ method to maximise the respondents recall of all
food and drink consumed. This procedure was based on that used by the Australian
Bureau of Statistics in the 1995 National Nutrition Survey, and is designed to
maximise the ability of respondents to recall everything consumed, ensuring an
adequate food diary was completed. Staff conducting these recalls had all completed
appropriate training in dietary assessment methods. Household measures (measuring
cups, plates, bowls and glasses) were used to help estimate food portion sizes. The
data collected from the 24-hour recalls was entered into FoodWorks Professional
(Version 8, Xyris Software, Queensland, Australia) to calculate total dietary energy
intake and dietary macronutrient composition using the AUSNUT 2011-13 database
including AusBrands and AusFoods.
Total energy intake (EI) was examined for under/over-reporting following collection.
Several equations exist in order to calculate an estimated basal metabolic rate
(BMRest), however, validation studies in overweight/obese populations have
previously found the Mifflin-St Jeor equation to give the most precise calculation of

Chapter 4
Page | 164
BMR in population groups with a BMI over 30 as opposed to other equations such as
the Schofield, Owen or Harris-Benedict equation (581). A physical activity level
(PAL) of 1.4 reflecting low activity and appropriately age-matched was selected
based on that published (582). This PAL was held constant over the intervention
period and used in the equations at all subsequent time points. To identify over- and
under-reporters at the group level, the modified Goldberg equation (583) was used to
calculate the specific lower and upper cut-offs for all participants as used by others
(584-586). Individuals greater or less than two standard deviations outside of these
upper and lower cut offs were classified as under and over-reporters respectively.
Participants within this range were classified as plausible reporters. Participants were
coded as over, plausible or under reporters at each assessment. A total of 91 and 95
participants from the PRT+ProD and PRT groups respectively returned the 24-hour
food recalls at baseline. Underreporting of energy intake at baseline was similar in
the PRT+ProD and PRT groups (PRT+ProD, 12.0%, n=11 vs PRT, 9.5%, n=9). Over
reporting of energy intake at baseline was also similar among both the PRT+ProD
(1%, n=1) and PRT (2%, n=2) groups with no differences between the groups. The
prevalence of under and over reporting remained consistent in both groups at 12- and
24-weeks (data not shown). Removing individuals who were classified as over- and
under-reporters did not change the results of the analysis and therefore all
participants were included in subsequent analysis.
Mean daily alcohol consumption was estimated from self-reported intakes over the
previous seven days. Previous research has shown that the seven-day alcohol recall
method is an accurate method to assess alcohol intake as it reduces the random
variability found in methods which estimate typical consumption over a longer
period of time (587). Participants were asked about their alcohol intake during the
previous seven days and were required to recall both the amount (using the
household measure they were familiar with e.g. wine glass, stubby, shot glass) and
the type of alcohol consumed (e.g. beer, wine, spirits). Average daily alcohol
consumption (g/day) was calculated using the summed volume of all alcoholic
beverages consumed over the preceding week divided by seven.

Chapter 4
Page | 165
Habitual Protein plus Protein from Whey Protein Supplements
The additional protein consumed from the whey protein supplements was calculated
for both training days and non-training days given the differing number of
supplements prescribed (one on non-training days and two on PRT days). Individual
compliance as a percentage at both 12-weeks and 24-weeks with the whey protein
supplements was multiplied by the dose of protein (either 20 or 40 g) with this
amount subsequently added to the habitual protein intake reported from the 24-hour
food diaries to calculate the g/day of protein consumed. The same method was used
to calculate g/kg/day at both 12- and 24-weeks with weight at both these respective
time points used in these calculations to determine the g/kg/day of protein intake
inclusive of the whey protein supplement at both 12- and 24-weeks.
4.3.11.7 Habitual Physical Activity
The Community Healthy Activities Model Program for Seniors (CHAMPS) physical
activity questionnaire was specifically designed to evaluate total leisure and
recreational physical activity time (hours per week) in older adults and found to be
reliable, valid and sensitive to change (588). Participants documented the frequency
and duration of their participation in a ‘typical week’ of a range of low, moderate,
and vigorous physical activities at baseline, 12- and 24-weeks of the study. These
results are reported as estimated kilojoules per week spent in aforementioned
activities.
4.3.11.8 Medical History, Health Status, Medication Use
All participants completed a lifestyle questionnaire to obtain information on
education background, current and previous employment details, history of diseases
or illnesses, family history of diabetes, smoking history, current medication and
dietary supplement use. Information on any alterations to or new medication
prescribed by the participants’ doctors was collected by research staff via the
monthly phone calls. Information recorded included medication name, dose
prescribed and daily quantity taken. Medications were categorised into diabetic,
hypolipidemic, anti-hypertensives, other cardiac agents such as anti-arrhythmic
drugs, osteoporotic, thyroid, anti-depressant/psychiatric, diuretics, thiazide diuretics,

Chapter 4
Page | 166
hormone replacement therapy, steroids, tamoxifen, and other (e.g. anti-inflammatory)
medications.
4.3.11.9 Compliance Assessment
Lift for Life® Exercise Training Cards
Compliance with the Lift for Life® PRT program was evaluated via self-completed
exercise cards. These cards were returned to researchers at the completion of the first
four weeks of training allowing the PRT programs to be reviewed. Training cards were
reviewed to confirm training programs were of adequate intensity, volume and that
appropriate progression could be applied. Following the collection of the first exercise
card, participants were asked to post subsequent exercise cards back at the completion
of one full card or every eight weeks.
Supplement Calendars
Compliance in taking the prescribed protein and vitamin D supplements was
evaluated via self-completed compliance calendars. These calendars were cross-
referenced by counting the remaining sachets of protein and vitamin D capsules
returned at the final testing appointment. The date supplements were commenced and
ceased along with the date returned were all recorded. The exact number of
supplements that should have been taken was able to be precisely calculated.
Compliance was calculated on a percentage basis as what was consumed divided by
what should have been consumed over the duration of the trial period for each
participant.
4.3.11.10 Adverse Events
Any adverse events associated with the exercise program or supplements were
recorded by research staff during the monthly phone calls to participants.
For this trial, an adverse event was defined as any health-related untoward or
unfavourable medical occurrence (sign, symptom, syndrome or illness) that
developed or worsened during the 24-week trial. All adverse events were assessed
for seriousness, causality and expectedness by the research staff and reported adverse

Chapter 4
Page | 167
events were categorised into adverse event, serious adverse event or unanticipated
problem based upon the National Institute of Ageing guidelines (589). Information
on any alterations to or new medication prescribed for any event by a treating
physician was collected by research staff with information including medication
name, dose prescribed, and daily quantity taken recorded.
4.3.12 Statistical Analysis
Detailed information related to the statistical analysis for this study will be provided
in Chapter 6.

Page | 168
Chapter 5
Lessons Learned Recruiting Older Adults with Type 2 Diabetes
to a Community-based Exercise and Nutrition
Randomised Controlled Trial

Chapter 5
Page | 169
5.1 Student Declaration
The PhD student was responsible for the 21-month recruitment campaign outlined in
the forthcoming Chapter. The student oversaw the implementation of each
recruitment strategy used and assessed its success or determined when a strategy
should be altered. The student was largely responsible for screening all expressions
of interest received and subsequent baseline appointment scheduling. The student
was responsible for the development, analysis and reporting contained within this
Chapter and for the development and subsequent publication of this Chapter as a
peer-reviewed journal article.

Chapter 5
Page | 170
5.2 Abstract
Recruiting participants into long-term community-based lifestyle intervention trials,
particularly adults with a chronic disease, is often slow and challenging. There is
limited data on successful recruitment strategies suitable for older adults with type 2
diabetes mellitus (T2DM) into community-based lifestyle programs, and no
information on cost estimates associated with recruitment. Herein we describe the
recruitment strategies used, the success of each approach and the costs associated
with the recruitment methods used in recruiting older adults with T2DM into a 6-
month community-based exercise and nutritional supplementation randomised
controlled trial (RCT). The Resistance Exercise, Vitamin D and Muscle Protein
Intervention Trial (REVAMP-IT) is a 24-week RCT targeting 200 adults with T2DM
designed to evaluate whether ingestion of a whey-protein drink plus vitamin D can
enhance the effects of progressive resistance training (PRT) on glycaemic control,
insulin sensitivity, body composition and cardiovascular health. Participants in this
RCT were randomly allocated to either: 1) a community-based PRT program
combined with whey protein and vitamin D supplements, or 2) solely the PRT
program. Recruitment strategies included state and local newspaper and radio
advertisements, targeted mail-outs, doctor and allied health referrals, community
presentations, web-based media and word of mouth. The number of expressions of
interest (EOI) received, participants screened and randomised in the trial, and how
they first heard of the study were recorded during the screening process. Reasons for
ineligibility or non-participation were also recorded plus the cost of each recruitment
method used. A total of 1,157 EOI were received over a 21-month period. Overall
959 (83%) individuals were screened and found to be ineligible for the trial or chose
not to participate. As a result, 198 participants were randomised to the 24-week
intervention. The most effective recruitment strategies were targeted mass mail-outs
(39% of the total participant sample), state (27%) and local (15%) print media.
Recruitment expenditure totalled AUD$40,421, AUD$35 per enquiry and AUD$204
per eligible participant. Targeted mail-outs and state print media were the most
expensive strategies, accounting for 38% of total expenditure. To recruit around 200
older adults with T2DM into a community-based lifestyle trial in a timely manner,

Chapter 5
Page | 171
ensuring an adequate budget is allocated to recruitment is paramount as targeted
mail-outs and state/local print media were the costliest yet most effective strategies.

Chapter 5
Page | 172
5.3 Introduction
The success of RCTs is dependent on effective recruitment of the target population.
One of the key challenges associated with conducting intervention trials that target
populations with specific medical conditions such as people with T2DM, is the
successful recruitment of an adequate number of participants within budget and
established timelines. Failing to recruit the required number of participants impacts
the statistical power and adversely impacts on the internal and external validity of the
trial. Delays in recruitment can also extend the trial duration and result in an increase
in trial and recruitment costs.
Recruitment of people with T2DM into a lifestyle modification trial involving an
exercise and/or a nutritional intervention can be particularly challenging because it
often involves identifying participants that must first meet certain inclusion criteria
(e.g. currently inactive) and who are also motivated to change their behaviour (e.g.
engage in regular exercise). Despite the clear evidence that physical activity (PA)
and diet are key elements in the management (and prevention) of T2DM, individuals
with this condition are typically inactive and have poor dietary habits (590, 591).
Therefore, it is difficult for the target population to make a commitment to make the
behavioural changes required in these types of studies. Exercise and dietary
intervention trials can be long and demanding, requiring significant change to an
individual’s daily routine. Common barriers and reasons for not participating in
exercise trials reported by individuals include inconvenience, a lack of time to
dedicate when managing work/family commitments and a lack of understanding of
the potential health benefits of participating in such trials (592, 593). A review of
recruitment strategies for participants into RCTs revealed that methods which do not
directly target the population of interest (e.g. T2DM patients), advertisements which
are not effective in conveying the key objectives of the research or which fail to
accurately inform of the potential personal health benefits to participation, can all
negatively impact on recruitment (594). Therefore, identifying the most effective
recruitment strategies which overcome the aforementioned barriers to participation
and which appeal to potential participants as well as convey an appropriate level of
information is crucial to successfully achieving recruitment goals.

Chapter 5
Page | 173
At present, there is limited literature on successful recruitment strategies suitable for
older adults with T2DM into community-based exercise and nutrition programs with
no information on cost estimates. There has only been one paper recently published
describing the experiences and strategies used to recruit type 2 diabetic patients into
an RCT to assess the efficacy of an automated, interactive voice-response telephone
intervention to promote physical activity behaviour (593). Therefore, the aim of this
chapter is to describe recruitment strategies used to recruit older adults with T2DM
into a 6-month community-based exercise and nutrition research intervention.
Strategies were defined as successful if they were effective in generating a greater
number of enquiries to the trial and a higher proportion of eligible participants
compared to other strategies. A secondary aim is to assess the costs associated with
the recruitment methods used. By providing a detailed report of this trials recruitment
experiences it is hoped this information will help to inform future intervention
studies wishing to recruit older adults with T2DM to community-based exercise
and/or nutrition programs.
5.4 Methods
5.4.1 Study Overview
A detailed description of the protocol for this trial is provided in Chapter 4 and has
previously been published (595). Briefly, this study was a 24-week RCT in which
participants were randomly allocated to either: 1) the Lift for Life® community-based
progressive resistance training (PRT) program combined with additional whey
protein and vitamin D, or 2) the Lift for Life® PRT program alone. The primary
outcomes were glycated haemoglobin (HbA1c) and homeostasis model assessment 2
(HOMA-2) of insulin sensitivity and beta-cell function. Secondary outcome
measures included changes in body composition, muscle strength, blood pressure,
blood lipids, adipokines and inflammatory markers, growth factors, health related
quality of life and cognitive function.
All participants enrolled in the trial were asked to complete the Lift for Life® PRT
program in local community health and fitness centres which involved training twice
a week for the first eight weeks and three times a week thereafter. Training sessions

Chapter 5
Page | 174
were supervised by qualified trainers, lasting approximately 45 to 60-minutes and
consisted of moderate- to high-intensity resistance training (3 sets of 8-10
repetitions) targeting all major muscle groups and with an emphasis on progressive
overload (increments in weight of 2 to 10%). All participants were charged a fee by
their local health and fitness provider to undertake the program, but were eligible for
reimbursement up to the value of AUD$240 at the completion of the study based on
their level of compliance (595).
In addition to the above training commitment, those randomised to the Lift for Life®
plus supplement group were provided with a supply of a whey-protein enriched
powder and vitamin D supplements with the instruction to consume two vitamin D
capsules (1,000 IU of vitamin D per capsule) each day, plus prepare and consume a
whey protein drink (20 grams of protein once per day on non-training days plus 20
grams after each Lift for Life® training session). The PRT alone group received no
additional powder or supplements.
Throughout the trial, participants were required to attend Deakin University for
approximately 2 hours on two occasions (baseline and 24-weeks). Research staff
conducted on-site testing at each health and fitness centre after 12-weeks. A rested
morning (8-10am) venous blood sample was additionally collected from each
participant’s antecubital vein at an accredited pathology laboratory following an
overnight fast on three occasions over the 24-week period (baseline, 12- and 24-
weeks).
5.4.2 Ethics
This trial was managed by staff within the Institute for Physical Activity and
Nutrition (IPAN) Research at Deakin University Burwood, Melbourne, Victoria,
Australia. The study was approved by the Deakin University Human Research Ethics
Committee (HREC 2013-050) (Appendix 4), and is registered with the Australian
and New Zealand Clinical Trials Registry (ACTRN12613000592741). All
participants provided written informed consent prior to their commencement in the
study.

Chapter 5
Page | 175
5.4.3 Funding
This project was funded by a grant from the National Health and Medical Research
Council Project (APP1046269). The whey-protein powder was provided by
OmniBlend (Campbellfield, Victoria, Australia) and the vitamin D supplements
(Ostelin) by Sanofi-Aventis Australia Pty Ltd (Macquarie Park, New South Wales,
Australia).
5.4.4 Sample Size Calculations
As reported in Chapter 4, it was estimated that a sample size of 168 participants
would provide the study with 90% power (P<0.05 two-tailed test) to detect a 0.5%
absolute difference for the change in HbA1c levels between the groups, assuming a
conservative standard deviation of 1.1%. For insulin sensitivity, a sample size of 140
would be required to detect a 0.7 difference for the change in HOMA-2 insulin
resistance between the groups at a power of 90%, assuming a conservative standard
deviation of 1.2. To compensate for an estimated 20% drop-out rate, it was
calculated that 202 participants would be recruited to the study and randomised 1:1
to either of the two groups (101 participants per group).
5.4.5 Screening Procedure and Inclusion/Exclusion Criteria
As reported previously (595) and detailed extensively in Chapter 4, eligibility for this
study was assessed using a two-step screening process. Briefly, participants were
screened via a telephone questionnaire and ineligibility was based on the following
criteria: 1) aged <50 or >75 years of age; 2) HbA1c >10%; 3) current or prior
participation in a structured resistance training programme >once per week or
moderate-intensity physical activity ≥150 min/week in the previous 3-months; 4)
vitamin D or calcium supplement use >500 IU/day and >600 mg/day, respectively, in
the previous 3-months; 5) severe orthopaedic, cardiovascular or respiratory
conditions that would preclude participation in an exercise programme, or those with
absolute contraindications to exercise, according to American College of Sports
Medicine guidelines (596); 6) renal impairment (estimated glomerular filtration rate
(eGFR) <45 ml/(min 1.73 m2)) or disease; 7) regular use of protein supplements; 8)
conditions that may affect vitamin D or calcium metabolism; 9) current smoker, or

Chapter 5
Page | 176
10) body mass index (BMI) >40 kg/m2. Participants who passed the initial telephone
screening were then required to obtain approval from their doctor to clear them of
any medical conditions contraindicated to exercise, based on ACSM guidelines
(Appendix 6). Participants were also required to provide a fasted, morning blood
sample to confirm that their HbA1c level was <10%.
5.4.6 Recruitment Strategies
During the trial establishment period and prior to beginning the recruitment
campaign, chief investigators and lead trial staff met repeatedly to discuss which
strategies should be used to recruit participants into this trial. These meetings were
used to brainstorm and plan the various recruitment strategies to be used. Those
adopted first were ones which had been used previously by trial staff. These
included local newspaper advertisements, flyers/posters and GP presentations.
Within the first 2 to 3-months, recruitment of participants was modest with very few
expressions of interest received from these strategies alone and necessitated a change
in the recruitment plan. At this point, lead trial staff consulted with the Deakin
University public relations and communications team to discuss the re-development
of trial advertisements and trial communications to a clear, informative and
appealing style. Following these meetings, lead trial staff again devised additional
recruitment strategies and a range of approaches, in addition to those already in use,
were implemented to recruit participants from both metropolitan Melbourne and
surrounding regions in Victoria, Australia such as the Werribee, Geelong and
Mornington areas. Such strategies included state and local newspaper and radio
advertisements, targeted mail-outs through the National Diabetes Support Scheme
(NDSS) member database, GP and allied health referrals, community presentations,
web-based media and word of mouth. A brief overview of each of the recruitment
approaches used is below. Specific information relating to the method of recruitment
for each participant was obtained during the participant’s first enquiry to the study.
State Print Media
A total of six paid advertisements were placed in key state-wide newspapers with the
advertisements ranging in size, colour and placement within each paper. The content

Chapter 5
Page | 177
of these advertisements included an eye-catching headline, a brief and simple
description of the trial, including the potential health benefits to participants
associated with participation, and relevant contact details as shown below in Figure
5.1. The cost for each of the advertisements ranged from AUD$1,700 to AUD$3,000.
Figure 5.1: Example of the study advertisement in state print media (newspaper).
Local Print Media
Twelve paid advertisements, similar in format to the state-based advertisements as
shown below in Figure 5.2, were also placed in a range of local municipality
newspapers throughout the recruitment period. These newspapers are delivered
weekly to each household within a given area (municipality). In general, these
advertisements were placed in the same paper fortnightly over a 6-week period,
however, occasionally single advertisements were used to trial and target one locality
to gauge the level of interest. Local paper advertisements cost AUD$400 to
AUD$500 each, depending on the size and placement of the advert within the paper.
Several free advertisements were also placed in local newspapers in the community
‘What’s On’ section (limited to 40 words). These free advertisements were used as a

Chapter 5
Page | 178
buffer to continue the recruitment campaign between paid state and local media
advertisements.
Figure 5.2: Example of the study advertisement for local print media (newspaper).
Radio Advertising
The study was also advertised on a state-wide radio station. Forty-five 15-second
advertisements, which were drafted by study researchers and developed by the radio
station, were played over a five-day period (Monday to Friday). The radio station
was selected based upon the demographics of the majority of their audience (e.g.
middle aged and older adults). The advertisements were initially played during the
‘Seniors Spotlight on Trials and Studies’ segment and following this were spread
sporadically over the course of the day ranging from 6am through to 10pm.
Advertising this trial on Magic radio costs AUD$990 for the forty-five 15 second
advertisements.
Targeted Mail-outs
The research team gained approval from Diabetes Australia, a non-government
organisation, to access the NDSS database, which is a federally-funded register of
Australians with diabetes that was initiated in 1987. Briefly, the aim of NDSS is to

Chapter 5
Page | 179
enhance the capacity of people with diabetes to understand and self-manage their
condition, and to provide relevant information, support and access to essential
products at subsidised prices. In Victoria, the NDSS register contains the contact
detail of more than 85% of all clinically confirmed cases of diabetes, which includes
type 1, type 2 and gestational diabetes (597). Since 2001, individuals joining the
NDSS have been asked whether they would be willing to be informed of any
opportunities to participate in research. Only those who consented to be contacted
were eligible to be invited to participate in this study. Because of the extensive nature
of the database, the research staff first used the online Australian Diabetes Map
(http://www.diabetesmap.com.au/), which is an interactive national diabetes
prevalence map established and regularly updated by NDSS and the Australian
Bureau of Statistics (ABS), to identify local government areas and the postcodes
within these areas with a reported high prevalence of individuals with T2DM.
Thereafter, the research team contacted NDSS who were responsible for identifying
the number of individuals within each of the identified postcodes that had T2DM,
who were aged 50-75 years and reported that they were not currently taking insulin
to manage their condition. A letter of invitation to participate in the study, that was
prepared by the research staff but sent by NDSS, was then forwarded to all
individuals that fulfilled the necessary inclusion criteria (Appendix 8). Nine mail-
outs were conducted in total and the number of letters sent per mail-out ranged from
80 to 5,000 depending upon the number of registrants within a target area. The cost
of a direct mail-out was approximately AUD$1.80 per letter. This cost increased or
decreased marginally depending on the number of individuals contacted (the greater
the number of letters sent the cheaper the cost).
Referrals from GPs and Allied Health Professionals
General practitioners, endocrinologists and other relevant health professionals (e.g.
diabetes educators, dietitians and pharmacists) identified from relevant directories
(e.g. Yellow Pages), hospitals and profession specific association websites who were
based in a 45km radius of Melbourne were sent information packs via the mail that
provided details about the trial. Included in these packs was a one page study
summary, which outlined the aims, commitment required and the potential benefits

Chapter 5
Page | 180
to participants, and the key eligibility criteria. They also received trial flyers and
posters (discussed below) and were asked to place these on notice boards and/or
distribute them directly to relevant patients. Connections with several Medicare
Local groups (regional organisations who co-ordinate improvements in healthcare for
designated populations groups and oversee front line primary healthcare services)
were also made during the establishment of this trial. Specifically, the Diabetes
Australia map, mentioned previously, was used to identify areas with high
prevalence of T2DM. The respective Medicare Local groups were subsequently
contacted to inform them of the trial and were provided trial information and
advertisements and requested to include these in any communications with GPs or
allied health providers.
Flyers and Presentations
Flyers and posters (Figure 5.3) were placed in prominent public and relevant
locations such as fitness clubs, libraries, senior citizen centres, pharmacies,
community houses and retirement villages. In addition, three presentations were
made to a range of audiences; one to a diabetes support group where the attendees
were a mix of accredited Diabetes Educators, patients and carers, one to GPs at a
Medicare Local meeting and another at the Northern Accredited Diabetes Educators
annual general meeting.
Figure 5.3: An example of the study recruitment flyer.

Chapter 5
Page | 181
Website Advertisement
Information about the study was posted on the Lift for Life®, Diabetes Victoria,
Diabetes Australia, Fitness Australia, Deakin University’s Centre for Physical
Activity and Nutrition and the Australian Centre for Behavioural Research in
Diabetes websites. These listings were placed on respective websites at the beginning
of the recruitment campaign and requested to be removed from the website at the
completion of recruitment. There was no cost associated with posting information on
these websites.
Social Media
A pay-per-click advertisement (AUD$0.03 per click at a capped limit of AUD$500)
was placed on the social media domain Facebook five months into the recruitment
campaign. This advertisement was 20 words long and used key words to capture
potential participant’s attention. The adverts appeared on an individual’s Facebook
page whose age fell into the eligible age range for the trial and a postcode pre-
identified to be within a 15km radius of Deakin University. An individual who
clicked on an advertisement was directed to the Lift for Life® website for further
information about the trial. The cap of AUD$500 was not reached during the
recruitment period but did allow for ~16,600 clicks to the advert.
Word of Mouth
Participants enrolled in the trial were actively encouraged to refer family, friends or
colleagues with T2DM into the study. In addition, participants with T2DM who
enquired but were ineligible for other research studies being conducted within IPAN
and who had consented to be contacted for any other research studies, were contacted
by research staff via telephone to determine their interest and eligibility in regards to
participating in this trial.
5.4.7 Data Collection and Analysis
The number of expressions of interest (EOIs), participants screened and included in
the trial, and how they heard about the study was recorded by the research staff
throughout the recruitment process. Reasons for ineligibility or non-participation in

Chapter 5
Page | 182
the trial were also recorded. These were categorised into one of five categories;
health-related, physical activity status, medication/supplement use, travel or age.
Response rates were reported as the number and percentage of participants both
interested in and recruited into the trial. Recruitment yield was calculated as the total
number of participants recruited divided by the number of EOIs. The success of each
recruitment strategy was determined from the number of participants recruited
divided by the number of EOIs from each strategy expressed as a percentage.
Recruitment rates were also calculated as the average number of participants
recruited and randomised per month throughout the recruitment phase. Results were
also split by gender. The cost of each recruitment method used was calculated by
dividing the total amount spent on a given strategy by: 1) the number of EOIs
generated for each strategy, and 2) the total number of eligible participants the
strategy was responsible for recruiting (e.g. cost per participant recruited).
5.5 Results
5.5.1 Recruitment
Recruitment for this trial was intended to be completed within 12-months. This was
extended to a period of 21-months (February 2014 to October 2015) due to a lower
than expected recruitment rate. In total, 1,157 EOI were received from which 198
older adults with T2DM were deemed eligible for the trial and subsequently
randomised. This represents 98% of the original specified target sample size of 202
participants. The results of the recruitment campaign are presented below and
include the number of EOIs whom were determined ineligible or chose not to
participate in the trial, the recruitment yield for each strategy used, the recruitment
timeline and a cost analysis of each of the strategies employed.
5.5.2 Response Rates and Reasons for Ineligibility or Non-participation
In total, 516 of 1,157 (45%) EOIs were found to be ineligible for this trial following
the initial screening. As shown in Table 5.1 the most common reasons for
ineligibility included being too physically active (26%), taking vitamin D
supplements at a dose of >500 IU/day (25%) and management of T2DM by way of
insulin therapy (11%).

Chapter 5
Page | 183
Table 5.1: Reasons participants were deemed ineligible for the trial.
Reason for Ineligibility Total Ineligible, n (%)
Health-related 115 (22%)
Not diagnosed with T2DM 28 (5%)
Any medical condition contraindicated to PRT 18 (3%)
BMI >40kg/m2 30 (6%)
HbA1c >10% 14 (3%)
Presence or indication of kidney disease 8 (2%)
Current smoker 17 (3%)
Physical Activity Status 135 (26%)
Meeting/exceeding Physical Activity Guidelines 135 (26%)
Medication or Supplement Use 192 (37%)
Prescribed insulin for management of T2DM 59 (11%)
Taking Vitamin D supplements >500 IU/day 128 (25%)
Taking dietary protein supplements 5 (1%)
Travel 53 (10%)
Travel plans 53 (10%)
Age 21 (4%)
Aged <50 or >75 years of age 21 (4%)
Total 516 (100%)
Presence or indication of kidney disease was considered if eGFR <45 mL/min. Potential participants were excluded if meeting or exceeding National Physical Activity Guidelines of 150 minutes of moderate to vigorous physical activity or participating in greater than one strength training session per week. Participants were excluded if responded yes to taking dietary protein supplements at a protein content of <10g per serve, as specified on the products nutrition information panel.
A total of 443 participants chose not to participate in the trial. As shown in Table 5.2,
189 (43%) were unable to meet the requirements of the trial based on the
inclusion/exclusion criteria and a further 127 (29%) were lost to follow-up following
their initial enquiries into the program. In total 62 (14%) participant could not meet
the financial obligations of committing to the PRT program and 61 (14%) did not
live within travel distance to Deakin University or a have a training facility within

Chapter 5
Page | 184
their immediate area. Only 4 (1%) participants chose not to participate as they did
not wish to take supplements of any form.
Table 5.2: Number and proportion (percentage) of expressions of interest who chose not to participate in this trial and the reasons provided for non-participation.
Reason for non-participation Total, n (%)
Unable to meet requirements of the trial 189 (42.7%)
Unable to afford the Lift for Life® PRT program 62 (14%)
Not willing to consume supplements 4 (0.9%)
Lost to follow-up following initial enquiry 127 (28.7%)
Not living within a reasonable travel distance to trial sites 61 (13.8%)
Total 443 (100%)
5.5.3 Recruitment Return by Recruitment Strategy
As presented in Table 5.3, targeted mail-outs were the most successful approach for
recruitment, generating 479 (42%) of the 1,157 EOIs, from which 78 participants
were eligible for the trial (39% of those randomised). State-wide free and paid
advertisements generated the second greatest number of enquiries (n=326, 28% of
total), from which 54 participants were eligible and subsequently randomised.
Advertising in local newspapers (both paid and unpaid) generated 173 enquires
(15%), with 27 of these enquiries deemed eligible, whilst website advertisements
produced 96 enquires (8%) that led to 19 participants randomised. All other forms of
recruitment generated a low number of enquires and resulted in only 20 eligible
participants in total: word of mouth (n=6, 3%); referral from health professionals
(n=10, 5%); flyers/presentations (n=4, 2%), with zero eligible participants from radio
advertising and social media.

Chapter 5
Page | 185
Table 5.3: Number and proportion (percentage) of expressions of interest and participants deemed eligible for the trial based on the various recruitment strategies.
Eligibility Status
Eligible Expressions of Interest
Recruitment Strategy n % n %
State Print Media 54 27 326 28
Local Print Media 27 14 173 15
Radio Advertising 0 - 6 0.5
Targeted Mail-outs 78 39 479 41
Allied Health Referrals 10 5 19 2
Website Advertising 19 10 96 8
Social Media 0 - 5 0.4
Flyers/Community Presentations 4 2 11 1
Word of Mouth 6 3 37 3
No Record 0 - 5 0.4
Total 198 100 1157 100
5.5.4 Recruitment Return by Gender and Age
The total number of male participants recruited for the trial exceeded female (n=128
and n=70, respectively) resulting in a gender distribution among the trial population
of 65% male and 35% female, respectively. This male versus female distribution was
similar overall when examining expressions of interest received and those deemed
ineligible and eligible (Table 5.4). Interestingly, the only recruitment strategy that
resulted in a higher number of females (n=9) than males (n=1) was allied health
referrals, but the total number of referrals from this method was very low (Figure
5.4). In terms of the age distribution, 39% of all eligible participants were aged 50-59
years, 53% were aged 60-69 years with the remaining 11% aged over 70 years.

Chapter 5
Page | 186
Table 5.4: Number and proportion of men and women screened and deemed eligible or ineligible for the trial.
Eligibility Status
Eligible n=198
Ineligible n=959
Total Screened n=1157
n % n % n %
Male 128 65 541 56 669 58
Female 70 35 418 44 488 42
Males and females who chose not to participate were included in the ineligible figures for this analysis only.
Figure 5.4: The number of male and female participants eligible for this trial and the recruitment strategies they responded from.
5.5.5 Recruitment Timeline
As previously mentioned, recruitment for this trial spanned a 21-month period.
Figure 5.5 illustrates the number of participants randomised per month over this
period. On average, nine participants were randomised per month. The peaks on the

Chapter 5
Page | 187
graph correspond with the implementation of State based newspaper advertisements
(April, May, August, June, November 2014 and February 2015) and targeted mail-
outs through the NDSS (September, October and December 2014 and May, July,
September and October 2015). Figure 5.6 clarifies the timing of each recruitment
strategy. As shown, not all strategies were implemented continuously throughout the
campaign, however, several methods of recruitment were often in place at the same
time. This may have meant a participant was exposed to more than one recruitment
strategy such as an advertisement, recruitment flyer or mail-out however, only the
first recruitment strategy reported was recorded on the screening form.
Figure 5.5: Number of participants randomised to this trial each month for the duration of the recruitment period.

Chapter 5
Page | 188
Figure 5.6: Timeline and timing of recruitment strategies implemented during A) 2014 and B) 2015. Black square represents active recruitment strategies. P, presentation; WOM, word of mouth.
5.5.6 Recruitment Cost
Table 5.5 provides recruitment yield by cost for each recruitment method used in this
trial. Table 5.5 is presented from most to least expensive per eligible participant
recruited. Expenses included in the cost analysis do not include staff costs. Staff
costs were not included in the analysis as they were not tracked by each method and
were not able to be differentiable from other tasks performed in the administration of
the trial. The costliest recruitment methods were both state print media and NDSS
mass mailing which both accounted for 38% of the total recruitment budget. Overall,
the total costs attached to these two recruitment strategies were AUD$15,360 and
AUD$15,327 respectively. Cost per eligible participant was greatest for state print
media at AUD$284 with 54 participants recruited. By comparison the higher yield of
eligible participants from the NDSS mass mailing meant the cost per eligible
participant was lower at AUD$196. Costs per eligible participant for local print

Chapter 5
Page | 189
media were similarly high to state print media at $AUD239 however, due to the
small number of adverts placed the overall cost of AUD$6,445 was only 16% of the
recruitment budget. Printed (paid) trial flyers and posters which were used at
community presentations and provided to allied health professionals was the
cheapest form of paid recruitment, however, of paid methods it also generated the
least number of eligible participants. Radio advertising and social media, whilst
generating enquires into the study, were found not to be effective methods of
recruitment for this trial as no eligible participants were recruited from these
approaches. Free methods of recruitment including focused website advertising and
word of mouth were responsible for generating 25 eligible participants for the trial,
and as such formed an important part of trial advertising and recruitment in their own
right as there was no expense to the trial other than staff costs. The overall
recruitment costs for this trial were AUD$40,421, which equated to AUD$35 per
enquiry and AUD$204 per eligible participant.
Table 5.5: The total costs, proportion of total recruitment costs, the number of eligible participants plus cost per participant for each recruitment strategy in this trial.
Eligible
Participants (n)
Cost per Eligible
Participanta
Total Costa
% of Total Recruitment
Costs
State Print Media 54 $284 $15,360 38
Local Print Media 27 $239 $6,445 16
Radio Advertising 0 - $990 2.5
Targeted Mail-outs 78 $196 $15,327 38
Allied Health & Flyers/ Presentations
14 $128 $1,799 4.5
Website Advertisement 19 $0 $0 0
Social Media 0 - $500 1
Word of Mouth 6 $0 $0 0
Total 198 $40,421 100 aStaff costs are not included in this analysis. All costs of recruitment are in Australian Dollars. Costs per eligible participant was calculated by dividing the total cost by the number of eligible participants.

Chapter 5
Page | 190
5.6 Discussion
In this 6-month community-based exercise and dietary supplementation trial in older
adults with T2DM, a total of 1,157 EOI were received over a 21-month recruitment
period from which 198 participants (17%) were deemed eligible and subsequently
randomised. These figures reflect an average randomisation rate of nine participants
per month. The most effective recruitment strategies for this trial were targeted mail-
outs to registered members of the NDSS database (39% of the total sample) and State
print media (27%). Overall, recruitment expenditure totalled AUD$40,421, with the
aforementioned two most effective recruitment strategies each costing approximately
AUD$15,000, the combination of which corresponded to 76% of all expenditure. In
total, recruitment costs equated to AUD$35 per enquiry and AUD$204 per eligible
participant. Collectively, these findings highlight the significant challenges
accompanying recruitment of T2DM patients into a community-based lifestyle
modification trial involving exercise and a nutritional supplement.
5.6.1 Eligibility Rate
Of all the 1,157 EOIs for this trial, only 198 participants were found to be eligible,
equating to a 17.1% success rate. This rate of recruitment is similar to a 17.9%
recruitment rate that was reported in the Look AHEAD (Action for Health in
Diabetes) trial. The aim of this large multi-centre RCT was to investigate the effects
of a lifestyle intervention aimed at reducing bodyweight by 7% through increased
physical activity (PA) and a reduction in calorie intake on a range of health
outcomes, including incidence of heart attacks, stroke and cardiovascular-related
death in overweight or obese adults with T2DM (598). Comparing the recruitment
success rates of different trials can be problematic, as factors such as differences in
the inclusion/exclusion criteria will influence recruitment rates. Nevertheless, other
exercise intervention trials recruiting sedentary overweight and obese post-
menopausal females have reported recruitment rates ranging from 2% to 20% (599-
602). Thus, the recruitment rate in this trial appears to be consistent with previous
intervention trials in older adults and provides a realistic target for future exercise
based RCTs designed to target older adults with T2DM, particularly where the

Chapter 5
Page | 191
design of the trial has similar eligibility criteria and involves a comparable level of
commitment.
5.6.2 Success of Recruitment Strategies
The recruitment strategies used in this study were diverse and varied depending on
their success as the recruitment phase evolved. Mass mail-outs through the NDSS
was the most successful strategy for recruiting participants with T2DM into this trial.
These letters were responsible for recruiting 39% of all eligible participants. While it
is difficult to compare the success rate of our mass mail-out campaign to other trials
given the varying eligibility criteria, our rate is slightly above that reported by the
Diabetes Prevention Program (DPP) conducted in the United States. In the DPP 29%
of its randomised participants were recruited via direct mass mail-outs into their
multi-centre RCT aimed at discovering whether modest weight loss through dietary
changes and increased physical activity or treatment with the oral diabetes
medication could prevent or delay the onset of T2DM in those at high risk for the
condition (603). The ability of mass mail-outs to target a large number of participants
at relatively low cost, combined with the reported success of this strategy to yield a
high number of eligible participants in both healthy and clinical populations, has in
recent years led to mass mail-out becoming an integral part of many RCTs
recruitment plans (593, 604-606). From our experience, when implementing mass
mail-outs as a recruitment strategy it is the choice of the mail-out lists which is likely
to contribute to its effectiveness. For instance, in our trial we were able to selectively
request the NDSS target members of the registry who met three of our inclusion
criteria (T2DM diagnosis, current management of condition (prescribed only oral
hypoglycaemic medication if any) and age). The NDSS database also allowed letters
to be sent only to local government areas and postcodes which trial staff had
identified as areas with a high prevalence of T2DM. We believe that this selective
communication to a tailored list of potential participants in specific areas greatly
assisted in the efficient identification of eligible participants.
State and local print media were the second and third most prolific methods of
recruitment, yielding 27% and 14% of participants, respectively. Other RCTs using

Chapter 5
Page | 192
state and local print media have reported similar recruitment rates from such
advertisements (603, 607, 608). It has previously been reported that the most
efficient and comprehensive recruitment campaigns employ several overlapping
strategies simultaneously, with constant assessment of the strategies employed to
ensure appropriate allocation of resources to the most successful strategies (609).
Trial staff remained diligent tracking and assessing the effectiveness of each
recruitment strategy with only those with the greatest yield of eligible participants
persisted with. This may have resulted in the success rate of the mass mail-outs and
state media being over reported as these strategies were employed repeatedly
compared to those that resulted in a smaller and slower yield of eligible participants
(e.g. web advertising, allied health, word of mouth, flyers and community
presentations). Previously, it had been reported that print media including direct
mail-outs plus newspaper advertisements are two strategies which are more effective
at capturing the attention of an older adult demographic (603). A finding which was
also experienced in this trial with each of the alternate strategies employed; web
advertising, allied health, word of mouth, flyers and community presentations, radio
and social media, each recruiting less than 10% of participants.
Interestingly, medical and allied health referrals were not successful in recruiting
older adults with T2DM into the trial, a result which has also been noted previously
as a less effective recruitment strategy in a previous large community-based
Australian trial in older adults and the elderly (604). In our trial, it cannot be
determined whether this was due to medical/allied health professional’s lack of
communication about the trial, poor distribution of trial advertising material and/or if
there was a general lack of interest in participating in an exercise program from
individuals attending these appointments. Based on our experiences, it is a
recommendation for future trials to consider practice-wide presentations which
eliminates the burden on health professionals to convey trial information and may
result in a greater percentage of trial participants recruited from this approach.

Chapter 5
Page | 193
5.6.3 Recruitment Cost
In total, AUD$40,421 was spent on all recruitment strategies combined, which
equates to an average of AUD$204 per eligible participant. Very few detailed cost
analyses of other large-scale RCTs recruitment campaigns exist making it difficult to
comparatively assess the methods and associated costs of recruiting eligible
participants. However, a trial investigating weight gain prevention in young adults
reported the average cost of recruiting one participant was US$233 in 2014 (605).
Similarly, a study investigating the recruitment of minority women into the Women’s
Health Trial which also utilised targeted mass mail-outs reported per participant
recruitment costs ranging from US$100 to $144 in 1998 (610). In contrast, the DPP
trial which randomised 3,819 participants spent on average US$1,075 per
randomised participant (191). The recruitment strategies employed by the DPP trial
make comparing costs to our trial difficult as the DPP employed a public relations
agency to help direct recruitment who worked alongside a recruitment committee
with their recruitment phasing spanning a total of 3-years and costing $US4,105,000
(611).
Despite State print media acquiring the second highest number of eligible
participants for our trial, it was the most expensive method, costing a total of
AUD$15,360 or AUD$204 per eligible participant. Local print media advertising
costs were considerably lower than State media however, the small yield in eligible
participants (14%) resulted in this method being the second most expensive
recruitment strategy. Mass mail-outs through the NDSS, a strategy employed within
the first eight months of our recruitment campaign, produced a high eligibility to
response ratio resulting in this approach being implemented multiple times over the
recruitment period. Whilst this approach was the second most expensive strategy
used (AUD$15,326) and accounted for 38% of the total dollars spent on recruitment,
as indicated the large yield of eligible participants resulted in this approach costing
AUD$196 per participant. A greater comparison of recruitment methods and
associated costs will be able to be made when other investigators publish such data.

Chapter 5
Page | 194
5.6.4 Reasons for Ineligibility
Of all the EOIs received for our trial, 45% (n=516 participants) were deemed
ineligible. Of these, 26% was due to the participants being classified as too
physically active (e.g. meeting or exceeding the Australian National Physical
Activity Guidelines). This result is not unexpected as there is recent evidence that
approximately 30% of adults with T2DM were found to meet physical activity
guidelines (590). Further, our findings are comparative to the 26% exclusion for
physical activity reported by another recent RCT recruiting T2DM patients to an
automated, interactive voice-response telephone intervention to promote physical
activity behaviours in adults with T2DM (593).
5.6.5 Reasons for Choosing Not to Participate
Reasons for non-participation in RCTs for people that initially enquire are frequently
missing from recruitment publications, but are important to consider as these factors
may offer valuable insight into areas of trial design that may be improved upon to
enhance recruitment to future trials. In our trial, 443 potential participants chose not
to participate following a description of the trial and requirements of participating
from trial staff over the telephone, or after reading the plain language statement; 43%
felt the requirements of the 24-week PRT program was too much of a commitment.
A further 14% cited not being able to bear the financial costs (approximately
AUD$300-700 depending on training site) associated with joining the Lift for Life®
resistance training program, despite the incentive of a monetary reimbursement at the
completion of the trial based upon each participant’s level of compliance to the
exercise program (AUD$240 if exercise compliance was 80% or above).
Unfortunately, no information was collected on the potential effects of the monetary
reimbursement acting as an incentive to participate in the trial. Similarly, the effect
that having to pay for the Lift for Life® training program had on people’s reluctance
to participate in the trial was also not assessed.
5.7 Limitations
There are a number of limitations that should be considered when interpreting the
findings from this chapter. Our study specifically targeted older adults with T2DM

Chapter 5
Page | 195
for an exercise and dietary supplementation trial and so the results and experiences
reported should be tempered when applying to other trials recruiting alternate clinical
populations. The effects of the monetary reimbursement on incentive to participate in
the trial were not assessed and future studies need to ask these types of questions to
assess the effects of such incentives on willingness to participate in research. The
recruitment strategies found to be most successful in sourcing eligible participants
for this trial were also the ones which were extensively repeated multiple times,
potentially biasing the findings. Similar messages were used for all of the
advertisements and as such no data is available for what type of message may be
most salient to older adults with T2DM. Additionally, only one recruitment strategy
was recorded per expression of interest leaving open the potential for cross-
contamination from different recruitment methods. For example, some participants
who received a mail-out may also have been exposed to a trial advertisement in web
or print media format, however, with only one form of recruitment noted for each
expression of interest the effects of exposure to two recruitment strategies remains
unknown. In the future, it would be useful for other trials to include such a question
in order to determine the benefits of multiple exposures to recruitment methods.
5.8 Conclusion
This chapter aimed to address the practical considerations surrounding recruitment of
older adults with T2DM into a RCT involving lifestyle modification. Recruitment
required continual sustained efforts and necessitated flexibility within the recruitment
strategies used to ensure the recruitment targets were being achieved. Of the vast
array of recruitment approaches employed, strategies which were found to be
ineffective at recruiting participants to this trial were radio advertising and social
media. Successful recruitment approaches were found to be those which directly
targeted the patient population of interest. The most successful strategy was targeted
mail-outs to members of the NDSS database, with state print media the second most
effective strategy. Overall, AUD$40,421 in total was spent on recruiting participants
to this trial, costs per randomised participant were AUD$204. The reporting of this
trials recruitment experiences offers several lessons about strategies and costs for

Chapter 5
Page | 196
future trials looking to recruit T2DM patients for trials involving lifestyle
modification.
Future Recommendations
An understanding of the specific population being recruited is key to identifying the
optimal strategies to reach trial demographics. It is important to design an
appropriately budgeted recruitment plan that is effective in sourcing eligible
participants and engaging interest from the target group to ensure subsequent
enrolment into the research trial. Such planning is paramount to successfully
remaining on target for the timely completion of RCTs within the allocated budget.

Page | 197
Chapter 6
The Effects of Progressive Resistance Training Combined with a
Whey-Protein Drink and Vitamin D Supplementation on Glycaemic
Control, Insulin Sensitivity and Body Composition and
Cardiovascular Risk Factors in Older Adults with Type 2 Diabetes

Chapter 6
Page | 198
6.1 Declaration Statement
This Chapter presents the analysis, results and discussion of the 6-month community
based PRT program titled REVAMP-IT. Under the guidance of my primary
supervisor my role was to analyse the data arising from this trial as presented in this
Chapter, draft and write the results, prepare all tables and figures along with
preparing the discussion with assistance from my supervisory team.

Chapter 6
Page | 199
6.2 Abstract
Supervised and structured high-intensity progressive resistance training (PRT) has
been shown to improve glycaemic control and lean mass in older adults with type 2
diabetes mellitus (T2DM), but whether similar benefits are achieved with
community-based moderate to high-intensity PRT remains uncertain. Emerging
evidence suggests that high protein diets, whey protein and/or vitamin D
supplementation may have beneficial effects on glycaemic control, body
composition, and cardiovascular health in those with T2DM, but whether combining
protein and vitamin D with PRT can provide additive or synergistic health benefits
remains unknown. The aim of this 24-week RCT was to investigate whether
combining PRT with whey protein and vitamin D supplements could enhance the
effects of PRT alone on glycaemic control, body composition and cardiovascular
health outcomes in older adults with T2DM. A total of 198 older adults (mean ± SD
age 61.5 ± 6.2 years) with T2DM participated in a community-based PRT program
(2-3 times per week) for 24-weeks with participants randomised to whey protein
supplementation (20 g per day plus 20g following PRT) with vitamin D treatment
(2,000 IU/day) (PRT+ProD, n=98) or PRT alone (PRT, n=100). Body composition
(total body, regional lean and fat mass plus thigh muscle cross-sectional area (25%
femur)) was measured at 0 and 24-weeks by DXA and pQCT. Glycaemic and
insulinaemic parameters along with lipids and inflammatory markers were assessed
at 0, 12- and 24-weeks using standard techniques. A total of 168 participants (85%)
completed the 24-week intervention (PRT+ProD=88 and PRT=80). Mean exercise
compliance was significantly higher in PRT+ProD compared to PRT (67% vs 58%,
P<0.05) and compliance with the whey protein and vitamin D supplements was 79%
and 92%, respectively. Overall serum 25(OH)D levels were ~72nmol/L at baseline
and 24-weeks of supplementation led to a mean increase of 28 nmol/L in the
PRT+ProD group (P=0.001); there was no change in PRT. Intention-to-treat analysis
showed PRT led to significant improvements in glycaemic control, total body and
regional (arm and leg) lean mass, thigh muscle size, upper and lower body muscle
strength, waist circumference, fat mass and DBP, but there was no added benefits of
the whey protein drink and vitamin D supplements, with the exception that there was
a significantly greater reduction in serum insulin concentrations after 12- and 24-
weeks in the PRT+ProD compared to PRT group. Similarly, there was significant

Chapter 6
Page | 200
beneficial effect of PRT combined with whey protein and vitamin D relative to PRT
alone on the anti-inflammatory marker IL-10, yet no between-group differences for
the change in any other inflammatory cytokines. Secondary pre-planned analysis
examining those who achieved ³66% exercise and ³80% whey protein and vitamin
D supplement adherence revealed a greater improvement in upper body muscle
strength and serum IL-6 in the PRT+ProD group plus a greater reduction in total and
low density lipoprotein (LDL) cholesterol. In summary, a community-based PRT
program was found to be safe and effective for improving glycaemic control and
body composition, but the addition of whey protein and vitamin D supplementation
did not enhance these health benefits in older overweight and obese adults with
T2DM.

Chapter 6
Page | 201
6.3 Introduction
Type 2 diabetes is largely considered a lifestyle-related disorder, and thus regular
exercise and adequate nutrition are widely considered the key pillars for the
management of glycaemic control and reducing body weight and fat mass in those
who are overweight/obese (5, 6). Traditionally, aerobic exercise training and caloric
restriction have been advocated for the management of weight and fat mass, but such
an approach has typically been associated with a loss in lean mass (7, 8). This is
important because lean mass is the primary site of glucose disposal under insulin
stimulated conditions (9). Indeed, reductions in lean mass have been shown to
negatively affect glycaemic control and metabolic rate, and further compound the
problems of insulin resistance (10, 11).
Progressive resistance training (PRT) is one mode of exercise that has been shown to
be safe and effective for improving or maintaining lean mass, size and strength in
older adults with T2DM (8, 12, 14, 204, 212, 225, 250, 612). Indeed, current national
and international physical activity guidelines for the management of this condition
recommended that moderate to high-intensity PRT be performed at least twice a
week due to it beneficial effects on lean mass, glycaemic control and insulin
sensitivity (6, 185, 211, 231). There is also some evidence supporting a beneficial
effect of PRT on markers of systemic inflammation in older adults with T2DM (217,
230, 238), which is important as increased inflammation has been implicated in the
pathophysiology of insulin resistance, endothelial dysfunction and cardiovascular
disease (22). To date however, the majority of randomised controlled trials (RCTs)
examining the effects of PRT in older adults with T2DM have been conducted under
tightly controlled and structured clinical laboratory settings. While there is some
evidence that community-based programs can improve glycaemic control and body
composition in adults with T2DM (204, 255), the benefits appear to be less
impressive which may relate to a number of factors including training intensity,
exercise compliance and/or inter-individual differences in dietary habits.
Nutrition or nutritional modification, like exercise, is an integral component to the
management of T2DM and influences many metabolic pathways that affect the
progression of this disease. Enhancing the health benefits of PRT through nutritional

Chapter 6
Page | 202
management may offer a synergistic effect on glycaemic control, body composition
and cardiovascular risk factors. In recent years, there has been considerable interest
into the role of dietary protein, including whey protein supplements, due to its
positive effects on stimulating insulin secretion and improving glycaemic control
(52, 329, 330, 379). Furthermore, in non-diabetic adults, post-exercise ingestion of a
protein-rich supplement such as whey protein has also been found to maximise the
anabolic effects of PRT on lean mass (305, 519, 572, 613, 614). Long-term
consumption of whey protein supplements has been reported to reduce weight and fat
mass through its effects on increasing satiety and subsequently reducing total energy
intake (353, 403). There is also mounting evidence that vitamin D deficiency is
associated with impaired beta-cell function, glucose intolerance, insulin resistance
and increased systemic inflammation, all of which may be improved with
supplementation, although the findings from RCTs are mixed (22, 59, 615). Whether
there are additive health and metabolic benefits of combining vitamin D and whey
protein with a community-based PRT program in older adults with T2DM is not
known. However, in a recent 13-week double-blinded, randomised placebo
controlled trial in 130 sarcopenic elderly adults without T2DM (mean age 80.3 years)
it was reported that the combination of 22g of whey protein and 100 IU vitamin D
twice/day with exercise improved total body lean mass, reduced android fat mass,
and improved strength and reduced inflammation in comparison to the placebo plus
exercise group (513).
The primary aim of this community-based Resistance Exercise, Vitamin D and
Muscle Protein Intervention Trial (REVAMP-IT) was to investigate if a community-
based PRT program combined with a whey protein and vitamin D enriched
supplement could synergistically interact to concomitantly enhance the effects of
PRT alone on glycaemic control and insulin sensitivity in older adults with T2DM.
Secondary aims were to examine the effects of the intervention on body composition
(total body and regional lean and fat mass and percent body fat), cardiovascular risk
factors (lipid and lipoprotein levels, blood pressure) and various markers of systemic
inflammation.
Chapter 6
Page | 203
6.4 Methods
As a detailed description of the methods for this study has been provided in Chapter
4, a brief summary of the methods for REVAMP-IT is provided below.
6.4.1 Study Design
This study was a 24-week two-arm parallel, RCT. Participants with established
(diagnosed by a GP or endocrinologist) T2DM who were suitable for the current
community-based Lift for Life® PRT program and met the trial inclusion criteria
(refer to Chapter 4 section 4.2.6 Screening and Eligibility) were randomised to one of
two groups: 1) the Lift for Life® program combined with a whey-protein drink and
vitamin D supplements or 2) the Lift for Life® program alone.
6.4.2 Participants
Men and women aged 50 to 75 years with established T2DM, treated with diet alone
or any oral hypoglycaemic agents (except insulin), were invited to participate in this
study. A two-step screening process was employed in this study. In the first instance,
a telephone screening questionnaire (Appendix 5) was used to assess an individual’s
eligibility. Participants were eligible if aged 50-75 years, had been diagnosed with
T2DM and were treating/managing their condition through dietary change or oral
hypoglycaemic medication only. Those who passed the telephone screening were
then required to gain GP approval prior to randomisation and participation in the Lift
for Life® program (second screening step) (Appendix 6).
6.4.3 Ethics
Ethics was approved by the Deakin University Human Research Ethics Committee:
Project number EC2013-050 (Appendix 4). This study is also registered with the
Australian New Zealand Clinical Trials Registry, registration number
ACTRN12613000592741.
6.4.4 Funding
This project was funded by a grant from the National Health and Medical Research
Council Project (APP1046269). The whey-protein powder was provided by

Chapter 6
Page | 204
OmniBlend (Campbellfield, Victoria, Australia) and the vitamin D supplements
(Ostelin) by Sanofi-Aventis Australia Pty Ltd (Macquarie Park, New South Wales,
Australia).
6.4.5 Randomisation
Randomisation occurred at the level of the individual participant, stratified by gender
and diabetes treatment (diet or oral hypoglycaemic medication), in blocks of 4-8
using a computer-generated random number sequence (Microsoft Excel) by an
independent researcher. All research staff responsible for the collection of
anthropometric, blood pressure, and body composition data were blinded to the
intervention groups. The project manager was solely responsible for the distribution
of supplements to participants randomised to the Lift for Life® program plus whey-
protein and vitamin D supplements. A limitation of our study was that the project
manager was involved in some of the strength assessments which may have
introduced some observational bias.
6.4.6 Intervention
Lift for Life® PRT Program
All participants were required to follow a training program modelled off the structure
of the Lift for Life® PRT program (www.liftforlife.com.au). The Lift for Life®
program comprises moderate-intensity PRT (2-3 sets of 8-12 repetitions at 60-75%
of maximum strength of 8-10 exercises) involving dynamic concentric and eccentric
contractions, focusing on the major muscle groups of the body. Training was made
incrementally more challenging at a rate of 2-10% per week to meet the principles of
progressive overload with the Borg RPE scale also used to validate training intensity.
An appropriate training intensity level for this trial was established as 12-15
(moderate- to high-intensity).
Due to the limited number of accredited Lift for Life® program providers in
Melbourne Australia, the trial was expanded to include training locations such as
commercial gymnasiums that were not accredited as a Lift for Life® program
provider but which did allow participants to safely perform a PRT program under the

Chapter 6
Page | 205
guidance of qualified Certificate IV personal trainers (minimum qualification). In
such instances, the structure of the training programs for these participants imitated
that of the Lift for Life® program as depicted below in Figure 6.1.
Figure 6.1: Flow diagram of the progress through the 24-week PRT program used in
this trial modelled off the Lift for Life® program.
Whey-Protein and Vitamin D Supplementation
Participants randomised to the Lift for Life® plus whey-protein and vitamin D
supplementation group received a 12-week supply of a whey-protein enriched
powder and vitamin D supplements at the completion of baseline testing and again
after 12-weeks of training. Whey-protein supplements were provided in single use
sachet form (OmniBlend, Campbellfield, Victoria, Australia). Participants were
instructed to mix one sachet containing 20g of WPC (80%) with 150ml of water
every morning of the trial and consume an additional supplement within two hours of
each Lift for Life® PRT session on the respective training days. Participants received
a marked shaker cup with instructions on how to reconstitute the whey-protein
powder in water (1 sachet per ~150ml of cold water) along with appropriate storage
instructions for the supplements. Participants were offered two flavours to select

Chapter 6
Page | 206
from (vanilla or mocha coffee). A detailed description of the preparation of these
supplements is provided in Chapter 4.
In addition to the whey-protein supplements, participants randomised to this
treatment group were also asked to take two 1,000 IU capsules of vitamin D3
(Ostelin, Melbourne, Victoria, Australia) each day for the duration of the study. The
goal of vitamin D3 treatment was to raise serum 25(OH)D concentrations to at least
75 nmol/L.
6.5 Outcome Measures
Participants attended Deakin University on three occasions throughout the duration
of the study for assessment (baseline, 12- and 24-weeks). All outcome measures
were assessed within the School of Exercise and Nutrition Sciences at Deakin
University, Burwood campus with the exception of fasted blood sample collections
which occurred at local pathology clinics at baseline, 12- and 24-weeks.
6.5.1 Anthropometry
All participants’ height, weight and waist circumference were measured using
standard techniques.
6.5.2 Blood Pressure
Following a 5-minute rest period where all participants were seated in a quiet room,
systolic blood pressure (SBP) and diastolic blood pressure (DBP) was measured
using an automated blood pressure monitor (AND Vital Sensor, Model number TM-
2551P, Abingdon, Oxford). Four measurements were taken on the left arm with a 2-
minute interval between readings; the mean of the final three readings were used in
the analysis.
6.5.3 Body Composition
Total body and regional (arm and leg) lean mass, fat mass and percentage body fat
was measured from total body scans performed using Dual X-ray Absorptiometry
(DXA) (Lunar Prodigy, GE Lunar Corp., Madison WI), using software version

Chapter 6
Page | 207
12.30.008. The short-term co-efficient of variation (CV) for repeated measurements
of total body lean mass and fat mass within the laboratory ranges from 1.0% to 1.7%.
A peripheral quantitative computed tomography (pQCT) scanner (XCT 3000, Stratec
Medizintechnik GmbH, Pforzheim, Germany) was used to measure muscle cross-
sectional area (CSA), subcutaneous and intermuscular fat CSA and muscle density,
as a surrogate measure of intermuscular adiposity, at the 25% femur site. The CV for
femur muscle CSA within the laboratory is 1.3%.
6.5.4 Muscle Strength
Isometric knee extensor strength (force in kg) was measured on the participant’s
dominant leg using Lord's strap assembly incorporating a strain gauge (Neuroscience
Research Australia, Sydney, Australia). Maximal muscle strength of the lower limbs
and back was estimated by employing three-repetition maximum strength (3-RM)
tests for the bilateral leg press (Synergy Omni Leg Press S-31 OPD, QLD, AUS) and
the seated row (Nautilus F3 Adjustable Tower Pulley System F3ATFS, Nautilus,
Vancouver, WA). One-repetition maximum (1-RM) muscle strength was determined
using the formula by Wathen et al. (579): 1-RM = 100 x (3-RM load)/(48.8 + 53.8 x
e (0:075x3)). The short-term CV for repeated measurements of 1-RM testing in our
laboratory was 2.0% for leg and 1.1% for back strength.
6.5.5 Biochemical, Hormonal and Inflammatory Cytokine Measurements
Extensive methodology for the measurement of biochemical, hormonal and
inflammatory markers is provided in Chapter 4. Following an overnight fast, a rested
morning (8-10am) venous blood sample was collected from each participant’s
antecubital vein at a local pathology laboratory. The following series of parameters
were all assessed by the pathology clinic using standardised techniques: HbA1c,
plasma glucose, creatinine, calcium, C-peptide, estimated glomular filtration rate
(eGFR), high-sensitive C-reactive protein (hs-CRP) and blood lipids (total
cholesterol, high density lipoprotein (HDL) cholesterol, low density lipoprotein
(LDL) cholesterol and triglycerides).

Chapter 6
Page | 208
A range of hormonal and inflammatory markers were assessed in a single batch at
the completion of the study from serum aliquot samples collected and stored
throughout the study. Serum 25(OH)D were analysed at Monash Health, Melbourne,
Australia. Samples were measured on the AbSciex Q Trap 5500 MS by liquid
chromatography-tandem mass spectrometry (LC-MS/MS). Serum IGF-1 was
measured using a 1-step sandwich chemiluminescense immunoassay LIAISON®
IGF-1 kit (DiaSorin, Saluggia (VC), Italy) with samples read on a LIAISON®
Analyser. Insulin sensitivity was assessed from fasting plasma insulin and fasting
plasma glucose (FPG) concentrations using the HOMA-2 calculator available from
the Diabetes Trials Unit www.OCDEM.ox.ac.uk (616).
A detailed description of the methods for inflammatory marker measurement is
provided in Chapter 4. The mean intra and inter-assay CVs for IL-6, IL-10, IL-8,
TNF-ɑ and Adiponectin was <12%. Samples with results below the detectable limits
of the assay were allocated the minimum detectable concentration for each assay: IL-
6= 0.16 pg/mL; IL-10= 0.40 pg/mL; IL-8= 0.06 pg/mL; TNF-ɑ = 0.07 pg/m;
Adiponectin = 0.20 µg/mL.
6.5.6 Dietary Assessment
Briefly, dietary data was collected with two 24-hour dietary recalls at baseline of
which the second one was used in the analysis and one 24-hour dietary recall at 12-
and 24-weeks. The data collected from the 24-hour recalls was entered into
FoodWorks Professional (Version 8, Xyris Software, Queensland, Australia) to
calculate total dietary energy intake and dietary macronutrient composition using the
AUSNUT 2011-13 database including AusBrands and AusFoods. Mean daily
alcohol consumption was estimated from self-reported intakes over the previous
seven days.
Habitual Protein plus Protein from Whey Protein Supplements
The additional protein consumed from the whey protein supplements was calculated
for both training days and non-training days given the differing number of
supplements prescribed (one on non-training days and two on PRT days). Individual
compliance as a percentage with the whey protein supplements was multiplied by the

Chapter 6
Page | 209
dose of protein (either 20 or 40 g) with this amount subsequently added to the
habitual protein intake reported from the 24-hour food diaries to calculate the grams
per day of protein consumed. The same method was used to calculate g/kg/day at
both 12- and 24-weeks with weight at both these respective time points used in the
calculations to determine the g/kg/day of protein intake inclusive of the whey protein
supplement.
6.5.7 Habitual Physical Activity
Total leisure and recreational physical activity time (hours per week) was assessed
using the Community Healthy Activities Model Program for Seniors (CHAMPS)
physical activity questionnaire. These results are reported as estimated kilojoules per
week spent in moderate- to high-intensity activities.
6.5.8 Medical History, Health Status and Medication Use
All participants completed a lifestyle questionnaire to obtain information on
education background, history of diseases or illnesses, current medial conditions,
family history of diabetes, smoking history, current medication and dietary
supplement use, average weekly alcohol consumption. Information on any alterations
to or new medication prescribed by the participants’ doctors was collected by
research staff via the monthly telephone calls.
6.5.9 Compliance Assessment
Lift for Life® Exercise Training Cards
Compliance with the Lift for Life® PRT program was evaluated via self-completed
exercise cards. These cards were returned to researchers at the completion of the first
four weeks of training either by post or trial staff collection from respective training
locations. This allowed the PRT programs to be reviewed and additional exercises
prescribed or modified if not challenging enough.
Supplement Calendars
Compliance with the prescribed protein and vitamin D supplements were evaluated
via self-completed compliance calendars and a capsule count of remaining vitamin D

Chapter 6
Page | 210
supplements, respectively. The compliance calendars for the protein supplements
were cross-referenced by counting the remaining sachets of protein returned at the
final testing appointment.
6.5.10 Adverse Events
Any adverse events associated with the exercise program or supplements were
recorded by research staff during the monthly phone calls to participants. For this
trial, an adverse event was defined as any health-related untoward or unfavourable
medical occurrence that developed or worsened during the 24-week trial as a direct
result of either the exercise program or supplements. All adverse events were
assessed for seriousness, causality and expectedness by the research staff and
reported adverse events were categorised into adverse event, serious adverse event or
unanticipated problem based upon the National Institute of Ageing guidelines (589).
6.5.11 Statistical Analysis
For the statistical analysis of this 24-week intervention we used the Statistical
Package for the Social Sciences (SPSS, version 24) and Stata statistical software
release 14.0 (College Station, TX: StataCorp LP.). Prior to all analyses, the data was
checked for normality with natural log transformations used to achieve normality
when required. This included: serum IL-10, IL-6, IL-8, TNF-a, adiponectin, hs-CRP,
insulin sensitivity (HOMA2%S) and all strength measures (knee-extensor strength,
1-RM leg press and 1-RM seated row). Independent t-tests were used for between-
group comparisons at baseline for continuous variables and Chi-square tests for
categorical variables. The McNemar test was used to check for any differences
between the groups for the change in the proportion of participants taking diabetes
medication, anti-hypertensive, lipid-lowering, diuretic and nonsteroidal anti-
inflammatory drug (NSAIDs) therapies.
All the data was analysed on a modified intention-to-treat basis, including all
randomly assigned participants, regardless of exercise or supplement compliance,
with at least one follow-up observation. To assess whether the whey protein drink
and vitamin D supplements enhanced the effects of PRT after 12- and 24-weeks,

Chapter 6
Page | 211
generalised linear mixed models were used with random intercepts fitted for each
outcome, including fixed effects for time (baseline, 12- and 24-weeks), group
(PRT+ProD, PRT), and an interaction between group and time. Several models were
run: 1) unadjusted, 2) adjusted for the baseline value of the outcome variable, and 3)
adjusted for various covariates (see below). Adjusting for baseline for each outcome
variable made no difference to the results, with the exception of fasting insulin where
a significant between-group interaction was seen at both 12- and 24-weeks (P=0.028
and P=0.038) and for serum TNF-a where there were no longer any between-group
differences after 12-weeks (P=0.620) and 24-weeks (P=0.241). For all outcome
measures where there were only two time points, specifically body composition as
assessed from DXA and pQCT along with 1-RM strength outcomes, analysis of
covariance (ANCOVA) was performed with baseline values included as a covariate
and the change as the outcome measure. Model 3 included the following covariates:
age, gender, ethnicity, BMI, moderate-vigorous physical activity and diabetes
management. Anti-hypertensive or lipid-lowering medication were also included as
covariates for blood pressure and lipid measures, respectively. The P-values are
presented from unadjusted analysis and model 3.
To calculate the net between group differences for the changes over time, we first
calculated the within-group changes from baseline in each group at each time point
and then subtracted the within-group changes in the PRT+ProD group from those in
the PRT group at 12- and 24-weeks. Percentage changes in the previously listed
variables which were log-transformed prior to analysis represent the absolute
differences from baseline multiplied by 100. All data is presented as means ± SD or
95% CI, unless stated otherwise and P<0.05 was considered statistically significant.
Whilst we acknowledge reporting of within-group changes at multiple time points
increases the risk of type I error and could have performed Bonferroni corrections we
set our significance level at P<0.05, as stated above, along with our hypotheses being
established a priori and like others (617) considered such a method to be overly
conservative in this instance as previously reported (618).
In addition to the above, tests of interactions by gender, BMI (< 30 vs ≥ 30 kg/m2),
diabetes management (use of oral hypoglycaemic medication or lifestyle

Chapter 6
Page | 212
management) and anti-hypertensive or lipid-lowering medication use (yes or no)
were also tested for all relevant measured outcomes variables. For glycaemic
outcomes, we also conducted tests of interactions for baseline HbA1c (< 7 vs ≥ 7%)
and FPG (< 7 vs ≥ 7 mmol/L). Of all these interactions tested for each outcome
variable none were found to be significant and thus the results are not presented.
All these same statistical tests and tests of interactions as stated above were run in the
same manner for the per protocol analysis using only those participants who met the
per protocol requirements. For the per protocol analysis, the cut point was set at 66%
compliance or approximately two PRT sessions per week along with 80% of the
whey protein and vitamin D supplements.
6.6 Results
6.6.1 Participant Characteristics
A total of 198 adults (126 men and 72 women) with established T2DM aged 50-75
years (mean ± SD: 61.5 ± 6.2 years) were randomised to participate in this 24-week
intervention trial. The mean ± SD age at diagnosis for T2DM was 54.9 ± 7.7 years
and the mean disease duration was 7.0 ± 5.2 years (range 21 days to 21.7 years). An
equal proportion of participants in each group at baseline were classified as
overweight (PRT+ProD, 41.8%; PRT, 36.0%, Chi-square P=0.40) or obese
(PRT+ProD, 44.9%; PRT, 58.0%, Chi-square P=0.065). An equal proportion of men
and women were allocated to each group and of similar ethnic backgrounds (Table
6.1). Approximately 70% of participants managed their diabetes with medication but
there were no differences in the proportion of participants in each group with regard
to how they managed their diabetes (e.g. lifestyle alone or medication) (Table 6.1).
There were also no differences at baseline between the two groups for any of the
additional characteristics listed in Table 6.1, including the number and proportion of
participants who reported previous diagnosis with hypertension,
hypercholesterolaemia or CVD as diagnosed by a doctor. The only exception to this
was the PRT+ProD group were found to have a significantly larger number and
proportion (n=65, 66%) of participants who had a family history of T2DM compared
to those in the PRT group (n=46, 46%, P<0.01).

Chapter 6
Page | 213
Table 6.1: Baseline characteristics of participants in the PRT+ProD and PRT groups. PRT+ProD PRT
n 98 100 Male / Female, n 62 / 36 64 / 36
Age (years) 61.1 ± 6.2 62.0 ± 6.2
Height (cm) 170.2 ± 10.3 170.5 ± 9.2 Ethnicity
Caucasian, n (%) 84 (86) 89 (89)
Asian, n (%) 11 (11) 8 (8)
Other, n (%) 3 (3) 3 (3) Age at diagnosis (years) 54.1 ± 7.2 55.1 ± 7.9
Duration of diabetes (years) 6.9 ± 5.4 6.9 ± 5.3
Family history of diabetes, n (%) 65 (66)** 46 (46) Diabetes management (lifestyle / medication), n 27 / 71 32 / 68
Overweight/Obese
Normal weight, n (%) 13 (13) 6 (6) Overweight, n (%) 41 (42) 36 (36)
Obese, n (%) 44 (45) 58 (58)
Ex-smoker, n (%) 36 (37) 41 (41)
Self-reported co-morbid condition Hypertension, n (%) 56 (60) 62 (62)
Hypercholesterolaemia, n (%) 27 (29) 25 (25)
CVD1, n (%) 7 (7) 12 (12) Employment status
Working full-time, n (%) 42 (43) 35 (35)
Working part-time/Semi-retired, n (%) 16 (16) 26 (26)
Not-working/Retired, n (%) 40 (41) 39 (39) Values presented are mean ± SD unless stated. The classification of overweight and obese was completed using the following BMI cut-offs, overweight BMI ≥ 25.0- ≤ 29.9 and obese BMI ≥ 30.0. 1 Cardiovascular disease encompassed previous diagnosis heart disease or previously having suffered a heart attack. 1 Cardiovascular disease encompassed previous heart attack, angina, heart disease and/or stroke. **P<0.01 vs PRT. CVD, Cardiovascular disease. PRT+ProD, progressive resistance training plus protein and vitamin D supplements; PRT, progressive resistance training.

Chapter 6
Page | 214
6.6.2 Study Attrition
Study Attrition
A CONSORT flow-chart of the study design including information for all
withdrawals and participants lost to follow-up is presented in Figure 6.2. Following
randomisation and prior to the 12-week assessment, an equal proportion of
participants from both the PRT+ProD (n=3) and PRT (n=5) groups were lost to
follow-up (e.g. could not be contacted or did not reply to phone, email or postal
requests) (Chi-square, P=0.721). In addition, a further 13 participants withdrew from
the study during the initial 12-weeks, the number of withdrawals was significantly
greater in the PRT than the PRT+ProD group (PRT+ProD n=2; PRT n=11; Chi-
square, P=0.011). The main reasons for withdrawal are discussed below. Following
the 12-week assessment, a further five participants in the PRT+ProD group were lost
to follow-up compared to only one participant in the PRT group (Chi-square,
P=0.084). An additional three participants in the PRT group withdrew from the trial
during this period, with no withdrawals in the PRT+ProD group. Thus, a total of 14
participants were lost to follow-up throughout the study with an equal proportion
from each group (PRT+ProD, n=8; PRT, n=6, Chi-square, P=0.553) and 16
participants withdrew from the trial, with a greater proportion in the PRT group
(14%, n=14) compared to the PRT + ProD group (2%, n=2) (Chi-square, P=0.002).
Three participants in the PRT+ProD and 11 in PRT group never commenced the
exercise program following randomisation. One participant in each of these groups
who never commenced the training program returned for follow-up testing
appointments at 12- and 24-weeks. These participants were not excluded from final
analysis. Overall, a total of 168 (85%) participants completed the trial and had data
available for final analysis, with slightly fewer drop-outs (withdrawals or lost to
follow-up) in the PRT+ProD group (n=88 included in final analysis) compared to the
PRT group (n=80 included in final analysis) (Chi-square, P=0.055).
Reasons for Withdrawal
During the first 12-weeks, the reasons for withdrawal in the PRT+ProD group were
health-related (n=1) and dislike of the training program (n=1). For the PRT group,
the reasons were health-related (n=5), carer/work commitments (n=4) and dislike of
the training program (n=2). Following the 12-week assessment, another three

Chapter 6
Page | 215
participants in the PRT group withdrew for either health-related reasons (n=2) or a
dislike of the training program (n=1). Overall, there were no significant differences
between the groups for the various reasons for withdrawing from the trial, with the
exception that a greater proportion of participants in the PRT group (n=4) withdrew
for health-related reasons compared to the PRT+ProD group (n=0) (Chi-square,
P=0.045).
When comparing those who either were lost to follow-up or withdrew from the
intervention to those who remained in the study, there were no differences observed in
any of the baseline outcome measures with the following exceptions; those who were
lost to follow-up/withdrew had a higher mean (± SD) baseline HbA1c (7.46 ± 1.30 vs
6.92 ± 1.10, P=0.01), FPG (9.36 ± 2.99 vs 8.04 ± 2.10, P=0.003), fasting insulin levels
(125.1 ± 163.4 vs 89.8 ± 51.7, P=0.03) and lower serum adiponectin levels (1.86 ±
0.91 vs 2.93 ± 0.12, P=0.001) compared to those who remained in the study.

Chapter 6
Page | 216
Figure 6.2: CONSORT flow diagram of participants through the trial. Progressive resistance training (PRT); protein and vitamin D supplements (ProD).

Chapter 6
Page | 217
6.6.3 Compliance
Lift for Life® Exercise Program Compliance
Compliance (the percentage of PRT sessions attended out of the total 64 prescribed
over the 24-week intervention) with the PRT program was significantly greater for
the PRT+ProD [mean (95% CI): 67.5% (62.0, 72.9)] compared to the PRT group
[57.9% (51.7, 64.2)] (P=0.023 for the between-group difference). Figure 6.3 shows
the histogram for the compliance (as a percentage) with the PRT program by group.
For the per protocol analysis, the cut point was set at 66% compliance or
approximately two PRT sessions per week. In the PRT group, 50% (n=50) of
participants achieved this level of compliance compared to 57% (n=56) in the
PRT+ProD groups. As the cost of training differed slightly across all the training
locations, we assessed whether there was any associated between the cost of training
and compliance with the PRT program yet found no significant association.
Figure 6.3: Histogram of the percentage exercise compliance by participants in the progressive resistance training plus protein and vitamin D supplementation (PRT+ProD, panel A) and PRT (panel B) group.
Whey Protein and Vitamin D Supplement Compliance
Mean (95% CI) compliance with both the whey protein drink and vitamin D
supplements in the PRT+ProD group, which was calculated as the percentage of the

Chapter 6
Page | 218
protein sachets and vitamin D capsules consumed over the 24-week period, was
78.6% (72.3, 84.9) and 91.5% (87.9, 95.1), respectively. Figure 6.4 shows the
histograms of the percentage compliance with the whey-protein drink and vitamin D
supplements. For the per protocol analysis, the cut-point was set at ≥80%
compliance. Overall 79% (n=78) of participants in the PRT+ProD group achieved a
mean compliance of ≥ 80% with the supplements. However, only 42% (n=41) of the
participants in the PRT+ProD group attained a mean compliance of ≥ 66% with the
PRT program and a mean compliance of ≥ 80% with the whey and vitamin D
supplements, thus only 41 participants in the PRT+ProD group were included in the
per-protocol analysis.
Figure 6.4: Histogram of the percentage compliance with the whey protein drink (panel A) and vitamin D supplements (panel B) in the progressive resistance training plus protein and vitamin D supplementation (PRT+ProD) group.
6.6.4 Adverse Events
Lift for Life® Exercise Program
In total, 42 musculoskeletal complaints or injuries were reported by 37 participants
with no significant differences between the groups (PRT+ProD, n=20, PRT, n=17;
P=0.538). One participant in each group reported two adverse events and an
additional participant in the PRT group reported three adverse events. As shown in
Table 6.2 the most common complaints were for the shoulder/neck and elbow/wrist
in both groups. The most common reason provided for reporting a neck/shoulder
complaint was neck tension/pain which led to a headache following a training
session. For elbow/wrist and back complaints, these were most commonly associated

Chapter 6
Page | 219
with aggravation of previously diagnosed tennis or golfers elbow or aggravation of
previous pain or injury in the back.
In the PRT+ProD group, 12 of the 20 participants continued their training with slight
modification to the program, six ceased training for a short period (1- to 2-weeks),
one participant reduced their training to two sessions per week for 6-weeks and one
individual withdrew from the exercise program but agreed to return for follow-up
testing. In the PRT group, nine of the 17 participants could continue with their
training by making small modifications or removing the specific exercise responsible
for the complaint/injury until recovery, six participants ceased training for a short
duration (1- to 3-weeks) and two discontinued the exercise program but returned for
follow-up testing. Of all the musculoskeletal complaints or injuries, eight participants
in the PRT+ProD and six participants in the PRT groups reported their complaints
were aggravations of a pre-existing injury.
Table 6.2: Number and proportion of musculoskeletal complaints reported by participants in the PRT+ProD and PRT groups that were deemed to be associated with the PRT program. Categorised by skeletal/muscular site.
Study Group
Adverse Event Location PRT+ProD PRT
Shoulder/Neck, n (%) 5 (24) 8 (38)
Elbow/wrist, n (%) 6 (29) 6 (28)
Gluteal, n (%) - 1 (5) Knee, n (%) 4 (19) 2 (10)
Back, n (%) 5 (24) 2 (9)
Hamstring, n (%) 1 (4) -
Groin, n (%) - 1 (5) Achilles, n (%) - 1 (5)
Total Number 21 21
Whey Protein and/or Vitamin D Supplements
No adverse events were reported with the ingestion of vitamin D supplements. A
total of 44 gastrointestinal (GI) related adverse events in 27 (28%) participants were
reported in relation to the whey protein drink in the PRT+ProD group over the 24-

Chapter 6
Page | 220
week period (Table 6.3). Of the participants reporting an adverse event, twelve
(44%) discontinued consuming the whey protein drink (n=10 prior to week 8) and
eight (30%) reduced or modified their supplement intake. Participants who modified
or reduced their supplement intake were instructed to reduce the dose to half a sachet
and gradually increase to the full sachet again over time if tolerated. A further seven
(26%) participants continued to consume the whey protein drink as prescribed
despite experiencing GI discomfort.
Table 6.3: Physical symptom(s) and number of adverse events related to the whey protein supplement in the PRT+ProD supplement group.
Physical Symptom(s) Number of Adverse Events
Bloating 6
Diarrhoea/Loose bowel movement 23
Nausea 4 Flatulence 4
Constipation 2
Abdominal Pain 5
Total Number 44
6.6.5 Physical Activity and Diet
At baseline, the mean moderate-vigorous physical activity habits of participants in
the PRT+ProD group was significantly less than those in the PRT group (mean
difference 3,559 kJ per week, P<0.01) (Table 6.4). There were no differences
between the groups for average daily energy intake (kJ), protein (g/day or g/kg/day),
fat and carbohydrates (g/day) or the percentage of energy intake from protein,
carbohydrates or fat at baseline (Table 6.5 and Table 6.6)
After 24-weeks, a significant increase in energy expenditure from moderate-vigorous
physical activity exclusive of the PRT program was observed in the PRT+ProD
group [mean change 4,556 kJ per week (95% CI, 2,396, 6,717), P=0.001] with no
change in the PRT group, which led to a significant between-group difference for the
change over time (interaction P=0.007) (Table 6.4).

Chapter 6
Page | 221
For all habitual dietary measures (total energy, fat, carbohydrates and alcohol), there
were no differences between the groups for the change over time after 12- or 24-
weeks except for dietary protein intake (Table 6.5). There were also no between
group differences for the change in dietary saturated fat, cholesterol, sodium,
potassium, magnesium and calcium (Appendix 9). For total energy intake, there was
a similar reduction in both groups after 24-weeks (PRT+ProD 437 kJ/day, P>0.05;
PRT 647 kJ/day, P<0.05). At baseline, an equal number and proportion of
participants in both groups reported consuming alcohol [(PRT+ProD, n=63 (64%)
and PRT, n=61 (61%)], with no differences between the groups (Chi-square analysis,
P=0.619).
Habitual Protein Intake plus Whey Protein Supplementation
The mean habitual dietary protein intake at baseline was 1.21 and 1.13 g/kg and 103
and 100 g/day in the PRT+ProD and PRT group, respectively (Table 6.6). There was
a small but significant 8 g reduction in habitual protein intake in the PRT+ProD
group at 24-weeks (there was no change in protein intake expressed as g/kg/day) but
no differences for the change over time between the group (Table 6.6 and Figure
6.5). Based on compliance with the whey protein supplement, at 12-weeks an
additional 11.2 g/day [(95% CI, 3.6, 18.9) P=0.014] or 0.13 g/kg ([95% CI, 0.09,
0.19) P=0. 011] of protein was consumed on non-training days (single supplement
day) and an additional 27.3 g/day [(95% CI, 19.3, 35.3) P=0.001] or 0.33 g/kg/day
[(95% CI, 0.27, 0.38) P=0.001] on training days (two supplements per day) relative
to baseline. As a result, protein intakes (at 12-weeks) were significantly greater in the
PRT+ProD compared to PRT group (between-group difference P<0.01 on both
training and non-training days). By 24-weeks the whey protein supplement provided
an additional 7.3 g/day [(95% CI, -2.6, 17.1) P=0.237] or 0.11 g/kg/day [(95% CI,
0.04, 0.18) P=0.061] on non-training days and 22.6 g per day [(95% CI, 12.5, 32.6)
P=0.001] or 0.29 g/kg of protein/day [(95% CI, 0.22, 0.36) P=0.001] relative to
baseline on top of habitual intakes (Table 6.6 and Figure 6.5). At 24-weeks, only the
increase in protein intake on training days was significantly higher relative to
baseline (P=0.001) in the PRT+ProD group. Similarly, there was a significant group-
by-time interaction for the change in protein intake on the training days only
(P=0.001) with intakes higher in the PRT+ProD compared to the PRT group.

Page | 222
Table 6.4: Baseline values and absolute within-group changes in the PRT+ProD and PRT group and the net between-group differences for the change at 12- and 24-weeks relative to baseline for moderate-vigorous physical activity.
Baseline Values and Within-Group Changes
PRT+ProD PRT Intervention Effects
Mean ± SD or
(95% CI) P-value Mean ± SD or
(95% CI) P-value Net Difference
(95% CI) P- values
Model 1 | Model 3
Moderate-vigorous Physical Activity (kJ/week)
Baseline 8,194 ± 8,067b 11,753 ± 10,885
∆ 12-weeks 1,670 (-58, 3,399) 0.067 -314 (-2,101, 1,472) 0.986 1,985 (-484, 4,453) 0.248 | 0.223
∆ 24-weeks 4,556 (2,396, 6,717) 0.001 -73 (-3,080, 2,933) 0.772 4,630 (991, 8,268) 0.007 | 0.006
Baseline values represent mean ± SD and within group changes and net differences represent means with 95% confidence intervals (CI). Intervention effect refers to the within group change from baseline in the intervention group minus the within group change from baseline in the control group. All change values and net differences were derived from model 1 – unadjusted values. Significant differences are highlighted in bold. Model 1 represents unadjusted P-values. Model 3 represents the P-value after adjusting for baseline values, age, gender, ethnicity and BMI. b P<0.01 vs PRT at baseline. PRT+ProD, progressive resistance training plus protein and vitamin D supplements; PRT, progressive resistance training.

Page | 223
Table 6.5: Baseline values and absolute within-group changes in the PRT+ProD and PRT groups and the net between-group differences for the change at 12- and 24-weeks relative to baseline for all macronutrients, excluding protein intake and the protein-vitamin D supplements.
Baseline Values and Within-Group Changes
PRT+ProD PRT Intervention Effects
Mean ± SD or
(95% CI) P-value Mean ± SD or
(95% CI) P-value Net Difference
(95% CI) P- values
Model 1 | Model 3
Energy Intake (kJ/day)
Baseline 8,514 ± 2,584 8,687 ± 2,202
∆ 12-weeks -357 (-898, -184) 0.158 -155 (-711, 401) 0.550 -201 (-972, 568) 0.640 | 0.835
∆ 24-weeks -437 (-994, -120) 0.059 -647 (-1,347, 52) 0.042 210 (-670, 1,091) 0.763 | 0.845
Carbohydrate (g/day)
Baseline 202.3 ± 82.7 200.3 ± 60.4
Δ 12-weeks -12.1 (-29, 4.8) 0.198 9.7 (-9.2, 28.6) 0.378 -21.8 (-46.9, 3.2) 0.124 | 0.144
Δ 24-weeks -12.2 (-31.0, 6.7) 0.097 -12.0 (-31.4, 7.4) 0.167 -0.18 (-27.0, 26.7) 0.935 | 0.856
Fat (g/day)
Baseline 76.6 ± 34.4 83.5 ± 37.5
Δ 12-weeks -1.8 (-9.6, 6.0) 0.334 -4.6 (-12.6, 3.4) 0.298 2.8 (-8.3, 13.8) 0.856 | 0.623
Δ 24-weeks -2.3 (-10.0, 5.4) 0.447 -8.2 (-18.2, 1.8) 0.080 5.9 (-6.5, 18.2) 0.393 | 0.420

Page | 224
% Energy Protein
Baseline 20.7 ± 5.4 19.6 ± 5.4
Δ 12-weeks 0.1 (-1.4, 1.2) 0.881 -0.7 (-2.1, 0.6) 0.608 0.6 (-1.3, 2.4) 0.780 | 0.731
Δ 24-weeks -0.9 (-2.6, 0.7) 0.374 -0.6 (-2.5, 1.3) 0.077 -0.3 (-2.9, 2.2) 0.059 | 0.060
% Energy Fat
Baseline 33.2 ± 9.8 34.9 ± 9.9
Δ 12-weeks 0.6 (-1.7, 2.9) 0.984 -1.0 (-3.1, 1.2) 0.295 1.6 (-1.6, 4.8) 0.467 | 0.394
Δ 24-weeks 1.1 (-4.0, 1.7) 0.686 -3.2 (-6.3, 0.0) 0.440 2.0 (-2.2, 6.2) 0.403 | 0.387
% Energy Carbohydrates
Baseline 39.6 ± 9.2 39.3 ± 9.7
Δ 12-weeks -0.4 (-2.6, 1.8) 0.925 2.0 (-0.4, 4.4) 0.116 -2.4 (-5.6, 0.8) 0.204 | 0.147
Δ 24-weeks -1.7 (-4.5, 1.0) 0.858 -2.5 (-5.9, 0.9) 0.983 -0.8 (-3.5, 5.1) 0.936 | 0.860
Alcohol§ (g/day)
Baseline 10.2 ± 12.8 12.7 ±15.3
Δ 12-weeks -0.4 (-2.3, 1.6) 0.567 -2.7 (-5.1, -0.2) 0.094 2.3 (-0.7, 5.4) 0.180 | 0.158
Δ 24-weeks 0.6 (-1.5, 2.7) 0.155 -1.2 (-3.1, 0.7) 0.477 1.8 (-1.0, 4.6) 0.515 | 0.486 Baseline values represent mean ± SD and within group changes and net differences represent means with 95% confidence intervals (CI). Intervention effect refers to the within group change from baseline in the intervention group minus the within group change from baseline in the control group. All change values and net differences were derived from unadjusted values. Significant differences are highlighted in bold. Model 1 represents unadjusted P-values. Model 3 represents the P-value after adjusting for age, gender, ethnicity, BMI and moderate-vigorous physical activity § Baseline alcohol intake and the change in alcohol intake was calculated only on the number of participants in each group who reported being a consumer of alcohol at respective time points. PRT+ProD, progressive resistance training plus protein and vitamin D supplements; PRT, progressive resistance training.

Page | 225
Table 6.6: Baseline values and absolute within-group changes in the PRT+ProD and PRT groups and the net between-group differences for the change at 12- and 24-weeks relative to baseline for habitual protein intake and protein intake inclusive of supplemental protein on non-training and training days in g/day and g/kg/day.
Baseline Values and Within-Group Changes
PRT+ProD PRT Intervention Effects
Mean ± SD or
(95% CI) P-value Mean ± SD or
(95% CI) P-value Net Difference
(95% CI) P-values
Model 1 | Model 3
Protein (g/day)
Habitual Protein (Excluding Whey Supplement)
Baseline 103.4 ± 33.8 99.9 ± 30.7
∆ 12-weeks -4.8 (-12.3, 2.6) 0.229 -5.8 (-13.1, 1.5) 0.200 1.0 (-9.5, 11.4) 0.966 | 0.824
∆ 24-weeks -8.0 (-17.9, 1.9) 0.025 -3.2 (-12.1, 5.7) 0.330 -4.8 (-18.0, 8.5) 0.321 | 0.263
Habitual Protein plus Whey Supplement (Non-Training Day)
Baseline 103.4 ± 33.8 99.9 ± 30.8
Δ 12-weeks 11.2 (3.6, 18.9) 0.014 -5.8 (-13.1, 1.6) 0.200 17.1 (6.5, 27.6) 0.008 | 0.003
Δ 24-weeks 7.3 (-2.6, 17.1) 0.237 -0.5 (-8.7, 7.7) 0.330 7.8 (-5.1, 20.6) 0.125 | 0.167
Habitual Protein plus Whey Supplement (Training Day)
Baseline 103.4 ± 33.8 99.9 ± 30.8
Δ 12-weeks 27.3 (19.3, 35.3) 0.001 -5.8 (-13.1, 1.6) 0.200 33.1 (22.3, 43.9) 0.001 | 0.001
Δ 24-weeks 22.6 (12.5, 32.6) 0.001 -0.5 (-8.7, 7.7) 0.330 23.0 (10.1, 36.0) 0.001 | 0.001

Page | 226
Protein (g/kg/day)
Habitual Protein (Excluding Whey Supplement)
Baseline 1.21 ± 0.37 1.13 ± 0.39
Δ 12-weeks -0.05 (-0.14, 0.03) 0.263 -0.06 (-0.14, 0.02) 0.224 0.01 (-0.11, 0.12) 0.985 | 0.808
Δ 24-weeks -0.08 (-0.20, 0.04) 0.102 -0.03 (-0.13, 0.08) 0.370 -0.02 (-0.20, 0.11) 0.576 | 0.513 Habitual Protein plus Whey Supplement (Non-Training Day)
Baseline 1.21 ± 0.37 1.13 ± 0.39
Δ 12-weeks 0.13 (0.09, 0.19) 0.011 -0.06 (-0.10, -0.01) 0.224 0.20 (0.13, 0.27) 0.007 | 0.003
Δ 24-weeks 0.11 (0.04, 0.18) 0.061 -0.03 (-0.09, 0.03) 0.370 0.14 (0.05, 0.23) 0.044 | 0.062
Habitual Protein plus Whey Supplement (Training Day)
Baseline 1.21 ± 0.37 1.13 ± 0.39
Δ 12-weeks 0.33 (0.27, 0.38) 0.001 -0.06 (-0.10, -0.01) 0.224 0.4 (0.3, 0.5) 0.001 | 0.001
Δ 24-weeks 0.29 (0.22, 0.36) 0.001 -0.03 (-0.09, 0.03) 0.370 0.32 (0.23, 0.42) 0.001 | 0.001 Baseline values represent mean ± SD and within group changes and net differences represent means with 95% confidence intervals (CI). Intervention effect refers to the within group change from baseline in the intervention group minus the within group change from baseline in the control group. All change values and net differences were derived from unadjusted values. Significant differences are highlighted in bold. Model 1 represents unadjusted P-values. Model 3 represents the P-value after adjusting for age, gender, ethnicity, BMI and moderate-vigorous physical activity PRT+ProD, progressive resistance training plus protein and vitamin D supplements; PRT, progressive resistance training

Chapter 6
Page | 227
Figure 6.5: Total dietary protein intakes (habitual plus supplemental) in older adults with type 2 diabetes at baseline, 12- and 24-weeks. The x-axis represents the two intervention groups (PRT (black bars) and PRT+ProD (white bars)) with the protein intake in the PRT+ProD presented on both non-training (NT) days and training (T) days. Data presented as mean ± SD. * P<0.05 vs baseline (within-group change). a P<0.05, b P<0.01, c P<0.001 between-group interaction.
6.6.6 Glycaemic and Insulinaemic Outcomes
Oral Hypoglycaemic Medication Use and Change
Table 6.7 shows the number of participants in each group at each time point who
were prescribed oral hypoglycaemic medication for the management of their T2DM.
At baseline, there were no differences between the groups, however at 12- and 24-
weeks a slightly higher proportion of participants in the PRT+ProD group were
taking prescribed oral hypoglycaemic medication compared to the PRT group (both
P<0.001). Throughout the study period there were no significant within-group
changes or differences between the groups for the number of participants that
increased or decreased their number of prescribed oral hypoglycaemic medication
(Table 6.7). Similarly, only a small number of participants changed (increased or
decreased) their oral hypoglycaemic medication dose, with no differences between
the groups with the exception that a greater proportion of participants in the PRT
group increased their doses after 24-weeks (PRT+ProD 3% vs PRT 11%, P<0.05).
Type of Oral Hypoglycaemic Medication
As shown in Table 6.8, the majority of participants prescribed oral hypoglycaemic
medication were taking biguanides (PRT+ProD 67%; PRT 58%) and/or

Chapter 6
Page | 228
sulphonylureas (PRT+ProD 27%; PRT 23%). There were no within-group changes
or between-group differences for the type of oral hypoglycaemic medication
prescribed to participants, with the exception of the following; 1) at 12- and 24-
weeks significantly more participants in the PRT+ProD group were prescribed
biguanides (P<0.001 and P<0.05, respectively) compared to the PRT group; 2) at all
time periods the PRT+ProD participants were more likely to be prescribed a
dipeptidyl peptidase 4 (DPP-4) (all P<0.001), and 3) participants in the PRT group
were more likely to be on combination therapy for their diabetes (all P<0.001).
Table 6.7: Total number and proportion of participants taking oral hypoglycaemic medications and the changes at baseline, 12- and 24-weeks in the PRT+ProD and PRT groups.
Baseline 12-weeks 24-weeks
Prescribed Medication, n (%) PRT+ProD 71 (72) 69 (75)*** 65 (74)***
PRT 68 (68) 53 (63) 52 (65)
Increased | Decreased Number, n (%)
PRT+ProD - 3 (3) | 4 (4) 6 (7) | 7 (8) PRT - 0 (0) | 2 (2) 2 (3) | 2 (3)
Increased | Decreased Dose, n (%)
PRT+ProD - 2 (2) | 3 (3) 3 (3)* | 5 (6) PRT - 5 (6) | 1 (1) 9 (11) | 4 (5)
Commenced | Ceased Medication, n (%)
PRT+ProD - 1 (1) | 2 (2) 2 (2) | 2 (2)
PRT - 0 (0) | 0 (0) 0 (0) | 0 (0) The percentages of participants on a type of oral hypoglycaemic agent was calculated from the total participants on a type of agent divided by the total number of participants multiplied by 100. *P<0.05, ***P<0.001 between-group difference. PRT+ProD, Progressive resistance training plus whey protein and vitamin D supplements; PRT, progressive resistance training.

Chapter 6
Page | 229
Table 6.8: Total number and proportion of participants taking oral hypoglycaemic medications at baseline, 12- and 24-weeks in the PRT+ProD and PRT groups.
Baseline 12-weeks 24-weeks Biguanides, n (%) PRT+ProD 66 (67) 65 (71)*** 61 (69)* PRT 58 (58) 44 (52) 43 (54) Sulphonylureas, n (%) PRT+ProD 26 (27) 24 (26) 23 (26) PRT 23 (23) 16 (19) 16 (20) Thiazolidinediones, n (%) PRT+ProD 0 (0) 0 (0) 0 (0) PRT 3 (3) 2 (2) 2 (3) Alpha Glucosidase Inhibitors, n (%)
PRT+ProD 0 (0) 0 (0) 0 (0) PRT 2 (2) 2 (3) 2 (3) DPP-4 Inhibitors, n (%) PRT+ProD 24 (24)*** 21 (23)*** 20 (23)*** PRT 9 (9) 6 (7) 5 (6) Incretin Mimetics, n (%) PRT+ProD 3 (3) 2 (2) 2 (2) PRT 6 (6) 6 (7) 7 (9) Sodium-glucose Co-transporter 2 Inhibitors, n (%) PRT+ProD 4 (4) 5 (5) 5 (4) PRT 1 (2) 2 (5) 2 (2) Insulin, n (%) PRT+ProD 0 (0) 0 (0) 1 (1) PRT 0 (0) 0 (0) 0 (0) Combination therapy1, n (%) PRT+ProD 0 (0)*** 0 (0)*** 0 (0)*** PRT 11 (11) 8 (10) 8 (10)
The percentages of participants on a type of oral hypoglycaemic agent was calculated from the total participants on a type of agent divided by the total number of participants multiplied by 100. *P<0.05, ***P<0.001 between-group difference. 1 Combination therapy included poly-pills such as Janumet, Glucovance, Avandamet, Metaglip or Avandaryl. PRT+ProD, Progressive resistance training plus whey protein and vitamin D supplements; PRT, progressive resistance training.

Chapter 6
Page | 230
Baseline Glycaemic Control and Insulin Sensitivity
There were no differences between the groups at baseline for HbA1c, insulin, insulin
sensitivity (HOMA2%S) or C-peptide levels (Table 6.9), with the exception that the
PRT+ProD group had slightly lower FPG levels (P<0.05) and higher insulin
sensitivity (HOMA2%S, P<0.01).
HbA1c and Fasting Plasma Glucose
At 12-weeks, both groups experienced a similar significant absolute 0.13 to 0.15%
(P=0.039 and P=0.060) reduction in HbA1c. While this modest improvement in
HbA1c persisted only in the PRT group after 24-weeks, there were no between-group
differences for the changes over time after 12- or 24-weeks (Table 6.9 and Figure
6.6). Levels of FPG improved by 4.3% and 6.6% after 12- and 24-weeks in the PRT
group (P<0.01 and P<0.001, respectively), with no changes observed in the
PRT+ProD group, which resulted in significant group-by-time interaction at 24-
weeks. However, after adjusting for the covariates in model 3 this result was no
longer significant (Table 6.9).
Fasting Insulin, C-peptide and Insulin Sensitivity
The PRT+ProD group experienced a significant reduction in fasting insulin after 12-
and 24-weeks relative to baseline [mean -9.89 pmol/L (95% CI, -16.99, -2.79)
P=0.003 and -6.2 pmol/L (95% CI, -13.6, 1.1) P=0.045]. There were no within-group
changes in fasting insulin in the PRT group. A trend (P=0.060) towards a significant
between-group difference at 12-weeks was noted following adjustment for covariates
(model 3). After adjusting for baseline fasting insulin a significant between-group
interaction was seen at both 12- and 24-weeks (P=0.028 and P=0.038). C-peptide
levels did not change at any time in either group and there were no group-by-time
interactions. For insulin sensitivity (HOMA2%S), there were no within-group
changes or between-group differences for the changes over time (Table 6.9 and
Figure 6.6). All results were similar whether adjusted for covariates included in
model 3.

Page | 231
Table 6.9: Baseline values and absolute within-group changes in the PRT+ProD and PRT groups and the net between-group differences for the change relative to baseline for HbA1c, fasting plasma glucose, insulin, insulin sensitivity and C-peptide.
Baseline Values and Within-Group Changes
PRT+ProD PRT Intervention Effects
Mean ± SD or
(95% CI) P-value Mean ± SD or
(95% CI) P-value Net Difference
(95% CI) P-values
Model 1 | Model 3 HbA1c % Baseline 6.86 ± 1.11 7.14 ± 1.17 Δ 12-weeks -0.13 (-0.24, -0.02) 0.039 -0.15 (-0.28, -0.03) 0.006 0.02 (-0.14, 0.19) 0.627 | 0.668
Δ 24-weeks -0.10 (-0.24, 0.05) 0.072 -0.17 (-0.32, -0.03) 0.002 0.08 (-0.13, 0.28) 0.325 | 0.595
HbA1c (IFCC mmol/mol) Baseline 51.48 ± 12.11 54.46 ± 12.86
Δ 12-weeks -1.63 (-2.80, -0.45) 0.016 -1.64 (-3.05, -0.22) 0.008 0.01 (-1.80, 1.83) 0.827 | 0.845
Δ 24-weeks -1.08 (-2.68, 0.52) 0.064 -1.88 (-3.46, -0.31) 0.002 -0.80 (-1.43, 3.04) 0.328 | 0.573
Fasting Glucose (mmol/L)
Baseline 7.88 ± 2.21a 8.60 ± 2.33
Δ 12-weeks -0.12 (-0.39, 0.16) 0.493 -0.37 (-0.64, -0.10) 0.004 0.25 (-0.13, 0.63) 0.143 | 0.072
Δ 24-weeks 0.00 (-0.32, 0.32) 0.586 -0.57 (-0.90, -0.24) 0.001 0.57 (0.11, 1.02) 0.018 | 0.087 Continued over page

Page | 232
Fasting Insulin (pmol/L)
Baseline 94.9 ± 102.8 95.2 ± 46.7 Δ 12-weeks -9.9 (-17.0, -2.8) 0.003 -2.5 (-10.3, 5.3) 0.515 -7.4 (-17.9, 3.1) 0.093* | 0.060
Δ 24-weeks -6.2 (-13.6, 1.1) 0.045 0.8 (-5.1, 6.7) 0.995 -7.0 (-16.5, 2.5) 0.151* | 0.271
Insulin sensitivity (HOMA2%S)
Baseline 78.1 ± 46.8b 60.4 ± 24.5 Δ 12-weeks 6.6 (-1.5, 14.6) 0.092 3.6 (-3.2, 10.3) 0.247 3.0 (-7.5, 13.5) 0.603 | 0.594 Δ 24-weeks 2.7 (-5.2, 10.6) 0.389 2.5 (-3.8, 8.8) 0.341 0.2 (-10.0, 10.5) 0.986 | 0.967
C-peptide (nmol/L)
Baseline 1.13 ± 0.58 1.20 ± 0.36 Δ 12-weeks -0.06 (-0.11, 0.00) 0.027 -0.03 (-0.09, 0.03) 0.291 -0.02 (-0.10, 0.06) 0.451 | 0.530 Δ 24-weeks -0.03 (-0.08, 0.03) 0.084 -0.02 (-0.09, 0.05) 0.371 -0.02 (-0.10, 0.06) 0.595 | 0.588
Baseline values represent mean ± SD and within group changes and net differences represent means with 95% confidence intervals (CI). Intervention effect refers to the within group change from baseline in the intervention group minus the within group change from baseline in the control group. All change values and net differences were derived from unadjusted values. Significant differences are highlighted in bold. Model 1 represents unadjusted P-values. Model 3 represents the P-value after adjustments for age, gender, ethnicity, BMI, oral hypoglycaemic use and moderate-vigorous physical activity. a P<0.05, b P<0.01 vs PRT at baseline. * P<0.05 significant between-group difference when adjusted for baseline. PRT+ProD, progressive resistance training plus protein and vitamin D supplements; PRT, progressive resistance training.

Page | 233
Figure 6.6: Mean absolute changes from baseline (95% CI) in HbA1c (%) (A), fasting glucose (mmol/L) (B), fasting insulin (pmol/L) (C) and HOMA2%S (D) in the PRT+ProD (●) and PRT (○) groups. * P<0.05, † P<0.01 and ‡ P<0.001 within-group difference from baseline. # P<0.05 between-group differences for the changes over time (group-by-time interaction) in the unadjusted model (Model 1).

Chapter 6:
Page | 234
6.6.7 Body Composition and Muscle Strength
As shown in Tables 6.10 to 6.13, no significant differences were observed between
the groups at baseline for any anthropometric, DXA-derived or pQCT (25% femur
site) assessed body composition or muscle strength parameters with the exception of
the following; (1) BMI was on average 1.5 kg/m2 higher in the PRT group (P<0.05)
and (2) the PRT+ProD group had a lower mean total body fat mass compared to the
PRT group (P<0.05). The proportion of participants categorised as normal weight,
overweight and obese is described above in Table 6.1. For waist circumference, there
were no differences between the groups at baseline for those classified as having a
normal (<94 cm men; <80 cm women) (PRT+ProD 12.4% and PRT 10.1%; Chi-
square P=0.615), or at risk waist circumference (≥ 94 cm men; ≥ 80 cm women)
(PRT+ProD 87.6% and PRT 89.9%; Chi-square P=0.123).
Anthropometry
Over the 24-week intervention, there were no significant between-group differences
for the change over time for weight, BMI or waist circumference (Table 6.10).
However, there was a significant mean 0.65 kg reduction in weight in the PRT group
after 24-weeks compared to baseline (P<0.05). Both groups experienced a similar
significant 1 to 2 cm reductions in waist circumference after 12- and 24-weeks when
compared to baseline (both P<0.05).
DXA Body Composition
In both the PRT+ProD and PRT groups, there were similar significant within-group
improvements over time in total body fat mass, percentage fat and total body lean
mass (P ranging <0.001 to 0.05), with no between group differences (group-by-time
interactions) for the changes over 24-weeks whether the results were unadjusted or
adjusted for covariates (model 3). For arm and leg lean mass, the PRT+ProD group
experienced a significant 0.15 kg [(95% CI, 0.09, 0.22) P=0.001] and 0.19 kg [(95%
CI, 0.07, 0.31) P=0.002] gain relative to baseline, but there were no significant
changes in the PRT group. While there was a trend towards a significant between
group difference for the change over time (group-by-time interaction, P=0.056) in
arm lean mass in the unadjusted model, this was not significant after adjustments
were made for covariates in model 3. There were no within-group changes or

Chapter 6:
Page | 235
between-group differences for the change over time in arm or leg fat mass, with the
exception that the PRT group had a 0.18 kg (95% CI, -0.34, -0.03) P=0.017]
reduction in leg fat mass relative to baseline. For appendicular lean mass (ALM),
there was a trend for a significantly greater gain in the PRT+ProD relative to PRT
group after 24-weeks (group-by-time interaction) in model 1 (P=0.075) and model 3
(P=0.064), which was driven by a 0.34 kg [(95% CI, 0.19, 0.49) P=0.001] gain in the
PRT+ProD group relative to a 0.14 kg [(95% CI, -0.02, 0.30) P=0.081] gain in the
PRT group (Table 6.11).
pQCT Body Composition
After 24-weeks, 25% femur muscle CSA increased significantly by 3.5% in the
PRT+ProD (P=0.001) and 1.8% in the PRT groups (P=0.086), but there was no
difference between the groups (group-by-time interaction, P=0.087) for these
changes over time (Table 6.12). A significant 0.9% [(95% CI, 0.3, 1.5) P=0.016]
increase in muscle density was observed in the PRT group compared to baseline,
indicating a reduction in intramuscular fat infiltration with a significant between-
group difference (P=0.047) observed only after adjusting for covariates in model 3.
For thigh (25% femur) intermuscular fat and subcutaneous CSA, there were no
significant within-group changes or between-group differences throughout the study.
Muscle Strength
Over time, both groups experienced similar significant mean 7 to 19% (all P=0.001)
increases in both upper and lower body strength measures with no between-group
differences (group-by-time interactions) for the changes over time (all P>0.05)
(Table 6.13).

Page | 236
Table 6.10: Baseline values and absolute within-group changes in the PRT+ProD and PRT groups for weight, body mass index (BMI) and waist circumference and the net between-group differences for the change relative to baseline.
Baseline Values and Within-Group Changes
PRT+ProD PRT Intervention Effects
Mean ± SD or
(95% CI) P-value Mean ± SD or
(95% CI) P-value Net Difference
(95% CI) P-values
Model 1 | Model 3
Body Weight (kg)
Baseline 86.1 ± 16.6 90.4 ± 15.2
Δ 12-weeks -0.05 (-0.45, 0.35) 0.865 -0.05 (-0.39, 0.30) 0.852 0.00 (-0.53, 0.53) 0.972 | 0.980
Δ 24-weeks -0.26 (-0.75, 0.24) 0.185 -0.65 (-1.30, -0.01) 0.010 0.39 (-0.41, 1.19) 0.271 | 0.229
BMI (kg/m2)
Baseline 29.6 ± 4.7a 31.1 ± 4.6
Δ 12-weeks 0.01 (-0.14, 0.13) 0.972 -0.05 (-0.19, 0.08) 0.568 0.05 (-0.14, 0.25) 0.625 | 0.629
Δ 24-weeks -0.09 ( -0.26, 0.09) 0.211 -0.24 (-0.50, 0.01) 0.019 0.16 (-0.14, 0.46) 0.231 | 0.213
Waist Circumference (cm)
Baseline 101.1 ± 12.6a 104.7 ± 12.0
Δ 12-weeks -1.0 (-1.5, -0.40) 0.005 -1.4 (-1.8, -0.9) 0.001 0.4 (-0.4, 1.1) 0.395 | 0.423
Δ 24-weeks -1.3 (-2.1, -0.64) 0.001 -1.9(-2.5, -1.3) 0.001 0.7 (-0.3, 1.6) 0.328 | 0.189 Baseline values represent mean ± SD and within group changes and net differences represent means with 95% confidence intervals (CI). Intervention effect refers to the within group change from baseline in the intervention group minus the within group change from baseline in the control group. All change values and net differences were derived from unadjusted values. Significant differences are highlighted in bold. Model 1 represents unadjusted P-values. Model 3 represents the P-value after adjustments for age, gender, ethnicity and moderate-vigorous physical activity. a P<0.05 vs PRT at baseline. PRT+ProD, progressive resistance training plus protein and vitamin D supplements; PRT, progressive resistance training.

Page | 237
Table 6.11: Baseline values and absolute within-group changes in the PRT+ProD and PRT groups and the net between-group differences for the change at 24-weeks from baseline for total body and regional (arms and legs) lean mass, fat mass and appendicular lean mass.
Baseline Values and Within-Group Changes
PRT+ProD PRT Intervention Effects
Mean ± SD or
(95% CI) P-value Mean ± SD or
(95% CI) P-value Net Difference
(95% CI) P-values
Model 1 | Model 3
Total Body
Fat Mass (kg)
Baseline 30.5 ± 9.5a 33.4 ± 10.0
Δ 24-weeks -0.57 (-1.02, -0.12) 0.010 -0.92 (-1.42, -0.41) 0.001 0.35 (-0.32, 1.02) 0.301 | 0.320
Lean Mass (kg)
Baseline 51.6 ± 10.7 53.2 ± 10.2
Δ 24-weeks 0.50 (0.18, 0.82) 0.002 0.37 (0.04, 0.70) 0.001 0.13 (-0.33, 0.58) 0.616 | 0.381
Percentage Fat Mass (%)
Baseline 36.8 ± 8.1 38.2 ± 8.4
Δ 24-weeks -0.63 (-1.04, -0.21) 0.003 -0.88 (-1.29, -0.46) 0.001 0.25 (-0.33, 0.84) 0.367 | 0.486
Appendicular Lean Mass (kg)
Baseline 23.2 ± 5.4 24.1 ± 5.2
Δ 24-weeks 0.34 (0.19, 0.49) 0.001 0.14 (-0.02, 0.30) 0.081 0.20 (-0.02, 0.42) 0.075 | 0.064

Page | 238
Arm
Fat Mass (kg)
Baseline 3.1 ± 1.3 3.5 ± 1.5
Δ 24-weeks -0.03 (-0.09, 0.02) 0.240 -0.05 (-0.13, 0.04) 0.225 0.02 (-0.08, 0.12) 0.723 | 0.952
Lean Mass (kg)
Baseline 6.1 ± 1.6 6.2 ± 1.4
Δ 24-weeks 0.15 (0.09, 0.22) 0.001 0.05 (-0.02, 0.20) 0.129 0.10 (0.03, 0.20) 0.056 | 0.111
Leg
Fat Mass (kg)
Baseline 8.3 ± 3.6 9.3 ± 4.1
Δ 24-weeks -0.04 (-0.18, 0.09) 0.475 -0.18 (-0.34, -0.03) 0.017 0.14 (-0.06, 0.3) 0.168 | 0.195
Lean Mass (kg)
Baseline 17.1 ± 3.9 17.9 ± 3.9
Δ 24-weeks 0.19 (0.07, 0.31) 0.002 0.08 (-0.04, 0.21) 0.168 0.10 (-0.07, 0.28) 0.259 | 0.189 Baseline values represent mean ± SD and within group changes and net differences represent means with 95% confidence intervals (CI). Intervention effect refers to the within group change from baseline in the intervention group minus the within group change from baseline in the control group. All change values and net differences were derived from unadjusted values. Significant differences are highlighted in bold. Model 1 represents unadjusted P-values. Model 3 represents the P-value after adjustments for age, gender, ethnicity and moderate-vigorous physical activity. a P<0.05 vs PRT at baseline. PRT+ProD, progressive resistance training plus protein and vitamin D supplements; PRT, progressive resistance training.

Page | 239
Table 6.12: Baseline values and absolute within-group changes in the PRT+ProD and PRT groups and the net between-group differences for the change at 24-weeks from baseline for 25% femur muscle cross-sectional area (CSA), muscle density, intermuscular and subcutaneous fat CSA.
Baseline Values and Within-Group Changes
PRT+ProD PRT Intervention Effects
Mean ± SD or
(95% CI) P-value Mean ± SD or
(95% CI) P-value Net Difference
(95% CI) P-values
Model 1 | Model 3
Muscle CSA
Baseline (cm2) 62.4 ± 14.6 64.8 ±16.0
% Δ 24-weeks 3.5 (1.7, 5.3) 0.001 1.8 (0.3, 3.4) 0.086 1.7 (-0.7, 4.1) 0.087 | 0.137
Muscle Density
Baseline (mg/cm3) 73.6 ± 11.0 73.5 ± 11.9
% Δ 24-weeks -0.1 (-0.9, 0.8) 0.655 0.9 (0.3, 1.5) 0.016 -1.0 (-2.0, 0.2) 0.127 | 0.047
Intermuscular Fat Area
Baseline (cm2) 21.7 ± 7.7 23.1 ± 8.2
% Δ 24-weeks 1.7 (-1.5, 4.8) 0.623 -0.7 (-3.6, 2.2) 0.290 2.4 (-1.9, 6.6) 0.267 | 0.247
Subcutaneous Fat Area
Baseline (cm2) 38.7 ± 24.9 44.6 ± 29.3
% Δ 24-weeks -0.8 (-3.7, 2.1) 0.745 -1.4 (-4.1, 1.4) 0.602 0.6 (-3.4, 4.6) 0.807 | 0.738 Baseline values represent mean ± SD and within group changes and net differences represent means with 95% confidence intervals (CI). Intervention effect refers to the within group change from baseline in the intervention group minus the within group change from baseline in the control group. All change values and net differences were derived from unadjusted values. Significant differences are highlighted in bold. Model 1 represents unadjusted P-values. Model 3 represents the P-value after adjustments for age, gender, ethnicity and moderate-vigorous physical activity. CSA, Cross sectional area; PRT+ProD, progressive resistance training plus protein and vitamin D supplements; PRT, progressive resistance training.

Page | 240
Table 6.13: Baseline values and within-group changes in the PRT+ProD and PRT groups and the net between-group differences for the change relative to baseline in leg press and seated row one-repetition maximum muscle strength and knee extensor isometric muscle strength.
Baseline Values and Within-Group Changes
PRT+ProD PRT Intervention Effects
Mean ± SD or
(95% CI) P-value Mean ± SD or
(95% CI) P-value Net Difference
(95% CI) P-values
Model 1 | Model 3
1-RM Leg Press
Baseline (kg) 186.9 ± 74.4 195.5 ± 79.2
% Δ 24-weeks 15.7 (9.7, 21.6) 0.001 14.7 (7.2, 22.2) 0.001 0.9 (-8.4, 10.4) 0.889 | 0.736
1-RM Seated Row
Baseline (kg) 53.4 ± 17.3 55.9 ± 17.1
% Δ 24-weeks 11.3 (5.7, 16.9) 0.001 7.3 (2.9, 11.6) 0.001 4.0 (-3.0, 11.1) 0.299 | 0.330
Knee Extensor Strength
Baseline (kg) 39.5 ± 14.1 40.9 ± 13.0
% Δ 12-weeks 12.1 (6.4, 17.8) 0.001 12.7 (7.3, 18.1) 0.001 -0.6 (-8.4, 7.2) 0.646 | 0.703
% Δ 24-weeks 18.9 (12.3, 25.5) 0.001 18.2 (12.2, 24.1) 0.001 0.8 (-8.1, 9.6) 0.954 | 0.953 Baseline values represent mean ± SD and within group changes and net differences represent means with 95% confidence intervals (CI). Intervention effect refers to the within group change from baseline in the intervention group minus the within group change from baseline in the control group. All change values and net differences were derived from unadjusted values. Significant differences are highlighted in bold. Model 1 represents unadjusted P-values. Model 3 represents the P-value after adjustments for age, gender, ethnicity and moderate-vigorous physical activity. PRT+ProD, progressive resistance training plus protein and vitamin D supplements; PRT, progressive resistance training.

Chapter 6
Page | 241
6.6.8 Cardiovascular Health
Anti-Hypertensive and Lipid-Lowering Medications
At baseline, 55% and 58% of participants in the PRT+ProD and PRT group were
taking anti-hypertensive medication. Similarly, just over 50% of participants in each
group at baseline were taking lipid-lowering medication. There were no significant
within-group changes or differences between-groups for the proportion of
participants taking anti-hypertensive or lipid-lowering medications at any point
during the intervention (Table 6.14). Similarly, there was no significant within-group
changes or between-group differences regarding a change in the number or dose of
these medications or whether participants commenced or ceased these medications
over the duration of the intervention (Table 6.14).

Chapter 6
Page | 242
Table 6.14: Total number and proportion of participants prescribed anti-hypertensive and/or lipid-lowering medications at baseline, 12- and 24-weeks in the PRT+ProD and PRT groups.
Baseline 12-weeks 24-weeks
Anti-Hypertensive Medications, n (%)
PRT+ProD 54 (55) 52 (56) 49 (56)
PRT 58 (58) 45 (54) 43 (54)
Increased | Decreased Number, n (%)
PRT+ProD - 0 (0) | 0 (0) 0 (0) | 1 (1)
PRT - 0 (0) | 0 (0) 1 (1) | 0 (0)
Increased | Decreased Dose, n (%)
PRT+ProD - 2 (2) | 1(1) 3 (3) | 3 (3)
PRT - 1 (1) | 0(0) 2 (3) | 0 (0)
Commenced | Ceased Medication, n (%)
PRT+ProD - 1 (1) | 0 (0) 1 (1) | 2 (2)
PRT - 0 (0) | 0 (0) 1 (1) | 1 (1)
Lipid-lowering Agents, n (%)
PRT+ProD 53 (54) 48 (52) 45 (51)
PRT 56 (56) 47 (55) 44 (54)
Increased | Decreased Number, n (%)
PRT+ProD - 0 (0) | 0 (0) 0 (0) | 0 (0)
PRT - 0 (0) | 0 (0) 0 (0) | 0 (0)
Increased | Decreased Dose, n (%)
PRT+ProD - 0 (0) | 3 (7) 1 (2) | 3 (7)
PRT - 2 (4) | 1 (2) 2 (4) | 2 (4)
Commenced | Ceased Medication, n (%)
PRT+ProD - 2 (2) | 1 (1) 1 (1) | 4 (5)
PRT - 1 (1) | 0 (0) 1 (1) | 1 (1)
The proportion of participants on anti-hypertensive or lipid-lowering medications was calculated based on the total number of participants in each group at each time point. PRT+ProD, Progressive resistance training plus whey protein and vitamin D supplements; PRT, progressive resistance training. The percentages were calculated from the total participants prescribed anti-hypertensive or lipid-lowering medication or had a change in either of these medications divided by the total number of participants multiplied by 100. PRT+ProD, Progressive resistance training plus whey protein and vitamin D supplements; PRT, progressive resistance training.

Chapter 6
Page | 243
Type of Anti-Hypertensive Medication
There were no between-group differences at any time point for the proportion of
participants prescribed different types of anti-hypertensive medications (Table 6.15).
Table 6.15: Types of anti-hypertensive medications participants were prescribed at baseline, 12- and 24-weeks in the PRT+ProD and PRT groups.
Baseline 12-weeks 24-weeks
ACE Inhibitors, n (%) PRT+ProD 11 (11) 11 (12) 8 (9)
PRT 20 (20) 16 (19) 15 (19)
Calcium-Channel Blocker, n (%)
PRT+ProD 5 (5) 4 (4) 3 (3)
PRT 7 (7) 4 (5) 2 (3)
β-Blocker, n (%)
PRT+ProD 10 (10) 8 (9) 7 (8)
PRT 10 (10) 7 (8) 6 (8)
AT1-Receptor Blocker, n (%)
PRT+ProD 3 (3) 3 (3) 3 (3)
PRT 2 (2) 1 (1) 1 (1)
Angiotensin II Receptor Antagonists, n (%)
PRT+ProD 13 (13) 12 (13) 11 (13)
PRT 16 (16) 12 (14) 12 (15)
Combination Therapy1, n (%)
PRT+ProD 31 (32) 30 (32) 30 (34)
PRT 23 (23) 19 (23) 20 (25) The percentages were calculated from the total number of anti-hypertensive drugs prescribed divided by the total number of participants on a type of anti-hypertensive medication multiplied by 100. 1 Combination therapy reflected those on combined anti-hypertensive drugs, an anti-hypertensive combined with a thiazide diuretic and hypertensive medication not otherwise classified. PRT+ProD, Progressive resistance training plus whey protein and vitamin D supplements; PRT, progressive resistance training.

Chapter 6
Page | 244
Baseline Hypertensive Status and Lipid Profile
At baseline, there were 50% and 39% of participants in the PRT+ProD and PRT
groups respectively, with measured blood pressure levels indicative of hypertension
with no differences between the groups. Including those prescribed anti-hypertensive
medications, this prevalence increased to 70% and 65% in the PRT+ProD and PRT
groups respectively, with no difference between the groups (data not shown). At
baseline, a similar number and proportion of participants in both groups presented
with high serum total cholesterol, triglyceride and LDL cholesterol and low HDL
cholesterol levels (Table 6.16).
Table 6.16: Number and proportion of participants in the PRT+ProD and PRT groups presenting with hyperlipidaemia.
PRT+ProD PRT
Cholesterol and Lipoprotein Status
Total cholesterol >5.5 mmol/L, n (%) 15 (15) 18 (18)
LDL cholesterol <2.0 mmol/L, n (%) 38 (39) 36 (36)
HDL cholesterol ≥1.0 mmol/L, n (%) 14 (14) 21 (21)
Triglycerides >1.7 nmol/L, n (%) 36 (37) 49 (49)
Elevated lipid(s) + lipid-lowering medication,3 n (%) 67 (68) 57 (57)
The percentage of participants suffering from any of the above conditions was calculated based on the total number of participants in that group divided by those who reported a comorbid condition multiplied by 100. 1 SBP ≥140 and/or DBP ≥90 mmHg; 2 SBP ≥140 and/or DBP ≥90 mmHg and/or taking anti-hypertensive medication; 3 Elevated triglycerides and/or taking lipid-lowering medication. PRT+ProD, progressive resistance training plus protein and vitamin D supplements; PRT, progressive resistance training; SBP, systolic blood pressure; DBP, diastolic blood pressure.
Baseline Blood Pressure, Serum Lipids and Cholesterol
There were no differences between the groups at baseline for SBP or DBP or any
serum lipid and lipoprotein concentrations (Table 6.17 and 6.18).
Blood Pressure
Throughout the intervention no significant changes in SBP were observed in either
group. However, a significant 2.5 and 2.6 mmHg reduction in DBP at both 12- and
24-weeks compared to baseline was observed in the PRT+ProD group (P=0.004 and

Chapter 6
Page | 245
P=0.010), with the PRT group also experiencing a 2.5 mmHg reduction in DBP only
after 24-weeks (P=0.010). However, there were no between-group differences for the
change over time in either SBP or DBP whether the results were unadjusted, adjusted
for covariates in model 3 as shown in Table 6.17.
Serum Lipid and Lipoprotein Levels
After 12-weeks the PRT+ProD group experienced a mean reduction in total and LDL
cholesterol of 0.20 mmol/L and 0.19 mmol/L, respectively (P=0.011 and P=0.005),
but these changes were not maintained after 24-weeks. There were no other within
group changes in any other measure in either group, and there were no between
group differences (group-by-time interactions) for the changes over 24-weeks
whether the results were unadjusted or adjusted for covariates (age, gender, ethnicity,
BMI, lipid-lowering medication and moderate-vigorous habitual physical activity)
(Table 6.18).

Page | 246
Table 6.17: Baseline values and absolute within-group changes in PRT+ProD and PRT groups and the net between-group differences for the change at 12- and 24-weeks relative to baseline for systolic and diastolic blood pressure.
Baseline Values and Within-Group Changes
PRT+ProD PRT Intervention Effects
Mean ± SD or
(95% CI) P-value Mean ± SD or
(95% CI) P-value Net Difference
(95% CI) P-values
Model 1 | Model 3
Systolic Blood Pressure (mmHg)
Baseline 136.0 ± 15.7 134.9 ± 15.2
Δ 12-weeks -2.5 (-5.5, 0.4) 0.144 0.4 (-3.6, 4.4) 0.965 -2.9 (-7.8, 1.9) 0.267 | 0.397
Δ 24-weeks -4.3 (-8.8, 0.2) 0.023 -2.4 (-6.2, 1.4) 0.093 -1.9 (-7.9, 4.0) 0.825 | 0.811
Diastolic Blood Pressure (mmHg)
Baseline 85.2 ± 9.0 83.1 ± 8.3
Δ 12-weeks -2.8 (-4.6, -1.0) 0.004 -0.9 (-3.1, 1.4) 0.392 -2.0 (-4.8, 0.8) 0.175 | 0.219
Δ 24-weeks -2.6 (-4.7, -0.5) 0.010 -2.5 (-4.6, -0.3) 0.010 -0.1 (-3.1, 2.8) 0.933 | 0.854 Baseline values represent mean ± SD and within group changes and net differences represent means with 95% confidence intervals (CI). Intervention effect refers to the within group change from baseline in the intervention group minus the within group change from baseline in the control group. All change values and net differences were derived from unadjusted values. Significant differences are highlighted in bold. Model 1 represents unadjusted P-values. Model 3 represents the P-value after adjustments for age, gender, ethnicity, BMI, anti-hypertensive use and moderate-vigorous physical activity. PRT+ProD, progressive resistance training plus protein and vitamin D supplements; PRT, progressive resistance training.

Page | 247
Table 6.18: Baseline values and absolute within-group changes in the PRT+ProD and PRT groups and the net between-group differences for the change at 12- and 24-weeks relative to baseline for serum total, HDL and LDL cholesterol and triglycerides.
Baseline Values and Within-Group Changes
PRT+ProD PRT Intervention Effects
Mean ± SD or
(95% CI) P-value Mean ± SD or
(95% CI) P-value Net Difference
(95% CI) P-values
Model 1 | Model 3
Total Cholesterol (mmol/L)
Baseline 4.40 ± 1.06 4.51 ± 1.08
Δ 12-weeks -0.20 (-0.35, -0.05) 0.011 -0.03 (-0.18, 0.13) 0.689 -0.18 (-0.39, 0.03) 0.131 | 0.197
Δ 24-weeks -0.11 (-0.27, 0.06) 0.171 0.00 (-0.16, 0.15) 0.889 -0.10 (-0.33, 0.12) 0.390 | 0.538
HDL Cholesterol (mmol/L)
Baseline 1.30 ± 0.34 1.24 ± 0.30
Δ 12-weeks -0.02 (-0.05, 0.02) 0.355 0.00 (-0.03, 0.04) 0.955 -2.0 (-4.8, 0.8) 0.488 | 0.436 Δ 24-weeks 0.00 (-0.04, 0.03) 0.934 0.00 (-0.03, 0.04) 0.997 -0.1 (-3.1, 2.8) 0.946 | 0.507
LDL Cholesterol (mmol/L)
Baseline 2.37 ± 0.92 2.44 ± 0.93
Δ 12-weeks -0.19 (-0.31, -0.07) 0.005 -0.09 (-0.20, 0.03) 0.233 -0.10 (-0.27, 0.06) 0.275 | 0.652
Δ 24-weeks -0.12 (-0.25, 0.02) 0.113 0.02 (-0.12, 0.16) 0.712 -0.13 (-0.33, 0.06) 0.175 | 0.245
Continued over page

Page | 248
Triglycerides (mmol/L)
Baseline 1.62 ± 1.03 1.82 ± 0.86
Δ 12-weeks 0.00 (-0.22, 0.23) 0.963 0.10 (-0.15, 0.36) 0.431 -0.10 (-0.44, 0.24) 0.546 | 0.275
Δ 24-weeks 0.03 (-0.10, 0.16) 0.907 0.03 (-0.15, 0.22) 0.993 0.00 (-0.23, 0.21) 0.920 | 0.761 Baseline values represent mean ± SD and within group changes and net differences represent means with 95% confidence intervals (CI). Intervention effect refers to the within group change from baseline in the intervention group minus the within group change from baseline in the control group. All change values and net differences were derived from unadjusted values. Significant differences are highlighted in bold. Model 1 represents unadjusted P-values. Model 3 represents the P-value after adjustments for age, gender, ethnicity, BMI, lipid-lowering medication and moderate habitual physical activity. PRT+ProD, progressive resistance training plus protein and vitamin D supplements; PRT, progressive resistance training.

Chapter 6
Page | 249
6.6.9 Other Medication Use and Change
The number and proportion of participants prescribed diuretics and NSAIDs are
presented in Table 6.19. There were no significant within-group changes or between-
group differences for any of the above medications, with the exception that a lower
number (and proportion) of participants in the PRT+ProD group were prescribed
diuretics in comparison to the PRT group at baseline (Chi-square; P<0.01)
Table 6.19: Total number and type of other medications prescribed to participants at baseline, 12- and 24-weeks in the PRT+ProD and PRT groups.
Baseline 12-weeks 24-weeks
Diuretics, n (%)
PRT+ProD 4 (4)* 5 (5) 4 (5)
PRT 14 (14) 8 (9) 8 (10)
NSAIDs, n (%)
PRT+ProD 8 (8) 6 (6) 8 (9)
PRT 5 (5) 4 (5) 4 (5)
The proportion of participants on any of the above medications was calculated based on the total number of participants in each group at each time point. NSAIDs, nonsteroidal anti-inflammatory drugs. PRT+ProD, Progressive resistance training plus whey protein and vitamin D supplements; PRT, progressive resistance training. * P<0.01 versus PRT.
6.6.10 Inflammatory Cytokines, Hormonal and Biochemical Factors
There were no differences between the groups in any of the inflammatory markers at
baseline with the exception that serum levels of IL-8 (P<0.05), TNF-a (P<0.01) and
hs-CRP (P<0.01) were all significantly lower in the PRT+ProD group (Table 6.20).
As shown in Table 6.20, there were no differences between the groups at baseline for
serum creatinine, eGFR, serum 25(OH)D or IGF-1 levels.
Inflammatory Cytokines
After 12- and 24-weeks, the PRT+ProD group experienced significant gains (48.8%
and 40.0%, respectively, both P=0.001) in the anti-inflammatory marker IL-10
compared to baseline. This increase combined with a 14% non-significant and 22%
significant (P=0.023) reduction in the PRT group resulted in a significant between-
group difference for the change over time (P=0.001). A significant between-group

Chapter 6
Page | 250
difference (group-by-time interaction) was also observed for the change in IL-8
(P=0.010) at 12-weeks. This was driven by a 6% (P=0.174) increase in the
PRT+ProD group and a 7% (P=0.103) reduction in the PRT group. Further, a
significant 7% reduction in TNF-α levels after 12-weeks in the PRT group relative to
baseline drove a significant between-group interaction (P=0.047) in the unadjusted
model. This was no longer significant following adjustment for covariates (model 3)
(P=0.057). At 24-weeks again a significant between-group difference (group-by-time
interaction) was observed for TNF-α, yet at this time-point the significant interaction
was driven by an 11% [(95% CI, 0.10, 20.6) P=0.033] significant increase in the
PRT+ProD group (Table 6.20 and Figure 6.7). This result was retained when
adjusting for covariates. However, after adjusting for the baseline values there were
no significant between-group differences at 12-weeks (P=0.620) or 24-weeks
(P=0.241). In addition to the results above, there was a non-significant within-group
reduction in serum adiponectin in the PRT+ProD group [mean change -4.0% (95%
CI, (-7.9, -0.1) P=0.115] after 24-weeks which resulted in a trend towards a
significant between-group difference (P=0.069) for the change over time when
adjusting for covariates in model 3. For all other inflammatory cytokines, there were
no within-group changes or between-group differences for the change over time
(Table 6.20 and Figure 6.7).
Hormonal and Biochemical Measures
After 12- and 24-weeks, the PRT+ProD group experienced a mean significant 25
nmol/L and 28 nmol/L increase in serum 25(OH)D (both P=0.001), with no change
observed in the PRT group (Table 6.21). This led to significant between-group
differences at both 12- and 24-weeks (both P=0.001). No within-group changes or
between-group differences were observed for serum IGF-1 following the 24-week
intervention (Table 6.21). Both groups experienced similar significant reductions in
serum creatinine and eGFR by 24-weeks (both P=0.001) with no group-by-time
interactions observed.

Page | 251
Table 6.20: Baseline values and percent changes in the PRT+ProD and PRT groups and the net between-group differences for the change at 12- and 24-weeks relative to baseline for serum levels of interleukin (IL)-10, IL-6, IL-8, tumor necrosis factor-alpha (TNF-α), adiponectin and high-sensitive C-reactive protein (hs-CRP).
Baseline Values and Within-Group Changes
PRT+ProD PRT Intervention Effects
Mean ± SD or
(95% CI) P-value Mean ± SD or
(95% CI) P-value Net Difference
(95% CI) P-values
Model 1 | Model 3
IL-10
Baseline (pg/ml) 8.1 ± 13.7 11.6 ± 18.9
%Δ 12-weeks 48.8 (27.7, 70.0) 0.001 -13.8 (-33.3, 5.6) 0.109 62.7 (34.1, 91.3) 0.001 | 0.001
%Δ 24-weeks 40.0 (18.1, 61.8) 0.001 -21.5 (-42.6, -0.3) 0.023 61.4 (31.0, 91.9) 0.001 | 0.001
IL-6
Baseline (pg/ml) 2.8 ± 2.5 3.2 ± 3.7
%Δ 12-weeks 10.5 (-7.4, 28.4) 0.211 -11.9 (-28.5, 4.7) 0.196 22.4 (-1.9, 46.7) 0.072 | 0.165
%Δ 24-weeks 13.7 (-2.2, 29.6) 0.139 -9.9 (-26.9, 7.1) 0.415 23.5 (0.4, 46.6) 0.105 | 0.160
IL-8
Baseline (pg/ml) 15.1 ± 7.1a 20.9 ± 25.3
%Δ 12-weeks 5.7 (-3.8, 15.3) 0.174 -7.0 (-18.1, 4.2) 0.103 12.7 (-1.8, 27.2) 0.033 | 0.010
%Δ 24-weeks 2.0 (-4.1, 8.4) 0.493 -3.7 (-16.1, 8.6) 0.377 5.9 (-7.2, 19.0) 0.262 | 0.158
Continued over page

Page | 252
TNF-α
Baseline (pg/ml) 7.6 ± 2.5b 9.2 ± 5.3
%Δ 12-weeks 6.3 (-4.5, 17.2) 0.355 -6.7 (-13.8, 0.0) 0.046 13.0 (0.0, 26.0) 0.047c | 0.057
%Δ 24-weeks 10.6 (0.10, 20.6) 0.033 -4.8 (-12.9, 3.2) 0.141 15.5 (2.5, 28.5) 0.009c | 0.009c
Adiponectin
Baseline (µg/mL) 2.9 ± 1.8 2.6 ± 1.3
%Δ 12-weeks -1.6 (-6.5, 3.3) 0.839 -2.9 (-6.5, 0.1) 0.201 1.3 (-4.7, 7.3) 0.582 | 0.716
%Δ 24-weeks -4.0 (-7.9, -0.1) 0.115 -0.5 (-4.8, 3.7) 0.985 -3.5 (-9.2, 2.3) 0.195 | 0.069
High sensitive-CRP
Baseline (mg/mL) 1.7 ± 1.5b 3.3 ± 5.7
%Δ 12-weeks -10.3 (-26.3, 5.8) 0.204 -4.1 (-23.4, 15.2) 0.606 -6.2 (-31.0, 18.7) 0.514 | 0.528
%Δ 24-weeks -2.0 (-16.2, 12.1) 0.854 0.0 (-20.0, 20.2) 0.910 -2.1 (-26.2, 21.9) 0.719 | 0.922 Baseline values represent mean ± SD and within group changes and net differences represent means with 95% confidence intervals (CI). Intervention effect refers to the within group change from baseline in the intervention group minus the within group change from baseline in the control group. All change values and net differences were derived from unadjusted values. Significant differences are highlighted in bold. Model 1 represents unadjusted P-values. Model 3 represents the P-value after adjustments for age, gender, ethnicity, BMI and moderate habitual physical activity. a P<0.05 b P<0.01 vs PRT at baseline. * Group-by-time interaction lost when model was adjusted for baseline serum levels. PRT+ProD, progressive resistance training plus protein and vitamin D supplements; PRT, progressive resistance training.

Chapter 6
Page | 253
Figure 6.7: Mean percentage change from baseline (95% CI) in log transformed serum interleukin (IL)-6 (A), IL-10 (B), IL-8 (C), TNF-α (D), adiponectin (E) and high sensitive hs-CRP (F) in the PRT+ProD (●) and PRT (○) groups. * P<0.01 ‡ P<0.001 within-group change from baseline # P<0.05, ^ P<0.001 between-group difference for the changes over time (group-by-time interaction). All p-values are based upon results adjusted for covariates. Please note the different scales for different graphs.

Page | 254
Table 6.21: Baseline values and absolute within-group changes in the PRT+ProD and PRT groups and the net between-group differences for the change at 12- and 24-weeks relative to baseline for serum creatinine, estimated glomular filtration (eGFR), 25-hydroxyvitamin D (25(OH)D) and insulin-like growth factor-1 (IGF-1).
Baseline Values and Within-Group Changes
PRT+ProD PRT Intervention Effects
Mean ± SD or
(95% CI) P-value Mean ± SD or
(95% CI) P-value Net Difference
(95% CI) P-values
Model 1 | Model 3
Creatinine (mol/L)
Baseline 75.5 ± 15.8 79.7 ± 17.5
Δ 12-weeks 0.6 (-1.2, 2.4) 0.499 0.3 (-1.8, 2.3) 0.679 -0.4 (-2.3, 3.1) 0.876 | 0.994
Δ 24-weeks 3.1 (1.2, 5.0) 0.001 3.2 (1.2, 5.3) 0.001 -0.2 (-3.0, 2.6) 0.783 | 0.988
eGFR (ml/min/1.73m2)
Baseline 84.8 ± 8.3b 81.2 ± 12.2
Δ 12-weeks -0.1 (-1.1, 1.0) 0.843 -0.3 (-2.1, 1.4) 0.661 0.3 (-1.7, 2.2) 0.822 | 0.640
Δ 24-weeks -2.6 (-4.0, -1.2) 0.001 -2.4 (-4.1, -0.7) 0.001 0.2 (-2.3, 2.0) 0.880 | 0.964
25(OH)D (nmol/L)
Baseline 75.5 ± 22.1a 68.7 ± 22.4
Continued over page

Page | 255
Δ 12-weeks 25.2 (20.7, 29.6) 0.001 0.2 (-3.9, 4.3) 0.754 24.9 (18.9, 31.0) 0.001 | 0.001
Δ 24-weeks 28.0 (22.8, 33.2) 0.001 3.3 (-2.0, 8.5) 0.155 24.7 (17.4, 32.0) 0.001 | 0.001
IGF-1 (nmol/L)
Baseline 20.0 ± 7.4 18.9 ± 6.2 Δ 12-weeks 0.0 (-0.6, 0.7) 0.813 -0.1 (-0.8, 0.6) 0.970 0.1 (-0.9, 1.0) 0.834 | 0.699
Δ 24-weeks 0.5 (-0.2, 1.1) 0.169 0.1 (-0.8, 1.1) 0.508 0.3 (-0.8, 1.4) 0.663 | 0.409 Baseline values represent mean ± SD and within group changes and net differences represent means with 95% confidence intervals (CI). Intervention effect refers to the within group change from baseline in the intervention group minus the within group change from baseline in the control group. All change values and net differences were derived from unadjusted values. Significant differences are highlighted in bold. Model 1 represents unadjusted P-values. Model 3 represents the P-value after adjustments for age, gender, ethnicity, BMI and moderate habitual physical activity. a P<0.05, b P<0.01 vs PRT at baseline. PRT+ProD, progressive resistance training plus protein and vitamin D supplements; PRT, progressive resistance training.

Chapter 6
Page | 256
6.6.11 Per Protocol Analysis
The per protocol analysis was limited to participants who achieved ≥ 66%
compliance with the PRT program and those in the PRT+ProD group who also
achieved ≥ 80% compliance with the whey protein and vitamin D supplements.
This sensitivity analysis was limited to a total of 41 participants in the PRT+ProD
group and 50 participants in the PRT group. Baseline characteristics for
participants included in the per protocol analysis are presented below in Table
6.22 with the remaining results tables found in Appendix 10 at the end of this
thesis.
Baseline Characteristics
The baseline characteristics were not different between the groups with the
exception that the PRT+ProD group were found to have a significantly higher
number (proportion) of individuals with a family history of diabetes (PRT+ProD,
n=30 (73%) vs PRT, n=20 (41%), P<0.05) and participants classified as normal
weight (BMI 18.5-24.9 kg/m2) (PRT+ProD, n=8 (19%) vs PRT, n=1 (2%),
P<0.05). As a result, the number and proportion of participants classified as
overweight (BMI 25.0-29.9 kg/m2) and obese (BMI >30 kg/m2) was lower in the
PRT+ProD compared to the PRT group (overweight, PRT+ProD, n=13 (32%) vs
PRT, n=18 (19%) and obese, PRT+ProD, n=20 (49%) vs PRT, n=31 (62%), both
P<0.05).
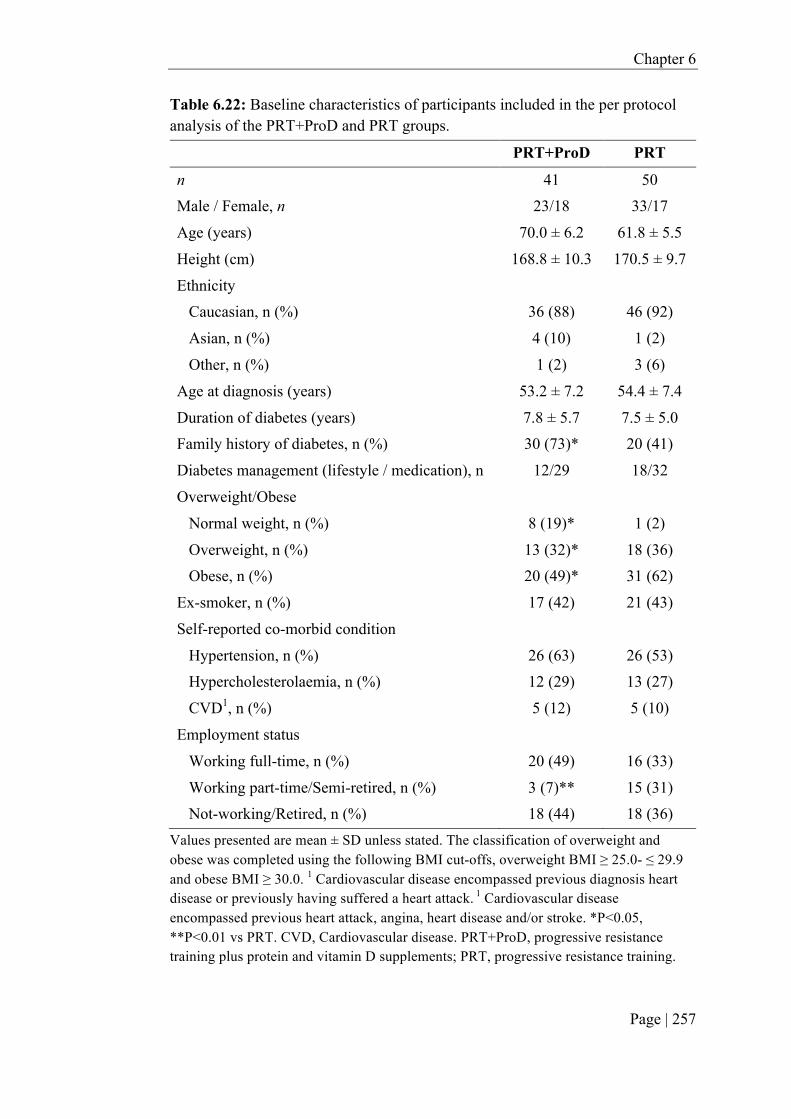
Chapter 6
Page | 257
Table 6.22: Baseline characteristics of participants included in the per protocol analysis of the PRT+ProD and PRT groups.
PRT+ProD PRT
n 41 50 Male / Female, n 23/18 33/17
Age (years) 70.0 ± 6.2 61.8 ± 5.5
Height (cm) 168.8 ± 10.3 170.5 ± 9.7
Ethnicity Caucasian, n (%) 36 (88) 46 (92)
Asian, n (%) 4 (10) 1 (2)
Other, n (%) 1 (2) 3 (6)
Age at diagnosis (years) 53.2 ± 7.2 54.4 ± 7.4
Duration of diabetes (years) 7.8 ± 5.7 7.5 ± 5.0 Family history of diabetes, n (%) 30 (73)* 20 (41)
Diabetes management (lifestyle / medication), n 12/29 18/32
Overweight/Obese
Normal weight, n (%) 8 (19)* 1 (2)
Overweight, n (%) 13 (32)* 18 (36) Obese, n (%) 20 (49)* 31 (62)
Ex-smoker, n (%) 17 (42) 21 (43)
Self-reported co-morbid condition
Hypertension, n (%) 26 (63) 26 (53) Hypercholesterolaemia, n (%) 12 (29) 13 (27)
CVD1, n (%) 5 (12) 5 (10)
Employment status
Working full-time, n (%) 20 (49) 16 (33)
Working part-time/Semi-retired, n (%) 3 (7)** 15 (31) Not-working/Retired, n (%) 18 (44) 18 (36)
Values presented are mean ± SD unless stated. The classification of overweight and obese was completed using the following BMI cut-offs, overweight BMI ≥ 25.0- ≤ 29.9 and obese BMI ≥ 30.0. 1 Cardiovascular disease encompassed previous diagnosis heart disease or previously having suffered a heart attack. 1 Cardiovascular disease encompassed previous heart attack, angina, heart disease and/or stroke. *P<0.05, **P<0.01 vs PRT. CVD, Cardiovascular disease. PRT+ProD, progressive resistance training plus protein and vitamin D supplements; PRT, progressive resistance training.

Chapter 6
Page | 258
Intervention Results
The findings from the per protocol analysis were similar to those from the
intention-to-treat analysis apart from the following results. Refer to Appendix 10
for all the per protocol results tables.
Diet
A significant between-group difference at 24-weeks was observed in all measures
of habitual protein intake (g, g/kg and percent energy per day, respectively),
which was due to a significant reduction in dietary protein intake (excluding the
supplement) of 12 g/day in the PRT+ProD group along with a non-significant 6 g
increase in the PRT group. A significant between-group difference was also
observed for the change in potassium intake at 24-weeks (P=0.019) only after
adjusting for covariates including age, gender, ethnicity, BMI and moderate-
vigorous physical activity. This between-group difference was driven by a non-
significant 254 mg reduction in the PRT+ProD group and the 338 mg non-
significant increase in the PRT group.
Anthropometry and pQCT
Significant between-group differences at 24-weeks were observed for weight and
BMI (P=0.030 and P=0.046) after adjusting for age, gender, ethnicity and
moderate-vigorous physical-activity, which was driven by significant reductions
(-1.02 kg and -0.42 kg/m2, both P<0.001) in the PRT group along with no change
in the PRT+ProD group. A significant 1.3 cm reduction in waist circumference
(P<0.001) in the PRT group was observed at 12-weeks although this difference
was not different to the PRT+ProD group. A similar significant reduction in waist
circumference in both the PRT+ProD and PRT groups was observed at 24-weeks,
although the magnitude of reduction was slightly greater in the PRT group (mean
change, PRT -2.6 cm and PRT+ProD -1.3 cm). In addition to the above results,
there was a 4.9% increase in 25% femur muscle CSA in the PRT+ProD group
(P=0001) with no change in the PRT group. This led to a trend towards a
significant between-group difference in both the unadjusted model (P=0.056) and
model 3 (P=0.078). Additionally, there was a significant 0.53 kg [(95% CI, 0.31,
0.74) P=0.001] increase in ALM in the PRT+ProD group which greater that the

Chapter 6
Page | 259
gain in the PRT group [0.21 kg (95% CI, 0.01, 0.40) P=0.031] (group-by-time
interaction, P=0.027), but this was not significant after adjustment for the
covariates in model 3 (P=0.184).
Muscle Strength
For the PRT+ProD group, there was a significantly greater gain in upper body
strength compared to the PRT group [net difference for change 16.8% (95% CI,
7.8, 25.8), group-by-time interaction, P=0.033], which remained following
adjustment for covariates in model 3 (P=0.041).
Serum Lipids
The PRT+ProD group experienced a significantly greater reduction in total
cholesterol and LDL cholesterol after 24-weeks compared to the PRT group [net
differences for change: cholesterol -0.24 mmol/L (95% CI, -0.49, 0.01) P=0.049;
LDL -0.20 mmol/L (95% CI, -0.49, -0.05), P=0.011], which remained after
adjusting for covariates (model 3).
Inflammatory Markers
For IL-6, there was a significant between-group difference (group-by-time
interaction) observed at 12- and 24-weeks only in the unadjusted model (P=0.037
and P=0.036). The interaction was driven by a non-significant 23% (P=0.073)
increase in the PRT+ProD group at 12-weeks and a significant 31% (P=0.016)
increase in the PRT+ProD group at 24-weeks with no change in the PRT group at
either 12- or 24-weeks. However, these results were attenuated following
adjustment for covariates in model 3.
6.7 Discussion
The main findings from this 24-week two-arm parallel, RCT in older adults with
T2DM was that the provision of a whey-protein drink (20 g daily and 20 g after
each of the three weekly PRT sessions) and 2,000 IU/day vitamin D did not
enhance the effects of the community-based Lift for Life® PRT program on
glycaemic control, body composition, muscle strength, blood pressure or blood
lipids. However, there was a significantly greater reduction in serum insulin

Chapter 6
Page | 260
concentrations after 12- and 24-weeks in the PRT+ProD compared to PRT group.
Further, there was a significant beneficial effect of PRT combined with whey
protein and vitamin D relative to PRT alone on the anti-inflammatory marker IL-
10, but there were no between-group differences for the change in hs-CRP, TNF-
α, adiponectin, IL-8 or IL-6 after 24-weeks. However, we did find that the PRT
program was safe and effective for improving glycaemic control, total body and
regional (arm and leg) lean mass, thigh muscle size, upper and lower body muscle
strength and lowering waist circumference, fat mass, percentage body fat and
DBP.
Secondary pre-planned analysis examining those who achieved ³66% exercise
adherence combined with ³80% adherence with the whey protein and vitamin D
supplements revealed that there were significant net gains in the PRT+ProD group
for upper body muscle strength and serum IL-6, and a greater reduction in total
cholesterol and LDL cholesterol with a trend for a greater gain in thigh (25%
femur) muscle CSA and arm lean mass. Importantly, there were no serious
adverse events associated with the intervention, and kidney function (eGFR)
improved significantly in both groups. The following sections will provide a
critical discussion of the above findings.
6.7.1 Effects of PRT, Whey Protein and Vitamin D on Lean Mass, Muscle
Size and Strength
Previous research has shown that older adults with T2DM typically experience an
accelerated loss in lean mass and/or strength compared to age-matched, non-
glycaemic controls (146-148). Given the importance of skeletal muscle for
glucose uptake from the circulation, there has been considerable interest in
identifying strategies to optimise lean mass in this group. In this 6-month
community-based RCT, we showed, for the first time, that a daily whey-protein,
leucine enriched, drink combined with vitamin D supplementation, both of which
have shown promise to influence muscle outcomes, did not significantly enhance
the effects of PRT on total body and regional lean mass and thigh muscle size in
older adults with T2DM. However, there was a trend for a modest 0.2 kg (95%

Chapter 6
Page | 261
CI, -0.02, 0.42) greater gain in ALM in the PRT+ProD compared to the PRT
group (P=0.075), which may be due in part, to the significantly higher adherence
to the exercise program in the PRT+ProD group (68% vs 58%). Similarly, the
PRT-related gains in arm and leg lean mass and thigh muscle CSA were 0.5 to
1.8% greater in the PRT+ProD group, but none of these gains were significantly
different from those observed in PRT alone. There are several factors which are
likely to have contributed to the lack of a significant additive effect of the protein-
vitamin D supplement on PRT on muscle outcomes in our study. This includes,
but is not limited to, the baseline habitual protein intakes of participants, the dose
of protein consumed and the subsequent spread in protein intake between the
groups and/or change (increase) over time and the initial vitamin D status of the
participants.
For healthy older adults and the elderly, current guidelines and expert committee
statements recommend PRT be combined with a dietary protein intake level of at
least 1.2 g/kg/day with at least 25–30 g of high-quality protein ingested post-
exercise in order to overcome the anabolic resistance associated with ageing
muscle (495, 619). However, several recent systematic reviews and meta-analyses
have reported that protein/essential amino acid supplementation does not
significantly augment the effects of PRT on muscle mass and/or strength in older
adults (486, 487) or only provides small additional benefits to lean mass (485). In
our study, the lack of any marked additive muscular benefits may be related to the
already high baseline habitual protein intakes of the participants, which averaged
1.21 g/kg/day in the PRT+ProD group and 1.13 g/kg/day in the PRT group. In
support of this notion, a number of other intervention trials in healthy older adults
which found that greater protein intake did not enhance the effects of PRT on
muscle mass or strength also had participants that had initial habitual protein
intakes of ~1.0 to 1.2 g/kg/day (283, 284, 493, 620). However, it is possible that
the type, dose and distribution of protein intake in these studies also contributed
to the lack of any added skeletal muscle benefits to PRT.
Previous research has shown that consuming a bolus of protein (amino acid) can
act as a strong stimuli for endogenous insulin release by the beta–cells of the

Chapter 6
Page | 262
pancreas, particularly when combined with PRT (52, 621). This is important
because insulin stimulates an increase in MPS and suppresses breakdown (622),
and thus insulin resistance in T2DM may contribute further to age-related
anabolic resistance. In our study, long-term supplementation with whey protein
combined with PRT was associated with significantly greater reductions in insulin
levels relative to PRT alone after adjusting for baseline values. This finding is
supported by several acute studies which have shown that whey protein ingestion
post-PRT can increase plasma insulin levels and assist in enhancing the MPS
response in older adults and those with T2DM (276, 281, 379, 623). Conversely,
several other longer-term (≥12-week) trials in healthy or overweight/obese elderly
adults (282-285) and those with T2DM (286) have reported no additive effect of
increased protein consumption with PRT on serum insulin levels. Nevertheless,
the finding that serum insulin levels decreased in the PRT+ProD group in our trial
is consistent with the findings from a previous RCT examining the effects of PRT
plus whey protein supplementation in overweight/obese adults which reported a
significant reduction in plasma insulin area under the curve (AUC) (285). The
reason(s) for this reduction in circulating insulin levels with a combination of
PRT and protein supplementation remains uncertain, and requires further
investigation, but will be discussed in further detail below.
The lack of a significant additive effect of the whey protein supplement with PRT
on muscle outcomes may also be related to the lack of any increases in serum
IGF-1 levels, which is a key growth factor important for muscle hypertrophy
(624, 625). Several previous studies have shown that PRT, particularly high-
intensity PRT, increased protein intake (or supplementation), and the combination
of these factors, can stimulate an increase in IGF-1 in older adults (42, 513, 620).
While the precise reason(s) for the lack of any changes in serum IGF-1 levels in
either group in our study is unclear, it may be related to the modest adherence
with the exercise program, which averaged two session out of the prescribed three
per week, issues related to adhering to the prescribed training intensity (since the
program was implemented within a community-setting), the high level of protein
intake at baseline and/or the relatively modest increase in overall dietary protein
throughout the study.

Chapter 6
Page | 263
Another important factor that has been shown to influence whether protein can
augment the effects of PRT on muscle outcomes in older adults is the type and
dose of protein prescribed. It is well established that whey protein (with an
adequate dose of leucine) can elicit greater increases in postprandial MPS than
other sources of protein (e.g. casein, soy) (39). Acute studies in the elderly have
reported that at least 20 g of whey protein is required to stimulate an increase in
MPS above exercise alone (10 g was ineffective), but 40 g elicited the greatest
response (51). Moreover, there is evidence that 20 g of high-quality protein
containing 2-3 g of leucine maximally stimulates MPS (626-628). In our study,
participants were prescribed a daily dose of 20 g of whey protein providing ~2.4 g
leucine to be consumed prior to breakfast and an additional 20 g after each of the
three weekly PRT sessions. Mean adherence to the supplement was 79%, which
indicates that participants consumed on average, an additional 15.8 g of protein
per day on the non-training days and 31.6 g in a divided dose on the training days.
It is possible that the lack of a significant additive effect on muscle outcomes in
our study relates to the fact that participants were not provided with a single 40 g
dose of whey protein post-exercise. In part support of this notion, the results from
a 6-month trial in 80 mobility limited adults aged 70-85 years found that 40 g of
whey protein divided into 20 g after breakfast and 20 g after the evening meal
combined with PRT led to a non-significant 0.26 kg net gain in total body lean
mass compared to PRT alone (377). Furthermore, in this study by Chale and
colleagues the average increase in protein intake in the whey protein group was
only 18 g when both supplement adherence (mean 72%) and dietary protein
intake was considered, a level similar to that observed in our trial. In the study by
Chale and colleagues this was due to a reduction in habitual total energy and
protein intake, which suggests that the supplement may have been a partial meal
replacements or that there was possibly a satiety effect of the supplement leading
to a reduction in total food intake. Indeed, an acute study in 15 young resistance
training males found that whey protein consumption after PRT reduced
subsequent energy intake by a mean of 437 kJ (348). Consistent with these
results, we also observed a significant reduction in both total energy (mean 437
kJ/day) and protein intake (mean 8 g/day) in the PRT+ProD group.

Chapter 6
Page | 264
The lack of a significant interaction of PRT and whey protein on PRT-related
gains in muscle outcomes in our study may also be explained by an insufficient
spread (difference) in protein intake between the groups (373). After taking into
consideration the changes in habitual protein intake over the course of the
intervention and the adherence to whey protein supplements, we found that there
was an 18% and 36% spread between the groups or a 0.2 g/kg/day and 0.4
g/kg/day between-group spread on the non-training and training days,
respectively. In a previous review of 17 intervention trials examining the effects
of additional protein combined with PRT in both younger and older adults, Bosse
and colleagues (373) found that in studies which detected an additive or
synergistic benefit on muscle outcomes, there was an average 66% g/kg/day
between group spread (difference) in protein intake; a spread of protein intake of
10.2% g/kg/day was found to be ineffective (373). When we performed the pre-
planned per-protocol analysis in participants with ≥66% exercise adherence
(equivalent to two sessions per week) and ≥80% adherence to the whey-protein
and vitamin D supplements the spread in protein intake between-groups on
training and non-training days was around 50% (0.5 g/kg/day) and 20% (0.2
g/kg/day), respectively. This may help to explain the trend towards significantly
greater gains in ALM and thigh muscle CSA in the PRT+ProD compared to PRT
group with this secondary analysis. However, the findings from a 9-month trial in
middle-aged overweight and obese adults found that exercise (PRT 2 days and
aerobic training 1 day per week) combined with an additional 20, 40 or 60 g of
whey protein (divided into two doses and consumed with breakfast and lunch)
and which increased habitual intakes from around 1.0 g/kg/day to 1.15, 1.44 and
1.68 g/kg/day yet compared to control (0.94 g/kg/day) did not increase exercise-
induced responses to total body lean body mass (285). This was despite a 78%
spread in protein intake between the control group and those receiving the highest
dose (60 g/day) of whey protein. However, these findings must be interpreted
with caution given that 43% of participants withdrew from the study, and thus the
study may have been underpowered to detect any differences.
The timing of protein intake when performing PRT and the distribution of protein
intake throughout the day may also influence the skeletal muscle responses to

Chapter 6
Page | 265
exercise (49). Although data on the optimal timing of protein to maximise PRT-
related gains in older adults is limited, a study in elderly men found that ingestion
of 10 g of protein immediately following exercise resulted in greater gains in
muscle size and strength compared to delaying intake by 2 hours after PRT (496).
In addition, the results from a 24-week trial in frail elderly found that providing
additional protein (2 x 15 g) at breakfast and lunch to ensure a more even
distribution of protein throughout the day enhanced the effects of PRT on lean
mass (283). In our study, participants were instructed to consume the whey
protein enriched drink prior to breakfast and as soon as possible following each
PRT session. Unfortunately, no information was collected on the actual times that
the protein supplements were consumed, and data on the dietary protein intakes of
the participants at each meal was not examined. While there is some evidence that
muscles remain sensitive to protein ingestion for up to 24-hours following
training (629), the findings from our study are consistent with several previous
trials in healthy older adults which found that consumption of protein in close
proximity to exercise (282, 497) or through a divided dose (148) did not
significantly augment the effects of PRT on muscle hypertrophy. However, it is
clear that further research is still needed to determine whether a divided dose of
protein when combined with exercise is necessary to enhance the skeletal muscle
responses to training in older adults or those with chronic conditions like T2DM.
A unique aspect of our trial is that it included the combination of PRT with whey
protein and the provision of 2,000 IU vitamin D per day. Vitamin D deficiency
has been associated with reduced muscle mass, strength and function (630-
632)and insulin resistance (633, 634). There is also some evidence that vitamin D
treatment can have a positive effect on muscle protein metabolism (635, 636) and
may act synergistically with leucine and insulin to stimulate MPS (637).
However, the findings from our intention-to-treat analysis indicate that
supplementing with vitamin D and whey protein does not enhance the effects of
PRT on the mass, size or strength of muscle in older adults with T2DM.
Furthermore, pre-planned per protocol analysis in participants with ≥66%
exercise adherence and ≥80% adherence to the whey-protein drink and vitamin D
supplements revealed that there was a significantly greater gain upper body

Chapter 6
Page | 266
muscle strength, ALM (unadjusted only) plus a strong trend towards a greater
gain in thigh (25% femur) muscle CSA and arm lean mass. Several previous
human intervention trials which have investigated the effects of exercise
combined with vitamin D (including fortified milk) or multi-nutrient supplements
with additional vitamin D and protein (503, 512-514, 638-640) on muscle mass
and strength have reported mixed findings. This is likely due to differences in the
dose of vitamin D and protein prescribed (and subsequent changes over time), the
baseline serum 25(OH)D level and habitual protein intake of the participant, and
the health status of cohorts (healthy, elderly/frail or sarcopenic). In our trial, both
groups presented with a sufficient serum 25(OH)D levels at baseline (pooled
mean 72 nmol/L), but as expected, the provision of 2,000 IU of vitamin D daily in
the PRT+ProD group resulted in a significant increase in 25(OH)D levels (mean
change 28 nmol/L) with no change in the PRT group. While there is some
evidence (and expert opinion) that serum 25(OH)D levels of 50 to 75 nmol/L are
required for optimal muscle health and function (641), a recent meta-analysis
found that the greatest benefits of vitamin D treatment on muscle strength were
evident in those with 25(OH)D levels <30 nmol/L and when levels increased by at
least 25 nmol/L; there was no effect of vitamin D on lean mass (462). While it is
difficult to differentiate between the potential effects of protein and vitamin D on
the outcomes in our trial, it is likely that any potential beneficial effects of the
vitamin D on muscle outcomes in our study were blunted by the already high
serum 25(OH)D levels of the participants at baseline.
6.7.2 Effects of PRT, Whey Protein and Vitamin D on Fat Mass and Body
Weight
Along with PRT, long-term whey-protein supplementation or greater protein
intake in older overweight/obese adults has been associated with reductions in fat
mass and total body weight compared to control, (12, 352, 354, 642-644). Whey
protein is believed to improve satiety with the action of satiety hormones
contributing to this effect (348). Vitamin D is another dietary supplement shown
that has been shown to have a positive influence on fat mass and fat distribution,
although the data is very limited (451, 452). Whilst the exact mechanistic
pathways by which vitamin D can achieve this are not known, it has been

Chapter 6
Page | 267
speculated that high intakes of vitamin D can repress fatty acid synthase enzyme
by decreasing intracellular calcium in adipocytes (645). In our trial, no additive
effect of protein and vitamin D was seen on fat mass or total body weight
reductions, but there was a small but non-significant 0.5 kg reduction in fat mass.
The lack of a more pronounced effect on fat mass may have related to several
factors including the dose of protein, the change in total energy intake over the
course of the trial or metabolic adaptations to the intervention. There is also the
possibility that the already sufficient serum 25(OH)D levels of our participants at
baseline influenced the effect supplementary vitamin D had on such outcomes.
Due to whey proteins thermic effect of feeding, high satiety value and ability to
alter hunger hormones such as ghrelin, the regular addition of whey protein
supplements to adults with T2DM diet could plausibly limit total energy intake,
promote weight loss and have a positive effect on fat mass whilst preserving lean
mass (520). When supplementing whey protein with the aim of enhancing
PRT/exercise induced reductions in fat mass the quantity of whey protein has
been suggested to be an important factor influencing such a response (285). In our
trial, we provided 20 g of whey protein on the non-training days or two 20 g doses
on the training days. Whilst these doses of whey protein significantly increased
total protein intake from 1.2 to ~1.5 g/kg/day, there was not a concomitant
reduction in total energy intake. We speculate that the dose of protein on non-
training days (20 g) and the divided dose on training days (one 20 g serving in the
morning and another following training) was inadequate to attenuate energy
intake. Previously studies have shown that whey protein effects subsequent
energy intake in a dose-dependent manner (646) with some studies reporting
significant reductions in body weight, fat mass and even visceral adipose tissue
following the consumption of a~60 g bolus dose of whey protein in older
overweight adults performing exercise or PRT (355, 520). Coinciding with these
body composition improvements in one of the studies, significant reduction in
appetite and energy intake was also observed (355). In contrast to these findings,
a 36-week study providing whey protein in doses ranging from 20 g, as in our
trial, up to 60 g per day observed no significant between group differences for the
change in fat mass or total body weight between the group or controls receiving
Chapter 6
Page | 268
no additional protein (285). The lack of a difference between the groups in fat
mass reduction in that study was proposed to be due to the participants already
consuming an adequate level of protein intake at baseline (>0.9 g/kg/day) which
may have blunted the satiety effect of additional whey protein (285). Participants
in our trial also had high intakes of protein at baseline which may explain the
absence of a significant reduction in energy intake and/or differences for the
change in body composition.
In our study changes in fat mass and body weight were small and similar in both
groups. These results are consistent with another trial which found that the
combination of exercise, whey protein and vitamin D was no different to exercise
alone in reducing fat mass or total body weight in older sarcopenic adults (513).
Indeed, the magnitude of change in fat mass and weight loss in this study by
Rondanelli et al (513) was similar to that observed in our trial. Similarly, another
trial also observed no added benefit of a high-whey protein and vitamin D
enriched supplement plus PRT on fat mass or total body weight in obese adults,
although this trial also included a caloric restricted diet making comparisons
difficult. (512). Nevertheless, the small improvements in fat mass and total body
weight in our trial are similar to some other PRT trials in older overweight/obese
adults with T2DM in the absence of caloric restriction (203, 216, 250), yet others
have reported much greater losses in weight and fat mass (7, 8, 202, 208, 217).
These differences could be related to the fact that we conducted a ‘real-world’
community-based program which contrasts with many others which were
performed in clinically controlled exercise laboratories.
6.7.3 Effects of PRT, Whey Protein and Vitamin D on Glycaemic and
Insulinaemic Outcomes
Previous research has shown that whey protein (and a high protein diet) can have
an insulinotropic effect, and thus stimulate insulin secretion to enhance glucose
clearance from the blood (333, 403, 647). Moderate- to high-intensity PRT has
also been shown to improve glycaemic control and insulin sensitivity, but whether
whey protein supplementation can enhance the effects of PRT on these outcomes
in older adults with T2DM remains uncertain. In this 6-month RCT in 198

Chapter 6
Page | 269
overweight and obese older adults with T2DM there was a 0.56 mmol/L (6.8%)
greater reduction in FPG in the PRT compared to PRT+ProD group after 24-
weeks, but this was not significant after adjusting for covariates. Conversely,
there was a significant reduction in serum insulin concentrations in the
PRT+ProD after 12- and 24-weeks, that differed from the PRT group after
adjusting for baseline values, which would indicate an improvement in insulin
sensitivity. However, there was no evidence to support an additive effect of PRT
with 20 g of whey protein consumed daily prior to breakfast and an additional 20
g within two hours of each of the two to three weekly PRT sessions, on the
clinically relevant outcome measures of HbA1c or insulin sensitivity as assessed
via the HOMA model.
Consistent with the results from our 6-month RCT in older adults with T2DM, a
number of previous intervention trials in healthy older adults and those with
metabolic syndrome or T2DM have also failed to detect any additive effect of
increased dietary protein, whey protein or a milk-based protein supplementation
with PRT on glycaemic and insulinaemic outcomes when compared to exercise
/PRT (283-285, 305, 519-521, 648). For instance, a 16-week intervention
involving an energy-restricted diet with either a standard or high protein intake
(19% vs 33%), with or without PRT performed three days per week, in
overweight and obese adults with T2DM resulted in similar significant reductions
in HbA1c, FPG and serum insulin, despite greater weight and fat loss in the high
protein plus PRT group (286). Similarly, the findings from a 36-week RCT in
middle-aged overweight and obese adults with FPG levels within the ‘normal’
range (<6.1 mmol/L) revealed that whey protein supplementation at 0, 20, 40 or
60 g per day combined with twice weekly PRT and aerobic training had no effect
on glucose levels [OGTT glucose area under the curve (AUC)] or insulin
resistance (HOMA-IR) yet insulin AUC decreased significantly by 2.6% across
the groups (285). There are a number of factors which may explain the lack of an
added benefit of increased protein combined with PRT on glycaemic outcomes in
both our study and previous trials. This could include the baseline HbA1c or FPG
status of the participants, the use of oral hypoglycaemic medications, the habitual
protein intake of participants, the type, timing and dose of protein prescribed and

Chapter 6
Page | 270
subsequent spread (difference) in protein intake between groups, and differences
in duration of the intervention period.
For people with T2DM it is generally recommended that they maintain a HbA1c
level ≤ 7% and FPG between 6-8 mmol/L as this has been associated with a
reduced risk of long term T2DM-related complications (649, 650). In our study,
the mean baseline HbA1c level of participants in the PRT+ProD and PRT group
was 6.9 and 7.1%, respectively (mean FPG levels were 7.9 and 8.6 mmol/L,
respectively). Overall less than half of the participants (44%) had an initial HbA1c
>7%, and there was a significantly higher proportion of participants with a level
above this cut-point in the PRT compared to PRT+ProD group (51% vs 37%).
This may explain, in part, our finding that the combination of PRT with whey
protein supplementation did not lead to greater benefits on glycaemic control and
insulin sensitivity compared to PRT alone. However, secondary analysis revealed
that there was no significant interaction by baseline HbA1c status (≤7 vs >7%).
Consistent with our findings, nearly all previous studies which reported no added
benefit of increased dietary or supplemental protein with PRT on HbA1c, insulin
sensitivity or insulin resistance included participants with adequate glycaemic
control (148, 283, 285, 520, 521, 648). Given that there are some reported
benefits of whey protein supplementation or a higher protein intake (without
PRT) on HbA1c or FPG levels in participants with poor glycaemic control (HbA1c
>7.5%) (38, 263, 272, 396), further research is warranted to investigate whether
the combination of exercise with increased dietary protein or protein
supplementation can improve glycaemic measures in older adults with poorly
controlled T2DM.
One of the challenges when conducting lifestyle-related intervention trials in
individuals with T2DM is that many participants are taking oral hypoglycaemic
medications to maintain their blood glucose levels. Given the marked effect that
these agents have on measures of glycaemic control, it is possible that they may
mask or attenuate any potential beneficial effects of lifestyle-related approaches.
In our study, 70% of the participants were taking a prescribed oral hypoglycaemic
agent at baseline, with an equal proportion within each group. Although the

Chapter 6
Page | 271
number of participants taking such medication did not change significantly in
either group throughout the study (and there was no marked change in dosage),
there was a higher proportion (~10% difference) of participants in the PRT+ProD
group taking oral hypoglycaemic medications at 12- and 24-weeks. However, this
is unlikely to have influenced the findings as all results remained unchanged after
adjusting for the use of oral hypoglycaemic medications, and secondary analysis
revealed that there was no interaction by diabetes management (lifestyle alone
versus medication) for any of the glycaemic outcome measures. However, given
the small number of participants that were managing their diabetes through
lifestyle approaches alone, it is likely that we were underpowered to detect any
potential added benefits of the whey protein supplement on PRT related changes
in glycaemic outcomes in this subgroup.
As already indicated, there is considerable evidence supporting an insulinotropic
effect of protein, but whether there is an optimal level of intake (intake at
g/kg/day) or dose of protein necessary to cause this effect and improve glycaemic
control or enhance the glycaemic improvements of PRT over the long-term
remains uncertain. Yet the findings from various acute studies indicate that there
are positive effects on postprandial glucose levels and insulin secretion with 10 to
55 g of whey protein provided with a meal or pre-meal (52, 342, 621, 651, 652).
Based on these findings one would anticipate that a 20 g daily dose of whey
protein consumed prior to breakfast and an additional 20 g taken after each PRT
session would be sufficient to elicit a positive response when combined with PRT.
It is possible that the lack of any exercise-protein interaction in our study may
relate to the habitual protein intake of the participants which exceeded 1.1
g/kg/day at baseline (~20% protein). However, the results from a 5-week
randomised, calorie-controlled crossover study in 12 adults with T2DM (mean
HbA1c 8.0%) revealed that a high-protein diet (30% protein) led to a 40%
reduction in the 24-hour glucose area response and a 0.5% absolute greater
reduction in HbA1c (-0.8 vs -0.3%) compared to an isocaloric conventional low-
fat diet (15% protein) (263). A possible reason for the positive effect in this study
by Gannon and colleagues is the large between-group difference in protein intake
(30% vs 15%). However, in our study similar between-group differences were

Chapter 6
Page | 272
observed. The average protein intake (diet plus supplement) differed by
approximately 10-18% and 26-35% on the non-training and training days,
respectively. Another potential explanation may be that older adults with T2DM
require a higher dose of protein to experience a similar response. Indeed, several
acute studies have shown that 50 to 55 g of whey protein consumed prior to a
meal significantly improved postprandial glycaemia in adults with T2DM (342,
379), although others have reported that a dose of ~20-25g is also effective (341,
653). Further research is needed in adults with T2DM to evaluate the effects of
whey protein alone and combined with PRT on long-term glycaemic control.
Contrary to the findings from many acute studies examining the effects of whey
protein on insulin responses, we found that there was a significant reduction in
serum insulin concentrations in the PRT+ProD group after 12- and 24-weeks,
which differed from the changes in the PRT group after adjusting for baseline
values. In line with these findings, a 12-week study in overweight and obese
adults found that daily consumption of 55 g of whey protein resulted in a
significant 10-11% reduction in plasma insulin concentrations (351). However,
unlike the findings from our trial this study by Pal and colleagues also detected a
significant decrease in HOMA assessed insulin resistance, suggesting that there
was an improvement in long-term insulin sensitivity. While a number of previous
intervention trials ranging from 12- to 36-weeks in healthy older adults and those
with metabolic syndrome or T2DM have reported a significant reduction in serum
insulin levels following increased dietary protein or whey protein
supplementation with and without exercise, none of these studies observed an
added benefit of protein combined with exercise or between-group differences
when different doses of protein were combined with exercise (285, 286, 520,
648). Furthermore, secondary analysis of a 36-week trial in overweight and obese
adults who performed resistance and aerobic exercise twice weekly and were
supplemented with either 0, 20, 40 or 60 g per day of whey protein found that
neither total protein intake nor the change in protein intake expressed as g/kg/day
throughout the study was associated with changes in insulin, HOMA-IR or insulin
sensitivity (494). The finding that there was a greater reduction in insulin levels in
the PRT+ProD group in our study may be explained, in part, by the higher level

Chapter 6
Page | 273
of adherence to the training as there is some evidence that training volume is
related to the magnitude of decrease in serum insulin concentrations (654).
Furthermore, since there was a decrease in C-peptide levels in the PRT+ProD
group, which provides a measure of insulin secretion, this suggests that the
decrease in insulin was driven by a reduction in insulin secretion. However, the
clinical significance of these changes remains uncertain given that there were no
significant long-term benefits on insulin sensitivity.
Increased levels of pro-inflammatory markers (e.g. hs-CRP, IL-6 and TNF-α)
have also been associated with poor glycaemic control in adults with T2DM
(525). While there is some data showing that PRT-related improvements in
inflammatory markers in older overweight adults coincide with improvements in
insulin resistance and/or glycaemic control (236, 237, 555), from the limited data
available (most studies have only measured hs-CRP) there appears to be no
evidence that increasing protein intake or protein supplementation can enhance
this response (285, 286). However, in our study there was a significant increase in
the level of the anti-inflammatory marker IL-10 in the PRT+ProD compared to
PRT group, but this was also associated with a greater increase in the pro-
inflammatory marker IL-8 at week 12. It is difficult to explain these findings,
particularly as there was little shift in the remaining pro- and anti- inflammatory
markers (adiponectin, IL-6, hs-CRP) in either group, which may be related to the
modest reductions in fat mass, a well-known contributor to increased
inflammation. Given these mixed findings, it is possible that the lack of a more
systemic between-group difference or improvement in the various inflammatory
markers in our study may have contributed to the lack of any between-group
differences in the glycaemic outcome measures, but this requires further study.
Evidence exists to support a direct relationship between serum 25(OH)D
concentrations and insulin sensitivity and HbA1c (634, 655, 656). Further,
correcting vitamin D deficiency with supplementation has been shown to improve
insulin sensitivity in some studies (657, 658), However, as reviewed by others,
the evidence from intervention trials assessing the effects of vitamin D
supplementation on glycaemic outcomes in adults with normal glucose tolerance

Chapter 6
Page | 274
and people with T2DM remained mixed (659) with any potential benefits likely to
be most prominent in people with prediabetes and insufficient/deficient baseline
serum 25(OH)D levels (571). In our study, the mean baseline serum 25(OH)D
level of the participants in the PRT+ProD and PRT group was well within the
normal range (mean 75 and 69 nmol/L, respectively); only 19% of participants
had a level below 50 nmol/L which some consider insufficient. Although
treatment with 2,000 IU daily increased serum 25(OH)D levels by an average of
28 nmol/L after 6-months, given that adequate basal serum 25(OH)D levels (and
HbA1c status) it is unlikely that such an increase provided any added benefits. If
vitamin D treatment does influence glycaemic measures in adults T2DM, further
research is still needed to determine if there is an optimal dose and serum
25(OH)D concentration that is likely to provide any benefits, and whether it is
restricted to those with poorly controlled diabetes.
Despite the lack of any significant exercise-protein-vitamin D interaction on the
glycaemic outcome measures, there was a significant 0.13% to 0.15% absolute
reduction in HbA1c in both the PRT+ProD and PRT group after 12-weeks, which
tended to persist in both groups after 24-weeks. Over the past two decades, there
have been many intervention trials and subsequent meta-analyses which have
reported that PRT, particularly supervised and structured in well controlled
laboratory, clinic or gymnasium settings, can improve glycaemic control and/or
insulin sensitivity in people with T2DM (12, 157, 203, 212, 228, 612, 660). In the
most recent meta-analysis of PRT trials of at least 8-weeks duration in older
adults aged at least 60 years with T2DM (n=8), Lee et al. (660) found that PRT
significantly lowered (absolute reduction) HbA1c by 0.50%. Other meta-analyses
have reported similar absolute mean 0.34% to 0.57% improvements in HbA1c
following PRT (227, 228), although it was noted that there was considerable
heterogeneity among the studies. Nevertheless, these changes are considerably
greater than the mean changes observed in our study, which may be explained by
a number of factors, including the baseline HbA1c status of our participants.
Subgroup analysis from several previous meta-analyses have shown that
participants with higher baseline HbA1c levels (>7.0 or 7.5%) experience greater
PRT-related improvements when compared with those with baseline levels below

Chapter 6
Page | 275
these cut-points (8, 228, 661). Thus, the modest reductions observed in our study
are likely related to the fact that the mean basal HbA1c levels of the participants in
the PRT+ProD and PRT group was 6.9 and 7.1%, respectively. However, it is
worth noting that no significant interaction by baseline HbA1c status (≤7 vs >7%)
was observed in our study, but less than half of all participants had a baseline
HbA1c level >7%.
Another likely explanation for the modest improvements in our study was that the
PRT program was conducted across 80 different local health and fitness and not
within a controlled clinical setting. Although all participants were enrolled within
the community-based Lift for Life® program, which is a structured PRT program
based on evidence from clinical trials that is implemented and supervised by
exercise trainers who have received specialised training as part of the Lift for
Life® accreditation process, it was not possible to control or standardise the
prescription of exercise across all facilities. A previous cluster RCT examining
the effectiveness of the standard compared to an enhanced behaviourally focused
Lift for Life® program in overweight adults and those with T2DM reported no
changes in HbA1c following the standard program and a modest net 0.13%
absolute improvement after 24-weeks in those who received the enhanced
program; when the analysis was restricted to those participants with T2DM the
net benefit was 0.3% (662). On this basis, it is difficult to explain why such
modest improvements were observed in HbA1c in our cohort of overweight and
obese adults with T2DM.
A previous meta-analysis of community-based physical activity interventions for
adults with T2DM reported a trend toward a lowering of HbA1c (mean -0.32%,
P<0.06) (23), but another meta-analysis found that structured exercise training of
>150 minutes per week was associated with greater reductions in HbA1c in adults
with T2DM than that of ≤150 minutes per week (227). While neither of these
studies focused specifically on PRT, the findings from several meta-analyses have
indicated that the characteristics of PRT programs (volume, intensity, frequency
or duration) appear to have little influence on the changes in HbA1c or other
related measures (227, 228, 660). While this may be due to the similarity in the

Chapter 6
Page | 276
design of many of the previous PRT programs, a potential explanation for the
small improvements in glycaemic control in our study may relate to the adherence
to the training (PRT+ProD 68%; PRT 58%). However, this still equates to
approximately two out of three PRT sessions per week, which is in line with most
current exercise guidelines for people with T2DM. An alternative reason for the
small improvements in HbA1c in our study may relate to the relatively modest
gains in lean mass (mean 0.4 to 0.5 kg), which was lower than that observed in
another laboratory clinical trials which observed greater benefits on glycaemic
control (12). However, as indicated earlier there is some evidence that PRT-
related reductions in HbA1c can occur without any marked changes in lean mass
(660, 663).
The cessation of a single bout of PRT/exercise causes improvements in both
glucose disposal and metabolism which may last for several hours or possibly
days (664). Due to this it is unknown whether the improvements typically
observed in insulin sensitivity following exercise training in those with T2DM is
due to the accumulative effects of the individual exercise sessions or an
adaptation induced from long-term training (665). To avoid any residual effect of
the final PRT session on FPG and insulin levels, participants in our trial were
instructed to provide a fasted blood sample at least 48-hours following their last
PRT session. It is possible that this timing may explain the lack of a significant
difference between the PRT+ProD and PRT groups in FPG and insulin sensitivity
as assessed by the HOMA model. It is also possible that the major effect of the
PRT program was on postprandial glucose and insulin sensitivity which were not
assessed but are dependent on muscle insulin sensitivity.
In summary, this study indicates that a community-based PRT intervention in
older adults with T2DM was associated with modest improvements HbA1c, but
there no evidence of any added benefits of whey protein and vitamin D treatment
on either glycaemic control or insulin sensitivity.

Chapter 6
Page | 277
6.7.4 Effects of PRT, Whey Protein and Vitamin D on Blood Pressure and
Lipids
Despite reports from some reviews and meta-analyses that PRT, high protein diets
and supplementation with whey/dairy proteins or vitamin D can improve various
cardiovascular outcomes (38, 212, 333, 659, 666-670), few intervention trials
have investigated whether such nutritional approaches can provide additive
benefits to exercise in people with T2DM. In our 6-month RCT in older
overweight and obese adults with T2DM, we found that there was no additive
benefits of daily whey protein and vitamin D supplementation to a community-
based PRT program on any cardiovascular outcomes. After 24-weeks there were
similar significant reductions in DBP in both groups along with a small reduction
in total cholesterol and LDL cholesterol in the PRT+ProD group at 12-weeks, but
these benefits were not maintained to 24-weeks. The reason(s) why we did not
observe more meaningful improvements in these outcomes following either PRT
alone or PRT in combination with whey protein and vitamin D supplements may
be due to a number of factors, including the small changes in weight and fat mass,
the relatively high proportion of participants taking anti-hypertensive and lipid-
lowering medication, the basal blood pressure and lipid levels of the participants,
the adequate basal dietary protein and serum 25(OH)D status of participants
and/or differences in the adherence to the intervention. Indeed, per-protocol
analysis of participants who achieved ≥66% compliance with the PRT program
and ≥80% compliance with the whey protein and vitamin D supplements revealed
that the PRT+ProD group experienced a significantly greater reduction in both
total cholesterol and LDL cholesterol after 24-weeks compared to the PRT alone.
In line with the findings from the intention-to-treat analysis of our 6-month trial,
several previous intervention trials in older overweight adults and those with
metabolic syndrome or T2DM have failed to detect any added benefits of whey
protein supplementation or increased dietary protein in combination with PRT on
change in cholesterol or lipid profiles and blood pressure compared to PRT alone
(42, 284-286, 513, 648, 671). The lack of an interactive effect in our study and
many of these previous trials is likely related to the fact that most participants had
baseline lipid and/or blood pressure profiles within the normal healthy range. In
Chapter 6
Page | 278
addition, more than 50% of participants in our study were taking anti-
hypertensive or lipid-lowering medication, which may attenuate any potential
benefits. We detected no interaction by use of lipid-lowering or anti-hypertensive
medication in our study for any blood pressure or lipid profile measure and like
our findings one 12-week trial in 28 overweight men with hyperlipidaemia also
failed to detect any added benefit of 26.6 g per day of whey protein combined
with PRT on blood lipids levels compared to PRT alone (671). While this may be
related to the small sample size in the previous study, an alternative explanation is
that a higher dose of whey protein may be needed to elicit a positive response.
Subgroup analysis of a previous meta-analysis of 13 RCTs found that the effects
of whey protein (without exercise) on serum triglyceride levels were greatest at
doses of ≥30 g (670). Moreover, a 12-week non-exercise trial in overweight and
obese adults (not taking lipid-lowering or anti-hypertensive medication)
demonstrated that supplementation with 27 g of whey protein isolate twice daily
(total 54 g per day) decreased total cholesterol and LDL cholesterol compared to
either casein and a control group (351). In part support of these findings, the per
protocol analysis in our study revealed that participants who were ≥80%
compliant with the whey protein and vitamin D supplements (and ≥66%
compliant with PRT) experienced a significantly greater reduction in total
cholesterol and LDL cholesterol compared to the non-supplemented group.
Interestingly however, the mean daily protein intakes after 12- and 24-weeks in
the PRT+ProD group increased by only 15 and 7 g and 34 and 26 g relative to
baseline on the non-training and training days, respectively. While further
research is still needed to determine if there is an optimal dose of protein to
enhance cardiovascular health outcomes, secondary analysis of a previous 36-
week exercise-whey protein supplementation trial in middle-aged overweight and
obese adults revealed that neither total protein intake (mean 1.18 g/kg/day) or
change in protein intake (mean 0.15 g/kg/day) throughout the study combined
with exercise were associated with changes in any cardiovascular index (blood
pressure or lipid measures) (494).

Chapter 6
Page | 279
We hypothesised that combining a whey protein drink with vitamin D
supplements would provide added benefits to PRT on cardiovascular risk factors.
To our knowledge, no previous studies have examined the effects of additional
protein plus vitamin D treatment with PRT with both protein and vitamin D on
blood pressure or lipids levels in older adults or those with T2DM. However, data
from a 12-week trial in vitamin D deficient elderly women discussed already in
section 2.11.1 was more effective at lowering blood lipids than either exercise or
vitamin D alone or even controls (502). Thus, in our study the lack of any additive
benefits of the vitamin D (plus protein) supplementation with PRT on blood
pressure or serum lipid measures may be related to the fact that a large proportion
of the participants had serum 25(OH)D levels that would be considered sufficient
(>50 nmol/L). Interestingly, a 20-week RCT in 130 hypertensive patients found
that 3,000 IU cholecalciferol per day had no effect on blood pressure, but
subgroup analysis revealed that participants with 25(OH)D levels <80 nmol/L did
experience a decrease in blood pressure (672). Whether there is an optimal serum
25(OH)D concentration to improve cardiovascular health outcomes remains
uncertain, but other long-term trials where participants had insufficient/deficient
levels of serum 25(OH)D levels (<30 nmol/L) have more consistently
demonstrated improvements in cardiovascular health following vitamin D
supplementation, including SBP and/or lipid measures (177, 502)
In older adults with T2DM the findings from two meta-analyses of RCTs have
reported a positive effect of PRT on blood pressure (212, 673). In our study, there
was a similar significant mean 2.4 to 2.6 mmHg reduction in DBP in both groups
after 24-weeks; SBP also decreased by an average of 2.4 mmHg in the PRT and
2.6 mmHg in the PRT+ProD group, but these within-group changes were not
statistically significant (P=0.08 and P=0.10, respectively). Nevertheless, a
previous meta-analysis of RCTs of blood pressure lowering regimens reported
that a reduction in SBP and DBP of 2.1 and 0.9 mmHg was associated with a 10%
reduced risk of major cardiovascular events (674). While this suggests that the
changes in our study are clinically meaningful, the magnitude of the changes were
slightly lower than these weighted mean differences of -4.44 mmHg for SBP and
-2.84 mmHg for DBP between PRT and controls from a meta-analysis of 10

Chapter 6
Page | 280
interventions in adults with T2DM (247). The reason(s) for these differences,
particularly regarding SBP, may relate to the modest mean 0.6 to 0.9 kg
reductions in total body fat mass in both groups in our study. Indeed, the findings
from a meta-analysis of 6,754 participants in 11 studies examining the effects of
weight loss from lifestyle interventions (diet and/or physical activity) over 12-
months on blood pressure in overweight and obese adults with T2DM found that
less than 5% weight loss was not associated with any marked improvements
(675). Other potential reasons for the modest improvements in blood pressure in
our study may relate to the implementation of the PRT within community-based
facilities which may have contributed to marked inter-individual variability in the
training intensity, the finding that only 44% of participants in the study were
classified as hypertensive based on SBP (≥140 mmHg) and/or DBP (≥90 mmHg)
and/or that more than 50% of the participants were taking anti-hypertensive
medication. However, subgroup analysis of several meta-analysis has found that
any between group differences for the change in blood pressure following PRT
were not related to either baseline blood pressure level or training intensity (228,
247), but there is some evidence that structured and longer duration programs
(>40-weeks) are most effective for improving blood pressure (676).
With regard to the effects of our PRT program on blood lipid levels, we found
that there were no marked benefits in either group after 24-weeks, despite some
initial benefits in the PRT+ProD group after 12-weeks. This appears to be in
contrast with the findings from a 2014 meta-analysis comparing aerobic and PRT
interventions in adults with T2DM which reported significant improvements in
total cholesterol, LDL cholesterol and triglycerides following PRT; there was no
effect of PRT on HDL cholesterol (212). There are likely to be a number of
factors that contributed to the lack of any improvements in blood lipids levels
following our 24-week PRT intervention. First, the baseline blood lipid profiles of
the participants in our study were generally within the healthy range; for each
lipid measure 60 to 83% of participants were classified as ‘normal’. In a previous
6-month RCT in older overweight and obese adults with T2DM with mean basal
lipid levels generally within the healthy range, Dunstan et al. (12) found that high-
intensity PRT combined with moderate weight loss had no effect on any blood

Chapter 6
Page | 281
lipid measure. Second, more than 50% of the participants in our study were taking
lipid-lowering medication, although no interaction by lipid-lowering medication
use was detected for any measure which may again be related to the basal lipid
profiles of our participants. Finally, the magnitude of the change (loss) in weight
and fat mass in our study was small. Previous research has shown that reductions
in weight of less than 5% following PRT or a multi-modal exercise program
failed to alter blood lipid levels in older adults with T2DM in interventions lasting
from 22-weeks to 24-months (8, 677).
6.7.5 Effects of PRT, Whey Protein and Vitamin D on Markers of
Inflammation
Since T2DM has been associated with chronic low grade systemic inflammation
which has been linked to poor glycaemic control and an increased risk of
diabetes-related complications, there has been considerable interest in identifying
strategies to improve the inflammatory profile of people with this condition.
There is emerging evidence that PRT (230, 244), vitamin D supplementation
(678) and dairy or whey protein supplementation (325, 326) may improve various
circulating pro- and/or anti- inflammatory markers in older adults and those with
T2DM, but whether the combination of vitamin D and whey protein
supplementation interact to enhance the effects of exercise on inflammatory
markers remains uncertain. In our 24-week RCT in overweight and obese adults
with T2DM, we observed mixed effects for the combination of PRT with whey
protein and vitamin D supplementation compared to PRT alone on various
circulating inflammatory markers. There was a significantly greater increase in
the anti-inflammatory marker IL-10 in the PRT+ProD compared to PRT group
after 12- and 24-weeks. While there were no significant between group
differences for the change in hs-CRP, TNF-α, adiponectin, IL-8 or IL-6 after 24-
weeks, an interesting observation was that all inflammatory markers tended to
increase relative to baseline in the PRT plus supplemented group and decrease in
the PRT group.
While it is difficult to explain the contrasting findings from our study and the
clinical relevance of the results, the most profound changes and between-group

Chapter 6
Page | 282
differences were for the anti-inflammatory marker IL-10 which increased in the
PRT+ProD group and decreased in the PRT group. A previous 16-week
intervention in free living overweight/obese adults found that whey protein
supplementation (20 g three times per day) combined with either PRT or a
multimodal exercise program (4 times per week) increased serum adiponectin
levels, another anti-inflammatory cytokine, by 18 to 23% compared to protein
supplementation alone (-6% change) (520). However, since there was no exercise
alone group in this study it is difficult to compare these findings with our results.
The reason(s) why some circulating inflammatory cytokines appear to improve
and others do not change in response to a given intervention remains uncertain,
particularly given that many cytokines (e.g., IL-6, TNF-α, adiponectin) are
produced at the same site (e.g. adipose tissue) and the pro-inflammatory markers
IL-6 and TNF-α are known to induce hepatic production of hs-CRP. Nevertheless,
this mixed response is a consistent observation from many previous exercise
and/or nutrition interventions (679-681).
One of the most common inflammatory markers that has been measured in many
previous exercise and nutrition interventions is the pro-inflammatory cytokine hs-
CRP. The inflammatory marker hs-CRP is a substance produced by the liver that
increases in the presence of inflammation in the body, and has been linked to
cardiovascular disease (682-684). In our study, hs-CRP levels did not change or
differ between the groups at any time throughout the 24-week intervention.
Consistent with these results, several previous intervention trials in
overweight/obese adults or those with T2DM reported that increased dietary
protein (286), whey protein supplementation (285) or vitamin D supplementation
(685) did not augment the effects of PRT on serum hs-CRP levels. This may be
due in part, to the fact that baseline hs-CRP levels were not elevated (only 19% of
participants in our study had an hs-CRP level >3 mg/L which is considered high).
Indeed, subgroup analysis of a 2015 meta-analysis reported that there was a small,
but significant effect of whey protein on lowering serum hs-CRP levels in those
with baseline values ≥3 mg/L (326). However, a 12-week study in 130 sarcopenic
elderly people with apparently normal hs-CRP levels found that there was still a
significant net benefit on hs-CRP levels following supplementation with a multi-

Chapter 6
Page | 283
nutrient drink containing whey protein (22 g), essential amino acids (10.9 g,
including 4 g leucine) and vitamin D (100 IU/day) in combination with a
moderate-intensity strength and balance exercise program (5 days per week)
compared to exercise plus placebo (513). This was due to a non-significant
reduction in the supplement group (P=0.329) and a non-significant increase
(P=0.061) in the placebo group. Unfortunately, nearly all the above trials did not
measure other pro- or anti-inflammatory cytokines, and thus it is not possible to
determine whether exercise combined with increased protein and/or vitamin D
has an effect on improving systemic inflammatory markers. However, the
findings from a 3-month intervention in 36 patients with chronic obstructive
pulmonary disease found that circulating levels of TNF-α, IL-6 and IL-8 all
decreased significantly after daily consumption of a whey protein enriched drink
combined with a low-intensity exercise program compared with those in the
control group, which may be related in part, to the elevated levels of inflammation
at baseline (386).
In overweight/obese adults previous research has consistently shown that diet
induced weight loss has a positive effect on lowering circulating pro-
inflammatory markers and increasing anti-inflammatory cytokines (549, 686,
687). Given that there was a significant, albeit modest, similar reduction in
weight, fat mass and waist circumference in both groups in our study, it is
somewhat surprising that we did not see consistent reductions in the measured
pro-inflammatory cytokines after 24-weeks, particularly in the PRT+ProD group
as exercise adherence was significantly higher in this group. Indeed, a 4-month
RCT in elderly women found that PRT combined with a protein enriched diet
achieved through the consumption of lean red meat (daily protein intake of ~1.3
g/kg/day) was associated with a 16% significantly greater reduction in the pro-
inflammatory marker IL-6 compared to PRT alone (42). Consistent with our
findings however, was the observation that there was no effect on any other pro-
or anti-inflammatory markers including TNF-α (42). Peake et al. (569) reported a
trend for an increase in serum IL-6 concentrations in older men following
supplementation with calcium-vitamin D fortified milk for 18-months, but this
was attenuated after adjusting for changes in fat mass. In our study, all results

Chapter 6
Page | 284
remained unchanged after including total body fat mass in the model. Based on
these mixed findings, further research is warranted to evaluate if there are any
potential additive or synergistic effects of exercise with various nutritional factors
on a range of circulating systemic markers of inflammation.
6.8 Strengths and Limitations
The strengths of this study lie in its randomised controlled design, the 24-week
intervention period, the large sample size of older adults with T2DM, the high
retention rate (85%), the low number of adverse events associated with the
intervention, and the successful implementation of the intervention within the
community. However, there are a number of limitations which may help to
explain some of the findings from this trial.
First, the older men and women with T2DM recruited to this trial had an average
HbA1c level of 7.0% which is indicative of good glycaemic control. Further,
around 70% of the participants were prescribed oral anti-hyperglycaemic
medication to manage their T2DM. Similarly, many had blood pressure and lipid
levels within the normal range which may also be explained by the high
proportion of participants taking anti-hypertensive and lipid-lowering medication.
In addition, mean dietary protein intakes and vitamin D status were adequate at
baseline based upon current recommendations. Collectively, these factors may
have limited the ability to detect potential improvements or between group
differences with the intervention.
Second, the PRT program was implemented across 80 different health and fitness
centres throughout Melbourne and surrounding regions. This was more sites than
originally we had planned but it was a necessity that we expand to this many
training sites when recruitment slowed. Mean adherence to the exercise program
averaged 63% which is equivalent to approximately two sessions out of the
prescribed three per week. This level of adherence is comparable or slightly lower
to that reported in many other PRT interventions over a similar period in older
adults and those with T2DM, even when training was performed under a
supervised laboratory based setting (42, 514). However, the fact that participants

Chapter 6
Page | 285
exercised at 80 different health and fitness centres across Melbourne and
surrounding regions with each location having their own exercise trainers made it
difficult to ensure consistency with regard to the prescription of exercise across
all programs. However, we did attempt to control for this variability by having all
trainers attend a two-day training workshop prior to any participants being
allocated to their respective training location. Similarly, the intensity of training
(or each exercise) was recorded using the RPE scale, but since this is a subjective
rather than a quantifiable measure it is possible that the intensity of training
between individuals varied considerably. However, the collection of the exercise
cards monthly for review by trial staff meant any drop in self-reported intensity
was readily observed and promptly rectified. In addition, the PRT program
consisted of equal parts upper and lower body exercises, however, given the
lower body has some of the largest muscle groups it is possible that the training
program underemphasised major muscle groups of the hips and legs. This
limitation in the design of the PRT program inadvertently may have had an
impact on the change in strength, body composition and even glycaemic control.
Third, a placebo or energy matched control drink was not used in this trial as it
became evident during the initial establishment phase of the study that the
ingredients used to develop such a placebo product had the potential to alter blood
glucose levels or influence muscle mass which were the two key outcomes of this
trial. The absence of a placebo or energy matched drink meant participants were
not blinded to which treatment group they were in which could have created a
certain bias towards performing the PRT program in the study or that the non-
supplemented group may have increased their protein and/or vitamin D intake.
However, the findings from the dietary analysis indicate that this did not occur. In
addition, the supplement may have also acted as an incentive to perform the PRT
program, which may possibly explain the significantly higher adherence to the
training in the PRT+ProD group. Also, the glycaemic effects of meals adjacent to
the consumption of the protein supplement was not considered and is a limitation
of our analysis. For instance, a 25 g bolus of protein consumed prior to a high
carbohydrate meal has been associated with marked reductions in postprandial
glycaemia in both acute and long-term settings (688). Fourth, we were not able to

Chapter 6
Page | 286
assess the distinct effects of the vitamin D supplements from the whey protein
drink, as we did not have a whey protein plus PRT or vitamin D plus PRT group
which would have allowed such a comparison. However, the inclusion of a
protein-vitamin D supplement group would have further increased the sample
size, and this study was designed to specifically evaluate whether whey protein
plus vitamin D could enhance the health benefits of PRT.
Fifth, there were also some limitations related to the outcomes measured and the
procedures used during our data collection. To assess insulin sensitivity, we relied
on the commonly used HOMA2%S formula which requires only FPG and insulin
concentrations to be measured. We acknowledge that this method is more variable
compared to the euglycaemic hyperinsulinaemic clamp method (689, 690) and is
more reflective of hepatic as opposed to muscular insulin sensitivity (691, 692).
However, performing euglycaemic hyperinsulinaemic clamps on all participants
on three occasions over the 24-week intervention period would not have been
feasible. Furthermore, previous studies have confirmed that the HOMA-2 method
for assessing insulin sensitivity/resistance is precise, reproducible and strongly
correlated to the results achieved by the glucose clamp technique (690). Another
potential limitation is the use of a 24-hour dietary recall to assess habitual dietary
intakes. Assessment of dietary intake is typically difficult with several
opportunities for misreporting of energy intake; typically, these include conscious
underreporting, undereating if the food recall is planned, respondent memory
lapses and misrepresentation of portion sizes (693). Further, misreporting (either
over- or under-reporting) has been found to occur more commonly in those with a
BMI >25 kg/m2, females compared to males and those of older age are also more
likely to misreport their energy intake (typically under-reporting as opposed to
over-reporting) (693). Despite these limitations, this dietary assessment technique
was the most appropriate for our trial given the large sample size and length of the
intervention. Further, when completing the 24-hour food recalls, we consistently
used a food model booklet with a clear description of portion-size measurements
and many household items (glasses, mugs etc.) to accurately estimate food,
energy and nutrient intake. Further, all trial staff conducting the food recalls and
subsequently entering this information into FoodWorks Professional (Version 8,

Chapter 6
Page | 287
Xyris Software, Queensland, Australia) to calculate total dietary energy intake
and dietary macronutrient composition were all highly trained and experienced in
performing such assessments.
Finally, not all research staff involved in the testing were blinded to the group
allocation, which may have introduced some observational bias. However, staff
who were not blinded were not involved in outcome assessments which could
have been altered based on this knowledge. Further, staff performing the
statistical analysis in this trial were blinded to treatment allocation.
6.9 Conclusion
In conclusion, this study has demonstrated that PRT improved glycaemic control,
total body and regional (arm and leg) lean mass, thigh muscle size, upper and
lower body muscle strength, waist circumference, fat mass, percentage body fat
and DBP. However the addition of 20 g of daily whey protein supplementation
with a further 20 g consumed following each PRT session (2 to 3 times per week)
with 2,000 IU of daily vitamin D did not enhance the effects of PRT on total body
or regional lean mass, fat mass, glycaemic control, insulin sensitivity or
cardiovascular risk factors in older overweight and obese adults with type 2
diabetes. While there was a greater beneficial effect of PRT combined with whey
protein and vitamin D relative to PRT alone on the anti-inflammatory marker IL-
10, there were no between group differences in any other pro- or anti-
inflammatory markers, and thus the clinical relevance of these findings are
unclear. Despite the lack of any consistent additive benefits following the
intention-to-treat analysis, secondary pre-planned analysis revealed that those
who achieved (≥66% exercise adherence) in upper body muscle strength and
serum IL-6, and a greater reduction in total cholesterol and LDL cholesterol.
While these findings must be interpreted with caution, they provide some
evidence that supplementation with whey-protein and vitamin D may provide
some added benefits to PRT in older overweight and obese adults with T2DM.
Another key finding from our intervention was that the community-based Lift for
Life® PRT program used in this study was safe and succesfully improved
glycaemic control, total body and regional (arm and leg) lean mass, thigh muscle

Chapter 6
Page | 288
size, upper and lower body muscle strength, waist circumference, fat mass,
percentage body fat and DBP. Importantly, there were no serious adverse events
associated with the intervention, and kidney function (eGFR) improved
significantly in both groups. Collectively, these findings add to the growing body
of literature to support the role of exercise, particularly PRT, as a safe, feasible,
and effective approach to improve multiple clinical risk factors associated with
T2DM in older overweight and obese adults with this condition.

Page | 289
Chapter 7
Summary, Conclusion and Future Recommendations

Chapter 7
Page | 290
7.1 Summary
Lifestyle management focusing on regular exercise and nutrition is the first line in
the treatment of older adults with type 2 diabetes mellitus (T2DM) (5, 6). Optimising
lean mass is critical for those with this condition, particularly older adults with
T2DM, as this is the largest mass of insulin-sensitive tissue and the predominant
reservoir for glucose disposal (9). Supervised and structured high-intensity PRT
programs in controlled laboratory settings have been found to be safe, well-tolerated
and effective for improving glycaemic control as well as lean mass, size and strength
in older adults with T2DM (8, 12, 14, 204, 212, 225, 250, 612). There is also some
evidence that exercise alone, including PRT, or combined with weight loss can
improve various cardiovascular risk factors, including blood pressure, lipids and
various circulating inflammatory markers. This is important because increased
inflammation has been implicated in the pathophysiology of insulin resistance and
several comorbidities associated with this condition including CVD (22). Whether
these same benefits can be achieved by participating in ‘real-world’ community
based PRT interventions has received less attention.
Dietary or nutritional modification in addition to physical activity is also an integral
component in the management of T2DM. Yet the most appropriate diet or
macronutrient distribution for the management of T2DM remains a continued topic
of debate among peak health authorities. Traditionally, caloric restriction is
recommended for those with T2DM due to the beneficial effects on body weight and
fat mass, however such an approach has been associated with poor long-term
adherence and weight re-gain. Further, whether caloric restriction plus PRT can
influence markers of systemic inflammation in older adults with T2DM remains
uncertain. In recent years, novel dietary approaches focusing on alternate macro- and
micronutrients including protein and vitamin D, alone or in combination with
exercise/PRT have been proposed as potential nutritional strategies to improve
several health outcomes in those with T2DM. This is largely driven by the findings
from acute studies demonstrating that these dietary factors alone, particularly protein,
or combined with exercise, can have a positive effect on MPS and stimulate beta-
cells of the pancreas to secrete insulin. However, few long-term human intervention

Chapter 7
Page | 291
trials in adults with T2DM have investigated whether such a combination transcribe
into measurable health outcomes. Thus, the aim of this thesis was to investigate if
lifestyle strategies such as caloric restriction, to promote weight loss, or nutritional
supplementation with protein and vitamin D, in combination with exercise/PRT
could promote greater improvements in glycaemic control, body composition,
cardiovascular related risk factors and systemic inflammation compared to PRT
alone in older overweight and obese adults with T2DM.
The specific aims are:
1. To compare the effect of PRT plus a moderate weight loss program versus
weight loss alone on systemic and endothelial markers of inflammation in
older overweight adults with T2DM (Chapter 3).
2. To report on the challenges of recruiting older adults with T2DM into a 6-
month community-based PRT and nutrition program along with reporting on
strategies which successfully resulted in participants randomised to the
intervention (Chapter 5).
3. To investigate whether ingestion of a daily whey-protein drink in
combination with vitamin D supplementation can enhance the effects of a
community-based PRT program on glycaemic control and insulin sensitivity
in older adults with T2DM (Chapter 6).
4. To examine whether a community-based PRT program combined with a
whey-protein drink and vitamin D supplementation is more effective for
enhancing total body and regional lean mass, muscle cross-sectional area
(CSA), muscle strength and reducing inter-/intra-muscular fat infiltration,
than PRT alone in older adults with T2DM (Chapter 6).
5. To compare the effects of a community-based PRT program combined with
whey-protein and vitamin D supplementation versus PRT alone, on
cardiovascular risk factors, including blood pressure and blood lipid levels,
and pro-inflammatory and anti-inflammatory cytokines. (Chapter 6).

Chapter 7
Page | 292
While the discussion sections within each previous chapter (3-6) consider the
limitations and methodological issues specific to these studies, section 7.2 below will
focus on the key research findings, limitations and corresponding directions for
future research arising from the studies in this thesis. This chapter closes with the
overarching clinical and public health implications of this research and a final
summary and conclusion for this thesis (section 7.3)
7.2 Key Research Findings, Limitations and Directions for Future Research
Below is a brief summary of the key findings from this thesis
1. Recruitment of older adults with T2DM into a community-based exercise and
nutrition intervention trial took longer than anticipated, was costly, required
continual sustained efforts and necessitated flexibility within the recruitment
strategies used to ensure the final target was achieved. Overall, 1,157
expressions of interest (EOI) were received over a 21-month period from which
959 (83%) individuals were screened and found to be ineligible for the trial or
chose not to participate. A total of 198 participants were deemed to be eligible
and randomised to the 24-week intervention. The most effective recruitment
strategies were targeted mass mail-outs (39% of the total participant sample) and
state (27%) print media. These strategies were also the most expensive each
accounting for 38% of total expenditure. Recruitment expenditure totalled
AUD$40,421, which equated to AUD$35 per enquiry and AUD$204 per eligible
participant.
2. Resistance training performed under supervised, clinically controlled and
structured settings or within local community-based facilities can improve
several clinically relevant outcomes important for adults with T2DM, including
lean mass, glycaemic control and muscular strength whilst also reducing fat
mass, DBP and some systemic markers of inflammation. However, the greatest
benefits were associated within the highly-controlled settings. Home-based PRT
program was largely ineffective at maintaining body composition and glycaemic
improvements gained under a supervised-laboratory controlled environment with
only slight improvements in some systemic markers of inflammation observed.

Chapter 7
Page | 293
3. Six-months of weight loss combined with high-intensity PRT did not have any
marked effects on any marker of systemic inflammation or endothelial function
in older adults with poorly controlled T2DM, despite reduction in weight and fat
mass and an improvement in lean mass. However, continued participation in
PRT over 12-months, independent of change in weight, was associated with
some improvements in certain inflammatory markers in older overweight adults
with type 2 diabetes.
4. PRT was associated with improved glycaemic control, total body and regional
(arm and leg) lean mass, thigh muscle size, upper and lower body muscle
strength, waist circumference, fat mass, percentage body fat and DBP. The
addition of once to twice daily 20 g of whey protein and 2,000 IU of vitamin D
per day did not further enhance these outcomes. there was a greater reduction in
serum insulin levels and a beneficial effect on the anti-inflammatory marker IL-
10 in the those supplemented with whey protein and vitamin D, the clinical
relevance of these findings remains uncertain given that lack of any additional
benefits on the clinically important outcome measures of glycaemic control and
insulin sensitivity.
5. In older overweight and obese adults who had greater adherence to the
community-based PRT and whey protein-vitamin D supplements there was some
evidence for additive benefits to upper body muscle strength, serum IL-6 and
total cholesterol and LDL cholesterol and to a lesser extent thigh muscle size
(CSA) and arm lean mass compared to those undertaking PRT alone.
This next section discusses these key findings, including their strengths and
limitations, and the corresponding future research directions.
7.2.1 Recruiting ‘at risk’ older adults with T2DM into exercise and nutrition
intervention trials is challenging and expensive
Ineffective or slow recruitment of participants into RCTs can lead to extended study
duration, greater resource usage and findings that are not as statistically precise as
intended if the required sample size is not obtained. A detailed and thorough
description of the recruitment strategies used for the 24-week community-based

Chapter 7
Page | 294
exercise-nutrition trial, the strategies which were successful (and not successful) and
the costs associated with recruiting older adults with T2DM into this trial is reported
in Chapter 5 of this thesis. At present, there is limited available data on successful
recruitment strategies which are suitable for recruiting older adults with a chronic
disease such as T2DM into community-based exercise and nutrition programs.
Further, no information is available on estimated costs associated with such
recruitment, which has important budget implications when planning such trials.
A wide range of recruitment strategies were implemented which included state and
local newspaper and radio advertisements, targeted mail-outs, doctor and allied
health referrals, community presentations, web-based media and word of mouth. Our
consistent monitoring of the effectiveness of strategies implemented and the vast
array of recruitment methods used meant we identified successful methods of
recruitment early and could focus our efforts and funds on such strategies. We found
the most successful and proliferative strategies (e.g. those which resulted in a high
number of expressions of interest and eligible participants and were subsequently
performed multiple times) were targeted mass mail-outs (39% of the total participant
sample), state (27%) and local (15%) print media. A total of 1,157 EOI over a 21-
month period were received for this intervention. Overall 83% of these participants
were deemed to be ineligible or chose not to participate. Physical activity status (e.g.
exceeding the national physical activity guidelines) and medication/supplement use
(e.g. taking vitamin D supplements >500 IU/day or being prescribed insulin for
diabetes management) were the two key reasons why individuals were not eligible
for the trial. A total of 198 participants (21% of all those screened) were found to be
eligible and were randomised to the 24-week intervention.
At present, there is limited literature on successful recruitment strategies suitable for
older adults with T2DM into community based exercise and nutrition programs and
no information on cost estimates. There were several key lessons from our study. We
had originally allocated 12-months for the recruitment for this trial, but this was
extended to 21-months due to the lower than expected success rate from those
screened. The strategies which were successful (targeted mail-outs and state print

Chapter 7
Page | 295
media) were the most expensive. Overall a total AUD$40,421 was spent, which
equated to AUD$35 per enquiry and AUD$204 per eligible participant.
In reporting the challenges, successes, failures and costs associated with recruiting
older adults with T2DM into our trial it is hoped studies in the future can learn from
these experiences and formulate an appropriate timeline of strategies to remain
within budget and trial timelines whilst expediently recruiting the target number of
participants. Whilst our reporting in Chapter 5 of our recruitment strategies and
experiences for our 24-week exercise and nutrition intervention was comprehensive
and methodical, limitations are still present.
Limitations
A limitation of our reporting of the success of recruitment strategies was that only
one recruitment strategy was recorded per EOI received. It is possible given the
numerous strategies we used for this intervention that individuals were exposed to
more than one recruitment strategy. Further, for each EOI received individuals were
informed about the opportunity for monetary re-imbursement equivalent to the Lift
for Life® training costs. Offering payment to clinical research participants, in an
effort to enhance recruitment by providing an incentive to take part or enabling
participants to participate without financial sacrifice, is common. Whether the
opportunity to receive the monetary reward offered in our intervention unduly
influenced participation of some participants or population groups was not addressed
nor recorded and thus cannot be commented on.
Future Recommendations
Other RCTs should report on the success or limitations of their chosen methods of
recruitment on a range of population groups and not just in those with T2DM. Cost-
benefit analysis of all recruitment strategies used should also be reported to help
guide future RCTs recruitment efforts. Further, knowing more about the effect
monetary reimbursement has on decisions to participate in such RCTS among
different age and population groups is required. Whilst we acknowledge that
payment may not be necessary for recruiting participants, particularly those with a
chronic condition such as T2DM who may be motivated to participate by the

Chapter 7
Page | 296
opportunity for therapeutic benefit, if the goal of payment is to reduce the financial
sacrifice that research participants must make and/or to compensate people for their
time, the influence this has on willingness to participate and bias on those who do
participate should be investigated.
7.2.2 Structured and supervised as well as community-based PRT results in
relevant cardiometabolic health improvements important to those with T2DM.
In Chapter 3 of this thesis, secondary analysis was performed on existing data from a
12-month RCT to investigate the effects of supervised high-intensity PRT plus
weight loss (caloric restriction) compared to a weight loss intervention alone had on
systemic and endothelial markers of inflammation in older overweight adults with
poorly controlled T2DM. After the first 6-month supervised phase of training, similar
significant reductions in body weight and fat mass were observed in both groups.
However, the PRT plus weight loss group experienced a net gain in total body lean
mass in comparison to weight loss alone, and a greater absolute improvement in
glycated haemoglobin. Despite these greater net benefits, there were no significant
changes in any markers of systemic inflammation or endothelial function in either
group. Interestingly, 6-months of continued home-based PRT (without weight loss)
was associated with some modest but significant improvements in various
inflammatory markers, suggesting that long-term training may lead to some
beneficial effects on markers of systemic inflammation.
Many previous studies have demonstrated the independent benefits that regular
exercise, including PRT, can have on several health outcomes in people with T2DM,
yet most of these studies to date have been conducted under clinically controlled
supervised gymnasium-based settings with little understanding of the clinical
relevance of a community-based program (8, 12, 154, 203, 207, 215, 216, 220, 224,
227, 566, 694). In Chapter 6, we reported the findings following our 24-week
nutrition and exercise intervention which incorporated whey protein and vitamin D
supplementation plus participation in a community-based PRT program. We
observed significant PRT-related improvements in a number of cardiometabolic
outcomes following this community-based intervention, including HbA1c, fasting

Chapter 7
Page | 297
glucose and insulin levels, waist circumference, upper and lower body muscular
strength, fat mass, lean mass and DBP. Although the magnitude of these health
improvements was considerably less than those achieved in Chapter 3 from the
supervised, clinically controlled PRT gymnasium-based program, it is important to
remember the intervention in Chapter 6 was more representative of a ‘real-world’
PRT program. Community-based programs have the potential to be far wider
reaching and accessed by a greater proportion of the population than those performed
in clinically controlled environments. Thus, the results found in Chapter 6 remain
important as they provide high-level scientific evidence to support a translational
research-to-practice community-based PRT program as a safe, feasible and effective
strategy to improve multiple cardiometabolic health outcomes in older overweight
and obese adults with T2DM.
Despite the strengths of both trials, such as the well-designed and independently
tailored PRT programs, the relatively high level of exercise adherence, the small
number of drop-outs and adverse events related to the PRT program plus the
significant improvements in a range of outcomes measured, these studies were not
without limitations.
Limitations
A limitation of our investigations in both these studies was the potential recruitment
bias. As mentioned in Chapters 3 and 5 of this thesis, individuals were required to
meet a number of eligibility requirements and were recruited to participate in long-
term exercise interventions, demonstrating a willingness and ability to exercise that
might be misrepresentative of the overall Australian population with T2DM or other
chronic diseases. Further, anyone with an HbA1c above 10%, a BMI greater than 40
kg/m2 or prescribed insulin for the management of their condition was ineligible for
the study. Such a selection bias may limit the relevance and applicability of our
findings in this thesis to those individuals with T2DM who are in a more advanced
stage of this disease.

Chapter 7
Page | 298
Future Recommendations
Given that the secondary per protocol analysis for the study in Chapter 6
demonstrated that whey-protein and vitamin D supplementation enhanced the effects
of PRT on a number of important health outcomes in older overweight and obese
adults with T2DM, further trials are needed to evaluate whether various nutritional
factors can provide additive health benefits to exercise in this group. There is also a
need to further evaluate the efficacy and effectiveness (and cost-effectiveness) of
community-based PRT (or related exercise) programs like the current Lift for Life®
program for people with T2DM. This should include an investigation into what
aspects of a community-based PRT (or exercise) program are most appealing to
those with T2DM and which may enhance long-term adherence. Future studies
should also recruit participants in more advanced stages of this disease to be more
representative of the broader T2DM population as such groups have not been
investigated sufficiently, in this thesis or the broader population.
7.2.3 The most effective diet or nutritional approach for the management of
T2DM remains unclear.
This section details the findings from both Chapter 3 and 6 of this thesis regarding
the two dietary related approaches which were prescribed in combination with PRT
for the improvement in glycaemic, insulinaemic, cardiovascular, inflammatory and
body composition outcomes in older adults with T2DM. These studies prescribed
two very different nutritional approaches. Weight loss from caloric restriction is
typically advised in those with T2DM yet the effects of combining PRT with weight
loss on markers of systemic inflammation had not been examined. Promising
evidence exists for the independent effects of high protein diets, whey protein and
vitamin D supplementation on several metabolic and body composition health
outcomes in healthy older adults and those with T2DM. Whether the combination of
these nutritional factors can enhance PRT associated health outcomes in older adults
with T2DM remains uncertain.

Chapter 7
Page | 299
Limited benefits of weight loss and/or PRT on markers of systemic inflammation
The secondary analysis performed in Chapter 3 revealed that 6-months of caloric
restriction alone or performed alongside high-intensity PRT, both of which resulted
in similar significant reductions in body weight and fat mass and an improvement in
HbA1c levels, was not associated with any significant improvement in markers of
systemic inflammation in older adults with poorly controlled T2DM. Given that
strong link between obesity and inflammation, the lack of any marked changes
during the initial 6-months may be related to the relative modest reductions in weight
and fat mass in our trial. However, other studies have also found that participation in
exercise or PRT alone is beneficial for improving markers of inflammation,
independent of changes in weight or fat mass. In partial support of such studies, we
observed 6-months of continued home-based training following the supervised
gymnasium-based program, despite weight and fat mass regain, was associated with
some modest improvements in various inflammation markers compared to sham-
exercise (stretching). However, in Chapter 6 we found that there were no
improvements in any pro- or anti-inflammatory marker following our 24-week
community-based PRT program. While this may be related in part to differences in
the intensity of the training, collectively these findings suggest that long-term
participation (>6-months) in PRT may be required to provide some benefits on
circulating inflammatory markers in older overweight and obese adults with T2DM.
Furthermore, given that there were significant improvements in HbA1c following
both PRT-related interventions, the findings from this thesis also suggest that
changes in circulating inflammatory markers may not play a key role in mediating
exercise-induced changes in glycaemic control, although this hypothesis requires
further investigation.
Whey protein plus vitamin D supplementation provided little or no additive benefits
to PRT in older overweight and obese adults with T2DM
Chapter 6 builds upon the findings in Chapter 3 by examining the potential additive
effects of a novel nutritional approach incorporating whey protein and vitamin D
with PRT in older adults with T2DM. The main findings from this chapter were that
the addition of a daily whey-protein drink and vitamin D supplements did not
enhance the effects of a community-based ‘real-world’ PRT program on measures of
Chapter 7
Page | 300
body composition, glycaemic control or cardiovascular risk factors in older
community-dwelling sedentary adults with T2DM. Although there was a trend for a
greater improvement in appendicular lean mass (ALM), the lack of any marked
additive effect on glycaemic or insulinaemic measures may be due to the adequate
baseline dietary protein intake (mean ~1.1 g/kg/day) and sufficient serum 25(OH)D
levels (mean 72 nmol/L) in this cohort of older adults with T2DM at the
commencement of this trial. The effects of combined whey protein and vitamin D
supplementation with PRT has not previously been examined in those with T2DM,
but of the few studies conducted in non-diabetic older adults the greatest benefits
have typically been observed in high risk groups (e.g., elderly and those with
sarcopenia) and/or those with inadequate protein intakes at baseline (512, 513, 515).
Indeed, in studies examining the independent effects of whey protein or vitamin D
supplementation on glycaemic control, body composition and/or cardiovascular risk
factors there is also some evidence that these nutritional factors provide greater
benefits in individuals with low baseline intakes and serum 25(OH)D levels (41, 452,
483). Collectively, these findings suggest that the greatest benefits of exercise
combined with nutritional supplement(s) are likely to occur in high risk groups that
are inactive and have insufficient intakes at baseline for the targeted nutritional
approach. However, it is evident that further research is need to help define the most
appropriate nutritional approach to be used in combination with PRT for the
management of T2DM.
Limitations
Chapter 3 in this thesis was a secondary analysis that was limited by a relatively
small sample size. Given the known variability in circulating inflammatory
cytokines, it is likely that this study was underpowered to detect any potential
between group differences. Additionally, whilst the caloric restriction imposed
during the supervised-gymnasium based phase of the trial (the first 6-months) was
sufficient to significantly reduce body weight and fat mass, these reductions were not
of the same magnitude observed in other trials which reported significant
improvements in a range of inflammatory markers concomitant to the weight loss.

Chapter 7
Page | 301
The independent contributions whey protein and vitamin D had on the measured
outcomes were not able to be assessed in this trial as there was no group in our trial
who were prescribed whey protein or vitamin D only with or without PRT. Further,
whilst this trial had a large sample size (in comparison to many previous exercise
RCTs in adults with T2DM) and examined the long-term effects, the participants
recruited were found to have intakes of protein and serum 25(OH)D levels at
baseline that are considered adequate (sufficient), and the vast majority were
prescribed some form of oral hypoglycaemic medication, which possibly blunted any
potential effects of the supplements on the measured outcomes in our trial.
Future Recommendations
Further RCTs are needed to investigate whether whey protein and vitamin D can
enhance the effect of community-based or supervised controlled PRT on body
composition, glycaemic and insulinaemic outcomes as well as CVD risk factors in
older adults with T2DM with inadequate dietary protein intakes and/or
deficient/insufficient serum 25(OH)D status. Further, almost 70% of our participants
were taking oral hypoglycaemic medication to management there T2DM. Thus,
future trials should consider recruiting and randomising a weighted proportion of
participants not on any oral hypoglycaemic medication to assess the effects of such
an intervention on those taking and not taking oral hypoglycaemic medication.
7.3 Conclusions and Public Health Implications
In this thesis, a number of different lifestyle approaches including PRT, PRT plus
weight loss and PRT plus whey protein and vitamin D supplementation were
prescribed with the aim of increasing lean mass, improving glycaemic control and
insulin sensitivity plus various cardiovascular risk factors and markers of systemic
inflammation in older adults with T2DM. Several different PRT settings were also
examined including a supervised clinically controlled gym-based setting, home-
based training and community-based health and leisure facilities. The main findings
from the studies in this thesis were that weight and fat mass reductions resultant from
supervised high-intensity PRT plus caloric restriction or caloric restriction alone did
not result in immediate improvement in systemic or endothelial markers of
inflammation. In contrast, there was some evidence that continued long-term

Chapter 7
Page | 302
exercise training was associated with modest improvements in some inflammatory
markers, but the clinical significance of these findings remains to be determined.
Second, participation in a long-term community-based PRT program improved
glycaemic control and lean mass, reduced fat mass and improved some CVD risk
factors, but the addition of a novel dietary approach incorporating increased protein
intake and vitamin D supplementation provided little or no added benefits.
The challenge remains following the completion of long-term exercise and nutrition
intervention studies, such as those in this thesis, of how to foster long-term
compliance and promote ongoing participation in community-based lifestyle
programs for continued health benefits. In addition, despite the large subject numbers
and long follow-up periods required, further studies are needed in older adults to
identify whether ongoing participation in PRT along with nutritional factors which
may enhance improvements in lean mass, translate to long-term improvements in
glycaemic control, insulin sensitivity and improve CVD risk factors in those with
T2DM and potentially lead to co-morbidity and mortality risk reduction benefits.
Below are a series of key messages and public health implications which can be
taken from this thesis and which could be used to guide clinical practice guidelines
or community care programmes and future health recommendations for those with
T2DM. It is important these implications are interpreted in the context of the
limitations outlined previously.
1. Weight loss in the absence of PRT may not be the most effective recommendation
for improving markers of inflammation in those with T2DM.
2. In older overweight and obese adults with T2DM who have adequate dietary
protein intakes and sufficient serum 25(OH)D levels there appears to be little
benefit to be gained in certain health outcomes by supplementing the diet with
daily whey protein and vitamin D. However, given that there was evidence for
some additional health benefits in those who were most compliant with the
exercise and supplements, further research is still needed to address whether such
a nutritional approach can provide added health benefits.

Chapter 7
Page | 303
3. Community-based PRT interventions for older overweight and obese adults with
T2DM are safe and effective for improving various health outcomes, but the
greatest benefits appear apparent when training is supervised and performed at a
high-intensity PRT. Thus, an approach moving forward for people with T2DM
regarding exercise may be to ensure they receive a high level of supervision and
attention during the initial few months of commencing a PRT program.
4. Policies and funding at both local government and national level should be
developed and made available to implement sustainable and accessible health-
oriented community-based PRT or physical activity programs for older adults
with T2DM.

Page | 304
References
1. Chen L, Magliano DJ, Zimmet PZ. The worldwide epidemiology of type 2 diabetes mellitus--present and future perspectives. Nat Rev Endocrinol. 2011;8(4):228-36.
2. Zimmet PZ. Can we avert a diabetes catastrophe in Australia? Med J Aust. 2013;199(4):225-6.
3. International Diabetes Federation. IDF Diabetes Atlas, 7th edn. [Internet]. Brussels, Belgium: International Diabetes Federation; 2015 [cited 2016 Feb 20]. Available from: https://www.idf.org/e-library/epidemiology-research/diabetes-atlas.html.
4. Martin-Timon I, Sevillano-Collantes C, Segura-Galindo A, Del Canizo-Gomez FJ. Type 2 diabetes and cardiovascular disease: Have all risk factors the same strength? World J Diabetes. 2014;5(4):444-70.
5. American Diabetes A, Bantle JP, Wylie-Rosett J, Albright AL, Apovian CM, Clark NG, et al. Nutrition recommendations and interventions for diabetes: a position statement of the American Diabetes Association. Diabetes Care. 2008;31(Supple 1):S61-78.
6. Colberg SR, Sigal RJ, Fernhall B, Regensteiner JG, Blissmer BJ, Rubin RR, et al. Exercise and type 2 diabetes: ACSM and ADA joint position statement. Diabetes Care. 2010;33(12).
7. Church TS, Blair SN, Cocreham S, Johannsen N, Johnson W, Kimberly Kramer K, et al. Effects of aerobic and resistance training on hemoglobin A1c levels in patients with type 2 diabetes: a randomised controlled trial JAMA. 2010;304(20):2253-62.
8. Sigal RJ, Kenny GP, Boule NG, Wells GA, Prud'homme D, Fortier M, et al. Effects of aerobic training, resistance training, or both on glycemic control in type 2 diabetes: a randomized trial. Ann Intern Med. 2007;147(6):357-69.
9. DeFronzo RA, Tripathy D. Skeletal muscle insulin resistance is the primary defect in type 2 diabetes. Diabetes Care. 2009;32(suppl 2):S157-63.
10. Srikanthan P, Karlamangla AS. Relative Muscle Mass Is Inversely Associated with Insulin Resistance and Prediabetes. Findings from The Third National Health and Nutrition Examination Survey. J Clin Endocrinol Metab. 2011;96(9):2898-903.
11. Park SW, Goodpaster BH, Strotmeyer ES, de Rekeneire N, Harris TB, Schwartz AV, et al. Decreased muscle strength and quality in older adults with type 2 diabetes: the health, aging, and body composition study. Diabetes. 2006;55(6):1813-8.
12. Dunstan DW, Daly RM, Owen N, Jolley D, De Courten M, Shaw J, et al. High-intensity resistance training improves glycemic control in older patients with type 2 diabetes. Diabetes Care. 2002;25(10):1729-36.

Page | 305
13. Daly RM, Dunstan DW, Owen N, Jolley D, Shaw JE, Zimmet PZ. Does high-intensity resistance training maintain bone mass during moderate weight loss in older overweight adults with type 2 diabetes? Osteoporos Int. 2005;16(12):1703-12.
14. Dunstan D, Daly R, Owen N, Jolley D, Vulikh E, Shaw J, et al. Home-based resistance training is not sufficient to maintain improved glycemic control following supervised training in older individuals with type 2 diabetes. Diabetes Care. 2005;28(1):3-9.
15. You T, Arsenis NC, Disanzo BL, Lamonte MJ. Effects of exercise training on chronic inflammation in obesity : current evidence and potential mechanisms. Sports Med. 2013;43(4):243-56.
16. Karstoft K, Pedersen BK. Exercise and type 2 diabetes: focus on metabolism and inflammation. Immunol Cell Biol. 2016;94(2):146-50.
17. Khoo J, Dhamodaran S, Chen DD, Yap SY, Chen RY, Tian RH. Exercise-Induced Weight Loss is More Effective than Dieting for Improving Adipokine Profile, Insulin Resistance, and Inflammation in Obese Men. Int J Sport Nutr Exerc Metab. 2015;25(6):566-75.
18. Liberman K, Forti LN, Beyer I, Bautmans I. The effects of exercise on muscle strength, body composition, physical functioning and the inflammatory profile of older adults: a systematic review. Curr Opin Clin Nutr Metab Care. 2017;20(1):30-53.
19. Zhao YF, Feng DD, Chen C. Contribution of adipocyte-derived factors to beta-cell dysfunction in diabetes. Int J Biochem Cell Biol. 2006;38(5-6):804-19.
20. Tilg H, Moschen AR. Inflammatory mechanisms in the regulation of insulin resistance. Mol Med. 2008;14(3-4):222-31.
21. Ehses JA, Ellingsgaard H, Boni-Schnetzler M, Donath MY. Pancreatic islet inflammation in type 2 diabetes: from alpha and beta cell compensation to dysfunction. Arch Physiol Biochem. 2009;115(4):240-7.
22. Pittas AG, Lau J, Hu FB, Dawson-Hughes B. The role of vitamin D and calcium in type 2 diabetes. A systematic review and meta-analysis. J Clin Endocrinol Metab. 2007;92(6):2017-29.
23. Plotnikoff RC, Costigan SA, Karunamuni ND, Lubans DR. Community-based physical activity interventions for treatment of type 2 diabetes: a systematic review with meta-analysis. Front Endocrinol 2013;4:3.
24. Colligan EM, Tomoyasu N, Howell B. Community-based wellness and prevention programs: the role of medicare. Front Public Health. 2014;2:189.
25. Koster-Rasmussen R, Simonsen MK, Siersma V, Henriksen JE, Heitmann BL, de Fine Olivarius N. Intentional Weight Loss and Longevity in Overweight Patients with Type 2 Diabetes: A Population-Based Cohort Study. PLoS One. 2016;11(1).

Page | 306
26. Maggio CA, Pi-Sunyer FX. The prevention and treatment of obesity. Application to type 2 diabetes. Diabetes Care. 1997;20(11):1744-66.
27. Diabetes Prevention Program Research Group. 10-year follow-up of diabetes incidence and weight loss in the Diabetes Prevention Program Outcomes Study. Lancet. 2009;374(9702):1677-86.
28. Jeffery RW, Drewnowski A, Epstein LH, Stunkard AJ, Wilson GT, Wing RR, et al. Long-term maintenance of weight loss: current status. Health Psychol. 2000;19(1S):5-16.
29. Lang A, Froelicher ES. Management of overweight and obesity in adults: behavioral intervention for long-term weight loss and maintenance. Eur J Cardiovasc Nurs. 2006;5(2):102-14.
30. Anderson JW, Konz EC, Frederich RC, Wood CL. Long-term weight-loss maintenance: a meta-analysis of US studies. Am J Clin Nutr. 2001;74(5):579-84.
31. Beavers KM, Ambrosius WT, Nicklas BJ, Rejeski WJ. Independent and combined effects of physical activity and weight loss on inflammatory biomarkers in overweight and obese older adults. J Am Geriatr Soc. 2013;61(7):1089-94.
32. Ryan AS, Ge S, Blumenthal JB, Serra MC, Prior SJ, Goldberg AP. Aerobic exercise and weight loss reduce vascular markers of inflammation and improve insulin sensitivity in obese women. J Am Geriatr Soc. 2014;62(4):607-14.
33. Giannopoulou I, Fernhall B, Carhart R, Weinstock RS, Baynard T, Figueroa A, et al. Effects of diet and/or exercise on the adipocytokine and inflammatory cytokine levels of postmenopausal women with type 2 diabetes. Metabolism. 2005;54(7):866-75.
34. Thompson D, Walhin JP, Batterham AM, Stokes KA, Cooper AR, Andrews RC. Effect of diet or diet plus physical activity versus usual care on inflammatory markers in patients with newly diagnosed type 2 diabetes: the Early ACTivity in Diabetes (ACTID) randomized, controlled trial. J Am Heart Assoc. 2014;3(3).
35. Snel M, van Diepen JA, Stijnen T, Pijl H, Romijn JA, Meinders AE, et al. Immediate and long-term effects of addition of exercise to a 16-week very low calorie diet on low-grade inflammation in obese, insulin-dependent type 2 diabetic patients. Food Chem Toxicol. 2011;49(12):3104-11.
36. Hu FB. Protein, body weight, and cardiovascular health. Am J Clin Nutr. 2005;82(1 Suppl):242S-7S.
37. Comerford KB, Pasin G. Emerging Evidence for the Importance of Dietary Protein Source on Glucoregulatory Markers and Type 2 Diabetes: Different Effects of Dairy, Meat, Fish, Egg, and Plant Protein Foods. Nutrients. 2016;8(8):446.

Page | 307
38. Dong JY, Zhang ZL, Wang PY, Qin LQ. Effects of high-protein diets on body weight, glycaemic control, blood lipids and blood pressure in type 2 diabetes: meta-analysis of randomised controlled trials. Br J Nutr. 2013;110(5):781-9.
39. Pennings B, Koopman R, Beelen M, Senden JM, Saris WH, van Loon LJ. Exercising before protein intake allows for greater use of dietary protein-derived amino acids for de novo muscle protein synthesis in both young and elderly men. Am J Clin Nutr. 2011;93(2):322-31.
40. Norton C, Toomey C, McCormack WG, Francis P, Saunders J, Kerin E, et al. Protein Supplementation at Breakfast and Lunch for 24 Weeks beyond Habitual Intakes Increases Whole-Body Lean Tissue Mass in Healthy Older Adults. J Nutr. 2016;146(1):65-9.
41. Kerstetter JE, Bihuniak JD, Brindisi J, Sullivan RR, Mangano KM, Larocque S, et al. The Effect of a Whey Protein Supplement on Bone Mass in Older Caucasian Adults. J Clin Endocrinol Metab. 2015;100(6):2214-22.
42. Daly RM, O'Connell SL, Mundell NL, Grimes CA, Dunstan DW, Nowson CA. Protein-enriched diet, with the use of lean red meat, combined with progressive resistance training enhances lean tissue mass and muscle strength and reduces circulating IL-6 concentrations in elderly women: a cluster randomized controlled trial. Am J Clin Nutr. 2014;99(4):899-910.
43. Schoenfeld BJ, Aragon AA, Krieger JW. The effect of protein timing on muscle strength and hypertrophy: a meta-analysis. J Int Soc Sports Nutr. 2013;10(1):53.
44. Areta JL, Burke LM, Ross ML, Camera DM, West DW, Broad EM, et al. Timing and distribution of protein ingestion during prolonged recovery from resistance exercise alters myofibrillar protein synthesis. J Physiol. 2013;591(9):2319-31.
45. Guimaraes-Ferreira L, Cholewa JM, Naimo MA, Zhi XI, Magagnin D, de Sa RB, et al. Synergistic effects of resistance training and protein intake: practical aspects. Nutrition. 2014;30(10):1097-103.
46. Wilkinson SB, Tarnopolsky MA, MacDonald MJ, MacDonald JR, Armstrong D, Philips SM. Consumption of fluid skim milk promotes greater muscle protein accretion after resistance exercise than does consumption of an isonitrogenous and isoenergetic soy-protein beverage. Am J Clin Nutr. 2007;85(4):1031-40.
47. Tang JE, Moore DR, Kujbida GW, Tarnopolsky MA, Phillips SM. Ingestion of whey hydrolysate, casein, or soy protein isolate: effects on mixed muscle protein synthesis at rest and following resistance exercise in young men. J Appl Physiol. 2009;107(3):987-92.
48. Draganidis D, Karagounis LG, Athanailidis I, Chatzinikolaou A, Jamurtas AZ, Fatouros IG. Inflammaging and Skeletal Muscle: Can Protein Intake Make a Difference? J Nutr. 2016;146(10):1940-52.

Page | 308
49. Paddon-Jones D, Rasmussen BB. Dietary protein recommendations and the prevention of sarcopenia. Curr Opin Clin Nutr Metab Care. 2009;12(1):86-90.
50. Breen L, Phillips SM. Nutrient interaction for optimal protein anabolism in resistance exercise. Curr Opin Clin Nutr Metab Care. 2012;15(3):226-32.
51. Yang Y, Breen L, Burd NA, Hector AJ, Churchward-Venne TA, Josse AR, et al. Resistance exercise enhances myofibrillar protein synthesis with graded intakes of whey protein in older men. Br J Nutr. 2012;108(10):1780-8.
52. Frid AH, Nilsson M, Holst JJ, Bjorck IM. Effect of whey on blood glucose and insulin responses to composite breakfast and lunch meals in type 2 diabetic subjects. Am J Clin Nutr. 2005;82(1):69-75.
53. Nilsson M, Holst JJ, Bjorck IME. Metabolic effects of amino acid mixtures and whey protein in healthy subjects: studies using glucose-equivalent drinks. Am J Clin Nutr. 2007;85(4):996-1004.
54. Nilsson M, Stenberg M, Frid AH, Holst JJ, Bjorck IM. Glycemia and insulinemia in healthy subjects after lactose-equivalent meals of milk and other food proteins: the role of plasma amino acids and incretins. Am J Clin Nutr. 2004;80(5):1246-53.
55. Ostman EM, Elmstahl HGML, Bjorck IME. Inconsistency between glycemic and insulinemic responses to regular and fermented milk products. Am J Clin Nutr. 2001;74(1):96-100.
56. Belobrajdic DP, McIntosh GH, Owens JA. A high-whey-protein diet reduces body weight gain and alters insulin sensitivity relative to red meat in wistar rats. J Nutr. 2004;134(6):1454-8.
57. Layman DK, Baum JI. Dietary protein impact on glycemic control during weight loss. J Nutr. 2004;134(4):968S-73S.
58. Zhang Y, Guo K, LeBlanc RE, Loh D, Schwartz GJ, Yu YH. Increasing dietary leucine intake reduces diet-induced obesity and improves glucose and cholesterol metabolism in mice via multimechanisms. Diabetes. 2007;56(6):1647-54.
59. Mitri J, Muraru MD, Pittas AG. Vitamin D and type 2 diabetes: a systematic review. Eur J Clin Nutr. 2011;65(9):1005-15.
60. Dawson-Hughes B. Serum 25-hydroxyvitamin D and functional outcomes in the elderly. Am J Clin Nutr. 2008;88(2):537S-40S.
61. Gagnon C, Lu ZX, Magliano DJ, Dunstan DW, Shaw JE, Zimmet PZ, et al. Serum 25-hydroxyvitamin D, calcium intake, and risk of type 2 diabetes after 5 years: results from a national, population-based prospective study (the Australian Diabetes, Obesity and Lifestyle study). Diabetes Care. 2011;34(5):1133-8.
62. Sung CC, Liao MT, Lu KC, Wu CC. Role of vitamin D in insulin resistance. J Biomed Biotechnol. 2012;2012.

Page | 309
63. Ramos-Trautmann G, González L, Díaz-Luquis G, Pérez CM, C. P. Inverse Association between Vitamin D Status and Diabetes in a Clinic Based Sample of Hispanic Adults in Puerto Rico. Diabetes Res. 2015;1(1):5-11.
64. Thorand B, Zierer A, Huth C, Linseisen J, Meisinger C, Roden M, et al. Effect of serum 25-hydroxyvitamin D on risk for type 2 diabetes may be partially mediated by subclinical inflammation: results from the MONICA/KORA Augsburg study. Diabetes Care. 2011;34(10):2320-2.
65. von Hurst PR, Stonehouse W, Coad J. Vitamin D supplementation reduces insulin resistance in South Asian women living in New Zealand who are insulin resistant and vitamin D deficient - a randomised, placebo-controlled trial. Br J Nutr. 2010;103(4):549-55.
66. Ljunghall S, Lind L, Lithell H, Skarfors E, Selinus I, Sorensen OH, et al. Treatment with one-alpha-hydroxycholecalciferol in middle-aged men with impaired glucose tolerance--a prospective randomized double-blind study. Acta Med Scand. 1987;222(4):361-7.
67. Ryu OH, Chung W, Lee S, Hong KS, Choi MG, Yoo HJ. The effect of high-dose vitamin D supplementation on insulin resistance and arterial stiffness in patients with type 2 diabetes. Korean J Intern Med. 2014;29(5):620-9.
68. Barengolts E, Manickam B, Eisenberg Y, Akbar A, Kukreja S, Ciubotaru I. Effect of High-Dose Vitamin D Repletion on Glycemic Control in African-American Males with Prediabetes and Hypovitaminosis D. Endocr Pract. 2015;21(6):604-12.
69. Anyanwu AC, Fasanmade OA, Odeniyi IA, Iwuala S, Coker HB, Ohwovoriole AE. Effect of Vitamin D supplementation on glycemic control in Type 2 diabetes subjects in Lagos, Nigeria. Indian J Endocrinol Metab. 2016;20(2):189-94.
70. Farrokhian A, Raygan F, Bahmani F, Talari HR, Esfandiari R, Esmaillzadeh A, et al. Long-Term Vitamin D Supplementation Affects Metabolic Status in Vitamin D-Deficient Type 2 Diabetic Patients with Coronary Artery Disease. J Nutr. 2017;147(3):384-9.
71. Mohamad MI, El-Sherbeny EE, Bekhet MM. The Effect of Vitamin D Supplementation on Glycemic Control and Lipid Profile in Patients with Type 2 Diabetes Mellitus. J Am Coll Nutr. 2016;35(5):399-404.
72. Evans JM, Newton RW, Ruta DA, MacDonald TM, Morris AD. Socio-economic status, obesity and prevalence of Type 1 and Type 2 diabetes mellitus. Diabet Med. 2000;17(6):478-80.
73. Boyle JP, Engelgau MM, Thompson TJ, Goldschmid MG, Beckles GL, Timberlake DS, et al. Estimating prevalence of type 1 and type 2 diabetes in a population of African Americans with diabetes mellitus. Am J Epidemiol. 1999;149(1):55-63.

Page | 310
74. Tabak AG, Herder C, Rathmann W, Brunner EJ, Kivimaki M. Prediabetes: a high-risk state for diabetes development. Lancet. 2012;379(9833):2279-90.
75. Gabir MM, Hanson RL, Dabelea D, Imperatore G, Roumain J, Bennett PH, et al. The 1997 American Diabetes Association and 1999 World Health Organization criteria for hyperglycemia in the diagnosis and prediction of diabetes. Diabetes Care. 2000;23(8):1108-12.
76. Shaw JA, Zimmet PZ, de Courten M, Dowse GK, Chitson P, Gareeboo H, et al. Impaired fasting glucose or impaired glucose tolerance - What best predicts future diabetes in Mauritius? Diabetes Care. 1999;22(3):399-402.
77. Unwin N, Shaw J, Zimmet P, Alberti KGMM. Impaired glucose tolerance and impaired fasting glycaemia: the current status on definition and intervention. Diabet Med. 2002;19:708-23.
78. Guariguata L, Whiting DR, Hambleton I, Beagley J, Linnenkamp U, Shaw JE. Global estimates of diabetes prevalence for 2013 and projections for 2035. Diabetes Res Clin Pract. 2014;103(2):137-49.
79. Tanamas SK, Magliano DJ, Lynch B, Sethi P, Willenberg L, Polkinghorne KR, et al. AusDiab 2012 The Australian Diabetes, Obesity and Lifestyle Study [Internet]. Melbourne: BakerIDI Heart and Diabetes Institute; 2013 [cited 2015 Nov 08]. Available from: https://www.baker.edu.au/Assets/Files/Baker IDI Ausdiab Report_interactive_FINAL.pdf.
80. Australian Institute of Health and Welfare. Australia's health 2016 [Internet]. Canberra: Australian Institute of Health and Welfare; 2016 [cited 2016 Jun 15]. Cat. no. AUS 199:[Available from: http://www.aihw.gov.au/publication-detail/?id=60129555544.
81. O'Dea K, Patel M, Kubisch D, Hopper J, Traianedes K. Obesity, diabetes, and hyperlipidemia in a central Australian aboriginal community with a long history of acculturation. Diabetes Care. 1993;16(7):1004-10.
82. Vos T, Goss J, Begg S, N. M. Projected health care costs report. Australian Burden of Disease and Injury Study [Internet]. Canberra: University of Queensland and Australian Institute of Health and Welfare; 2005 [cited 2013 Mar 30]. Available from: http://citeseerx.ist.psu.edu/viewdoc/download?doi=10.1.1.366.5748&rep=rep1&type=pdf.
83. Johnson G, Martin JE, Timoshanko A. Preventing type 2 diabetes: scaling up to create a prevention system. Med J Aust. 2015;202(1):24-6.
84. Shaw J, Tanamas S. Diabetes: the silent pandemic and its impact on Australia [Internet]. Melbourne, Australia: Baker IDI Heart and Diabetes Institute; 2012 [cited 2013 Mar 30]. Available from: https://static.diabetesaustralia.com.au/s/fileassets/diabetes-australia/e7282521-472b-4313-b18e-be84c3d5d907.pdf.

Page | 311
85. Australian Bureau of Statistics. Australian Health Survey: Biomedical Results for Chronic Diseases, 2011-12 [Internet]. Canberra: ABS; 2013 [cited 2014 Mar 14]. 4364.0.55.005:[Available from: http://www.ausstats.abs.gov.au/Ausstats/subscriber.nsf/0/01ECE269AAE6E736CA257C0700114DBA/$File/AHS - Biomedical Results for Chronic Diseases.pdf.
86. Pan XR, Li GW, Hu YH, Wang JX, Yang WY, An ZX, et al. Effects of diet and exercise in preventing NIDDM in people with impaired glucose tolerance. The Da Qing IGT and Diabetes Study. Diabetes Care. 1997;20(4):537-44.
87. Goff DC, Jr., Gerstein HC, Ginsberg HN, Cushman WC, Margolis KL, Byington RP, et al. Prevention of cardiovascular disease in persons with type 2 diabetes mellitus: current knowledge and rationale for the Action to Control Cardiovascular Risk in Diabetes (ACCORD) trial. Am J Cardiol. 2007;99.
88. The Action to Control Cardiovascular Risk in Diabetes Study Group. Effects of Intensive Glucose Lowering in Type 2 Diabetes. N Engl J Med. 2008;358(24):2545-59.
89. International Diabetes Federation. IDF Diabetes Atlas, 6th edn. [Internet]. Brussels, Belgium: International Diabetes Federation; 2013 [cited 2015 Mar 12]. 6th:[Available from: https://www.idf.org/e-library/epidemiology-research/diabetes-atlas.html.
90. Laakso M. Hyperglycemia and cardiovascular disease in type 2 diabetes. Diabetes. 1999;48(5):937-42.
91. Fox CS, Golden SH, Anderson C, Bray GA, Burke LE, de Boer IH, et al. Update on Prevention of Cardiovascular Disease in Adults With Type 2 Diabetes Mellitus in Light of Recent Evidence: A Scientific Statement From the American Heart Association and the American Diabetes Association. Circulation. 2015;132(8):691-718.
92. Zimmet P, Alberti KG, Shaw J. Global and societal implications of the diabetes epidemic. Nature. 2001;414(6865):782-7.
93. Laakso M. Cardiovascular disease in type 2 diabetes from population to man to mechanisms: the Kelly West Award Lecture 2008. Diabetes Care. 2010;33(2):442-9.
94. World Health Organization. Global Report on Diabetes [Internet]. Geneva, Switzerland World Health Organization; 2016 [cited 2017 Jan 22]. Available from: http://apps.who.int/iris/bitstream/10665/204871/1/9789241565257_eng.pdf.
95. Australian Institute of Health and Welfare. Cardiovascular disease, diabetes and chronic kidney disease—Australian facts: Prevalence and incidence [Internet]. Canberra: AIHW; 2014 [cited 2014 Jan 15]. Cat. no. CDK 2:[Available from: http://www.aihw.gov.au/publication-detail/?id=60129549616.

Page | 312
96. Leon BM, Maddox TM. Diabetes and cardiovascular disease: Epidemiology, biological mechanisms, treatment recommendations and future research. World J Diabetes. 2015;6(13):1246-58.
97. Australian Institute of Health and Welfare. Diabetes expenditure in Australia 2008–09 [Internet]. Canberra: Australian Institute of Health and Welfare; 2013 [Cat. no. CVD 62.:[Available from: http://www.aihw.gov.au/publication-detail/?id=60129543925.
98. Davis WA, Knuiman MW, Hendrie D, Davis TM. The obesity-driven rising costs of type 2 diabetes in Australia: projections from the Fremantle Diabetes Study. Intern Med J. 2006;36(3):155-61.
99. Leahy JL. Pathogenesis of type 2 diabetes mellitus. Arch Med Res. 2005;36(3):197-209.
100. Eriksson J, Franssila-Kallunki A, Ekstrand A, Saloranta C, Widen E, Schalin C, et al. Early metabolic defects in persons at increased risk for non-insulin-dependent diabetes mellitus. N Engl J Med. 1989;321(6):337-43.
101. Kahn SE. The relative contributions of insulin resistance and beta-cell dysfunction to the pathophysiology of Type 2 diabetes. Diabetologia. 2003;46(1):3-19.
102. Stumvoll M, Goldstein BJ, van Haeften TW. Type 2 diabetes: principles of pathogenesis and therapy. Lancet. 2005;365(9467):1333-46.
103. DeFronzo RA. Pharmacologic therapy for type 2 diabetes mellitus. Ann Intern Med. 1999;131(4):281-303.
104. DeFronzo RA, Ferrannini E, Simonson DC. Fasting hyperglycemia in non-insulin-dependent diabetes mellitus: contributions of excessive hepatic glucose production and impaired tissue glucose uptake. Metabolism. 1989;38(4):387-95.
105. Duncan BB, Schmidt MI, Pankow JS, Ballantyne CM, Couper D, Vigo A, et al. Low-grade systemic inflammation and the development of type 2 diabetes: the atherosclerosis risk in communities study. Diabetes. 2003;52(7):1799-805.
106. World Health Organization. Use of glycated haemoglobin (HbA1c) in the diagnosis of diabetes mellitus. Report of a World Health Organization Consultation [Internet]. Geneva: World Health Organization; 2011 [cited 2013 Nov 15]. Available from: http://www.who.int/diabetes/publications/report-hba1c_2011.pdf.
107. De Fronzo R, Abdul-Ghani M. Type 2 Diabetes Can Be Prevented With Early Pharmacological Intervention. Diabetes Care. 2011;34(Supp 2):S202-S9.
108. Alberti K, Zimmet P. Definition, Diagnosis and Classification of Diabetes Mellitus and its complications. Part1: Diagnosis and Classification of Diabetes Mellitus Provisional Report of a WHO Consultation Diabet Med. 1998;15:539-53.

Page | 313
109. Stratton IM, Adler AI, Neil HA, Matthews DR, Manley SE, Cull CA, et al. Association of glycaemia with macrovascular and microvascular complications of type 2 diabetes (UKPDS 35): prospective observational study. BMJ. 2000;321(7258):405-12.
110. Turner RC, Millns H, Neil HAW, Stratton IM, Manley SE, Matthews DR, et al. Risk factors for coronary artery disease in non-insulin dependent diabetes mellitus: United Kingdom prospective diabetes study (UKPDS: 23). BMJ. 1998;316(7134):823-8.
111. Turner RC, Holman RR, Cull CA, Stratton IM, et al. Intensive blood-glucose control with sulphonylureas or insulin compared with conventional treatment and risk of complications in patients with type 2 diabetes (UKPDS 33). The Lancet. 1998;352(9131):837-53.
112. American Diabetes Association. Standards of medical care in diabetes — 2011. Diabetes Care. 2011;34(Suppl 1):S11-S61.
113. d'Emden MC, Shaw JE, Colman PG, Colagiuri S, Twigg SM, Jones GR, et al. The role of HbA1c in the diagnosis of diabetes mellitus in Australia. Med J Aust. 2012;197(4):220-1.
114. Colagiuri S, Lee CM, Wong TY, Balkau B, Shaw JE, Borch-Johnsen K. DETECT-2 Collaboration Writing Group. Glycemic thresholds for diabetes-specific retinopathy: implications for diagnostic criteria for diabetes. Diabetes Care. 2011;34:145-50.
115. Stratton IM, Cull CA, Adler AI, Matthews DR, Neil HA, Holman RR. Additive effects of glycaemia and blood pressure exposure on risk of complications in type 2 diabetes: a prospective observational study (UKPDS 75). Diabetologia. 2006;49(8):1761-9.
116. NCD Risk Factor Collaboration. Effects of diabetes definition on global surveillance of diabetes prevalence and diagnosis: a pooled analysis of 96 population-based studies with 331 288 participants. Lancet Diabetes Endocrinol. 2015;3(8):624-37.
117. Kaprio J, Tuomilehto J, Koskenvuo M, Romanov K, Reunanen A, Eriksson J, et al. Concordance for Type-1 (Insulin-Dependent) and Type-2 (Non-Insulin-Dependent) Diabetes-Mellitus in a Population-Based Cohort of Twins in Finland. Diabetologia. 1992;35(11):1060-7.
118. Flores JC, Hirschhorn J, Altshuler D. The inherited basis of diabetes mellitus: implications for the genetic analysis of complex traits. Annu Rev Genomics Hum Genet. 2003;4:257-91.
119. Kacerovsky-Bielesz G, Kacerovsky M, Chmelik M, Farukuoye M, Ling C, Pokan R, et al. A single nucleotide polymorphism associates with the response of muscle ATP synthesis to long-term exercise training in relatives of type 2 diabetic humans. Diabetes Care. 2012;35(2):350-7.

Page | 314
120. Jenkins NT, McKenzie JA, Damcott CM, Witkowski S, Hagberg JM. Endurance exercise training effects on body fatness, VO2max, HDL-C subfractions, and glucose tolerance are influenced by a PLIN haplotype in older Caucasians. J Appl Physiol. 2010;108(3):498-506.
121. Mohlke KL, Boehnke M. Recent advances in understanding the genetic architecture of type 2 diabetes. Hum Mol Genet. 2015;24.
122. McPhee SJ, Papadakis MA. Current Medical Diagnosis & Treatment 2014. New York: McGraw-Hill Medical.; 2014.
123. Australian Institute of Health and Welfare. Type 2 diabetes in Australia’s children and young people: a working paper [Internet]. Canberra: Australian Institute of Health and Welfare; 2014 [cited 2017 Jan 10]. 21. Cat. no. CVD 64.:[Available from: http://www.aihw.gov.au/WorkArea/DownloadAsset.aspx?id=60129546359.
124. Sattar N. Gender aspects in type 2 diabetes mellitus and cardiometabolic risk. Best Pract Res Clin Endocrinol Metab. 2013;27(4):501-7.
125. Fall T, Hagg S, Ploner A, Magi R, Fischer K, Draisma HH, et al. Age- and sex-specific causal effects of adiposity on cardiovascular risk factors. Diabetes. 2015;64(5):1841-52.
126. Geer EB, Shen W. Gender differences in insulin resistance, body composition, and energy balance. Gend Med. 2009;6(Suppl 1):60-75.
127. Pouliot MC, Despres JP, Nadeau A, Moorjani S, Prud'Homme D, Lupien PJ, et al. Visceral obesity in men. Associations with glucose tolerance, plasma insulin, and lipoprotein levels. Diabetes. 1992;41(7):826-34.
128. Lemieux S, Prud'homme D, Nadeau A, Tremblay A, Bouchard C, Despres JP. Seven-year changes in body fat and visceral adipose tissue in women. Association with indexes of plasma glucose-insulin homeostasis. Diabetes Care. 1996;19(9):983-91.
129. Chen W, Wilson JL, Khaksari M, Cowley MA, Enriori PJ. Abdominal fat analyzed by DEXA scan reflects visceral body fat and improves the phenotype description and the assessment of metabolic risk in mice. Am J Physiol Endocrinol Metab. 2012;303(5):635-43.
130. Diabetes Prevention Program Research G. Relationship of body size and shape to the development of diabetes in the diabetes prevention program. Obesity. 2006;14(11):2107-17.
131. Matute ML, Kalkhoff RK. Sex steroid influence on hepatic gluconeogenesis and glucogen formation. Endocrinology. 1973;92(3):762-8.
132. Dantas AP, Sandberg K. Estrogen regulation of tumor necrosis factor-alpha: a missing link between menopause and cardiovascular risk in women? Hypertension. 2005;46(1):21-2.

Page | 315
133. Choi SE, Liu M, Palaniappan LP, Wang EJ, Wong ND. Gender and ethnic differences in the prevalence of type 2 diabetes among Asian subgroups in California. J Diabetes Complications. 2013;27(5):429-35.
134. Shai I, Jiang R, Manson JE, Stampfer MJ, Willett WC, Colditz GA, et al. Ethnicity, obesity, and risk of type 2 diabetes in women: a 20-year follow-up study. Diabetes Care. 2006;29(7):1585-90.
135. Colagiuri R, Thomas M, Buckley A. Preventing Type 2 Diabetes in Culturally and Linguistically Diverse Communities in NSW [Internet]. Sydney: NSW Department of Health; 2007 [cited 2015 Jan 04]. Available from: https://static.diabetesaustralia.com.au/s/fileassets/diabetes-australia/68e22e06-4281-4fb1-8d06-59af53719d85.pdf.
136. Astrup A, Finer N. Redefining Type 2 diabetes: 'Diabesity' or 'Obesity Dependent Diabetes Mellitus'? Obes Rev. 2000;1(2):57-9.
137. Anderson JW, Kendall CW, Jenkins DJ. Importance of weight management in type 2 diabetes: review with meta-analysis of clinical studies. J Am Coll Nutr. 2003;22(5):331-9.
138. Huerta JM, Tormo MJ, Chirlaque MD, Gavrila D, Amiano P, Arriola L, et al. Risk of type 2 diabetes according to traditional and emerging anthropometric indices in Spain, a Mediterranean country with high prevalence of obesity: results from a large-scale prospective cohort study. BMC Endocr Disord. 2013;13:7.
139. Abdullah A, Peeters A, de Courten M, Stoelwinder J. The magnitude of association between overweight and obesity and the risk of diabetes: a meta-analysis of prospective cohort studies. Diabetes Res Clin Pract. 2010;89(3):309-19.
140. Bray GA, Jablonski KA, Fujimoto WY, Barrett-Connor E, Haffner S, Hanson RL, et al. Relation of central adiposity and body mass index to the development of diabetes in the Diabetes Prevention Program. Am J Clin Nutr. 2008;87(5):1212-8.
141. Meisinger C, Döring A, Thorand B, Heier M, Löwel H. Body fat distribution and risk of type 2 diabetes in the general population: are there differences between men and women? The MONICA/KORA Augsburg Cohort Study. Am J Clin Nutr. 2006;84(3):483-9.
142. Barzilai N, Gupta G. Revisiting the role of fat mass in the life extension induced by caloric restriction. J Gerontol A Biol Sci Med Sci. 1999;54(3).
143. Gastaldelli A, Cusi K, Pettiti M, Hardies J, Miyazaki Y, Berria R, et al. Relationship between hepatic/visceral fat and hepatic insulin resistance in nondiabetic and type 2 diabetic subjects. Gastroenterology. 2007;133(2):496-506.
144. Wolfe RR. The underappreciated role of muscle in health and disease. Am J Clin Nutr. 2006;84(3):475-82.

Page | 316
145. DeFronzo RA, Jacot E, Jequier E, Maeder E, Wahren J, Felber JP. The effect of insulin on the disposal of intravenous glucose. Results from indirect calorimetry and heaptic and femoral venous catheterization. Diabetes. 1981;30(12):1000-7.
146. Park SW, Goodpaster BH, Strotmeyer ES, Kuller LH, Broudeau R, Kammerer C, et al. Accelerated loss of skeletal muscle strength in older adults with type 2 diabetes: the health, aging, and body composition study. Diabetes Care. 2007;30(6):1507-12.
147. Park SW, Goodpaster BH, Lee JS, Kuller LH, Boudreau R, de Rekeneire N, et al. Excessive loss of skeletal muscle mass in older adults with type 2 diabetes. Diabetes Care. 2009;32(11):1993-7.
148. Leenders M, Verdijk LB, van der Hoeven L, Adam JJ, van Kranenburg J, Nilwik R, et al. Patients with type 2 diabetes show a greater decline in muscle mass, muscle strength, and functional capacity with aging. J Am Med Dir Assoc. 2013;14(8):585-92.
149. Kalyani RR, Corriere M, Ferrucci L. Age-related and disease-related muscle loss: the effect of diabetes, obesity, and other diseases. Lancet Diabetes Endocrinol. 2014;2(10):819-29.
150. Barzilay JI, Cotsonis GA, Walston J, Schwartz AV, Satterfield S, Miljkovic I, et al. Insulin resistance is associated with decreased quadriceps muscle strength in nondiabetic adults aged ≥ 70 years. Diabetes Care. 2009;32(4):736-8.
151. Larsen BA, Wassel CL, Kritchevsky SB, Strotmeyer ES, Criqui MH, Kanaya AM, et al. Association of Muscle Mass, Area, and Strength With Incident Diabetes in Older Adults: The Health ABC Study. J Clin Endocrinol Metab. 2016;101(4):1847-55.
152. Mizgier ML, Casas M, Contreras-Ferrat A, Llanos P, Galgani JE. Potential role of skeletal muscle glucose metabolism on the regulation of insulin secretion. Obes Rev. 2014;15(7):587-97.
153. Larsen BA, Allison MA, Laughlin GA, Araneta MR, Barrett-Connor E, Wooten WJ, et al. The association between abdominal muscle and type II diabetes across weight categories in diverse post-menopausal women. J Clin Endocrinol Metab. 2015;100(1):105-9.
154. Hovanec N, Sawant A, Overend TJ, Petrella RJ, Vandervoort AA. Resistance training and older adults with type 2 diabetes mellitus: strength of the evidence. J Aging Res. 2012;2012.
155. Landi F, Onder G, Bernabei R. Sarcopenia and diabetes: two sides of the same coin. J Am Med Dir Assoc. 2013;14(8):540-1.
156. Eriksson J, Lindstrom J, Tuomilehto J. Potential for the prevention of type 2 diabetes. Br Med Bull. 2001;60:183-99.
157. Sigal RJ, Kenny GP, Wasserman DH, Castaneda-Sceppa C. Physical activity/exercise and type 2 diabetes. Diabetes Care. 2004;27(10):2518-39.

Page | 317
158. Manson JE, Nathan DM, Krolewski AS, Stampfer MJ, Willet WC, Hennekens CH. A prospective study of exercise and incidence of diabetes among US male physicians. JAMA. 1992;268:63-7.
159. Manson JE, Rimm EB, Stampfer MJ, Colditz GA, Willett WC, Krolewski AS, et al. Physical activity and incidence of non-insulin-dependent diabetes mellitus in women. Lancet. 1991;338(8770):774-8.
160. Kriska AM, LaPorte RE, Pettitt DJ, Charles MA, Nelson RG, Kuller LH, et al. The association of physical activity with obesity, fat distribution and glucose intolerance in Pima Indians. Diabetologia. 1993;36(9):863-9.
161. Bassuk SS, Manson JE. Epidemiological evidence for the role of physical activity in reducing risk of type 2 diabetes and cardiovascular disease. J Appl Physiol. 2005;99(3):1193-204.
162. Dunstan DW, Salmon J, Owen N, Armstrong T, Zimmet PZ, Welborn TA, et al. Associations of TV viewing and physical activity with the metabolic syndrome in Australian adults. Diabetologia. 2005;48(11):2254-61.
163. Salmon J, Bauman A, Crawford D, Timperio A, Owen N. The association between television viewing and overweight among Australian adults participating in varying levels of leisure-time physical activity. Int J Obes Relat Metab Disord. 2000;24(5):600-6.
164. Steyn NP, Mann J, Bennett PH, Temple N, Zimmet P, Tuomilehto J, et al. Diet, nutrition and the prevention of type 2 diabetes. Public Health Nutr. 2004;7.
165. Alberti KG, Zimmet P, Shaw J. International Diabetes Federation: a consensus on Type 2 diabetes prevention. Diabet Med. 2007;24(5):451-63.
166. Raymond MJ, Bramley-Tzerefos RE, Jeffs KJ, Winter A, Holland AE. Systematic review of high-intensity progressive resistance strength training of the lower limb compared with other intensities of strength training in older adults. Arch Phys Med Rehabil. 2013;94(8):1458-72.
167. van Dam RM, Rimm EB, Willett WC, Stampfer MJ, Hu FB. Dietary patterns and risk for type 2 diabetes mellitus in U.S. men. Ann Intern Med. 2002;136(3):201-9.
168. de Koning L, Malik VS, Rimm EB, Willett WC, Hu FB. Sugar-sweetened and artificially sweetened beverage consumption and risk of type 2 diabetes in men. Am J Clin Nutr. 2011;93(6):1321-7.
169. Malik VS, Popkin BM, Bray GA, Despres JP, Willett WC, Hu FB. Sugar-sweetened beverages and risk of metabolic syndrome and type 2 diabetes: a meta-analysis. Diabetes Care. 2010;33(11):2477-83.
170. Hu FB, Manson JE, Stampfer MJ, Colditz G, Liu S, Solomon CG, et al. Diet, lifestyle, and the risk of type 2 diabetes mellitus in women. N Engl J Med. 2001;345(11):790-7.

Page | 318
171. Fukagawa NK, Anderson JW, Hageman G, Young VR, Minaker KL. High-carbohydrate, high-fiber diets increase peripheral insulin sensitivity in healthy young and old adults. Am J Clin Nutr. 1990;52(3):524-8.
172. Swinburn BA, Boyce VL, Bergman RN, Howard BV, Bogardus C. Deterioration in carbohydrate metabolism and lipoprotein changes induced by modern, high fat diet in Pima Indians and Caucasians. J Clin Endocrinol Metab. 1991;73(1):156-65.
173. Pittas AG, Sun Q, Manson JE, Dawson-Hughes B, Hu FB. Plasma 25-hydroxyvitamin D concentration and risk of incident type 2 diabetes in women. Diabetes Care. 2010;33(9):2021-3.
174. Song Y, Wang L, Pittas AG, Del Gobbo LC, Zhang C, Manson JE, et al. Blood 25-hydroxy vitamin D levels and incident type 2 diabetes: a meta-analysis of prospective studies. Diabetes Care. 2013;36(5):1422-8.
175. de Boer IH, Tinker LF, Connelly S, Curb JD, Howard BV, Kestenbaum B, et al. Calcium plus vitamin D supplementation and the risk of incident diabetes in the Women's Health Initiative. Diabetes Care. 2008;31(4):701-7.
176. Avenell A, Cook JA, MacLennan GS, McPherson GC, Record trial group. Vitamin D supplementation and type 2 diabetes: a substudy of a randomised placebo-controlled trial in older people. Age Ageing. 2009;38(5):606-9.
177. Zittermann A, Frisch S, Berthold HK, Gotting C, Kuhn J, Kleesiek K, et al. Vitamin D supplementation enhances the beneficial effects of weight loss on cardiovascular disease risk markers. Am J Clin Nutr. 2009;89(5):1321-7.
178. Jorde R, Sneve M, Torjesen P, Figenschau Y. No improvement in cardiovascular risk factors in overweight and obese subjects after supplementation with vitamin D3 for 1 year. J Intern Med. 2010;267(5):462-72.
179. Wood AD, Secombes KR, Thies F, Aucott L, Black AJ, Mavroeidi A, et al. Vitamin D3 supplementation has no effect on conventional cardiovascular risk factors: a parallel-group, double-blind, placebo-controlled RCT. J Clin Endocrinol Metab. 2012;97(10):3557-68.
180. Nagpal J, Pande JN, Bhartia A. A double-blind, randomized, placebo-controlled trial of the short-term effect of vitamin D3 supplementation on insulin sensitivity in apparently healthy, middle-aged, centrally obese men. Diabet Med. 2009;26(1):19-27.
181. Grammatiki M, Rapti E, Karras S, Ajjan RA, Kotsa K. Vitamin D and diabetes mellitus: Causal or casual association? Rev Endocr Metab Disord. 2017;10.1007/s11154-016-9403-y.
182. Laakso M. Cardiovascular disease in type 2 diabetes: challenge for treatment and prevention. J Intern Med. 2001;249(3):225-35.
183. Hansson GK, Libby P. The immune response in atherosclerosis: a double-edged sword. Nat Rev Immunol. 2006;6(7):508-19.

Page | 319
184. Pradhan AD, Manson JE, Rifai N, Buring JE, Ridker PM. C-reactive protein, interleukin 6, and risk of developing type 2 diabetes mellitus. JAMA. 2001;286(3):327-34.
185. Hordern MD, Dunstan DW, Prins JB, Baker MK, Singh MA, Coombes JS. Exercise prescription for patients with type 2 diabetes and pre-diabetes: a position statement from Exercise and Sport Science Australia. J Sci Med Sport. 2012;15(1):25-31.
186. Johnson M, Jones R, Freeman C, Woods HB, Gillett M, Goyder E, et al. Can diabetes prevention programmes be translated effectively into real-world settings and still deliver improved outcomes? A synthesis of evidence. Diabetes Medicine. 2013;30(1):3-15.
187. Eriksson KF, Lindgarde F. Prevention of type 2 (non-insulin-dependent) diabetes mellitus by diet and physical exercise. The 6-year Malmo feasibility study. Diabetologia. 1991;34(12):891-8.
188. Knowler WC, Barret-Connor E, Fowler SE, Hamman RF, Lachin JM. Reduction in the incidence of type 2 diabetes with lifestyle among subjects with impaired glucose tolerance. N Engl J Med. 2002;346:393-403.
189. Li G, Zhang P, Wang J, Gregg EW, Yang W, Gong Q, et al. The long-term effect of lifestyle interventions to prevent diabetes in the China Da Qing Diabetes Prevention Study: a 20-year follow-up study. Lancet. 2008;371(9626):1783-9.
190. Lindstrom J, Ilanne-Parikka P, Peltonen M, Aunola S, Eriksson JG, Hemio K, et al. Sustained reduction in the incidence of type 2 diabetes by lifestyle intervention: follow-up of the Finnish Diabetes Prevention Study. Lancet. 2006;368(9548):1673-9.
191. The Diabetes Prevention Program Research Group. The Diabetes Prevention Program (DPP): Description of lifestyle intervention. Diabetes Care. 2002;25(12):2165-71.
192. Stiegler RS, Zimmet PZ, Cameron AJ, Shaw JE. Lifestyle management: preventing Type 2 diabets and cardiovascular complications. Therapy. 2009;6(4):489-96.
193. Gillies CL, Abrams KR, Lambert PC, Cooper NJ, Sutton AJ, Hsu RT, et al. Pharmacological and lifestyle interventions to prevent or delay type 2 diabetes in people with impaired glucose tolerance: systematic review and meta-analysis. BMJ. 2007;334(7588):299.
194. Yoon U, Kwok LL, Magkidis A. Efficacy of lifestyle interventions in reducing diabetes incidence in patients with impaired glucose tolerance: a systematic review of randomized controlled trials. Metabolism. 2013;62(2):303-14.
195. Hood DA. Invited Review: contractile activity-induced mitochondrial biogenesis in skeletal muscle. J Appl Physiol. 2001;90(3):1137-57.

Page | 320
196. Tipton KD, Rasmussen BB, Miller SL, Wolf SE, Owens-Stovall SK, Petrini BE, et al. Timing of amino acid-carbohydrate ingestion alters anabolic response of muscle to resistance exercise. Am J Physiol Endocrinol Metab. 2001;281(2):197-206.
197. Haskell WL, Lee I, Pate RR, Powell KE, Blair SN, Franklin BA, et al. Physical activity and public health: Updated recommendation for adults from the American College of Sports Medicine and the American Heart Association. Circulation. 2007;116(9):1081-93.
198. American Diabetes Association. Standards of Medical Care in Diabetes 2017. Diabetes Care. 2016;40(Suppl 1).
199. Bacchi E, Negri C, Targher G, Faccioli N, Lanza M, Zoppini G, et al. Both resistance training and aerobic training reduce hepatic fat content in type 2 diabetic subjects with nonalcoholic fatty liver disease (the RAED2 Randomized Trial). Hepatology. 2013;58(4):1287-95.
200. Motahari-Tabari N, Ahmad Shirvani M, Shirzad EAM, Yousefi-Abdolmaleki E, Teimourzadeh M. The effect of 8 weeks aerobic exercise on insulin resistance in type 2 diabetes: a randomized clinical trial. Glob J Health Sci. 2014;7(1):115-21.
201. Bloomgarden ZT. American Diabetes Association Annual Meeting, 1999: diabetes and obesity. Diabetes Care. 2000;23(1):118-24.
202. Cauza E, Hanusch-Enserer U, Strasser B, Ludvik B, Metz-Schimmerl S, Pacini G, et al. The relative benefits of endurance and strength training on the metabolic factors and muscle function of people with type 2 diabetes mellitus. Arch Phys Med Rehabil. 2005;86(8):1527-33.
203. Castaneda C, Layne JE, Munoz-Orians L, Gordon PL, Walsmith J, Foldvari M, et al. A randomized controlled trial of resistance exercise training to improve glycemic control in older adults with type 2 diabetes. Diabetes Care. 2002;25(12):2335-41.
204. Dunstan DW, Vulikh E, Owen N, Jolley D, Shaw J, Zimmet P. Community center-based resistance training for the maintenance of glycemic control in adults with type 2 diabetes. Diabetes Care. 2006;29(12):2586-91.
205. Dunstan DW, Puddey IB, Beilin LJ, Burke V, Morton AR, Stanton KG. Effects of a short-term circuit weight training program on glycaemic control in NIDDM. Diabetes Res Clin Pract. 1998;40(1):53-61.
206. Ng CLW, Goh SY, Malhotra R, Ostbye T, Tai ES. Minimal difference between aerobic and progressive resistance exercise on metabolic profile and fitness in older adults with diabetes mellitus: a randomised trial. J Physiother. 2010;56(3):163-70.
207. Cauza E, Hanusch-Enserer U, Strasser B, Kostner K, Dunky A, Haber P. Strength and endurance training lead to different post exercise glucose profiles

Page | 321
in diabetic participants using a continuous subcutaneous glucose monitoring system. Eur J Clin Invest. 2005;35(12):745-51.
208. Kwon HR, Han KA, Ku YH, Ahn HJ, Koo BK, Kim HC, et al. The effects of resistance training on muscle and body fat mass and muscle strength in type 2 diabetic women. Korean Diabetes J. 2010;34(2):101-10.
209. Snowling NJ, Hopkins WG. Effects of different modes of exercise training on glucose control and risk factors for complications in type 2 diabetic patients: a meta-analysis. Diabetes Care. 2006;29(11):2518-27.
210. Praet SF, van Loon LJ. Optimizing the therapeutic benefits of exercise in Type 2 diabetes. J Appl Physiol. 2007;103(4):1113-20.
211. Willey KA, Singh MA. Battling insulin resistance in elderly obese people with type 2 diabetes: bring on the heavy weights. Diabetes Care. 2003;26(5):1580-8.
212. Yang Z, Scott CA, Mao C, Tang J, Farmer AJ. Resistance exercise versus aerobic exercise for type 2 diabetes: a systematic review and meta-analysis. Sports Med. 2014;44(4):487-99.
213. Colberg SR, Sigal RJ, Yardley JE, Riddell MC, Dunstan DW, Dempsey PC, et al. Physical Activity/Exercise and Diabetes: A Position Statement of the American Diabetes Association. Diabetes Care. 2016;39(11):2065-79.
214. de Lade CG, Marins JC, Lima LM, de Carvalho CJ, Teixeira RB, Albuquerque MR, et al. Effects of different exercise programs and minimal detectable changes in hemoglobin A1c in patients with type 2 diabetes. Diabetol Metab Syndr. 2016;8:13.
215. Plotnikoff RC, Eves N, Jung M, Sigal RJ, Padwal R, Karunamuni N. Multicomponent, home-based resistance training for obese adults with type 2 diabetes: a randomized controlled trial. Int J Obes. 2010;34(12):1733-41.
216. Honkola A, Forsen T, Eriksson J. Resistance training improves the metabolic profile in individuals with type 2 diabetes. Acta Diabetol. 1997;34(4):245-8.
217. Mavros Y, Kay S, Anderberg KA, Baker MK, Wang Y, Zhao R, et al. Changes in insulin resistance and HbA1c are related to exercise-mediated changes in body composition in older adults with type 2 diabetes: interim outcomes from the GREAT2DO trial. Diabetes Care. 2013;36(8):2372-9.
218. Jorge ML, de Oliveira VN, Resende NM, Paraiso LF, Calixto A, Diniz AL, et al. The effects of aerobic, resistance, and combined exercise on metabolic control, inflammatory markers, adipocytokines, and muscle insulin signaling in patients with type 2 diabetes mellitus. Metabolism. 2011;60(9):1244-52.
219. Balducci S, Zanuso S, Cardelli P, Salvi L, Mazzitelli G, Bazuro A, et al. Italian Diabetes Exercise Study (IDES) Investigators. Changes in physical fitness predict improvements in modifiable cardiovascular risk factors independently of body weight loss in subjects with type 2 diabetes participating in the Italian Diabetes and Exercise Study (IDES). Diabetes Care. 2012;35(6):1347-54.

Page | 322
220. Cuff DJ, Meneilly GS, Martin A, Ignaszewski A, Tildesley HD, Frohlich JJ. Effective exercise modality to reduce insulin resistance in women with type 2 diabetes. Diabetes Care. 2003;26(11):2977-82.
221. Tan SJ, Li W, Wang JX. Effects of six months of combined aerobic and resistance training for elderly patients with a long history of type 2 diabetes. J Sports Sci Med. 2012;11(3):495-501.
222. Liu Y, Liu SX, Cai Y, Xie KL, Zhang WL, Zheng F. Effects of combined aerobic and resistance training on the glycolipid metabolism and inflammation levels in type 2 diabetes mellitus. J Phys Ther Sci. 2015;27(7):2365-71.
223. Black LE, Swan PD, Alvar BA. Effects of intensity and volume on insulin sensitivity during acute bouts of resistance training. J Strength Cond Res. 2010;24(4):1109-16.
224. Ibanez J, Izquierdo M, Arguelles I, Forga L, Larrion JL, Garcia-Unciti M, et al. Twice-weekly progressive resistance training decreases abdominal fat and improves insulin sensitivity in older men with type 2 diabetes. Diabetes Care. 2005;28(3):662-7.
225. Baldi JC, Snowling N. Resistance training improves glycaemic control in obese type 2 diabetic men. Int J Sports Med. 2003;24(6):419-23.
226. Eriksson J, Taimela S, Eriksson K, Parviainen S, Peltonen J, Kujala U. Resistance training in the treatment of non-insulin-dependent diabetes mellitus. Int J Sports Med. 1997;18(4):242-6.
227. Umpierre D, Ribeiro PA, Kramer CK, Leitao CB, Zucatti AT, Azevedo MJ, et al. Physical activity advice only or structured exercise training and association with HbA1c levels in type 2 diabetes: a systematic review and meta-analysis. JAMA. 2011;305(17):1790-9.
228. Ishiguro H, Kodama S, Horikawa C, Fujihara K, Hirose AS, Hirasawa R, et al. In Search of the Ideal Resistance Training Program to Improve Glycemic Control and its Indication for Patients with Type 2 Diabetes Mellitus: A Systematic Review and Meta-Analysis. Sports Med. 2016;46(1):67-77.
229. Richter EA, Hargreaves M. Exercise, GLUT4, and skeletal muscle glucose uptake. Physiol Rev. 2013;93(3):993-1017.
230. Brooks N, Layne JE, Gordon PL, Roubenoff R, Nelson ME, Castaneda-Sceppa C. Strength training improves muscle quality and insulin sensitivity in Hispanic older adults with type 2 diabetes. Int J Med Sci. 2006;4(1):19-27.
231. Sigal RJ, Kenny GP, Wasserman DH, Castaneda-Sceppa C, White RD. Physical activity/exercise and type 2 diabetes: a consensus statement from the American Diabetes Association. Diabetes Care. 2006;29(6):1433-8.
232. Esposito K, Pontillo A, Giugliano F, Giugliano G, Marfella R, Nicoletti G, et al. Association of low interleukin-10 levels with the metabolic syndrome in obese women. J Clin Endocrinol Metab. 2003;88(3):1055-8.

Page | 323
233. Ryan AS, Nicklas BJ. Reductions in plasma cytokine levels with weight loss improve insulin sensitivity in overweight and obese postmenopausal women. Diabetes Care. 2004;27(7):1699-705.
234. Cottam DR, Mattar SG, Barinas-Mitchell E, Eid G, Kuller L, Kelley DE, et al. The chronic inflammatory hypothesis for the morbidity associated with morbid obesity: implications and effects of weight loss. Obes Surg. 2004;14(5):589-600.
235. Hamer M, Sabia S, Batty GD, Shipley MJ, Tabak AG, Singh-Manoux A, et al. Physical activity and inflammatory markers over 10 years: follow-up in men and women from the Whitehall II cohort study. Circulation. 2012;126(8):928-33.
236. Kadoglou NP, Fotiadis G, Athanasiadou Z, Vitta I, Lampropoulos S, Vrabas IS. The effects of resistance training on ApoB/ApoA-I ratio, Lp(a) and inflammatory markers in patients with type 2 diabetes. Endocrine. 2012;42(3):561-9.
237. Swift DL, Johannsen NM, Earnest CP, Blair SN, Church TS. Effect of exercise training modality on C-reactive protein in type 2 diabetes. Med Sci Sports Exerc. 2012;44(6):1028-34.
238. Mavros Y, Kay S, Simpson KA, Baker MK, Wang Y, Zhao RR, et al. Reductions in C-reactive protein in older adults with type 2 diabetes are related to improvements in body composition following a randomized controlled trial of resistance training. J Cachexia Sarcopenia Muscle. 2014;5(2):111-20.
239. Kim KB. Effect of different training mode on Interleukin-6 (IL-6) and C-reactive protein (CRP) in type 2 diabetes mellitus (T2DM) patients. J Exerc Nutrition Biochem. 2014;18(4):371-8.
240. Donges CE, Duffield R, Drinkwater EJ. Effects of resistance or aerobic exercise training on interleukin-6, C-reactive protein, and body composition. Med Sci Sports Exerc. 2010;42(2):304-13.
241. Vieira VJ, Valentine RJ, Wilund KR, Woods JA. Effects of diet and exercise on metabolic disturbances in high-fat diet-fed mice. Cytokine. 2009;46(3):339-45.
242. Vieira VJ, Valentine RJ, Wilund KR, Antao N, Baynard T, Woods JA. Effects of exercise and low-fat diet on adipose tissue inflammation and metabolic complications in obese mice. Am J Physiol Endocrinol Metab. 2009;296(5).
243. Zhang W, Mottillo EP, Zhao J, Gartung A, VanHecke GC, Lee JF, et al. Adipocyte lipolysis-stimulated interleukin-6 production requires sphingosine kinase 1 activity. J Biol Chem. 2014;289(46):32178-85.
244. Hayashino Y, Jackson JL, Hirata T, Fukumori N, Nakamura F, Fukuhara S, et al. Effects of exercise on C-reactive protein, inflammatory cytokine and adipokine in patients with type 2 diabetes: a meta-analysis of randomized controlled trials. Metabolism. 2014;63(3):431-40.

Page | 324
245. Nascimento Dda C, Tibana RA, Benik FM, Fontana KE, Ribeiro Neto F, Santana FS, et al. Sustained effect of resistance training on blood pressure and hand grip strength following a detraining period in elderly hypertensive women: a pilot study. Clin Interv Aging. 2014;9:219-25.
246. Payne WR, Walsh KJ, Harvey JT, Livy MF, McKenzie KJ, Donaldson A, et al. Effect of a low-resource-intensive lifestyle modification program incorporating gymnasium-based and home-based resistance training on type 2 diabetes risk in Australian adults. Diabetes Care. 2008;31(12):2244-50.
247. Figueira FR, Umpierre D, Cureau FV, Zucatti AT, Dalzochio MB, Leitao CB, et al. Association between physical activity advice only or structured exercise training with blood pressure levels in patients with type 2 diabetes: a systematic review and meta-analysis. Sports Med. 2014;44(11):1557-72.
248. Amouzad Mahdirejei H, Fadaei Reyhan Abadei S, Abbaspour Seidi A, Eshaghei Gorji N, Rahmani Kafshgari H, Ebrahim Pour M, et al. Effects of an eight-week resistance training on plasma vaspin concentrations, metabolic parameters levels and physical fitness in patients with type 2 diabetes. Cell J. 2014;16(3):367-74.
249. James AP, Whiteford J, Ackland TR, Dhaliwal SS, Woodhouse JJ, Prince RL, et al. Effects of a 1-year randomised controlled trial of resistance training on blood lipid profile and chylomicron concentration in older men. Eur J Appl Physiol. 2016;116(11-12):2113-23.
250. Misra A, Alappan NK, Vikram NK, Goel K, Gupta N, Mittal K, et al. Effect of supervised progressive resistance-exercise training protocol on insulin sensitivity, glycemia, lipids, and body composition in Asian Indians with type 2 diabetes. Diabetes Care. 2008;31(7):1282-7.
251. Ribeiro AS, Tomeleri CM, Souza MF, Pina FL, Schoenfeld BJ, Nascimento MA, et al. Effect of resistance training on C-reactive protein, blood glucose and lipid profile in older women with differing levels of RT experience. Age (Dordr). 2015;37(6):109.
252. Bacchi E, Negri C, Zanolin ME, Milanese C, Faccioli N, Trombetta M, et al. Metabolic effects of aerobic training and resistance training in type 2 diabetic subjects: a randomized controlled trial (the RAED2 study). Diabetes Care. 2012;35(4):676-82.
253. Sukala WR, Page R, Rowlands DS, Krebs J, Lys I, Leikis M, et al. South Pacific Islanders resist type 2 diabetes: comparison of aerobic and resistance training. Eur J Appl Physiol. 2012;112(1):317-25.
254. Mann S, Beedie C, Jimenez A. Differential effects of aerobic exercise, resistance training and combined exercise modalities on cholesterol and the lipid profile: review, synthesis and recommendations. Sports Med. 2014;44(2):211-21.

Page | 325
255. Minges KE, Cormick G, Unglik E, Dunstan DW. Evaluation of a resistance training program for adults with or at risk of developing diabetes: an effectiveness study in a community setting. Int J Behav Nutr Phys Act. 2011;8(1):50-7.
256. King AC, Rejeski WJ, Buchner DM. Physical activity interventions targeting older adults. A critical review and recommendations. Am J Prev Med. 1998;15(4):316-33.
257. Ackermann RT, Cheadle A, Sandhu N, Madsen L, Wagner EH, LoGerfo JP. Community exercise program use and changes in healthcare costs for older adults. Am J Prev Med. 2003;25(3):232-7.
258. Plotnikoff RC, Karunamuni ND, Johnson JA, Kotovych M, Svenson LW. Health-related behaviours in adults with diabetes: associations with health care utilization and costs. Can J Public Health. 2008;99(3):227-31.
259. Jacobs-van der Bruggen MA, Bos G, Bemelmans WJ, Hoogenveen RT, Vijgen SM, Baan CA. Lifestyle interventions are cost-effective in people with different levels of diabetes risk: results from a modeling study. Diabetes Care. 2007;30(1):128-34.
260. Evidence-Based Nutrition Principles and Recommendations for the Treatment and Prevention of Diabetes and Related Complications. Diabetes Care. 2002;25(1):202.
261. Krauss RM, Eckel RH, Howard BV, Appel LJ, Daniels SR, Deckelbaum RJ, et al. AHA Guidelines Revision 2000: A statement for healthcare professionals from the Nutrition Committee of the American Heart Association Circulation. 2000;102:2284-99.
262. Nutrition Committee of the British Diabetic Association's Professional Advisory Committee. Dietary recommendations for people with diabetes:an update for the 1990's. Diabet Med. 1992;9(2):189-202.
263. Gannon MC, Nuttall FQ, Saeed A, Jordan K, Hoover H. An increase in dietary protein improves the blood glucose response in persons with type 2 diabetes. Am J Clin Nutr. 2003;78(4):734-41.
264. Layman DK, Boileau RA, Erickson DJ, Painter JE, Shiue H, Sather C, et al. A reduced ratio of dietary carbohydrate to protein improves body composition and blood lipid profiles during weight loss in adult women. J Nutr. 2003;133(2):411-7.
265. Layman DK, Shiue H, Sather C, Erickson DJ, Baum J. Increased dietary protein modifies glucose and insulin homeostasis in adult women during weight loss. J Nutr. 2003;133(2):405-10.
266. Skov AR, Toubro S, Ronn B, Holm L, Astrup A. Randomized trial on protein vs carbohydrate in ad libitum fat reduced diet for the treatment of obesity. Int J Obes Relat Metab Disord. 1999;23(5):528-36.

Page | 326
267. Parker B, Noakes M, Luscombe N, Clifton P. Effect of a high-protein, high-monounsaturated fat weight loss diet on glycemic control and lipid levels in type 2 diabetes. Diabetes Care. 2002;25(3):425-30.
268. Ajala O, English P, Pinkney J. Systematic review and meta-analysis of different dietary approaches to the management of type 2 diabetes. Am J Clin Nutr. 2013;97(3):505-16.
269. Farnsworth E, Luscombe ND, Noakes M, Wittert G, Argyiou E, Clifton PM. Effect of a high-protein, energy-restricted diet on body composition, glycemic control, and lipid concentrations in overweight and obese hyperinsulinemic men and women. Am J Clin Nutr. 2003;78(1):31-9.
270. Gannon MC, Nuttall JA, Damberg G, Gupta V, Nuttall FQ. Effect of protein ingestion on the glucose appearance rate in people with type 2 diabetes. J Clin Endocrinol Metab. 2001;86(3):1040-7.
271. Bezerra Duarte SM, Faintuch J, Stefano JT, Sobral de Oliveira MB, de Campos Mazo DF, Rabelo F, et al. Hypocaloric high-protein diet improves clinical and biochemical markers in patients with nonalcoholic fatty liver disease (NAFLD). Nutr Hosp. 2014;29(1):94-101.
272. Gannon MC, Nuttall FQ. Effect of a high-protein, low-carbohydrate diet on blood glucose control in people with type 2 diabetes. Diabetes. 2004;53(9):2375-82.
273. Pedersen E, Jesudason DR, Clifton PM. High protein weight loss diets in obese subjects with type 2 diabetes mellitus. Nutr Metab Cardiovasc Dis. 2014;24(5):554-62.
274. Krebs JD, Elley CR, Parry-Strong A, Lunt H, Drury PL, Bell DA, et al. The Diabetes Excess Weight Loss (DEWL) Trial: a randomised controlled trial of high-protein versus high-carbohydrate diets over 2 years in type 2 diabetes. Diabetologia. 2012;55(4):905-14.
275. Manders RJ, Little JP, Forbes SC, Candow DG. Insulinotropic and muscle protein synthetic effects of branched-chain amino acids: potential therapy for type 2 diabetes and sarcopenia. Nutrients. 2012;4(11):1664-78.
276. van Loon LJ, Kruijshoop M, Menheere PP, Wagenmakers AJ, Saris WH, Keizer HA. Amino acid ingestion strongly enhances insulin secretion in patients with long-term type 2 diabetes. Diabetes Care. 2003;26(3):625-30.
277. Gannon MC, Nuttall FQ, Grant CT, Ercan-Fang S, Ercan-Fang N. Stimulation of insulin secretion by fructose ingested with protein in people with untreated type 2 diabetes. Diabetes Care. 1998;21(1):16-22.
278. Charles S, Henquin JC. Distinct effects of various amino acids on45Ca2+fluxes in rat pancreatic islets. Biochem J. 1983;214(3):899-907.
279. Dixon G, Nolan J, McClenaghan N, Flatt PR, Newsholme P. A comparative study of amino acid consumption by rat islet cells and the clonal beta-cell line

Page | 327
BRIN-BD11 - the functional significance of L-alanine. J Endocrinol. 2003;179(3):447-54.
280. Sener A, Malaisse WJ. L-leucine and a nonmetabolized analogue activate pancreatic islet glutamate dehydrogenase. Nature. 1980;288(5787):187-9.
281. Manders RJ, Hansen D, Zorenc AH, Dendale P, Kloek J, Saris WH, et al. Protein co-ingestion strongly increases postprandial insulin secretion in type 2 diabetes patients. J Med Food. 2014;17(7):758-63.
282. Verdijk LB, Jonkers RAM, Gleeson BG, Beelen M, Meijer K, Savelberg HHCM, et al. Protein supplementation before and after exercise does not further augment skeletal muscle hypertrophy after resistance training in elderly men. Am J Clin Nutr. 2009;89(2):608-16.
283. Tieland M, Dirks ML, van der Zwaluw N, Verdijk LB, van de Rest O, de Groot LC, et al. Protein supplementation increases muscle mass gain during prolonged resistance-type exercise training in frail elderly people: a randomized, double-blind, placebo-controlled trial. J Am Med Dir Assoc. 2012;13(8):713-9.
284. Leenders M, Verdijk LB, Van der Hoeven L, Van Kranenburg J, Nilwik R, Wodzig WK, et al. Protein supplementation during resistance-type exercise training in the elderly. Med Sci Sports Exerc. 2013;45(3):542-52.
285. Weinheimer EM, Conley TB, Kobza VM, Sands LP, Lim E, Janle EM, et al. Whey protein supplementation does not affect exercise training-induced changes in body composition and indices of metabolic syndrome in middle-aged overweight and obese adults. J Nutr. 2012;142(8):1532-9.
286. Wycherley TP, Noakes M, Clifton PM, Cleanthous X, Keogh JB, Brinkworth GD. A high-protein diet with resistance exercise training improves weight loss and body composition in overweight and obese patients with type 2 diabetes. Diabetes Care. 2010;33(5):969-76.
287. Nuttall FQ, Gannon MC. Metabolic response of people with type 2 diabetes to a high protein diet. Nutr Metab. 2004;1(1):6.
288. Brinkworth GD, Noakes M, Buckley JD, Keogh JB, Clifton PM. Long-term effects of a very-low-carbohydrate weight loss diet compared with an isocaloric low-fat diet after 12 mo. Am J Clin Nutr. 2009;90(1):23-32.
289. Mateo-Gallego R, Marco-Benedi V, Perez-Calahorra S, Bea AM, Baila-Rueda L, Lamiquiz-Moneo I, et al. Energy-restricted, high-protein diets more effectively impact cardiometabolic profile in overweight and obese women than lower-protein diets. Clin Nutr. 2017;36(2):371-9.
290. Symons TB, Sheffield-Moore M, Wolfe RR, Paddon-Jones D. A moderate serving of high-quality protein maximally stimulates skeletal muscle protein synthesis in young and elderly subjects. J Am Diet Assoc. 2009;109(9):1582-6.
291. Bosaeus I, Rothenberg E. Nutrition and physical activity for the prevention and treatment of age-related sarcopenia. Proc Nutr Soc. 2016;75(2):174-80.

Page | 328
292. Baum JI, Kim IY, Wolfe RR. Protein Consumption and the Elderly: What Is the Optimal Level of Intake? Nutrients. 2016;8(6).
293. Leidy HJ, Clifton PM, Astrup A, Wycherley TP, Westerterp-Plantenga MS, Luscombe-Marsh ND, et al. The role of protein in weight loss and maintenance. Am J Clin Nutr. 2015;101(6):1320S-9S.
294. Leidy HJ, Hoertel HA, Douglas SM, Higgins KA, Shafer RS. A high-protein breakfast prevents body fat gain, through reductions in daily intake and hunger, in "Breakfast skipping" adolescents. Obesity. 2015;23(9):1761-4.
295. Berryman CE, Agarwal S, Lieberman HR, Fulgoni VL, 3rd, Pasiakos SM. Diets higher in animal and plant protein are associated with lower adiposity and do not impair kidney function in US adults. Am J Clin Nutr. 2016;104(3):743-9.
296. Wycherley TP, Moran LJ, Clifton PM, Noakes M, Brinkworth GD. Effects of energy-restricted high-protein, low-fat compared with standard-protein, low-fat diets: a meta-analysis of randomized controlled trials. Am J Clin Nutr. 2012;96(6):1281-98.
297. Luscombe ND, Clifton PM, Noakes M, Parker B, Wittert G. Effects of energy-restricted diets containing increased protein on weight loss, resting energy expenditure, and the thermic effect of feeding in type 2 diabetes. Diabetes Care. 2002;25(4):652-7.
298. Karst H, Steiniger J, Noack R, Steglich HD. Diet-induced thermogenesis in man: thermic effects of single proteins, carbohydrates and fats depending on their energy amount. Ann Nutr Metab. 1984;28(4):245-52.
299. Westerterp KR, Wilson SA, Rolland V. Diet induced thermogenesis measured over 24h in a respiration chamber: effect of diet composition. Int J Obes Relat Metab Disord. 1999;23(3):287-92.
300. Leibel RL, Rosenbaum M, Hirsch J. Changes in energy expenditure resulting from altered body weight. N Engl J Med. 1995;332(10):621-8.
301. Bessard T, Schutz Y, Jequier E. Energy-Expenditure and Postprandial Thermogenesis in Obese Women before and after Weight-Loss. Am J Clin Nutr. 1983;38(5):680-93.
302. Westman EC, Yancy WS, Edman JS, Tomlin KF, Perkins CE. Effect of 6-month adherence to a very low carbohydrate diet program. Am J Med. 2002;113(1):30-6.
303. Astrup A. The satiating power of protein--a key to obesity prevention? Am J Clin Nutr. 2005;82(1):1-2.
304. Pesta DH, Samuel VT. A high-protein diet for reducing body fat: mechanisms and possible caveats. Nutr Metab. 2014;11(1):53.
305. Layman DK, Evans E, Baum JI, Seyler J, Erickson DJ, Boileau RA. Dietary protein and exercise have additive effects on body composition during weight loss in adult women. J Nutr. 2005;135(8):1903-10.

Page | 329
306. Brinkworth GD, Noakes M, Parker B, Foster P, Clifton PM. Long-term effects of advice to consume a high-protein, low-fat diet, rather than a conventional weight-loss diet, in obese adults with type 2 diabetes: one-year follow-up of a randomised trial. Diabetologia. 2004;47(10):1677-86.
307. Westman EC, Yancy WS, Jr., Mavropoulos JC, Marquart M, McDuffie JR. The effect of a low-carbohydrate, ketogenic diet versus a low-glycemic index diet on glycemic control in type 2 diabetes mellitus. Nutr Metab. 2008;5(1):36.
308. Kouw IW, Gorissen SH, Burd NA, Cermak NM, Gijsen AP, van Kranenburg J, et al. Postprandial Protein Handling Is Not Impaired in Type 2 Diabetes Patients When Compared With Normoglycemic Controls. J Clin Endocrinol Metab. 2015;100(8):3103-11.
309. Paddon-Jones D, Sheffield-Moore M, Zhang XJ, Volpi E, Wolf SE, Aarsland A, et al. Amino acid ingestion improves muscle protein synthesis in the young and elderly. Am J Physiol Endocrinol Metab. 2004;286(3):321-8.
310. Breen L, Phillips SM. Skeletal muscle protein metabolism in the elderly: Interventions to counteract the 'anabolic resistance' of ageing. Nutr Metab. 2011;8(68).
311. Manders RJ, Koopman R, Beelen M, Gijsen AP, Wodzig WK, Saris WH, et al. The muscle protein synthetic response to carbohydrate and protein ingestion is not impaired in men with longstanding type 2 diabetes. J Nutr. 2008;138(6):1079-85.
312. Katsanos CS, Kobayashi H, Sheffield-Moore M, Aarsland A, Wolfe RR. A high proportion of leucine is required for optimal stimulation of the rate of muscle protein synthesis by essential amino acids in the elderly. Am J Physiol Endocrinol Metab. 2006;291(2):381-7.
313. Gougeon R. Insulin resistance of protein metabolism in type 2 diabetes and impact on dietary needs: a review. Can J Diabetes. 2013;37(2):115-20.
314. Pereira S, Marliss EB, Morais JA, Chevalier S, Gougeon R. Insulin resistance of protein metabolism in type 2 diabetes. Diabetes. 2008;57(1):56-63.
315. Papakonstantinou E, Triantafillidou D, Panagiotakos DB, Koutsovasilis A, Saliaris M, Manolis A, et al. A high-protein low-fat diet is more effective in improving blood pressure and triglycerides in calorie-restricted obese individuals with newly diagnosed type 2 diabetes. Eur J Clin Nutr. 2010;64(6):595-602.
316. Tay J, Luscombe-Marsh ND, Thompson CH, Noakes M, Buckley JD, Wittert GA, et al. A very low-carbohydrate, low-saturated fat diet for type 2 diabetes management: a randomized trial. Diabetes Care. 2014;37(11):2909-18.
317. Raymond F, Wang L, Moser M, Metairon S, Mansourian R, Zwahlen MC, et al. Consequences of exchanging carbohydrates for proteins in the cholesterol metabolism of mice fed a high-fat diet. PLoS One. 2012;7(11).

Page | 330
318. Bortolotti M, Kreis R, Debard C, Cariou B, Faeh D, Chetiveaux M, et al. High protein intake reduces intrahepatocellular lipid deposition in humans. Am J Clin Nutr. 2009;90(4):1002-10.
319. Zhang X, Beynen AC. Lowering effect of dietary milk-whey protein v. casein on plasma and liver cholesterol concentrations in rats. Br J Nutr. 1993;70(1):139-46.
320. Hosomi R, Fukunaga K, Arai H, Kanda S, Nishiyama T, Yoshida M. Fish protein hydrolysates affect cholesterol metabolism in rats fed non-cholesterol and high-cholesterol diets. J Med Food. 2012;15(3):299-306.
321. Shukla A, Brandsch C, Bettzieche A, Hirche F, Stangl GI, Eder K. Isoflavone-poor soy protein alters the lipid metabolism of rats by SREBP-mediated down-regulation of hepatic genes. J Nutr Biochem. 2007;18(5):313-21.
322. Lovati MR, Manzoni C, Canavesi A, Sirtori M, Vaccarino V, Marchi M, et al. Soybean protein diet increases low density lipoprotein receptor activity in mononuclear cells from hypercholesterolemic patients. J Clin Invest. 1987;80(5):1498-502.
323. Potter SM. Overview of proposed mechanisms for the hypocholesterolemic effect of soy. J Nutr. 1995;125(3 Suppl):606S-11S.
324. El Khoury D, Anderson GH. Recent advances in dietary proteins and lipid metabolism. Curr Opin Lipidol. 2013;24(3):207-13.
325. Zemel MB, Sun X, Sobhani T, Wilson B. Effects of dairy compared with soy on oxidative and inflammatory stress in overweight and obese subjects. Am J Clin Nutr. 2010;91(1):16-22.
326. Zhou LM, Xu JY, Rao CP, Han S, Wan Z, Qin LQ. Effect of whey supplementation on circulating C-reactive protein: a meta-analysis of randomized controlled trials. Nutrients. 2015;7(2):1131-43.
327. Ball L, Davmor R, Leveritt M, Desbrow B, Ehrlich C, Chaboyer W. The nutrition care needs of patients newly diagnosed with type 2 diabetes: informing dietetic practice. J Hum Nutr Diet. 2016;29(4):487-94.
328. Lichtman SW, Pisarska K, Berman ER, Pestone M, Dowling H, Offenbacher E, et al. Discrepancy between self-reported and actual caloric intake and exercise in obese subjects. N Engl J Med. 1992;327(27):1893-8.
329. Sousa GT, Lira FS, Rosa JC, de Oliveira EP, Oyama LM, Santos RV, et al. Dietary whey protein lessens several risk factors for metabolic diseases: a review. Lipids Health Dis. 2012;11:67.
330. Gill HS, Rutherford KJ, Cross ML. Bovine milk: a unique source of immunomodulatory ingredients for functional foods. In: Buttriss J, Saltmarsh M, editors. Functional Foods II –Claims and Evidence. Cambridge, England: Royal Society of Chemistry Press; 2000. p. 82-90.
331. Marshall K. Therapeutic applications of whey protein. Altern Med Rev. 2004;9(2):136-56.

Page | 331
332. Mignone LE, Wu T, Horowitz M, Rayner CK. Whey protein: The "whey" forward for treatment of type 2 diabetes? World J Diabetes. 2015;6(14):1274-84.
333. Pal S, Radavelli-Bagatini S. The effects of whey protein on cardiometabolic risk factors. Obes Rev. 2013;14(4):324-43.
334. Walzem RL, Dillard CJ, German JB. Whey components: millennia of evolution create functionalities for mammalian nutrition: what we know and what we may be overlooking. Crit Rev Food Sci Nutr. 2002;42(4):353-75.
335. Etzel MR. Manufacture and use of dairy protein fractions. J Nutr. 2004;134(4):996S-1002S.
336. Krissansen GW. Emerging health properties of whey proteins and their clinical implications. J Am Coll Nutr. 2007;26(6):713S-23S.
337. Mortensen LS, Holmer-Jensen J, Hartvigsen ML, Jensen VK, Astrup A, de Vrese M, et al. Effects of different fractions of whey protein on postprandial lipid and hormone responses in type 2 diabetes. Eur J Clin Nutr. 2012;66(7):799-805.
338. Walrand S, Gryson C, Salles J, Giraudet C, Migne C, Bonhomme C, et al. Fast-digestive protein supplement for ten days overcomes muscle anabolic resistance in healthy elderly men. Clin Nutr. 2016;35(3):660-8.
339. Luiking YC, Deutz NE, Memelink RG, Verlaan S, Wolfe RR. Postprandial muscle protein synthesis is higher after a high whey protein, leucine-enriched supplement than after a dairy-like product in healthy older people: a randomized controlled trial. Nutr J. 2014;13:9.
340. Devries MC, Phillips SM. Supplemental protein in support of muscle mass and health: advantage whey. J Food Sci. 2015;80(Suppl 1).
341. Ma J, Jesudason DR, Stevens JE, Keogh JB, Jones KL, Clifton PM, et al. Sustained effects of a protein 'preload' on glycaemia and gastric emptying over 4 weeks in patients with type 2 diabetes: A randomized clinical trial. Diabetes Res Clin Pract. 2015;108(2).
342. Ma J, Stevens JE, Cukier K, Maddox AF, Wishart JM, Jones KL, et al. Effects of a protein preload on gastric emptying, glycemia, and gut hormones after a carbohydrate meal in diet-controlled type 2 diabetes. Diabetes Care. 2009;32(9):1600-2.
343. Clifton PM, Galbraith C, Coles L. Effect of a low dose whey/guar preload on glycemic control in people with type 2 diabetes--a randomised controlled trial. Nutr J. 2014;13(103):103.
344. Weigle DS, Breen PA, Matthys CC, Callahan HS, Meeuws KE, Burden VR, et al. A high-protein diet induces sustained reductions in appetite, ad libitum caloric intake, and body weight despite compensatory changes in diurnal plasma leptin and ghrelin concentrations. Am J Clin Nutr. 2005;82(1):41-8.

Page | 332
345. Leidy HJ, Carnell NS, Mattes RD, Campbell WW. Higher protein intake preserves lean mass and satiety with weight loss in pre-obese and obese women. Obesity. 2007;15(2):421-9.
346. Jakubowicz D, Froy O. Biochemical and metabolic mechanisms by which dietary whey protein may combat obesity and Type 2 diabetes. J Nutr Biochem. 2013;24(1):1-5.
347. Tappy L, Jequier E, Acheson K. Thermic effect of infused amino acids in healthy humans and in subjects with insulin resistance. Am J Clin Nutr. 1993;57(6):912-6.
348. Monteyne A, Martin A, Jackson L, Corrigan N, Stringer E, Newey J, et al. Whey protein consumption after resistance exercise reduces energy intake at a post-exercise meal. Eur J Nutr. 2016;10.1007/s00394-016-1344-4.
349. Burd NA, Yang Y, Moore DR, Tang JE, Tarnopolsky MA, Phillips SM. Greater stimulation of myofibrillar protein synthesis with ingestion of whey protein isolate v. micellar casein at rest and after resistance exercise in elderly men. Br J Nutr. 2012;108(6):958-62.
350. Bendtsen LQ, Lorenzen JK, Bendsen NT, Rasmussen C, Astrup A. Effect of dairy proteins on appetite, energy expenditure, body weight, and composition: a review of the evidence from controlled clinical trials. Adv Nutr. 2013;4(4):418-38.
351. Pal S, Ellis V, Dhaliwal S. Effects of whey protein isolate on body composition, lipids, insulin and glucose in overweight and obese individuals. Br J Nutr. 2010;104(5):716-23.
352. Coker RH, Miller S, Schutzler S, Deutz N, Wolfe RR. Whey protein and essential amino acids promote the reduction of adipose tissue and increased muscle protein synthesis during caloric restriction-induced weight loss in elderly, obese individuals. Nutr J. 2012;11:105.
353. Baer DJ, Stote KS, Paul DR, Harris GK, Rumpler WV, Clevidence BA. Whey protein but not soy protein supplementation alters body weight and composition in free-living overweight and obese adults. J Nutr. 2011;141(8):1489-94.
354. Claessens M, van Baak MA, Monsheimer S, Saris WH. The effect of a low-fat, high-protein or high-carbohydrate ad libitum diet on weight loss maintenance and metabolic risk factors. Int J Obes. 2009;33(3):296-304.
355. Tahavorgar A, Vafa M, Shidfar F, Gohari M, Heydari I. Whey protein preloads are more beneficial than soy protein preloads in regulating appetite, calorie intake, anthropometry, and body composition of overweight and obese men. Nutr Res. 2014;34(10):856-61.
356. Pal S, Ellis V. The acute effects of four protein meals on insulin, glucose, appetite and energy intake in lean men. Br J Nutr. 2010;104(8):1241-8.

Page | 333
357. Cummings DE. Ghrelin and the short- and long-term regulation of appetite and body weight. Physiol Behav. 2006;89(1):71-84.
358. Mellinkoff SM, Frankland M, Boyle D, Greipel M. Relationship between serum amino acid concentration and fluctuations in appetite. J Appl Physiol. 1956;8(5):535-8.
359. Bowen J, Noakes M, Trenerry C, Clifton PM. Energy intake, ghrelin, and cholecystokinin after different carbohydrate and protein preloads in overweight men. J Clin Endocrinol Metab. 2006;91(4):1477-83.
360. Bowen J, Noakes M, Clifton PM. Appetite regulatory hormone responses to various dietary proteins differ by body mass index status despite similar reductions in ad libitum energy intake. J Clin Endocrinol Metab. 2006;91(8):2913-9.
361. Landi F, Calvani R, Tosato M, Martone AM, Ortolani E, Savera G, et al. Protein Intake and Muscle Health in Old Age: From Biological Plausibility to Clinical Evidence. Nutrients. 2016;8(5).
362. Wolfe RR. Regulation of muscle protein by amino acids. J Nutr. 2002;132(10):3219S-24S.
363. Phillips SM, Tang JE, Moore DR. The role of milk- and soy-based protein in support of muscle protein synthesis and muscle protein accretion in young and elderly persons. J Am Coll Nutr. 2009;28(4):343-54.
364. Pennings B, Groen B, de Lange A, Gijsen AP, Zorenc AH, Senden JM, et al. Amino acid absorption and subsequent muscle protein accretion following graded intakes of whey protein in elderly men. Am J Physiol Endocrinol Metab. 2012;302(8):992-9.
365. Floyd JC, Jr., Fajans SS, Pek S, Thiffault CA, Knopf RF, Conn JW. Synergistic effect of certain amino acid pairs upon insulin secretion in man. Diabetes. 1970;19(2):102-8.
366. Manders RJ, Koopman R, Sluijsmans WE, van den Berg R, Verbeek K, Saris WH, et al. Co-ingestion of a protein hydrolysate with or without additional leucine effectively reduces postprandial blood glucose excursions in Type 2 diabetic men. J Nutr. 2006;136(5):1294-9.
367. Churchward-Venne TA, Burd NA, Phillips SM. Nutritional regulation of muscle protein synthesis with resistance exercise: strategies to enhance anabolism. Nutr Metab. 2012;9(40).
368. Drummond MJ, Rasmussen BB. Leucine-enriched nutrients and the regulation of mammalian target of rapamycin signalling and human skeletal muscle protein synthesis. Curr Opin Clin Nutr Metab Care. 2008;11(3):222-6.
369. Norton LE, Wilson GJ, Layman DK, Moulton CJ, Garlick PJ. Leucine content of dietary proteins is a determinant of postprandial skeletal muscle protein synthesis in adult rats. Nutr Metab. 2012;9(1):67.

Page | 334
370. Daly RM. Dietary Protein, Exercise and Skeletal Muscle: Is There a Synergistic Effect in Older Adults and the Elderly? In: Weaver CM, Daly RM, Bischoff-Ferrari HA, editors. Nutritional Influences on Bone Health: 9th International Symposium;10.1007/978-3-319-32417-3_6: Springer International Publishing; 2016. p. 63-75.
371. Zhu K, Kerr DA, Meng X, Devine A, Solah V, Binns CW, et al. Two-Year Whey Protein Supplementation Did Not Enhance Muscle Mass and Physical Function in Well-Nourished Healthy Older Postmenopausal Women. J Nutr. 2015;145(11):2520-6.
372. Pal S, Radavelli-Bagatini S, Hagger M, Ellis V. Comparative effects of whey and casein proteins on satiety in overweight and obese individuals: a randomized controlled trial. Eur J Clin Nutr. 2014;68(9):980-6.
373. Bosse JD, Dixon BM. Dietary protein to maximize resistance training: a review and examination of protein spread and change theories. J Int Soc Sports Nutr. 2012;9(1):42.
374. Morley JE, Argiles JM, Evans WJ, Bhasin S, Cella D, Deutz NE, et al. Nutritional recommendations for the management of sarcopenia. J Am Med Dir Assoc. 2010;11(6):391-6.
375. Arnal MA, Mosoni L, Boirie Y, Houlier ML, Morin L, Verdier E, et al. Protein pulse feeding improves protein retention in elderly women. Am J Clin Nutr. 1999;69(6):1202-8.
376. Rizzoli R, Stevenson JC, Bauer JM, van Loon LJ, Walrand S, Kanis JA, et al. The role of dietary protein and vitamin D in maintaining musculoskeletal health in postmenopausal women: a consensus statement from the European Society for Clinical and Economic Aspects of Osteoporosis and Osteoarthritis (ESCEO). Maturitas. 2014;79(1):122-32.
377. Chale A, Cloutier GJ, Hau C, Phillips EM, Dallal GE, Fielding RA. Efficacy of whey protein supplementation on resistance exercise-induced changes in lean mass, muscle strength, and physical function in mobility-limited older adults. J Gerontol A Biol Sci Med Sci. 2013;68(6):682-90.
378. Mortensen LS, Hartvigsen ML, Brader LJ, Astrup A, Schrezenmeir J, Holst JJ, et al. Differential effects of protein quality on postprandial lipemia in response to a fat-rich meal in type 2 diabetes: comparison of whey, casein, gluten, and cod protein. Am J Clin Nutr. 2009;90(1):41-8.
379. Jakubowicz D, Froy O, Ahren B, Boaz M, Landau Z, Bar-Dayan Y, et al. Incretin, insulinotropic and glucose-lowering effects of whey protein pre-load in type 2 diabetes: a randomised clinical trial. Diabetologia. 2014;57(9):1807-11.
380. Adams RL, Broughton KS. Insulinotropic Effects of Whey: Mechanisms of Action, Recent Clinical Trials, and Clinical Applications. Ann Nutr Metab. 2016;69(1):56-63.

Page | 335
381. Gonlachanvit S, Hsu CW, Boden GH, Knight LC, Maurer AH, Fisher RS, et al. Effect of altering gastric emptying on postprandial plasma glucose concentrations following a physiologic meal in type-II diabetic patients. Dig Dis Sci. 2003;48(3):488-97.
382. Hayes M, Stanton C, Fitzgerald GF, Ross RP. Putting microbes to work: dairy fermentation, cell factories and bioactive peptides. Part II: bioactive peptide functions. Biotechnol J. 2007;2(4):435-49.
383. Kerasioti E, Stagos D, Georgatzi V, Bregou E, Priftis A, Kafantaris I, et al. Antioxidant Effects of Sheep Whey Protein on Endothelial Cells. Oxid Med Cell Longev. 2016;2016.
384. Pal S, Ellis V. The chronic effects of whey proteins on blood pressure, vascular function, and inflammatory markers in overweight individuals. Obesity. 2010;18(7):1354-9.
385. Pal S, Ellis V. Acute effects of whey protein isolate on blood pressure, vascular function and inflammatory markers in overweight postmenopausal women. Br J Nutr. 2011;105(10):1512-9.
386. Sugawara K, Takahashi H, Kashiwagura T, Yamada K, Yanagida S, Homma M, et al. Effect of anti-inflammatory supplementation with whey peptide and exercise therapy in patients with COPD. Respir Med. 2012;106(11):1526-34.
387. Yamaguchi M, Uchida M. Alpha-lactalbumin suppresses interleukin-6 release after intestinal ischemia/reperfusion via nitric oxide in rats. Inflammopharmacology. 2007;15(1):43-7.
388. Holmer-Jensen J, Karhu T, Mortensen LS, Pedersen SB, Herzig KH, Hermansen K. Differential effects of dietary protein sources on postprandial low-grade inflammation after a single high fat meal in obese non-diabetic subjects. Nutr J. 2011;10:115.
389. Perrone F, da-Silva-Filho AC, Adorno IF, Anabuki NT, Leal FS, Colombo T, et al. Effects of preoperative feeding with a whey protein plus carbohydrate drink on the acute phase response and insulin resistance. A randomized trial. Nutr J. 2011;10:66.
390. Petyaev IM, Dovgalevsky PY, Klochkov VA, Chalyk NE, Kyle N. Whey protein lycosome formulation improves vascular functions and plasma lipids with reduction of markers of inflammation and oxidative stress in prehypertension. Scientific World Journal. 2012;2012.
391. Herder C, Peltonen M, Koenig W, Kraft I, Muller-Scholze S, Martin S, et al. Systemic immune mediators and lifestyle changes in the prevention of type 2 diabetes: results from the Finnish Diabetes Prevention Study. Diabetes. 2006;55(8):2340-6.
392. de Aguilar-Nascimento JE, Prado Silveira BR, Dock-Nascimento DB. Early enteral nutrition with whey protein or casein in elderly patients with acute ischemic stroke: a double-blind randomized trial. Nutrition. 2011;27(4):440-4.

Page | 336
393. Duff WR, Chilibeck PD, Rooke JJ, Kaviani M, Krentz JR, Haines DM. The effect of bovine colostrum supplementation in older adults during resistance training. Int J Sport Nutr Exerc Metab. 2014;24(3):276-85.
394. Laviolette L, Lands LC, Dauletbaev N, Saey D, Milot J, Provencher S, et al. Combined effect of dietary supplementation with pressurized whey and exercise training in chronic obstructive pulmonary disease: a randomized, controlled, double-blind pilot study. J Med Food. 2010;13(3):589-98.
395. Lee YM, Skurk T, Hennig M, Hauner H. Effect of a milk drink supplemented with whey peptides on blood pressure in patients with mild hypertension. Eur J Nutr. 2007;46(1):21-7.
396. Gouni-Berthold I, Schulte DM, Krone W, Lapointe JF, Lemieux P, Predel HG, et al. The whey fermentation product malleable protein matrix decreases TAG concentrations in patients with the metabolic syndrome: a randomised placebo-controlled trial. Br J Nutr. 2012;107(11):1694-706.
397. Ticinesi A, Meschi T, Lauretani F, Felis G, Franchi F, Pedrolli C, et al. Nutrition and Inflammation in Older Individuals: Focus on Vitamin D, n-3 Polyunsaturated Fatty Acids and Whey Proteins. Nutrients. 2016;8(4):186.
398. Vinagre I, Sanchez-Quesada JL, Sanchez-Hernandez J, Santos D, Ordonez-Llanos J, De Leiva A, et al. Inflammatory biomarkers in type 2 diabetic patients: effect of glycemic control and impact of LDL subfraction phenotype. Cardiovasc Diabetol. 2014;13(34):34.
399. Kawase M, Hashimoto H, Hosoda M, Morita H, Hosono A. Effect of administration of fermented milk containing whey protein concentrate to rats and healthy men on serum lipids and blood pressure. J Dairy Sci. 2000;83(2):255-63.
400. Wu X, Tolvanen JP, Hutri-Kahonen N, Kahonen M, Makynen H, Korpela R, et al. Comparison of the effects of supplementation with whey mineral and potassium on arterial tone in experimental hypertension. Cardiovasc Res. 1998;40(2):364-74.
401. Ballard KD, Bruno RS, Seip RL, Quann EE, Volk BM, Freidenreich DJ, et al. Acute ingestion of a novel whey-derived peptide improves vascular endothelial responses in healthy individuals: a randomized, placebo controlled trial. Nutr J. 2009;8:34.
402. Ballard KD, Kupchak BR, Volk BM, Mah E, Shkreta A, Liptak C, et al. Acute effects of ingestion of a novel whey-derived extract on vascular endothelial function in overweight, middle-aged men and women. Br J Nutr. 2013;109(5):882-93.
403. Graf S, Egert S, Heer M. Effects of whey protein supplements on metabolism: evidence from human intervention studies. Curr Opin Clin Nutr Metab Care. 2011;14(6):569-80.

Page | 337
404. Ricci-Cabello I, Herrera MO, Artacho R. Possible role of milk-derived bioactive peptides in the treatment and prevention of metabolic syndrome. Nutr Rev. 2012;70(4):241-55.
405. McGregor RA, Poppitt SD. Milk protein for improved metabolic health: a review of the evidence. Nutr Metab. 2013;10(1):46.
406. Fluegel SM, Shultz TD, Powers JR, Clark S, Barbosa-Leiker C, Wright BR, et al. Whey beverages decrease blood pressure in prehypertensive and hypertensive young men and women. Int Dairy J. 2010;20(11):753-60.
407. Karpe F. Postprandial lipoprotein metabolism and atherosclerosis. J Intern Med. 1999;246(4):341-55.
408. Holick MF. Vitamin D deficiency. N Engl J Med. 2007;357(3):266-81. 409. Borel P, Caillaud D, Cano NJ. Vitamin D bioavailability: state of the art. Crit
Rev Food Sci Nutr. 2015;55(9):1193-205. 410. Holick MF. McCollum Award Lecture, 1994: vitamin D--new horizons for the
21st century. Am J Clin Nutr. 1994;60(4):619-30. 411. Shearer MJ. The roles of vitamins D and K in bone health and osteoporosis
prevention. Proc Nutr Soc. 1997;56(3):915-37. 412. Harris SS, Dawson-Hughes B. Plasma vitamin D and 25OHD responses of
young and old men to supplementation with vitamin D3. J Am Coll Nutr. 2002;21(4):357-62.
413. Harris SS, Dawson-Hughes B, Perrone GA. Plasma 25-hydroxyvitamin D responses of younger and older men to three weeks of supplementation with 1800 IU/day of vitamin D. J Am Coll Nutr. 1999;18(5):470-4.
414. Christakos S, Ajibade DV, Dhawan P, Fechner AJ, Mady LJ. Vitamin D: metabolism. Endocrinol Metab Clin North Am. 2010;39(2):243-53.
415. Bikle DD. Vitamin D metabolism, mechanism of action, and clinical applications. Chem Biol. 2014;21(3):319-29.
416. Working Group of the Australian and New Zealand Bone and Mineral Society; Endocrine Society of Australia; Osteoporosis Australia. Vitamin D and adult bone health in Australia and New Zealand: a position statement. Med J Aust. 2005;182(6):281-5.
417. Ross AC, Manson JE, Abrams SA, Aloia JF, Brannon PM, Clinton SK, et al. The 2011 report on dietary reference intakes for calcium and vitamin D from the Institute of Medicine: what clinicians need to know. J Clin Endocrinol Metab. 2011;96(1):53-8.
418. Dawson-Hughes B, Mithal A, Bonjour JP, Boonen S, Burckhardt P, Fuleihan GE, et al. IOF position statement: vitamin D recommendations for older adults. Osteoporos Int. 2010;21(7):1151-4.
419. Holick MF, Binkley NC, Bischoff-Ferrari HA, Gordon CM, Hanley DA, Heaney RP, et al. Evaluation, treatment, and prevention of vitamin D

Page | 338
deficiency: an Endocrine Society clinical practice guideline. J Clin Endocrinol Metab. 2011;96(7):1911-30.
420. Rosen CJ, Abrams SA, Aloia JF, Brannon PM, Clinton SK, Durazo-Arvizu RA, et al. IOM committee members respond to Endocrine Society vitamin D guideline. J Clin Endocrinol Metab. 2012;97(4):1146-52.
421. Van Belle TL, Gysemans C, Mathieu C. Vitamin D and diabetes: the odd couple. Trends Endocrinol Metab. 2013;24(11):561-8.
422. Wolden-Kirk H, Overbergh L, Christesen HT, Brusgaard K, Mathieu C. Vitamin D and diabetes: its importance for beta cell and immune function. Mol Cell Endocrinol. 2011;347(1-2):106-20.
423. Bland R, Markovic D, Hills CE, Hughes SV, Chan SL, Squires PE, et al. Expression of 25-hydroxyvitamin D3-1alpha-hydroxylase in pancreatic islets. J Steroid Biochem Mol Biol. 2004;89-90(1-5):121-5.
424. Baeke F, Takiishi T, Korf H, Gysemans C, Mathieu C. Vitamin D: modulator of the immune system. Curr Opin Pharmacol. 2010;10(4):482-96.
425. Pittas AG, Harris SS, Stark PC, Dawson-Hughes B. The effects of calcium and vitamin D supplementation on blood glucose and markers of inflammation in nondiabetic adults. Diabetes Care. 2007;30(4):980-6.
426. Ford ES, Ajani UA, McGuire LC, Liu S. Concentrations of serum vitamin D and the metabolic syndrome among U.S. adults. Diabetes Care. 2005;28(5):1228-30.
427. Scragg R, Sowers M, Bell C, Third National H, Nutrition Examination S. Serum 25-hydroxyvitamin D, diabetes, and ethnicity in the Third National Health and Nutrition Examination Survey. Diabetes Care. 2004;27(12):2813-8.
428. Kayaniyil S, Vieth R, Retnakaran R, Knight JA, Qi Y, Gerstein HC, et al. Association of vitamin D with insulin resistance and beta-cell dysfunction in subjects at risk for type 2 diabetes. Diabetes Care. 2010;33(6):1379-81.
429. Jorde R, Figenschau Y. Supplementation with cholecalciferol does not improve glycaemic control in diabetic subjects with normal serum 25-hydroxyvitamin D levels. Eur J Nutr. 2009;48(6):349-54.
430. Witham MD, Dove FJ, Dryburgh M, Sugden JA, Morris AD, Struthers AD. The effect of different doses of vitamin D(3) on markers of vascular health in patients with type 2 diabetes: a randomised controlled trial. Diabetologia. 2010;53(10):2112-9.
431. Sugden JA, Davies JI, Witham MD, Morris AD, Struthers AD. Vitamin D improves endothelial function in patients with Type 2 diabetes mellitus and low vitamin D levels. Diabet Med. 2008;25(3):320-5.
432. Elkassaby S, Harrison LC, Mazzitelli N, Wentworth JM, Colman PG, Spelman T, et al. A randomised controlled trial of high dose vitamin D in recent-onset type 2 diabetes. Diabetes Res Clin Pract. 2014;106(3):576-82.

Page | 339
433. Grubler MR, Gaksch M, Kienreich K, Verheyen N, Schmid J, B OH, et al. Effects of vitamin D supplementation on glycated haemoglobin and fasting glucose levels in hypertensive patients: a randomized controlled trial. Diabetes Obes Metab. 2016;18(10):1006-12.
434. Krul-Poel YH, Ter Wee MM, Lips P, Simsek S. MANAGEMENT OF ENDOCRINE DISEASE: The effect of vitamin D supplementation on glycaemic control in patients with type 2 diabetes mellitus: a systematic review and meta-analysis. Eur J Endocrinol. 2017;176(1).
435. Haroon N, Anton A, John J, Mittal M. Effect of vitamin D supplementation on glycemic control in patients with type 2 diabetes: a systematic review of interventional studies. J Diabetes Metab Disord. 2015;14:3.
436. Nasri H, Behradmanesh S, Ahmadi A, Rafieian-Kopaei M. Impact of oral vitamin D (cholecalciferol) replacement therapy on blood pressure in type 2 diabetes patients; a randomized, double-blind, placebo controlled clinical trial. J Nephropathol. 2014;3(1):29-33.
437. Jehle S, Lardi A, Felix B, Hulter HN, Stettler C, Krapf R. Effect of large doses of parenteral vitamin D on glycaemic control and calcium/phosphate metabolism in patients with stable type 2 diabetes mellitus: a randomised, placebo-controlled, prospective pilot study. Swiss Med Wkly. 2014;144.
438. Wagner H, Alvarsson M, Mannheimer B, Degerblad M, Ostenson CG. No Effect of High-Dose Vitamin D Treatment on beta-Cell Function, Insulin Sensitivity, or Glucose Homeostasis in Subjects With Abnormal Glucose Tolerance: A Randomized Clinical Trial. Diabetes Care. 2016;39(3):345-52.
439. Kavaric S, Vuksanovic M, Bozovic D, Jovanovic M, Jeremic V, Radojicic Z, et al. Body weight and waist circumference as predictors of vitamin D deficiency in patients with type 2 diabetes and cardiovascular disease. Vojnosanit Pregl. 2013;70(2):163-9.
440. Vitezova A, Muka T, Zillikens MC, Voortman T, Uitterlinden AG, Hofman A, et al. Vitamin D and body composition in the elderly. Clin Nutr. 2017;36(2):585-92.
441. Fornari R, Francomano D, Greco EA, Marocco C, Lubrano C, Wannenes F, et al. Lean mass in obese adult subjects correlates with higher levels of vitamin D, insulin sensitivity and lower inflammation. J Endocrinol Invest. 2015;38(3):367-72.
442. Visser M, Deeg DJ, Lips P, Longitudinal Aging Study A. Low vitamin D and high parathyroid hormone levels as determinants of loss of muscle strength and muscle mass (sarcopenia): the Longitudinal Aging Study Amsterdam. J Clin Endocrinol Metab. 2003;88(12):5766-72.
443. Pourshahidi LK. Vitamin D and obesity: current perspectives and future directions. Proc Nutr Soc. 2015;74(2):115-24.

Page | 340
444. Wood RJ. Vitamin D and adipogenesis: new molecular insights. Nutr Rev. 2008;66(1):40-6.
445. Kong J, Li YC. Molecular mechanism of 1,25-dihydroxyvitamin D3 inhibition of adipogenesis in 3T3-L1 cells. Am J Physiol Endocrinol Metab. 2006;290(5):916-24.
446. Bischoff-Ferrari HA, Borchers M, Gudat F, Durmuller U, Stahelin HB, Dick W. Vitamin D receptor expression in human muscle tissue decreases with age. J Bone Miner Res. 2004;19(2):265-9.
447. Bischoff HA, Borchers M, Gudat F, Duermueller U, Theiler R, Stahelin HB, et al. In situ detection of 1,25-dihydroxyvitamin D3 receptor in human skeletal muscle tissue. Histochem J. 2001;33(1):19-24.
448. Simpson RU, Thomas GA, Arnold AJ. Identification of 1,25-dihydroxyvitamin D3 receptors and activities in muscle. J Biol Chem. 1985;260(15):8882-91.
449. Rejnmark L. Effects of vitamin d on muscle function and performance: a review of evidence from randomized controlled trials. Ther Adv Chronic Dis. 2011;2(1):25-37.
450. Ceglia L, Harris SS. Vitamin D and its role in skeletal muscle. Calcif Tissue Int. 2013;92(2):151-62.
451. Rosenblum JL, Castro VM, Moore CE, Kaplan LM. Calcium and vitamin D supplementation is associated with decreased abdominal visceral adipose tissue in overweight and obese adults. Am J Clin Nutr. 2012;95(1):101-8.
452. Salehpour A, Hosseinpanah F, Shidfar F, Vafa M, Razaghi M, Dehghani S, et al. A 12-week double-blind randomized clinical trial of vitamin D(3) supplementation on body fat mass in healthy overweight and obese women. Nutr J. 2012;11:78.
453. Cangussu LM, Nahas-Neto J, Orsatti CL, Bueloni-Dias FN, Nahas EA. Effect of vitamin D supplementation alone on muscle function in postmenopausal women: a randomized, double-blind, placebo-controlled clinical trial. Osteoporos Int. 2015;26(10):2413-21.
454. Chandler PD, Wang L, Zhang X, Sesso HD, Moorthy MV, Obi O, et al. Effect of vitamin D supplementation alone or with calcium on adiposity measures: a systematic review and meta-analysis of randomized controlled trials. Nutr Rev. 2015;73(9):577-93.
455. Zhou J, Chen H, Wang Z, Li Y, Li M, Xiang H. Effects of vitamin D supplementation on insulin resistance in patients with type 2 diabetes mellitus. Zhonghua Yi Xue Za Zhi. 2014;94(43):3407-10.
456. Tabesh M, Azadbakht L, Faghihimani E, Tabesh M, Esmaillzadeh A. Effects of Calcium Plus Vitamin D Supplementation on Anthropometric Measurements and Blood Pressure in Vitamin D Insufficient People with Type 2 Diabetes: A Randomized Controlled Clinical Trial. J Am Coll Nutr. 2015;34(4):281-9.

Page | 341
457. Barchetta I, Del Ben M, Angelico F, Di Martino M, Fraioli A, La Torre G, et al. No effects of oral vitamin D supplementation on non-alcoholic fatty liver disease in patients with type 2 diabetes: a randomized, double-blind, placebo-controlled trial. BMC Med. 2016;14(1):92.
458. Sadiya A, Ahmed SM, Carlsson M, Tesfa Y, George M, Ali SH, et al. Vitamin D supplementation in obese type 2 diabetes subjects in Ajman, UAE: a randomized controlled double-blinded clinical trial. Eur J Clin Nutr. 2015;69(6):707-11.
459. Hansen KE, Johnson RE, Chambers KR, Johnson MG, Lemon CC, Vo TN, et al. Treatment of Vitamin D Insufficiency in Postmenopausal Women: A Randomized Clinical Trial. JAMA Intern Med. 2015;175(10):1612-21.
460. Sadiya A, Ahmed SM, Carlsson M, Tesfa Y, George M, Ali SH, et al. Vitamin D3 supplementation and body composition in persons with obesity and type 2 diabetes in the UAE: A randomized controlled double-blinded clinical trial. Clin Nutr. 2016;35(1):77-82.
461. Mason C, Tapsoba JD, Duggan C, Imayama I, Wang CY, Korde L, et al. Effects of Vitamin D3 Supplementation on Lean Mass, Muscle Strength, and Bone Mineral Density During Weight Loss: A Double-Blind Randomized Controlled Trial. J Am Geriatr Soc. 2016;64(4):769-78.
462. Beaudart C, Buckinx F, Rabenda V, Gillain S, Cavalier E, Slomian J, et al. The effects of vitamin D on skeletal muscle strength, muscle mass, and muscle power: a systematic review and meta-analysis of randomized controlled trials. J Clin Endocrinol Metab. 2014;99(11):4336-45.
463. Dalan R, Liew H, Assam PN, Chan ES, Siddiqui FJ, Tan AW, et al. A randomised controlled trial evaluating the impact of targeted vitamin D supplementation on endothelial function in type 2 diabetes mellitus: The DIMENSION trial. Diab Vasc Dis Res. 2016;13(3):192-200.
464. Chagas CE, Borges MC, Martini LA, Rogero MM. Focus on vitamin D, inflammation and type 2 diabetes. Nutrients. 2012;4(1):52-67.
465. Ning C, Liu L, Lv G, Yang Y, Zhang Y, Yu R, et al. Lipid metabolism and inflammation modulated by Vitamin D in liver of diabetic rats. Lipids Health Dis. 2015;14:31.
466. Mora JR, Iwata M, von Andrian UH. Vitamin effects on the immune system: vitamins A and D take centre stage. Nat Rev Immunol. 2008;8(9):685-98.
467. Dinca M, Serban MC, Sahebkar A, Mikhailidis DP, Toth PP, Martin SS, et al. Does vitamin D supplementation alter plasma adipokines concentrations? A systematic review and meta-analysis of randomized controlled trials. Pharmacol Res. 2016;107:360-71.
468. Targher G, Bertolini L, Padovani R, Zenari L, Scala L, Cigolini M, et al. Serum 25-hydroxyvitamin D3 concentrations and carotid artery intima-media thickness among type 2 diabetic patients. Clin Endocrinol. 2006;65(5):593-7.

Page | 342
469. Kampmann U, Mosekilde L, Juhl C, Moller N, Christensen B, Rejnmark L, et al. Effects of 12 weeks high dose vitamin D3 treatment on insulin sensitivity, beta cell function, and metabolic markers in patients with type 2 diabetes and vitamin D insufficiency - a double-blind, randomized, placebo-controlled trial. Metabolism. 2014;63(9):1115-24.
470. Sollid ST, Hutchinson MY, Fuskevag OM, Figenschau Y, Joakimsen RM, Schirmer H, et al. No effect of high-dose vitamin D supplementation on glycemic status or cardiovascular risk factors in subjects with prediabetes. Diabetes Care. 2014;37(8):2123-31.
471. Yiu YF, Yiu KH, Siu CW, Chan YH, Li SW, Wong LY, et al. Randomized controlled trial of vitamin D supplement on endothelial function in patients with type 2 diabetes. Atherosclerosis. 2013;227(1):140-6.
472. Tabesh M, Azadbakht L, Faghihimani E, Tabesh M, Esmaillzadeh A. Calcium-vitamin D cosupplementation influences circulating inflammatory biomarkers and adipocytokines in vitamin D-insufficient diabetics: a randomized controlled clinical trial. J Clin Endocrinol Metab. 2014;99(12):2485-93.
473. Neyestani TR, Nikooyeh B, Alavi-Majd H, Shariatzadeh N, Kalayi A, Tayebinejad N, et al. Improvement of vitamin D status via daily intake of fortified yogurt drink either with or without extra calcium ameliorates systemic inflammatory biomarkers, including adipokines, in the subjects with type 2 diabetes. J Clin Endocrinol Metab. 2012;97(6):2005-11.
474. Shab-Bidar S, Neyestani TR, Djazayery A, Eshraghian MR, Houshiarrad A, Kalayi A, et al. Improvement of vitamin D status resulted in amelioration of biomarkers of systemic inflammation in the subjects with type 2 diabetes. Diabetes Metab Res Rev. 2012;28(5):424-30.
475. Pilz S, Marz W, Wellnitz B, Seelhorst U, Fahrleitner-Pammer A, Dimai HP, et al. Association of vitamin D deficiency with heart failure and sudden cardiac death in a large cross-sectional study of patients referred for coronary angiography. J Clin Endocrinol Metab. 2008;93(10):3927-35.
476. Jorde R, Grimnes G. Vitamin D and metabolic health with special reference to the effect of vitamin D on serum lipids. Prog Lipid Res. 2011;50(4):303-12.
477. Burgaz A, Orsini N, Larsson SC, Wolk A. Blood 25-hydroxyvitamin D concentration and hypertension: a meta-analysis. J Hypertens. 2011;29(4):636-45.
478. Li YC, Kong J, Wei M, Chen ZF, Liu SQ, Cao LP. 1,25-Dihydroxyvitamin D(3) is a negative endocrine regulator of the renin-angiotensin system. J Clin Invest. 2002;110(2):229-38.
479. Liu ZM, Woo J, Wu SH, Ho SC. The role of vitamin D in blood pressure, endothelial and renal function in postmenopausal women. Nutrients. 2013;5(7):2590-610.

Page | 343
480. Boon N, Hul GB, Stegen JH, Sluijsmans WE, Valle C, Langin D, et al. An intervention study of the effects of calcium intake on faecal fat excretion, energy metabolism and adipose tissue mRNA expression of lipid-metabolism related proteins. Int J Obes. 2007;31(11):1704-12.
481. Eftekhari MH, Akbarzadeh M, Dabbaghmanesh MH, Hassanzadeh J. The effect of calcitriol on lipid profile and oxidative stress in hyperlipidemic patients with type 2 diabetes mellitus. ARYA Atheroscler. 2014;10(2):82-8.
482. Pilz S, Verheyen N, Grubler MR, Tomaschitz A, Marz W. Vitamin D and cardiovascular disease prevention. Nat Rev Cardiol. 2016;13(7):404-17.
483. Jafari T, Fallah AA, Barani A. Effects of vitamin D on serum lipid profile in patients with type 2 diabetes: A meta-analysis of randomized controlled trials. Clin Nutr. 2016;35(6):1259-68.
484. de Paula TP, Kramer CK, Viana LV, Azevedo MJ. Effects of individual micronutrients on blood pressure in patients with type 2 diabetes: a systematic review and meta-analysis of randomized clinical trials. Sci Rep. 2017;7.
485. Finger D, Goltz FR, Umpierre D, Meyer E, Rosa LH, Schneider CD. Effects of protein supplementation in older adults undergoing resistance training: a systematic review and meta-analysis. Sports Med. 2015;45(2):245-55.
486. Cermak NM, Res PT, de Groot LC, Saris WH, van Loon LJ. Protein supplementation augments the adaptive response of skeletal muscle to resistance-type exercise training: a meta-analysis. Am J Clin Nutr. 2012;96(6):1454-64.
487. Thomas DK, Quinn MA, Saunders DH, Greig CA. Protein Supplementation Does Not Significantly Augment the Effects of Resistance Exercise Training in Older Adults: A Systematic Review. J Am Med Dir Assoc. 2016;17(10):959 e1-9.
488. Godard MP, Williamson DL, Trappe SW. Oral amino-acid provision does not affect muscle strength or size gains in older men. Med Sci Sports Exerc. 2002;34(7):1126-31.
489. Kim HK, Suzuki T, Saito K, Yoshida H, Kobayashi H, Kato H, et al. Effects of exercise and amino acid supplementation on body composition and physical function in community-dwelling elderly Japanese sarcopenic women: a randomized controlled trial. J Am Geriatr Soc. 2012;60(1):16-23.
490. Trabal J, Forga M, Leyes P, Torres F, Rubio J, Prieto E, et al. Effects of free leucine supplementation and resistance training on muscle strength and functional status in older adults: a randomized controlled trial. Clin Interv Aging. 2015;10:713-23.
491. Campbell WW, Crim MC, Young VR, Evans WJ. Increased energy requirements and changes in body composition with resistance training in older adults. Am J Clin Nutr. 1994;60(2):167-75.

Page | 344
492. Iglay HB, Apolzan JW, Gerrard DE, Eash JK, Anderson JC, Campbell WW. Moderately increased protein intake predominately from egg sources does not influence whole body, regional, or muscle composition responses to resistance training in older people. J Nutr Health Aging. 2009;13(2):108-14.
493. Kukuljan S, Nowson CA, Sanders K, Daly RM. Effects of resistance exercise and fortified milk on skeletal muscle mass, muscle size, and functional performance in middle-aged and older men: an 18-mo randomized controlled trial. J Appl Physiol. 2009;107(6):1864-73.
494. Campbell WW, Kim JE, Amankwaah AF, Gordon SL, Weinheimer-Haus EM. Higher Total Protein Intake and Change in Total Protein Intake Affect Body Composition but Not Metabolic Syndrome Indexes in Middle-Aged Overweight and Obese Adults Who Perform Resistance and Aerobic Exercise for 36 Weeks. J Nutr. 2015;145(9):2076-83.
495. Bauer J, Biolo G, Cederholm T, Cesari M, Cruz-Jentoft AJ, Morley JE, et al. Evidence-based recommendations for optimal dietary protein intake in older people: a position paper from the PROT-AGE Study Group. J Am Med Dir Assoc. 2013;14(8):542-59.
496. Esmarck B, Andersen JL, Olsen S, Richter EA, Mizuno M, Kjaer M. Timing of postexercise protein intake is important for muscle hypertrophy with resistance training in elderly humans. J Physiol. 2001;535(Pt 1):301-11.
497. Candow DG, Chilibeck PD, Facci M, Abeysekara S, Zello GA. Protein supplementation before and after resistance training in older men. Eur J Appl Physiol. 2006;97(5):548-56.
498. Cuthbertson D, Smith K, Babraj J, Leese G, Waddell T, Atherton P, et al. Anabolic signaling deficits underlie amino acid resistance of wasting, aging muscle. FASEB J. 2005;19(3):422-4.
499. Atherton PJ, Smith K. Muscle protein synthesis in response to nutrition and exercise. J Physiol. 2012;590(5):1049-57.
500. Moore DR, Robinson MJ, Fry JL, Tang JE, Glover EI, Wilkinson SB, et al. Ingested protein dose response of muscle and albumin protein synthesis after resistance exercise in young men. Am J Clin Nutr. 2009;89(1):161-8.
501. Burd NA, West DW, Moore DR, Atherton PJ, Staples AW, Prior T, et al. Enhanced amino acid sensitivity of myofibrillar protein synthesis persists for up to 24 h after resistance exercise in young men. J Nutr. 2011;141(4):568-73.
502. Kim HJ, Kang CK, Park H, Lee MG. Effects of vitamin D supplementation and circuit training on indices of obesity and insulin resistance in T2D and vitamin D deficient elderly women. J Exerc Nutrition Biochem. 2014;18(3):249-57.
503. Agergaard J, Trostrup J, Uth J, Iversen JV, Boesen A, Andersen JL, et al. Does vitamin-D intake during resistance training improve the skeletal muscle hypertrophic and strength response in young and elderly men? - a randomized controlled trial. Nutr Metab. 2015;12:32.

Page | 345
504. Janssen HC, Samson MM, Verhaar HJ. Vitamin D deficiency, muscle function, and falls in elderly people. Am J Clin Nutr. 2002;75(4):611-5.
505. Thacher TD, Clarke BL. Vitamin D insufficiency. Mayo Clin Proc. 2011;86(1):50-60.
506. Campbell WW, Crim MC, Young VR, Joseph LJ, Evans WJ. Effects of resistance training and dietary protein intake on protein metabolism in older adults. Am J Physiol. 1995;268(6 Pt 1).
507. Rosendahl E, Lindelof N, Littbrand H, Yifter-Lindgren E, Lundin-Olsson L, Haglin L, et al. High-intensity functional exercise program and protein-enriched energy supplement for older persons dependent in activities of daily living: a randomised controlled trial. Aust J Physiother. 2006;52(2):105-13.
508. Carlsson M, Littbrand H, Gustafson Y, Lundin-Olsson L, Lindelof N, Rosendahl E, et al. Effects of high-intensity exercise and protein supplement on muscle mass in ADL dependent older people with and without malnutrition: a randomized controlled trial. J Nutr Health Aging. 2011;15(7):554-60.
509. Buhl SF, Andersen AL, Andersen JR, Andersen O, Jensen JE, Rasmussen AM, et al. The effect of protein intake and resistance training on muscle mass in acutely ill old medical patients - A randomized controlled trial. Clin Nutr. 2016;35(1):59-66.
510. Arnarson A, Gudny Geirsdottir O, Ramel A, Briem K, Jonsson PV, Thorsdottir I. Effects of whey proteins and carbohydrates on the efficacy of resistance training in elderly people: double blind, randomised controlled trial. Eur J Clin Nutr. 2013;67(8):821-6.
511. Fiatarone MA, O'Neill EF, Ryan ND, Clements KM, Solares GR, Nelson ME, et al. Exercise training and nutritional supplementation for physical frailty in very elderly people. N Engl J Med. 1994;330(25):1769-75.
512. Verreijen AM, Verlaan S, Engberink MF, Swinkels S, de Vogel-van den Bosch J, Weijs PJ. A high whey protein-, leucine-, and vitamin D-enriched supplement preserves muscle mass during intentional weight loss in obese older adults: a double-blind randomized controlled trial. Am J Clin Nutr. 2015;101(2):279-86.
513. Rondanelli M, Klersy C, Terracol G, Talluri J, Maugeri R, Guido D, et al. Whey protein, amino acids, and vitamin D supplementation with physical activity increases fat-free mass and strength, functionality, and quality of life and decreases inflammation in sarcopenic elderly. Am J Clin Nutr. 2016;103(3):830-40.
514. Holm L, Olesen JL, Matsumoto K, Doi T, Mizuno M, Alsted TJ, et al. Protein-containing nutrient supplementation following strength training enhances the effect on muscle mass, strength, and bone formation in postmenopausal women. J Appl Physiol. 2008;105(1):274-81.

Page | 346
515. Bauer JM, Verlaan S, Bautmans I, Brandt K, Donini LM, Maggio M, et al. Effects of a vitamin D and leucine-enriched whey protein nutritional supplement on measures of sarcopenia in older adults, the PROVIDE study: a randomized, double-blind, placebo-controlled trial. J Am Med Dir Assoc. 2015;16(9):740-7.
516. Doherty TJ. The influence of aging and sex on skeletal muscle mass and strength. Curr Opin Clin Nutr Metab Care. 2001;4(6):503-8.
517. Deschenes MR. Effects of aging on muscle fibre type and size. Sports Med. 2004;34(12):809-24.
518. Boden G, Chen X, DeSantis RA, Kendrick Z. Effects of age and body fat on insulin resistance in healthy men. Diabetes Care. 1993;16(5):728-33.
519. Meckling KA, Sherfey R. A randomized trial of a hypocaloric high-protein diet, with and without exercise, on weight loss, fitness, and markers of the Metabolic Syndrome in overweight and obese women. Appl Physiol Nutr Metab. 2007;32(4):743-52.
520. Arciero PJ, Baur D, Connelly S, Ormsbee MJ. Timed-daily ingestion of whey protein and exercise training reduces visceral adipose tissue mass and improves insulin resistance: the PRISE study. J Appl Physiol. 2014;117(1):1-10.
521. Iglay HB, Thyfault JP, Apolzan JW, Campbell WW. Resistance training and dietary protein: effects on glucose tolerance and contents of skeletal muscle insulin signaling proteins in older persons. Am J Clin Nutr. 2007;85(4):1005-13.
522. Fekete AA, Giromini C, Chatzidiakou Y, Givens DI, Lovegrove JA. Whey protein lowers blood pressure and improves endothelial function and lipid biomarkers in adults with prehypertension and mild hypertension: results from the chronic Whey2Go randomized controlled trial. Am J Clin Nutr. 2016;104(6):1534-44.
523. Garcia-Unciti M, Izquierdo M, Idoate F, Gorostiaga E, Grijalba A, Ortega-Delgado F, et al. Weight-Loss Diet Alone or Combined with Progressive Resistance Training Induces Changes in Association between the Cardiometabolic Risk Profile and Abdominal Fat Depots. Ann Nutr Metab. 2012;61(4):296-304.
524. Maltais ML, Perreault K, Courchesne-Loyer A, Lagace JC, Barsalani R, Dionne IJ. Effect of Resistance Training and Various Sources of Protein Supplementation on Body Fat Mass and Metabolic Profile in Sarcopenic Overweight Older Adult Men: A Pilot Study. Int J Sport Nutr Exerc Metab. 2016;26(1):71-7.
525. Jung UJ, Choi MS. Obesity and its metabolic complications: the role of adipokines and the relationship between obesity, inflammation, insulin resistance, dyslipidemia and nonalcoholic fatty liver disease. Int J Mol Sci. 2014;15(4):6184-223.

Page | 347
526. Kadoglou NP, Iliadis F, Angelopoulou N, Perrea D, Ampatzidis G, Liapis CD, et al. The anti-inflammatory effects of exercise training in patients with type 2 diabetes mellitus. Eur J Cardiovasc Prev Rehabil. 2007;14(6):837-43.
527. Abizanda P, Lopez MD, Garcia VP, Estrella Jde D, da Silva Gonzalez A, Vilardell NB, et al. Effects of an Oral Nutritional Supplementation Plus Physical Exercise Intervention on the Physical Function, Nutritional Status, and Quality of Life in Frail Institutionalized Older Adults: The ACTIVNES Study. J Am Med Dir Assoc. 2015;16(5).
528. Chatterjee S, Khunti K, Davies MJ. Type 2 diabetes. Lancet. 2017;10.1016/S0140-6736(17)30058-2.
529. Esser N, Legrand-Poels S, Piette J, Scheen AJ, Paquot N. Inflammation as a link between obesity, metabolic syndrome and type 2 diabetes. Diabetes Res Clin Pract. 2014;105(2):141-50.
530. Cesari M, Penninx BW, Pahor M, Lauretani F, Corsi AM, Rhys Williams G, et al. Inflammatory markers and physical performance in older persons: the InCHIANTI study. J Gerontol A Biol Sci Med Sci. 2004;59(3):242-8.
531. Kolb H, Mandrup-Poulsen T. The global diabetes epidemic as a consequence of lifestyle-induced low-grade inflammation. Diabetologia. 2010;53(1):10-20.
532. Van Gaal LF, Mertens IL, De Block CE. Mechanisms linking obesity with cardiovascular disease. Nature. 2006;444(7121):875-80.
533. Lee SY, Chang HJ, Sung J, Kim KJ, Shin S, Cho IJ, et al. The impact of obesity on subclinical coronary atherosclerosis according to the risk of cardiovascular disease. Obesity. 2014;22(7):1762-8.
534. Nicklas BJ, Ambrosius W, Messier SP, Miller GD, Penninx BW, Loeser RF, et al. Diet-induced weight loss, exercise, and chronic inflammation in older, obese adults: a randomized controlled clinical trial. Am J Clin Nutr. 2004;79(4):544-51.
535. Ho TP, Zhao X, Courville AB, Linderman JD, Smith S, Sebring N, et al. Effects of a 12-month moderate weight loss intervention on insulin sensitivity and inflammation status in nondiabetic overweight and obese subjects. Horm Metab Res. 2015;47(4):289-96.
536. Strasser B, Berger K, Fuchs D. Effects of a caloric restriction weight loss diet on tryptophan metabolism and inflammatory biomarkers in overweight adults. Eur J Nutr. 2015;54(1):101-7.
537. van Gemert WA, May AM, Schuit AJ, Oosterhof BY, Peeters PH, Monninkhof EM. Effect of Weight Loss with or without Exercise on Inflammatory Markers and Adipokines in Postmenopausal Women: The SHAPE-2 Trial, A Randomized Controlled Trial. Cancer Epidemiol Biomarkers Prev. 2016;25(5):799-806.
538. Forsythe LK, Wallace JM, Livingstone MB. Obesity and inflammation: the effects of weight loss. Nutr Res Rev. 2008;21(2):117-33.

Page | 348
539. Madsen EL, Rissanen A, Bruun JM, Skogstrand K, Tonstad S, Hougaard DM, et al. Weight loss larger than 10% is needed for general improvement of levels of circulating adiponectin and markers of inflammation in obese subjects: a 3-year weight loss study. Eur J Endocrinol. 2008;158(2):179-87.
540. Messier SP, Mihalko SL, Legault C, Miller GD, Nicklas BJ, DeVita P, et al. Effects of intensive diet and exercise on knee joint loads, inflammation, and clinical outcomes among overweight and obese adults with knee osteoarthritis: the IDEA randomized clinical trial. JAMA. 2013;310(12):1263-73.
541. Cardinal J, Pretorius CJ, Ungerer JP. Biological and diurnal variation in glucocorticoid sensitivity detected with a sensitive in vitro dexamethasone suppression of cytokine production assay. J Clin Endocrinol Metab. 2010;95(8):3657-63.
542. Bastard JP, Maachi M, Lagathu C, Kim MJ, Caron M, Vidal H, et al. Recent advances in the relationship between obesity, inflammation, and insulin resistance. Eur Cytokine Netw. 2006;17(1):4-12.
543. Chae JS, Paik JK, Kang R, Kim M, Choi Y, Lee SH, et al. Mild weight loss reduces inflammatory cytokines, leukocyte count, and oxidative stress in overweight and moderately obese participants treated for 3 years with dietary modification. Nutr Res. 2013;33(3):195-203.
544. Trussardi Fayh AP, Lopes AL, Fernandes PR, Reischak-Oliveira A, Friedman R. Impact of weight loss with or without exercise on abdominal fat and insulin resistance in obese individuals: a randomised clinical trial. Br J Nutr. 2013;110(3):486-92.
545. Samaras K, Viardot A, Lee PN, Jenkins A, Botelho NK, Bakopanos A, et al. Reduced arterial stiffness after weight loss in obese type 2 diabetes and impaired glucose tolerance: the role of immune cell activation and insulin resistance. Diab Vasc Dis Res. 2013;10(1):40-8.
546. Zhou X, Fragala MS, McElhaney JE, Kuchel GA. Conceptual and methodological issues relevant to cytokine and inflammatory marker measurements in clinical research. Curr Opin Clin Nutr Metab Care. 2010;13(5):541-7.
547. Reed JL, De Souza MJ, Williams NI. Effects of exercise combined with caloric restriction on inflammatory cytokines. Appl Physiol Nutr Metab. 2010;35(5):573-82.
548. Christiansen T, Paulsen SK, Bruun JM, Pedersen SB, Richelsen B. Exercise training versus diet-induced weight-loss on metabolic risk factors and inflammatory markers in obese subjects: a 12-week randomized intervention study. Am J Physiol Endocrinol Metab. 2010;298(4):824-31.
549. Imayama I, Ulrich CM, Alfano CM, Wang C, Xiao L, Wener MH, et al. Effects of a caloric restriction weight loss diet and exercise on inflammatory

Page | 349
biomarkers in overweight/obese postmenopausal women: a randomized controlled trial. Cancer Res. 2012;72(9):2314-26.
550. Borruel S, Molto JF, Alpanes M, Fernandez-Duran E, Alvarez-Blasco F, Luque-Ramirez M, et al. Surrogate markers of visceral adiposity in young adults: waist circumference and body mass index are more accurate than waist hip ratio, model of adipose distribution and visceral adiposity index. PLoS One. 2014;9(12).
551. Klein S, Allison DB, Heymsfield SB, Kelley DE, Leibel RL, Nonas C, et al. Waist Circumference and Cardiometabolic Risk: a Consensus Statement from Shaping America's Health: Association for Weight Management and Obesity Prevention; NAASO, the Obesity Society; the American Society for Nutrition; and the American Diabetes Association. Obesity. 2007;15(5):1061-7.
552. Capel F, Klimcakova E, Viguerie N, Roussel B, Vitkova M, Kovacikova M, et al. Macrophages and adipocytes in human obesity: adipose tissue gene expression and insulin sensitivity during calorie restriction and weight stabilization. Diabetes. 2009;58(7):1558-67.
553. Kosteli A, Sugaru E, Haemmerle G, Martin JF, Lei J, Zechner R, et al. Weight loss and lipolysis promote a dynamic immune response in murine adipose tissue. J Clin Invest. 2010;120(10):3466-79.
554. Ribeiro F, Alves AJ, Duarte JA, Oliveira J. Is exercise training an effective therapy targeting endothelial dysfunction and vascular wall inflammation? Int J Cardiol. 2010;141(3):214-21.
555. Balducci S, Zanuso S, Nicolucci A, Fernando F, Cavallo S, Cardelli P, et al. Anti-inflammatory effect of exercise training in subjects with type 2 diabetes and the metabolic syndrome is dependent on exercise modalities and independent of weight loss. Nutr Metab Cardiovasc Dis. 2010;20(8):608-17.
556. Sixt S, Beer S, Bluher M, Korff N, Peschel T, Sonnabend M, et al. Long- but not short-term multifactorial intervention with focus on exercise training improves coronary endothelial dysfunction in diabetes mellitus type 2 and coronary artery disease. Eur Heart J. 2010;31(1):112-9.
557. de Salles BF, Simao R, Miranda F, Novaes Jda S, Lemos A, Willardson JM. Rest interval between sets in strength training. Sports Med. 2009;39(9):765-77.
558. Rohling M, Herder C, Stemper T, Mussig K. Influence of Acute and Chronic Exercise on Glucose Uptake. J Diabetes Res. 2016;2016.
559. Strasser B, Arvandi M, Siebert U. Resistance training, visceral obesity and inflammatory response: a review of the evidence. Obes Rev. 2012;13(7):578-91.
560. Hopps E, Canino B, Caimi G. Effects of exercise on inflammation markers in type 2 diabetic subjects. Acta Diabetol. 2011;48(3):183-9.
561. Wycherley TP, Brinkworth GD, Noakes M, Buckley JD, Clifton PM. Effect of caloric restriction with and without exercise training on oxidative stress and

Page | 350
endothelial function in obese subjects with type 2 diabetes. Diabetes Obes Metab. 2008;10(11):1062-73.
562. Kwon HR, Min KW, Ahn HJ, Seok HG, Lee JH, Park GS, et al. Effects of Aerobic Exercise vs. Resistance Training on Endothelial Function in Women with Type 2 Diabetes Mellitus. Diabetes Metab J. 2011;35(4):364-73.
563. Wegge JK, Roberts CK, Ngo TH, Barnard RJ. Effect of diet and exercise intervention on inflammatory and adhesion molecules in postmenopausal women on hormone replacement therapy and at risk for coronary artery disease. Metabolism. 2004;53(3):377-81.
564. Adamopoulos S, Parissis J, Kroupis C, Georgiadis M, Karatzas D, Karavolias G, et al. Physical training reduces peripheral markers of inflammation in patients with chronic heart failure. Eur Heart J. 2001;22(9):791-7.
565. Zoppini G, Targher G, Zamboni C, Venturi C, Cacciatori V, Moghetti P, et al. Effects of moderate-intensity exercise training on plasma biomarkers of inflammation and endothelial dysfunction in older patients with type 2 diabetes. Nutr Metab Cardiovasc Dis. 2006;16(8):543-9.
566. da Silva CA, Ribeiro JP, Canto JC, da Silva RE, Silva Junior GB, Botura E, et al. High-intensity aerobic training improves endothelium-dependent vasodilation in patients with metabolic syndrome and type 2 diabetes mellitus. Diabetes Res Clin Pract. 2012;95(2):237-45.
567. Cohen ND, Dunstan DW, Robinson C, Vulikh E, Zimmet PZ, Shaw JE. Improved endothelial function following a 14-month resistance exercise training program in adults with type 2 diabetes. Diabetes Res Clin Pract. 2008;79(3):405-11.
568. de Jager W, Bourcier K, Rijkers GT, Prakken BJ, Seyfert-Margolis V. Prerequisites for cytokine measurements in clinical trials with multiplex immunoassays. BMC Immunol. 2009;10(1):52.
569. Peake JM, Kukuljan S, Nowson CA, Sanders K, Daly RM. Inflammatory cytokine responses to progressive resistance training and supplementation with fortified milk in men aged 50+ years: an 18-month randomized controlled trial. Eur J Appl Physiol. 2011;111(12):3079-88.
570. Unick JL, Gaussoin S, Bahnson J, Crow R, Curtis J, Killean T, et al. Validity of Ratings of Perceived Exertion in Patients with Type 2 Diabetes. J Nov Physiother Phys Rehabil. 2014;1(1):102.
571. Gagnon C, Daly RM, Carpentier A, Lu ZX, Shore-Lorenti C, Sikaris K, et al. Effects of combined calcium and vitamin D supplementation on insulin secretion, insulin sensitivity and beta-cell function in multi-ethnic vitamin D-deficient adults at risk for type 2 diabetes: a pilot randomized, placebo-controlled trial. PLoS One. 2014;9(10).

Page | 351
572. Andersen LL, Tufekovic G, Zebis MK, Crameri RM, Verlaan G, Kjaer M, et al. The effect of resistance training combined with timed ingestion of protein on muscle fiber size and muscle strength. Metabolism. 2005;54(2):151-6.
573. GE Healthcare: Lunar enCORE-based X-ray Bone Densitometer User Manual. Madison W, USA; 2010
574. Eser P, Hill B, Ducher G, Bass S. Skeletal benefits after long-term retirement in former elite female gymnasts. J Bone Miner Res. 2009;24(12):1981-8.
575. Levy JC, Matthews DR, Hermans MP. Correct homeostasis model assessment (HOMA) evaluation uses the computer program. Diabetes Care. 1998;21(12):2191-2.
576. Lord SR, Menz HB, Tiedemann A. A physiological profile approach to falls risk assessment and prevention. Phys Ther. 2003;83(3):237-52.
577. Miller JP, Pratley RE, Goldberg AP, Gordon P, Rubin M, Treuth MS, et al. Strength training increases insulin action in healthy 50- to 65-yr-old men. J Appl Physiol. 1994;77(3):1122-7.
578. Treuth MS, Ryan AS, Pratley RE, Rubin MA, Miller JP, Nicklas BJ, et al. Effects of strength training on total and regional body composition in older men. J Appl Physiol. 1994;77(2):614-20.
579. Wathen D. Load assignment. In: Baechle TR, editor. Essentials of Strength Training and Conditioning. Ilinois: Champaign; 1994.
580. Knutzen KM, Brilla LR, Caine D. Validity of 1RM prediction equations for older adults. J Strength Cond Res. 1999;13(3):242-6.
581. Frankenfield DC, Rowe WA, Smith JS, Cooney RN. Validation of several established equations for resting metabolic rate in obese and nonobese people. J Am Diet Assoc. 2003;103(9):1152-9.
582. EFSA Panel on Dietetic Products NaAN. Scientific Opinion on Dietary Reference Values for energy. EFSA Journal 2013;11(1):3005.
583. Black AE. Critical evaluation of energy intake using the Goldberg cut-off for energy intake : basal metabolic rate. A practical guide to its calculation, use and limitations. Int J Obes Relat Metab Disord. 2000;24(9):1119-30.
584. Ferrari P, Slimani N, Ciampi A, Trichopoulou A, Naska A, Lauria C, et al. Evaluation of under- and overreporting of energy intake in the 24-hour diet recalls in the European Prospective Investigation into Cancer and Nutrition (EPIC). Public Health Nutr. 2002;5(6B):1329-45.
585. McGowan MJ, Harrington KE, Kiely M, Robson PJ, Livingstone MB, Gibney MJ. An evaluation of energy intakes and the ratio of energy intake to estimated basal metabolic rate (EI/BMRest) in the North/South Ireland Food Consumption Survey. Public Health Nutr. 2001;4(5A):1043-50.
586. Leclercq C, Arcella D, Piccinelli R, Sette S, Le Donne C, Turrini A, et al. The Italian National Food Consumption Survey INRAN-SCAI 2005-06: main

Page | 352
results in terms of food consumption. Public Health Nutr. 2009;12(12):2504-32.
587. Stockwell T, Donath S, Cooper-Stanbury M, Chikritzhs T, Catalano P, Mateo C. Under-reporting of alcohol consumption in household surveys: a comparison of quantity-frequency, graduated-frequency and recent recall. Addiction. 2004;99(8):1024-33.
588. Stewart AL, Mills KM, King AC, Haskell WL, Gillis D, Ritter PL. CHAMPS physical activity questionnaire for older adults: outcomes for interventions. Med Sci Sports Exerc. 2001;33(7):1126-41.
589. National Institute of Ageing. Clinical Research Study Investigator's Toolbox. Advere Events [Internet]. U.S. Department of Health & Human Services; 2016 [updated 21 Nov 2016; cited 2017 14 May]. Available from: https://www.nia.nih.gov/research/dgcg/clinical-research-study-investigators-toolbox/adverse-events.
590. Kelly J, Edney K, Moran C, Srikanth V, Callisaya M. Gender Differences in Physical Activity Levels of Older People With Type 2 Diabetes Mellitus. J Phys Act Health. 2016;13(4):409-15.
591. Qiu S-h, Sun Z-l, Cai X, Liu L, Yang B. Improving Patients' Adherence to Physical Activity in Diabetes Mellitus: A Review. Diabetes Metab J. 2012;36(1):1-5.
592. Oude Rengerink K, Opmeer BC, Logtenberg SL, Hooft L, Bloemenkamp KW, Haak MC, et al. IMproving PArticipation of patients in Clinical Trials--rationale and design of IMPACT. BMC Med Res Methodol. 2010;10(1):85.
593. Johnson EJ, Niles BL, Mori DL. Targeted recruitment of adults with type 2 diabetes for a physical activity intervention. Diabetes Spectr. 2015;28(2):99-105.
594. Caldwell PH, Hamilton S, Tan A, Craig JC. Strategies for increasing recruitment to randomised controlled trials: systematic review. PLoS Med. 2010;7(11).
595. Daly RM, Miller EG, Dunstan DW, Kerr DA, Solah V, Menzies D, et al. The effects of progressive resistance training combined with a whey-protein drink and vitamin D supplementation on glycaemic control, body composition and cardiometabolic risk factors in older adults with type 2 diabetes: study protocol for a randomized controlled trial. Trials. 2014;15:431.
596. American College of Sports Medicine. ACSM Guidelines for Exercise Testing and Prescription. Philadelphia: Lippincott Williams & Wilkins; 2000.
597. Riddell MA, Renwick C, Wolfe R, Colgan S, Dunbar J, Hagger V, et al. Cluster randomized controlled trial of a peer support program for people with diabetes: study protocol for the Australasian Peers for Progress study. BMC Public Health. 2012;12(843):843.

Page | 353
598. Mount DL, Davis C, Kennedy B, Raatz S, Dotson K, Gary-Webb TL, et al. Factors influencing enrollment of African Americans in the Look AHEAD trial. Clin Trials. 2012;9(1):80-9.
599. Church TS, Earnest CP, Skinner JS, Blair SN. Effects of different doses of physical activity on cardiorespiratory fitness among sedentary, overweight or obese postmenopausal women with elevated blood pressure: a randomized controlled trial. JAMA. 2007;297(19):2081-91.
600. Daley AJ, Crank H, Mutrie N, Saxton JM, Coleman R. Patient recruitment into a randomised controlled trial of supervised exercise therapy in sedentary women treated for breast cancer. Contemp Clin Trials. 2007;28(5):603-13.
601. Irwin ML, Cadmus L, Alvarez-Reeves M, O'Neil M, Mierzejewski E, Latka R, et al. Recruiting and retaining breast cancer survivors into a randomized controlled exercise trial: the Yale Exercise and Survivorship Study. Cancer. 2008;112(11 Suppl):2593-606.
602. Rhew I, Yasui Y, Sorensen B, Ulrich CM, Neuhouser ML, Tworoger SS, et al. Effects of an exercise intervention on other health behaviors in overweight/obese post-menopausal women. Contemp Clin Trials. 2007;28(4):472-81.
603. Rubin RR, Fujimoto WY, Marrero DG, Brenneman T, Charleston JB, Edelstein SL, et al. The Diabetes Prevention Program: recruitment methods and results. Control Clin Trials. 2002;23(2):157-71.
604. Sanders KM, Stuart AL, Merriman EN, Read ML, Kotowicz MA, Young D, et al. Trials and tribulations of recruiting 2,000 older women onto a clinical trial investigating falls and fractures: Vital D study. BMC Med Res Methodol. 2009;9:78.
605. Tate DF, LaRose JG, Griffin LP, Erickson KE, Robichaud EF, Perdue L, et al. Recruitment of young adults into a randomized controlled trial of weight gain prevention: message development, methods, and cost. Trials. 2014;15:326.
606. Lovato LC, Hill K, Hertert S, Hunninghake DB, Probstfield JL. Recruitment for controlled clinical trials: literature summary and annotated bibliography. Control Clin Trials. 1997;18(4):328-52.
607. Piantadosi C, Chapman IM, Naganathan V, Hunter P, Cameron ID, Visvanathan R. Recruiting older people at nutritional risk for clinical trials: what have we learned? BMC Res Notes. 2015;8:151.
608. Korde LA, Micheli A, Smith AW, Venzon D, Prindiville SA, Drinkard B, et al. Recruitment to a physical activity intervention study in women at increased risk of breast cancer. BMC Med Res Methodol. 2009;9:27.
609. Bjornson-Benson WM, Stibolt TB, Manske KA, Zavela KJ, Youtsey DJ, Buist AS. Monitoring recruitment effectiveness and cost in a clinical trial. Control Clin Trials. 1993;14(2 Suppl):52S-67S.

Page | 354
610. Fouad MN, Corbie-Smith G, Curb D, Howard BV, Mouton C, Simon M, et al. Special populations recruitment for the Women's Health Initiative: successes and limitations. Control Clin Trials. 2004;25(4):335-52.
611. Glendenning P, Tse-Jiun Chew G. Controversies and consensus regarding vitamin D deficiency in 2015: whom to test and whom to treat? Med J Aust. 2015;202(9):470-1.
612. Hameed UA, Manzar D, Raza S, Shareef MY, Hussain ME. Resistance Training Leads to Clinically Meaningful Improvements in Control of Glycemia and Muscular Strength in Untrained Middle-aged Patients with type 2 Diabetes Mellitus. N Am J Med Sci. 2012;4(8):336-43.
613. Candow DG, Burke NC, Smith-Palmer T, Burke DG. Effect of whey and soy protein supplementation combined with resistance training in young adults. Int J Sport Nutr Exerc Metab. 2006;16(3):233-44.
614. Hulmi JJ, Lockwood CM, Stout JR. Effect of protein/essential amino acids and resistance training on skeletal muscle hypertrophy: A case for whey protein. Nutr Metab. 2010;7:51.
615. Mitri J, Dawson-Hughes B, Hu FB, Pittas AG. Effects of vitamin D and calcium supplementation on pancreatic beta cell function, insulin sensitivity, and glycemia in adults at high risk of diabetes: the Calcium and Vitamin D for Diabetes Mellitus (CaDDM) randomized controlled trial. Am J Clin Nutr. 2011;94(2):486-94.
616. Wallace TM, Levy JC, Matthews DR. Use and abuse of HOMA modeling. Diabetes Care. 2004;27(6):1487-95.
617. Simpson KA, Mavros Y, Kay S, Meiklejohn J, de Vos N, Wang Y, et al. Graded Resistance Exercise And Type 2 Diabetes in Older adults (The GREAT2DO study): methods and baseline cohort characteristics of a randomized controlled trial. Trials. 2015;16:512.
618. Perneger TV. What's wrong with Bonferroni adjustments. BMJ. 1998;316(7139):1236-8.
619. Deutz NE, Bauer JM, Barazzoni R, Biolo G, Boirie Y, Bosy-Westphal A, et al. Protein intake and exercise for optimal muscle function with aging: recommendations from the ESPEN Expert Group. Clin Nutr. 2014;33(6):929-36.
620. Zhu K, Meng X, Kerr D, Devine A, Solah V, Binns C, et al. The effects of a two-year RCT of whey protein supplementation on bone structure, IGF-1, and urinary calcium excretion in older postmenopausal women. J Bone Miner Res. 2011;26(2298-306):2298.
621. Gunnerud UJ, Ostman EM, Bjorck IM. Effects of whey proteins on glycaemia and insulinaemia to an oral glucose load in healthy adults; a dose-response study. Eur J Clin Nutr. 2013;67(7):749-53.

Page | 355
622. Abdulla H, Smith K, Atherton PJ, Idris I. Role of insulin in the regulation of human skeletal muscle protein synthesis and breakdown: a systematic review and meta-analysis. Diabetologia. 2016;59(1):44-55.
623. Miller SL, Tipton KD, Chinkes DL, Wolf SE, Wolfe RR. Independent and combined effects of amino acids and glucose after resistance exercise. Med Sci Sports Exerc. 2003;35(3):449-55.
624. Parkhouse WS, Coupland DC, Li C, Vanderhoek KJ. IGF-1 bioavailability is increased by resistance training in older women with low bone mineral density. Mech Ageing Dev. 2000;113(2):75-83.
625. Ahtiainen JP, Hulmi JJ, Lehti M, Kraemer WJ, Nyman K, Selanne H, et al. Effects of resistance training on expression of IGF-I splice variants in younger and older men. Eur J Sport Sci. 2016;16(8):1055-63.
626. Witard OC, McGlory C, Hamilton DL, Phillips SM. Growing older with health and vitality: a nexus of physical activity, exercise and nutrition. Biogerontology. 2016;17(3):529-46.
627. Stark M, Lukaszuk J, Prawitz A, Salacinski A. Protein timing and its effects on muscular hypertrophy and strength in individuals engaged in weight-training. J Int Soc Sports Nutr. 2012;9(1):54.
628. Katsanos CS, Madura JA, 2nd, Roust LR. Essential amino acid ingestion as an efficient nutritional strategy for the preservation of muscle mass following gastric bypass surgery. Nutrition. 2016;32(1):9-13.
629. Burd NA, Tang JE, Moore DR, Phillips SM. Exercise training and protein metabolism: influences of contraction, protein intake, and sex-based differences. J Appl Physiol. 2009;106(5):1692-701.
630. Wicherts IS, van Schoor NM, Boeke AJ, Visser M, Deeg DJ, Smit J, et al. Vitamin D status predicts physical performance and its decline in older persons. J Clin Endocrinol Metab. 2007;92(6):2058-65.
631. Bischoff-Ferrari HA, Dietrich T, Orav EJ, Hu FB, Zhang Y, Karlson EW, et al. Higher 25-hydroxyvitamin D concentrations are associated with better lower-extremity function in both active and inactive persons aged > or =60 y. Am J Clin Nutr. 2004;80(3):752-8.
632. Baczynski R, Massry SG, Magott M, el-Belbessi S, Kohan R, Brautbar N. Effect of parathyroid hormone on energy metabolism of skeletal muscle. Kidney Int. 1985;28(5):722-7.
633. Maestro B, Molero S, Bajo S, Davila N, Calle C. Transcriptional activation of the human insulin receptor gene by 1,25-dihydroxyvitamin D(3). Cell Biochem Funct. 2002;20(3):227-32.
634. Chiu KC, Chu A, Go VL, Saad MF. Hypovitaminosis D is associated with insulin resistance and beta cell dysfunction. Am J Clin Nutr. 2004;79(5):820-5.
635. Halfon M, Phan O, Teta D. Vitamin D: a review on its effects on muscle strength, the risk of fall, and frailty. Biomed Res Int. 2015;2015.

Page | 356
636. Barton-Davis ER, Shoturma DI, Musaro A, Rosenthal N, Sweeney HL. Viral mediated expression of insulin-like growth factor I blocks the aging-related loss of skeletal muscle function. Proc Natl Acad Sci U S A. 1998;95(26):15603-7.
637. Salles J, Chanet A, Giraudet C, Patrac V, Pierre P, Jourdan M, et al. 1,25(OH)2-vitamin D3 enhances the stimulating effect of leucine and insulin on protein synthesis rate through Akt/PKB and mTOR mediated pathways in murine C2C12 skeletal myotubes. Mol Nutr Food Res. 2013;57(12):2137-46.
638. Kukuljan S, Nowson CA, Sanders KM, Nicholson GC, Seibel MJ, Salmon J, et al. Independent and combined effects of calcium-vitamin D3 and exercise on bone structure and strength in older men: an 18-month factorial design randomized controlled trial. J Clin Endocrinol Metab. 2011;96(4):955-63.
639. Bunout D, Barrera G, Leiva L, Gattas V, de la Maza MP, Avendano M, et al. Effects of vitamin D supplementation and exercise training on physical performance in Chilean vitamin D deficient elderly subjects. Exp Gerontol. 2006;41(8):746-52.
640. Uusi-Rasi K, Patil R, Karinkanta S, Kannus P, Tokola K, Lamberg-Allardt C, et al. Exercise and vitamin D in fall prevention among older women: a randomized clinical trial. JAMA Intern Med. 2015;175(5):703-11.
641. Bischoff-Ferrari HA. Optimal serum 25-hydroxyvitamin D levels for multiple health outcomes. Adv Exp Med Biol. 2014;810:500-25.
642. Park BS, Khamoui AV, Brown LE, Kim DY, Han KA, Min KW, et al. Effects of Elastic Band Resistance Training on Glucose Control, Body Composition, and Physical Function in Women With Short- vs. Long-Duration Type-2 Diabetes. J Strength Cond Res. 2016;30(6):1688-99.
643. Straight CR, Dorfman LR, Cottell KE, Krol JM, Lofgren IE, Delmonico MJ. Effects of resistance training and dietary changes on physical function and body composition in overweight and obese older adults. J Phys Act Health. 2012;9(6):875-83.
644. Nicklas BJ, Chmelo E, Delbono O, Carr JJ, Lyles MF, Marsh AP. Effects of resistance training with and without caloric restriction on physical function and mobility in overweight and obese older adults: a randomized controlled trial. Am J Clin Nutr. 2015;101(5):991-9.
645. Zemel MB. Proposed role of calcium and dairy food components in weight management and metabolic health. Phys Sportsmed. 2009;37(2):29-39.
646. Astbury NM, Stevenson EJ, Morris P, Taylor MA, Macdonald IA. Dose-response effect of a whey protein preload on within-day energy intake in lean subjects. Br J Nutr. 2010;104(12):1858-67.
647. Tessari P, Kiwanuka E, Cristini M, Zaramella M, Enslen M, Zurlo C, et al. Slow versus fast proteins in the stimulation of beta-cell response and the

Page | 357
activation of the entero-insular axis in type 2 diabetes. Diabetes Metab Res Rev. 2007;23(5):378-85.
648. Arciero PJ, Gentile CL, Pressman R, Everett M, Ormsbee MJ, Martin J, et al. Moderate protein intake improves total and regional body composition and insulin sensitivity in overweight adults. Metabolism. 2008;57(6):757-65.
649. Intensive blood-glucose control with sulphonylureas or insulin compared with conventional treatment and risk of complications in patients with type 2 diabetes (UKPDS 33). UK Prospective Diabetes Study (UKPDS) Group. Lancet. 1998;352(9131):837-53.
650. The Royal Australian College of General Practitioners and Diabetes Australia. General practice management of type 2 diabetes – 2016–18 [Internet]. Melbourne, Australia: The Royal Australian College of General Practitioners; 2016 [cited 2017 Jan 10]. Available from: https://static.diabetesaustralia.com.au/s/fileassets/diabetes-australia/5d3298b2-abf3-487e-9d5e-0558566fc242.pdf.
651. Akhavan T, Luhovyy BL, Brown PH, Cho CE, Anderson GH. Effect of premeal consumption of whey protein and its hydrolysate on food intake and postmeal glycemia and insulin responses in young adults. Am J Clin Nutr. 2010;91(4):966-75.
652. Petersen BL, Ward LS, Bastian ED, Jenkins AL, Campbell J, Vuksan V. A whey protein supplement decreases post-prandial glycemia. Nutr J. 2009;8:47.
653. Clifton PM, Condo D, Keogh JB. Long term weight maintenance after advice to consume low carbohydrate, higher protein diets--a systematic review and meta analysis. Nutr Metab Cardiovasc Dis. 2014;24(3):224-35.
654. Dela F, Prats C, Helge JW. Exercise interventions to prevent and manage type 2 diabetes: physiological mechanisms. Med Sport Sci. 2014;60:36-47.
655. Kostoglou-Athanassiou I, Athanassiou P, Gkountouvas A, Kaldrymides P. Vitamin D and glycemic control in diabetes mellitus type 2. Ther Adv Endocrinol Metab. 2013;4(4):122-8.
656. Zhang J, Ye J, Guo G, Lan Z, Li X, Pan Z, et al. Vitamin D Status Is Negatively Correlated with Insulin Resistance in Chinese Type 2 Diabetes. Int J Endocrinol. 2016;2016.
657. Cade C, Norman AW. Vitamin D3 improves impaired glucose tolerance and insulin secretion in the vitamin D-deficient rat in vivo. Endocrinology. 1986;119(1):84-90.
658. Gedik O, Akalin S. Effects of vitamin D deficiency and repletion on insulin and glucagon secretion in man. Diabetologia. 1986;29(3):142-5.
659. Cianferotti L, Bertoldo F, Bischoff-Ferrari HA, Bruyere O, Cooper C, Cutolo M, et al. Vitamin D supplementation in the prevention and management of major chronic diseases not related to mineral homeostasis in adults: research for evidence and a scientific statement from the European society for clinical

Page | 358
and economic aspects of osteoporosis and osteoarthritis (ESCEO). Endocrine. 2017;56(2):245-61.
660. Lee J, Kim D, Kim C. Resistance Training for Glycemic Control, Muscular Strength, and Lean Body Mass in Old Type 2 Diabetic Patients: A Meta-Analysis. Diabetes Ther. 2017;10.1007/s13300-017-0258-3.
661. Umpierre D, Ribeiro PA, Schaan BD, Ribeiro JP. Volume of supervised exercise training impacts glycaemic control in patients with type 2 diabetes: a systematic review with meta-regression analysis. Diabetologia. 2013;56(2):242-51.
662. Teychenne M, Ball K, Salmon J, Daly RM, Crawford DA, Sethi P, et al. Adoption and maintenance of gym-based strength training in the community setting in adults with excess weight or type 2 diabetes: a randomized controlled trial. Int J Behav Nutr Phys Act. 2015;12:105.
663. Irvine C, Taylor NF. Progressive resistance exercise improves glycaemic control in people with type 2 diabetes mellitus: a systematic review. Aust J Physiother. 2009;55(4):237-46.
664. Mikines KJ, Sonne B, Farrell PA, Tronier B, Galbo H. Effect of physical exercise on sensitivity and responsiveness to insulin in humans. Am J Physiol. 1988;254(3 Pt 1):248-59.
665. Schneider SH, Amorosa LF, Khachadurian AK, Ruderman NB. Studies on the mechanism of improved glucose control during regular exercise in type 2 (non-insulin-dependent) diabetes. Diabetologia. 1984;26(5):355-60.
666. Kelley GA, Kelley KS. Impact of progressive resistance training on lipids and lipoproteins in adults: another look at a meta-analysis using prediction intervals. Prev Med. 2009;49(6):473-5.
667. Schwingshackl L, Missbach B, Dias S, Konig J, Hoffmann G. Impact of different training modalities on glycaemic control and blood lipids in patients with type 2 diabetes: a systematic review and network meta-analysis. Diabetologia. 2014;57(9):1789-97.
668. Santesso N, Akl EA, Bianchi M, Mente A, Mustafa R, Heels-Ansdell D, et al. Effects of higher- versus lower-protein diets on health outcomes: a systematic review and meta-analysis. Eur J Clin Nutr. 2012;66(7):780-8.
669. Hidayat K, Du HZ, Yang J, Chen GC, Zhang Z, Li ZN, et al. Effects of milk proteins on blood pressure: a meta-analysis of randomized control trials. Hypertens Res. 2017;40(3):264-70.
670. Zhang JW, Tong X, Wan Z, Wang Y, Qin LQ, Szeto IM. Effect of whey protein on blood lipid profiles: a meta-analysis of randomized controlled trials. Eur J Clin Nutr. 2016;70(8):879-85.
671. Denysschen CA, Burton HW, Horvath PJ, Leddy JJ, Browne RW. Resistance training with soy vs whey protein supplements in hyperlipidemic males. J Int Soc Sports Nutr. 2009;6:8.

Page | 359
672. Larsen T, Mose FH, Bech JN, Hansen AB, Pedersen EB. Effect of cholecalciferol supplementation during winter months in patients with hypertension: a randomized, placebo-controlled trial. Am J Hypertens. 2012;25(11):1215-22.
673. Strasser B, Siebert U, Schobersberger W. Resistance training in the treatment of the metabolic syndrome: a systematic review and meta-analysis of the effect of resistance training on metabolic clustering in patients with abnormal glucose metabolism. Sports Med. 2010;40(5):397-415.
674. Turnbull F, Neal B, Algert C, Chalmers J, Chapman N, Cutler J, et al. Effects of different blood pressure-lowering regimens on major cardiovascular events in individuals with and without diabetes mellitus: results of prospectively designed overviews of randomized trials. Arch Intern Med. 2005;165(12):1410-9.
675. Franz MJ, Boucher JL, Rutten-Ramos S, VanWormer JJ. Lifestyle weight-loss intervention outcomes in overweight and obese adults with type 2 diabetes: a systematic review and meta-analysis of randomized clinical trials. J Acad Nutr Diet. 2015;115(9):1447-63.
676. Hayashino Y, Jackson JL, Fukumori N, Nakamura F, Fukuhara S. Effects of supervised exercise on lipid profiles and blood pressure control in people with type 2 diabetes mellitus: a meta-analysis of randomized controlled trials. Diabetes Res Clin Pract. 2012;98(3):349-60.
677. Loimaala A, Groundstroem K, Rinne M, Nenonen A, Huhtala H, Parkkari J, et al. Effect of long-term endurance and strength training on metabolic control and arterial elasticity in patients with type 2 diabetes mellitus. Am J Cardiol. 2009;103(7):972-7.
678. Chen N, Wan Z, Han SF, Li BY, Zhang ZL, Qin LQ. Effect of vitamin D supplementation on the level of circulating high-sensitivity C-reactive protein: a meta-analysis of randomized controlled trials. Nutrients. 2014;6(6):2206-16.
679. Calle MC, Fernandez ML. Effects of resistance training on the inflammatory response. Nutr Res Pract. 2010;4(4):259-69.
680. Phillips MD, Patrizi RM, Cheek DJ, Wooten JS, Barbee JJ, Mitchell JB. Resistance training reduces subclinical inflammation in obese, postmenopausal women. Med Sci Sports Exerc. 2012;44(11):2099-110.
681. Della Gatta PA, Garnham AP, Peake JM, Cameron-Smith D. Effect of exercise training on skeletal muscle cytokine expression in the elderly. Brain Behav Immun. 2014;39:80-6.
682. Firdous S. Correlation of CRP, fasting serum triglycerides and obesity as cardiovascular risk factors. J Coll Physicians Surg Pak. 2014;24(5):308-13.
683. Vepsalainen T, Soinio M, Marniemi J, Lehto S, Juutilainen A, Laakso M, et al. Physical activity, high-sensitivity C-reactive protein, and total and

Page | 360
cardiovascular disease mortality in type 2 diabetes. Diabetes Care. 2011;34(7):1492-6.
684. Soinio M, Marniemi J, Laakso M, Lehto S, Ronnemaa T. High-sensitivity C-reactive protein and coronary heart disease mortality in patients with type 2 diabetes: a 7-year follow-up study. Diabetes Care. 2006;29(2):329-33.
685. Carrillo AE, Flynn MG, Pinkston C, Markofski MM, Jiang Y, Donkin SS, et al. Vitamin D supplementation during exercise training does not alter inflammatory biomarkers in overweight and obese subjects. Eur J Appl Physiol. 2012;112(8):3045-52.
686. Fayh AP, Lopes AL, da Silva AM, Reischak-Oliveira A, Friedman R. Effects of 5 % weight loss through diet or diet plus exercise on cardiovascular parameters of obese: a randomized clinical trial. Eur J Nutr. 2013;52(5):1443-50.
687. Abd El-Kader SM, Saiem Al-Dahr MH. Weight loss improves biomarkers endothelial function and systemic inflammation in obese postmenopausal Saudi women. Afr Health Sci. 2016;16(2):533-41.
688. Ma J, Jesudason DR, Stevens JE, Keogh JB, Jones KL, Clifton PM, et al. Sustained effects of a protein 'preload' on glycaemia and gastric emptying over 4 weeks in patients with type 2 diabetes: A randomized clinical trial. Diabetes Res Clin Pract. 2015;108(2):e31-4.
689. Matthews D, Hosker J, Rudenski A, Naylor B, Treacher D, Turner R. Homeostasis model assessment: insulin resistance and B-cell function from fasting plasma glucose and insulin concentrations in man. Diabetologia. 1985;28(7):412-9.
690. Bonora E, Saggiani F, Targher G, Zenere MB, Alberiche M, Monauni T, et al. Homeostasis model assessment closely mirrors the glucose clamp technique in the assessment of insulin sensitivity - Studies in subjects with various degrees of glucose tolerance and insulin sensitivity. Diabetes Care. 2000;23(1):57-63.
691. Radziuk J. Insulin sensitivity and its measurement: structural commonalities among the methods. J Clin Endocrinol Metab. 2000;85(12):4426-33.
692. Pham H, Utzschneider KM, de Boer IH. Measurement of insulin resistance in chronic kidney disease. Curr Opin Nephrol Hypertens. 2011;20(6):640-6.
693. Poslusna K, Ruprich J, de Vries JH, Jakubikova M, van't Veer P. Misreporting of energy and micronutrient intake estimated by food records and 24 hour recalls, control and adjustment methods in practice. Br J Nutr. 2009;101 (Suppl 2):S73-85.
694. Balducci S, Zanuso S, Cardelli P, Salvi L, Bazuro A, Pugliese L, et al. Effect of High- versus Low-Intensity Supervised Aerobic and Resistance Training on Modifiable Cardiovascular Risk Factors in Type 2 Diabetes; The Italian Diabetes and Exercise Study (IDES). PLoS One. 2012;7(11).

Page | 361
Appendices

Page | 362
Appendix 1
Mean baseline and the absolute change from baseline and the net differences for the change for HbA1c and body composition measurements in the PRT+WL and WL groups at 3, 6, 9 and 12-months.
PRT+WL WL Net Difference (95% CI)
HbA1c Baseline (%) 8.1 ± 1.0 7.5 ± 1.1 ∆ 3-months -0.6 (-1.0, -0.3)* -0.1 (-0.5, 0.4) 0.6 (0.0, 1.1)#
∆ 6-months -1.2 (-1.7, -0.7)† -0.4 (-0.9, -0.1)* 0.8 (0.1, 1.5)#
∆ 9-months -0.5 (-1.2, 0.2) 0.0 (-0.4, 0.4) 0.5 (-0.3, 1.4) ∆ 12-months -0.3 (-1.0, 0.4) 0.2 (-0.4, 0.7) 0.5 (-0.4, 1.4)
Body Weight Baseline (kg) 88.7 ± 10.9 89.5 ± 12.1 ∆ 3-months -1.8 (-2.8, -0.7)† -2.0 (-2.9, -1.1) † -0.2 (-1.6, 1.2) ∆ 6-months -2.5 (-4.0, -0.9)† -3.1 (-4.3, 1.8) † -0.6 (-2.6, 1.3)
∆ 9-months -2.3 (-3.8, -0.8)† -3.2 (-4.8, -1.6) † -0.9 (-2.9, 1.2)
∆ 12-months -1.7 (-2.6, -0.6)* -1.6 (-2.9, -0.3)* 0.0 (-1.6,1.6)
Fat Mass Baseline (kg) 33.1 ± 7.4 35.6 ± 6.8 ∆ 6-months -2.4 (-3.8, -0.9)† -2.1 (-3.6, -0.5)† 0.3 (-1.8, 2.3) ∆ 12-months -1.2 (-2.0, -0.3) 0.0 (-1.2, 0.8) 1.0 (-0.2, 2.2)
Lean Mass Baseline (kg) 51.8 ± 8.1 49.7 ± 9.5 ∆ 6-months 0.5 (-0.1, 1.1) -0.4 (-1.1, 0.3) -0.9 (-1.8, 0.0) ∆ 12-months 0.1 (-0.6, 0.8) -0.7 (-1.2, -0.1)* -0.7 (-1.6, 0.2)
Percent Fat Mass Baseline (%) 37.7 ± 6.8 40.6 ± 7.4 %∆ 6-months -2.0 (-3.1, -0.8)† -1.5 (-2.7, -0.2) 0.5 (-1.1, 2.1)
%∆ 12-months -0.7 (-1.5, 0.0) -0.9 (-3.6, 1.7) -0.2 (-2.6, 2.2) DXA measurements for fat mass, lean mass and percent fat mass were only performed at 0-, 6- and 12-months. Baseline values represent mean ± SD; change represents mean (95% CI). * P < 0.05, † P <0.01 vs baseline; # P < 0.05 between-group difference from baseline.

Page | 363
Appendix 2
Mean values ± SD in various inflammatory markers for the PRT+WL and WL groups at 3-, 6-, 9- and 12-months.
PRT + WL WL
IL-10 (pg/ml)
Baseline 14.1 ± 19.2 4.2 ± 5.7
3-months 11.0 ± 17.8 5.2 ± 12.6
6-months 10.7 ± 19.0 4.4 ± 3.4
9-months 10.0 ± 18.7 6.5 ± 8.2
12-months 14.1 ± 23.0 7.4 ± 13.5
IL-6 (pg/ml)
Baseline 3.7 ± 3.1 1.6 ± 1.8
3-months 3.9 ± 4.0 1.3 ± 1.1
6-months 4.4 ± 4.7 3.9 ± 7.9
9-months 6.1 ± 10.5 1.8 ± 1.7
12-months 5.9 ± 7.3 4.3 ± 6.4
TNF-α (pg/ml)
Baseline 8.2 ± 3.6 7.1 ± 5.0
3-months 7.3 ± 2.9 6.9 ± 6.2
6-months 9.1 ± 5.9 13.4 ± 20.2
9-months 7.1 ± 2.9 7.8 ± 4.5
12-months 6.2 ± 2.3 8.9 ± 6.6
Adiponectin (µg/ml)
Baseline 1.7 ± 0.7 2.7 ± 0.9
3-months 1.8 ± 0.5 2.9 ± 0.9
6-months 2.0 ± 0.8 2.9 ± 1.3
9-months 2.2 ± 1.3 3.0 ± 1.1
12-months 2.2 ± 1.5 2.5 ± 0.9 Values are raw means ± SD

Page | 364
Appendix 3
Mean value ± SD in endothelial markers for the PRT+WL and WL groups at 3-, 6-, 9- and 12-months.
PRT+WL PRT
ICAM-1 (ng/ml)
Baseline 134.9 ± 59.6 142.4 ± 69.4
3-months 135.7 ± 51.3 143.0 ± 75.2
6-months 134.3 ± 49.3 121.7 ± 47.5
9-months 113.9 ± 22.6 122.2 ± 54.7
12-months 120.0 ± 32.6 113.8 ± 41.3
Resistin (ng/ml)
Baseline 10.5 ± 5.6 11.0 ± 3.9
3-months 12.2 ± 4.2 10.8 ± 3.7
6-months 11.7 ± 4.6 10.5 ± 4.5
9-months 10.4 ± 4.6 11.5 ± 5.6
12-months 10.6 ± 5.3 10.4 ± 4.2 Values are raw means ± SD

Page | 365
Appendix 4

Page | 366
Appendix 5

sfol
Retracted Stamp

Page | 368

Page | 369

Page | 370
Appendix 7
PLAIN LANGUAGE STATEMENT AND CONSENT FORM
TO: Participants
Plain Language Statement
Date: 3rd April, 2014 Full Project Title: Does a High Protein Enriched Drink and Vitamin D
Enhance the Health Benefits of the Lift for Life® Resistance Training Program in Older Adults with Type 2 Diabetes?
Principal Researcher: Professor Robin Daly Student Researcher: Ms Eliza Miller Associate Researcher(s): Professor David Dunstan, Professor Caryl Nowson,
Associate Professor Deborah Kerr, Associate Professor Vicky Solah, Mr David Menzies, Dr Helen Macpherson, Dr Matthew Hughes
This Plain Language Statement and Consent Form is 9 pages long. Please make sure you have all the pages.
1. Your Consent You are invited to take part in this research project which will investigate the effects of resistance training (lifting weights) alone or resistance training in combination with a protein enriched drink with additional vitamin D on blood glucose levels, body composition and cardiovascular risk factors in people with type 2 diabetes. This Plain Language Statement contains detailed information about the research project. Its purpose is to explain to you as openly and clearly as possible all the procedures involved in this project before you decide whether or not to take part in it. Please read this Plain Language Statement carefully. Feel free to ask questions about any information in the document. You may also wish to discuss the project with a relative or friend or your local health worker. Feel free to do this. Once you understand what the project is about and if you agree to take part in it, you will be asked to sign the Consent Form. By signing the Consent Form, you indicate that you understand the information and that you give your consent to participate in the research project.

Page | 371
You will be given a copy of the Plain Language Statement and Consent Form to keep as a record. Participation in this study is voluntary. If you do not wish to take part you are not obliged to. If you decide to take part and later change your mind, you are free to withdraw from the project at any stage. Your decision whether or not to participate will not affect your relationship with Deakin University.
2. Purpose and Background Regular exercise is important for maintaining blood glucose levels in people with, or at risk of developing, type 2 diabetes because it helps to make the muscles use glucose more effectively. Resistance training (lifting weights) is particularly effective for improving blood glucose levels as well as increasing muscle mass, strength and physical function. To optimise the health benefits of resistance training, it has been suggested that it should be combined with adequate nutrition, particularly an adequate intake of dietary protein. Maintaining adequate vitamin D levels has also been shown to be important for both optimal blood glucose levels and muscle function. Thus, this 6-month study is designed to investigate whether daily consumption of a protein enriched drink and vitamin D can enhance the benefits of participation in the Lift for Life® resistance training program on glycaemic control, body composition and cardiovascular risk factors in people with type 2 diabetes. Lift for Life® is a community-based resistance training program for people with or at risk of developing type 2 diabetes that is being coordinated by Fitness Australia and Baker IDI Heart and Diabetes Institute. A total of 202 men and women with type 2 diabetes who have agreed to participate in the commercial Lift for Life® resistance training program will participate in this project. You are invited to participate in this research project because you have type 2 diabetes and are aged between 50 and 75 years and free of any serious health conditions that might limit your participation in the Lift for Life® resistance training program. If you are not eligible for this study, you may still be able to participate in the standard Lift for Life® program. This study is being sponsored by the National Health and Medical Research Council (NHMRC). This trial has been initiated by the investigator, Professor Robin Daly.
3. Procedures – what you will be asked to do If you decide to participate in this study you will be asked to sign this Participant Information and Consent Form. To participate in this study, you must have passed the initial telephone screening test conducted by one of the research staff. Before you commence the study, you will be required to visit your local doctor who will be required to complete the Lift for Life® recommendation to participate health and medical screening form to make sure that you don’t have any medical conditions that could affect your participation in this study (e.g. unstable heart disease). Upon entry into the study, you will undergo initial baseline testing and then you will be randomly allocated (like the flip of a coin) to one of two groups. You will have a one in two chance of being in either group. This is called randomisation. This is a

Page | 372
standard research method used to ensure that the results of a study are true and correct.
Group 1: Lift for Life® resistance training with increased dietary protein and vitamin D. If you are allocated to this group you will be prescribed an individually tailored and progressive resistance training program which will be conducted at an accredited Lift for Life® health and fitness centre. You will be required to attend 2 supervised exercise sessions and another non-supervised exercise session each week for 6-months. The supervised sessions will be conducted by qualified Lift for Life® exercise trainers. Each session will last approximately 45-60 minutes, and include a warm-up and cool-down and moderate intensity resistance training. Therefore, the total time commitment for the 6-months of training will be approximately 150 minutes per week, which is the current recommended level of physical activity. To monitor your progress, you will be asked to complete a diary of your participation in the exercise program. You will also be asked to take vitamin D supplements (2000 IU) and consume one protein enriched drink (about 150 ml providing 20g of protein) each morning before breakfast and the same drink after each Lift for Life® training session. You will be supplied with all drinks and supplements at no charge for the duration of the study. To monitor your intake, you will be asked to complete a daily calendar/checklist throughout the study.
Group 2: Lift for Life® resistance training. If you are allocated to this group you will be prescribed the same exercise program as outlined for Group 1, but you will not be asked to consume either the protein drinks or vitamin D supplements. As per group 1, you will also be asked to record your participation in the exercise program in a diary.
For all people involved in the study, we will collect the following information and conduct a number of tests throughout the 6-month study. This testing will be conducted at both the Lift for Life® health and fitness centres and at Deakin University in Burwood.
• You will be asked to complete a general lifestyle and health questionnaire to obtain information on past employment history, education history, marital status, cultural background, menopausal history (women only), dieting and weight history, alcohol intake, smoking history, medical history, use of prescription and non-prescription medications and diabetes history and perceived barriers and obstacles to participating in exercise. We will also measure your weight, height and waist circumference at the beginning of the study and after 3 and 6 months.
• Total body composition (amount of muscle and fat) and bone density of the total body, hip and spine will be measured using a non-invasive method referred to as dual energy X-ray absorptiometry (DXA) at the beginning and end of the study. The assessment of body composition and bone density by DXA involves lying on a bed for approximately 20 minutes whilst a scanning arm moves along the length of your body above you. This test will be conducted at Deakin University and we will arrange transport for you to Deakin from your home if needed.
• Peripheral computed tomography (pQCT) is a non-invasive method that will be used to assess muscle and fat size and density in your thigh at the beginning and end of the study. Your leg will be inserted into the opening of a gantry (ring with x-ray source and detectors) for scanning. This test will involve remaining still for three to five minutes during the measurement. The pQCT scans will

Page | 373
cause no pain or discomfort other than having to remain still. This test will be conducted at Deakin University at the same time as your DXA scan.
• We will take a small blood sample to assess the effects of the program on a number of important markers in your blood, including blood glucose, glycated haemoglobin (HbA1c), insulin, cholesterol and lipids, vitamin D and other markers of muscle and bone metabolism and inflammation. A blood sample of 30 mls (1.5 tablespoon) will be taken from a vein in your arm using a needle at baseline, 3 and 6 months. The blood sample will collected by a trained research nurse in the morning when you have had nothing to eat or drink since the night before.
• We would also like to assess your blood pressure at baseline, 3 and 6 months. • You will be required to undergo some simple balance and walking tests to
measure your muscle function at baseline, 3 and 6 months. We will assess your maximal muscle strength on specific resistance (strength) training equipment. This involves lifting weights until you can only lift a weight three times.
• We would also like to ask you a few questions about your exercise/physical activity and TV/computer habits three times over the study. In addition, we would also like to assess your dietary habits using a food frequency questionnaire at baseline, 3 and 6 months and a 24-hour food recall each month, which will be completed over the telephone with one of the researchers.
• You will be asked to complete a questionnaire which will assess your health-related quality of life at the beginning and end of the study. You will also be asked to complete a simple computer test and questionnaire to assess you cognitive function at baseline, 3 and 6 months.
There will be continual review and monitoring during your participation in this research to enable the early detection of any problems that you may experience.
THIS NEXT ASSESSMENT TASK IS OPTIONAL You will also be invited to have a brain scan using MRI (Magnetic Resonance Imaging) at Swinburne University in Hawthorn (at no cost to you). MRI scanning involves brain imaging techniques that are non-invasive and provide the ability to image the brain whilst completing a simply task. Before the MRI session begins, you will be required to complete a safety questionnaire administered by the neuroimaging technologist regarding any metal you have on or in your body, such as that from any surgery involving metal plates and pace makers. A copy of the MRI safety questionnaire is attached to this document. Due to the nature of MRI that involves magnets, no metal may be taken into the room. The scanner is also quite noisy so you will be provided with some headphones to reduce this noise. Once in the scanner, you will undergo a structural brain scan, a resting state scan, where you will have your eyes closed, and a functional scan where you will perform a simple memory task. The entire time spent in the MRI scanner should not exceed 45 minutes.
4. Collection of Tissue Samples for Research Purposes By consenting to take part in this study, you also consent to the collection, storage and use of tissue samples as specified below. A blood sample of 30 mls (1.5 tablespoon) will be taken from a vein in your arm using a needle at the beginning of the study, 3 and 6 months by a qualified research nurse. The samples will not be labelled with information that directly identifies you.

Page | 374
The samples will be “coded”, which means that it will be labelled with a number that can be linked to you. All samples will be stored securely at Deakin University and only the research staff involved in this study will have access to the samples. Some of the samples will be tested immediately at the end of the study and some will be frozen and stored for 10-years following the publication of study findings. We wish to store these samples to conduct further testing to look for other muscle, bone, inflammatory or cardiometabolic biomarkers when and if funding for this becomes available in the future. This future testing may be conducted by researchers from the present study or by other researchers employed by Deakin University. If any changes to the study are made which affect how these samples will be used, your samples will not be used, without your further consent. These samples will be disposed of according to standard laboratory practice, immediately after testing.
5. Possible Benefits We cannot guarantee or promise that you will receive any benefits from this project. By participating in this project, you will receive information on ways to improve your health. For some people the possible benefits may include an improvement in blood glucose levels and blood lipids and an increase in muscle mass, strength and function (e.g. balance), and a reduction of circulating (blood) markers of inflammation which are linked to common chronic diseases. We also expect that the findings from this study will make an important contribution to the development of exercise and dietary guidelines to improve health outcomes for people with type 2 diabetes.
6. Possible Risks Possible risks, side effects and discomforts include the following: • The exercise program will involve resistance (strength) training and you may
experience some minor and transient muscle soreness initially following the training sessions or the muscle strength testing. However, this form of training has been shown to be safe and acceptable, and the Lift for Life® program is designed in such a way to help minimise risks for participants through (1) supervised and graduated exercise programs; (2) specialised training for Lift for Life® Trainers; (3) requirement for Doctor’s approval prior to commencing the program; (4) pre-exercise assessment; and (5) regular assessments during the program.
• This research study involves exposure to a very small amount of radiation from DXA and pQCT scans of your body. As part of everyday living, everyone is exposed to naturally occurring background radiation and receives a dose of about 2 millisieverts (mSv) each year. The effective dose you will receive from all the DXA and pQCT scans of your body will be approximately 0.065 mSv. At these dose levels, no harmful effects of radiation have been demonstrated, as any effect is too small to measure. The risk is believed to be very low.
• If you have been involved in any other research studies that involve radiation, please inform us. Please keep this Patient Information and Consent Form that includes information about your exposure to radiation in this study for at least five years. You will be required to provide this information to researchers of any future research studies
• When you have blood samples taken for this study, you might feel pain or be light-headed and there is a chance you might get a small bruise on your arm.

Page | 375
• Participants randomised to the protein and vitamin D fortified group (Group 1) will be asked to consume an additional 20-40g of protein and 2000 IU of vitamin D each day for 6 months. The amount of protein is within the recommended range for a healthy diet. We will measure your kidney function from the blood sample that you provide. If we detect any problems we will refer you to your doctor and ask you to withdraw from the study. Treatment with vitamin D is also very safe. There is a very small risk of hypercalcemia (high calcium levels in the blood) and hypercalciuria (high calcium levels in the urine) with vitamin D therapy. If you know you have high levels of blood calcium, then you will not be asked to take part in this study. The amount of vitamin D in the supplement is at the level recommended for health benefits. Thus, normal health will not be adversely affected by consumption of the test product to be used in this study.
• MRI uses radio waves and magnetism to make diagnostic images of the body. There are no known harmful effects. This test involves no radiation. Some people may find the MRI scan unpleasant, and feel claustrophobic, because you have to lie in a chamber while the scan is performed. Certain medical devices must be excluded from the MRI facilities. Such as cardiac pacemakers, cochlear implants, neuro-stimulators, certain metallic dental work, body jewellery and other metallic foreign objects implanted in the body. A complete list is outlined on MRI Pre-Scan Safety Questionnaires. You will be asked to indicate on this questionnaire any previous surgery regarding implanted metal in your body and any surgical operation performed on your head/arm. Some people may find the MRI scan unpleasant, and feel claustrophobic, because you have to lie in a chamber while the scan is performed. In the event that anxiety, claustrophobia or panic attacks are experienced during the scan and you wish to stop the scan, then the scan shall be terminated. After the MRI scans, a Swinburne University’s radiologist will examine the brain scans. There is a rare possibility that an abnormality may be found that is significant and which should be investigated further. Although a significant abnormality is extremely unlikely, if one is detected you will be informed by the radiologist or your nominated health practitioner. If you would prefer not to be exposed to this unlikely (yet possible) experience, then you are advised not to participate in the MRI scan.
There may be additional unforeseen or unknown risks.
7. Other Treatments Whilst on Study It is important to tell your doctor and the research staff about any treatments or medications you may be taking, including non-prescription medications, vitamins or herbal remedies and any changes to these during your participation in the study.
9. Privacy, Confidentiality and Disclosure of Information Any information obtained in connection with this research project that can identify you will remain confidential and will only be used for the purpose of this research project. All collected information will be labelled with a unique study code, and not with your name or any other identifying information, which be kept separate from the information collected. All paper copies of this information will be kept in a locked filing cabinet in the researcher’s office at Deakin University or in a password protected computer. Only researchers involved in this project will have access to this information. The information collected from this study will be kept until the end of the project and then placed in archives for 6 years from the publication of findings. All data will also be kept in a database stored on a computer which will be password

Page | 376
protected and only accessible to the research staff involved in this study, and may be used in future research which is closely related to this project. We wish to store blood samples to conduct further testing to look for other muscle, bone or inflammatory biomarkers when and if funding for this becomes available in the future. This future testing may be conducted by researchers from the present study or by other researchers employed by Deakin University. In any publication, information will be provided in such a way that you cannot be identified; only group findings will be published. In accordance with the Freedom of Information Act 1982 (Vic), you have the right to access and to request correction of information held about you by Deakin University.
10. New Information Arising During the Project During the research project, new information about the risks and benefits of the project may become known to the researchers. If this occurs, you will be told about this new information. This new information may mean that you can no longer participate in this research. If this occurs, the person(s) supervising the research will stop your participation. In all cases, you will be offered all available care to suit your needs and medical condition.
11. Results of Project At the completion of the study, you will be provided with an individual report of your results. You will also receive access to the main findings from the study.
12. Further Information or Any Problems
If you require further information or if you have any problems concerning this project (for example, any side effects) you can contact the principal researcher or associate researcher.
Contact Person Telephone Number
Professor Robin Daly 03 9244 6040
Ms Eliza Miller 03 9244 6739
13. Other Issues If you have any complaints about any aspect of the project, the way it is being conducted or any questions about your rights as a research participant, then you may contact:
The Manager, Research Integrity, Deakin University, 221 Burwood Highway, Burwood Victoria 3125, Telephone: 9251-7129, [email protected]
Please quote project number [2013-050].
14. Participation is Voluntary Participation in any research project is voluntary. If you do not wish to take part you are not obliged to. If you decide to take part and later change your mind, you are free to withdraw from the project at any stage.

Page | 377
Your decision whether to take part or not to take part, or to take part and then withdraw, will not affect your routine treatment, your relationship with those treating you or your relationship with Deakin University. You will also have the option to withdraw your data and tissues from the research project if you wish to do so. Before you make your decision, a member of the research team will be available so that you can ask any questions you have about the research project. You can ask for any information you want. Sign the Consent Form only after you have had a chance to ask your questions and have received satisfactory answers. If you decide to withdraw from this project, please notify a member of the research team before you withdraw. This notice will allow that person or the research supervisor to inform you if there are any health risks or special requirements linked to withdrawing.
15. Reimbursement for your costs As reimbursement for some of the expenses incurred by you for participating in the Lift for Life® resistance training program, you will be eligible to receive up to $240 in vouchers or cash at the completion of the study. The amount you will be reimbursed will be determined each month based on your continued involvement in the study. All protein-based drinks and supplements will be provided to you free of charge if you are randomly allocated to this group. No costs will be incurred by you for the blood collection or any of the other tests.
16. Ethical Guidelines This project will be carried out according to the National Statement on Ethical Conduct in Research Involving Humans (June 1999) produced by the National Health and Medical Research Council of Australia. This statement has been developed to protect the interests of people who agree to participate in human research studies. The ethical aspects of this research project have been approved by the Deakin University Human Research Ethics Committee (project number [2013-050].
17. Termination of the Study This research project may be stopped for a variety of reasons. These may include reasons such as: unacceptable side effects.

Page | 378
PLAIN LANGUAGE STATEMENT AND CONSENT FORM
TO: Participants
Consent Form
Date: 3rd April 2014
Full Project Title: Does a High Protein Enriched Drink and Vitamin D Enhance the Health Benefits of the Lift for Life® Resistance Training Program in Older Adults with Type 2 Diabetes?
Reference Number: [2013-050]
I have read, and I understand the attached Plain Language Statement.
I freely agree to participate in this project according to the conditions in the Plain Language Statement.
As indicated in the plain language statement there is an OPTIONAL component of this study involving the use of Magnetic Resonance Imaging (MRI) to assess the effects of the intervention on brain structure and function. Please indicate below (tick box) whether you are willing to participate in this aspect of the study.
o I AGREE to participate in the MRI sub study to assess brain structure and function.
o I DO NOT wish to participate in the MRI sub study to assess brain structure and function.
I have been given a copy of the Plain Language Statement and Consent Form to keep.
The researcher has agreed not to reveal my identity and personal details, including where information about this project is published, or presented in any public form.
Participant’s Name (printed) …………………………………………………………………………………………
Signature ……………………………………………….. Date………………….........

sfol
Retracted Stamp

Page | 380

Page | 381
Appendix 9
Baseline values and absolute within-group changes in the progressive resistance training (PRT) plus protein and vitamin D supplementation (PRT+ProD) and PRT groups and the net between-group differences for the change at 12- and 24-weeks relative to baseline for saturated fat, dietary cholesterol and select micronutrients excluding the protein-vitamin D supplements.
Baseline Values and Within-Group Changes
PRT+ProD PRT Intervention Effects
Mean ± SD or
(95% CI) P-value Mean ± SD or
(95% CI) P-value Net Difference
(95% CI) P- values
Model 1 | Model 3 Saturated Fat (g/day)
Baseline 26.1 ± 13.0 30.0 ± 17.6
Δ 12-weeks 0.4 (-2.8, 3.6) 0.890 -2.5 (-6.7, 1.7) 0.284 2.9 (-2.3, 8.1) 0.430 | 0.273
Δ 24-weeks -0.6 (-3.5, 2.4) 0.622 -5.0 (-9.1, -1.0) 0.018 4.5 (-0.4, 9.4) 0.105 | 0.087
Cholesterol (mg)
Baseline 279.7 ± 164.3 329.6 ± 278.0
Δ 12-weeks 20.6 (-31.9, 80.0) 0.805 -11.4 (-77.1, 54.2) 0.740 32.0 (-50.7, 114.7) 0.663 | 0.570
Δ 24-weeks 32.5 (-26.7, 91.7) 0.302 -29.0 (-96.3, 38.3) 0.225 61.5 (-27.1, 150.1) 0.101 | 0.092
Sodium (mg)
Baseline 2648 ± 1504 2602 ± 1438
Continued over page

Page | 382
Δ 12-weeks -185 (-536, 166) 0.173 -146 (-494, 202) 0.242 -39 (-530, 452) 0.809 | 0.814
Δ 24-weeks 146 (-275, 567) 0.989 -171.1 (-544, 202) 0.165 317 (-245, 878) 0.337 | 0.241
Potassium (mg)
Baseline 3493 ± 1161 3620 ± 1138
Δ 12-weeks 75 (-233, 383) 0.502 -114 (-414, 186) 0.451 189 (-239, 617) 0.313 | 0.268
Δ 24-weeks -100 (-383, 183) 0.359 -18 (-352, 317) 0.969 -82 (-515, 350) 0.541 | 0.381
Calcium (mg)
Baseline 899 ± 414 945 ± 414
Δ 12-weeks -67 (-156, 21) 0.219 3 (-100, 106) 0.944 -70 (-204, 64) 0.444 | 0.438
Δ 24-weeks 27 (-79, 133) 0.796 -69 (-178, 40) 0.136 96 (-54, 247) 0.205 | 0.216
Magnesium (mg)
Baseline 399 ± 149 421 ± 142
Δ 12-weeks -14 (-50, 23) 0.496 -10 (-44, 24) 0.442 -4 (-53, 46) 0.917 | 0.844
Δ 24-weeks -14 (-51, 23) 0.325 -2 (-41, 38) 0.937 -12 (-65, 41) 0.547 | 0.465 Baseline values represent mean ± SD and within group changes and net differences represent means with 95% confidence intervals (CI). Intervention effect refers to the within group change from baseline in the intervention group minus the within group change from baseline in the control group. All change values and net differences were derived from unadjusted values. Significant differences are highlighted in bold. Model 1 represents unadjusted P-values. Model 3 represents the P-value after adjustments for age, gender, ethnicity, BMI and moderate-vigorous physical activity. PRT+ProD, progressive resistance training plus protein and vitamin D supplements; PRT, progressive resistance training.

Page | 383
Appendix 10
Per Protocol Results Tables
Table 1: Baseline values and absolute within-group changes in the PRT+ProD and PRT group and the net between-group differences for the change at 12- and 24-weeks relative to baseline for moderate habitual physical activity. Baseline Values and Within-Group Changes
PRT+ProD PRT Intervention Effects
Mean ± SD or
(95% CI) P-value Mean ± SD or
(95% CI) P-value Net Difference
(95% CI) P- values
Model 1 | Model 3 Moderate-vigorous Physical Activity (kJ/Week)
Baseline 7,475 ± 8,418a 10,908 ± 8,342
∆ 12-weeks 1,004 (-1,129, 3,137) 0.343 890 (-1,018, 2,797) 0.390 114 (-2,699, 2,928) 0.970 | 0.985 ∆ 24-weeks 3,874 (1,401, 6,347) 0.001 44 (-2,570, 2,658) 0.985 3,830 (212, 7,449) 0.009 | 0.012
Baseline values represent mean ± SD and within group changes and net differences represent means with 95% confidence intervals (CI). Intervention effect refers to the within group change from baseline in the intervention group minus the within group change from baseline in the control group. All change values and net differences were derived from model 1 – unadjusted values. Significant differences are highlighted in bold. Model 1 represents unadjusted P-values. Model 3 represents the P-value after adjusting for baseline values, age, gender, ethnicity and BMI. a P<0.05 vs PRT at baseline. PRT+ProD, progressive resistance training plus protein and vitamin D supplements; PRT, progressive resistance training.
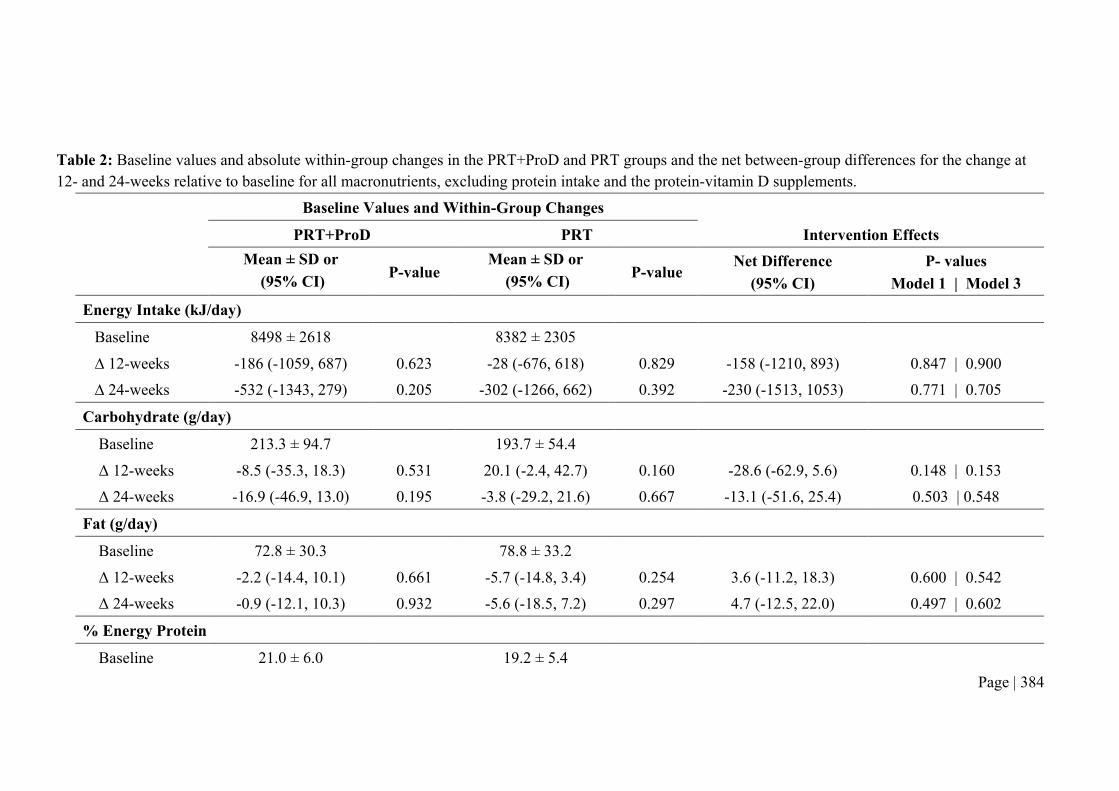
Page | 384
Table 2: Baseline values and absolute within-group changes in the PRT+ProD and PRT groups and the net between-group differences for the change at 12- and 24-weeks relative to baseline for all macronutrients, excluding protein intake and the protein-vitamin D supplements.
Baseline Values and Within-Group Changes
PRT+ProD PRT Intervention Effects
Mean ± SD or
(95% CI) P-value Mean ± SD or
(95% CI) P-value Net Difference
(95% CI) P- values
Model 1 | Model 3 Energy Intake (kJ/day)
Baseline 8498 ± 2618 8382 ± 2305
∆ 12-weeks -186 (-1059, 687) 0.623 -28 (-676, 618) 0.829 -158 (-1210, 893) 0.847 | 0.900 ∆ 24-weeks -532 (-1343, 279) 0.205 -302 (-1266, 662) 0.392 -230 (-1513, 1053) 0.771 | 0.705
Carbohydrate (g/day)
Baseline 213.3 ± 94.7 193.7 ± 54.4 Δ 12-weeks -8.5 (-35.3, 18.3) 0.531 20.1 (-2.4, 42.7) 0.160 -28.6 (-62.9, 5.6) 0.148 | 0.153 Δ 24-weeks -16.9 (-46.9, 13.0) 0.195 -3.8 (-29.2, 21.6) 0.667 -13.1 (-51.6, 25.4) 0.503 | 0.548
Fat (g/day)
Baseline 72.8 ± 30.3 78.8 ± 33.2 Δ 12-weeks -2.2 (-14.4, 10.1) 0.661 -5.7 (-14.8, 3.4) 0.254 3.6 (-11.2, 18.3) 0.600 | 0.542 Δ 24-weeks -0.9 (-12.1, 10.3) 0.932 -5.6 (-18.5, 7.2) 0.297 4.7 (-12.5, 22.0) 0.497 | 0.602
% Energy Protein
Baseline 21.0 ± 6.0 19.2 ± 5.4

Page | 385
Δ 12-weeks -0.5 (-2.3, 1.3) 0.512 -0.6 (-2.3, 1.0) 0.739 0.1 (-2.2, 2.5) 0.824 | 0.838 Δ 24-weeks -0.4 (-2.4, 1.6) 0.279 2.0 (0.1, 3.8) 0.005 -2.3 (-5.0, 0.4) 0.007 | 0.006
% Energy Fat
Baseline 31.9 ± 10.1 34.1 ± 8.5 Δ 12-weeks -0.3 (-3.2, 2.6) 0.819 -2.0 (-5.0, 0.9) 0.154 1.7 (-2.4, 5.8) 0.397 | 0.350 Δ 24-weeks 1.1 (-2.3, 4.5) 0.324 -0.4 (-3.2, 2.4) 0.444 1.5 (-2.8, 5.8) 0.213 | 0.274
% Energy Carbohydrates
Baseline 41.5 ± 9.8 39.5 ± 8.5 Δ 12-weeks 0.2 (-2.7, 3.1) 0.849 3.6 (0.7, 6.5) 0.036 -3.4 (-7.5, 0.7) 0.180 | 0.146 Δ 24-weeks -0.7 (-4.7, 3.3) 0.714 -0.2 (-3.2, 2.8) 0.833 -0.4 (-5.2, 4.3) 0.902 | 0.937
Alcohol§ (g/day)
Baseline 5.8 ± 8.8 10.2 ± 15.7 Δ 12-weeks 0.3 (-1.6, 2.3) 0.670 -2.5 (-4.7, -0.4) 0.010 2.8 (0.0, 5.8) 0.044 | 0.048 Δ 24-weeks 0.77 (-1.1, 2.6) 0.372 -1.1 (-2.3, 0.2) 0.383 1.8 (-0.3, 3.9) 0.221 | 0.268
Baseline values represent mean ± SD and within group changes and net differences represent means with 95% confidence intervals (CI). Intervention effect refers to the within group change from baseline in the intervention group minus the within group change from baseline in the control group. All change values and net differences were derived from unadjusted values. Significant differences are highlighted in bold. Model 1 represents unadjusted P-values. Model 3 represents the P-value after adjusting for age, gender, ethnicity, BMI and moderate-vigorous physical activity § Baseline alcohol intake and the change in alcohol intake was calculated based only on the number of participants in each group who reported being a consumer of alcohol at respective time points. PRT+ProD, progressive resistance training plus protein and vitamin D supplements; PRT, progressive resistance training.

Page | 386
Table 3: Baseline values and absolute within-group changes in PRT+ProD and PRT groups and the net between-group differences for the change at 12- and 24-weeks relative to baseline for saturated fat, cholesterol, sodium, potassium, calcium and magnesium.
Baseline Values and Within-Group Changes
PRT+ProD PRT Intervention Effects
Mean ± SD or
(95% CI) P-
value Mean ± SD or
(95% CI) P-value Net Difference
(95% CI) P- values
Model 1 | Model 3
Saturated Fat (g/day)
Baseline 26.2 ± 12.4 27.4 ± 14.8
Δ 12-weeks -0.1 (-5.5, 5.3) 0.958 -2.6 (-6.9, 1.7) 0.264 2.5 (-4.1, 9.2) 0.447 | 0.424
Δ 24-weeks -0.1 (-4.6, 4.5) 0.969 -2.9 (-7.9, 2.1) 0.208 2.9 (-4.0, 9.7) 0.393 | 0.338
Cholesterol (mg)
Baseline 258.6 ± 99.7 272.9 ± 181.9
Δ 12-weeks 44.8 (-25.5, 115.2) 0.261 18.5 (-48.0, 84.9) 0.532 26.4 (-69.2, 121.9) 0.754 | 0.723
Δ 24-weeks 17.7 (-53.8, 89.2) 0.630 15.7 (-56.4, 87.8) 0.640 -2.0 (-99.6, 103.5) 0.999 | 0.974
Sodium (mg)
Baseline 2740 ± 1438 2378 ± 960
Δ 12-weeks -457 (-994, 80) 0.120 79 (-317, 475) 0.824 -536 (-1182, 109) 0.143 | 0.147
Δ 24-weeks 22 (-650, 693) 0.919 48 (-351, 448) 0.848 -26 (-762, 709) 0.865 | 0.982
Continued over page

Page | 387
Potassium (mg)
Baseline 3649 ± 1188 3504 ± 1124
Δ 12-weeks 231 (-241, 703) 0.336 -85 (-428, 259) 0.580 316 (-248, 880) 0.282 | 0.240
Δ 24-weeks -254 (-616, 108) 0.260 338 (-92, 768) 0.128 -592 (-1165, -19) 0.062 | 0.019
Calcium (mg)
Baseline 929 ± 377 897 ± 359
Δ 12-weeks -159 (-279, -38) 0.016 -11 (-127, 104) 0.857 -148 (-312, 17) 0.144 | 0.155
Δ 24-weeks -18 (-139, 103) 0.373 -17 (-164, 130) 0.686 -1 (-193, 190) 0.748 | 0.763
Magnesium (mg)
Baseline 402 ± 184 410 ± 143
Δ 12-weeks -18 (-79, 43) 0.434 -24 (-62, 14) 0.158 5 (-63, 73) 0.769 | 0.720
Δ 24-weeks -44 (-97, 10) 0.116 10 (-37, 57) 0.790 -14 (-49, 22) 0.159 | 0.080 Baseline values represent mean ± SD and within group changes and net differences represent means with 95% confidence intervals (CI). Intervention effect refers to the within group change from baseline in the intervention group minus the within group change from baseline in the control group. All change values and net differences were derived from unadjusted values. Significant differences are highlighted in bold. Model 1 represents unadjusted P-values. Model 3 represents the P-value after adjustments for age, gender, ethnicity, BMI and moderate-vigorous physical activity. PRT+ProD, progressive resistance training plus protein and vitamin D supplements; PRT, progressive resistance training.

Page | 388
Table 4: Baseline values and absolute within-group changes in the PRT+ProD and PRT groups and the net between-group differences for the change at 12- and 24-weeks relative to baseline for habitual protein intake and protein intake inclusive of supplemental protein on non-training and training days in g/day and g/kg/day.
Baseline Values and Within-Group Changes
PRT+ProD PRT Intervention Effects
Mean ± SD or
(95% CI) P-value Mean ± SD or
(95% CI) P-value Net Difference
(95% CI) P- values
Model 1 | Model 2 Protein (g/day)
Habitual Protein (Excluding Whey Supplement)
Baseline 103.8 ± 32.4 93.5 ± 26.4
∆ 12-weeks -3.5 (-12.7, 5.8) 0.471 -2.8 (-11.5, 5.9) 0.651 -0.65 (-13.2, 11.9) 0.777 | 0.836
∆ 24-weeks -12.4 (-25.7, 0.8) 0.035 5.9 (-3.8, 15.5) 0.190 -18.3 (-34.1, -2.26) 0.012 | 0.006
Habitual Protein plus Whey Supplement (Non-Training Day)
Baseline 103.8 ± 32.4 93.5 ± 26.4
Δ 12-weeks 15.5 (6.1, 24.8) 0.009 -2.8 (-11.5, 5.9) 0.651 18.2 (5.7, 30.9) 0.018 | 0.014 Δ 24-weeks 6.6 (-6.7, 19.9) 0.219 2.7 (-8.0, 13.3) 0.190 3.9 (-12.7, 20.5) 0.869 | 0.932
Habitual Protein plus Whey Supplement (Training Day)
Baseline 103.8 ± 32.4 93.5 ± 26.4
Δ 12-weeks 34.4 (24.9, 43.8) 0.001 -2.8 (-11.5, 5.9) 0.651 37.2 (24.5, 49.9) 0.001 | 0.001 Δ 24-weeks 25.6 (12.3, 38.9) 0.001 2.7 (-8.0, 13.3) 0.190 22.9 (6.3, 39.5) 0.005 | 0.011

Page | 389
Protein (g/kg/day) Habitual Protein (Excluding Whey Supplement)
Baseline 1.23 ± 0.35 b 1.03 ± 0.28
Δ 12-weeks -0.03 (-0.14, 0.07) 0.561 -0.03 (-0.13, 0.07) 0.633 0.00 (-0.15, 0.14) 0.855 | 0.874
Δ 24-weeks -0.13 (-0.28, 0.03) 0.090 0.08 (-0.02, 0.19) 0.086 -0.21 (-0.39, -0.03) 0.015 | 0.015
Habitual Protein plus Whey Supplement (Non-Training Day)
Baseline 1.23 ± 0.35 b 1.03 ± 0.28
Δ 12-weeks 0.20 (0.09, 0.31) 0.005 -0.03 (-0.13, 0.07) 0.633 0.23 (0.08, 0.37) 0.009 | 0.009 Δ 24-weeks 0.11 (-0.05, 0.27) 0.079 0.08 (-0.02, 0.19) 0.086 0.02 (-0.16, 0.21) 0.656 | 0.688
Habitual Protein plus Whey Supplement (Training Day) Baseline 1.23 ± 0.35 b 1.03 ± 0.28
Δ 12-weeks 0.43 (0.31, 0.54) 0.001 -0.03 (-0.13, 0.07) 0.633 0.46 (0.31, 0.60) 0.001 | 0.001 Δ 24-weeks 0.34 (017, 0.51) 0.001 0.08 (-0.02, 0.19) 0.086 0.26 (0.07, 0.45) 0.001 | 0.002
Baseline values represent mean ± SD and within group changes and net differences represent means with 95% confidence intervals (CI). Intervention effect refers to the within group change from baseline in the intervention group minus the within group change from baseline in the control group. All change values, net differences and interaction effects were derived from unadjusted values. Significant differences are highlighted in bold. Model 1 represents unadjusted P-values. Model 3 represents the P-value after adjustments for age, gender, ethnicity, BMI and moderate-vigorous physical activity. PRT+ProD, progressive resistance training plus protein and vitamin D supplements; PRT, progressive resistance training.

Page | 390
Table 5: Baseline values and absolute within-group changes in PRT+ProD and PRT groups and the net between-group differences for the change at 12- and 24-weeks relative to baseline for HbA1c, fasting plasma glucose, C-peptide and measures of insulin resistance, sensitivity and beta-cell function.
Baseline Values and Within-Group Changes
PRT+ProD PRT Intervention Effects
Mean ± SD or
(95% CI) P-value Mean ± SD or
(95% CI) P-value Net Difference
(95% CI) P- values
Model 1 | Model 3 HbA1c (%)
Baseline 6.76 ± 1.00 6.88 ± 1.08 Δ 12-weeks -0.27 (-0.45, -0.08) 0.006 -0.06 (-0.21, 0.09) 0.422 -0.20 (-0.43, 0.02) 0.095 | 0.111 Δ 24-weeks -0.22 (-0.46, 0.02) 0.022 -0.09 (-0.27, 0.10) 0.265 -0.14 (-0.43, 0.16) 0.266 | 0.134 HbA1c (IFCC mmol/mol) Baseline 50.34 ± 10.96 51.64 ± 11.72 Δ 12-weeks -2.98 (-4.94, -1.02) 0.005 -0.54 (-2.16, 1.08) 0.524 -2.44 (-4.92, 0.05) 0.287 | 0.081 Δ 24-weeks -2.44 (-5.05, -0.17) 0.021 -0.90 (-2.92, 1.12) 0.288 -1.54 (-4.74, 1.66) 0.344 | 0.119 Fasting Glucose (mmol/L)
Baseline 7.52 ± 1.80a 8.47 ± 2.12
Δ 12-weeks -0.31 (-0.64, 0.02) 0.153 -0.38 (-0.74, -0.03) 0.036 0.07 (-0.41, 0.56) 0.304 | 0.631 Δ 24-weeks -0.07 (-0.52, 0.38) 0.737 -0.57 (-0.98, -0.17) 0.002 0.50 (-0.10, 2.00) 0.451 | 0.311
Continued over page

Page | 391
Fasting Insulin (pmol/L)
Baseline 84.96 ± 51.08 102.82 ± 50.96 Δ 12-weeks -13.8 (-26.3, -1.4) 0.010 -2.9 (-14.7, 8.9) 0.594 -11.0 (-27.9, 6.0) 0.155 | 0.138 Δ 24-weeks -9.5 (-20.8, 1.8) 0.078 -3.1 (-10.8, 4.6) 0.570 -6.0 (-10.8, 4.6) 0.404 | 0.689
Insulin sensitivity (HOMA2%S)
Baseline 79.4 ± 48.8b 57.3 ± 25.4 Δ 12-weeks 8.3 (-3.7, 20.3) 0.095 5.2 (-4.0, 14.4) 0.314 3.1 (-11.5, 17.8) 0.911 | 0.454 Δ 24-weeks 5.5 (-6.1, 17.1) 0.282 7.3 (-0.7, 15.2) 0.088 -1.7 (-15.4, 11.9) 0.369 | 0.787
C-peptide (nmol/L)
Baseline 1.10 ± 0.44a 1.26 ± 0.36 Δ 12-weeks -0.07 (-0.14, 0.01) 0.058 -0.03 (-0.10, 0.04) 0.453 -0.04 (-0.15, 0.06) 0.394 | 0.425 Δ 24-weeks -0.04 (-0.11, 0.03) 0.254 -0.06 (-0.14, 0.02) 0.093 0.02 (-0.09, 0.12) 0.745 | 0.974
Baseline values represent mean ± SD and within group changes and net differences represent means with 95% confidence intervals (CI). Intervention effect refers to the within group change from baseline in the intervention group minus the within group change from baseline in the control group. All change values and net differences were derived from unadjusted values. Significant differences are highlighted in bold. Model 1 represents unadjusted P-values. Model 3 represents the P-value after adjustments for age, gender, ethnicity, BMI, oral hypoglycaemic use and moderate-vigorous physical activity. a P<0.05, b P<0.01 vs PRT at baseline. PRT+ProD, progressive resistance training plus protein and vitamin D supplements; PRT, progressive resistance training.

Page | 392
Table 6: Baseline values and absolute within-group changes in the PRT+ProD and PRT groups for weight, body mass index (BMI) and waist circumference and the net between-group differences for the change relative to baseline at 12- and 24-weeks.
Baseline Values and Within-Group Changes
PRT+ProD PRT Intervention Effects
Mean ± SD or
(95% CI) P-value Mean ± SD or
(95% CI) P-value Net Difference
(95% CI) P- values
Model 1 | Model 3 Body Weight (kg) Baseline 84.4 ± 16.3a 91.6 ± 12.6 Δ 12-weeks 0.2 (-0.3, 0.7) 0.464 -0.1 (-0.5, 0.4) 0.811 0.3 (-0.4, 1.0) 0.499 | 0.487
Δ 24-weeks -0.2 (-1.0, 0.6) 0.491 -1.0 (-1.8, -0.2) 0.001 0.8 (-0.3, 1.9) 0.064 | 0.030
BMI (kg/m2) Baseline 29.5 ± 4.4a 31.6 ±4.1 Δ 12-weeks 0.9 (-0.1, 0.3) 0.386 0.0 (-0.2, 0.1) 0.864 0.1 (-0.1, 0.3) 0.509 | 0.516
Δ 24-weeks -0.1 (-0.4, 0.1) 0.268 -0.4 (-0.7, -0.1) 0.001 0.3 (-0.1, 0.7) 0.066 | 0.046
Waist Circumference (cm)
Baseline 100.0 ± 12.3a 105.7 ± 10.5 Δ 12-weeks -0.6 (-1.4, 0.3) 0.179 -1.3 (-2.0, -0.7) 0.001 0.8 (-0.2, 1.8) 0.271 | 0.254
Δ 24-weeks -1.3 (-2.4, -0.2) 0.001 -2.6 (-3.4, 1.8) 0.001 12.6 (-0.1, 2.6) 0.083 | 0.180 Baseline values represent mean ± SD and within group changes and net differences represent means with 95% confidence intervals (CI). Intervention effect refers to the within group change from baseline in the intervention group minus the within group change from baseline in the control group. All change values and net differences were derived from unadjusted values. Significant differences are highlighted in bold. Model 1 represents unadjusted P-values. Model 3 represents the P-value after adjustments

Page | 393
for age, gender, ethnicity and moderate-vigorous physical activity. a P<0.05 vs PRT at baseline. PRT+ProD, progressive resistance training plus protein and vitamin D supplements; PRT, progressive resistance training.

Page | 394
Table 7: Baseline values and absolute within-group changes in PRT+ProD and PRT groups and the net between-group differences for the change at 24-weeks from baseline for total body and regional (arms and legs) fat mass and lean mass and appendicular lean mass.
Baseline Values and Within-Group Changes
PRT+ProD PRT Intervention Effects
Mean ± SD or
(95% CI) P-value Mean ± SD or
(95% CI) P-value Net Difference
(95% CI) P- values
Model 1 | Model 3 Total Body
Fat Mass (kg) Baseline 30.68 ± 8.55 34.14 ± 9.47 Δ 24-weeks -0.73 (-1.41, -0.06) 0.029 -1.33 (-1.98, -0.67) 0.001 -0.60 (-0.34, 1.54) 0.206 | 0.169 Lean Mass (kg) Baseline 49.58 ± 10.97a 53.53 ± 9.33
Δ 24-weeks 0.85 (0.38, 1.31) 0.001 0.51 (0.12, 0.90) 0.008 0.19 (-0.38, 0.76) 0.270 | 0.213 Percentage Fat Mass (%) Baseline 38.05 ± 7.70 38.73 ± 8.35
% Δ 24-weeks -0.89 (-1.48, -0.31) 0.002 -1.25 (-1.78, -0.72) 0.001 0.36 (-0.42, 1.14) 0.357 | 0.334 Appendicular Lean Mass (kg)
Baseline 22.10 ± 5.37a 24.47 ± 4.73
Δ 24-weeks 0.53 (0.31, 0.74) 0.001 0.21 (0.01, 0.40) 0.031 0.32 (0.03, 0.60) 0.027 | 0.184

Page | 395
Arms
Fat Mass (kg) Baseline 3.11 ± 1.09 3.46 ± 1.48
Δ 24-weeks -0.03 (-0.01, 0.06) 0.479 -0.07 (-0.16, 0.02) 0.136 0.04 (-0.10, 0.17) 0.584 | 0.441 Lean Mass (kg) Baseline 5.70 ± 1.56a 6.38 ± 1.28
Δ 24-weeks 0.25 (0.16, 0.34) 0.001 0.13 (0.04, 0.21) 0.003 0.09 (-0.03, 0.22) 0.054 | 0.066
Legs
Fat Mass (kg) Baseline 8.36 ± 3.05 9.56 ± 4.26
Δ 24-weeks -0.13 (-0.32, 0.00) 0.149 -0.26 (-0.46, -0.07) 0.007 0.01 (-0.01, 0.04) 0.334 | 0.357 Lean Mass (kg) Baseline 16.35 ± 3.89a 18.10 ± 3.54
Δ 24-weeks 0.28 (0.01, 0.05) 0.001 0.01 (-0.08, 0.02) 0.305 0.20 (-0.04, 0.43) 0.095 | 0.141 Baseline values represent mean ± SD and within group changes and net differences represent means with 95% confidence intervals (CI). Intervention effect refers to the within group change from baseline in the intervention group minus the within group change from baseline in the control group. All change values and net differences were derived from unadjusted values. Significant differences are highlighted in bold. Model 1 represents unadjusted P-values. Model 3 represents the P-value after adjustments for age, gender, ethnicity and moderate-vigorous physical activity. a P<0.05 vs PRT at baseline. PRT+ProD, progressive resistance training plus protein and vitamin D supplements; PRT, progressive resistance training.

Page | 396
Table 8: Baseline values and absolute within-group changes in PRT+ProD and PRT groups and the net between-group differences for the change at 24-weeks from baseline for 25% femur muscle cross-sectional area (CSA), density and intermuscular plus subcutaneous fat CSA.
Baseline Values and Within-Group Changes
PRT+ProD PRT Intervention Effects
Mean ± SD or
(95% CI) P-value Mean ± SD or
(95% CI) P-value Net Difference
(95% CI) P- values
Model 1 | Model 3 Muscle CSA Baseline (cm2) 59.1 ± 12.8a 66.3 ± 14.6 % Δ 24-weeks 4.9 (2.2, 7.6) 0.001 2.3 (0.1, 4.4) 0.177 2.6 (-0.7, 6.0) 0.056 | 0.078
Muscle Density
Baseline (mg/cm3) 73.4 ± 3.4 73.4 ± 2.8
% Δ 24-weeks 0.2 (-1.1, 1.5) 0.895 0.8 (0.1, 1.6) 0.041 -0.6 (-2.1, 0.8) 0.336 | 0.497
Intermuscular Fat Area (cm2)
Baseline 21.3 ± 6.3 22.1 ± 4.9
% Δ 24-weeks 1.0 (-3.5, 5.5) 0.964 -1.5 (-5.5, 2.5) 0.244 2.5 (-3.5, 8.4) 0.419 | 0.469
Subcutaneous Fat Area (cm2)
Baseline 40.2 ± 22.2 47.8 ± 32.2 % Δ 24-weeks -3.2 (-7.4, 1.0) 0.362 -2.6 (-5.9, 0.8) 0.620 -0.6 (-5.8, 4.7) 0.906 | 0.616
Baseline values represent mean ± SD and within group changes and net differences represent means with 95% confidence intervals (CI). Intervention effect refers to the within group change from baseline in the intervention group minus the within group change from baseline in the control group. All change values and net differences were derived from unadjusted values. Significant differences are highlighted in bold. Model 1 represents unadjusted P-values. Model 3 represents the P-

Page | 397
value after adjustments for age, gender, ethnicity and moderate-vigorous physical activity. a P<0.05 vs PRT at baseline. CSA, Cross sectional area; PRT+ProD, progressive resistance training plus protein and vitamin D supplements; PRT, progressive resistance training.

Page | 398
Table 9: Baseline values and absolute within-group changes in PRT+ProD and PRT groups and the net between-group differences for the change at 24-weeks relative to baseline in leg press and seated row one-repetition maximum muscle strength and knee extensor isometric muscle strength.
Baseline Values and Within-Group Changes
PRT+ProD PRT Intervention Effects
Mean ± SD or
(95% CI) P-value Mean ± SD or
(95% CI) P-value Net Difference
(95% CI) P- values
Model 1 | Model 3 1-RM Leg Press
Baseline (kg) 177.6 ± 67.8 206.8 ± 90.5
% Δ 24-weeks 18.8 (10.7, 26.8) 0.001 13.5 (4.4, 22.7) 0.003 5.2 (-7.1, 17.5) 0.408 | 0.710
1-RM Seated Row
Baseline (kg) 51.2 ± 17.2a 58.2 ± 16.7
% Δ 24-weeks 16.8 (7.8, 25.8) 0.001 4.2 (-1.2, 9.6) 0.120 12.7 (2.7, 22.6) 0.033 | 0.041
Knee Extensor Strength
Baseline (kg) 36.9 ± 13.7 42.0 ± 14.5
% Δ 12-weeks 7.7 (4.4, 11.0) 0.001 9.4 (6.4, 12.4) 0.001 -1.7 (-6.1, 2.7) 0.391 | 0.227 % Δ 24-weeks 26.3 (14.6, 38.1) 0.001 29.1 (17.1, 41.0) 0.001 -4.8 (-21.1, 11.6) 0.313 | 0.229
Baseline values represent mean ± SD and within group changes and net differences represent means with 95% confidence intervals (CI). Intervention effect refers to the within group change from baseline in the intervention group minus the within group change from baseline in the control group. All change values and net differences were derived from unadjusted values. Significant differences are highlighted in bold. Model 1 represents unadjusted P-values. Model 3 represents the P-value after adjustments for age, gender, ethnicity and moderate-vigorous physical activity. PRT+ProD, progressive resistance training plus protein and vitamin D supplements; PRT, progressive resistance training.

Page | 399
Table 10: Baseline values and absolute within-group changes in PRT+ProD and PRT groups and the net between-group differences for the change at 12- and 24-weeks relative to baseline for systolic and diastolic blood pressure.
Baseline Values and Within-Group Changes
PRT+ProD PRT Intervention Effects
Mean ± SD or
(95% CI) P-value Mean ± SD or
(95% CI) P-value Net Difference
(95% CI) P- values
Model 1 | Model 3 Systolic Blood Pressure (mmHg)
Baseline 138.0 ± 16.52 135.1 ± 12.58
Δ 12-weeks -4.6 (-9.0, -0.17) 0.167 -0.1 (-5.2, 5.0) 0.965 -4.5 (-11.3, 2.3) 0.273 | 0.244 Δ 24-weeks -3.9 (-8.9, 1.2) 0.017 -3.5 (-7.9, 1.0) 0.166 -0.4 (-7.0, 6.3) 0.273 | 0.181
Diastolic Blood Pressure (mmHg) Baseline 85.7 ± 9.9 83.8 ± 7.4 Δ 12-weeks -2.9 (-5.5, -0.4) 0.032 -1.1 (-3.5, 1.3) 0.378 -1.8 (-5.3, 1.6) 0.315 | 0.307 Δ 24-weeks -8.0 (-15.9, 0.0) 0.040 -3.5 (-8.0, 1.0) 0.010 -4.50 (-13.1, 4.1) 0.789 | 0.999
Baseline values represent mean ± SD and within group changes and net differences represent means with 95% confidence intervals (CI). Intervention effect refers to the within group change from baseline in the intervention group minus the within group change from baseline in the control group. All change values and net differences were derived from unadjusted values. Significant differences are highlighted in bold. Model 1 represents unadjusted P-values. Model 3 represents the P-value after adjustments for age, gender, ethnicity, BMI, anti-hypertensive use and moderate-vigorous physical activity. PRT+ProD, progressive resistance training plus protein and vitamin D supplements; PRT, progressive resistance training.

Page | 400
Table 11: Baseline values and absolute within-group changes in PRT+ProD and PRT groups and the net between-group differences for the change at 12- and 24-weeks relative to baseline for serum total cholesterol, HDL and LDL cholesterol and triglycerides.
Baseline Values and Within-Group Changes
PRT+ProD PRT Intervention Effects
Mean ± SD or
(95% CI) P-value Mean ± SD or
(95% CI) P-value Net Difference
(95% CI) P- values
Model 1 | Model 3 Total Cholesterol (mmol/L)
Baseline 4.39 ± 1.21 4.17 ± 0.95
Δ 12-weeks -0.21 (-0.45, 0.03) 0.041 -0.02 (-0.15, 0.10) 0.762 -0.19 (-0.44, 0.07) 0.128 | 0.079 Δ 24-weeks -0.22 (-0.44, 0.00) 0.030 0.02 (-0.13, 0.17) 0.783 -0.24 (-0.49, 0.01) 0.049 | 0.014
HDL Cholesterol (mmol/L)
Baseline 1.26 ± 0.35 1.23 ± 0.28
Δ 12-weeks -0.02 (-0.09, 0.04) 0.426 0.03 (-0.01, 0.08) 0.148 -0.05 (-0.12, 0.02) 0.118 | 0.081 Δ 24-weeks 0.00 (-0.06, 0.04) 0.708 0.00 (-0.05, 0.05) 0.973 0.00 (-0.08, 0.06) 0.766 | 0.560
LDL Cholesterol (mmol/L)
Baseline 2.41 ± 1.00 2.11 ± 0.81 Δ 12-weeks -0.18 (-0.37, 0.02) 0.034 -0.04 (-0.14, 0.06) 0.537 -0.13 (-0.35, 0.07) 0.203 | 0.169 Δ 24-weeks -0.20 (-0.38, -0.01) 0.018 0.07 (-0.06, 0.21) 0.271 -0.27 (-0.49, -0.05) 0.011 | 0.003

Page | 401
Triglycerides (mmol/L)
Baseline 1.59 ± 0.75 1.84 ± 0.95 Δ 12-weeks -0.02 (-0.21, 0.16) 0.786 -0.03 (-0.25, 0.19) 0.781 0.01 (-0.28, 0.30) 0.960 | 0.977 Δ 24-weeks -0.03 (-0.19, 0.13) 0.724 0.01 (-0.35, 0.27) 0.931 -0.04 (-0.35, 0.28) 0.782 | 0.704
Baseline values represent mean ± SD and within group changes and net differences represent means with 95% confidence intervals (CI). Intervention effect refers to the within group change from baseline in the intervention group minus the within group change from baseline in the control group. All change values and net differences were derived from unadjusted values. Significant differences are highlighted in bold. Model 1 represents unadjusted P-values. Model 3 represents the P-value after adjustments for age, gender, ethnicity, BMI, lipid-lowering medication and moderate habitual physical activity. PRT+ProD, progressive resistance training plus protein and vitamin D supplements; PRT, progressive resistance training.

Page | 402
Table 12: Baseline values and percent changes in the PRT+ProD and PRT groups and the net between-group differences for the change at 12- and 24-weeks relative to baseline for serum levels of interleukin (IL)-10, IL-6, IL-8, tumour necrosis factor-alpha (TNF-α), adiponectin and high-sensitive C-reactive protein (CRP).
Baseline Values and Within-Group Changes
PRT+ProD PRT Intervention Effects
Mean ± SD or
(95% CI) P-value Mean ± SD or
(95% CI) P-value Net Difference
(95% CI) P- values
Model 1 | Model 3 IL-10
Baseline (pg/ml) 9.45 ± 11.12 11.16 ± 19.69
% Δ 12-weeks 55.9 (22.2, 89.7) 0.001 -12.7 (-28.5, 3.0) 0.061 68.7 (33.9, 103.5) 0.001 | 0.001 % Δ 24-weeks 57.4 (23.2, 91.6) 0.001 -14.8 (-30.9, 1.3) 0.030 72.2 (36.8, 107.5) 0.001 | 0.001
IL-6
Baseline (pg/ml) 2.75 ± 2.31 2.59 ± 2.14
% Δ 12-weeks 22.8 (-4.9, 50.5) 0.073 -12.3 (-32.5, 8.0) 0.267 35.1 (19.4, 68.2) 0.037 | 0.047 % Δ 24-weeks 30.7 (9.3, 52.2) 0.016 -4.4 (-26.5, 17.7) 0.687 35.1 (4.4, 65.8) 0.036 | 0.051
IL-8
Baseline (pg/ml) 15.18 ± 8.18 15.03 ± 7.25
% Δ 12-weeks 10.8 (-2.1, 23.8) 0.062 1.1 (-5.6, 7.8) 0.761 9.7 (-4.0, 23.4) 0.142 | 0.106 % Δ 24-weeks 5.2 (-2.8, 13.1) 0.379 7.4 (-0.3, 15.0) 0.043 -2.2 (-13.1, 8.8) 0.736 | 0.671

Page | 403
TNF-a
Baseline (pg/ml) 7.69 ± 2.23 7.71 ± 2.48 % Δ 12-weeks 2.6 (-3.7, 9.0) 0.369 -3.2 (-9.2, 2.9) 0.343 5.8 (-2.9, 14.5) 0.198 | 0.202
% Δ 24-weeks 3.3 (-2.7, 9.3) 0.260 2.0 (-4.8, 8.9) 0.503 1.3 (-7.8, 10.4) 0.784 | 0.751
Adiponectin
Baseline (µg/mL) 3.23 ± 2.25 2.93 ± 1.25 % Δ 12-weeks -1.0 (-8.2, 6.3) 0.343 -3.5 (-7.8, 0.9) 0.150 2.5 (-5.6, 10.5) 0.532 | 0.512
% Δ 24-weeks -3.7 (-7.8, 0.3) 0.503 -2.2 (-7.5, 3.0) 0.349 -1.5 (-8.2, 5.2) 0.691 | 0.240
High sensitive-CRP
Baseline (mg/mL) 1.59 ± 1.34 2.08 ± 2.36 % Δ 12-weeks -8.4 (-35.6, 18.9) 0.512 -1.4 (-23.5, 20.6) 0.893 -6.9 (-41.1, 27.2) 0.674 | 0.672
% Δ 24-weeks -6.8 (-29.0, 15.3) 0.593 9.6 (-13.9, 33.1) 0.367 -16.4 (-48.8, 15.9) 0.319 | 0.431 Baseline values represent mean ± SD and within group changes and net differences represent means with 95% confidence intervals (CI). Intervention effect refers to the within group change from baseline in the intervention group minus the within group change from baseline in the control group. All change values and net differences were derived from unadjusted values. Significant differences are highlighted in bold. Model 1 represents unadjusted P-values. Model 3 represents the P-value after adjustments for age, gender, ethnicity, BMI and moderate habitual physical activity. a P<0.05 vs PRT at baseline. PRT+ProD, progressive resistance training plus protein and vitamin D supplements; PRT, progressive resistance training.

Page | 404
Table 13: Baseline values and absolute within-group changes in PRT+ProD and PRT groups and the net between-group differences for the change at 12- and 24-weeks relative to baseline for serum creatinine, estimated glomular filtration (eGFR), 25-hydroxyvitamin D (25(OH)D) and insulin-like growth factor-1 (IGF-1).
Baseline Values and Within-Group Changes
PRT+ProD PRT Intervention Effects
Mean ± SD or
(95% CI) P-value Mean ± SD or
(95% CI) P-value Net Difference
(95% CI) P- values
Model 1 | Model 3 Creatinine (mol/L)
Baseline 74.41 ± 13.27a 80.70 ± 15.83
Δ 12-weeks 2.27 (-0.47, 5.01) 0.097 -1.02 (-3.58, 1.54) 0.411 3.29 (-0.42, 6.99) 0.075 | 0.113 Δ 24-weeks 5.10 (2.39, 7.80) 0.001 4.24 (1.49, 6.99) 0.001 0.86 (-2.99, 4.70) 0.642 | 0.449
eGFR (ml/min/1.73m2)
Baseline 85.00 ± 6.81a 80.38 ± 11.77
Δ 12-weeks -0.98 (-2.50, 0.53) 0.320 0.80 (-1.21, 2.81) 0.404 -1.78 (-4.35, 0.80) 0.199 | 0.258 Δ 24-weeks -3.83 (-6.00, -1.66) 0.001 -3.10 (-5.23, -0.97) 0.001 -0.73 (-3.75, 2.29) 0.598 | 0.510
25(OH)D (nmol/L)
Baseline 78.77 ± 22.30 68.12 ± 22.21
Δ 12-weeks 26.74 (18.82, 34.66) 0.001 3.06 (-2.09, 8.20) 0.257 23.68 (14.68, 32.69) 0.001 | 0.001 Δ 24-weeks 33.88 (25.82, 41.95) 0.001 5.05 (-1.39, 11.49) 0.061 28.83 (-18.79, 38.88) 0.001 | 0.001

Page | 405
IGF-1 (nmol/L)
Baseline 20.62 ± 6.96 20.4 ± 7.50 Δ 12-weeks 0.48 (-0.56, 1.51) 0.365 -0.82 (-1.53, -0.12) 0.063 1.30 (0.10, 2.51) 0.057 | 0.068
Δ 24-weeks 0.80 (-0.32, 1.93) 0.127 -0.25 (-1.29, 0.79) 0.568 1.06 (-0.46, 2.57) 0.122 | 0.054 Baseline values represent mean ± SD and within group changes and net differences represent means with 95% confidence intervals (CI). Intervention effect refers to the within group change from baseline in the intervention group minus the within group change from baseline in the control group. All change values and net differences were derived from unadjusted values. Significant differences are highlighted in bold. Model 1 represents unadjusted P-values. Model 3 represents the P-value after adjustments for age, gender, ethnicity, BMI and moderate habitual physical activity. a P<0.05 vs PRT at baseline. PRT+ProD, progressive resistance training plus protein and vitamin D supplements; PRT, progressive resistance training.

Page | 406