Example of a German Free-Float Car-Sharing Company ...
16
resources Article Example of a German Free-Float Car-Sharing Company Expansion in East-Central Europe ÁrpádTóth and Cecília Szigeti * Kautz Gyula Faculty of Economics and Business Administration, Széchenyi István University, Egyetem Square 1, 9026 Gy˝ or, Hungary; [email protected] * Correspondence: [email protected] or [email protected] Received: 15 October 2019; Accepted: 4 November 2019; Published: 8 November 2019 Abstract: This study examines the expansion of a German free-float car-sharing company in Hungary from financial and sustainability perspectives. BMW and Daimler recently created the joint ventures ShareNow, ChargeNow, ReachNow, FreeNow, and ParkNow, which are having a significant global impact, as their services are now available in 14 different countries. We also expect further market development, since ShareNow started to operate in Hungary in May 2019. The whole EU market is just one step away from being covered by the same professional service, and the future might bring a real globally available free-float car-sharing service provider. Our review used a combination of two methodologies: financial statement-based business analysis and sustainability analysis. On the basis of this study, we concluded that these companies are primarily operated for profit and not on a sustainable operation basis. Additionally, it was also found that the current statistical data collection method does not measure precisely these activities. Financial reporting and sustainability reporting are connected, but they cover different areas. As a subject of further research, we suggest examining whether it is possible to establish a clear connection between these methodologies in the foreseeable future. Keywords: Car2Go; DriveNow; GreenGo; MOL LIMO; sustainability; economies of scale; sharing economy 1. Theoretical Background The objective of this study was to examine the performances of free-float car-sharing entities in Hungary and compare them to those of their German counterparts from financial analysis and sustainability perspectives. On the basis of actual financial results in Hungary, they appear to be less profitable businesses compared to other rental service companies. Recently, Car2Go and DriveNow created joint ventures, which generated significant competition because they entered the Hungarian market in May 2019. In Hungary, free-float car-sharing companies might follow different business models, which can cause unusual results. We also reviewed the available sustainability reports to define a possible connection to financial statements. Additionally, we tried to evaluate these companies from the sustainability perspective. 1.1. Business Model Review The free-float car-sharing business model was categorized, defined, and described in a car-sharing business model review by Deloitte [1]. Since then, other studies reviewed the model and the markets itself, for example that of Munoz and Cohen [2]. Several studies raised sustainability-related questions regarding sharing economy models. Reitmann and Lieven [3] examined how policy measures succeeded in promoting electric mobility in 20 countries by measuring the influence of monetary incentives, regulations, and charging Resources 2019, 8, 172; doi:10.3390/resources8040172 www.mdpi.com/journal/resources
-
Upload
khangminh22 -
Category
Documents
-
view
0 -
download
0
Transcript of Example of a German Free-Float Car-Sharing Company ...
resources
Article
Example of a German Free-Float Car-SharingCompany Expansion in East-Central Europe
Árpád Tóth and Cecília Szigeti *
Kautz Gyula Faculty of Economics and Business Administration, Széchenyi István University, Egyetem Square 1,9026 Gyor, Hungary; [email protected]* Correspondence: [email protected] or [email protected]
Received: 15 October 2019; Accepted: 4 November 2019; Published: 8 November 2019
Abstract: This study examines the expansion of a German free-float car-sharing company in Hungaryfrom financial and sustainability perspectives. BMW and Daimler recently created the joint venturesShareNow, ChargeNow, ReachNow, FreeNow, and ParkNow, which are having a significant globalimpact, as their services are now available in 14 different countries. We also expect further marketdevelopment, since ShareNow started to operate in Hungary in May 2019. The whole EU market isjust one step away from being covered by the same professional service, and the future might bringa real globally available free-float car-sharing service provider. Our review used a combination oftwo methodologies: financial statement-based business analysis and sustainability analysis. On thebasis of this study, we concluded that these companies are primarily operated for profit and noton a sustainable operation basis. Additionally, it was also found that the current statistical datacollection method does not measure precisely these activities. Financial reporting and sustainabilityreporting are connected, but they cover different areas. As a subject of further research, we suggestexamining whether it is possible to establish a clear connection between these methodologies in theforeseeable future.
Keywords: Car2Go; DriveNow; GreenGo; MOL LIMO; sustainability; economies of scale; sharing economy
1. Theoretical Background
The objective of this study was to examine the performances of free-float car-sharing entitiesin Hungary and compare them to those of their German counterparts from financial analysis andsustainability perspectives. On the basis of actual financial results in Hungary, they appear to be lessprofitable businesses compared to other rental service companies. Recently, Car2Go and DriveNowcreated joint ventures, which generated significant competition because they entered the Hungarianmarket in May 2019.
In Hungary, free-float car-sharing companies might follow different business models, which cancause unusual results. We also reviewed the available sustainability reports to define a possibleconnection to financial statements. Additionally, we tried to evaluate these companies from thesustainability perspective.
1.1. Business Model Review
The free-float car-sharing business model was categorized, defined, and described in a car-sharingbusiness model review by Deloitte [1]. Since then, other studies reviewed the model and the marketsitself, for example that of Munoz and Cohen [2]. Several studies raised sustainability-related questionsregarding sharing economy models.
Reitmann and Lieven [3] examined how policy measures succeeded in promoting electricmobility in 20 countries by measuring the influence of monetary incentives, regulations, and charging
Resources 2019, 8, 172; doi:10.3390/resources8040172 www.mdpi.com/journal/resources

Resources 2019, 8, 172 2 of 16
infrastructure. Hartl et al. [4] addressed the gap between business-to-consumer (B2C) and peer-to-peer(P2P) car-sharing services from the customer’s perspective. Overall, these previous studies on free-floatcar-sharing businesses support the initial assumption that these entities are profit-oriented, and theiroperations can be questioned from a sustainability perspective. From the business model perspective,in Hungary, there is a unique situation for free-float car-sharing companies, considering the impactof the international lease regulation changes. A wide range of studies, such as those of Wheeler andWebb [5] and Barone et al. [6], have provided summaries on the expected impact of lease capitalizationand its effect on profitability and leverage ratios. Giner and Pardo [7] reviewed the value relevance ofoperating lease liabilities.
1.2. Sustainability Reviews
Sustainable business model (SBM) types were introduced to describe groupings of mechanismsand solutions that may contribute to building a business model for sustainability. Examples are:Maximize material and energy efficiency; Create value from ‘waste’; Substitute with renewables andnatural processes; Deliver functionality rather than ownership; Adopt a stewardship role; Encouragesufficiency; Re-purpose the business for society/environment; and Develop scale-up solutions [8].
Geissinger et al. [9] described and classified the sustainability connotation of sharing-economyplatforms for Sweden. Indeed, sharing economy can be considered as a path towards sustainability [10].Bernardi and Diamantini [11] explored how sharing economy, adopted by an increasing number ofcities, may be integrated into the urban agenda, fostering its positive aspects (like decreased carbonemissions [12]), while avoiding its negative externalities, and focused, as examples, on Milan and Seoul.Ma et al. [13] proposed an alternative governance model to improve the effectiveness of a collaborativegovernance regime towards urban sustainability. Albinsson et al. [14] developed a two-dimensionalsharing economy matrix for sustainability reviews, which focuses on collaborative consumption usersvs. non-users in the US and Indian markets. Ma et al. [15] argued that the two-level transformations,triggered by the disruptive innovation of the sharing economy and led by urban change towardssustainability, mutually influence each other in the fast-changing urban context in Shanghai.
1.3. Sharing Economy Reviews
The emergence and rapid spread of the ‘sharing’ or ‘collaborative’ economy is one of the mostsignificant social-economic challenges of our time. The success of the concept can be traced back to theeconomic crisis. It focuses on usage and not on owning goods. The debate over the regulation of thesharing economy has become polarized between those who are radically opposed to any interventionand those who favor some form of regulation (Table 1).
Table 1. Opinions on the regulation of the sharing economy.
Point of View Authors Main Messages
All interventions are rejected [16–20]Excessive regulation eliminates consumer benefitsand efficiency gains. Using platforms reduces marketfailures.
Some regulation required [21–28]
Innovative and intelligent regulation that enforcesconsumer protection without disrupting innovation.Certain areas of the sharing economy are suitable forregulatory intervention, others for self-regulation.Co-regulation: responsibilities are shared betweengovernment and industry. A new legal framework isneeded to regulate the sharing economy, as accordingto the current legal framework many inadequatepractices in the sharing economy do not require anyregulation as they pertain to the private sphere.

Resources 2019, 8, 172 3 of 16
Table 1. Cont.
Point of View Authors Main Messages
Strict regulation required [29]
Taxation of sharing economy companies is possibleby law, although questions about law applicationmay arise. Everyone involved should be submittedto regulations (for example, in the case of car-sharingservices, licenses issued to drivers, and identificationof drivers).
Sharing economy platforms can be represented in a two-dimension matrix. The first dimension ofthe matrix classifies sharing platforms into for-profit (FP) and not-for-profit (NFP) activities. The seconddimension follows the B2C–P2P axis [30]. Car-sharing business models are for-profit, B2C sharingeconomy platforms and therefore belong to group 4. (Figure 1).
Resources 2019, 8, x FOR PEER REVIEW 3 of 17
Strict regulation required [29]
Taxation of sharing economy companies is possible by law, although questions about law application may arise. Everyone involved should be submitted to regulations (for example, in the case of car-sharing services,
licenses issued to drivers, and identification of drivers).
Sharing economy platforms can be represented in a two-dimension matrix. The first dimension of the matrix classifies sharing platforms into for-profit (FP) and not-for-profit (NFP) activities. The second dimension follows the B2C–P2P axis [30]. Car-sharing business models are for-profit, B2C sharing economy platforms and therefore belong to group 4. (Figure 1).
Figure 1. Two-dimensional sharing-economy matrix [31]. P2P: peer-to-peer, B2C: business-to-consumer, NFP: not-for-profit, FP: for-profit.
2. Materials and Methods
From the available financial and legal information, the following elements were reviewed:
• The list of entities in Hungary based on the principal operational activity code (TEÁOR) classification in the companies’ court register
• Profitability review based on published financial statements • Certain aspects of the lease accounting regulation and comparison between the International
Financial Reporting Standards (IFRS) 16 Leases and the Hungarian Accounting Law • Car-sharing companies’ fleet size, car-sharing costs, opinions of registered users in Hungary and
Germany.
Sustainability was reviewed on the basis of Penz et al. [32], exploring and explaining how, why, and when a sustainable operation is adopted and participation in the sharing economy becomes key, as well as how sharing economy models and sustainability (sustainable sharing economy, SSE) correspond conceptually in the collected articles. Seven sustainability aspects were addressed, of which four refer to car-sharing (Table 2).
Table 2. Sustainability aspects of car sharing.
Producing Less
Idle Capacity and Under-Utilized Physical Assets
“As cars stand idle 95% of the time, any sharing scheme that makes cars accessible to non-owners would reduce the number of cars required for a given mileage level.” [33]
Reduce Waste Resource Efficiency
through Using rather than Owning
“Car sharing contributes to a more efficient and rational mobility (with a lower number of vehicles per capita among members, lower demand
Figure 1. Two-dimensional sharing-economy matrix [31]. P2P: peer-to-peer, B2C: business-to-consumer,NFP: not-for-profit, FP: for-profit.
2. Materials and Methods
From the available financial and legal information, the following elements were reviewed:
• The list of entities in Hungary based on the principal operational activity code (TEÁOR)classification in the companies’ court register
• Profitability review based on published financial statements• Certain aspects of the lease accounting regulation and comparison between the International
Financial Reporting Standards (IFRS) 16 Leases and the Hungarian Accounting Law• Car-sharing companies’ fleet size, car-sharing costs, opinions of registered users in Hungary
and Germany.
Sustainability was reviewed on the basis of Penz et al. [32], exploring and explaining how,why, and when a sustainable operation is adopted and participation in the sharing economy becomeskey, as well as how sharing economy models and sustainability (sustainable sharing economy, SSE)correspond conceptually in the collected articles. Seven sustainability aspects were addressed, of whichfour refer to car-sharing (Table 2).
Resources 2019, 8, 172 4 of 16
Table 2. Sustainability aspects of car sharing.
Producing Less
Idle Capacity andUnder-Utilized Physical Assets
“As cars stand idle 95% of the time, any sharing scheme that makes cars accessible tonon-owners would reduce the number of cars required for a given mileage level.” [33]
Reduce Waste
Resource Efficiency throughUsing rather than Owning
“Car sharing contributes to a more efficient and rational mobility (with a lowernumber of vehicles per capita among members, lower demand for parking space,lower fixed costs, and a complement to public transport.” [34]
Extended Use Pattern
Low Ecological Footprint/LowCarbon
“Carbon dioxide emissions and copper usage decrease with the diffusion of car- andride-sharing services.” [35]“With a lower consumption of physical and economicresources, car-sharing can also contribute to the reduction of energy andenvironmental impacts” Baptista et al. [34]
Own Less, Interact More,Build Social Capital Different studies document the high impact of car-sharing on car ownership. [36]
3. Results and Discussion
3.1. Free-Float Car-Sharing Business Models in Hungary and Germany
Specific free-float service providers are defined as companies offering the service of car-sharing,i.e., the use of vehicles that can be rented and parked freely throughout the entire business area withouthaving to determine the start and the end of the rental period in advance. The beginning and end ofthe rent are established for all vehicles through a specific smartphone application. Payment is basedon usage and according to a fixed minute rate.
Comparing this market to the sharing economy review models, according to Codagnone andMartens [30] (Figure 1), free-float car-sharing entities are B2C entities focused on profitable operation,and this requires strict regulation (Table 1). This business model represents a different resourceutilization with respect to P2P-based common sharing, which motivated us to perform a parallelprofitability and sustainability review.
To accurately identify all key free-float companies, the complete database of the firm registry wasreviewed, considering the defined principal operational activity of each company. This classification(TEÁOR’08) is “identical and fully harmonized with the European one, NACE Rev.2. StatisticalClassification of Economic Activities in the European Community, 2008 (Nomenclature des activitéséconomiques dans les Communautés européennes) [37]. Based on Regulation 1893/2006/EC, with effectfrom 1 January 2008, TEÁOR’08 is used to determine the principal activities of enterprises, in thecalculation of economic and social indicators as well as for the publication of statistical data.”The car-sharing activities are classified under Section “N” as administrative and support serviceactivities, in division 77, group 77.1, and class 77.11 “renting and leasing of cars and light motor vehicles”.From the registered Hungarian companies’ database, 362 companies were identified. This analysiscovers all Hungarian operational entities. In order to include recently established objects, all companiesabove 10 staff headcounts were investigated, according to the EU commission-defined categories.On the basis of a detailed review, 28 companies were identified, as presented in Appendix A (Figure A1).
According to the Hungarian Accounting Regulation Act C of 2000, in Hungary [38], companiesneed to file a financial statement by the end of the fifth month after the fiscal year. Consequently,the latest reports available were for 2017.
From Appendix A, on the basis of their financial statements, as of April 2019, only 2 companiesout of the total 28 entities, i.e., #11 GreenGo Car Europe Korlátolt Felelosségu Társaság (hereinafter:GreenGo) and #20 MOL Limitless Mobility Korlátolt Felelosségu Társaság (hereinafter: MOL LIMO),were real flee-float car-sharing companies, and both operate in Budapest. This list contained allfree-float service providers but did not represent the total lease market, because financial leaseactivities are classified in a different statistical segment, in section K Financial and insurance activities,

Resources 2019, 8, 172 5 of 16
divisions 64–66. It did, however, represent all non-micro-level free-float car-sharing companies. This isthe consequence of the unclear current statistical data, which do not identify specific lease, rental,or free-float services. In the case of a larger population, it would be challenging to sort out suchcompanies manually; sub-sections could be created to evaluate lease and rental services accuratelyin the statistical classification. In 2017 for Hungary, free-float car-sharing represented a 110.7 millionHungarian forint (HUF) (€358,300) market.
In the analyzed group from the profitability perspective, it was visible that the free-float car-sharingservice providers delivered significantly worse results in Hungary compared to lease and rental servicecompanies in 2017, as shown in Figure 2.
Resources 2019, 8, x FOR PEER REVIEW 5 of 17
the statistical classification. In 2017 for Hungary, free-float car-sharing represented a 110.7 million Hungarian forint (HUF) (€358,300) market.
In the analyzed group from the profitability perspective, it was visible that the free-float car-sharing service providers delivered significantly worse results in Hungary compared to lease and rental service companies in 2017, as shown in Figure 2.
Figure 2. Changes in asset structure, GreenGo (2014–2017 in EUR) [39].
To gain a better understanding of the situation, each Hungarian free-float service was separately examined and later compared to German service providers.
3.1.1. Financial Statement Analysis and Review of the Financing Model
GreenGo was established in 2014 as the first free-float car-sharing service in the Hungarian market, where it was the only market participant until 2017. The first day of real operation, when the company started to provide services, was in November 2016, with 45 electric cars.
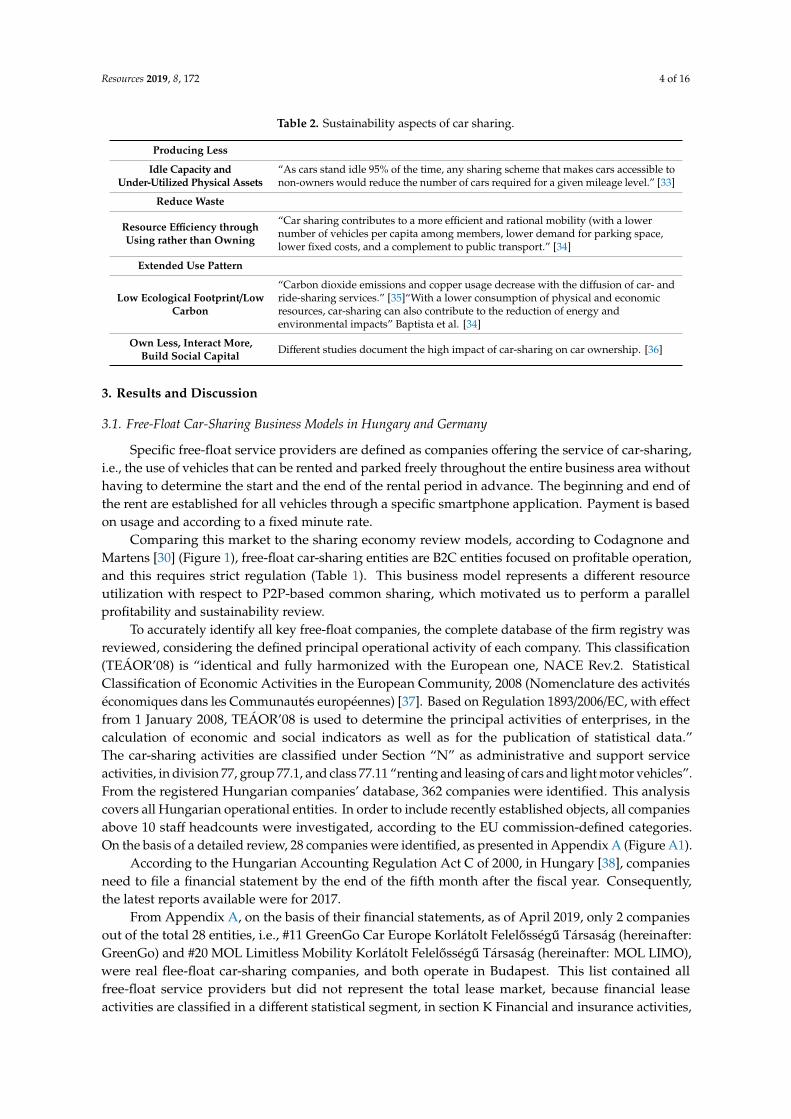
From the financial perspective, the assets and liabilities of the company looked as follows. Assets: The long-term assets value continuously increased from HUF 69 M in 2019 to HUF 102 M on 2017, which consists of intangible assets of HUF 43 M, tangible assets of HUF 58 M, and other investments of HUF 1 M. This breakdown would give the reader important information if we included the published data from January 2018 when GreenGo reported 168 vehicles, which in case of purchase, should be recorded as property, plant, and equipment (PPE). It appears that HUF 58 M/168 vehicles = HUF 0.34 M (approx. €1060) per car is a very unreasonable figure. The only reasonable explanation is if the company applied operational leases, and these assets are off-balance-sheet financed items. Later in this review, this business model will be compared to that of the other Hungarian competitor. Below in Figure 3. is a summary table related to the asset items for the period 2014–2017:
-220.00% -180.00% -140.00% -100.00% -60.00% -20.00% 20.00%
Car fleet provider
Car rental
Free-float car share
Lease
Car fleet provider Car rentalFree-float car
shareLease
Average Profit before tax / revenue 3.32% 4.10% -205.65% 6.98%
Figure 2. Changes in asset structure, GreenGo (2014–2017 in EUR) [39].
To gain a better understanding of the situation, each Hungarian free-float service was separatelyexamined and later compared to German service providers.
3.1.1. Financial Statement Analysis and Review of the Financing Model
GreenGo was established in 2014 as the first free-float car-sharing service in the Hungarian market,where it was the only market participant until 2017. The first day of real operation, when the companystarted to provide services, was in November 2016, with 45 electric cars.
From the financial perspective, the assets and liabilities of the company looked as follows. Assets:The long-term assets value continuously increased from HUF 69 M in 2019 to HUF 102 M on 2017,which consists of intangible assets of HUF 43 M, tangible assets of HUF 58 M, and other investments ofHUF 1 M. This breakdown would give the reader important information if we included the publisheddata from January 2018 when GreenGo reported 168 vehicles, which in case of purchase, should berecorded as property, plant, and equipment (PPE). It appears that HUF 58 M/168 vehicles = HUF 0.34 M(approx. €1060) per car is a very unreasonable figure. The only reasonable explanation is if the companyapplied operational leases, and these assets are off-balance-sheet financed items. Later in this review,this business model will be compared to that of the other Hungarian competitor. Below in Figure 3 isa summary table related to the asset items for the period 2014–2017:
Resources 2019, 8, 172 6 of 16
Resources 2019, 8, x FOR PEER REVIEW 6 of 17
Figure 3. Changes in asset structure, GreenGo (2014–2017 in EUR) [39].
Liabilities, equity: The equity value remained relatively the same over 2016–2017, i.e., HUF 43 M; however, the generated loss increased significantly from HUF 18 M (€59,000) to HUF 158 M (€512,600), which was compensated by the equity contribution from owners. The debt/equity ratio also significantly increased in relation to the liabilities increase by HUF 129.3 M, mainly as a result of the short-term shareholders’ loans of HUF 115 M and the long-term related parties’ credit of HUF 16 M. Profit and loss statement: The realized revenue increased from the 2016 value of HUF 8 M (€26,000) to the 2017 value of HUF 111 M (€358,000), while the expenses increased from HUF 27 M to HUF 275 M. This was the principal reason for the generated loss as the company did not realize enough revenue to compensate for the increased material expenditures. Below in Figure 4 is a summary of the statement of profit and loss of GreenGo for the period of 2014–2017.
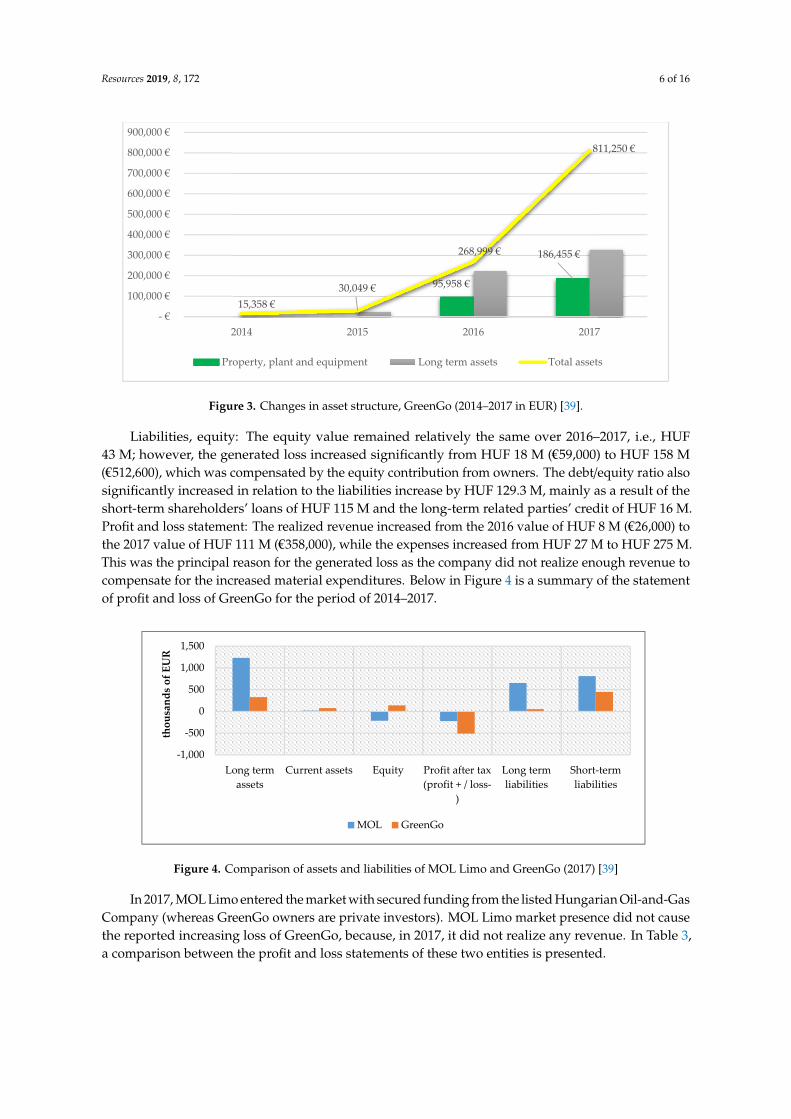
Figure 4. Comparison of assets and liabilities of MOL Limo and GreenGo (2017) [39]
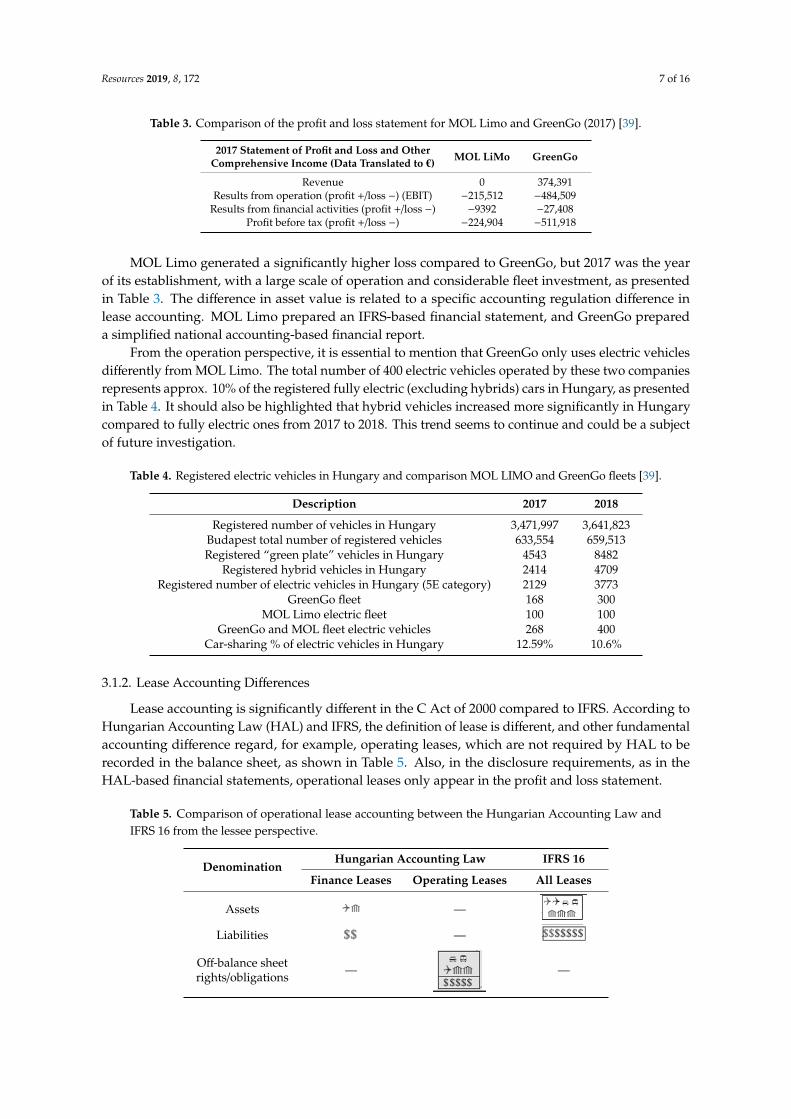
In 2017, MOL Limo entered the market with secured funding from the listed Hungarian Oil-and-Gas Company (whereas GreenGo owners are private investors). MOL Limo market presence did not cause the reported increasing loss of GreenGo, because, in 2017, it did not realize any revenue. In Table 3, a comparison between the profit and loss statements of these two entities is presented.
Table 3. Comparison of the profit and loss statement for MOL Limo and GreenGo (2017) [39].
2017 Statement of Profit and Loss and Other Comprehensive Income (Data Translated to €)
MOL LiMo GreenGo
Revenue 0 374,391 Results from operation (profit +/loss −) (EBIT) −215,512 −484,509
95,958 €
186,455 €
15,358 €30,049 €
268,999 €
811,250 €
- €
100,000 €
200,000 €
300,000 €
400,000 €
500,000 €
600,000 €
700,000 €
800,000 €
900,000 €
2014 2015 2016 2017
Property, plant and equipment Long term assets Total assets
-1,000
-500
0
500
1,000
1,500
Long termassets
Current assets Equity Profit after tax(profit + / loss-
)
Long termliabilities
Short-termliabilities
thou
sand
s of
EU
R
MOL GreenGo
Figure 3. Changes in asset structure, GreenGo (2014–2017 in EUR) [39].
Liabilities, equity: The equity value remained relatively the same over 2016–2017, i.e., HUF43 M; however, the generated loss increased significantly from HUF 18 M (€59,000) to HUF 158 M(€512,600), which was compensated by the equity contribution from owners. The debt/equity ratio alsosignificantly increased in relation to the liabilities increase by HUF 129.3 M, mainly as a result of theshort-term shareholders’ loans of HUF 115 M and the long-term related parties’ credit of HUF 16 M.Profit and loss statement: The realized revenue increased from the 2016 value of HUF 8 M (€26,000) tothe 2017 value of HUF 111 M (€358,000), while the expenses increased from HUF 27 M to HUF 275 M.This was the principal reason for the generated loss as the company did not realize enough revenue tocompensate for the increased material expenditures. Below in Figure 4 is a summary of the statementof profit and loss of GreenGo for the period of 2014–2017.
Resources 2019, 8, x FOR PEER REVIEW 6 of 17
Figure 3. Changes in asset structure, GreenGo (2014–2017 in EUR) [39].
Liabilities, equity: The equity value remained relatively the same over 2016–2017, i.e., HUF 43 M; however, the generated loss increased significantly from HUF 18 M (€59,000) to HUF 158 M (€512,600), which was compensated by the equity contribution from owners. The debt/equity ratio also significantly increased in relation to the liabilities increase by HUF 129.3 M, mainly as a result of the short-term shareholders’ loans of HUF 115 M and the long-term related parties’ credit of HUF 16 M. Profit and loss statement: The realized revenue increased from the 2016 value of HUF 8 M (€26,000) to the 2017 value of HUF 111 M (€358,000), while the expenses increased from HUF 27 M to HUF 275 M. This was the principal reason for the generated loss as the company did not realize enough revenue to compensate for the increased material expenditures. Below in Figure 4 is a summary of the statement of profit and loss of GreenGo for the period of 2014–2017.
Figure 4. Comparison of assets and liabilities of MOL Limo and GreenGo (2017) [39]
In 2017, MOL Limo entered the market with secured funding from the listed Hungarian Oil-and-Gas Company (whereas GreenGo owners are private investors). MOL Limo market presence did not cause the reported increasing loss of GreenGo, because, in 2017, it did not realize any revenue. In Table 3, a comparison between the profit and loss statements of these two entities is presented.
Table 3. Comparison of the profit and loss statement for MOL Limo and GreenGo (2017) [39].
2017 Statement of Profit and Loss and Other Comprehensive Income (Data Translated to €)
MOL LiMo GreenGo
Revenue 0 374,391 Results from operation (profit +/loss −) (EBIT) −215,512 −484,509
95,958 €
186,455 €
15,358 €30,049 €
268,999 €
811,250 €
- €
100,000 €
200,000 €
300,000 €
400,000 €
500,000 €
600,000 €
700,000 €
800,000 €
900,000 €
2014 2015 2016 2017
Property, plant and equipment Long term assets Total assets
-1,000
-500
0
500
1,000
1,500
Long termassets
Current assets Equity Profit after tax(profit + / loss-
)
Long termliabilities
Short-termliabilities
thou
sand
s of
EU
R
MOL GreenGo
Figure 4. Comparison of assets and liabilities of MOL Limo and GreenGo (2017) [39]
In 2017, MOL Limo entered the market with secured funding from the listed Hungarian Oil-and-GasCompany (whereas GreenGo owners are private investors). MOL Limo market presence did not causethe reported increasing loss of GreenGo, because, in 2017, it did not realize any revenue. In Table 3,a comparison between the profit and loss statements of these two entities is presented.
Resources 2019, 8, 172 7 of 16
Table 3. Comparison of the profit and loss statement for MOL Limo and GreenGo (2017) [39].
2017 Statement of Profit and Loss and OtherComprehensive Income (Data Translated to €) MOL LiMo GreenGo
Revenue 0 374,391Results from operation (profit +/loss −) (EBIT) −215,512 −484,509
Results from financial activities (profit +/loss −) −9392 −27,408Profit before tax (profit +/loss −) −224,904 −511,918
MOL Limo generated a significantly higher loss compared to GreenGo, but 2017 was the yearof its establishment, with a large scale of operation and considerable fleet investment, as presentedin Table 3. The difference in asset value is related to a specific accounting regulation difference inlease accounting. MOL Limo prepared an IFRS-based financial statement, and GreenGo prepareda simplified national accounting-based financial report.
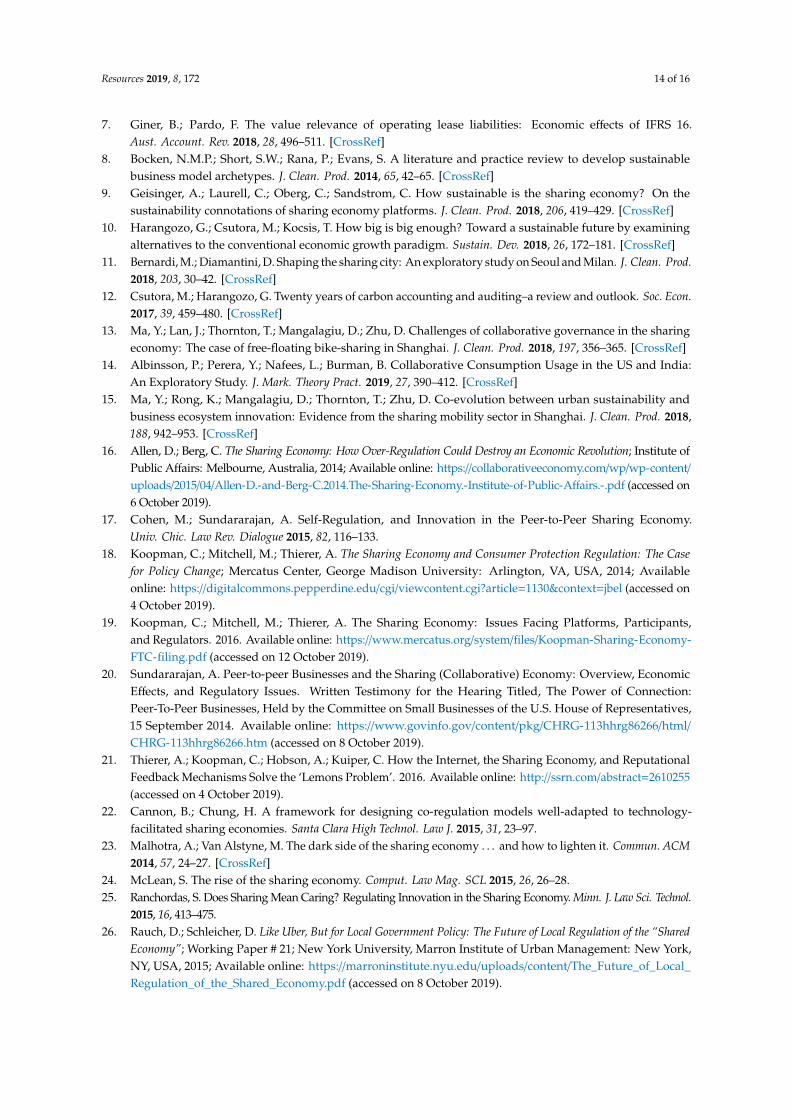
From the operation perspective, it is essential to mention that GreenGo only uses electric vehiclesdifferently from MOL Limo. The total number of 400 electric vehicles operated by these two companiesrepresents approx. 10% of the registered fully electric (excluding hybrids) cars in Hungary, as presentedin Table 4. It should also be highlighted that hybrid vehicles increased more significantly in Hungarycompared to fully electric ones from 2017 to 2018. This trend seems to continue and could be a subjectof future investigation.
Table 4. Registered electric vehicles in Hungary and comparison MOL LIMO and GreenGo fleets [39].
Description 2017 2018
Registered number of vehicles in Hungary 3,471,997 3,641,823Budapest total number of registered vehicles 633,554 659,513Registered “green plate” vehicles in Hungary 4543 8482
Registered hybrid vehicles in Hungary 2414 4709Registered number of electric vehicles in Hungary (5E category) 2129 3773
GreenGo fleet 168 300MOL Limo electric fleet 100 100
GreenGo and MOL fleet electric vehicles 268 400Car-sharing % of electric vehicles in Hungary 12.59% 10.6%
3.1.2. Lease Accounting Differences
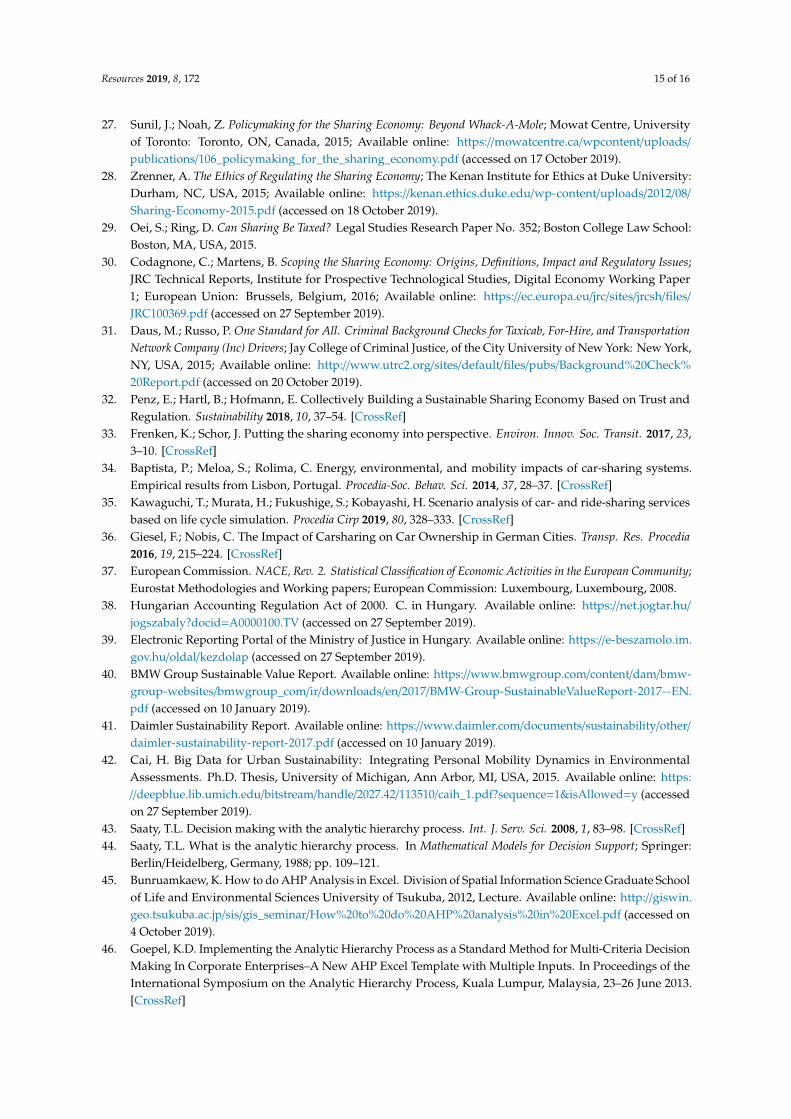
Lease accounting is significantly different in the C Act of 2000 compared to IFRS. According toHungarian Accounting Law (HAL) and IFRS, the definition of lease is different, and other fundamentalaccounting difference regard, for example, operating leases, which are not required by HAL to berecorded in the balance sheet, as shown in Table 5. Also, in the disclosure requirements, as in theHAL-based financial statements, operational leases only appear in the profit and loss statement.
Table 5. Comparison of operational lease accounting between the Hungarian Accounting Law andIFRS 16 from the lessee perspective.
DenominationHungarian Accounting Law IFRS 16
Finance Leases Operating Leases All Leases
Assets
Resources 2019, 8, x FOR PEER REVIEW 7 of 17
Results from financial activities (profit +/loss −) −9392 −27,408 Profit before tax (profit +/loss −) −224,904 −511,918
MOL Limo generated a significantly higher loss compared to GreenGo, but 2017 was the year of its establishment, with a large scale of operation and considerable fleet investment, as presented in Table 3. The difference in asset value is related to a specific accounting regulation difference in lease accounting. MOL Limo prepared an IFRS-based financial statement, and GreenGo prepared a simplified national accounting-based financial report.
From the operation perspective, it is essential to mention that GreenGo only uses electric vehicles differently from MOL Limo. The total number of 400 electric vehicles operated by these two companies represents approx. 10% of the registered fully electric (excluding hybrids) cars in Hungary, as presented in Table 4. It should also be highlighted that hybrid vehicles increased more significantly in Hungary compared to fully electric ones from 2017 to 2018. This trend seems to continue and could be a subject of future investigation.
Table 4. Registered electric vehicles in Hungary and comparison MOL LIMO and GreenGo fleets [39].
Description 2017 2018 Registered number of vehicles in Hungary 3,471,997 3,641,823
Budapest total number of registered vehicles 633,554 659,513 Registered “green plate” vehicles in Hungary 4543 8482
Registered hybrid vehicles in Hungary 2414 4709 Registered number of electric vehicles in Hungary (5E category) 2129 3773
GreenGo fleet 168 300 MOL Limo electric fleet 100 100
GreenGo and MOL fleet electric vehicles 268 400 Car-sharing % of electric vehicles in Hungary 12.59% 10.6%
3.1.2. Lease Accounting Differences
Lease accounting is significantly different in the C Act of 2000 compared to IFRS. According to Hungarian Accounting Law (HAL) and IFRS, the definition of lease is different, and other fundamental accounting difference regard, for example, operating leases, which are not required by HAL to be recorded in the balance sheet, as shown in Table 5. Also, in the disclosure requirements, as in the HAL-based financial statements, operational leases only appear in the profit and loss statement.
Table 5. Comparison of operational lease accounting between the Hungarian Accounting Law and IFRS 16 from the lessee perspective.
Denomination Hungarian Accounting Law IFRS 16
Finance Leases Operating Leases All Leases
Assets --- Liabilities ---
Off-balance sheet rights/obligations ---
---
IFRS 16 key objective was to record the operational lease committed rights (rights of use, ROU) as assets and committed liabilities to reduce the off-balance sheet items. For the entities reporting under HAL regulation, this is not a requirement, and in case of an independent financial analysis or a credit strength testing, they can be invisible. The recorded off-balance sheet value can be significant from a creditor’s or financial analysis’ point of view. GreenGo reported under HAL regulation, where the operational leases as off-balance sheet items might create a business advantage from the
—
Resources 2019, 8, x FOR PEER REVIEW 7 of 17
Results from financial activities (profit +/loss −) −9392 −27,408 Profit before tax (profit +/loss −) −224,904 −511,918
MOL Limo generated a significantly higher loss compared to GreenGo, but 2017 was the year of its establishment, with a large scale of operation and considerable fleet investment, as presented in Table 3. The difference in asset value is related to a specific accounting regulation difference in lease accounting. MOL Limo prepared an IFRS-based financial statement, and GreenGo prepared a simplified national accounting-based financial report.
From the operation perspective, it is essential to mention that GreenGo only uses electric vehicles differently from MOL Limo. The total number of 400 electric vehicles operated by these two companies represents approx. 10% of the registered fully electric (excluding hybrids) cars in Hungary, as presented in Table 4. It should also be highlighted that hybrid vehicles increased more significantly in Hungary compared to fully electric ones from 2017 to 2018. This trend seems to continue and could be a subject of future investigation.
Table 4. Registered electric vehicles in Hungary and comparison MOL LIMO and GreenGo fleets [39].
Description 2017 2018 Registered number of vehicles in Hungary 3,471,997 3,641,823
Budapest total number of registered vehicles 633,554 659,513 Registered “green plate” vehicles in Hungary 4543 8482
Registered hybrid vehicles in Hungary 2414 4709 Registered number of electric vehicles in Hungary (5E category) 2129 3773
GreenGo fleet 168 300 MOL Limo electric fleet 100 100
GreenGo and MOL fleet electric vehicles 268 400 Car-sharing % of electric vehicles in Hungary 12.59% 10.6%
3.1.2. Lease Accounting Differences
Lease accounting is significantly different in the C Act of 2000 compared to IFRS. According to Hungarian Accounting Law (HAL) and IFRS, the definition of lease is different, and other fundamental accounting difference regard, for example, operating leases, which are not required by HAL to be recorded in the balance sheet, as shown in Table 5. Also, in the disclosure requirements, as in the HAL-based financial statements, operational leases only appear in the profit and loss statement.
Table 5. Comparison of operational lease accounting between the Hungarian Accounting Law and IFRS 16 from the lessee perspective.
Denomination Hungarian Accounting Law IFRS 16
Finance Leases Operating Leases All Leases
Assets --- Liabilities ---
Off-balance sheet rights/obligations ---
---
IFRS 16 key objective was to record the operational lease committed rights (rights of use, ROU) as assets and committed liabilities to reduce the off-balance sheet items. For the entities reporting under HAL regulation, this is not a requirement, and in case of an independent financial analysis or a credit strength testing, they can be invisible. The recorded off-balance sheet value can be significant from a creditor’s or financial analysis’ point of view. GreenGo reported under HAL regulation, where the operational leases as off-balance sheet items might create a business advantage from the
Liabilities
Resources 2019, 8, x FOR PEER REVIEW 7 of 17
Results from financial activities (profit +/loss −) −9392 −27,408 Profit before tax (profit +/loss −) −224,904 −511,918
MOL Limo generated a significantly higher loss compared to GreenGo, but 2017 was the year of its establishment, with a large scale of operation and considerable fleet investment, as presented in Table 3. The difference in asset value is related to a specific accounting regulation difference in lease accounting. MOL Limo prepared an IFRS-based financial statement, and GreenGo prepared a simplified national accounting-based financial report.
From the operation perspective, it is essential to mention that GreenGo only uses electric vehicles differently from MOL Limo. The total number of 400 electric vehicles operated by these two companies represents approx. 10% of the registered fully electric (excluding hybrids) cars in Hungary, as presented in Table 4. It should also be highlighted that hybrid vehicles increased more significantly in Hungary compared to fully electric ones from 2017 to 2018. This trend seems to continue and could be a subject of future investigation.
Table 4. Registered electric vehicles in Hungary and comparison MOL LIMO and GreenGo fleets [39].
Description 2017 2018 Registered number of vehicles in Hungary 3,471,997 3,641,823
Budapest total number of registered vehicles 633,554 659,513 Registered “green plate” vehicles in Hungary 4543 8482
Registered hybrid vehicles in Hungary 2414 4709 Registered number of electric vehicles in Hungary (5E category) 2129 3773
GreenGo fleet 168 300 MOL Limo electric fleet 100 100
GreenGo and MOL fleet electric vehicles 268 400 Car-sharing % of electric vehicles in Hungary 12.59% 10.6%
3.1.2. Lease Accounting Differences
Lease accounting is significantly different in the C Act of 2000 compared to IFRS. According to Hungarian Accounting Law (HAL) and IFRS, the definition of lease is different, and other fundamental accounting difference regard, for example, operating leases, which are not required by HAL to be recorded in the balance sheet, as shown in Table 5. Also, in the disclosure requirements, as in the HAL-based financial statements, operational leases only appear in the profit and loss statement.
Table 5. Comparison of operational lease accounting between the Hungarian Accounting Law and IFRS 16 from the lessee perspective.
Denomination Hungarian Accounting Law IFRS 16
Finance Leases Operating Leases All Leases
Assets --- Liabilities ---
Off-balance sheet rights/obligations ---
---
IFRS 16 key objective was to record the operational lease committed rights (rights of use, ROU) as assets and committed liabilities to reduce the off-balance sheet items. For the entities reporting under HAL regulation, this is not a requirement, and in case of an independent financial analysis or a credit strength testing, they can be invisible. The recorded off-balance sheet value can be significant from a creditor’s or financial analysis’ point of view. GreenGo reported under HAL regulation, where the operational leases as off-balance sheet items might create a business advantage from the
—
Resources 2019, 8, x FOR PEER REVIEW 7 of 17
Results from financial activities (profit +/loss −) −9392 −27,408 Profit before tax (profit +/loss −) −224,904 −511,918
MOL Limo generated a significantly higher loss compared to GreenGo, but 2017 was the year of its establishment, with a large scale of operation and considerable fleet investment, as presented in Table 3. The difference in asset value is related to a specific accounting regulation difference in lease accounting. MOL Limo prepared an IFRS-based financial statement, and GreenGo prepared a simplified national accounting-based financial report.
From the operation perspective, it is essential to mention that GreenGo only uses electric vehicles differently from MOL Limo. The total number of 400 electric vehicles operated by these two companies represents approx. 10% of the registered fully electric (excluding hybrids) cars in Hungary, as presented in Table 4. It should also be highlighted that hybrid vehicles increased more significantly in Hungary compared to fully electric ones from 2017 to 2018. This trend seems to continue and could be a subject of future investigation.
Table 4. Registered electric vehicles in Hungary and comparison MOL LIMO and GreenGo fleets [39].
Description 2017 2018 Registered number of vehicles in Hungary 3,471,997 3,641,823
Budapest total number of registered vehicles 633,554 659,513 Registered “green plate” vehicles in Hungary 4543 8482
Registered hybrid vehicles in Hungary 2414 4709 Registered number of electric vehicles in Hungary (5E category) 2129 3773
GreenGo fleet 168 300 MOL Limo electric fleet 100 100
GreenGo and MOL fleet electric vehicles 268 400 Car-sharing % of electric vehicles in Hungary 12.59% 10.6%
3.1.2. Lease Accounting Differences
Lease accounting is significantly different in the C Act of 2000 compared to IFRS. According to Hungarian Accounting Law (HAL) and IFRS, the definition of lease is different, and other fundamental accounting difference regard, for example, operating leases, which are not required by HAL to be recorded in the balance sheet, as shown in Table 5. Also, in the disclosure requirements, as in the HAL-based financial statements, operational leases only appear in the profit and loss statement.
Table 5. Comparison of operational lease accounting between the Hungarian Accounting Law and IFRS 16 from the lessee perspective.
Denomination Hungarian Accounting Law IFRS 16
Finance Leases Operating Leases All Leases
Assets --- Liabilities ---
Off-balance sheet rights/obligations ---
---
IFRS 16 key objective was to record the operational lease committed rights (rights of use, ROU) as assets and committed liabilities to reduce the off-balance sheet items. For the entities reporting under HAL regulation, this is not a requirement, and in case of an independent financial analysis or a credit strength testing, they can be invisible. The recorded off-balance sheet value can be significant from a creditor’s or financial analysis’ point of view. GreenGo reported under HAL regulation, where the operational leases as off-balance sheet items might create a business advantage from the
Off-balance sheetrights/obligations —
Resources 2019, 8, x FOR PEER REVIEW 7 of 17
Results from financial activities (profit +/loss −) −9392 −27,408 Profit before tax (profit +/loss −) −224,904 −511,918
MOL Limo generated a significantly higher loss compared to GreenGo, but 2017 was the year of its establishment, with a large scale of operation and considerable fleet investment, as presented in Table 3. The difference in asset value is related to a specific accounting regulation difference in lease accounting. MOL Limo prepared an IFRS-based financial statement, and GreenGo prepared a simplified national accounting-based financial report.
From the operation perspective, it is essential to mention that GreenGo only uses electric vehicles differently from MOL Limo. The total number of 400 electric vehicles operated by these two companies represents approx. 10% of the registered fully electric (excluding hybrids) cars in Hungary, as presented in Table 4. It should also be highlighted that hybrid vehicles increased more significantly in Hungary compared to fully electric ones from 2017 to 2018. This trend seems to continue and could be a subject of future investigation.
Table 4. Registered electric vehicles in Hungary and comparison MOL LIMO and GreenGo fleets [39].
Description 2017 2018 Registered number of vehicles in Hungary 3,471,997 3,641,823
Budapest total number of registered vehicles 633,554 659,513 Registered “green plate” vehicles in Hungary 4543 8482
Registered hybrid vehicles in Hungary 2414 4709 Registered number of electric vehicles in Hungary (5E category) 2129 3773
GreenGo fleet 168 300 MOL Limo electric fleet 100 100
GreenGo and MOL fleet electric vehicles 268 400 Car-sharing % of electric vehicles in Hungary 12.59% 10.6%
3.1.2. Lease Accounting Differences
Lease accounting is significantly different in the C Act of 2000 compared to IFRS. According to Hungarian Accounting Law (HAL) and IFRS, the definition of lease is different, and other fundamental accounting difference regard, for example, operating leases, which are not required by HAL to be recorded in the balance sheet, as shown in Table 5. Also, in the disclosure requirements, as in the HAL-based financial statements, operational leases only appear in the profit and loss statement.
Table 5. Comparison of operational lease accounting between the Hungarian Accounting Law and IFRS 16 from the lessee perspective.
Denomination Hungarian Accounting Law IFRS 16
Finance Leases Operating Leases All Leases
Assets --- Liabilities ---
Off-balance sheet rights/obligations ---
---
IFRS 16 key objective was to record the operational lease committed rights (rights of use, ROU) as assets and committed liabilities to reduce the off-balance sheet items. For the entities reporting under HAL regulation, this is not a requirement, and in case of an independent financial analysis or a credit strength testing, they can be invisible. The recorded off-balance sheet value can be significant from a creditor’s or financial analysis’ point of view. GreenGo reported under HAL regulation, where the operational leases as off-balance sheet items might create a business advantage from the
—

Resources 2019, 8, 172 8 of 16
IFRS 16 key objective was to record the operational lease committed rights (rights of use, ROU) asassets and committed liabilities to reduce the off-balance sheet items. For the entities reporting under HALregulation, this is not a requirement, and in case of an independent financial analysis or a credit strengthtesting, they can be invisible. The recorded off-balance sheet value can be significant from a creditor’s orfinancial analysis’ point of view. GreenGo reported under HAL regulation, where the operational leases asoff-balance sheet items might create a business advantage from the presentation perspective because theleverage ratio does not show the total minimum of liabilities from the lease obligations.
3.1.3. Comparison to German Entities
Germany has the most significant car-sharing market in Europe, with several service providersand over 30,000 registered users, as summarized below in Table 6 in comparison to Hungary.
Table 6. Comparison of German and Hungarian entities’ published users, fleet size, and serviced cities.
Provider’s Name Registered Users Fleet Size Service Available in theNumber of Cities
Free-float car share providers in GermanyShare Now (car2go and DriveNow) 3,000,000+ 20,000+ out of 3200+ electric 31
Flinkster (DB) 315,000 4000 300Cambio 77,000 1600 22
Stadtmobil 63,000 2600 100Book N Drive 43,000 1015 14
teilAuto 35,000 1000 19Free-float car share providers in Hungary
GreenGo (HUN) 30–40,000 300 electric 1MOL LIMO (HUN) 40,000 100 electric350 petrol 1
From this table, it can be concluded that German free-float car-sharing companies operatesignificantly larger fleets and have a substantially larger number of registered users in absolute terms.Hungarian companies operate only in one city, namely, Budapest, with a total of 750 vehicles fora 525 km2 city area, where the population is approx. 1.75 M. In contrast, only one company, ShareNow,operates approx. 4000 cars in Berlin for an 891 km2 city area with a 3.6 M population. For additionalcomparison, in the capital city in the region with the most similar population, Vienna, only ShareNowoperates, with 2000+ vehicles for a 1.8 M population and a 415 km2 city area.
The service fees can also be compared, because in April 2019, ShareNow announced to extend theoperation in Budapest as well, with approx. 240 vehicles (of which, 40 electric BMW i3). Table 7 showsthe fee and car type comparison.
Table 7. Comparison of free-float service costs between ShareNow, MOL Limo, and GreenGo (2019) [39–41].
Provider’s Name Service Fee Car Type Additional Conditions
ShareNow (BMW and Daimler) from 99 HUF/min (0.32 cent/min) Mini, BMW 38.7 €/hGreenGo from 65 HUF/min (0.21 cent/min) VW Up
MOL LIMO from 66 HUF/min (0.21 cent/mind) VW Up, Mercedes A class
ShareNow provides services across the EU and, in 2019, established the most significant Europeanfleet; additionally, it published a plan to invest further €1 billion. With 20,000+ vehicles, joint companiesoperate in 24 countries globally. It is only a matter of time to utilize the economies-of-scale advantage andprovide service in all European countries. A coverage map for Car2Go and DriveNow is shown in Figure 5.
From the operation and financial analysis perspectives, an apparent market concentration is happeningnow in Europe, which is a successful business model. Without doubts, it supports sustainability; however,there is no core sustainability element in this business model. The more effective utilization of the resourceshas an impact on sustainability, but it is based on a usual corporate profit model.

Resources 2019, 8, 172 9 of 16
Resources 2019, 8, x FOR PEER REVIEW 9 of 17
Figure 5. Car2Go and DriveNow joint coverage.
From the operation and financial analysis perspectives, an apparent market concentration is happening now in Europe, which is a successful business model. Without doubts, it supports sustainability; however, there is no core sustainability element in this business model. The more effective utilization of the resources has an impact on sustainability, but it is based on a usual corporate profit model.
3.2. Sustainability
From the sustainability perspective (Table 2), three statements (out of a total of seven) appeared in the official communications of the reviewed companies, presented in Table 8.
Table 8. Sustainability-related aspects of car-sharing [32,39–41].
Sustainability-Related Aspects of
Car-Sharing GreenGo MOL Limo BMW
DriveNow Daimler Car2Go
Resource efficiency through using
rather than owning
There is less of an emphasis on parking infrastructure and
road expansion
Digital parking service Park
Now
The smart ForTwo can fit in almost any parking
spot and can maneuver around even the most
intense downtown rush hour traffic jams.
Low ecological footprint/low
carbon
300 electric * cars
The VW MOL Limo fleet is 450-strong
(100 electrical and 350 gas-
powered vehicles)
900 Electric vehicles in
Europe, 1300 in the USA
Shared cars are smaller than those in the average
household.
Own less, interact more, build social
capital
Digital networking
Over 50% of Car2Go members do not own a
car.
Figure 5. Car2Go and DriveNow joint coverage.
3.2. Sustainability
From the sustainability perspective (Table 2), three statements (out of a total of seven) appeared inthe official communications of the reviewed companies, presented in Table 8.
Table 8. Sustainability-related aspects of car-sharing [32,39–41].
Sustainability-RelatedAspects of Car-Sharing GreenGo MOL Limo BMW DriveNow Daimler Car2Go
Resource efficiencythrough using rather
than owning
There is less of an emphasis on parkinginfrastructure and road expansion
Digital parkingservice Park Now
The smart ForTwo can fitin almost any parking spotand can maneuver around
even the most intensedowntown rush hour
traffic jams.
Low ecologicalfootprint/low carbon
300 electric * cars
The VW MOL Limo fleetis 450-strong (100electrical and 350
gas-powered vehicles)
900 Electricvehicles in Europe,
1300 in the USA
Shared cars are smaller than those in theaverage household.
Own less, interact more,build social capital Digital networking Over 50% of Car2Go
members do not own a car.
* Electric cars have two main advantages: unlike gasoline, electricity can be generated from various sources includingrenewable ones, and electric vehicles can reduce urban air pollution from road transportation. “However, whileelectric cars can reduce gasoline use, they increase electricity consumption. Depending on how the electricity isgenerated, emissions of particular air pollutants may reduce or increase” [42]. In Appendix B (Table A1), we list thevital sustainability-related statements from car2go and DriveNow sustainability reports; the reviewed sustainabilityreports are all related to Corporate Social Responsibility (CSR) orientation.
3.3. Analytic Hierarchy Process
To resolve the lack of reconciliation between financial and sustainability reporting, potentialdecision-support models, such as the analytic hierarchy process model, can be utilized to present theconnection between the different reporting systems. It is crucial to determine the factors and to applyproper weights for the specific items. To measure impacts, the method of the analytic hierarchy process(AHP) was used, where the weights of the factors were identified in order from the most to the leastsignificant from the investor decision’s perspective.
When constructing the decision-making environment, it is crucial to identify issues or attributesthat may be helpful [43,44], which brings the disharmony of traditional financial performance measuring

Resources 2019, 8, 172 10 of 16
attributes and sustainability aspects into perspective. The AHP theory aims to find the preferablealternative by weighing the priorities of the involved factors on a 1–9 scale (1: equal importance,9: higher importance with respect to another component) and carrying out pairwise comparisons andstandardization of the results to validate the overall ranking of factors [43,44]. Considering the findingsof the current study, six elements were selected and weighed (w), as shown in Figure 6.
Resources 2019, 8, x FOR PEER REVIEW 10 of 17
* Electric cars have two main advantages: unlike gasoline, electricity can be generated from various sources including renewable ones, and electric vehicles can reduce urban air pollution from road transportation. “However, while electric cars can reduce gasoline use, they increase electricity consumption. Depending on how the electricity is generated, emissions of particular air pollutants may reduce or increase” [42]. In Appendix B (Table A1), we list the vital sustainability-related statements from car2go and DriveNow sustainability reports; the reviewed sustainability reports are all related to Corporate Social Responsibility (CSR) orientation.
3.3. Analytic Hierarchy Process
To resolve the lack of reconciliation between financial and sustainability reporting, potential decision-support models, such as the analytic hierarchy process model, can be utilized to present the connection between the different reporting systems. It is crucial to determine the factors and to apply proper weights for the specific items. To measure impacts, the method of the analytic hierarchy process (AHP) was used, where the weights of the factors were identified in order from the most to the least significant from the investor decision’s perspective.
When constructing the decision-making environment, it is crucial to identify issues or attributes that may be helpful [43,44], which brings the disharmony of traditional financial performance measuring attributes and sustainability aspects into perspective. The AHP theory aims to find the preferable alternative by weighing the priorities of the involved factors on a 1–9 scale (1: equal importance, 9: higher importance with respect to another component) and carrying out pairwise comparisons and standardization of the results to validate the overall ranking of factors [43,44]. Considering the findings of the current study, six elements were selected and weighed (w), as shown in Figure 6.
Figure 6. Decision factors and assumed weights.
In the analysis process, pairwise comparisons were developed for each criterion using linear integer scaling, summarized in a 6 × 6 matrix, which was then normalized using natural logarithms (ln (𝐴)) [45]. Using the AHP template and methodology of Goepel [46], the results were then averaged by rows, and the impacts were measured by the Eigenvector method (EVM). The summary matrix is presented in Figure 7.
Company valuation by investors
Total assets
w: 5
Profitability
w: 8
Cash flows
w: 6
Sustainability
w:1Large company
w: 3Medium/small
company
w: 3
Figure 6. Decision factors and assumed weights.
In the analysis process, pairwise comparisons were developed for each criterion using linearinteger scaling, summarized in a 6 × 6 matrix, which was then normalized using natural logarithms(ln(A)) [45]. Using the AHP template and methodology of Goepel [46], the results were then averagedby rows, and the impacts were measured by the Eigenvector method (EVM). The summary matrix ispresented in Figure 7.
Resources 2019, 8, x FOR PEER REVIEW 11 of 17
Figure 7. Summary of the analytic hierarchy process (AHP) matrix.
Additionally, the Eigenvalue (or 𝜆, consistency measure), the consistency index (CI), the mean relative error (MRE) of the weights, and the consistency ratio (CR) were calculated [47]. If the Eigenvalue (the matrix product of normalized principal Eigenvectors) equals the sample size (6), perfect consistency can be identified (𝜆 = 𝑛), which in our case corresponds to the value of 6.091.
The priorities pi in the input matrix were transformed into a near-consistent model using the EVM. In the pairwise n × n comparison matrix 𝐴 = 𝑎 , where 𝛺 , 𝛺 , … , 𝛺 are comparable elements with a positive numerical value, the transformation procedure is as follows: 𝛺…𝛺 ⎯⎯⎯⎯⎯⎯⎯⎯⎯ 𝑤( ), … , 𝑤( )…𝑤( ), … , 𝑤( ) (1)
With the use of EVM, the measuring procedure can be adapted to pairwise comparisons: ∑ 𝑎 𝑤 = 𝜆 𝑤 , 𝑖 = 1, … , 𝑛, where 𝜆 𝑤 are the principal Eigenvectors [48]. The normalization process is as follows:
𝑝 = 𝑟 / 𝑟 (2)
The CI was calculated by: CI = (𝜆 − 𝑛)𝑛 − 1 = 0.18% (3)
Error calculation of the priority vector 𝑤 with the used EVM followed:
𝛥𝑤 = 1𝑛 − 1 (𝑛𝜆 𝑎 𝑤 − 𝑤 ) , 𝑖 = 1, … , 𝑛 = 19.0% (4)
In the CR, the Alonson/Lamata linear fit was used: CR = , , = 1,4% [47]. From the hierarchical structure and from the potential AHP model presented in Figure 7,
profitability remains the most significant factor in an investor company valuation with a normalized principal Eigenvector of 41.3%, followed by the cash flows (22.3%) and total assets (18.2%). From the investor decision’s perspective, as long as sustainability reporting does not harmonize with financial reporting, the sustainability aspects tend to have a low impact factor (4.4%). In conclusion, the AHP statistical method is usable for the prioritization of factors, but it should be emphasized that the applied weights of the factors can be depend on subjective evaluations.
4. Conclusions
Figure 7. Summary of the analytic hierarchy process (AHP) matrix.
Additionally, the Eigenvalue (or λ, consistency measure), the consistency index (CI), the meanrelative error (MRE) of the weights, and the consistency ratio (CR) were calculated [47]. If theEigenvalue (the matrix product of normalized principal Eigenvectors) equals the sample size (6),perfect consistency can be identified (λ = n), which in our case corresponds to the value of 6.091.
The priorities pi in the input matrix were transformed into a near-consistent model using the EVM.In the pairwise n × n comparison matrix A = ai j, where Ω1, Ω2, . . . , Ωn are comparable elements witha positive numerical value, the transformation procedure is as follows:
Ω1
. . .Ωn
measurement
procedure−−−−−−−−−−−−−→
w(1)
1 , . . . , w(n)1
. . .
w(1)n , . . . , w(n)
n
(1)

Resources 2019, 8, 172 11 of 16
with the use of EVM, the measuring procedure can be adapted to pairwise comparisons:n∑
k=1aikwk =
λmaxwi, i = 1, . . . , n, where λmaxwi are the principal Eigenvectors [48].The normalization process is as follows:
pi = r1/N∑
i=1
ri (2)
The CI was calculated by:
CI =(λ− n)n− 1
= 0.18% (3)
Error calculation of the priority vector wi with the used EVM followed:
∆wi =
√√1
n− 1
n∑k=1
(nλ
aikwk −wi)2, i = 1, . . . , n = 19.0% (4)
In the CR, the Alonson/Lamata linear fit was used: CR = λ−n2,7699n−4,3513−n = 1.4% [47].
From the hierarchical structure and from the potential AHP model presented in Figure 7,profitability remains the most significant factor in an investor company valuation with a normalizedprincipal Eigenvector of 41.3%, followed by the cash flows (22.3%) and total assets (18.2%). From theinvestor decision’s perspective, as long as sustainability reporting does not harmonize with financialreporting, the sustainability aspects tend to have a low impact factor (4.4%). In conclusion, the AHPstatistical method is usable for the prioritization of factors, but it should be emphasized that the appliedweights of the factors can be depend on subjective evaluations.
4. Conclusions
From the financial and sustainability reports, the following conclusions can be made related to theHungarian free-float car-sharing market:
1. The market competition is increasing, and Hungarian companies have so far generated onlylosses from the financial statement’s perspective and are not competitive with respect to theirGerman counterparts. Market concentration seems to be increasing since the end of April 2019,when ShareNow started to provide services in Hungary. Additionally, we found that the reviewedcompanies follow a business model and not a sustainability model. Tóth et al. [49] defined trulyresponsible enterprises and developed a sustainability ranking model based on three key aspectsi.e., local economic role, environmental impact, and social responsibility, which are measured ona five-point scale, ranging from destructive to sustaining operations. From the environmentalimpact and social responsibility perspectives, car-sharing entities may be considered even assustaining or public-spirited entities, but with the international market concentration, their localeconomic role is reduced; solutions should be found to achieve a more sustainable operation.
2. From the statistical data collection’s perspective, on the EU level, a separate car-sharing sub-categoryshould be created because, at the moment, rental and lease companies are not separated instatistical reports.
3. In the reviewed sustainability reports, four areas were compared for Car2go and DriveNow, asfollows: (a) new business model; (b) geographic expansion; (c) public transport; (d) electric vehicles.The basic idea of sustainable mobility is simple: “We need to shape our city mobility in such a waythat the ease and safety of our everyday movements now and in the future will not diminish butgrow, and the quality of life will not suffer but improve for us and for the generations to come” [50].For sustainability achievement, three key areas can be defined as the targeted goals for the reviewedentities: (a) Efficiency of resource utilization, (b) Low carbon footprint, and (c) Build of social capital.

Resources 2019, 8, 172 12 of 16
Sustainability reports in the examined sample cannot be connected to the financial statements,whereas harmonization is essential and should be a subject of future studies.
4. This study provides additional information and evidence regarding financial and sustainabilityreport harmonization, confirming the “importance of environmental accounting on financialperformance” [51,52] and policy development in the car-sharing industry.
5. Future research studies can focus on harmonization development between the different reportingstandards and the next harmonization steps planned by the International Accounting StandardBoard (IASB) in this area.
6. Considering the available information and the early stage of harmonization, this paper has certainlimitations. We concluded that no clear connection exists between financial and sustainabilityreporting, but we could not precisely link those reporting standards; financial statements wereonly available until 2017.
Author Contributions: A.T. and C.S. initiated the study and performed the conceptualization, A.T. prepared theliterature review, designed the methodology and collected the data, C.S. validated the results, A.T. and C.S. wrotethe paper.
Funding: This research received no external funding.
Acknowledgments: Data collection, analysis, and administrative support received from the “Research Center ofVehicle Industry” at Széchenyi István University (JKK).
Conflicts of Interest: The authors declare no conflict of interest.
Appendix AResources 2019, 8, x FOR PEER REVIEW 13 of 17
Figure A1. TEÁOR 77.11 main renting or lease activity of companies with at least 10 staff headcounts in Hungary [25].
Appendix B
Table A1. Aspects of the sustainable sharing economy (SSE) [40,41].
BMW Daimler
New business model
“The focus will continue to be placed on the development, production, and sale of vehicles, with a wide range of innovative mobility services on top.” (p. 11) “Providing opportunities to test the BMW i3 as part of our DriveNow car-sharing scheme.” ([40], p. 60)
“Transport infrastructure and transport systems frequently operate at their limits, especially in urban areas. That is why Daimler has developed a range of pioneering mobility concepts.” ([41], p. 55)
Geographic expansion
“DriveNow is currently available in 13 European cities. On 8 April 2016, the BMW Group launched an advanced car-sharing program in the USA under the name ReachNow.” ([40], p. 73)
“The 300 new vehicles are being used in Berlin, and additional models will also be introduced to other cities in the future.” “In 2016, car2go launched in the Chinese megacity of Chongqing with the brand suffix “JíXíng” (roughly translated as: “drive off immediately”). “car2go is the first international company to implement the free-floating car-sharing concept in China.” ([41], p. 55)
Public transport
“DriveNow in Copenhagen is operated by the city’s public transport company Arriva. With their “Rejsekort,” a card for almost all mobility services in the whole of Denmark, users also gain access to DriveNow. ([40], p. 74)
“From the car-sharing provider car2go and the mobility platform Moovel to the taxi app Mytaxi, the coach company Flixbus, and the Bus Rapid Transit (BRT) system.” ([41], p. 55)
Figure A1. TEÁOR 77.11 main renting or lease activity of companies with at least 10 staff headcountsin Hungary [25].

Resources 2019, 8, 172 13 of 16
Appendix B
Table A1. Aspects of the sustainable sharing economy (SSE) [40,41].
BMW Daimler
New business model
“The focus will continue to be placed onthe development, production, and sale ofvehicles, with a wide range of innovativemobility services on top.” (p. 11)“Providing opportunities to test the BMWi3 as part of our DriveNow car-sharingscheme.” ([40], p. 60)
“Transport infrastructure andtransport systems frequently operateat their limits, especially in urbanareas. That is why Daimler hasdeveloped a range of pioneeringmobility concepts.” ([41], p. 55)
Geographic expansion
“DriveNow is currently available in 13European cities. On 8 April 2016,the BMW Group launched an advancedcar-sharing program in the USA under thename ReachNow.” ([40], p. 73)
“The 300 new vehicles are being usedin Berlin, and additional models willalso be introduced to other cities in thefuture.” “In 2016, car2go launched inthe Chinese megacity of Chongqingwith the brand suffix “JíXíng”(roughly translated as: “drive offimmediately”). “car2go is the firstinternational company to implementthe free-floating car-sharing concept inChina.” ([41], p. 55)
Public transport
“DriveNow in Copenhagen is operated bythe city’s public transport companyArriva. With their “Rejsekort,” a card foralmost all mobility services in the wholeof Denmark, users also gain access toDriveNow. ([40], p. 74)
“From the car-sharing provider car2goand the mobility platform Moovel tothe taxi app Mytaxi, the coachcompany Flixbus, and the Bus RapidTransit (BRT) system.” ([41], p. 55)
Electric vehicles
“The fleet for both programs currentlycomprises more than 6000 vehicles inEurope, of which around 15% are purelyelectric BMW i3 vehicles. A further 1300vehicles are available in the USA.DriveNow is one of the strongest driversof electromobility in Germany”. (p. 71)“Copenhagen is the only city in Europe inwhich we have operated our car-sharingservice from the start with a fleet of purelyelectric BMW i3 cars. The good charginginfrastructure in the city offers idealconditions for this.” ([40], p. 74)
“Car2go has added 20 smart ForTwoelectric vehicles to the local fleet.This is the first step in evaluating thefeasibility of using electric vehicles inour fleet by relying on Montréal’sexisting charging infrastructure, aswell as determining how the city’sclimate conditions impact vehiclerange and availability.” https://www.car2go.com/NA/en/nextgen/
References
1. Deloitte, L.L.C. Car Sharing in Europe–Business Models, National Variations, and Upcoming Disruptions.Available online: https://www2.deloitte.com/uk/en/pages/manufacturing/articles/car-sharing-in-europe.html(accessed on 23 February 2019).
2. Muñoz, P.; Cohen, B. A Compass for Navigating Sharing Economy Business Models. Calif. Manag. Rev. 2018,61, 114–147. [CrossRef]
3. Reitmann, N.; Lieven, T. How policy measures succeeded to promote electric mobility–worldwide reviewand outlook. J. Clean. Prod. 2019, 206, 66–75. [CrossRef]
4. Hartl, B.; Sabitzer, T.; Hofmann, E.; Penz, E. “Sustainability is a nice bonus” the role of sustainability incarsharing from a consumer perspective. J. Clean. Prod. 2018, 202, 88–100. [CrossRef]
5. Wheeler, S.A.; Webb, T. Leases: A review of contemporary academic literature relating to lessees.Account. Horiz. 2015, 29, 997–1023. [CrossRef]
6. Barone, E.; Birt, J.; Moya, S. Lease accounting: A review of recent literature. Account. Eur. 2014, 11, 35–54.[CrossRef]
Resources 2019, 8, 172 14 of 16
7. Giner, B.; Pardo, F. The value relevance of operating lease liabilities: Economic effects of IFRS 16.Aust. Account. Rev. 2018, 28, 496–511. [CrossRef]
8. Bocken, N.M.P.; Short, S.W.; Rana, P.; Evans, S. A literature and practice review to develop sustainablebusiness model archetypes. J. Clean. Prod. 2014, 65, 42–65. [CrossRef]
9. Geisinger, A.; Laurell, C.; Oberg, C.; Sandstrom, C. How sustainable is the sharing economy? On thesustainability connotations of sharing economy platforms. J. Clean. Prod. 2018, 206, 419–429. [CrossRef]
10. Harangozo, G.; Csutora, M.; Kocsis, T. How big is big enough? Toward a sustainable future by examiningalternatives to the conventional economic growth paradigm. Sustain. Dev. 2018, 26, 172–181. [CrossRef]
11. Bernardi, M.; Diamantini, D. Shaping the sharing city: An exploratory study on Seoul and Milan. J. Clean. Prod.2018, 203, 30–42. [CrossRef]
12. Csutora, M.; Harangozo, G. Twenty years of carbon accounting and auditing–a review and outlook. Soc. Econ.2017, 39, 459–480. [CrossRef]
13. Ma, Y.; Lan, J.; Thornton, T.; Mangalagiu, D.; Zhu, D. Challenges of collaborative governance in the sharingeconomy: The case of free-floating bike-sharing in Shanghai. J. Clean. Prod. 2018, 197, 356–365. [CrossRef]
14. Albinsson, P.; Perera, Y.; Nafees, L.; Burman, B. Collaborative Consumption Usage in the US and India:An Exploratory Study. J. Mark. Theory Pract. 2019, 27, 390–412. [CrossRef]
15. Ma, Y.; Rong, K.; Mangalagiu, D.; Thornton, T.; Zhu, D. Co-evolution between urban sustainability andbusiness ecosystem innovation: Evidence from the sharing mobility sector in Shanghai. J. Clean. Prod. 2018,188, 942–953. [CrossRef]
16. Allen, D.; Berg, C. The Sharing Economy: How Over-Regulation Could Destroy an Economic Revolution; Institute ofPublic Affairs: Melbourne, Australia, 2014; Available online: https://collaborativeeconomy.com/wp/wp-content/uploads/2015/04/Allen-D.-and-Berg-C.2014.The-Sharing-Economy.-Institute-of-Public-Affairs.-.pdf (accessed on6 October 2019).
17. Cohen, M.; Sundararajan, A. Self-Regulation, and Innovation in the Peer-to-Peer Sharing Economy.Univ. Chic. Law Rev. Dialogue 2015, 82, 116–133.
18. Koopman, C.; Mitchell, M.; Thierer, A. The Sharing Economy and Consumer Protection Regulation: The Casefor Policy Change; Mercatus Center, George Madison University: Arlington, VA, USA, 2014; Availableonline: https://digitalcommons.pepperdine.edu/cgi/viewcontent.cgi?article=1130&context=jbel (accessed on4 October 2019).
19. Koopman, C.; Mitchell, M.; Thierer, A. The Sharing Economy: Issues Facing Platforms, Participants,and Regulators. 2016. Available online: https://www.mercatus.org/system/files/Koopman-Sharing-Economy-FTC-filing.pdf (accessed on 12 October 2019).
20. Sundararajan, A. Peer-to-peer Businesses and the Sharing (Collaborative) Economy: Overview, EconomicEffects, and Regulatory Issues. Written Testimony for the Hearing Titled, The Power of Connection:Peer-To-Peer Businesses, Held by the Committee on Small Businesses of the U.S. House of Representatives,15 September 2014. Available online: https://www.govinfo.gov/content/pkg/CHRG-113hhrg86266/html/CHRG-113hhrg86266.htm (accessed on 8 October 2019).
21. Thierer, A.; Koopman, C.; Hobson, A.; Kuiper, C. How the Internet, the Sharing Economy, and ReputationalFeedback Mechanisms Solve the ‘Lemons Problem’. 2016. Available online: http://ssrn.com/abstract=2610255(accessed on 4 October 2019).
22. Cannon, B.; Chung, H. A framework for designing co-regulation models well-adapted to technology-facilitated sharing economies. Santa Clara High Technol. Law J. 2015, 31, 23–97.
23. Malhotra, A.; Van Alstyne, M. The dark side of the sharing economy . . . and how to lighten it. Commun. ACM2014, 57, 24–27. [CrossRef]
24. McLean, S. The rise of the sharing economy. Comput. Law Mag. SCL 2015, 26, 26–28.25. Ranchordas, S. Does Sharing Mean Caring? Regulating Innovation in the Sharing Economy. Minn. J. Law Sci. Technol.
2015, 16, 413–475.26. Rauch, D.; Schleicher, D. Like Uber, But for Local Government Policy: The Future of Local Regulation of the “Shared
Economy”; Working Paper # 21; New York University, Marron Institute of Urban Management: New York,NY, USA, 2015; Available online: https://marroninstitute.nyu.edu/uploads/content/The_Future_of_Local_Regulation_of_the_Shared_Economy.pdf (accessed on 8 October 2019).
Resources 2019, 8, 172 15 of 16
27. Sunil, J.; Noah, Z. Policymaking for the Sharing Economy: Beyond Whack-A-Mole; Mowat Centre, Universityof Toronto: Toronto, ON, Canada, 2015; Available online: https://mowatcentre.ca/wpcontent/uploads/publications/106_policymaking_for_the_sharing_economy.pdf (accessed on 17 October 2019).
28. Zrenner, A. The Ethics of Regulating the Sharing Economy; The Kenan Institute for Ethics at Duke University:Durham, NC, USA, 2015; Available online: https://kenan.ethics.duke.edu/wp-content/uploads/2012/08/
Sharing-Economy-2015.pdf (accessed on 18 October 2019).29. Oei, S.; Ring, D. Can Sharing Be Taxed? Legal Studies Research Paper No. 352; Boston College Law School:
Boston, MA, USA, 2015.30. Codagnone, C.; Martens, B. Scoping the Sharing Economy: Origins, Definitions, Impact and Regulatory Issues;
JRC Technical Reports, Institute for Prospective Technological Studies, Digital Economy Working Paper1; European Union: Brussels, Belgium, 2016; Available online: https://ec.europa.eu/jrc/sites/jrcsh/files/JRC100369.pdf (accessed on 27 September 2019).
31. Daus, M.; Russo, P. One Standard for All. Criminal Background Checks for Taxicab, For-Hire, and TransportationNetwork Company (Inc) Drivers; Jay College of Criminal Justice, of the City University of New York: New York,NY, USA, 2015; Available online: http://www.utrc2.org/sites/default/files/pubs/Background%20Check%20Report.pdf (accessed on 20 October 2019).
32. Penz, E.; Hartl, B.; Hofmann, E. Collectively Building a Sustainable Sharing Economy Based on Trust andRegulation. Sustainability 2018, 10, 37–54. [CrossRef]
33. Frenken, K.; Schor, J. Putting the sharing economy into perspective. Environ. Innov. Soc. Transit. 2017, 23,3–10. [CrossRef]
34. Baptista, P.; Meloa, S.; Rolima, C. Energy, environmental, and mobility impacts of car-sharing systems.Empirical results from Lisbon, Portugal. Procedia-Soc. Behav. Sci. 2014, 37, 28–37. [CrossRef]
35. Kawaguchi, T.; Murata, H.; Fukushige, S.; Kobayashi, H. Scenario analysis of car- and ride-sharing servicesbased on life cycle simulation. Procedia Cirp 2019, 80, 328–333. [CrossRef]
36. Giesel, F.; Nobis, C. The Impact of Carsharing on Car Ownership in German Cities. Transp. Res. Procedia2016, 19, 215–224. [CrossRef]
37. European Commission. NACE, Rev. 2. Statistical Classification of Economic Activities in the European Community;Eurostat Methodologies and Working papers; European Commission: Luxembourg, Luxembourg, 2008.
38. Hungarian Accounting Regulation Act of 2000. C. in Hungary. Available online: https://net.jogtar.hu/
jogszabaly?docid=A0000100.TV (accessed on 27 September 2019).39. Electronic Reporting Portal of the Ministry of Justice in Hungary. Available online: https://e-beszamolo.im.
gov.hu/oldal/kezdolap (accessed on 27 September 2019).40. BMW Group Sustainable Value Report. Available online: https://www.bmwgroup.com/content/dam/bmw-
group-websites/bmwgroup_com/ir/downloads/en/2017/BMW-Group-SustainableValueReport-2017--EN.pdf (accessed on 10 January 2019).
41. Daimler Sustainability Report. Available online: https://www.daimler.com/documents/sustainability/other/daimler-sustainability-report-2017.pdf (accessed on 10 January 2019).
42. Cai, H. Big Data for Urban Sustainability: Integrating Personal Mobility Dynamics in EnvironmentalAssessments. Ph.D. Thesis, University of Michigan, Ann Arbor, MI, USA, 2015. Available online: https://deepblue.lib.umich.edu/bitstream/handle/2027.42/113510/caih_1.pdf?sequence=1&isAllowed=y (accessedon 27 September 2019).
43. Saaty, T.L. Decision making with the analytic hierarchy process. Int. J. Serv. Sci. 2008, 1, 83–98. [CrossRef]44. Saaty, T.L. What is the analytic hierarchy process. In Mathematical Models for Decision Support; Springer:
Berlin/Heidelberg, Germany, 1988; pp. 109–121.45. Bunruamkaew, K. How to do AHP Analysis in Excel. Division of Spatial Information Science Graduate School
of Life and Environmental Sciences University of Tsukuba, 2012, Lecture. Available online: http://giswin.geo.tsukuba.ac.jp/sis/gis_seminar/How%20to%20do%20AHP%20analysis%20in%20Excel.pdf (accessed on4 October 2019).
46. Goepel, K.D. Implementing the Analytic Hierarchy Process as a Standard Method for Multi-Criteria DecisionMaking In Corporate Enterprises–A New AHP Excel Template with Multiple Inputs. In Proceedings of theInternational Symposium on the Analytic Hierarchy Process, Kuala Lumpur, Malaysia, 23–26 June 2013.[CrossRef]
Resources 2019, 8, 172 16 of 16
47. Tomashevskii, I.L. Eigenvector ranking method as a measuring tool: Formulas for errors. Eur. J. Oper. Res.2015, 240, 774–780. [CrossRef]
48. Alonso, L. Consistency in the analytic hierarchy process: A new approach. Int. J. Uncertain. Fuzziness Knowl.-Based Syst. 2006, 14, 445–459. [CrossRef]
49. Tóth, G. The Truly Responsible Enterprise: About Unsustainable Development, the Tools of Corporate SocialResponsibility (CSR), and the Deeper, Strategic Approach, 2nd ed.; KÖVET–Hungarian Association for SustainableEconomies, 2009; Available online: http://refhub.elsevier.com/S0959-6526 (accessed on 7 November 2019).
50. Tkatchenko, R. Personal City Mobility in the Context of Sustainable Development. Ph.D. Thesis, CorvinusUniversity, Budapest, Hungary, 2018. Available online: http://phd.lib.uni-corvinus.hu/990/2/Tkatchenko_Rossen_ten.pdf (accessed on 27 September 2019).
51. Fogarassy, C.; Neubauer, É.; Mansur, H. The main transition management issues and the effects ofenvironmental accounting on financial performance-with focus on cement industry. Adm. Manag. Public2018, 31, 52–66. [CrossRef]
52. Horvath, B.; Khazami, N.; Ymeri, P.; Fogarassy, C. Investigating the Current Business Model InnovationTrends in the Biotechnology Industry. JBEM 2019, 20, 63–85. [CrossRef]
© 2019 by the authors. Licensee MDPI, Basel, Switzerland. This article is an open accessarticle distributed under the terms and conditions of the Creative Commons Attribution(CC BY) license (http://creativecommons.org/licenses/by/4.0/).