Egypt’s Exchange Rate Regime Policy after the Float
34
Egypt’s Exchange Rate Regime Policy after the Float By Ali A. Massoud* and Thomas D. Willett** *Dr. Ali Massoud is an associate professor at the Economics Department, Faculty of Commerce, Sohag University, Egypt and a visiting scholar at the Claremont Institute for Economic Policy Studies, Claremont Graduate University. ** Professor Thomas Willett is the Horton Professor of Economics, Claremont Graduate University and Claremont McKenna College, USA and Director of the Claremont Institute for Economic Policy Studies. Email: [email protected] Phone: ++1(909) 331-9804 (U.S.A) ++20(111)3131-215 (Egypt) 1
Transcript of Egypt’s Exchange Rate Regime Policy after the Float
Egypt’s Exchange Rate Regime Policy after the Float
By
Ali A. Massoud* and Thomas D. Willett**
*Dr. Ali Massoud is an associate professor at the Economics Department,Faculty of Commerce, Sohag University, Egypt and a visiting scholar at theClaremont Institute for Economic Policy Studies, Claremont GraduateUniversity.
** Professor Thomas Willett is the Horton Professor of Economics, ClaremontGraduate University and Claremont McKenna College, USA and Director of theClaremont Institute for Economic Policy Studies.
Email: [email protected]
Phone: ++1(909) 331-9804 (U.S.A)
++20(111)3131-215 (Egypt)
1
Egypt’s Exchange Rate Regime Policy after the Float
by
Ali A. Massoud and Thomas D. Willett
Abstract:
The major purpose of this paper is to analyze the actual exchange rate
policies followed by Egypt since the Central Bank of Egypt (CBE) announced its
adoption of a floating ER regime in January 2003.
Based on our analytical and empirical approachs to analyzing the actual degree
of flexibility of exchange rate policies we concluded the following. First, the
de jure “Free Floating” ER Regime that the CBE announced in January, 2003 was
not preserved during the period of the study. Second, the changes in the IMF’s
de facto classifications of Egypt’s actual exchange rate policies were broadly
accurate. Third, the move from light to heavy exchange market management in
2011 leads to what has been called a one way speculative option. Fourth, too
much attention has been paid to the US dollar in setting exchange rate
policies. Since the dollar exchange rate sometimes moves substantially against
some of these other currencies such as the Euro, it is important that such
fluctuations should also be taken into account.
2
Keywords: Exchange Rate Regimes Estimation, Exchange Rate RegimesClassification, Exchange Rate Regimes, Exchange Rate Policies, and ExchangeMarket Pressure.
Introduction:
In order to make a sound recommendation for a country exchange rate policy, it
is valuable to evaluate how well its exchange rate policies have operated in
the past. This in turn requires determination of what policies a country
actually followed. The latter is a nontrivial question because recent research
has shown that the exchange rate regimes that countries actually follow
frequently diverge from those officially reported to the IMF.
Where a country is following a narrowly pegged exchange rate, this regime is
easy to classify. It is important however to investigate not only the broad
type of exchange rate regime that has been adopted but also to analyze how it
has been operated with the adjustable peg. The key questions are how
frequently and by how much the peg is adjusted and what are the circumstances
that lead to such adjustments? More interesting and more difficult to analyze
issues arise when countries adopt various forms of flexibility of exchange
rate. The easiest of such de facto regimes to analyze in a free float which form
3
a theoretical perspective- regimes that a country never (hardly ever)
intervenes in the foreign exchange. In practice the adoption of such genuine
free floating regimes is quite rare. The US dollar and euro closely
approximate this as have countries such as Canada, Japan, and New Zealand over
particular periods, but these are only a small percentage of countries
following some types of flexible exchange rate regimes.
Countries sometimes announce that they have adopted a free float when they are
in fact using official intervention to manage the exchange rate. This was true
of Egypt after 2003. Another example is Korea (see Willett et Al., 2009).
A crawling peg regime, which Egypt announced in January 2001, is easy to
classify as a type of regime, but important questions remain about how
flexibly it was operated. In most standard classifications, crawling pegs are
put more toward the fixed end of the exchange rate spectrum than a managed
float. Research has shown however, that some managed floats have operated with
less flexibility than some crawling pegs and vice versa (see Willett et al.,
2005).For an illustration of this for the exchange rates of several Asian
countries before the Asian crisis of 1997-1998.
Thus, with both crawling pegs and managed floats it is important to analyze
how they actually operated and how this may have varied over time. For
example, was there actually more flexibility during Egypt’s managed float
regime than for its crawling peg and did their relationship vary over
different time periods.
The major purpose of this paper is to analyze the actual exchange rate
policies followed by Egypt since the Central Bank of Egypt (CBE) announced its
adoption of a floating ER regime in January 2003. For these purposes it is not
sufficient to determine whether a country has adopted a floating exchange
rate. It is also important to analyze how heavily and in what ways the
exchange rate is managed. For these purposes we adopt analytic and empirical
approaches to review Egypt’s exchange rate policies.
The importance of this paper comes from the lack of the study that deals with
the issue of the estimation of exchange rate policy in Egypt. Providing an
4
accurate estimation of the exchange rate policy in Egypt helps in providing
sound recommendations for the Egyptian authorities in order to deal with the
disequilibrium in the foreign exchange market. This enables the Egyptian
authorities to adopt the right exchange rate regime that corrects the
disequilibrium in foreign exchange market and ends the one direction
speculation option on the Egyptian Pound.
Correcting the disequilibrium in the foreign exchange market in Egypt and
ending up the one way speculation option helps in correcting other
macroeconomic variables in the Egyptian economy. For instance, El-Ramly and Abdel-
Haleim (2008) has found that the devaluations of the Egyptian Pound over the
period from 1982 to 2004 have an initial contractionary effect on output in
Egypt. Massoud (forthcoming) has found an impact of exchange rate movements on
domestic prices. CPI and PPI are affected by the movements in exchange rate of
the Egyptian Pound.
The remainder of this paper is organized as follows. Section (1) provides a
brief summary of the literature that deals with identifying ER regimes.
Section (2) presents a historical reading of Egypt’s ER regime before the
float. Section (3) presents an analytical view for the ER behavior for the
Egyptian Pound after the float. Section (4) provides a comparison between our
EMP approach and IMF’s classification of Egypt’s exchange rate regimes.
Section (5) presents the findings and policy implications that come out of our
study.
1. Literature Review
Recent research has shown that countries' actual exchange rate policies often
differ from their stated policies. This has given rise to a number of efforts
to classify exchange rate regimes on a de facto basis. For a recent review of
these measures (see Willett et al., 2011). These include several different types of
statistical measures and a new set of classifications from the IMF that is
based on its staff judgments in classifying the de facto exchange rate regime
for its member countries. For instance, in 1998, the IMF revised its
classification of the de jure “Managed Floating” ER regime in Egypt to a de facto
5
“Conventional Fixed Peg” ER regime. The IMF in 2012 revised its own de facto
classification of ER regime in Egypt from a “Crawl-Like Arrangement” to a
“Stabilized Arrangement”.
A heroic effort to classify a large number of exchange rate regimes has been
undertaken by Reinhart and Rogoff (2004) while their classification has many
desirable features such as including inflation and dual exchange rate regimes,
it suffers from looking only at the behavior of the exchange rate and not
adjusting for the extent of official intervention. As a consequence they
misclassify countries such as Japan and Korea as having free floating regimes
over periods in which they had substantial movements in their exchange rates
but also massive intervention in the foreign exchange market.
Levy-Yeyati and Sturzenegger (2005) uses cluster analysis of changes in exchange rates
regime but their methodology allows them only to differentiate between fixed,
crawling peg, and floating rate regimes and does not provide a method of
analyzing the degree of official management of flexible regimes. A third
approach is presented by Calvo and Reinhart (2002) based on the variances of
changes in reserves, exchange rate, and interest rates. The use of the ratios
of variances does not allow one to distinguish the extent of management in
individual Periods of short duration. The use of interest rates is also
problematic as one cannot tell from this statistical data whether an interest
rate move by a desire to limit currency depreciation or to diminish the loss
of reserves.
For the purpose of this paper we follow the conclusion of recent studies that
the approach of looking directly at the ratios of changes in exchange rates is
not appropriate. It is important to also take into account the shocks that a
country faces. Thus, for example, over a particular period an exchange rate
may show little variation because there is heavy official intervention to
limit exchange rate fluctuation. But there could also be little interventions
and few shocks. Where there are a number of large shocks, a country that
intervenes fairly heavily may still have a lower exchange rate variability
than a country with a high propensity to intervene in the foreign exchange
6
market, which is the key characteristic of a none flexible management of the
exchange rate.
Conceptually the magnitude of shocks in foreign exchange market corresponds to
the size of the corresponding shifts in demand and supply schedules for
foreign exchange. These shifts correspond to the concept of exchange market
pressure (EMP) generated by shocks to foreign exchange market. The foundation
of the concept of EMP was introduced by Girton, L. and Roper, D., (1977). However, the
first use of the concept of exchange market pressure for the statistical
measurement of exchange rate flexibility was by Weymark (1995, 1997, and 1998). Her
particular methodology suffered from some technical problems, however, see
Willett et al (2011) and (2012).
Frankel and Wei (2008 and 2009) and Willett et al (2005) developed another approach also
based on the concept of EMP. Their approach investigates the degree to which
shifts in demand and supply in the foreign exchange market are allowed to move
the exchange rate versus being offset by official intervention. This approach
has often been used based on exchange rate behavior with respect to a single
major foreign currency. For application for the Japanese yen and Korean won
against the dollar see Willett et al (2009), (2012) and (2011). For many countries,
however, the exchange rates with respect to more than one foreign currency may
be important. To deal with this issue Frankel and Wei (2008 and 2009)
developed their approach to include the behavior of multiple foreign exchange
rates. Their approach draws on their earlier approach to estimate the de facto
weights of a set of foreign currencies where countries are managing their
exchange rate against a basket of foreign currencies.
In a freely floating exchange rate the size can be measured by the movement of
the exchange rate while under a fixed exchange rate system it would be
measured by the size of the amount of official intervention required to
maintain the exchange rate constant (in empirical studies this is usually
proxied by the change in a country’s international reserves). Under a managed
float the shock will result in some combination of change in the exchange rate
and official intervention. The ratio of the movements in the exchange rate
7
relative to the change in reserves provide a measure of the strength of the
propensity of the authorities to intervene in the foreign exchange market and
its inverse the degree of exchange rate flexibility.
Ideally one would want to weight the two types of changes by the slope of the
excess demand curve in the foreign exchange market. Good estimates of such
slopes are not available, however we weight them equally. For discussion of
the issues involved in weighting see Willett et al. (2013).
A separate analysis could be undertaken to estimate a Taylor rule type
reaction function for a country that includes exchange rate in the reaction
function. A complete analysis of a country’s exchange rate cum Monetary regime
would include estimates of the extent to which the domestic monetary effects
of exchange market intervention are sterilized or not.
For discussion of this and farther analysis of the other statistical measures
(see Willett et al., 2011). In addition to these statistical measures, there is also
now available at the IMF a set of de facto classifications based on the judgment
of IMF staff about the exchange rate policies actually followed. For many
purposes these classifications are extremely useful but they are weak in terms
of characterizing the extent of management of the managed floats. We do
however compare our statistical measures with the de facto classification of the
IMF. Again see the survey by Willett et al (2011).
There are two studies that examined the de facto ER regime in Egypt. The first study
is Selim (2010). The study investigated if there was a significant change in the
exchange rate behavior with the announcement of the float of the Egyptian
Pound on January, 2003. It used LYS methodology in order to classify Egypt’s
exchange rate after the float. The study used the Chow test for structural
break. It concluded that according to the Chow test’s results, there was no
significant change associated in the exchange behavior with the announcement
of the float. The author concluded that she was not able to classify the
Egyptian exchange regime by using LYS methodology.
The second study is Kamar and Bakardzhieva (2005). This study used a single-equation
approach to cointegration. It concluded that the Egyptian authorities have
8
always managed the exchange regime, whether under the label of “adjustable
peg”, “crawling peg” or the de facto management of its de jure free float.
This conclusion leaves open, however, the important question of how heavily
the exchange rate is managed.
2. Reading the History of ER Regime in Egypt before the announcement of the
float: an Analytical Approach.
Before we analyze the de facto ER regime in Egypt after the floating of the
Egyptian Pound in January 2003, we believe that it is important to read the
history of how Egypt ER regime was operated in the previous periods. We are
not doing so in a purely narrative way, rather we connect the analysis of the
ER regime to two dimensions. The first dimension is the movements in ER of the
Egyptian Pound. The second dimension is the movements of the total foreign
reserves at the Central Bank of Egypt. In this section, we examine the ER
regimes that Egypt followed before the de jure floating ER regime that took
place in January 2003. We can distinguish between three ER regimes that Egypt
followed during this period. These ER regimes are: fixed adjustable peg,
managed floating, and crawling peg. The rest of this section sheds the light
on how ER regime in Egypt had been operated before the float.
2.1 The Fixed but Adjustable Peg ER Regime:
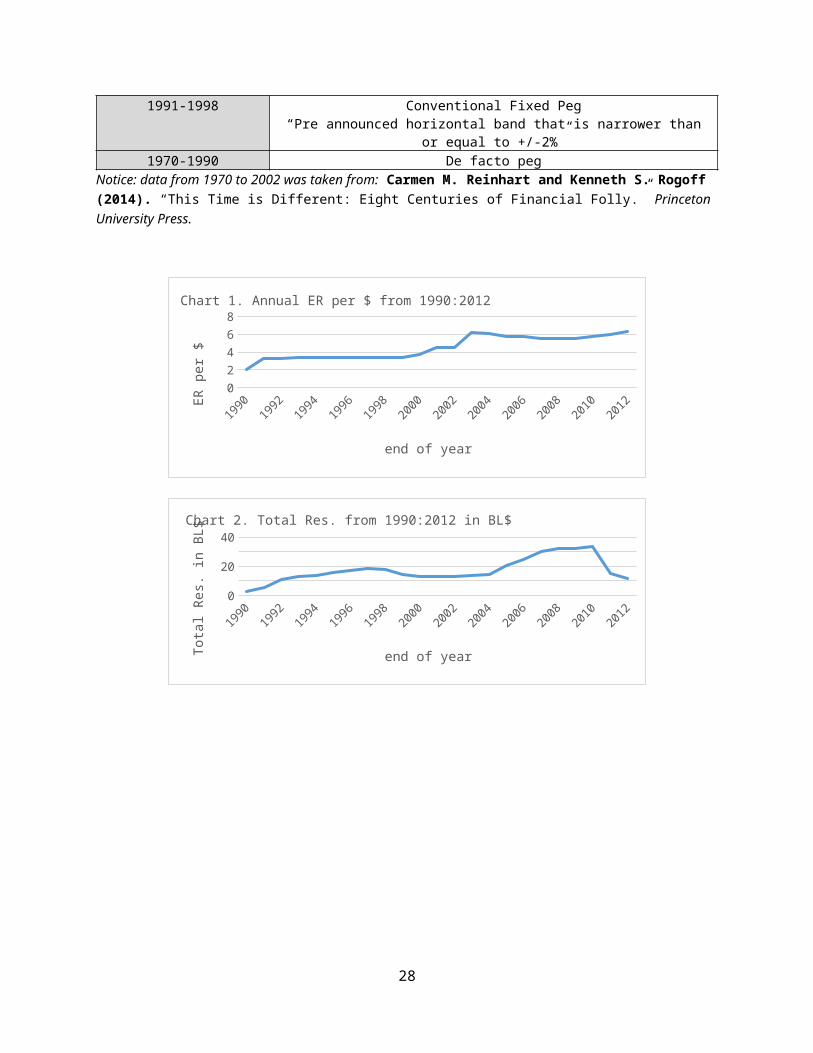
Starting from the sixties till 1990, Egypt had put a fixed but adjustable peg
in practice. The Egyptian authority had kept the ER of the Egyptian Pound
fixed to the USD. The CBE had adjusted the ER of the Egyptian pound from 1.1
LE per 1$ to 2 LE per 1$ in July 1990. Chart (1) captures the jump of the ER
for the Egyptian pound. The question here is: What is the impact of this
devaluation on reserves? Chart (2) shows that reserves had grown after the
devaluation of the Egyptian Pound. Reserves had increased from 1.6 BL $ in
July 1990 to 2.7 BL$ in December 1990 and jumped in January 1991 to 3.2BL$.
This may indicate that the CBE allowed the ER of the Egyptian Pound to move
and did not intervene to prevent the deterioration of its value against the
USD. This may be true. However, we rather argue that the CBE might intervened
against the wind to keep the ER of the Egyptian Pound at 2 LE per 1$ but if
9
failed to do so. We build our argument on two points: the first one is the decline
in reserves over the last two months in 1990. Reserves declined from 3.9 BL$
in October 1990 to 2.7 BL$ in December 1990. The second is that, if the CBE
could defend its fixed adjustable peg, it would not change it shortly at the
beginning of 1991.
2.2 The Managed Floating ER Regime:
In February 1991 as a part of the economic reform program, the Egyptian
authority changed its ER policy from the adoption of a fixed but adjustable
peg ER regime to a managed floating ER regime. As a result of the new regime,
the ER of the Egyptian Pounds devalued from 2LE per 1$ to 3.4$, on average
between February 1991 and December 2000. As chart (1) shows, the ER of the
Egyptian Pound was moving up slowly against the USD. Regarding reserves,
during the period from January 1991 to December 2001, we can distinguish
between two sub-periods. The first period is from January 1991 to September 1997.
Over this period, reserves increased steadily from 3.1BL$ in January 1991 to
reach its peak of 19.1 BL$ in September 1997, as chart (2) shows. This may
have happened because of the foreign debt relief for Egypt as a result of its
reaction to the first “Gulf War” in 1991.The CBE had kept the ER for the
Egyptian Pound to what extent stable against the USD. The second period from
October 1997 to December 2000. As chart (1) shows, the CBE had kept the ER for
the Egyptian Pound fixed against the USD at 3.388 LE per 1$ between October
1997 and January 1999. But how did the CBE had keep the ER of the Egyptian
Pound fixed during this period? Chart (2) provides an answer. As chart (2)
shows, the CBE had lost about 5% of its reserves. Reserves declined to be
about 18BL$. As a result of losing reserves, the CBE had depreciated the ER of
the Egyptian Pound through 1998 and 1999. However, it continued to lose
reserves to the point that the reserves stock was only 13.1BL$ in
December2000. It is worth mentioning that during this period, Egypt was
exposed to three major shocks: (1) the terrorist act in Luxor in 1997 and its
10
implications on the tourism sector, which is considered to be a main source of
foreign currencies in Egypt. (2) the Asian Crisis that took place in 1997 and
1998 and caused huge capital outflows from Egypt. (3) the second” INTIFADAH”
for the Palestinian people which took place in 2000 and its negative
implications on the Egyptian economy, especially on tourism and foreign
investments. In 1998, the IMF revised its classification of the de jure
“Managed Floating” ER regime in Egypt to a de facto “Conventional Fixed Peg” ER
regime rather than the official classification of a managed float regime.
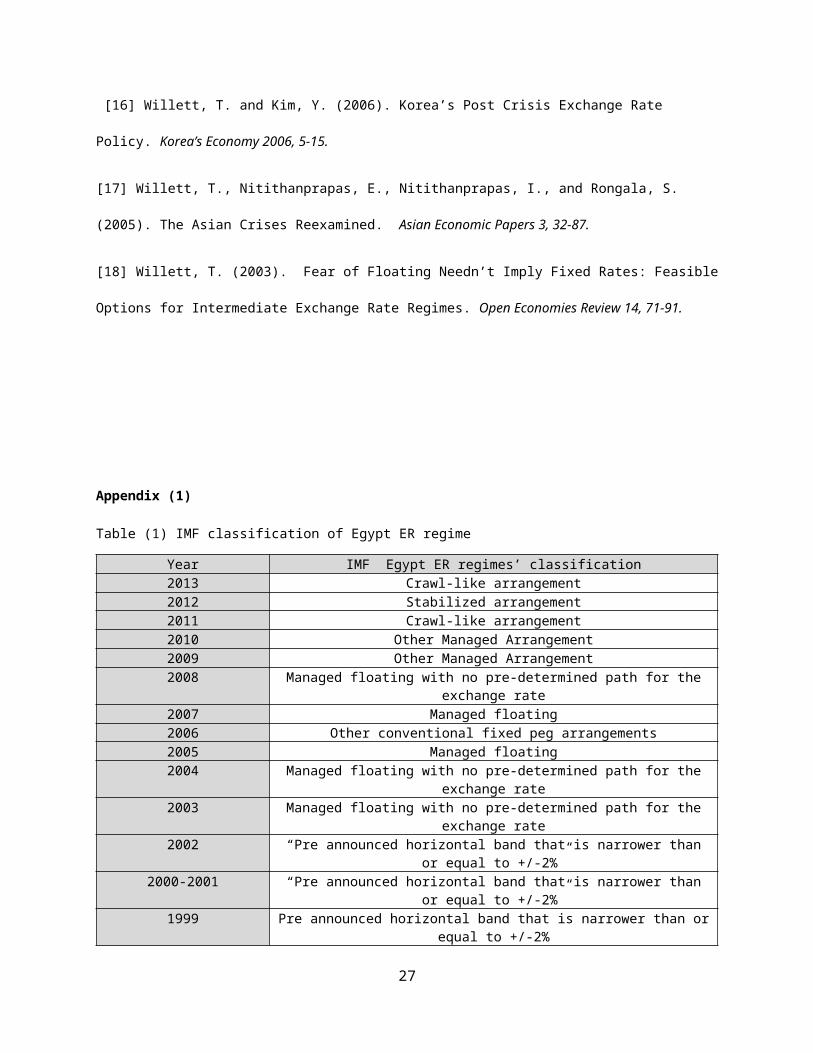
Table (1) in the appendix shows the history of the IMF’s de facto
classifications of Egypt’s exchange rate regime.
2.3 The Crawling Peg ER Regime:
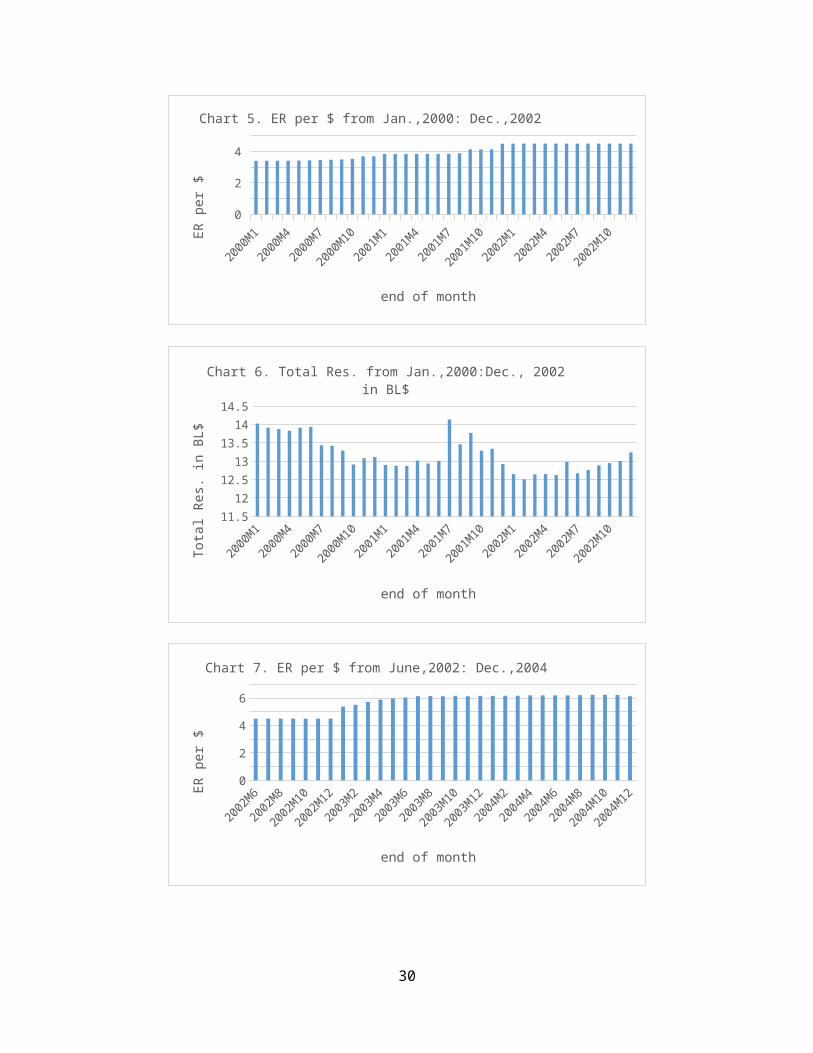
In January 2001, the CBE announced the adoption of a de jure” Crawling Peg ER
Regime”. Over the period from January 2001 to December 2002, the ER of the
Egyptian Pound was devalued three times. The first time was when the CBE adopted
the new ER regime. At that time the ER for the Egyptian Pound was set at 3.85
LE per 1$. The second time was on September 2001, as a result of the 9/11
terrorist act against the USA and its implications on the Egyptian economy.
The CBE devalued the Egyptian Pound to 4.14 LE per 1$. The third time was in
January 2002. As the effects of the 9/11 attack continued, the losses in the
tourism sector in Egypt continued, the CBE forced to devalue the Egyptian
Pound one more time and it set the ER at 4.5 LE per 1$. The CBE kept this rate
till its announcement of adopting floating ER regime in January 2003. Chart
(1) and chart (5) capture these developments in the ER of the Egyptian Pound.
During this period of adopting a de jure “Crawling Peg ER Regime”, reserves
fluctuated between 14.1BL$ (in July 2001) and 12.5 BL$ (in February 2002), as
Chart (2) and chart (6) show.
In conclusion:
From our analytical review of the history of the ER regimes in Egypt, we reach
the following conclusions:
1- When Egypt was exposed to external or internal shocks, the Egyptian
authorities, in most of the cases, tried to absorb these shocks by
11
leaning against the wind, then once it to lost reserves to a critical
point, the CBE allowed the ER of the Egyptian Pounds to depreciate and
an announcement adopting of a new ER regime was made.
2- External shocks and their implications on the Egyptian economy were, in
almost all the cases, the major reason for the CBE to adopt new ER
regime.
3- The ER of the Egyptian Pound during this period, regardless the de jure
ER regime or the de facto ER that CBE put in practice, was pegged to the
USD in tighter or looser ways.
3. The de facto vs. the de jure Egyptian ER Regime after the Float.
In January 2003, the CBE announced the new” Free Floating ER Regime” to be
followed in Egypt. Since this time, there have been doubts that this de jure
“Free Floating” was really being followed by the CBE. This doubt spread not
only among market participants, but also among local economists and those at
the IMF. After only a year of the new de jure ER regime, the IMF revised its
classification of Egypt’s ER regime as follows. In 2004, 2005, and 2006, the
IMF classified Egypt’s ER regime to a de facto “Managed Floating With no
predetermined path for ER” combined with a policy framework defined as
following a “Monetary Aggregate Target”. In 2008, the IMF changed its
classification of Egypt’s ER regime to a de facto “other Conventional Fixed Peg
Arrangement” with ER as a nominal anchor. In 2009, the IMF again reclassified
Egypt’s ER regime as a de facto “Managed Floating with no Predetermined Path for
ER”. In 2011, the IMF reclassified Egypt’s ER regime as a de facto “Craw-Like
Arrangement”. Few months later, in 2012, the IMF reclassified Egypt’s ER
regime as a de facto “Stabilized Arrangement”. In 2013, the IMF reclassified
Egypt’s ER regime as a de facto “Craw-Like Arrangement” with the ER used as a
nominal anchor.
It is worth mentioning that in estimating Egypt’s exchange rate regime after
the float using EMP approach, we faced major difficulties. These difficulties
were the common three major difficulties in applying the EMP approach to
evaluating the degree of flexibility or management of a country’s exchange
12
rate policy. One is to obtain data on the country’s exchange market
intervention. Few countries make this information public. Thus, researchers
had to use reported changes in reserves as a crude proxy. At least three
problems make this an imperfect proxy. First, some increases in reserves such
as some that accompany foreign aid do not go through the market. Secondly,
interest earnings on reserves lead to increases in the stock of reserves
without intervention. Third, changes in exchange rates may lead to valuation
changes. On average these considerations lead increases in reserves to
overstate amounts of intervention and declines in reserves to understate
intervention. Thus, for example the modest increases in Egypt’s reserves in
2008 through 2010 should not be taken as indication that there was any
substantial intervention to push up the currency.
A second problem is that a country has exchange rates against many currencies
while many studies have used just the exchange rate against a major currency
such as the dollar. Fluctuations in the value of the dollar against third
currency can influence the overall degree of flexibility of a country’s
currency. Frankel and Wei (2008) and (2009) have developed an approach to
estimating the implicit weights in a country’s policies toward a basket of
currencies. This approach was extended from estimating the weights in basket
pegs to cases of greater exchange rate flexibility. However, their technique
has been less successful in in this content. We applied their approach to
Egypt during the floating rate period but results often did not make sense.
The third problem in that the EMP index of flexibility is clearly defined only
in the cases where the central bank is intervening against the wind, i.e.
accumulating reserves to hold down the rate of appreciation or using reserves
to limit depreciations. Sometimes, however, previous studies have found
reserve increases while currencies are depreciating or reserve losses when
currencies are appreciating. Egypt has been no exception. Such “wrong sign”
episodes are likely frequently due to the imperfect nature of reserve changes
as a proxy for actual intervention. Where this isn’t the case it would will
that the country was actively intervening to increase rather than reduce
13
exchange rate movements. Such actions could be interpreted either as super
flexibility or as super management.
In the previous section, we concluded that the Egyptian authorities had been
trying to limit the fluctuations of the ER of the Egyptian Pound against the
dollar as much as it can. To investigate to what extent this occurred, we
examined the behavior of the ER of the Egyptian Pound with respect to the USD
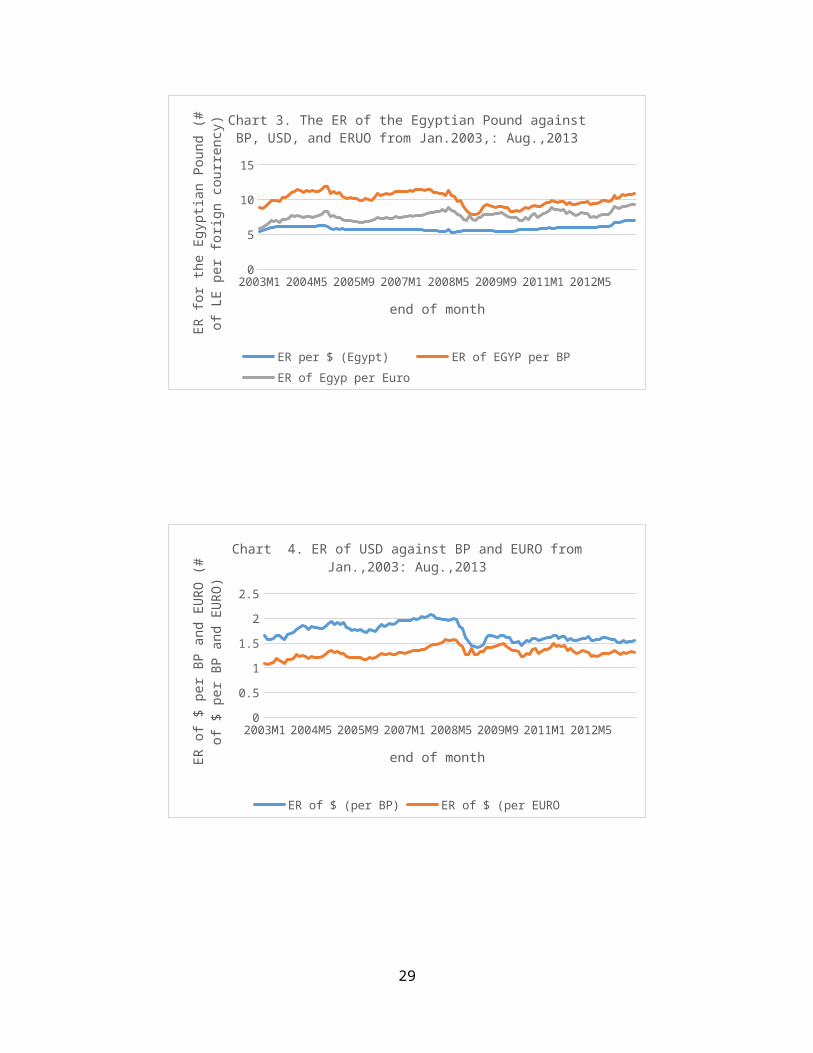
and two other main currencies, the Euro and the British Pound. Chart (3) shows
that the ER of the Egyptian Pound against the USD was fairly stable compared
with the ER of the Egyptian Pound against both the Euro and the British Pound
through the period from January 2003 to November 2012. This finding indicates
that the CBE had used the ER of the Egyptian Pound against the USD as an
implicit anchor for its monetary policy. As chart (4) shows, the ER of the USD
went through periods of depreciation and appreciation between January 2003 and
December 2012.
By comparing the ER of the Egyptian Pound against the Euro and the British
Pound during the same period, as chart (3) shows, we see that the ER of the
Egyptian Pound against these two currencies had followed almost the same
behavior of the ER of the USD against these two currencies. This finding
supports our argument of that the CBE was using the ER of the Egyptian Pound
against the dollar as an anchor for monetary policy in Egypt and allowing it
to move more flexibly against the euro and the British Pound. Another point
that supports our argument is that since the CBE adopted the new system in the
exchange market with the auctions for USDs in December 2012, the ER of the
Egyptian Pounds has fluctuated against the USD dollar and against both the
Euro and the British Pound. These movements were captured in chart (3).
In the remaining part of this section, we discuss four main shocks that faced
the Egyptian economy during the period of our study as follows.
3.1 Floating the Pound in January 2003:
In January 2003, the CBE announced the adoption of the” Free Floating ER
Regime”. As shown in Charts (1 and 7), the Egyptian Pounds lost around 20% of
its value against the USD during the month of the adoption of the new regime.
14
The ER of the Egyptian Pound increased from 4.5 LE per 1 $ to be 5.4 LE per
1$. This depreciation continued untill December 2004, when the ER for the
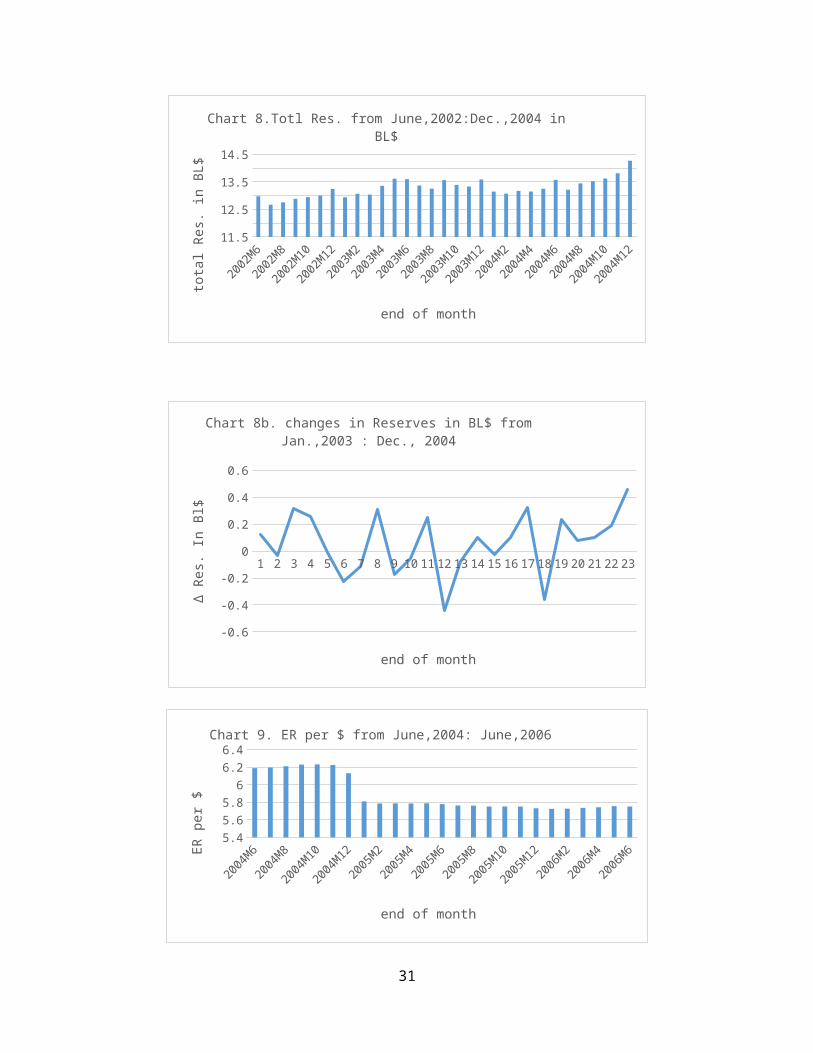
Egyptian Pound reached 6.3 LE per 1$. During this period, reserves were
fluctuating with an increasing trend. They increased from 12.9 BL$ in December
2002 to 14.3 BL$ in December 2004. As charts (3 and 4) show, the CBE during
this period was intervening to keep the ER of the Egyptian Pound against the
USD as quite stable.
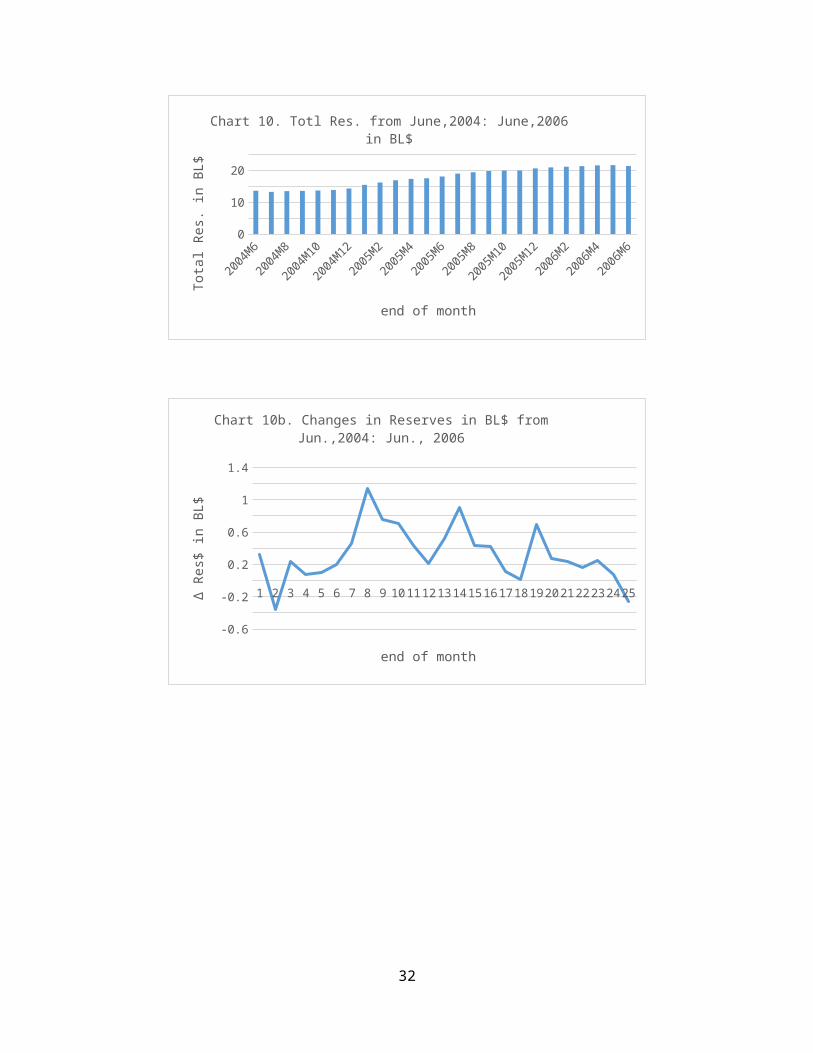
3.2 Inflation Targeting in January 2005:
In January 2005, the CBE announced its intention to adopt inflation targeting
as a nominal anchor for the monetary policy over the medium term. This step
affected the ER of the Egyptian Pound instantly. The Egyptian Pound
appreciated against the US, moving from 6.1 LE per 1$ to be 5.8 LE per 1$. As
charts (1 and 9) show, the ER of the Egyptian Pound appreciated modestly then
fluctuated within a narrow range against the USD. Once again this was not the
case for the ER of the Egyptian Pound against the Euro and the British Pound
as chart (3) shows. Chart (10) shows that reserves steadily increased from
15.4 BL$ in January 2005 to 21.3 LB$ in June 2006. This trend in reserves
continued on untill December 2010 when the reserves stock reached a record of
33.6 BL$.
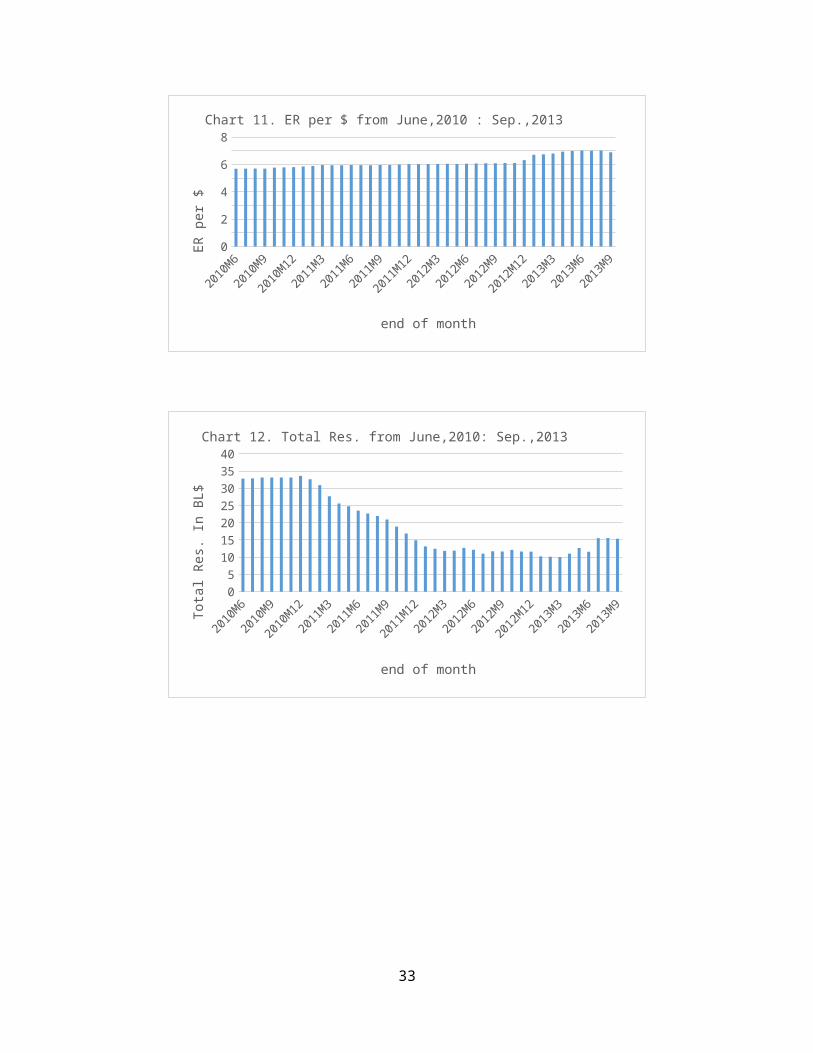
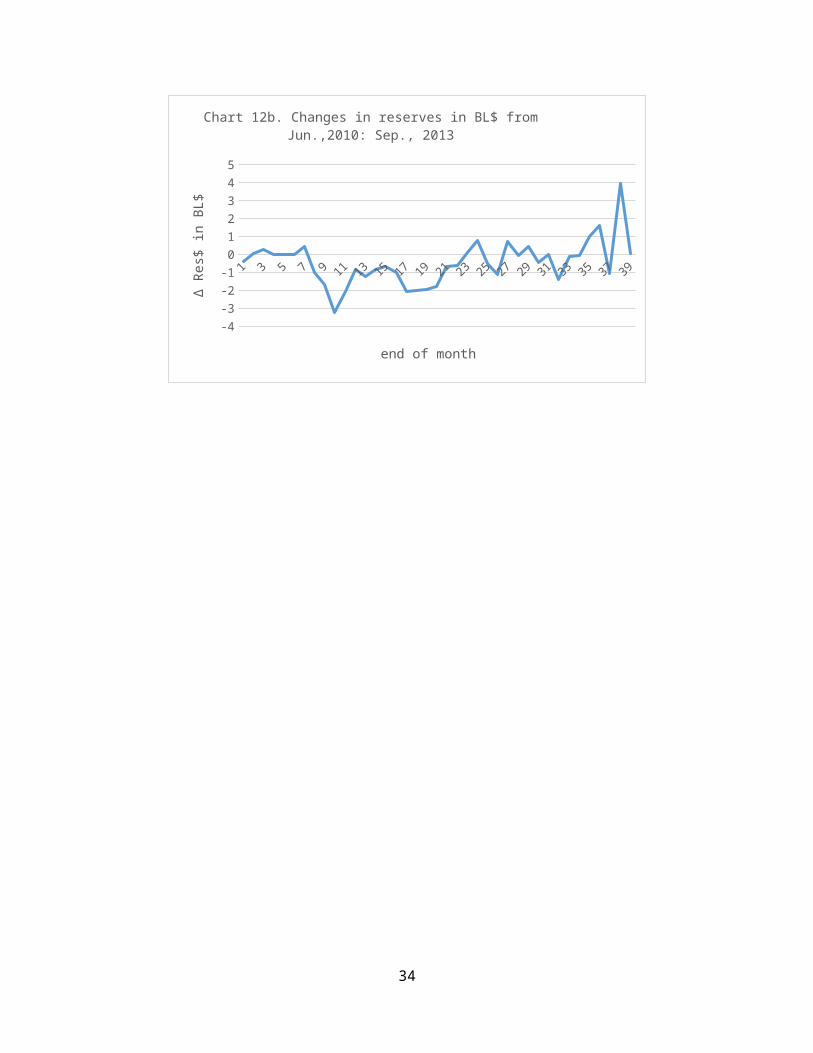
3.3 25th. Of January Revolution in 2011:
In 25th of January 2011, what is called the 25th of January revolution
erupted. As a result, Egypt has been in political and social instability.
There have been great impacts of this event on the Egyptian economy. What
happened in the exchange market was not far from what was going on in the
political scene. It might be expected that the ER of the Egyptian Pound would
depreciate substantially. Surprisingly, as shown in chart (11), this was not
the case. The ER of the Egyptian Pound against the USD was fairly stable, only
depreciating from 5.8 LE per 1$ in January 2011 to be 6.1 LE per 1$ in
November 2012. Two main things explain this behavior. First, the huge amount of
the decline that happened in reserves during this period. As chart (2) shows,
by the end of year 2012, reserves had dramatically declined to a very low
15
level indicating that the authorities had been intervening heavily to prop up
the currency. Reserves declined to 11.6 BL$ from 32.6BL$ in January 2011.
Secondly, as Chart (3) shows, during this period while the ER of the Egyptian
Pound was fairly stable against the dollar, it was fluctuating substantially
against both the British Pound and the Euro. Thus, there is a strong evidence
that the CBE had been intervening extensively to keep the ER of the Egyptian
Pound stable against the USD.
3.4 The Introduction of Auctions of USDs in December 2012.
In order to stop the huge losses of reserves and to take a step farther to put
the floating ER regime in practice, the CBE announced the adoption of a new
system of putting the USD on auction.
The quick result of the new regime was the depreciation of the Egyptian Pound
against the USD, the Euro, and the British Pound. Charts (3 and 13) show that.
4. EMP flexibility assessment of Egypt’s exchange rate regime and the IMF
classifications:
The following table shows the IMF de facto classifications of exchange rate
regime in Egypt during the period from 2003 to 2013. In columns (1 and 2), we
calculated the change in exchange rate of the Egyptian Pound against the US
dollar and the changes in the ratio of international reserves to monetary base
for each individual year from 2003 to 2013. From this table we can conclude
that the exchange rate of the Egyptian pound was managed with various degree
of flexibility against the US dollar, but has never been allowed to freely
float.
As table (1) shows, during Egypt’s floating rate period there have been a
number of such “wrong signs” but they have generally been cases where were
small. Thus, we are inclined toward interpreting most of these years such as
2003 and 2004 as ones with a high degree of flexibility. For further
discussion of this issue see Willett et al. (2011).
16
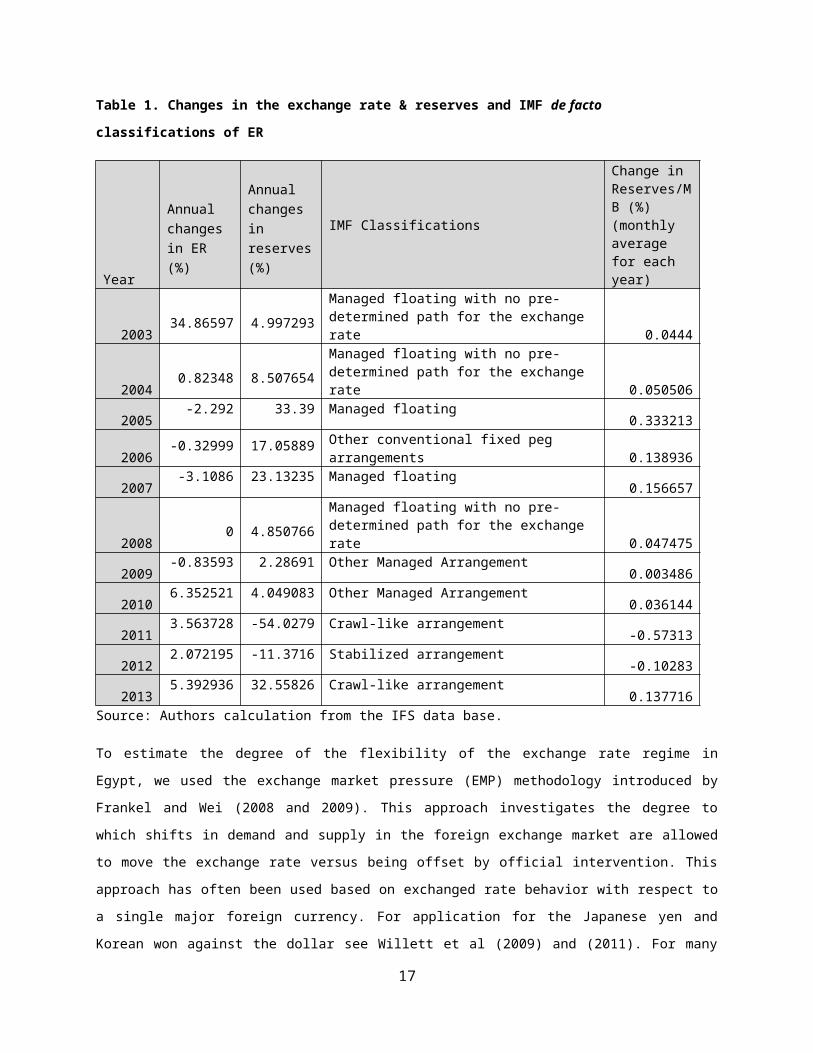
Table 1. Changes in the exchange rate & reserves and IMF de facto
classifications of ER
Year
Annual changes in ER (%)
Annual changes in reserves(%)
IMF Classifications
Change in Reserves/MB (%) (monthly average for each year)
200334.86597 4.997293
Managed floating with no pre-determined path for the exchange rate 0.0444
20040.82348 8.507654
Managed floating with no pre-determined path for the exchange rate 0.050506
2005-2.292 33.39 Managed floating
0.333213
2006-0.32999 17.05889 Other conventional fixed peg
arrangements 0.138936
2007-3.1086 23.13235 Managed floating
0.156657
20080 4.850766
Managed floating with no pre-determined path for the exchange rate 0.047475
2009-0.83593 2.28691 Other Managed Arrangement
0.003486
20106.352521 4.049083 Other Managed Arrangement
0.036144
20113.563728 -54.0279 Crawl-like arrangement
-0.57313
20122.072195 -11.3716 Stabilized arrangement
-0.10283
20135.392936 32.55826 Crawl-like arrangement
0.137716Source: Authors calculation from the IFS data base.
To estimate the degree of the flexibility of the exchange rate regime in
Egypt, we used the exchange market pressure (EMP) methodology introduced by
Frankel and Wei (2008 and 2009). This approach investigates the degree to
which shifts in demand and supply in the foreign exchange market are allowed
to move the exchange rate versus being offset by official intervention. This
approach has often been used based on exchanged rate behavior with respect to
a single major foreign currency. For application for the Japanese yen and
Korean won against the dollar see Willett et al (2009) and (2011). For many
17
countries, however, the exchange rates with respect to more than one foreign
currency may be important. To deal with this issue Frankel and Wei (2008) and
(2009) developed a methodology that includes the behavior of multiple foreign
exchange rates.
Following Frankel and Wei (2008 and 2009), we define the EMP as the percentage
change in the value of the currency plus the change in reserves as a fraction
of the monetary base. The Special Drawing Right (SDR) is used as a numeraire
following Frankel and Wei (2004, 2008, and 2009). To avoid non-stationarity
that is likely to occur in time series, the variables are used in terms of
changes rather than levels.
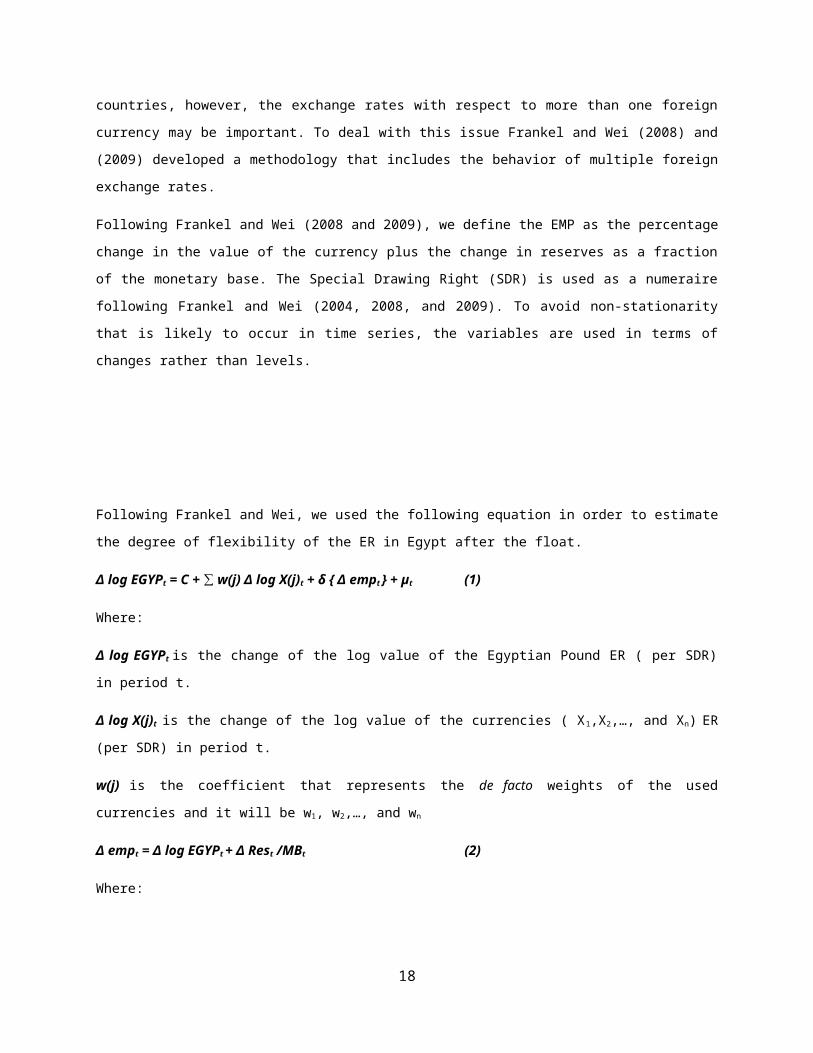
Following Frankel and Wei, we used the following equation in order to estimate
the degree of flexibility of the ER in Egypt after the float.
Δ log EGYPt = C + w(j) Δ log X(j)∑ t + δ { Δ empt } + µt (1)
Where:
Δ log EGYPt is the change of the log value of the Egyptian Pound ER ( per SDR)
in period t.
Δ log X(j)t is the change of the log value of the currencies ( X1,X2,…, and Xn) ER
(per SDR) in period t.
w(j) is the coefficient that represents the de facto weights of the used
currencies and it will be w1, w2,…, and wn
Δ empt = Δ log EGYPt + Δ Rest /MBt (2)
Where:
18
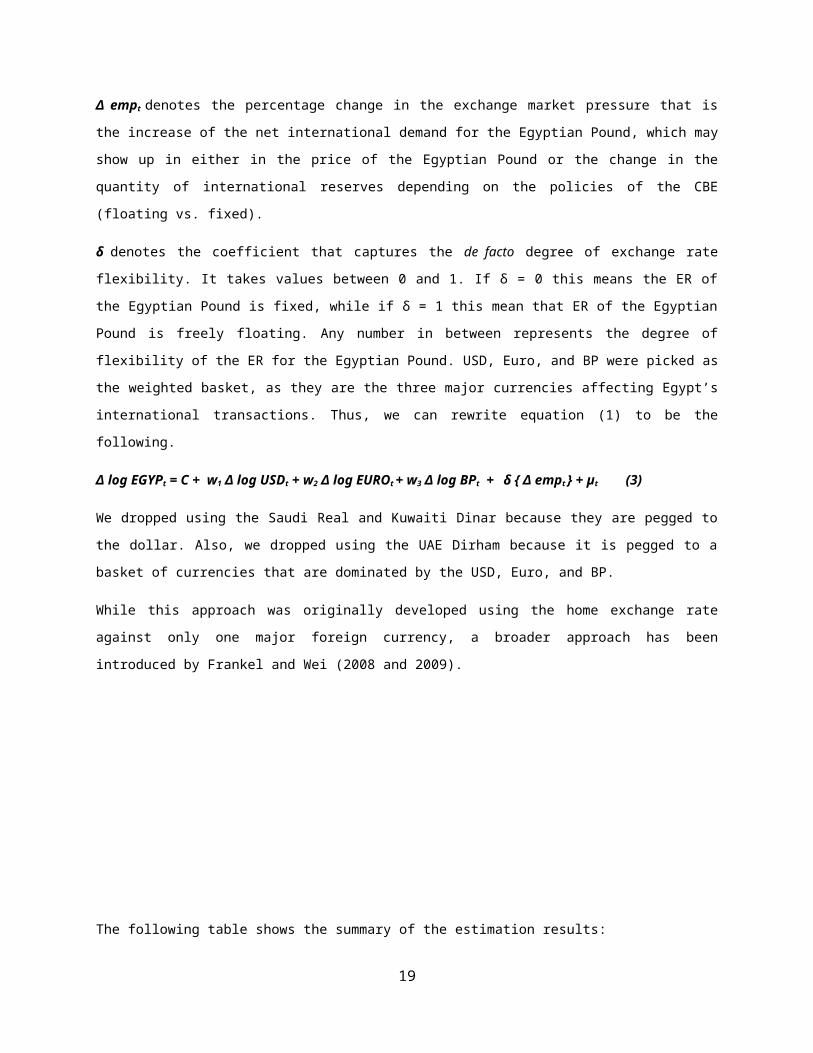
Δ empt denotes the percentage change in the exchange market pressure that is
the increase of the net international demand for the Egyptian Pound, which may
show up in either in the price of the Egyptian Pound or the change in the
quantity of international reserves depending on the policies of the CBE
(floating vs. fixed).
δ denotes the coefficient that captures the de facto degree of exchange rate
flexibility. It takes values between 0 and 1. If δ = 0 this means the ER of
the Egyptian Pound is fixed, while if δ = 1 this mean that ER of the Egyptian
Pound is freely floating. Any number in between represents the degree of
flexibility of the ER for the Egyptian Pound. USD, Euro, and BP were picked as
the weighted basket, as they are the three major currencies affecting Egypt’s
international transactions. Thus, we can rewrite equation (1) to be the
following.
Δ log EGYPt = C + w1 Δ log USDt + w2 Δ log EUROt + w3 Δ log BPt + δ { Δ empt } + µt (3)
We dropped using the Saudi Real and Kuwaiti Dinar because they are pegged to
the dollar. Also, we dropped using the UAE Dirham because it is pegged to a
basket of currencies that are dominated by the USD, Euro, and BP.
While this approach was originally developed using the home exchange rate
against only one major foreign currency, a broader approach has been
introduced by Frankel and Wei (2008 and 2009).
The following table shows the summary of the estimation results:
19
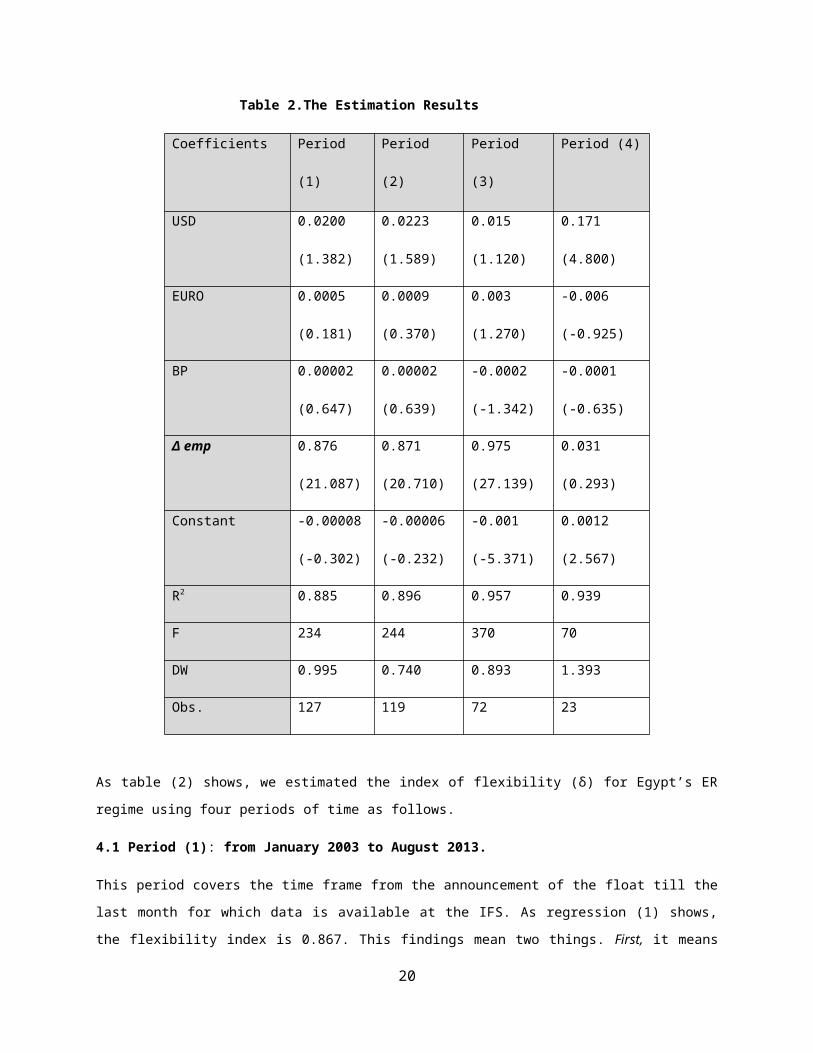
Table 2.The Estimation Results
Coefficients Period
(1)
Period
(2)
Period
(3)
Period (4)
USD 0.0200
(1.382)
0.0223
(1.589)
0.015
(1.120)
0.171
(4.800)
EURO 0.0005
(0.181)
0.0009
(0.370)
0.003
(1.270)
-0.006
(-0.925)
BP 0.00002
(0.647)
0.00002
(0.639)
-0.0002
(-1.342)
-0.0001
(-0.635)
Δ emp 0.876
(21.087)
0.871
(20.710)
0.975
(27.139)
0.031
(0.293)
Constant -0.00008
(-0.302)
-0.00006
(-0.232)
-0.001
(-5.371)
0.0012
(2.567)
R2 0.885 0.896 0.957 0.939
F 234 244 370 70
DW 0.995 0.740 0.893 1.393
Obs. 127 119 72 23
As table (2) shows, we estimated the index of flexibility (δ) for Egypt’s ER
regime using four periods of time as follows.
4.1 Period (1): from January 2003 to August 2013.
This period covers the time frame from the announcement of the float till the
last month for which data is available at the IFS. As regression (1) shows,
the flexibility index is 0.867. This findings mean two things. First, it means
20
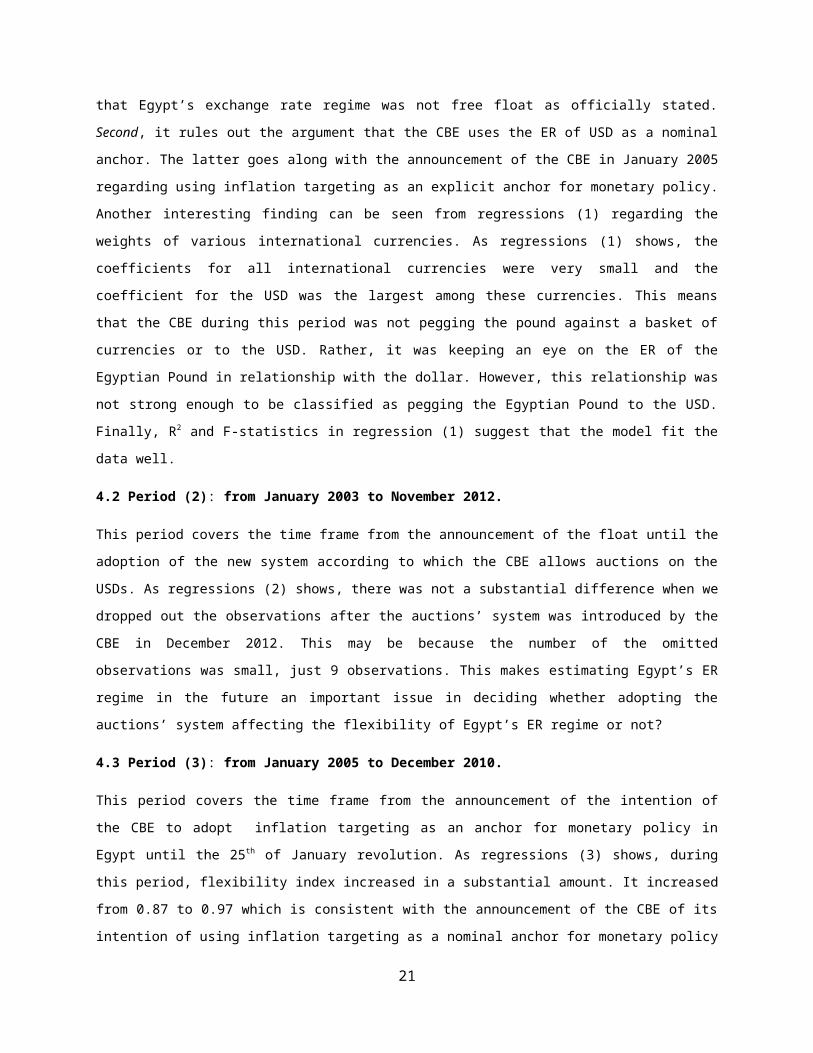
that Egypt’s exchange rate regime was not free float as officially stated.
Second, it rules out the argument that the CBE uses the ER of USD as a nominal
anchor. The latter goes along with the announcement of the CBE in January 2005
regarding using inflation targeting as an explicit anchor for monetary policy.
Another interesting finding can be seen from regressions (1) regarding the
weights of various international currencies. As regressions (1) shows, the
coefficients for all international currencies were very small and the
coefficient for the USD was the largest among these currencies. This means
that the CBE during this period was not pegging the pound against a basket of
currencies or to the USD. Rather, it was keeping an eye on the ER of the
Egyptian Pound in relationship with the dollar. However, this relationship was
not strong enough to be classified as pegging the Egyptian Pound to the USD.
Finally, R2 and F-statistics in regression (1) suggest that the model fit the
data well.
4.2 Period (2): from January 2003 to November 2012.
This period covers the time frame from the announcement of the float until the
adoption of the new system according to which the CBE allows auctions on the
USDs. As regressions (2) shows, there was not a substantial difference when we
dropped out the observations after the auctions’ system was introduced by the
CBE in December 2012. This may be because the number of the omitted
observations was small, just 9 observations. This makes estimating Egypt’s ER
regime in the future an important issue in deciding whether adopting the
auctions’ system affecting the flexibility of Egypt’s ER regime or not?
4.3 Period (3): from January 2005 to December 2010.
This period covers the time frame from the announcement of the intention of
the CBE to adopt inflation targeting as an anchor for monetary policy in
Egypt until the 25th of January revolution. As regressions (3) shows, during
this period, flexibility index increased in a substantial amount. It increased
from 0.87 to 0.97 which is consistent with the announcement of the CBE of its
intention of using inflation targeting as a nominal anchor for monetary policy
21
over the medium term. Also, R2 increased from 0.88 to 0.96 which means the
model even fits the data better.
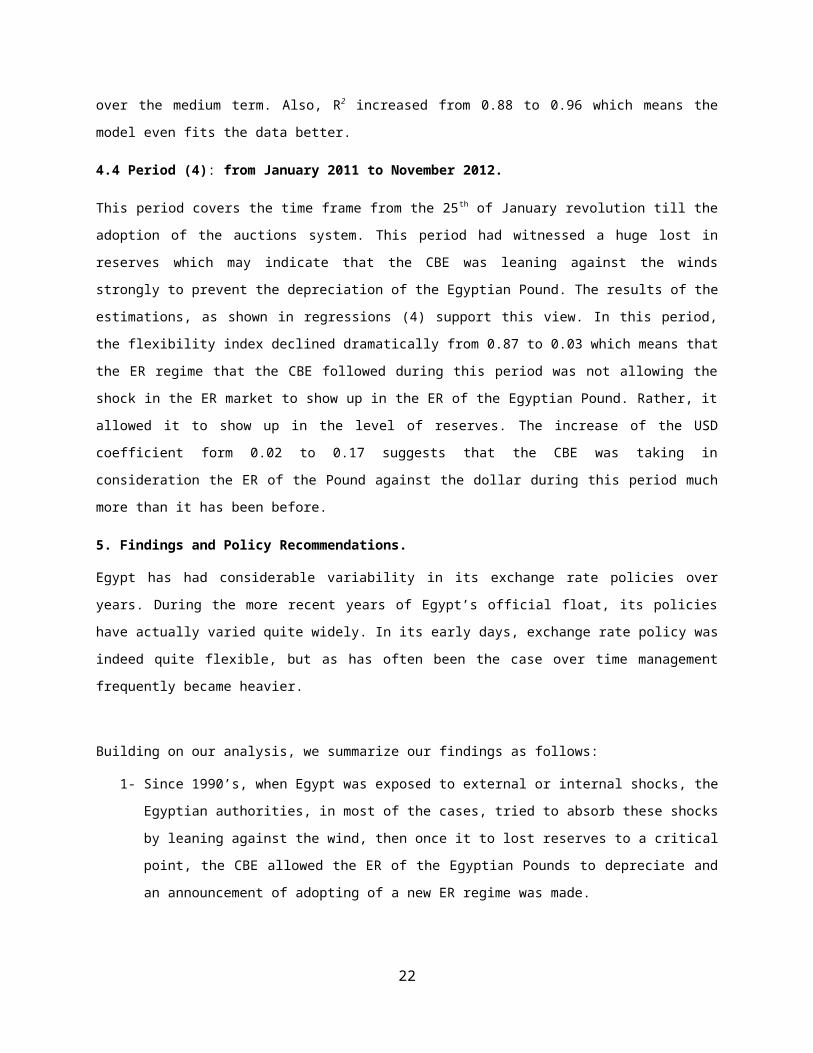
4.4 Period (4): from January 2011 to November 2012.
This period covers the time frame from the 25th of January revolution till the
adoption of the auctions system. This period had witnessed a huge lost in
reserves which may indicate that the CBE was leaning against the winds
strongly to prevent the depreciation of the Egyptian Pound. The results of the
estimations, as shown in regressions (4) support this view. In this period,
the flexibility index declined dramatically from 0.87 to 0.03 which means that
the ER regime that the CBE followed during this period was not allowing the
shock in the ER market to show up in the ER of the Egyptian Pound. Rather, it
allowed it to show up in the level of reserves. The increase of the USD
coefficient form 0.02 to 0.17 suggests that the CBE was taking in
consideration the ER of the Pound against the dollar during this period much
more than it has been before.
5. Findings and Policy Recommendations.
Egypt has had considerable variability in its exchange rate policies over
years. During the more recent years of Egypt’s official float, its policies
have actually varied quite widely. In its early days, exchange rate policy was
indeed quite flexible, but as has often been the case over time management
frequently became heavier.
Building on our analysis, we summarize our findings as follows:
1- Since 1990’s, when Egypt was exposed to external or internal shocks, the
Egyptian authorities, in most of the cases, tried to absorb these shocks
by leaning against the wind, then once it to lost reserves to a critical
point, the CBE allowed the ER of the Egyptian Pounds to depreciate and
an announcement of adopting of a new ER regime was made.
22
2- External shocks and their implications on the Egyptian economy were, in
almost all the cases, the major reason for the CBE to adopt new ER
regimes.
3- The ER of the Egyptian Pound before announcing the float, regardless the
de jure ER regime or the de facto ER that CBE put in practice, was pegged
to the USD in tighter or looser ways.
4- The de jure “Free Floating” ER Regime that the CBE announced in January,
2003 was not preserved during the period of the study. The de facto
exchange rate of the Egyptian Pound was a managed exchange rate regime
with various degree of flexibility against the US dollar, but has never
been allowed to freely float. Egypt is not the only country that has
claimed to have adopted a free float while continuing to intervene
heavily at times to limit its fluctuations. This gives another
illustration of the importance of carefully investigating the exchange
rate regimes actually being followed by countries rather than relying
exclusively on what governments state their policy to be. This finding
goes along with what Kamar and Bakardzhieva (2005) has concluded. The study
has concluded that the Egyptian authorities have always managed the
exchange regime, whether under the label of “adjustable per”, “Crawling
peg” or the de facto management of its de jure free float.
5- The move from light to heavy exchange market management in 2011 is a
source of concern. Where exchange rates are heavily managed in the face
of continuing exchange market pressures, the government begins to
generate perverse expectations similar to these that generated such
great speculative problems under adjustably pegged exchange rate
regimes. Such prolonged heavy intervention sets up what has been called
a one way speculative option. Participants don’t know if these will be a
major change in the exchange rate over the near but they do know the
direction which any major change would be. These prolonged heavy
intervention rather offsetting speculative pressures can generate even
greater ones. This appears to have been the case in Egypt.
23
6- Based on our EMP approach to analyzing the actual degree of flexibility
of exchange rate policies we found that the changes in the IMF’s de facto
classifications of Egypt’s actual exchange rate policies were broadly
accurate.
7- This study uses the official exchange rate for the Egyptian Pound
against the dollar. However, because of the instability in the foreign
exchange market in Egypt and the shortage of foreign currencies in this
market, black market existed during the study period. Since we do not
have access for the data on the exchange rate for the Egyptian Pound in
the black market, we did not consider it in our study. Thus, we
recommend further research to look at the exchange rate of the Egyptian
Pound in the black market.
There are some important policy recommendations drown out of this paper. We
advise the Egyptian authorities to do the following:
1- Over the study’s period, there were more than one exchange rate for the
Egyptian Pound. These rates are the official rate, the unofficial rate
at foreign exchange companies, and the unofficial rate in the black
market. The Egyptian authorities must take all measures that ensure a
unified exchange rate for the pound. We believe that only lightly
managed floating is the most reasonable means to achieve a unified
exchange rate for the pound.
2- We also have concern that too much attention has been paid to the US
dollar in setting exchange rate policies. Clearly, the exchange rate
against the dollar is the most important exchange rate, but several
other currencies are also important for Egypt’s international
transactions. Since the dollar exchange rate sometimes moves
substantially against some of these other currencies such as the Euro,
it is important that such fluctuations should also be taken into
account.
24
Thus, if the Egyptian authorities have to intervene in the foreign
exchange market to stabilize the exchange rate for the Egyptian Pound,
it should not only intervene against the dollar. Rather, they should
consider other major currencies that are important in the international
transactions for Egypt.
3. Exchange rate policy should more consistently follow a lightly
managed float. There are times when it is appropriate for the central
bank to intervene in the foreign exchange market to smooth exchange rate
fluctuations and help maintain an orderly foreign exchange market. As
noted above, however, continued high levels of intervention can lead to
overvalued exchange rates that result in destabilizing rather than
stabilizing the market. Thus, excessively heavy management of the
exchange rate can prove to be highly disruptive, as recent events have
shown.
References
[1] Cavoli, T. and R., Rajan (2010). A Note on Exchange Rate Regimes in Asia:
Are They Really What They Claim to Be? Economics Bulletin, Vol.4 no 4, 2864-2876.
[2] Calvo, G. and C., Reinhart (2002). Fear of Floating. Quarterly Journal of
Economics CXVII, 379-409.
[3] El-Ramly, H. and S. Abdel-Haleim (2008). The Effect of Devaluation on
Output in the Egyptian Economy: A Vector Autoregression Analysis. International
Research Journal of Finance and Economics.
[4] Frankel, J. (2009). New Estimation of China’s Exchange Rate Regime. Pacific
Economic Review 14:3.
[5] Frankel, J. and S., Wei (2008). Estimating of De Facto Exchange Rate
Regimes: Synthesis of the Techniques for Inferring Flexibility and Basket
Weights. NBER Working Paper Series, WB14016.
25
[6] Girton, L. and Roper, D. (1977). A Monetary Model of Exchange Market
Pressure Applied to the Postwar Canadian Experience. American Economic Review
September, 537-548.
[7] Kamar, B. and D., Bakardzhieva (2005). Economic Trilemma and Exchange Rate
Management in Egypt. Review of The Middle East Economics and Finance Vol.3 no.2.
[8] Levy-Yeyati, E. and F., Sturzenegger (2005). Classifying Exchange Rate
Regimes: Deeds vs. Words. European Economic Review49, 1603-1635.
[9] Seliem, H. (2010). Has Egypt’s Monetary Policy Changed After the Float?
EconPapers no.543, Economic Research Forum.
[10] Reinhart, C. and K., Rogoff (2004). The Modern History of Exchange Rate
Arrangements: A Reinterpretation. Quarterly Journal of Economics 119, 1-48.
[11] Weymark, D. (1995). Estimating exchange market pressure and the degree of
exchange market pressure for Canada. Journal of International Economics 39, 273-295.
[12] Weymark, D. (1997). Measuring the Degree of Exchange Rate Market
Intervention in a Small Open Economy. Journal of International Money and Finance 16, 55-79.
[13] Weymark, D. (1998). A General Approach to Measuring Exchange Market
Pressure. Oxford Economic Papers 50, 106-121.
[14] Willett, T., et al. (2012). Measuring Exchange Rate Flexibility: A Two-Parameter Market Pressure Approach. Global Journal of Economics, 2012, Vol. 1
[15] Willett, T., Chiu, M. P., Dechsakulthorn, S., Ghosh, R., Kibesse, B.,
Kim, K., Kim, Y, and Ouyang, A. (2011). Classifying international aspects of
currency regimes. Journal of Financial Economic Policy 3, 288-303.
26
[16] Willett, T. and Kim, Y. (2006). Korea’s Post Crisis Exchange Rate
Policy. Korea’s Economy 2006, 5-15.
[17] Willett, T., Nitithanprapas, E., Nitithanprapas, I., and Rongala, S.
(2005). The Asian Crises Reexamined. Asian Economic Papers 3, 32-87.
[18] Willett, T. (2003). Fear of Floating Needn’t Imply Fixed Rates: Feasible
Options for Intermediate Exchange Rate Regimes. Open Economies Review 14, 71-91.
Appendix (1)
Table (1) IMF classification of Egypt ER regime
Year IMF Egypt ER regimes’ classification2013 Crawl-like arrangement2012 Stabilized arrangement2011 Crawl-like arrangement2010 Other Managed Arrangement2009 Other Managed Arrangement2008 Managed floating with no pre-determined path for the
exchange rate2007 Managed floating2006 Other conventional fixed peg arrangements2005 Managed floating2004 Managed floating with no pre-determined path for the
exchange rate2003 Managed floating with no pre-determined path for the
exchange rate2002 “Pre announced horizontal band that is narrower than
or equal to +/-2%”2000-2001 “Pre announced horizontal band that is narrower than
or equal to +/-2%”1999 Pre announced horizontal band that is narrower than or
equal to +/-2%
27
1991-1998 Conventional Fixed Peg“Pre announced horizontal band that is narrower than
or equal to +/-2%”1970-1990 De facto peg
Notice: data from 1970 to 2002 was taken from: Carmen M. Reinhart and Kenneth S. Rogoff (2014). “This Time is Different: Eight Centuries of Financial Folly.” Princeton University Press.
1990
1992
1994
1996
1998
2000
2002
2004
2006
2008
2010
2012
02468
Chart 1. Annual ER per $ from 1990:2012
end of year
ER p
er $
1990
1992
1994
1996
1998
2000
2002
2004
2006
2008
2010
2012
0
20
40Chart 2. Total Res. from 1990:2012 in BL$
end of yearTota
l Re
s. i
n BL
$
28
2003M1 2004M5 2005M9 2007M1 2008M5 2009M9 2011M1 2012M50
5
10
15
Chart 3. The ER of the Egyptian Pound against BP, USD, and ERUO from Jan.2003,: Aug.,2013
ER per $ (Egypt) ER of EGYP per BPER of Egyp per Euro
end of month
ER f
or t
he E
gypt
ian Po
und
(#
of L
E pe
r fo
rign
cou
rren
cy)
2003M1 2004M5 2005M9 2007M1 2008M5 2009M9 2011M1 2012M50
0.5
1
1.5
2
2.5
Chart 4. ER of USD against BP and EURO from Jan.,2003: Aug.,2013
ER of $ (per BP) ER of $ (per EURO
end of monthER o
f $
per
BP a
nd EUR
O (#
of $
per
BP
and
EURO
)
29
2000M1
2000M4
2000M7
2000M10
2001M1
2001M4
2001M7
2001M10
2002M1
2002M4
2002M7
2002M10
0
2
4
Chart 5. ER per $ from Jan.,2000: Dec.,2002
end of month
ER p
er $
2000M1
2000M4
2000M7
2000M10
2001M1
2001M4
2001M7
2001M10
2002M1
2002M4
2002M7
2002M10
11.512
12.513
13.514
14.5
Chart 6. Total Res. from Jan.,2000:Dec., 2002 in BL$
end of month
Tota
l Re
s. i
n BL
$
2002M6
2002M8
2002M10
2002M12
2003M2
2003M4
2003M6
2003M8
2003M10
2003M12
2004M2
2004M4
2004M6
2004M8
2004M10
2004M12
0
2
4
6
Chart 7. ER per $ from June,2002: Dec.,2004
end of month
ER p
er $
30
2002M6
2002M8
2002M10
2002M12
2003M2
2003M4
2003M6
2003M8
2003M10
2003M12
2004M2
2004M4
2004M6
2004M8
2004M10
2004M12
11.5
12.5
13.5
14.5
Chart 8.Totl Res. from June,2002:Dec.,2004 in BL$
end of month
tota
l Re
s. i
n BL
$
1 2 3 4 5 6 7 8 9 10 11 12 13 14 15 16 17 18 19 20 21 22 23
-0.6
-0.4
-0.2
0
0.2
0.4
0.6
Chart 8b. changes in Reserves in BL$ from Jan.,2003 : Dec., 2004
end of month
Δ Re
s. I
n Bl
$
2004M6
2004M8
2004M10
2004M12
2005M2
2005M4
2005M6
2005M8
2005M10
2005M12
2006M2
2006M4
2006M6
5.45.65.86
6.26.4
Chart 9. ER per $ from June,2004: June,2006
end of month
ER p
er $
31
2004M6
2004M8
2004M10
2004M12
2005M2
2005M4
2005M6
2005M8
2005M10
2005M12
2006M2
2006M4
2006M6
0
10
20
Chart 10. Totl Res. from June,2004: June,2006 in BL$
end of month
Tota
l Re
s. i
n BL
$
1 2 3 4 5 6 7 8 9 10111213141516171819202122232425
-0.6
-0.2
0.2
0.6
1
1.4
Chart 10b. Changes in Reserves in BL$ from Jun.,2004: Jun., 2006
end of month
Δ Re
s$ i
n BL
$
32
2010M6
2010M9
2010M12
2011M3
2011M6
2011M9
2011M12
2012M3
2012M6
2012M9
2012M12
2013M3
2013M6
2013M9
0
2
4
6
8Chart 11. ER per $ from June,2010 : Sep.,2013
end of month
ER p
er $
2010M6
2010M9
2010M12
2011M3
2011M6
2011M9
2011M12
2012M3
2012M6
2012M9
2012M12
2013M3
2013M6
2013M9
0510152025303540
Chart 12. Total Res. from June,2010: Sep.,2013
end of month
Tota
l Re
s. I
n BL
$
33
1 3 5 7 9 11 13 15 17 19 21 23 25 27 29 31 33 35 37 39
-4-3-2-1012345
Chart 12b. Changes in reserves in BL$ from Jun.,2010: Sep., 2013
end of month
Δ Re
s$ i
n BL
$
34