Ex-Post Monitoring of Japanese ODA Loan Projects in FY ...
168
Ex-Post Monitoring of Japanese ODA Loan Projects in FY 2012 Report JUNE 2013 JAPAN INTERNATIONAL COOPERATION AGENCY NAKAMOTO & ASSOCIATES CO.LTD. EV JR 13-09
-
Upload
khangminh22 -
Category
Documents
-
view
0 -
download
0
Transcript of Ex-Post Monitoring of Japanese ODA Loan Projects in FY ...
Ex-Post Monitoring of Japanese ODA Loan Projects in FY 2012
Report
JUNE 2013
JAPAN INTERNATIONAL COOPERATION AGENCY
NAKAMOTO & ASSOCIATES CO.LTD.
EV JR
13-09


Preface
Ex-post evaluation of ODA projects has been in place since 1975, and since then its coverage has gradually expanded. Japan’s ODA charter revised in 2003 clearly states under the section “Enhancement of Evaluation” that in order to measure, analyze and objectively evaluate the outcome of ODA, third-party evaluations by experts shall be enhanced. Ex-post monitoring is usually conducted seven years after the completion of ODA Loan projects and five years after Ex-post Evaluation if there is any concern in project effectiveness and sustainability based on the results of the ex-post evaluation. The aim of this exercise is to re-verify the project’s effectiveness, impact, and sustainability, to monitor the extent to which recommendations drawn from the ex-post evaluation are being applied, and to obtain recommendations and lessons learned for the future projects to sustain their impact and to improve themselves as a whole. This time, 9 projects in different countries were monitored by external consultants, and this report is a compilation of all the results obtained. Now that this report is completed, we are determined to share the lessons and recommendations drawn with those who are concerned in and out of JICA, and utilize them to improve the management of ODA projects in the future. Finally, I wish to express my sincere appreciation to all the people who kindly cooperated with us to implement this exercise.
June 2013
Masato Watanabe Vice President
Japan International Cooperation Agency (JICA)

Disclaimer
This report is an English translation of the original report in Japanese, which is a compilation of the results from Ex-post monitoring in Japanese fiscal year 2012. Monitoring was implemented by external consultants entrusted by JICA, in order to improve the neutrality of the results. The views and recommendations expressed in this report do not necessarily reflect the official view and opinion of JICA. Minor amendments to the original report may be added when it is posted on the official website of JICA. The Japanese version shall prevail in the event of any inconsistency with the English translation. No part of this report may be copied or reprinted without the consent of JICA.

Table of Contents
Preface
Disclaimer
Table of Contents
Thailand “Regional Development Project (II)”
1. Project Description ................................................................................................................... 1-1 1.1 Project Objective ................................................................................................................. 1-1 1.2 Outline of the Loan Agreement ........................................................................................... 1-1 1.3 Background of Ex-post Monitoring .................................................................................... 1-2
2. Outline of the Monitoring Study ............................................................................................... 1-3 2.1 External Monitoring Consultant .......................................................................................... 1-3 2.2 Duration of Monitoring Study ............................................................................................. 1-3
3. Monitoring Results ................................................................................................................... 1-3 3.1 Effectiveness ....................................................................................................................... 1-3
3.1.1 Quantitative Effects...................................................................................................... 1-3 3.1.1.1 Results from Operation and Effect Indicators ....................................................... 1-3 3.1.1.2 Internal Rates of Return (IRR) .............................................................................. 1-7
3.1.2 Qualitative Effects........................................................................................................ 1-7 3.2 Impact ............................................................................................................................... 1-10
3.2.1 Intended Impacts ........................................................................................................ 1-10 3.2.1.1 Foreign Currency Reserve .................................................................................. 1-10 3.2.1.2 Reduction of Regional Disparities through Employment Creation in Rural Areas
........................................................................................................................................ 1-11 3.2.1.3 Tourism Data of Chiang Rai................................................................................ 1-11
3.2.2 Other Impacts ............................................................................................................. 1-12 3.2.2.1 Improvement in the Lives of Farmers ................................................................. 1-12 3.2.2.2. Contribution to the Development of the Region and the Tourism Industry ....... 1-12
3.3 Sustainability .................................................................................................................... 1-13 3.3.1 Structural Aspects of Operation and Maintenance ..................................................... 1-13 3.3.2 Technical Aspects of Operation and Maintenance ..................................................... 1-13 3.3.3 Financial Aspects of Operation and Maintenance ...................................................... 1-13 3.3.4 Current Status of Operation and Maintenance ........................................................... 1-13
3.4 Others ................................................................................................................................ 1-14 4. Conclusion, Lessons Learned and Recommendations ............................................................ 1-14

4.1 Conclusion ........................................................................................................................ 1-14 4.2 Recommendations ............................................................................................................. 1-15 4.3 Lessons Learned................................................................................................................ 1-15
Comparison of the Original and Actual Scope of the Project ..................................................... 1-16
Philippines "Special Economic Zones Environment Management Project"
1. Project Description ................................................................................................................... 2-1 1.1 Project Objective ................................................................................................................. 2-1 1.2 Outline of the Loan Agreement ........................................................................................... 2-1 1.3 Background of Ex-post Monitoring .................................................................................... 2-2
2. Outline of the Monitoring Study ............................................................................................... 2-2 2.1 Duration of Monitoring Study ............................................................................................. 2-2
3. Monitoring Results ................................................................................................................... 2-3 3.1 Effectiveness ....................................................................................................................... 2-3
3.1.1 Quantitative Effects...................................................................................................... 2-3 3.1.1.1 Results from Operation and Effect Indicators ....................................................... 2-3 3.1.1.2 Results of Calculations of Internal Rates of Return (IRR) .................................... 2-7
3.1.2 Qualitative Effects........................................................................................................ 2-7 3.2 Impact ................................................................................................................................. 2-7
3.2.1 Intended Impacts .......................................................................................................... 2-7 3.2.1.1 Number of locators................................................................................................ 2-7 3.2.1.2 Investments from Locators .................................................................................... 2-8 3.2.1.3 Employment in the ECOZONEs ........................................................................... 2-9
3.2.2. Other Impacts .............................................................................................................. 2-9 3.2.2.1 Social and Environmental Impact ......................................................................... 2-9 3.2.2.2 Land Acquisition, Relocation .............................................................................. 2-10
3.3 Sustainability .................................................................................................................... 2-10 3.3.1 Structural Aspects of Operation and Maintenance ..................................................... 2-10 3.3.2 Technical Aspects of Operation and Maintenance ..................................................... 2-10 3.3.3 Financial Aspects of Operation and Maintenance ...................................................... 2-11 3.3.4 Current Status of Operation and Maintenance ........................................................... 2-13
4. Conclusion, Lessons Learned and Recommendations ............................................................ 2-13 4.1 Conclusion ........................................................................................................................ 2-13 4.2 Recommendations ............................................................................................................. 2-14 4.3 Lessons Learned................................................................................................................ 2-14
Comparison of the Original and Actual Scope of the Project ..................................................... 2-15
Tunisia "Treated Sewage Irrigation Project"
1. Project Description ................................................................................................................... 3-1 1.1 Project Objective ................................................................................................................. 3-1 1.2 Outline of the Loan agreement ............................................................................................ 3-1 1.3 Background of the Ex-Post Monitoring .............................................................................. 3-2
2. Outline of the Monitoring Study ............................................................................................... 3-2 2.1 External Monitoring Consultants ........................................................................................ 3-2 2.2 Duration of Monitoring Study ............................................................................................. 3-2 2.3 Constraints of the Monitoring Study ................................................................................... 3-3
3. Results of the study ................................................................................................................... 3-3 3.1 Effectiveness ....................................................................................................................... 3-3
3.1.1 Quantitative effects ...................................................................................................... 3-3 3.1.1.1 Results from Operation and Effect Indicators ....................................................... 3-3 3.1.1.2 Result of calculations of Internal Rates of Return (IRR) .................................... 3-13
3.1.2 Qualitative effects ...................................................................................................... 3-13 3.2 Impact ............................................................................................................................... 3-13
3.2.1 Intended Impacts ........................................................................................................ 3-13 3.2.1.1 Economic impact................................................................................................. 3-13 3.2.1.2 Social impact ....................................................................................................... 3-14
3.2.2 Other Positive or Negative Impacts ........................................................................... 3-15 3.2.2.1 Awareness for Vaccination and Protective Clothing. .......................................... 3-15 3.2.2.2 Impact on the natural environment ..................................................................... 3-15 3.2.2.3 Removal of settlers and lands acquisition ........................................................... 3-16
3.3 Sustainability .................................................................................................................... 3-16 3.3.1 Structural aspect of operation and maintenance ......................................................... 3-16 3.3.2 Technical aspects of operation and maintenance ....................................................... 3-17 3.3.3 Financial aspects of operation and maintenance ........................................................ 3-18 3.3.4 Actual status of operation and maintenance ............................................................... 3-20
3.4 Others ................................................................................................................................ 3-21 4. Conclusions, lessons learned and recommendations .............................................................. 3-22
4.1 Conclusions ....................................................................................................................... 3-22 4.2 Recommendations ............................................................................................................. 3-22
4.2.1 Recommendations to the Ministry of Agriculture ...................................................... 3-22 4.3 Lessons learned ................................................................................................................. 3-23
Comparison of the Original and Actual Scope of the Project ..................................................... 3-24

Tunisia “Irrigation Perimeters Improvement Project in Oasis"
1. Project Description ................................................................................................................... 4-1 1.1 Project Objective ................................................................................................................. 4-1 1.2 Outline of the Loan Agreement ........................................................................................... 4-1 1.3 Background of Ex-Post Monitoring .................................................................................... 4-2
2. Outline of the Monitoring Study ............................................................................................... 4-2 2.1 External Monitoring Consultants ........................................................................................ 4-2 2.2 Duration of Monitoring Study ............................................................................................. 4-2 2.3 Constraints of the Monitoring Study ................................................................................... 4-3
3. Monitoring Results ................................................................................................................... 4-3 3.1 Effectiveness ....................................................................................................................... 4-3
3.1.1 Quantitative Effects...................................................................................................... 4-3 3.1.1.1 Results from Operation and Effect Indicators ....................................................... 4-3 3.1.1.2 Results of Calculations of Internal Rates of Return (IRR) .................................... 4-6
3.1.2 Qualitative Effects........................................................................................................ 4-6 3.2 Impact ................................................................................................................................. 4-7
3.2.1 Intended Impacts .......................................................................................................... 4-7 3.2.2 Other Impacts ............................................................................................................... 4-8
3.2.2.1 Environmental Impact ........................................................................................... 4-8 3.2.2.2 Impact to Surrounding Regions ............................................................................ 4-9 3.2.2.3 Land Acquisition, Relocation ................................................................................ 4-9
3.3 Sustainability .................................................................................................................... 4-10 3.3.1 Structural Aspects of Operation and Maintenance ..................................................... 4-10
3.3.1.1 CRDA ................................................................................................................. 4-10 3.3.1.2 GDA .................................................................................................................... 4-11
3.3.2 Technical Aspects of Operation and Maintenance ..................................................... 4-12 3.3.2.1 CRDA ................................................................................................................. 4-12 3.3.2.2 GDA .................................................................................................................... 4-13 3.3.2.3 Ministry of Agriculture ....................................................................................... 4-13
3.3.3 Financial Aspects of Operation and Maintenance ...................................................... 4-13 3.3.3.1 CRDA ................................................................................................................. 4-13 3.3.3.2 GDA .................................................................................................................... 4-14 3.3.3.3 Ministry of Agriculture ....................................................................................... 4-16
3.3.4 Current Status of Operation and Maintenance ........................................................... 4-16 4. Conclusion, Lessons Learned and Recommendations ............................................................ 4-17
4.1 Conclusion ........................................................................................................................ 4-17 4.2 Recommendations ............................................................................................................. 4-17 4.3 Lessons Learned................................................................................................................ 4-17
Comparison of the Original and Actual Scope of the Project ..................................................... 4-18
Tunisia "Barbara Irrigation Project"
1. Project Description ................................................................................................................... 5-1 1.1 Project Objective ................................................................................................................. 5-1 1.2 Outline of Loan Agreement................................................................................................. 5-1 1.3 Background of Ex-post Monitoring .................................................................................... 5-2
2. Outline of the Monitoring Study ............................................................................................... 5-2 2.1 External Monitoring Consultants ........................................................................................ 5-2 2.2 Duration of Monitoring Study ............................................................................................. 5-2 2.3 Constraints of the Monitoring Study ................................................................................... 5-2
3. Monitoring Results ................................................................................................................... 5-3 3.1 Effectiveness ....................................................................................................................... 5-3
3.1.1 Quantitative Effects...................................................................................................... 5-3 3.1.1.1 Results from Operation and Effect Indicators ....................................................... 5-3 3.1.1.2 Results of Calculations of Internal Rates of Return (IRR) .................................. 5-8
3.1.2 Qualitative Effects........................................................................................................ 5-8 3.2 Impact ................................................................................................................................. 5-8
3.2.1 Intended Impacts .......................................................................................................... 5-8 3.2.1.1 Social and Environmental Impact ......................................................................... 5-8 3.2.1.2 Impact on Job Creation ......................................................................................... 5-8 3.2.1.3 Annual Income from Farming ............................................................................... 5-9 3.2.1.4 Asset Ownership of Rural Households ................................................................. 5-9
3.2.2 Other Impacts ............................................................................................................... 5-9 3.2.2.1 Organizational Impact ........................................................................................... 5-9 3.2.2.2 Resettlement and Land Acquisition ...................................................................... 5-9 3.2.2.3 Salt Damage .......................................................................................................... 5-9
3.3 Sustainability .................................................................................................................... 5-10 3.3.1 Structural Aspects of Operation and Maintenance ..................................................... 5-10
3.3.1.1 CRDA ................................................................................................................. 5-10 3.3.1.2 GDA .................................................................................................................... 5-10
3.3.2 Technical Aspects of Operation and Maintenance ..................................................... 5-11 3.3.2.1 CRDA ................................................................................................................. 5-11
3.3.2.2 GDA .................................................................................................................... 5-11 3.3.2.3 External Support ................................................................................................. 5-11
3.3.3 Financial Aspects of Operation and Maintenance ...................................................... 5-12 3.3.3.1 CRDA ................................................................................................................. 5-12 3.3.3.2 GDA .................................................................................................................... 5-13
3.3.4 Current Status of Operation and Maintenance ........................................................... 5-14 3.4 Others ................................................................................................................................ 5-14
3.4.1 Follow-up of Lessons Learned ................................................................................... 5-14 3.4.2 Follow-up of Recommendations ................................................................................ 5-15
4. Conclusion, Lessons Learned and Recommendations ............................................................ 5-15 4.1 Conclusion ........................................................................................................................ 5-15 4.2 Recommendations ............................................................................................................. 5-15
4.2.1 Recommendations to the Ministry of Agriculture ...................................................... 5-15 4.3 Lessons Learned................................................................................................................ 5-16
Comparison of the Original and Actual Scope of the Project ..................................................... 5-17
Jordan "Second Human Resources Development Sector Investment"
1. Project Description ................................................................................................................... 6-1 1.1 Project Objective ................................................................................................................. 6-1 1.2 Outline of the Loan Agreement ........................................................................................... 6-1 1.3 Background of Ex-post Monitoring .................................................................................... 6-2
2. Outline of the Monitoring Study ............................................................................................... 6-2 2.1 External Monitoring Consultants ........................................................................................ 6-2 2.2 Duration of Monitoring Study ............................................................................................. 6-2
3. Monitoring Results ................................................................................................................... 6-3 3.1 Effectiveness ....................................................................................................................... 6-3
3.1.1 Quantitative Effects...................................................................................................... 6-3 3.1.1.1 Operation and Effect Indicators ............................................................................ 6-3 3.1.1.2 Internal Rates of Return (IRR) ............................................................................ 6-14
3.1.2 Qualitative Effects...................................................................................................... 6-14 3.2 Impact ............................................................................................................................... 6-15
3.2.1 Intended Impacts ........................................................................................................ 6-15 3.2.1.1 Improvement of the Balance of Payments and Foreign Currency ...................... 6-15 3.2.1.2 Industrial structure .............................................................................................. 6-15 3.2.1.3 Women's Advance into Society ........................................................................... 6-15 3.2.1.4 Social Stability .................................................................................................... 6-15

3.2.1.5 Regional development ......................................................................................... 6-15 3.2.2 Other Impacts ............................................................................................................. 6-15
3.3 Sustainability .................................................................................................................... 6-16 3.3.1 Structural Aspects of Operation and Maintenance ..................................................... 6-16 3.3.2 Technical Aspects of Operation and Maintenance ..................................................... 6-17 3.3.3 Financial Aspects of Operation and Maintenance ...................................................... 6-17
3.4 Others ................................................................................................................................ 6-18 4. Conclusion, Lessons Learned and Recommendations ............................................................ 6-18
4.1 Conclusion ........................................................................................................................ 6-18 4.2 Recommendations ............................................................................................................. 6-19
4.2.1 Recommendations to the implementing agency......................................................... 6-19 4.3 Lessons Learned................................................................................................................ 6-19
Comparison of the Original and Actual Scope of the Project ..................................................... 6-20
South Africa "Kwandebele Region Water Augmentation Project"
1. Project Description ................................................................................................................... 7-1 1.1 Project Objective ................................................................................................................. 7-1 1.2 Outline of the Loan Agreement ........................................................................................... 7-1 1.3 Background of Ex-post Monitoring .................................................................................... 7-1
2. Outline of the Monitoring Study ............................................................................................... 7-3 2.1 External Monitoring Consultant .......................................................................................... 7-3 2.2 Duration of Monitoring Study ............................................................................................. 7-3 2.3 Constraints during the Monitoring Study ............................................................................ 7-3
3. Monitoring Results ................................................................................................................... 7-4 3.1 Effectiveness ....................................................................................................................... 7-4
3.1.1 Quantitative Effects...................................................................................................... 7-4 3.1.1.1 Results from Operation and Effect Indicators ....................................................... 7-4 3.1.1.2 Results of Calculations of Internal Rates of Return (IRR) .................................... 7-7
3.1.2 Qualitative Effects........................................................................................................ 7-7 3.2 Impact ................................................................................................................................. 7-7
3.2.1 Intended Impacts .......................................................................................................... 7-7 3.2.1.1 Improvement of Living Conditions ....................................................................... 7-7
3.2.2 Other Impacts ............................................................................................................... 7-9 3.2.2.1 Environmental Impact ........................................................................................... 7-9
3.3 Sustainability ...................................................................................................................... 7-9 3.3.1 Structural Aspects of Operation and Maintenance ....................................................... 7-9
3.3.2 Technical Aspects of Operation and Maintenance ..................................................... 7-11 3.3.3 Financial Aspects of Operation and Maintenance ...................................................... 7-11 3.3.4 Current Status of Operation and Maintenance ........................................................... 7-12
3.4 Others ................................................................................................................................ 7-12 4. Conclusion, Lessons Learned and Recommendations ............................................................ 7-13
4.1 Conclusion ........................................................................................................................ 7-13 4.2 Recommendations ............................................................................................................. 7-13
4.2.1 Recommendation to WSA ......................................................................................... 7-13 4.2.2 Recommendation to DWAF and the government of South Africa ............................. 7-14
4.3 Lessons Learned................................................................................................................ 7-14 Comparison of the Original and Actual Scope of the Project ..................................................... 7-15
Zimbabwe "Matabeleland Telecommunications Network Development Project"
1. Project Description ................................................................................................................... 8-1 1.1 Project Objective ................................................................................................................. 8-1 1.2 Outline of the Loan Agreement ........................................................................................... 8-1 1.3 Background of Ex-post Monitoring .................................................................................... 8-2
2. Outline of the Monitoring Study ............................................................................................... 8-2 2.1 External Monitoring Consultant .......................................................................................... 8-2 2.2 Duration of Monitoring Study ............................................................................................. 8-2
3. Monitoring Results ................................................................................................................... 8-2 3.1 Effectiveness ....................................................................................................................... 8-2
3.1.1 Quantitative Effects...................................................................................................... 8-2 3.1.1.1 Operation and Effect Indicators ............................................................................ 8-2 3.1.1.2 Internal Rates of Return (IRR) .............................................................................. 8-6
3.1.2 Qualitative Effects........................................................................................................ 8-6 3.2 Impact ................................................................................................................................. 8-6
3.2.1 Intended Impacts .......................................................................................................... 8-6 3.2.1.1 Contribution to the Improvement of Investment Environment ............................. 8-6 3.2.1.2 Contribution to the Improvement of Living Environment .................................... 8-6
3.2.2 Resettlement, Land Acquisition, and Other Impacts .................................................... 8-6 3.3 Sustainability ...................................................................................................................... 8-7
3.3.1 Structural Aspects of Operation and Maintenance ....................................................... 8-7 3.3.2 Technical Aspects of Operation and Maintenance ....................................................... 8-7 3.3.3 Financial Aspects of Operation and Maintenance ........................................................ 8-8 3.3.4 Current Status of Operation and Maintenance ............................................................. 8-9
4. Conclusion, Lessons Learned and Recommendations .............................................................. 8-9 4.1 Conclusion .......................................................................................................................... 8-9 4.2 Recommendations ............................................................................................................. 8-10 4.3 Lessons Learned................................................................................................................ 8-10
Comparison of the Original and Actual Scope of the Project ..................................................... 8-11
Zimbabwe "Mashonaland Manicaland Digitalization Project (II)"
1. Project Description ................................................................................................................... 9-1 1.1 Project Objective ................................................................................................................. 9-1 1.2 Outline of the Loan Agreement ........................................................................................... 9-1 1.3 Background and Reason of Ex-post Monitoring ................................................................. 9-2
2. Outline of the Monitoring Study ............................................................................................... 9-2 2.1 External Monitoring Consultant .......................................................................................... 9-2 2.2 Duration of Monitoring Study ............................................................................................. 9-3
3. Monitoring Results ................................................................................................................... 9-3 3.1 Effectiveness ....................................................................................................................... 9-3
3.1.1 Quantitative Effects...................................................................................................... 9-3 3.1.1.1 Operation and Effect Indicators ............................................................................ 9-3 3.1.1.2 Results of Calculations of Internal Rates of Return (IRR) .................................... 9-5
3.1.2 Qualitative Effects........................................................................................................ 9-5 3.2 Impact ................................................................................................................................. 9-6
3.2.1 Intended Impacts .......................................................................................................... 9-6 3.2.1.1 Customer Satisfaction of TelOne’s Communication Status .................................. 9-6
3.2.2 Other Impacts ............................................................................................................... 9-6 3.2.2.1 Environmental Impact ........................................................................................... 9-6 3.2.2.2 Resettlement and Land Acquisition ...................................................................... 9-6
3.3 Sustainability ...................................................................................................................... 9-7 3.3.1 Structural Aspects of Operation and Maintenance ....................................................... 9-7 3.3.2 Technical Aspects of Operation and Maintenance ....................................................... 9-7 3.3.3 Financial Aspects of Operation and Maintenance ........................................................ 9-7 3.3.4 Current Status of Operation and Maintenance ............................................................. 9-8
4. Conclusion, Lessons Learned and Recommendations .............................................................. 9-9 4.1 Conclusion .......................................................................................................................... 9-9 4.2 Recommendations ............................................................................................................. 9-10 4.3 Lessons Learned................................................................................................................ 9-10
Comparison of the Original and Actual Scope of the Project ..................................................... 9-11

1-1
Ex-Post Monitoring of Japanese ODA Loan Project
Thailand
Regional Development Project (II)
External Monitoring Consultants: Kazunori Honda / Toyo Tanaka, Nakamoto&Associates Co., Ltd.
1. Project Description
Project Location City gate at the Entrance of the
Tourist Spot of Pattaya
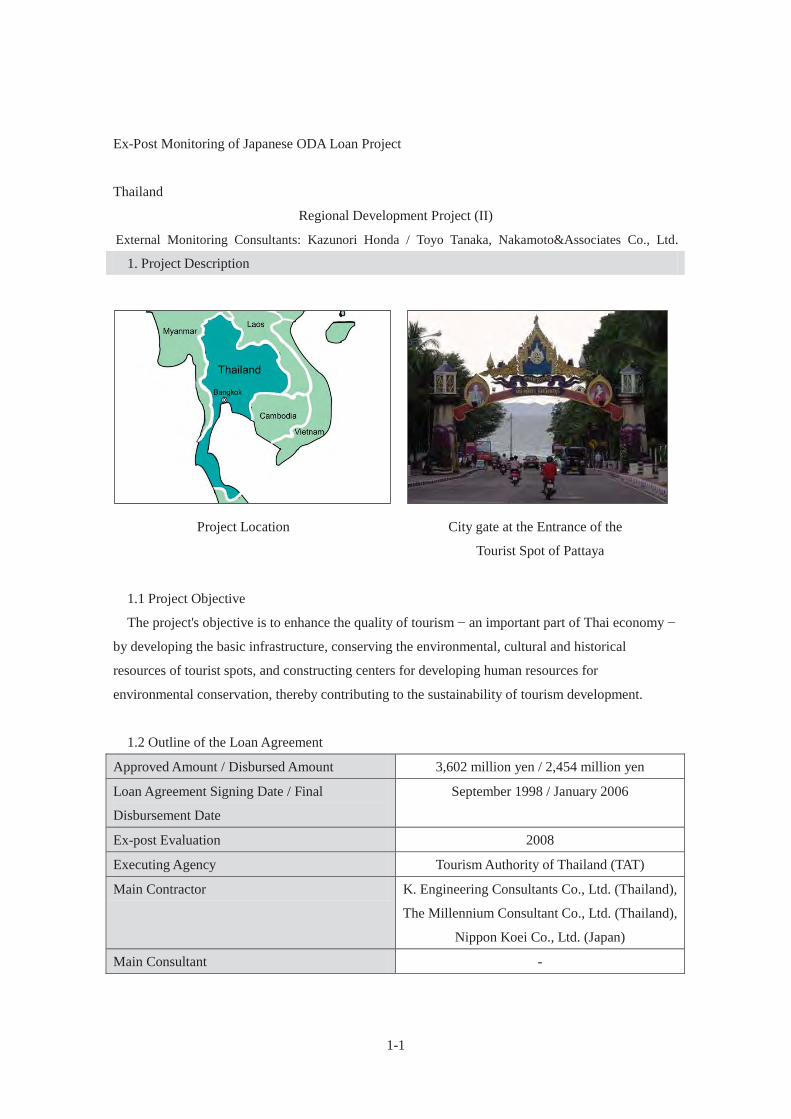
1.1 Project Objective
The project's objective is to enhance the quality of tourism − an important part of Thai economy −
by developing the basic infrastructure, conserving the environmental, cultural and historical
resources of tourist spots, and constructing centers for developing human resources for
environmental conservation, thereby contributing to the sustainability of tourism development.
1.2 Outline of the Loan Agreement
Approved Amount / Disbursed Amount 3,602 million yen / 2,454 million yen
Loan Agreement Signing Date / Final
Disbursement Date
September 1998 / January 2006
Ex-post Evaluation 2008
Executing Agency Tourism Authority of Thailand (TAT)
Main Contractor K. Engineering Consultants Co., Ltd. (Thailand),
The Millennium Consultant Co., Ltd. (Thailand),
Nippon Koei Co., Ltd. (Japan)
Main Consultant -
1-2
1.3 Background of Ex-post Monitoring
With its currency crisis, Thailand had to try to find an economic base that could replace a rapid industrialization and the economic growth dependent on the financial market. In this context, it was quite a natural course for the country to implement this project related to tourism after Regional Development Project I (hereinafter "Project I").
As already known at the start of Project I, which was implemented from 1996 to 2002, the tourism sector was important for economic development, but there was a great possibility for the tourism promotion to destroy the environment or to have a negative influence on the conservation of culture. With Project I, while targeting to contribute to economic growth by promoting tourism, attention was also paid to the environmental destruction and the negative influence on culture. With Regional Development Project II (hereinafter "this Project"), this consideration was highlighted further. In addition to the harmony between tourism and the environment, the promotion of tourism by using traditional regional cultures was planned in an explicit form. Installation of basic infrastructure in the tourism sector; conservation of environment, culture, and history of tourist spots; and construction of centers for environmental personnel training were implemented. At the time of ex-post evaluation, certain effects were observed as a result of the implementation of this project. However, the effects of this project could not be determined from the tourists’ “average length of stay” and “average expenditure”. On the other hand, since the effects of this project can be seen in certain projects such as industrial village, the effectiveness of this project was rated to be moderate. At the time of ex-post evaluation, comprehensive administrative body for the subprojects was nonexistent, and concern was shown over the sustainability of the project. In addition, ex-post evaluation indicated the existence of some poorly maintained facilities and non-operational facilities. Further, ex-post evaluation report made a recommendation to the Thai government to consider allocating the necessary budget to remove the equipment that was out of operation and transfer them to locations where they could be used effectively.
Therefore, this project was selected for ex-post monitoring, placing emphasis on confirming the effectiveness of the project pertaining to improving the quality of tourism based on indicators such as the “average length of stay” and the “average expenditure”, and verifying the operation status of each sub-project, to be reviewed under each criterion with the findings from the field survey and other research activities with a final conclusion being drawn.

1-3
2. Outline of the Monitoring Study
2.1 External Monitoring Consultant
Kazunori Honda (Nakamoto & Associates Co., Ltd.)
Toyo Tanaka (Nakamoto & Associates Co., Ltd.)
2.2 Duration of Monitoring Study
Duration of the Study: September 2012 – June 2013
Duration of the Field Study: November 17, 2012 – November 27, 2012
3. Monitoring Results
3.1 Effectiveness
3.1.1 Quantitative Effects
3.1.1.1 Results from Operation and Effect Indicators
(1) Domestic and Foreign Tourists
Although the economic downturn of the Lehman Crisis in 2008 had led to a decrease in the
number of tourists in 2009, the number of domestic and foreign tourists has been increasing since
2010. Improvement in the quality of tourism can be seen through a steady increase in the “Average
Length of Stay” and “Average Expenditure” since the time of ex-post evaluation. Therefore, the
effect of this project seems to be continually produced.
The number of domestic tourists shows a steady increase since 2007. In 2010, the number of
tourists increased by 24.52 million (25% increase compared to the previous year, Table 1).
Table 1. Quantity and Quality of Tourism by Domestic Tourists
Source: TAT
Apart from this project, major factors in stimulating tourism in Thailand include the "Finance
Ministry Ordinance No. 278" and "Notification of the Director-General of the Revenue Department
on Income Tax No. 187" enacted in 2010. These regulations allowed domestic tourists to deduct the
accommodation fee from the income when using the hotels that fulfill certain conditions. This led to
YearNumber of
tourists(million)
Average Lengthof stay(days)
AverageExpenditure
(baht/person/day)
Revenue(million baht)
2007 83.23 2.63 1,767.35 380,417
2008 84.28 N/A N/A 388,200
2009 98.00 2.35 1,540.63 407,600
2010 122.52 2.59 1,736.38 402,574
2011 133.18 2.73 1,831.53 483,225
1-4
a considerable increase in domestic tourists. Until then, Thai tourists would usually stay at family or
friend's house while on vacation. Only a limited number of people enjoyed staying at a hotel.
However, the tourism style of Thai people has changed as a result of these measures.
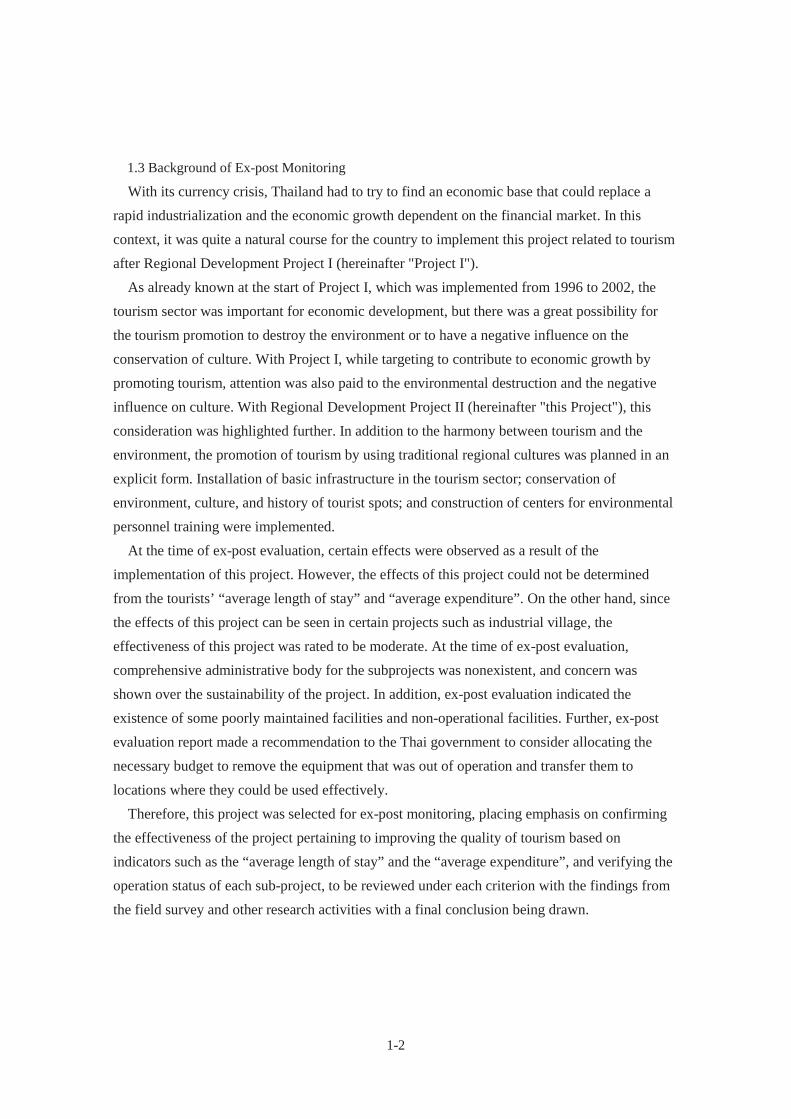
Although Thailand experienced an economic recession in 2009 and a political uprising in
Bangkok from 2009 to 2010, overall, the number of foreign tourists is showing a growing trend. In
2010, there number of tourists increased by 1.8million (growth of 13% from 2009) compared to the
previous year, and a significant increase of 3.3 million in 2011(growth of 21% from 2010) compared
to the previous year (Table 2). The main reason for this increase is Thailand's policy which focused
on attracting tourists from neighboring countries. This led to the overall increase of foreign tourists,
although the number of tourists from Japan, Europe, and United States has decreased. Thailand
particularly focused on attracting tourists from China, campaigning to attract tourists with the sales
copy "Amazing Thailand" has been effective.
Table 2. Quantity and Quality of Tourism by Foreign Tourists
Source: TAT
Trends in the number of tourists throughout Thailand are not necessarily the direct results of this
project. Many different policies to stimulate tourism have acted compositely, and have resulted in the
increase of the number of tourists, their average length of stay, and average expenditure. Therefore, it
is impossible to measure the direct effect of the influence of facilities such as, environmental
protection facilities, environmental conservation, or nature study center, which were built by this
project. However, city gates, monuments, and sidewalks constructed by this project at tourist spots
such as Chiang Rai, Ayutthaya, and Pattaya are still being used. Furthermore, industrial village of Na
Ton Chan has developed considerably through production of cotton products. It can be said that this
project is definitely playing a part in promoting the tourism sector of Thailand.
(2) Operation Status and Operation Rate of Sub-Projects
At the time of appraisal, the TAT was overseeing some sub-projects, and, at the same time, acted
as a coordinator for all the sub-projects. However, jurisdictions of all of the sub-projects, with the
YearNumber of
tourists(million)
Average Lengthof stay(days)
AverageExpenditure
(baht/person/day)
Revenue(million baht)
2007 14.46 9.19 4,120.95 547,782
2008 14.58 9.51 4,142.30 574,521
2009 14.15 8.99 4,011.00 510,225
2010 15.94 9.12 4,079.00 592,794
2011 19.23 9.64 4,187.00 776,217

1-5
exception of A5 “human resource development for tourism”, have been transferred to other
government agencies. In addition, decentralization law transferred the operation and management
responsibility of A11 "industrial villages" to each village. Based on the information obtained from
the TAT under these circumstances, the current status of the sub-projects can be seen in Table 3.
1-6
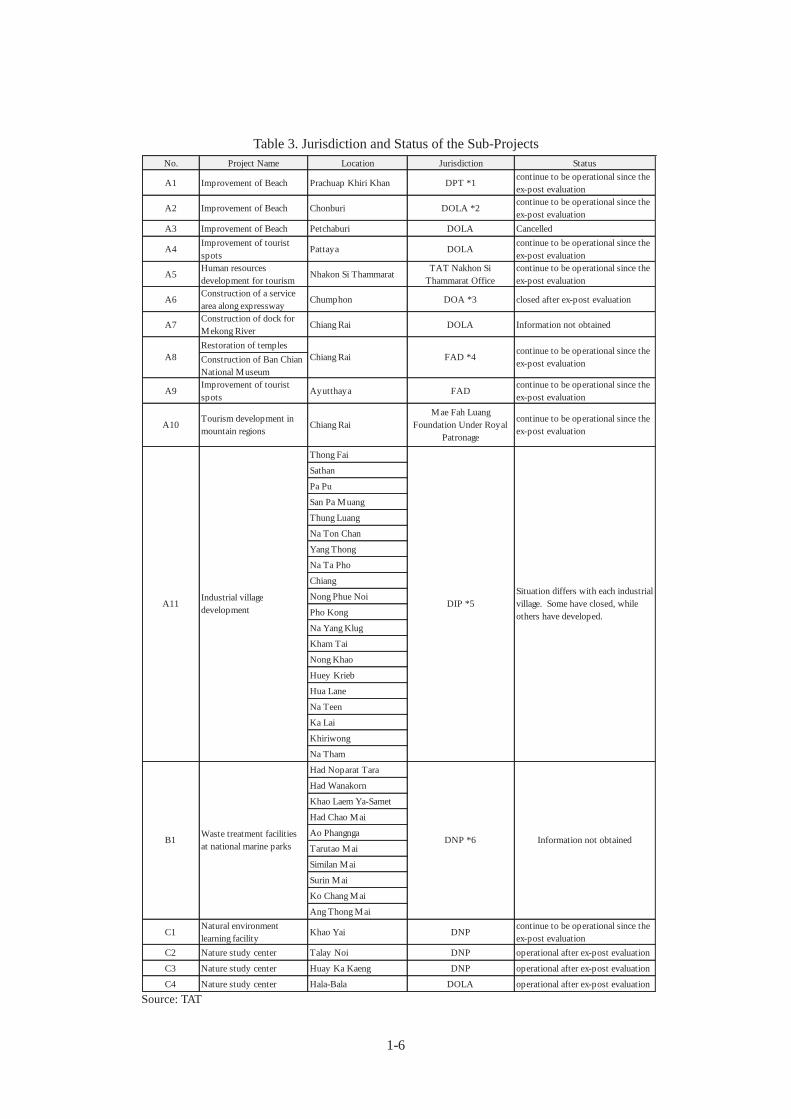
Table 3. Jurisdiction and Status of the Sub-Projects
Source: TAT
No. Project Name Location Jurisdiction Status
A1 Improvement of Beach Prachuap Khiri Khan DPT *1continue to be operational since theex-post evaluation
A2 Improvement of Beach Chonburi DOLA *2continue to be operational since theex-post evaluation
A3 Improvement of Beach Petchaburi DOLA Cancelled
A4Improvement of touristspots
Pattaya DOLAcontinue to be operational since theex-post evaluation
A5Human resourcesdevelopment for tourism
Nhakon Si ThammaratTAT Nakhon Si
Thammarat Officecontinue to be operational since theex-post evaluation
A6Construction of a servicearea along expressway
Chumphon DOA *3 closed after ex-post evaluation
A7Construction of dock forMekong River
Chiang Rai DOLA Information not obtained
Restoration of templesConstruction of Ban ChianNational Museum
A9Improvement of touristspots
Ayutthaya FADcontinue to be operational since theex-post evaluation
A10Tourism development inmountain regions
Chiang RaiMae Fah Luang
Foundation Under RoyalPatronage
continue to be operational since theex-post evaluation
Thong Fai
Sathan
Pa Pu
San Pa Muang
Thung Luang
Na Ton Chan
Yang Thong
Na Ta Pho
Chiang
Nong Phue Noi
Pho Kong
Na Yang Klug
Kham Tai
Nong Khao
Huey Krieb
Hua Lane
Na Teen
Ka Lai
Khiriwong
Na Tham
Had Noparat Tara
Had Wanakorn
Khao Laem Ya-Samet
Had Chao Mai
Ao Phangnga
Tarutao Mai
Similan Mai
Surin Mai
Ko Chang Mai
Ang Thong Mai
C1Natural environmentlearning facility
Khao Yai DNPcontinue to be operational since theex-post evaluation
C2 Nature study center Talay Noi DNP operational after ex-post evaluation
C3 Nature study center Huay Ka Kaeng DNP operational after ex-post evaluation
C4 Nature study center Hala-Bala DOLA operational after ex-post evaluation
Information not obtained
Situation differs with each industrialvillage. Some have closed, whileothers have developed.
continue to be operational since theex-post evaluation
B1Waste treatment facilitiesat national marine parks
DNP *6
A8 Chiang Rai FAD *4
A11Industrial villagedevelopment
DIP *5
1-7
*1 DPT: Department of Public Works and Town & Country Planning (Ministry of Interior) *2 DOLA: Department of Local Administration (Ministry of Interior) *3 DOA: Department of Agriculture (Ministry of Agriculture and Cooperatives) *4 FAD: Fine Arts Department (Ministry of Education) *5 DIP: Department of Industry Promotion (Ministry of Industry) *6 DNP: Department of National Park (Ministry of Natural Resources and Environment)
Details of the current status of each sub-project are only available at its overseeing government
agency or at the region that the subproject is located. For this reason, the following sites were
selected from the sub-projects, and detailed on-site survey was conducted to ascertain their actual
situations.
A2 "Coastal development" Chonburi
A4 "Coastal development" Pattaya
A9 "Tourism area development" Ayutthaya
A11.13 "Industrial village development" Ban Kham Tai
C1 "Nature learning center” Khao Yai
Although the indicators have temporarily been influenced negatively by the economic downturn
and political instability, generally, the numbers are the same or above those from the time of ex-post
evaluation. It is impossible to measure the direct contribution of the project to these indicators,
however, it can be said that the project has played a definite part in the development of tourism in
Thailand.
3.1.1.2 Internal Rates of Return (IRR)
Re-calculation of Internal rate of return (IRR) will not be performed since IRR had not been
calculated at the time of ex-post evaluation.
3.1.2 Qualitative Effects
Overall operation status and the effect of the sub-projects to the neighboring areas were examined
through an interview with the TAT. Of the sub-projects, A2, A4, A5, A9, A11 (partial), C1-4 continue
to contribute to the sustainability of the tourism sector. On the other hand, there are projects such as
A6 & A11 (partial) which have shifted its role, and are being utilized for other purposes (Table 4).
1-8
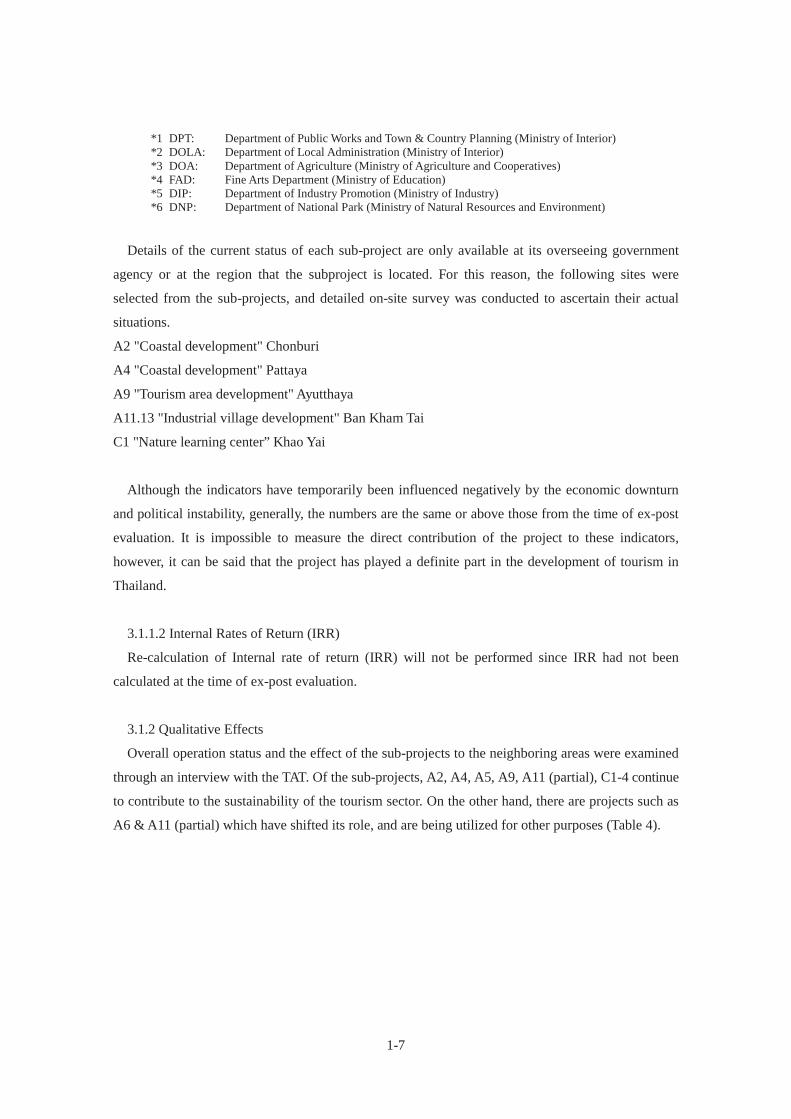
Table 4 Current Status of the Sub-Projects According to the Interviews to TAT
Source: TAT
(*1) Information collected during the site visit (*2) TAT website (Wat Chedi Luang / Wat Phra That Phu Khao) (*3) Fine Arts Department website (Ban Chiang National Museum) (*4) Mae Fah Luang Foundation under Royal Patronage website (Doitung Region Development)
At the visited sites, the following situations were verified:
A2, A4: City gates and sidewalks built by this project continued to be used, and were contributing
to the improvement of scenery. They were well-maintained and kept in a satisfactory condition. The
No. Current Status of the Sub-Projects
A1The scenery is maintained, building upon the shore protection and sidewalkconstructed by this project
A2(*1) Shore protection and sidewalk constructed by this project are still being used.
A3This sub-project was cancelled before appraisal due to the opposition from theresidents.
A4(*1)Shore protection, sidewalk, monuments, and fountains constructed by this projectis still being used.
A5 Tourism guides are constantly trained at TAT Nakhon Si Thammarat Office.
A6 Service Area is closed due to popularity of new service area opened in the vicinity.
A7Jurisdiction has moved to DOLA.No information was available at TAT
A8(*2*3)Ban Chiang National Museum, Wat Chedi Luang, Wat Phra That Phu KhaoTemple continues to operate.
A9(*1) Utilized as part of Ayutthaya.
A10(*4)Mae Fah Luang Foundation under Rotal Patronage has taken over and hascontinued the development through "Doitung Regional Development Project".
A11(*1)There are industrial villages which were successful such as Na Ton Chan village.On the other hand, there are those which were closed such as Kham Tai.
B1.1-B1.10Regulatory agency has changed to DNP. No information was available at TAT.Information could not be obtained.
C1(*1)Visitors to Nature Study Center are mainly domestic tourists. The center is beingutilized by many students and families.
C2 Construction has been completed, and the facility is being utilized.
C3 Construction has been completed, and the facility is being utilized.
C4 Construction has been completed, and the facility is being utilized.
1-9
sites were crowded with tourists, and were full of activity. The region is one of the major tourists
spots in the country, and many tour buses were parked in the vicinity of these sites.
A9: Landscape improvement work implemented by this project could be seen within the premises
of Ayutthaya Historical Park. However, Si Nakharin Park, implemented by this project, was being
used as a park by local residents rather than as a tourist spot. Ayutthaya was devastated by flood in
2011. The restoration processes of the region, with emphasis on the historic sites, have since been
undertaken, and the effects of the flood were barely noticeable. At the site visit, many tourists were
visiting Ayutthaya. Tourism attraction in the region such as elephant rides had also resumed its
activity. However, in the neighboring districts outside the historic site, unrepaired facilities could
still be seen.
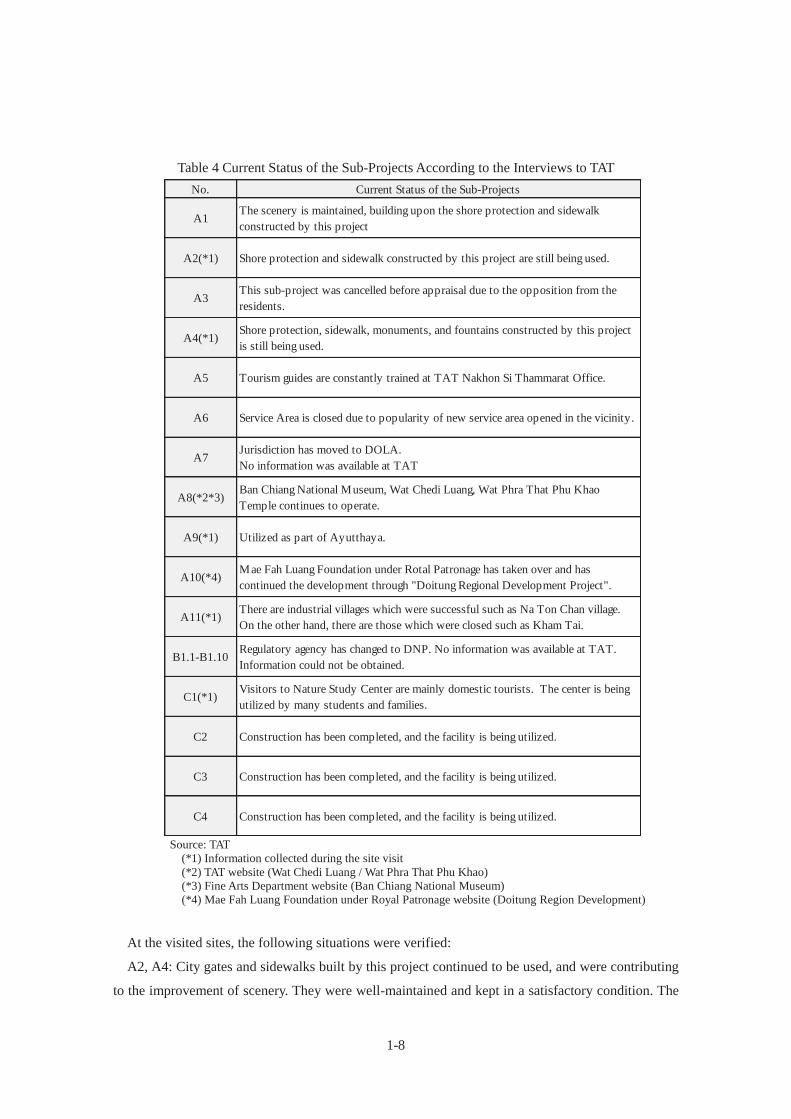
A11.13: The visited industrial village specialized in production of textile products. The village
was closed due to insufficient funds to purchase the necessary raw material. The village was making
a request to the local municipal office to provide funding to resume the textile business. However,
the industrial village facility continues to be utilized by the villagers. On the weekdays, aerobics
exercise is held on the premises. Exercise bike and weight training equipment were placed in one of
the facilities, and the space was being utilized as a gym. The gym’s usage fee is collected from the
villagers to pay for the electricity bill of the air conditioner placed in the gym; no profit is made from
this operation. Industrial village facilities were also used for events as a meeting place, a festival
ground, and a venue for regional marathon competition. Maintenance of the facility is undertaken by
the villagers themselves, and the facility was kept in satisfactory condition. According to the
industrial village manager, the facility is ready to resume its operation and welcome the tourists at
any time.
Lodges at Nature Study Center (Khao Yai) Industrial Village Facility (Kham Tai)
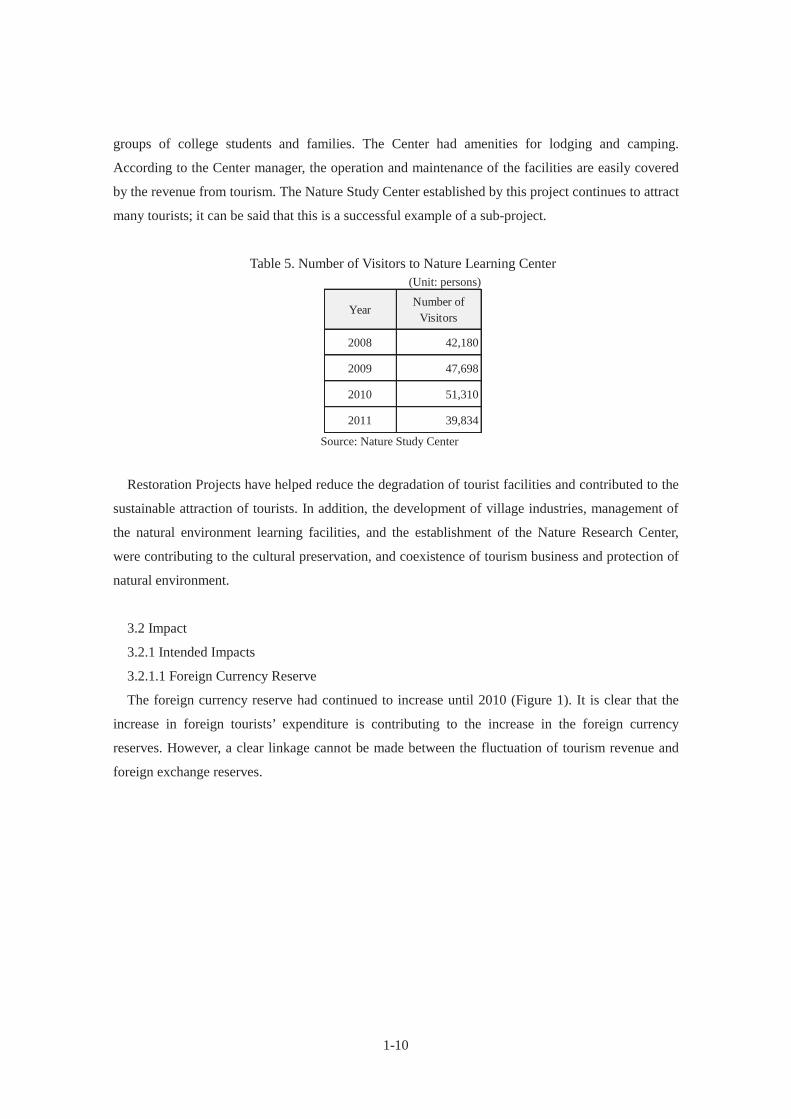
C1: Nature Study Center is mainly used by domestic tourists. As shown in Table 5, 40,000 to
50,000 tourists visit the facility every year. At the time of the site visit, the Center was crowded with
1-10
groups of college students and families. The Center had amenities for lodging and camping.
According to the Center manager, the operation and maintenance of the facilities are easily covered
by the revenue from tourism. The Nature Study Center established by this project continues to attract
many tourists; it can be said that this is a successful example of a sub-project.
Table 5. Number of Visitors to Nature Learning Center (Unit: persons)
Source: Nature Study Center
Restoration Projects have helped reduce the degradation of tourist facilities and contributed to the
sustainable attraction of tourists. In addition, the development of village industries, management of
the natural environment learning facilities, and the establishment of the Nature Research Center,
were contributing to the cultural preservation, and coexistence of tourism business and protection of
natural environment.
3.2 Impact
3.2.1 Intended Impacts
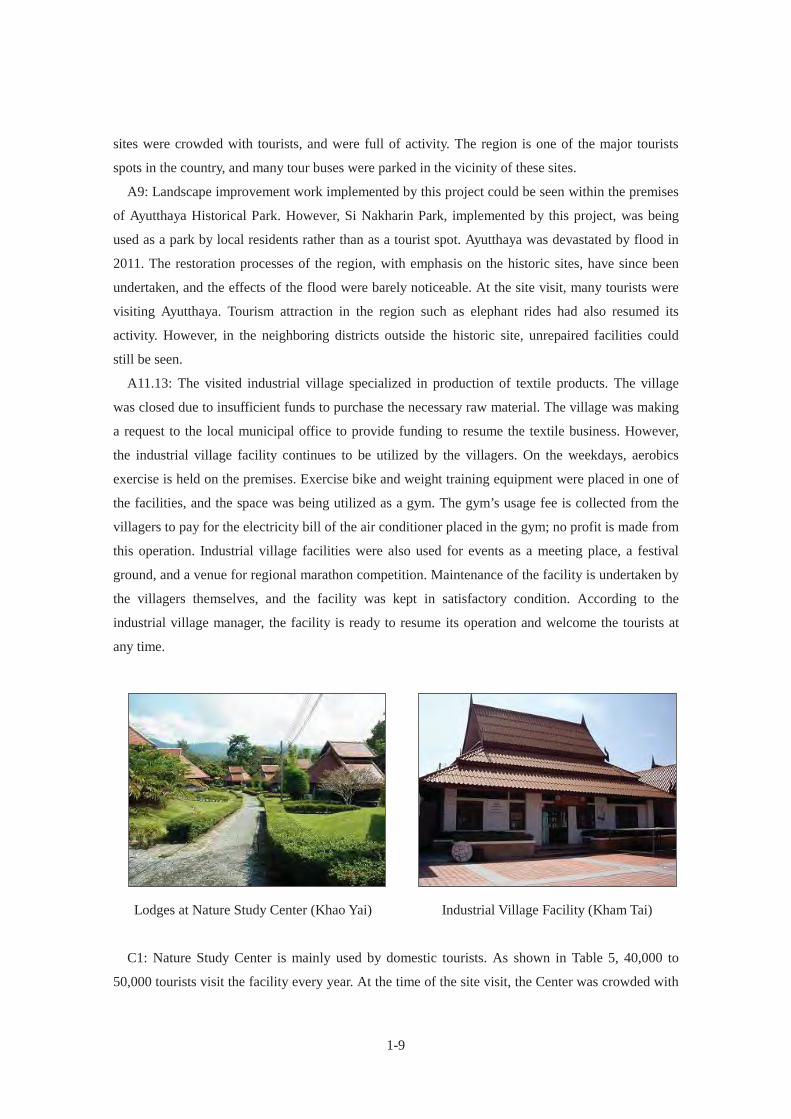
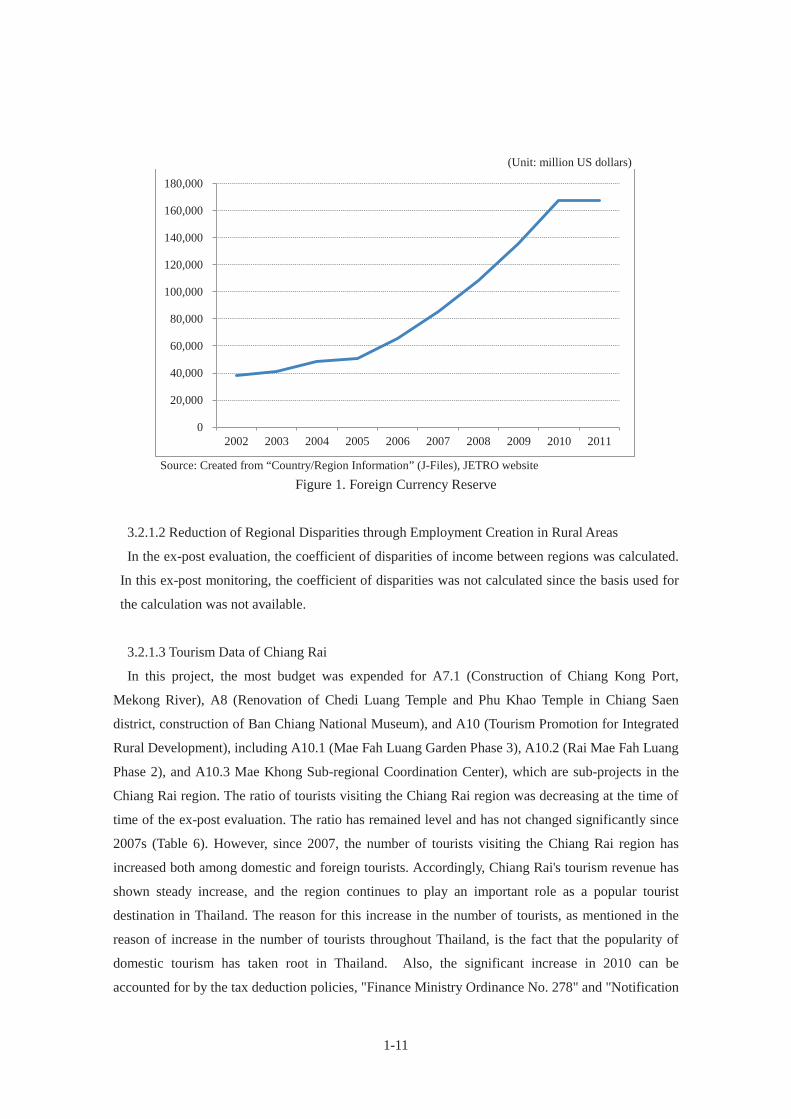
3.2.1.1 Foreign Currency Reserve
The foreign currency reserve had continued to increase until 2010 (Figure 1). It is clear that the
increase in foreign tourists’ expenditure is contributing to the increase in the foreign currency
reserves. However, a clear linkage cannot be made between the fluctuation of tourism revenue and
foreign exchange reserves.
YearNumber of
Visitors
2008 42,180
2009 47,698
2010 51,310
2011 39,834
1-11
(Unit: million US dollars)
Source: Created from “Country/Region Information” (J-Files), JETRO website
Figure 1. Foreign Currency Reserve
3.2.1.2 Reduction of Regional Disparities through Employment Creation in Rural Areas
In the ex-post evaluation, the coefficient of disparities of income between regions was calculated.
In this ex-post monitoring, the coefficient of disparities was not calculated since the basis used for
the calculation was not available.
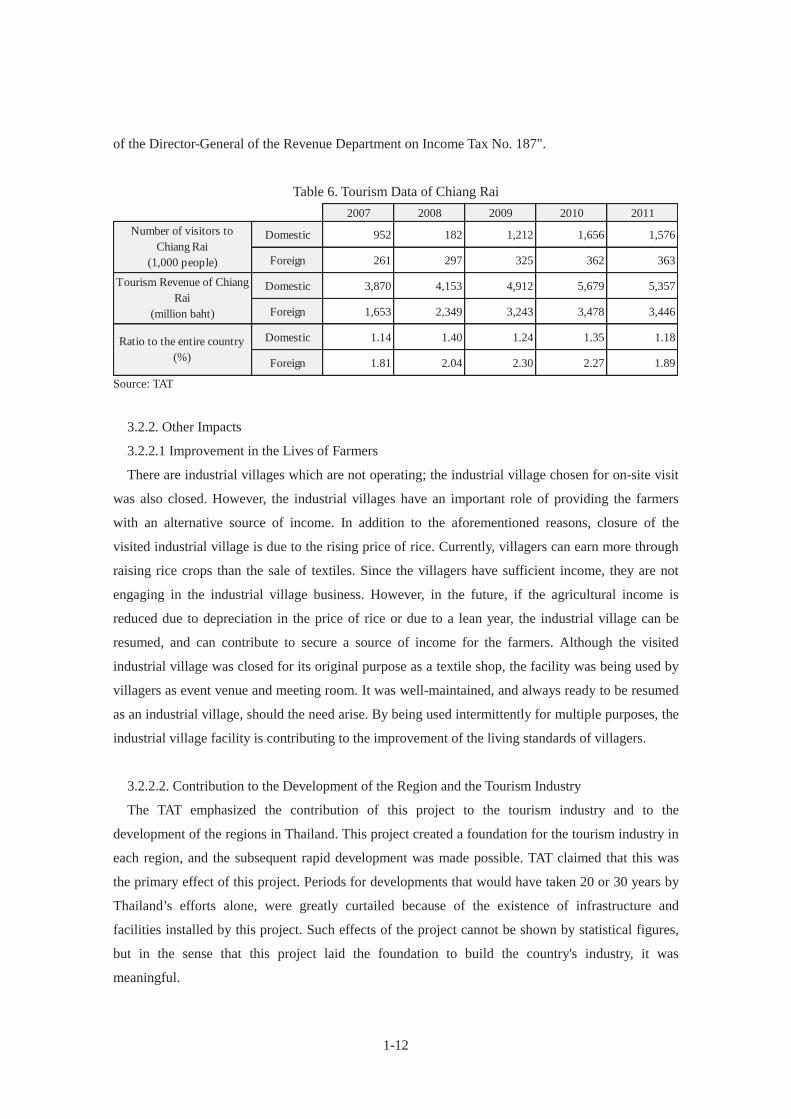
3.2.1.3 Tourism Data of Chiang Rai
In this project, the most budget was expended for A7.1 (Construction of Chiang Kong Port,
Mekong River), A8 (Renovation of Chedi Luang Temple and Phu Khao Temple in Chiang Saen
district, construction of Ban Chiang National Museum), and A10 (Tourism Promotion for Integrated
Rural Development), including A10.1 (Mae Fah Luang Garden Phase 3), A10.2 (Rai Mae Fah Luang
Phase 2), and A10.3 Mae Khong Sub-regional Coordination Center), which are sub-projects in the
Chiang Rai region. The ratio of tourists visiting the Chiang Rai region was decreasing at the time of
time of the ex-post evaluation. The ratio has remained level and has not changed significantly since
2007s (Table 6). However, since 2007, the number of tourists visiting the Chiang Rai region has
increased both among domestic and foreign tourists. Accordingly, Chiang Rai's tourism revenue has
shown steady increase, and the region continues to play an important role as a popular tourist
destination in Thailand. The reason for this increase in the number of tourists, as mentioned in the
reason of increase in the number of tourists throughout Thailand, is the fact that the popularity of
domestic tourism has taken root in Thailand. Also, the significant increase in 2010 can be
accounted for by the tax deduction policies, "Finance Ministry Ordinance No. 278" and "Notification
0
20,000
40,000
60,000
80,000
100,000
120,000
140,000
160,000
180,000
2002 2003 2004 2005 2006 2007 2008 2009 2010 2011
1-12
of the Director-General of the Revenue Department on Income Tax No. 187".
Table 6. Tourism Data of Chiang Rai
Source: TAT
3.2.2. Other Impacts
3.2.2.1 Improvement in the Lives of Farmers
There are industrial villages which are not operating; the industrial village chosen for on-site visit
was also closed. However, the industrial villages have an important role of providing the farmers
with an alternative source of income. In addition to the aforementioned reasons, closure of the
visited industrial village is due to the rising price of rice. Currently, villagers can earn more through
raising rice crops than the sale of textiles. Since the villagers have sufficient income, they are not
engaging in the industrial village business. However, in the future, if the agricultural income is
reduced due to depreciation in the price of rice or due to a lean year, the industrial village can be
resumed, and can contribute to secure a source of income for the farmers. Although the visited
industrial village was closed for its original purpose as a textile shop, the facility was being used by
villagers as event venue and meeting room. It was well-maintained, and always ready to be resumed
as an industrial village, should the need arise. By being used intermittently for multiple purposes, the
industrial village facility is contributing to the improvement of the living standards of villagers.
3.2.2.2. Contribution to the Development of the Region and the Tourism Industry
The TAT emphasized the contribution of this project to the tourism industry and to the
development of the regions in Thailand. This project created a foundation for the tourism industry in
each region, and the subsequent rapid development was made possible. TAT claimed that this was
the primary effect of this project. Periods for developments that would have taken 20 or 30 years by
Thailand’s efforts alone, were greatly curtailed because of the existence of infrastructure and
facilities installed by this project. Such effects of the project cannot be shown by statistical figures,
but in the sense that this project laid the foundation to build the country's industry, it was
meaningful.
2007 2008 2009 2010 2011
Domestic 952 182 1,212 1,656 1,576
Foreign 261 297 325 362 363
Domestic 3,870 4,153 4,912 5,679 5,357
Foreign 1,653 2,349 3,243 3,478 3,446
Domestic 1.14 1.40 1.24 1.35 1.18
Foreign 1.81 2.04 2.30 2.27 1.89
Number of visitors toChiang Rai
(1,000 people)
Tourism Revenue of ChiangRai
(million baht)
Ratio to the entire country(%)

1-13
It is difficult to confirm the direct impact of this project. Although the contribution of this project
to the increase of foreign reserves and to the increase in the number of tourists visiting the Chiang
Rai region seems unmistakable, it is impossible to accurately grasp and reveal the effects of this
project.
3.3 Sustainability
3.3.1 Structural Aspects of Operation and Maintenance
Sub-projects under the TAT jurisdiction were well maintained, and no problems could be detected.
For the operation and management of each sub-project status, see Table 3 and Table 4. On the other
hand, information regarding the operation and management of facilities under government agencies
other than the TAT could not be obtained.
3.3.2 Technical Aspects of Operation and Maintenance
Tourism human resource training center, under the jurisdiction of the TAT, holds tourism training
sessions daily. At over 30 TAT regional offices located throughout the country, community-based
tourism support is engaged to promote tourism for the region. Hence, the training program differs
with each regional office. As for the tourist development program, training of regional tourism
guides and regional tourism marketing and promotion are conducted. Regarding the wastewater
treatment and garbage disposal systems at marine parks, information concerning the technical
aspects of operation and maintenance were not available at the TAT.
3.3.3 Financial Aspects of Operation and Maintenance
Regarding the wastewater treatment and garbage disposal systems at marine parks, information
concerning the financial aspects of the operation and maintenance was not available at the TAT.
3.3.4 Current Status of Operation and Maintenance
Some facilities, which were under construction at the time of ex-post evaluation, are well
maintained after becoming operational. Some facilities have continually been properly maintained
since the ex-post evaluation. On the other hand, there are sub-projects which are not operating.
Through interview with the TAT and field visits, the following information was obtained: Within the
sub-projects, there are those which were cancelled at the implementation such as A3, that which was
terminated due to the opening of a convenient service area nearby (A6), and those which closed their
industrial village such as Kham Thai (A11.13). On the other hand, at the visited sites of A2, A4, A9,
A11.13, C1, it was confirmed that the maintenance and management were properly conducted. In
addition, A10 “Tourism Promotion for Integrated Rural Development”, which is comprised of 3
1-14
sub-projects in Chiang Rai province, is being properly maintained under the supervision of Mae Fah
Luang Foundation. According to TAT, there was no information available at the TAT that B1 (with
10 sub-projects B1.1 – B1.10), wastewater treatment and garbage disposal systems in 10 marine
national parks, were operating after ex-post evaluation. Due to the time constraints, further
information could not be obtained.
Because the facilities and equipment installed by this project are diverse and located throughout
the country, investigation of the overall operation and maintenance was not possible. However, for
sub-projects in which the site visits were conducted, the operation and maintenance were
appropriately implemented. Also, according to the TAT, to their knowledge, the operation and
maintenance of the facilities are being conducted appropriately in the sub-projects.
3.4 Others
Follow-up of the Recommendation in Ex-post Evaluation
Ex-post evaluation report made a recommendation to the Thai government to make the necessary
budget available, in order to remove the equipment that was out of operation and to transfer them to
locations where they can be used effectively. In the interview with the TAT, it was confirmed that
there had been a transfer of some unused equipment to other parks since 2005. However, the
relocation or the utilization of all the facility equipment for B1, wastewater treatment and garbage
disposal systems in the marine parks, could not be traced.
4. Conclusion, Lessons Learned and Recommendations
4.1 Conclusion
The ex-post evaluation defined the quality of tourism by the fluctuations in the "average length of
stay" and the "average expenditure". If this ex-post monitoring is to use the same indicators, both
indicators are increasing overall in spite of the economic downturn and political instability, and
hence, it can be concluded that the quality of tourism in Thailand is continually maintained. Though
the improved quality of tourism cannot be explained by the result of this project alone, this project
had a distinct role in the development of tourism in Thailand.
Regarding the operation status of each subproject, there are those which were cancelled (A3),
those which became non-operational after ex-post evaluation (A6, parts of A11), and those which
were non-operational at the time of ex-post evaluation and became operational (C2-4). Other
sub-projects are unchanged from the time of the ex-post evaluation. The current status of each
sub-project differs greatly.
The TAT, which was the coordinator for the sub-projects during the implementation of the project
has ended its role, and the jurisdiction of the sub-projects, with the exception of one (A5), continues
1-15
to belong to those implementing agencies of each sub-project such as DOLA, DNP, DPT, and FAD.
There are also a number of sub-projects, including industrial villages, of which the jurisdiction was
transferred to their respective local municipalities due to the Decentralization Law.
In conclusion, effectiveness and impact of the project continue to be produced in general.
Concerning the operation and maintenance structure, responsible agency for each subproject is clear,
and no problem has been detected.
4.2 Recommendations
None.
4.3 Lessons Learned
None.
1-16
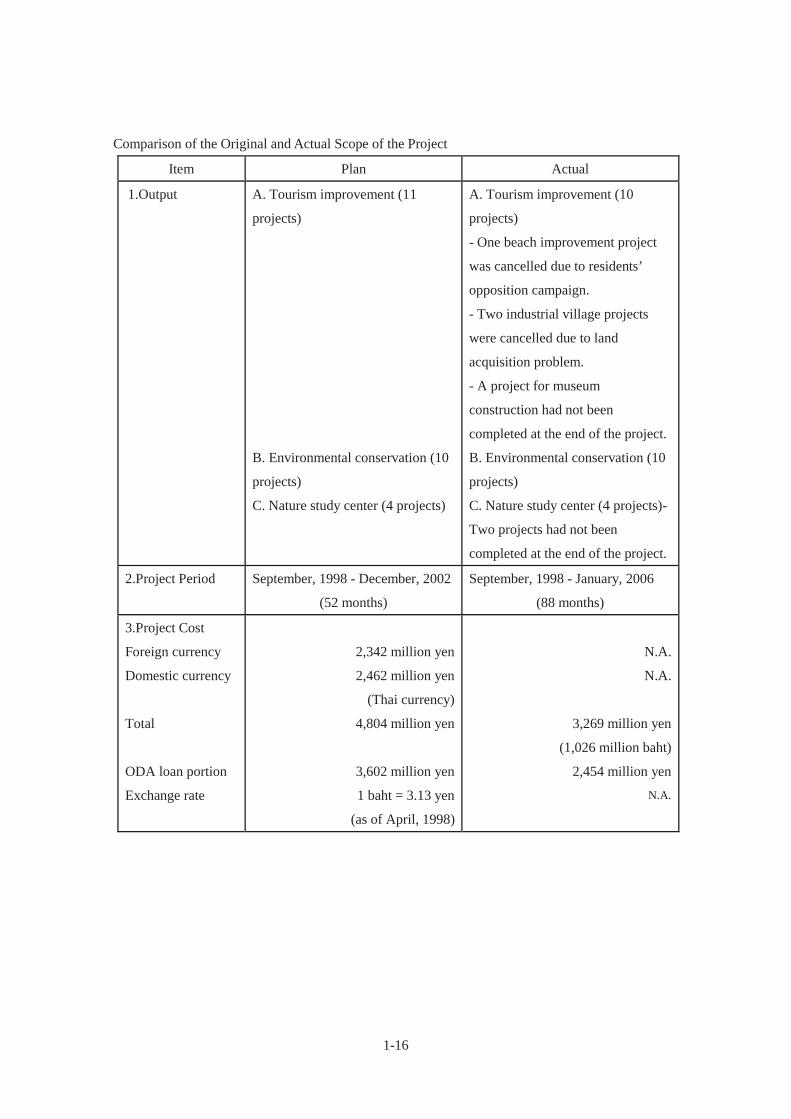
Comparison of the Original and Actual Scope of the Project
Item Plan Actual
1.Output A. Tourism improvement (11
projects)
B. Environmental conservation (10
projects)
C. Nature study center (4 projects)
A. Tourism improvement (10
projects)
- One beach improvement project
was cancelled due to residents’
opposition campaign.
- Two industrial village projects
were cancelled due to land
acquisition problem.
- A project for museum
construction had not been
completed at the end of the project.
B. Environmental conservation (10
projects)
C. Nature study center (4 projects)-
Two projects had not been
completed at the end of the project.
2.Project Period September, 1998 - December, 2002
(52 months)
September, 1998 - January, 2006
(88 months)
3.Project Cost
Foreign currency
Domestic currency
Total
ODA loan portion
Exchange rate
2,342 million yen
2,462 million yen
(Thai currency)
4,804 million yen
3,602 million yen
1 baht = 3.13 yen
(as of April, 1998)
N.A.
N.A.
3,269 million yen
(1,026 million baht)
2,454 million yen
N.A.
2-1
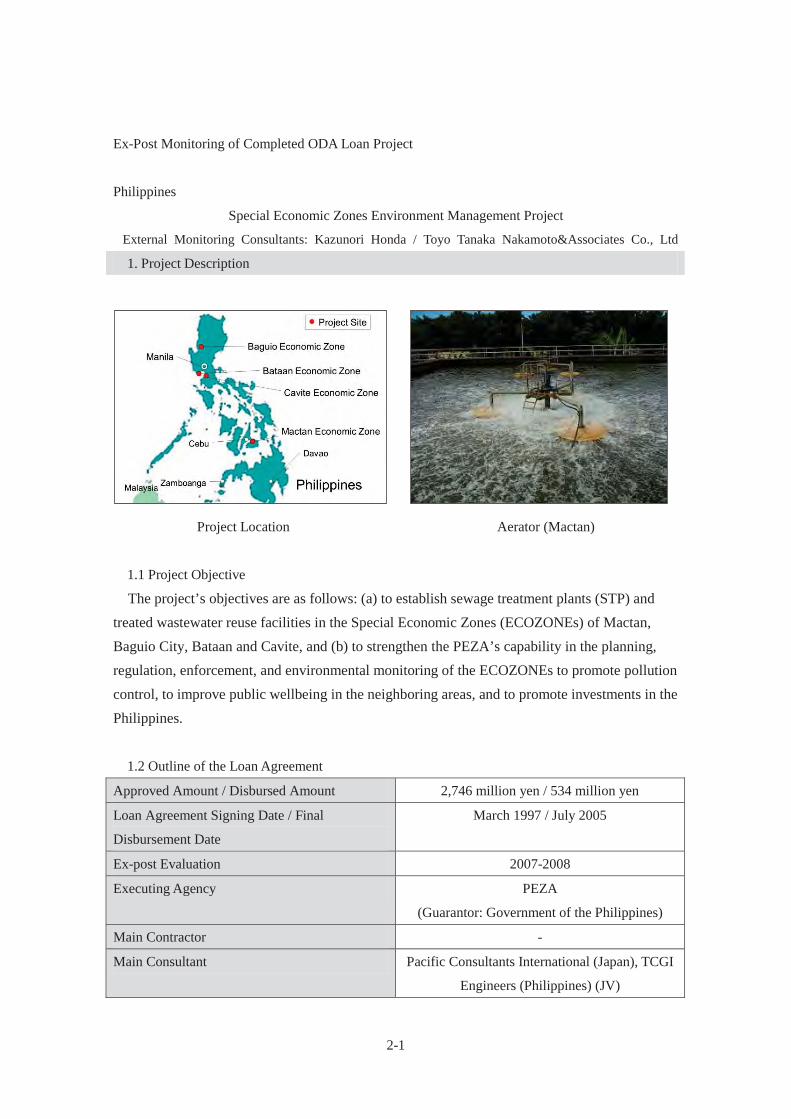
Ex-Post Monitoring of Completed ODA Loan Project
Philippines
Special Economic Zones Environment Management Project
External Monitoring Consultants: Kazunori Honda / Toyo Tanaka Nakamoto&Associates Co., Ltd
1. Project Description
Project Location Aerator (Mactan)
1.1 Project Objective
The project’s objectives are as follows: (a) to establish sewage treatment plants (STP) and treated wastewater reuse facilities in the Special Economic Zones (ECOZONEs) of Mactan, Baguio City, Bataan and Cavite, and (b) to strengthen the PEZA’s capability in the planning, regulation, enforcement, and environmental monitoring of the ECOZONEs to promote pollution control, to improve public wellbeing in the neighboring areas, and to promote investments in the Philippines.
1.2 Outline of the Loan Agreement
Approved Amount / Disbursed Amount 2,746 million yen / 534 million yen
Loan Agreement Signing Date / Final
Disbursement Date
March 1997 / July 2005
Ex-post Evaluation 2007-2008
Executing Agency PEZA
(Guarantor: Government of the Philippines)
Main Contractor -
Main Consultant Pacific Consultants International (Japan), TCGI
Engineers (Philippines) (JV)
2-2
1.3 Background of Ex-post Monitoring
In 1995, the Philippine government enacted into law Republic Act no. 7916 otherwise known as
the Special Economic Zone Act of 1995 and developmentally restructured the Export Processing
Zone Authority (EPZA) to establish the Philippine Economic Zone Authority (PEZA). The PEZA
manages and operates four (4) public Special Economic Zone (ECOZONES) namely Mactan
Economic Zone (MEZ), Cavite Economic Zone (CEZ), Baguio City Economic Zone (BCEZ) and
Bataan Economic Zone (BEZ), now Freeport Area of Bataan (FAB). In the ECOZONEs, preferential
treatment for investments, and provision of improved infrastructure and services were offered to
attract business enterprises. As a result MEZ, CEZ and BCEZ were filled to their capacity. As
investments grew in the ECOZONEs, the amount of wastewater and solid waste was expected to
increase, and there was urgent need to prevent pollution in the ECOZONEs. Therefore, the
construction and rehabilitation of sewage treatment facilities were implemented in the four
ECOZONES directly managed by the PEZA.
Although Sewage Treatment Plant (STP) and Wastewater Reuse Facility (WRF) were installed,
the amount of treated water and their operation / utilization rate was low at the time of ex-post
evaluation, and the effectiveness of the project was limited. Further, the ex-post evaluation report
indicated that some areas within Mactan needed repair and/or rehabilitation of the existing sewage
collection system. In Bataan, besides the low locator filling rate, the necessity for construction
and/or renovation of the existing sewage collection system were indicated. In addition,
environmental audit/monitoring, and management and maintenance of the STP and the WRF were
outsourced to private entities. However, at the time of ex-post evaluation, the PEZA had not
outsourced its operations in Bataan, and it continued hiring private engineers and supervising the
operations by itself.
In this context, this project was selected for ex-post monitoring, while placing an emphasis on the
analysis of the operation / utilization rate, number of locators and the situations of the investment in
the ECOZONEs, the external monitoring consultants reviewed the findings from the field survey and
those of other research activities, and deducted a final conclusion.
2. Outline of the Monitoring Study
2.1 Duration of Monitoring Study
Duration of the Study: September 2012 – June 2013
Duration of the Field Study: November 27, 2012 – December 6, 2012
2-3
3. Monitoring Results
3.1 Effectiveness
3.1.1 Quantitative Effects
3.1.1.1 Results from Operation and Effect Indicators
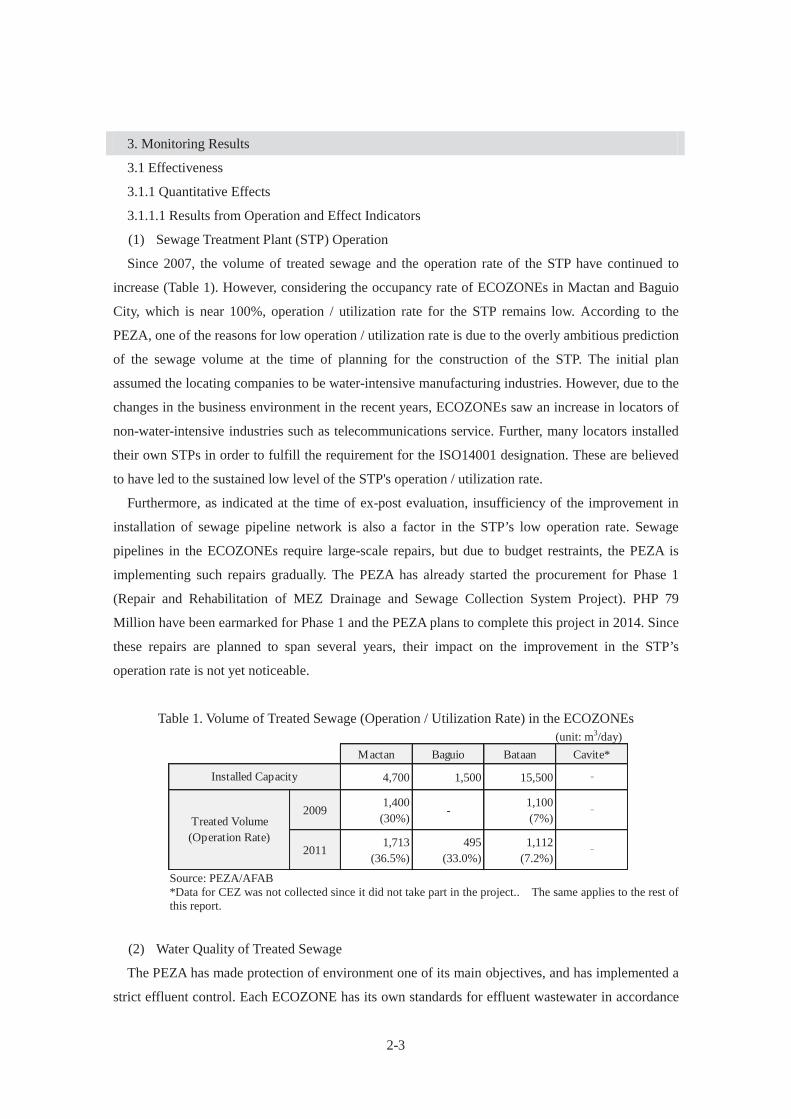
(1) Sewage Treatment Plant (STP) Operation
Since 2007, the volume of treated sewage and the operation rate of the STP have continued to
increase (Table 1). However, considering the occupancy rate of ECOZONEs in Mactan and Baguio
City, which is near 100%, operation / utilization rate for the STP remains low. According to the
PEZA, one of the reasons for low operation / utilization rate is due to the overly ambitious prediction
of the sewage volume at the time of planning for the construction of the STP. The initial plan
assumed the locating companies to be water-intensive manufacturing industries. However, due to the
changes in the business environment in the recent years, ECOZONEs saw an increase in locators of
non-water-intensive industries such as telecommunications service. Further, many locators installed
their own STPs in order to fulfill the requirement for the ISO14001 designation. These are believed
to have led to the sustained low level of the STP's operation / utilization rate.
Furthermore, as indicated at the time of ex-post evaluation, insufficiency of the improvement in
installation of sewage pipeline network is also a factor in the STP’s low operation rate. Sewage
pipelines in the ECOZONEs require large-scale repairs, but due to budget restraints, the PEZA is
implementing such repairs gradually. The PEZA has already started the procurement for Phase 1
(Repair and Rehabilitation of MEZ Drainage and Sewage Collection System Project). PHP 79
Million have been earmarked for Phase 1 and the PEZA plans to complete this project in 2014. Since
these repairs are planned to span several years, their impact on the improvement in the STP’s
operation rate is not yet noticeable.
Table 1. Volume of Treated Sewage (Operation / Utilization Rate) in the ECOZONEs (unit: m3/day)
Source: PEZA/AFAB *Data for CEZ was not collected since it did not take part in the project.. The same applies to the rest of this report.
(2) Water Quality of Treated Sewage
The PEZA has made protection of environment one of its main objectives, and has implemented a
strict effluent control. Each ECOZONE has its own standards for effluent wastewater in accordance
Mactan Baguio Bataan Cavite*
4,700 1,500 15,500
20091,400(30%)
-1,100(7%)
20111,713
(36.5%)495
(33.0%)1,112
(7.2%)
Installed Capacity
Treated Volume(Operation Rate)
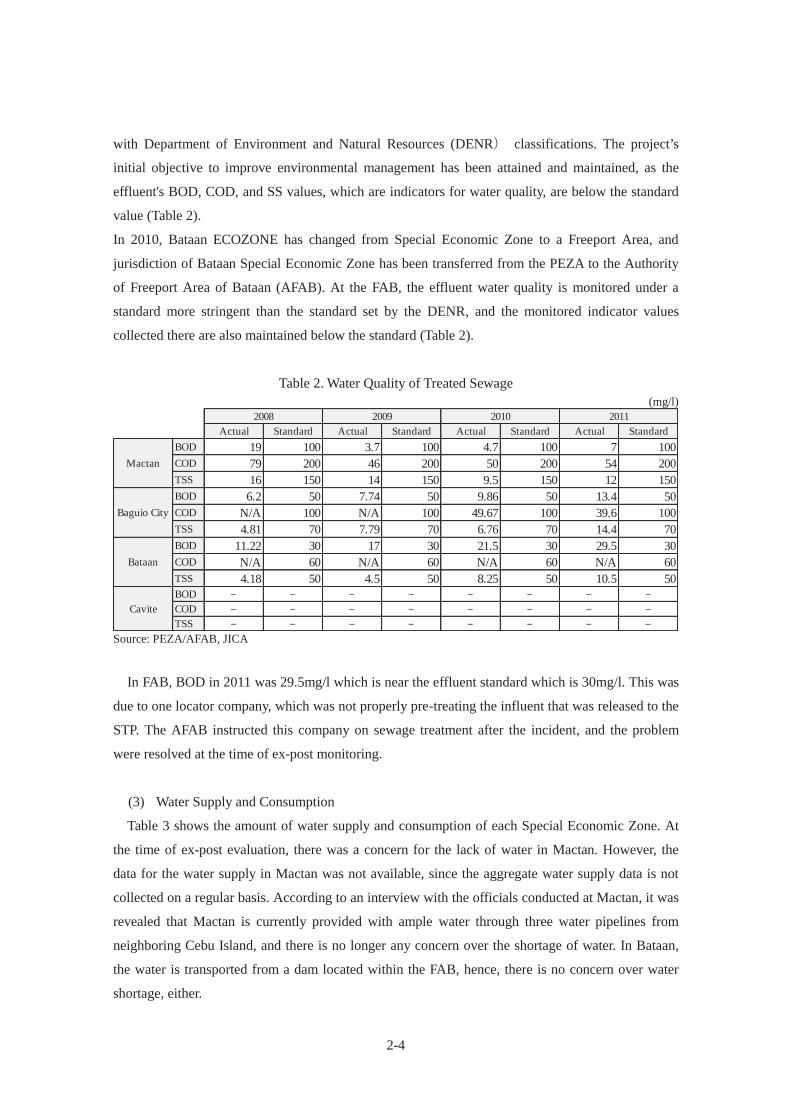
2-4
with Department of Environment and Natural Resources (DENR classifications. The project’s
initial objective to improve environmental management has been attained and maintained, as the
effluent's BOD, COD, and SS values, which are indicators for water quality, are below the standard
value (Table 2).
In 2010, Bataan ECOZONE has changed from Special Economic Zone to a Freeport Area, and
jurisdiction of Bataan Special Economic Zone has been transferred from the PEZA to the Authority
of Freeport Area of Bataan (AFAB). At the FAB, the effluent water quality is monitored under a
standard more stringent than the standard set by the DENR, and the monitored indicator values
collected there are also maintained below the standard (Table 2).
Table 2. Water Quality of Treated Sewage (mg/l)
Source: PEZA/AFAB, JICA
In FAB, BOD in 2011 was 29.5mg/l which is near the effluent standard which is 30mg/l. This was
due to one locator company, which was not properly pre-treating the influent that was released to the
STP. The AFAB instructed this company on sewage treatment after the incident, and the problem
were resolved at the time of ex-post monitoring.
(3) Water Supply and Consumption
Table 3 shows the amount of water supply and consumption of each Special Economic Zone. At
the time of ex-post evaluation, there was a concern for the lack of water in Mactan. However, the
data for the water supply in Mactan was not available, since the aggregate water supply data is not
collected on a regular basis. According to an interview with the officials conducted at Mactan, it was
revealed that Mactan is currently provided with ample water through three water pipelines from
neighboring Cebu Island, and there is no longer any concern over the shortage of water. In Bataan,
the water is transported from a dam located within the FAB, hence, there is no concern over water
shortage, either.
Actual Standard Actual Standard Actual Standard Actual StandardBOD 19 100 3.7 100 4.7 100 7 100COD 79 200 46 200 50 200 54 200TSS 16 150 14 150 9.5 150 12 150BOD 6.2 50 7.74 50 9.86 50 13.4 50COD N/A 100 N/A 100 49.67 100 39.6 100TSS 4.81 70 7.79 70 6.76 70 14.4 70BOD 11.22 30 17 30 21.5 30 29.5 30COD N/A 60 N/A 60 N/A 60 N/A 60TSS 4.18 50 4.5 50 8.25 50 10.5 50BODCODTSS
2011
Mactan
Baguio City
Bataan
Cavite
2008 2009 2010
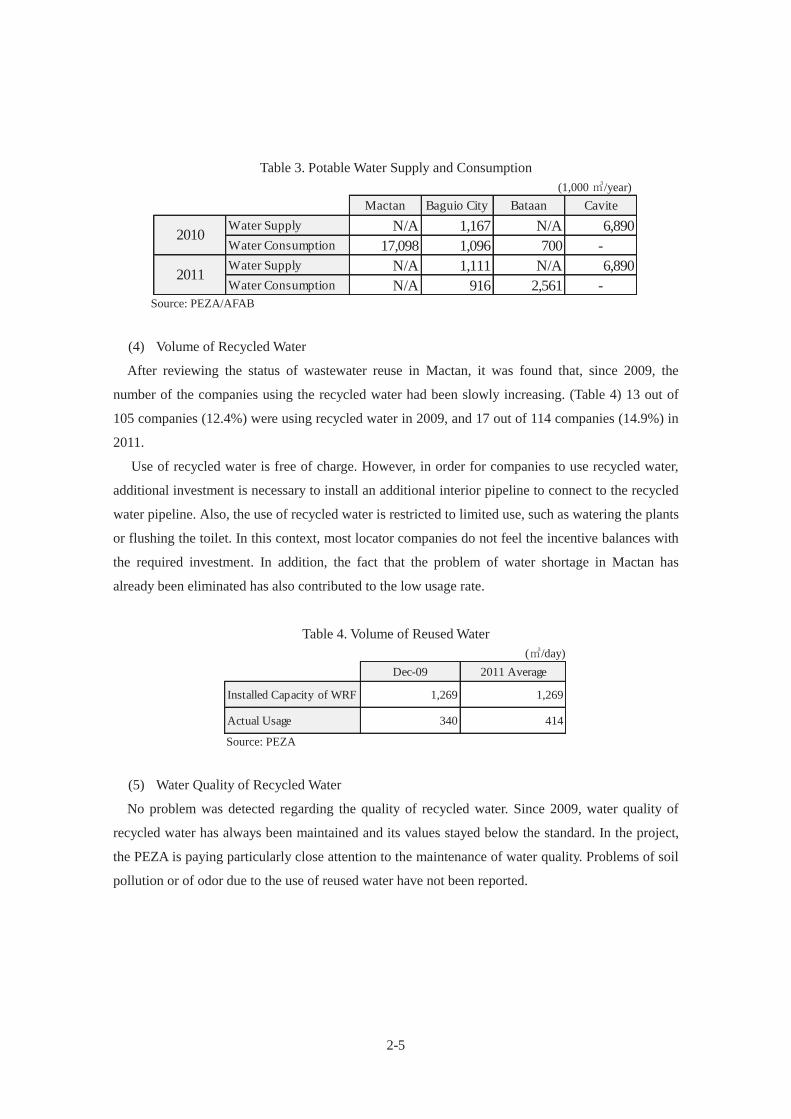
2-5
Table 3. Potable Water Supply and Consumption (1,000 /year)
Source: PEZA/AFAB
(4) Volume of Recycled Water
After reviewing the status of wastewater reuse in Mactan, it was found that, since 2009, the
number of the companies using the recycled water had been slowly increasing. (Table 4) 13 out of
105 companies (12.4%) were using recycled water in 2009, and 17 out of 114 companies (14.9%) in
2011.
Use of recycled water is free of charge. However, in order for companies to use recycled water,
additional investment is necessary to install an additional interior pipeline to connect to the recycled
water pipeline. Also, the use of recycled water is restricted to limited use, such as watering the plants
or flushing the toilet. In this context, most locator companies do not feel the incentive balances with
the required investment. In addition, the fact that the problem of water shortage in Mactan has
already been eliminated has also contributed to the low usage rate.
Table 4. Volume of Reused Water ( /day)
Source: PEZA
(5) Water Quality of Recycled Water
No problem was detected regarding the quality of recycled water. Since 2009, water quality of
recycled water has always been maintained and its values stayed below the standard. In the project,
the PEZA is paying particularly close attention to the maintenance of water quality. Problems of soil
pollution or of odor due to the use of reused water have not been reported.
Mactan Baguio City Bataan CaviteWater Supply N/A 1,167 N/A 6,890Water Consumption 17,098 1,096 700 -Water Supply N/A 1,111 N/A 6,890Water Consumption N/A 916 2,561 -
2010
2011
Dec-09 2011 Average
Installed Capacity of WRF 1,269 1,269
Actual Usage 340 414
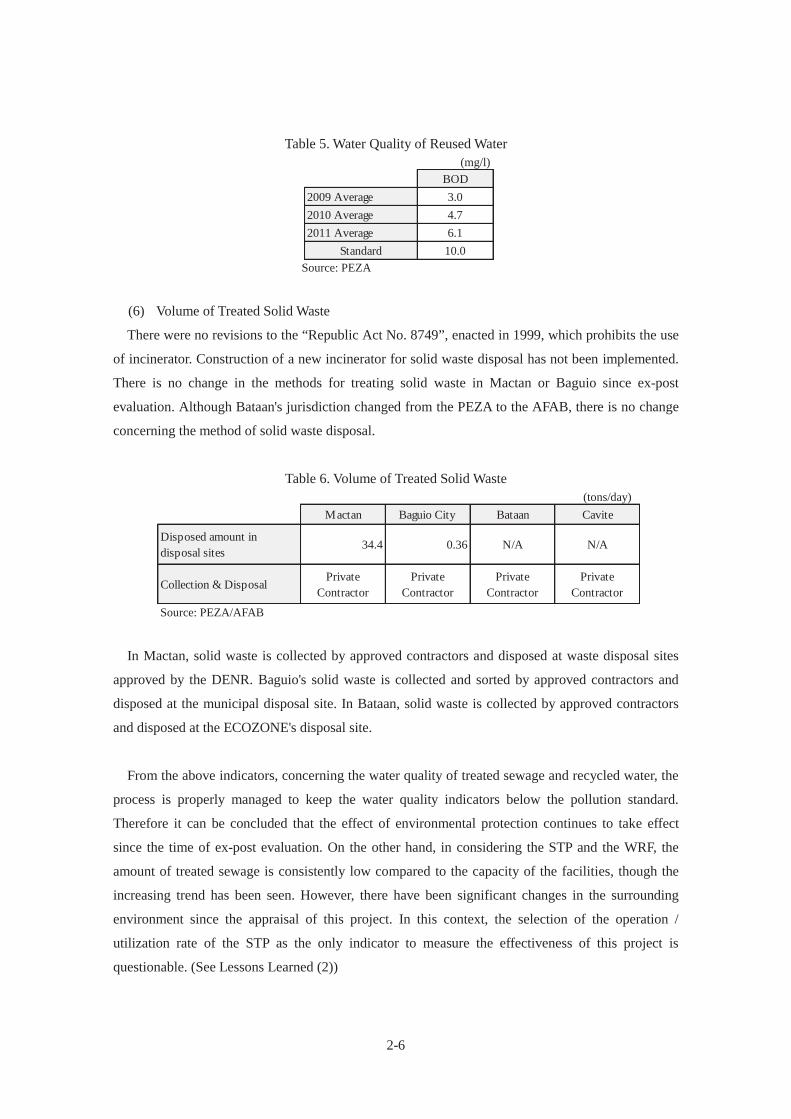
2-6
Table 5. Water Quality of Reused Water (mg/l)
Source: PEZA
(6) Volume of Treated Solid Waste
There were no revisions to the “Republic Act No. 8749”, enacted in 1999, which prohibits the use
of incinerator. Construction of a new incinerator for solid waste disposal has not been implemented.
There is no change in the methods for treating solid waste in Mactan or Baguio since ex-post
evaluation. Although Bataan's jurisdiction changed from the PEZA to the AFAB, there is no change
concerning the method of solid waste disposal.
Table 6. Volume of Treated Solid Waste (tons/day)
Source: PEZA/AFAB
In Mactan, solid waste is collected by approved contractors and disposed at waste disposal sites
approved by the DENR. Baguio's solid waste is collected and sorted by approved contractors and
disposed at the municipal disposal site. In Bataan, solid waste is collected by approved contractors
and disposed at the ECOZONE's disposal site.
From the above indicators, concerning the water quality of treated sewage and recycled water, the
process is properly managed to keep the water quality indicators below the pollution standard.
Therefore it can be concluded that the effect of environmental protection continues to take effect
since the time of ex-post evaluation. On the other hand, in considering the STP and the WRF, the
amount of treated sewage is consistently low compared to the capacity of the facilities, though the
increasing trend has been seen. However, there have been significant changes in the surrounding
environment since the appraisal of this project. In this context, the selection of the operation /
utilization rate of the STP as the only indicator to measure the effectiveness of this project is
questionable. (See Lessons Learned (2))
BOD2009 Average 3.02010 Average 4.72011 Average 6.1
Standard 10.0
Mactan Baguio City Bataan Cavite
Disposed amount indisposal sites
34.4 0.36 N/A N/A
Collection & DisposalPrivate
ContractorPrivate
ContractorPrivate
ContractorPrivate
Contractor
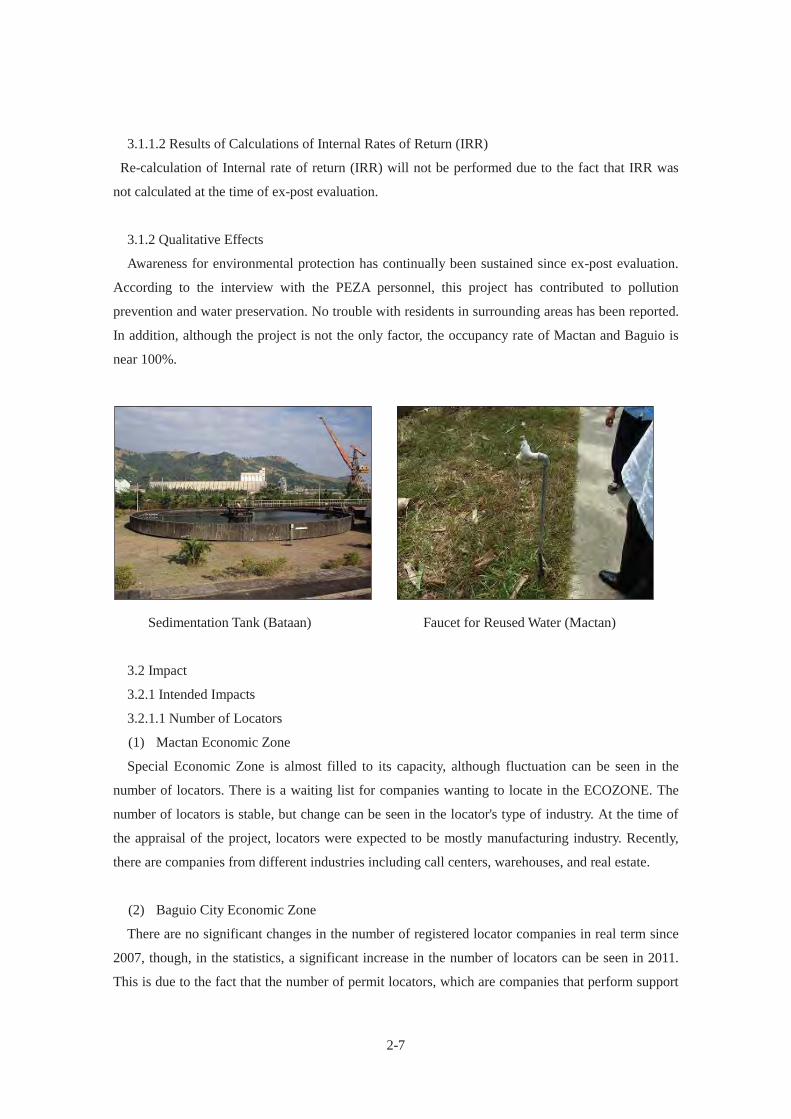
2-7
3.1.1.2 Results of Calculations of Internal Rates of Return (IRR)
Re-calculation of Internal rate of return (IRR) will not be performed due to the fact that IRR was
not calculated at the time of ex-post evaluation.
3.1.2 Qualitative Effects
Awareness for environmental protection has continually been sustained since ex-post evaluation.
According to the interview with the PEZA personnel, this project has contributed to pollution
prevention and water preservation. No trouble with residents in surrounding areas has been reported.
In addition, although the project is not the only factor, the occupancy rate of Mactan and Baguio is
near 100%.
Sedimentation Tank (Bataan) Faucet for Reused Water (Mactan)
3.2 Impact
3.2.1 Intended Impacts
3.2.1.1 Number of Locators
(1) Mactan Economic Zone
Special Economic Zone is almost filled to its capacity, although fluctuation can be seen in the
number of locators. There is a waiting list for companies wanting to locate in the ECOZONE. The
number of locators is stable, but change can be seen in the locator's type of industry. At the time of
the appraisal of the project, locators were expected to be mostly manufacturing industry. Recently,
there are companies from different industries including call centers, warehouses, and real estate.
(2) Baguio City Economic Zone
There are no significant changes in the number of registered locator companies in real term since
2007, though, in the statistics, a significant increase in the number of locators can be seen in 2011.
This is due to the fact that the number of permit locators, which are companies that perform support
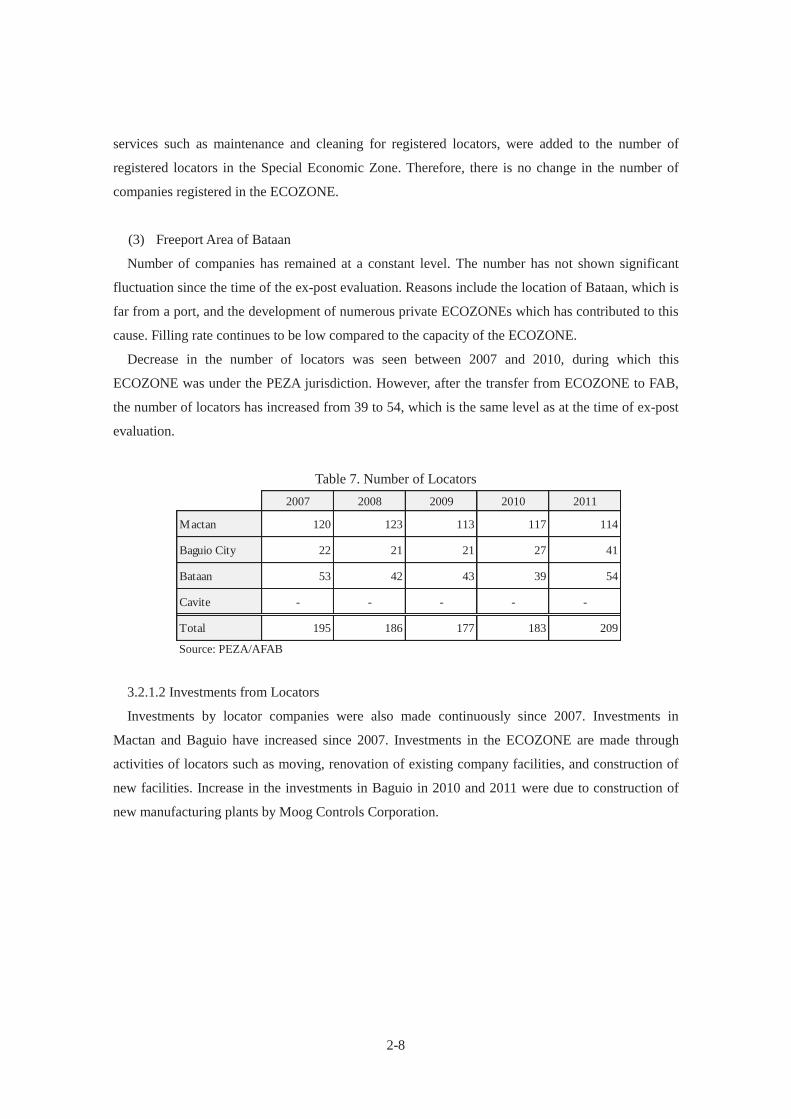
2-8
services such as maintenance and cleaning for registered locators, were added to the number of
registered locators in the Special Economic Zone. Therefore, there is no change in the number of
companies registered in the ECOZONE.
(3) Freeport Area of Bataan
Number of companies has remained at a constant level. The number has not shown significant
fluctuation since the time of the ex-post evaluation. Reasons include the location of Bataan, which is
far from a port, and the development of numerous private ECOZONEs which has contributed to this
cause. Filling rate continues to be low compared to the capacity of the ECOZONE.
Decrease in the number of locators was seen between 2007 and 2010, during which this
ECOZONE was under the PEZA jurisdiction. However, after the transfer from ECOZONE to FAB,
the number of locators has increased from 39 to 54, which is the same level as at the time of ex-post
evaluation.
Table 7. Number of Locators
Source: PEZA/AFAB
3.2.1.2 Investments from Locators
Investments by locator companies were also made continuously since 2007. Investments in
Mactan and Baguio have increased since 2007. Investments in the ECOZONE are made through
activities of locators such as moving, renovation of existing company facilities, and construction of
new facilities. Increase in the investments in Baguio in 2010 and 2011 were due to construction of
new manufacturing plants by Moog Controls Corporation.
2007 2008 2009 2010 2011
Mactan 120 123 113 117 114
Baguio City 22 21 21 27 41
Bataan 53 42 43 39 54
Cavite - - - - -
Total 195 186 177 183 209
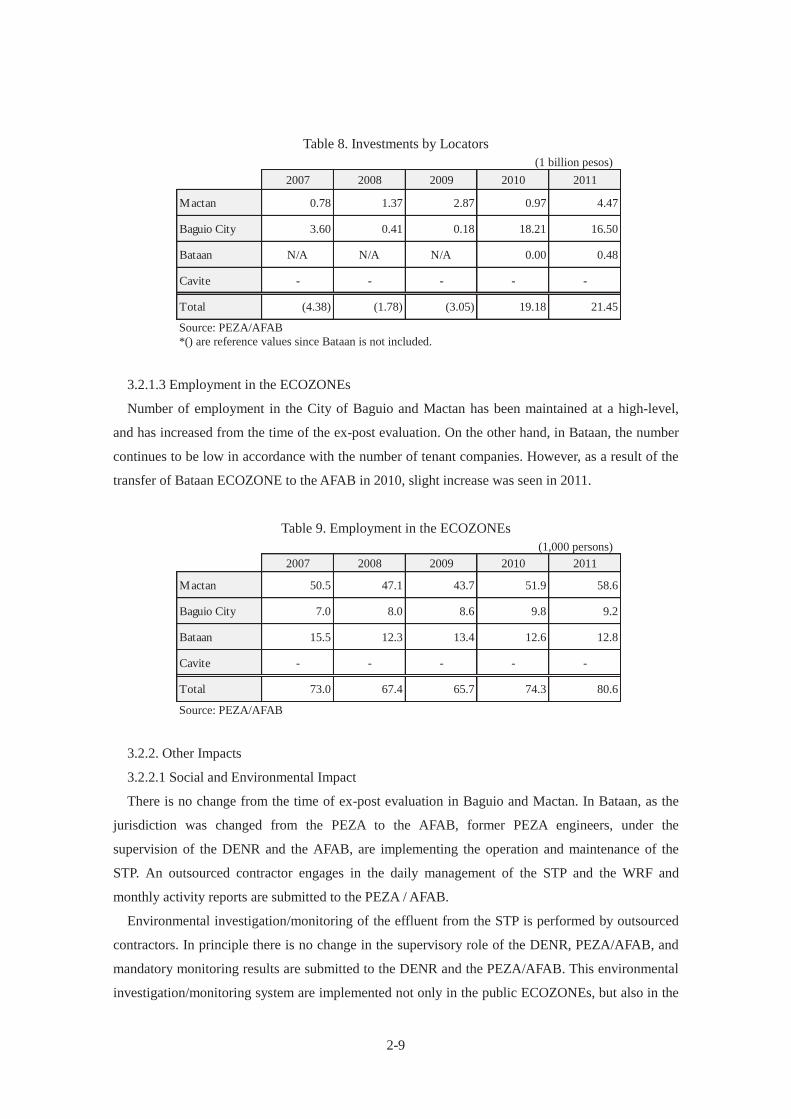
2-9
Table 8. Investments by Locators (1 billion pesos)
Source: PEZA/AFAB *() are reference values since Bataan is not included.
3.2.1.3 Employment in the ECOZONEs
Number of employment in the City of Baguio and Mactan has been maintained at a high-level,
and has increased from the time of the ex-post evaluation. On the other hand, in Bataan, the number
continues to be low in accordance with the number of tenant companies. However, as a result of the
transfer of Bataan ECOZONE to the AFAB in 2010, slight increase was seen in 2011.
Table 9. Employment in the ECOZONEs (1,000 persons)
Source: PEZA/AFAB
3.2.2. Other Impacts
3.2.2.1 Social and Environmental Impact
There is no change from the time of ex-post evaluation in Baguio and Mactan. In Bataan, as the
jurisdiction was changed from the PEZA to the AFAB, former PEZA engineers, under the
supervision of the DENR and the AFAB, are implementing the operation and maintenance of the
STP. An outsourced contractor engages in the daily management of the STP and the WRF and
monthly activity reports are submitted to the PEZA / AFAB.
Environmental investigation/monitoring of the effluent from the STP is performed by outsourced
contractors. In principle there is no change in the supervisory role of the DENR, PEZA/AFAB, and
mandatory monitoring results are submitted to the DENR and the PEZA/AFAB. This environmental
investigation/monitoring system are implemented not only in the public ECOZONEs, but also in the
2007 2008 2009 2010 2011
Mactan 0.78 1.37 2.87 0.97 4.47
Baguio City 3.60 0.41 0.18 18.21 16.50
Bataan N/A N/A N/A 0.00 0.48
Cavite - - - - -
Total (4.38) (1.78) (3.05) 19.18 21.45
2007 2008 2009 2010 2011
Mactan 50.5 47.1 43.7 51.9 58.6
Baguio City 7.0 8.0 8.6 9.8 9.2
Bataan 15.5 12.3 13.4 12.6 12.8
Cavite - - - - -
Total 73.0 67.4 65.7 74.3 80.6
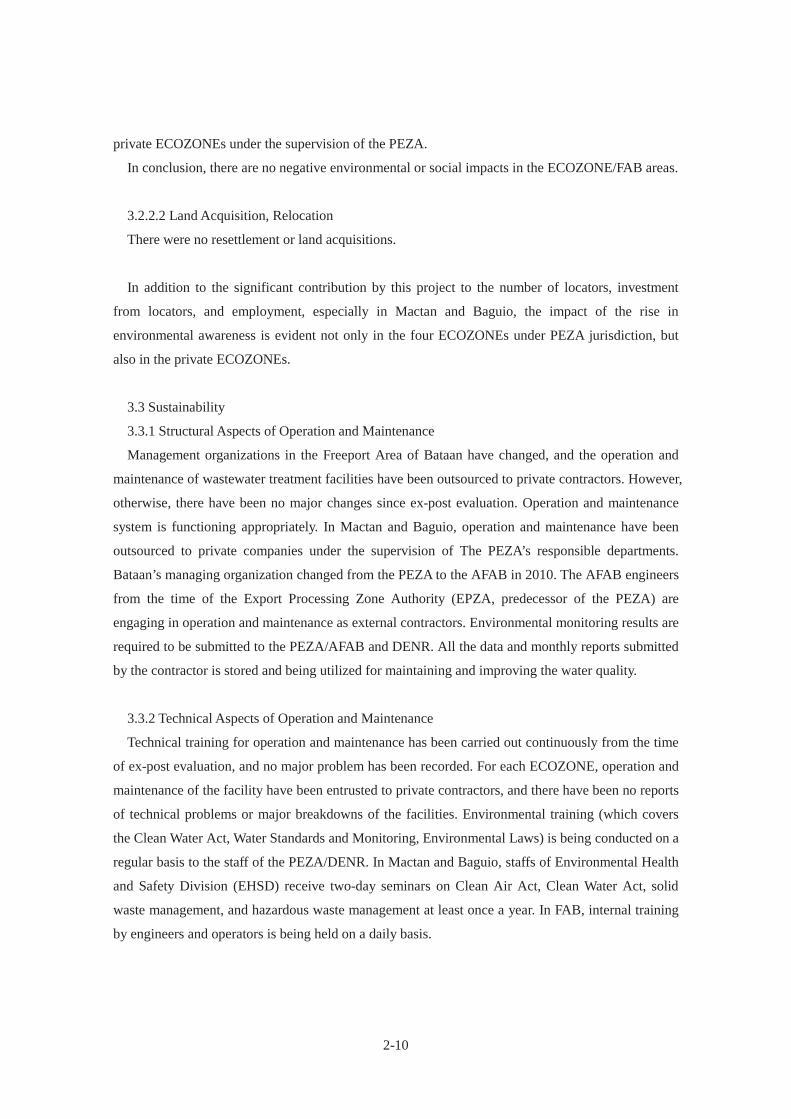
2-10
private ECOZONEs under the supervision of the PEZA.
In conclusion, there are no negative environmental or social impacts in the ECOZONE/FAB areas.
3.2.2.2 Land Acquisition, Relocation
There were no resettlement or land acquisitions.
In addition to the significant contribution by this project to the number of locators, investment
from locators, and employment, especially in Mactan and Baguio, the impact of the rise in
environmental awareness is evident not only in the four ECOZONEs under PEZA jurisdiction, but
also in the private ECOZONEs.
3.3 Sustainability
3.3.1 Structural Aspects of Operation and Maintenance
Management organizations in the Freeport Area of Bataan have changed, and the operation and
maintenance of wastewater treatment facilities have been outsourced to private contractors. However,
otherwise, there have been no major changes since ex-post evaluation. Operation and maintenance
system is functioning appropriately. In Mactan and Baguio, operation and maintenance have been
outsourced to private companies under the supervision of The PEZA’s responsible departments.
Bataan’s managing organization changed from the PEZA to the AFAB in 2010. The AFAB engineers
from the time of the Export Processing Zone Authority (EPZA, predecessor of the PEZA) are
engaging in operation and maintenance as external contractors. Environmental monitoring results are
required to be submitted to the PEZA/AFAB and DENR. All the data and monthly reports submitted
by the contractor is stored and being utilized for maintaining and improving the water quality.
3.3.2 Technical Aspects of Operation and Maintenance
Technical training for operation and maintenance has been carried out continuously from the time
of ex-post evaluation, and no major problem has been recorded. For each ECOZONE, operation and
maintenance of the facility have been entrusted to private contractors, and there have been no reports
of technical problems or major breakdowns of the facilities. Environmental training (which covers
the Clean Water Act, Water Standards and Monitoring, Environmental Laws) is being conducted on a
regular basis to the staff of the PEZA/DENR. In Mactan and Baguio, staffs of Environmental Health
and Safety Division (EHSD) receive two-day seminars on Clean Air Act, Clean Water Act, solid
waste management, and hazardous waste management at least once a year. In FAB, internal training
by engineers and operators is being held on a daily basis.

2-11
3.3.3 Financial Aspects of Operation and Maintenance
The PEZA has ensured sufficient profit in operating profit and profit after tax over the past 8 years.
No problem can be found concerning the financial status. (Table10) According to interview with the
PEZA, there were no abnormal or extraordinary expenditure that would have impact on the financial
situation. (Table 11)
Setting and collection of sewage treatment fees and wastewater reuse fee of Mactan, which was
under deliberation in 2007, has not yet been implemented. (Table 15) The matter is still under
deliberation. In BCEZ and FAB, sewage treatment fee has been levied continually from 2007.
Table 10. Financial Condition of the PEZA (1,000 pesos)
Source: PEZA
Table 11. Breakdown of Expenses (1,000 pesos)
Source: PEZA
On the contrary, the AFAB is in a state of deficit in its income and net income since its inception.
(Table 12, Table 13) Under the new law (Republic Act No. 9728), the AFAB should receive a 500
million pesos budget annually for the five (5) years after its establishment, as subsidy from the
Philippine government. However, no such budget was received in 2010 and only 100 million pesos
was approved in 2011. The AFAB has requested for an allocation of five hundred million from the
Philippine Government budget for fiscal years 2012 and 2013 but the government has only approved
100 million pesos for each year. These cases are not uncommon in the Philippines.
AFAB has drafted a master plan for the renovation of the FAB. Improvement of the operation /
utilization rate of the STP is included in the plan. AFAB plans on continuing the request for
additional budget. Should they receive the full requested budget, the AFAB plans to invest in the
2007 2008 2009 2010 2011
Income 7,177,081 6,389,471 5,509,578 6,257,862 7,075,661
Expenses 6,256,809 5,658,067 5,182,953 5,660,664 6,169,785
Income from Operations 920,272 731,404 326,625 597,198 905,876
Other Income (Expenses) 72,521 -314,974 196,960 -3,720 127,810
Income Tax 304,350 117,015 151,042 172,556 293,571
Net Income 688,444 299,415 372,542 420,923 740,116
2007 2008 2009 2010 2011
Personnel Expenses 367,566 367,327 495,775 567,138 561,047
Maintenance andOperation Expenses
5,889,243 5,290,740 4,687,178 5,093,526 5,608,738
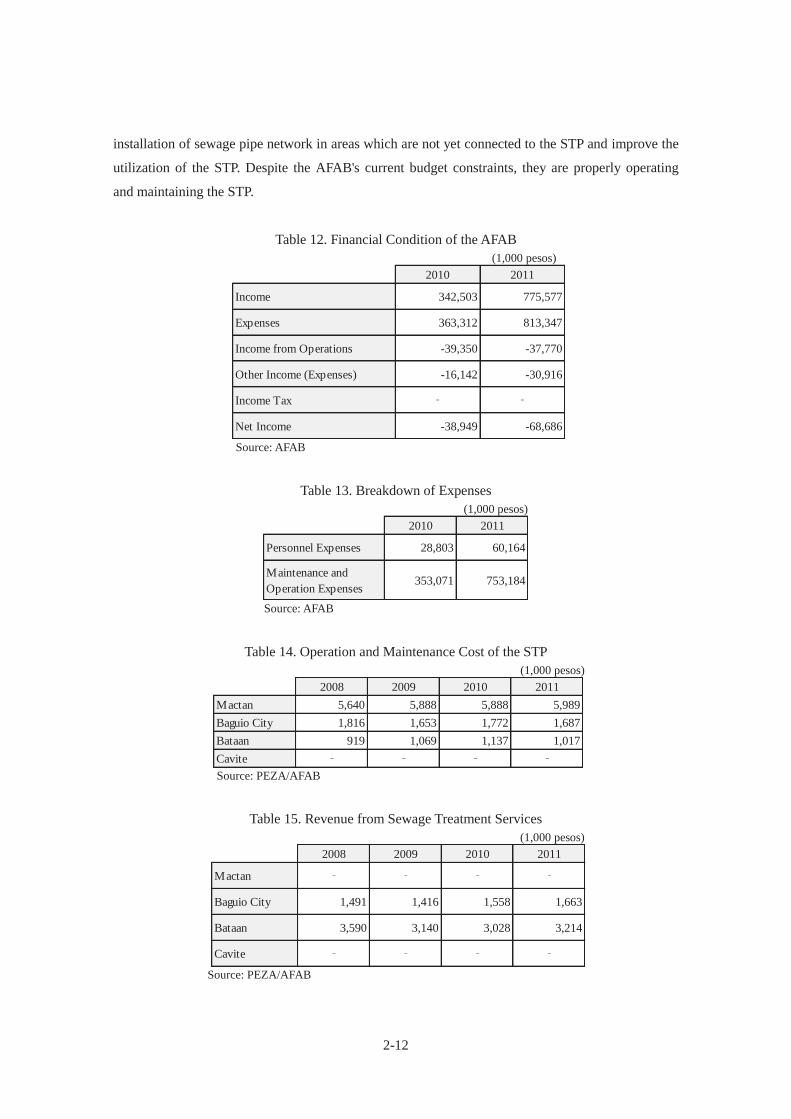
2-12
installation of sewage pipe network in areas which are not yet connected to the STP and improve the
utilization of the STP. Despite the AFAB's current budget constraints, they are properly operating
and maintaining the STP.
Table 12. Financial Condition of the AFAB (1,000 pesos)
Source: AFAB
Table 13. Breakdown of Expenses (1,000 pesos)
Source: AFAB
Table 14. Operation and Maintenance Cost of the STP (1,000 pesos)
Source: PEZA/AFAB
Table 15. Revenue from Sewage Treatment Services (1,000 pesos)
Source: PEZA/AFAB
2010 2011
Income 342,503 775,577
Expenses 363,312 813,347
Income from Operations -39,350 -37,770
Other Income (Expenses) -16,142 -30,916
Income Tax
Net Income -38,949 -68,686
2010 2011
Personnel Expenses 28,803 60,164
Maintenance andOperation Expenses
353,071 753,184
2008 2009 2010 2011Mactan 5,640 5,888 5,888 5,989Baguio City 1,816 1,653 1,772 1,687Bataan 919 1,069 1,137 1,017Cavite
2008 2009 2010 2011
Mactan
Baguio City 1,491 1,416 1,558 1,663
Bataan 3,590 3,140 3,028 3,214
Cavite
2-13
3.3.4 Current Status of Operation and Maintenance
There is no change in the status of operation and maintenance from the time of ex-post evaluation.
Operation and maintenance is carried out properly based upon the manual. In Mactan, operation and
maintenance is done by 3 shifts of 5 workers and 2 back-up workers, and the periodic inspection has
also been carried out properly. Check-up of all equipment in the plant is carried out daily, and
ampere voltage information of the device is recorded. Cleaning of the pump stations, manhole
stations, strainer of final sedimentation tank is done on a daily basis. Removal of suspended solids in
the tanks, such as plastic and paper, and cleaning of pipes for water reuse facility is being conducted
on a regular basis several times a month. With respect to the management of the facility, there has
not been an issue to date from the time of the ex-post evaluation. There is no problem obtaining
spare parts. Their purchase is to be approved by the PEZA and executed on the needs basis.
From the above, the operation and maintenance conducted by the PEZA is satisfactory, and no
major problem has been identified. On the other hand, although the AFAB is sufficiently
implementing the operation and maintenance activities such as water quality monitoring within the
limits of its budget, governmental budget has not been allocated and future prospects remain unclear.
The AFAB has fallen into a deficit and is in a severe financial situation.
4. Conclusion, Lessons Learned and Recommendations
4.1 Conclusion
In Mactan, Baguio City, and Freeport Area of Bataan, the operating / utilization rate of the
wastewater treatment facilities has increased, though slightly. However, the operation / utilization
rate is constantly low compared to the projected / designed capacity of the facility, and its value
remains below 50%. One of the major causes is the increase in the number of non-water-intensive,
non-manufacturing locators resulting from the diversification of business environment. Also,
locators are constructing their own STP facilities to obtain the ISO certification. In addition, as has
been detected prior to this report, the upgrading/rehabilitation of the existing sewage collection
system has been prolonged and not sufficient areas have been covered, which is also a contributing
factor to the situation. Therefore, it can be speculated that the dramatic increase in the utilization rate
in the future is unlikely.
On the other hand, in terms of prevention of pollution of the surrounding environment, which was
one of the objectives of the project, the PEZA and the AFAB are particularly observant, and water
quality survey has been carried out continually on a regular basis. The indicators for the water
quality are maintained below the water quality standard, and the STP’s effluent and Mactan's
recycled water quality is maintained at a satisfactory level. There have been no reports of soil
contamination or odor. In this regard, the role played by this project is particularly significant.
2-14
4.2 Recommendations
None.
4.3 Lessons Learned
(1) PEZA
In planning of water use project in the ECOZONE, it is desirable to predict the potential industries
of locators, as much as possible. At the time of appraisal, locators from water-intensive industries
such as garment and steel industries were assumed to be potential locators. However, rapid growth of
information and technology industries and other factors have led to a change in the locator industries.
Predicting such changes is difficult. While taking into account the “future economic conditions”,
consideration should be given to the possibility of changes in the industry of the locators at the time
of appraisal; review, including the reconsideration of the project at a reasonable timing, is desirable.
Also, if the promotion of environmental protection by water conservation is conducted at
government level and ample budget can be allocated for this cause, then raising the operation /
utilization rate of the existing facilities through the completion of proposed sewage collection system
projects in the ECOZONEs and the strengthening of environmental awareness programs for locators
will become possible. Because Mactan and Baguio are leading tourist destinations in the Philippines,
linking such efforts to tourism projects may lead to further promotion of environment protection.
(2) JICA
Operation / utilization rate has been adopted as the indicator to evaluate the effectiveness of this
project. However, since the objective of the project is to prevent pollution and to improve public
well-being in the neighboring areas through installation of the STP and the WRF, operation /
utilization rate should not be the only indicator to measure the effectiveness of this project. As for
the indicators used for the evaluation of such project, in order to assess the project from different
viewpoints, it is desirable to use multiple indicators, or to leave a certain flexibility to revise the
indicators when the situation evolves. In this project, for example, the proportion of locators using
the STP (including the STPs installed by the locators themselves) may be an effective indicator.
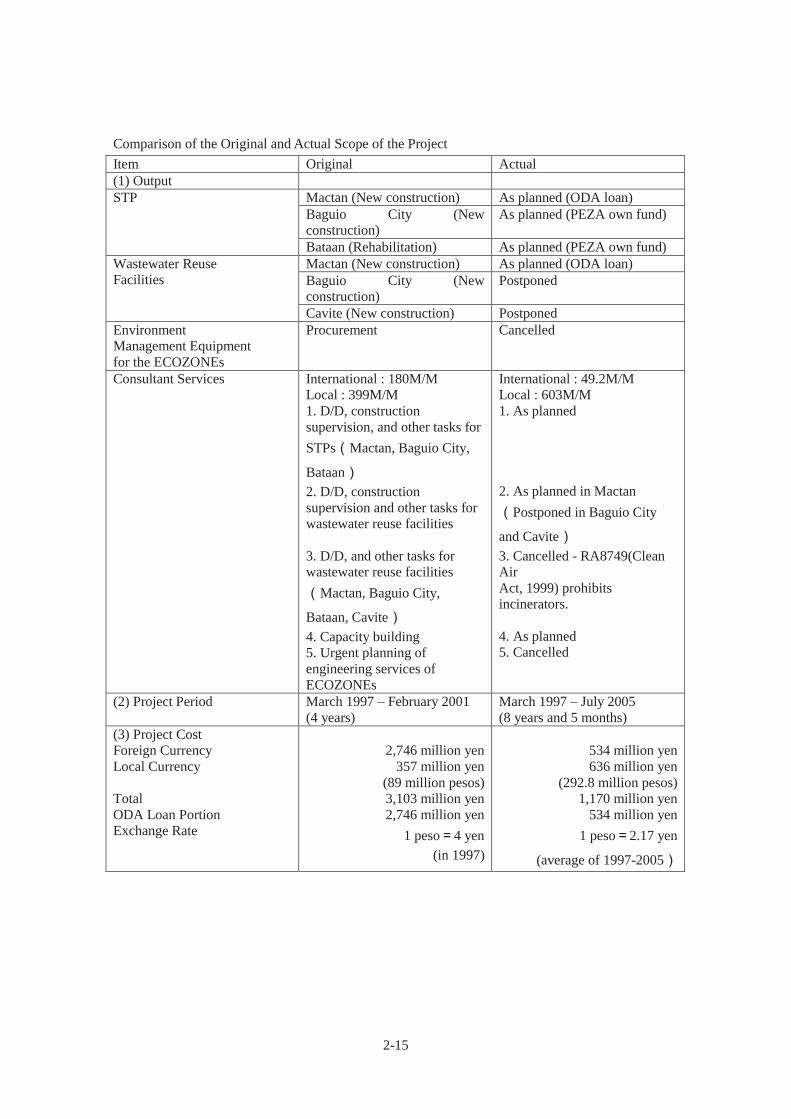
2-15
Comparison of the Original and Actual Scope of the Project Item Original Actual (1) Output STP Mactan (New construction) As planned (ODA loan)
Baguio City (New construction)
As planned (PEZA own fund)
Bataan (Rehabilitation) As planned (PEZA own fund) Wastewater Reuse Facilities
Mactan (New construction) As planned (ODA loan) Baguio City (New construction)
Postponed
Cavite (New construction) Postponed Environment Management Equipment for the ECOZONEs
Procurement Cancelled
Consultant Services International : 180M/M Local : 399M/M 1. D/D, construction supervision, and other tasks for STPs Mactan, Baguio City,
Bataan2. D/D, construction supervision and other tasks for wastewater reuse facilities 3. D/D, and other tasks for wastewater reuse facilities
Mactan, Baguio City,
Bataan, Cavite4. Capacity building 5. Urgent planning of engineering services of ECOZONEs
International : 49.2M/M Local : 603M/M 1. As planned 2. As planned in Mactan
Postponed in Baguio City
and Cavite3. Cancelled - RA8749(Clean Air Act, 1999) prohibits incinerators. 4. As planned 5. Cancelled
(2) Project Period March 1997 – February 2001 (4 years)
March 1997 – July 2005 (8 years and 5 months)
(3) Project Cost Foreign Currency Local Currency Total ODA Loan Portion Exchange Rate
2,746 million yen
357 million yen (89 million pesos) 3,103 million yen 2,746 million yen
1 peso 4 yen (in 1997)
534 million yen 636 million yen
(292.8 million pesos) 1,170 million yen
534 million yen 1 peso 2.17 yen
(average of 1997-2005

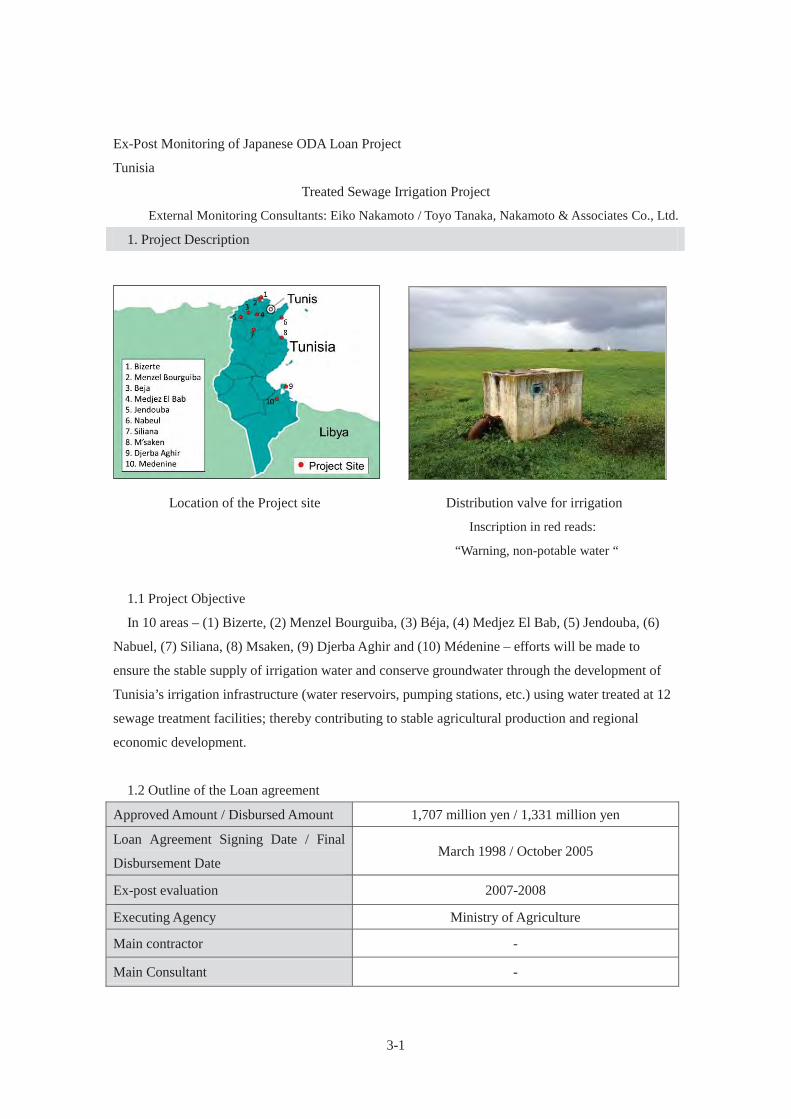
3-1
Ex-Post Monitoring of Japanese ODA Loan Project
Tunisia
Treated Sewage Irrigation Project
External Monitoring Consultants: Eiko Nakamoto / Toyo Tanaka, Nakamoto & Associates Co., Ltd.
1. Project Description
Location of the Project site Distribution valve for irrigation
Inscription in red reads:
“Warning, non-potable water “
1.1 Project Objective
In 10 areas – (1) Bizerte, (2) Menzel Bourguiba, (3) Béja, (4) Medjez El Bab, (5) Jendouba, (6)
Nabuel, (7) Siliana, (8) Msaken, (9) Djerba Aghir and (10) Médenine – efforts will be made to
ensure the stable supply of irrigation water and conserve groundwater through the development of
Tunisia’s irrigation infrastructure (water reservoirs, pumping stations, etc.) using water treated at 12
sewage treatment facilities; thereby contributing to stable agricultural production and regional
economic development.
1.2 Outline of the Loan agreement Approved Amount / Disbursed Amount 1,707 million yen / 1,331 million yen
Loan Agreement Signing Date / Final
Disbursement Date March 1998 / October 2005
Ex-post evaluation 2007-2008
Executing Agency Ministry of Agriculture
Main contractor -
Main Consultant -

3-2
1.3 Background of the Ex-Post Monitoring
Rainfall is sparse in Tunisia, and most of the arable land is found in either arid or semi-arid areas.
Agricultural regions that rely primarily on rainwater frequently suffer major damage from drought.
To stabilize agricultural production and increase crop yields, development of irrigation facilities was
indispensable. On the other hand, since surface and groundwater resources are limited, securing
ample water for agricultural irrigation was a major challenge, especially in the dry season. Under
these circumstances, treated sewage was an important source of relatively stable water supply
regardless of rainy season or dry season, and so, effective utilization of this water resource was
sought. Around 1965, Tunisia began implementing a series of irrigation projects based on the use of
treated sewage water for agriculture, and, on the basis of that experience, promoted development
plans (including the present project) related to sewage treatment facilities and irrigation facilities. In
accordance with this situation, this project installed infrastructures for irrigation utilizing treated
sewage from 12 sewage treatment plants in 10 regions.
However, at the time of ex-post evaluation (fiscal year 2007), the effects of the project were
limited compared to the plan. Because infrastructure installation was cancelled in some regions
(Menzel Bourguiba and Jendouba), number of beneficiary rural households was 61% of the plan;
area irrigated by treated sewage remained at 26%. Among the obstacles in the promotion of using
treated water was the strong reluctance to use treated water by older generations, who were insistent
on traditional farming methods.
Ex-post evaluation made recommendations to conduct field studies in the regions already using
treated sewage irrigation, to promote exchange of information within each generation, and to deepen
the farmers’ understanding of treated sewage irrigation through regularly held seminars on crops
suitable to treated sewage irrigation and its cultivation method.
Therefore, this project was selected for ex-post monitoring and reviewed under each criterion with
the findings from the field survey and other research activities with a final conclusion being drawn.
2. Outline of the Monitoring Study
2.1 External Monitoring Consultants
Eiko Nakamoto (Nakamoto & Associates Co., Ltd.)
Toyo Tanaka (Nakamoto & Associates Co., Ltd.)
2.2 Duration of Monitoring Study
Duration of the study: September 2012 – June 2013
Duration of the Field Study: 26 November – 14 December 2012

3-3
2.3 Constraints of the Monitoring Study
Obtaining all of the detailed data for each region was impossible due to the limitation of the
survey period. The missing data were supplemented by national statistical data and by interviews to
relevant authorities.
3. Results of the study
3.1 Effectiveness
3.1.1 Quantitative effects
3.1.1.1 Results from Operation and Effect Indicators
3.1.1.1.1 Number of Beneficiary Rural Households
In M’saken, the number of beneficiary rural households is approximately the same or slightly
higher compared to the time of ex-post evaluation (see Table 1). In Nabeul, sewage treatment station,
SE3, has been omitted from the calculations, but no additional data could be obtained. It should be
noted that these numbers refer to the number of rural households in the area covered by treated
sewage irrigation, and do not represent the number of households actually using the irrigation.
Consequently, these numbers cannot be an adequate indicator for determining the effectiveness of
this project, and no further analysis will be made based on these numbers. Refer to Table 3 for the
number of rural households actually using the irrigation. Also, at the time of ex-post evaluation,
Agricultural Development Group (GDA) did not exist in Bizerte; GDA was to be organized in 2006,
and treated sewage irrigation was planned to begin in 2008. However, GDA has not been founded to
this day.
Table 1 Number of Beneficiary Rural Households (Unit: households)
Planned 2006** 2007 2008 2009 2010 2011
Bizerte* 2 16 13 13 13 13 13Beja*(Medjez El Bab)
8 21 N/A N/A N/A N/A N/A
Nabeul (SE3/SE4) 1,044 610 324 421 443 443 443
Siliana 27 22 23 23 23 20 20
M'saken 100 70 120 120 125 132 132
Djerba Aghir* 55 36 36 36 37 38 38
Medenine* 40 39 39 39 39 39 39
Total 1,276 814 555 652 680 685 685 Source: Regional Commissariat of Agricultural Development (CRDA)
* sites visited **ex-post evaluation Note: Years in which the data was unavailable is marked with « N/A » .
3.1.1.1.2 Number of Rural Households Utilizing Irrigation
Regarding the number of rural households utilizing irrigation, comparison with ex-post evaluation
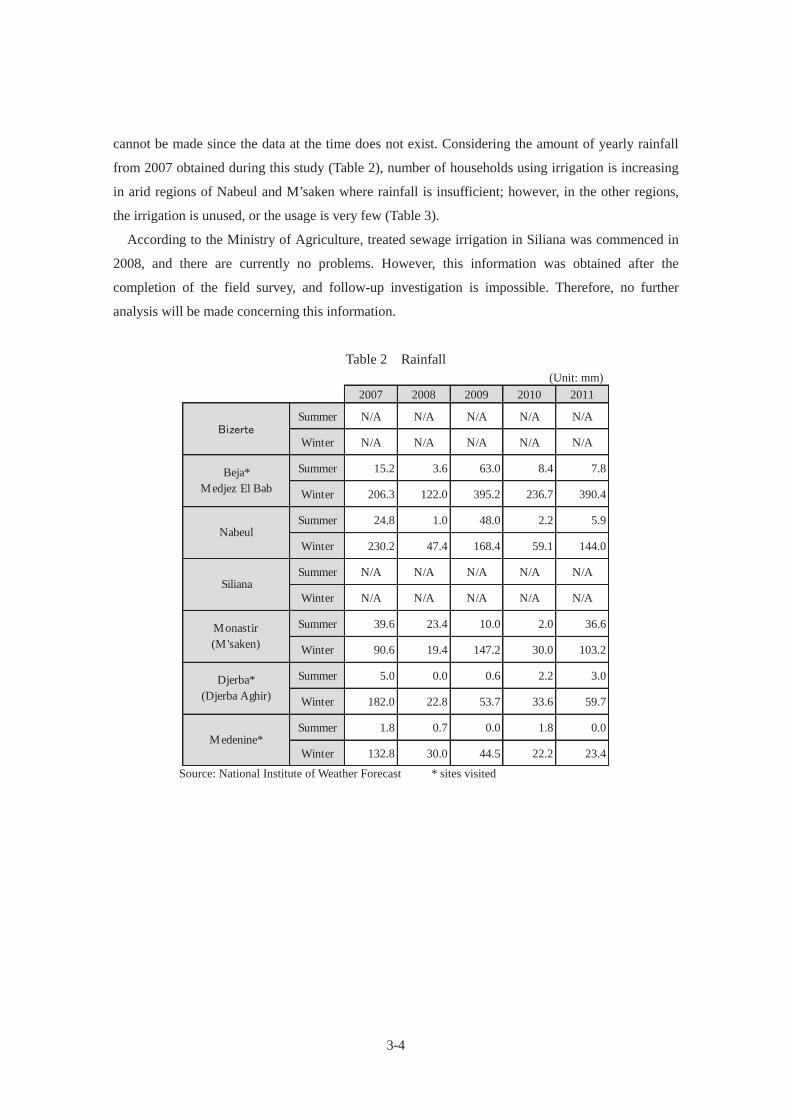
3-4
cannot be made since the data at the time does not exist. Considering the amount of yearly rainfall
from 2007 obtained during this study (Table 2), number of households using irrigation is increasing
in arid regions of Nabeul and M’saken where rainfall is insufficient; however, in the other regions,
the irrigation is unused, or the usage is very few (Table 3).
According to the Ministry of Agriculture, treated sewage irrigation in Siliana was commenced in
2008, and there are currently no problems. However, this information was obtained after the
completion of the field survey, and follow-up investigation is impossible. Therefore, no further
analysis will be made concerning this information.
Table 2 Rainfall (Unit: mm)
2007 2008 2009 2010 2011
Summer N/A N/A N/A N/A N/A
Winter N/A N/A N/A N/A N/A
Summer 15.2 3.6 63.0 8.4 7.8
Winter 206.3 122.0 395.2 236.7 390.4
Summer 24.8 1.0 48.0 2.2 5.9
Winter 230.2 47.4 168.4 59.1 144.0
Summer N/A N/A N/A N/A N/A
Winter N/A N/A N/A N/A N/A
Summer 39.6 23.4 10.0 2.0 36.6
Winter 90.6 19.4 147.2 30.0 103.2
Summer 5.0 0.0 0.6 2.2 3.0
Winter 182.0 22.8 53.7 33.6 59.7
Summer 1.8 0.7 0.0 1.8 0.0
Winter 132.8 30.0 44.5 22.2 23.4
Siliana
Medenine*
Beja*Medjez El Bab
Nabeul
Monastir(M'saken)
Djerba*(Djerba Aghir)
Source: National Institute of Weather Forecast * sites visited
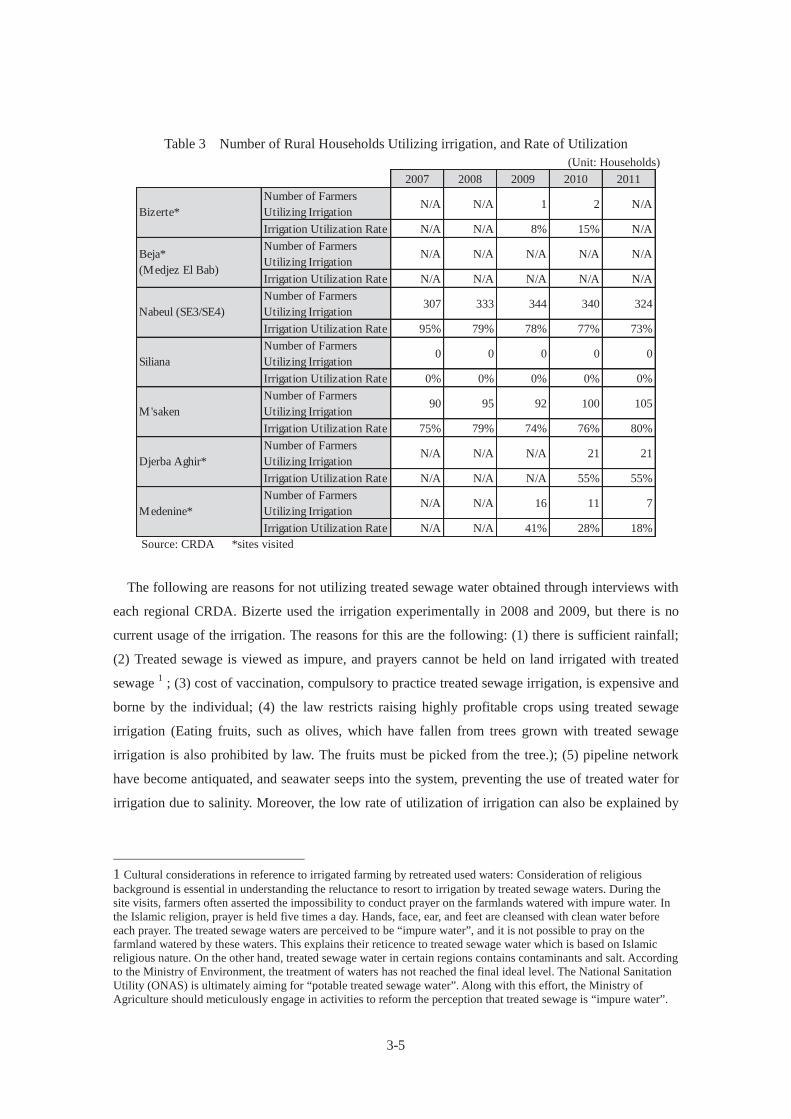
3-5
Table 3 Number of Rural Households Utilizing irrigation, and Rate of Utilization (Unit: Households)
2007 2008 2009 2010 2011Number of FarmersUtilizing Irrigation
N/A N/A 1 2 N/A
Irrigation Utilization Rate N/A N/A 8% 15% N/ANumber of FarmersUtilizing Irrigation
N/A N/A N/A N/A N/A
Irrigation Utilization Rate N/A N/A N/A N/A N/ANumber of FarmersUtilizing Irrigation
307 333 344 340 324
Irrigation Utilization Rate 95% 79% 78% 77% 73%Number of FarmersUtilizing Irrigation
0 0 0 0 0
Irrigation Utilization Rate 0% 0% 0% 0% 0%Number of FarmersUtilizing Irrigation
90 95 92 100 105
Irrigation Utilization Rate 75% 79% 74% 76% 80%Number of FarmersUtilizing Irrigation
N/A N/A N/A 21 21
Irrigation Utilization Rate N/A N/A N/A 55% 55%Number of FarmersUtilizing Irrigation
N/A N/A 16 11 7
Irrigation Utilization Rate N/A N/A 41% 28% 18%
Bizerte*
Djerba Aghir*
Medenine*
Beja*(Medjez El Bab)
Nabeul (SE3/SE4)
Siliana
M'saken
Source: CRDA *sites visited
The following are reasons for not utilizing treated sewage water obtained through interviews with
each regional CRDA. Bizerte used the irrigation experimentally in 2008 and 2009, but there is no
current usage of the irrigation. The reasons for this are the following: (1) there is sufficient rainfall;
(2) Treated sewage is viewed as impure, and prayers cannot be held on land irrigated with treated
sewage 1 ; (3) cost of vaccination, compulsory to practice treated sewage irrigation, is expensive and
borne by the individual; (4) the law restricts raising highly profitable crops using treated sewage
irrigation (Eating fruits, such as olives, which have fallen from trees grown with treated sewage
irrigation is also prohibited by law. The fruits must be picked from the tree.); (5) pipeline network
have become antiquated, and seawater seeps into the system, preventing the use of treated water for
irrigation due to salinity. Moreover, the low rate of utilization of irrigation can also be explained by
1 Cultural considerations in reference to irrigated farming by retreated used waters: Consideration of religious background is essential in understanding the reluctance to resort to irrigation by treated sewage waters. During the site visits, farmers often asserted the impossibility to conduct prayer on the farmlands watered with impure water. In the Islamic religion, prayer is held five times a day. Hands, face, ear, and feet are cleansed with clean water before each prayer. The treated sewage waters are perceived to be “impure water”, and it is not possible to pray on the farmland watered by these waters. This explains their reticence to treated sewage water which is based on Islamic religious nature. On the other hand, treated sewage water in certain regions contains contaminants and salt. According to the Ministry of Environment, the treatment of waters has not reached the final ideal level. The National Sanitation Utility (ONAS) is ultimately aiming for “potable treated sewage water”. Along with this effort, the Ministry of Agriculture should meticulously engage in activities to reform the perception that treated sewage is “impure water”.

3-6
the dissolution of the GDA at the event of the revolution of 2011.2 The low utilization rate in Béja
and Medjez El Bab, in addition to the reasons shown for Bizerte, is as follows: (6) the revolution has
caused bankruptcy or closing of industrial farmers who were primary users of the irrigation; (7) there
is frequent system failure and water outage, since the quality of treated sewage is poor, and
contaminants clog the irrigation pumps. In Medenine, additional reasons are as follows: (8) many of
the farmers, which are small, part time farmers, are indifferent to treated sewage irrigation due to its
cost; (9) many farmers prefer not to rely on irrigation because of occasional water outages due to
pump failure or electric bill arrears; (10) Olives, which is the primary crop in Medenine, can be
raised using rainwater, and there is no incentive in using the irrigation. In Djerba Aghir, irrigation is
no longer utilized since February 2012, since the GDA is non-existent after the revolution, and
operation and maintenance cost cannot be paid (See Footnote 2). At the visited sites, the utilization
of irrigation were very few or none, and there were no new applications for utilization.
3.1.1.1.3 Irrigated Areas
Since the ex-post evaluation, the irrigated areas remain the same or have slightly diminished (see
Table 4). See 3.1.1.1.2 for the reasons for the low utilization rate. According to the Ministry of
Agriculture and the CRDA, decrease in the irrigated area can be accounted to bankruptcy or
discontinuation of large-scale industrial farmers which were seen throughout the country at the event
of the revolution in 2011. Small-scale farmers constitute the majority of farmers currently utilizing
the irrigation.
2 Significance of the GDA as a system: In order to understand the GDAs’ dissolution or their functional deficiencies, it is necessary to take into account the Tunisian political context. During the implementation of the project, from 1998 to 2005, the GDAs had been created by the former government with the purpose of generalizing the utilization of the irrigation facilities and to ensure their maintenance. According to persons concerned within the CRDA and the GDA, “there was corruption, since the GDA was managed by the President’s next of kin or by local rural households appointed by the former government; the farmers were compelled to participate”. When the government collapsed at the event of the Jasmine Revolution in 2011, the supervisors of the GDA appointed by the former president were ousted with him. The farmers who were compelled by the government to use the facilities before the revolution were passive in the continuation of treated sewage irrigation, and the maintenance of the facilities (pumping stations etc.) was abandoned following the dissolution of the GDA. The Ministry of Agriculture is quite aware of the chaotic situation prevailing in the relations between the CRDA and the GDA. Financial responsibilities of inspection and maintenance are not clearly defined, and more facilities are being abandoned and have become dilapidated. (This is the case in Béja, Medjez El Bab, Medenine, and Djerba Aghir). Since the revolution, the rural households lost the sense of initiative, adopting a passive attitude of dependency to the government.
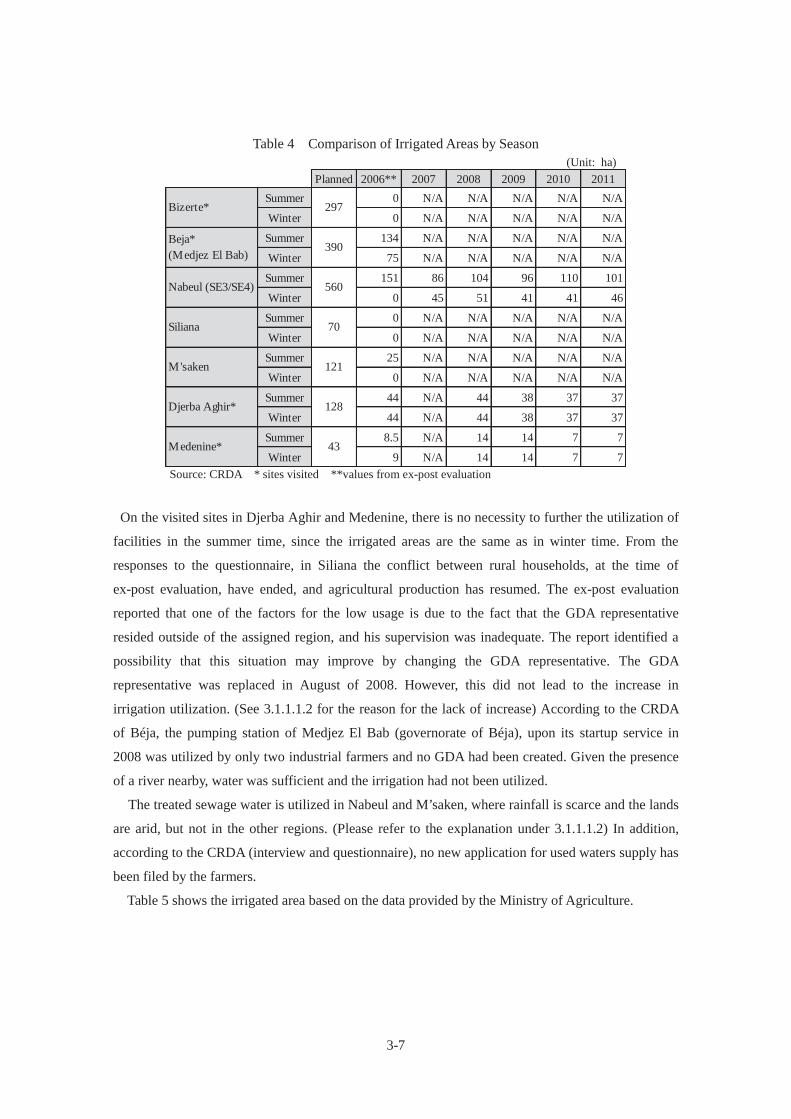
3-7
Table 4 Comparison of Irrigated Areas by Season (Unit: ha)
Planned 2006** 2007 2008 2009 2010 2011Summer 0 N/A N/A N/A N/A N/A
Winter 0 N/A N/A N/A N/A N/A
Summer 134 N/A N/A N/A N/A N/A
Winter 75 N/A N/A N/A N/A N/A
Summer 151 86 104 96 110 101
Winter 0 45 51 41 41 46
Summer 0 N/A N/A N/A N/A N/A
Winter 0 N/A N/A N/A N/A N/A
Summer 25 N/A N/A N/A N/A N/A
Winter 0 N/A N/A N/A N/A N/A
Summer 44 N/A 44 38 37 37
Winter 44 N/A 44 38 37 37
Summer 8.5 N/A 14 14 7 7
Winter 9 N/A 14 14 7 7
Siliana 70
Nabeul (SE3/SE4) 560
Bizerte* 297
Beja*(Medjez El Bab)
390
Medenine* 43
M'saken 121
Djerba Aghir* 128
Source: CRDA * sites visited **values from ex-post evaluation
On the visited sites in Djerba Aghir and Medenine, there is no necessity to further the utilization of
facilities in the summer time, since the irrigated areas are the same as in winter time. From the
responses to the questionnaire, in Siliana the conflict between rural households, at the time of
ex-post evaluation, have ended, and agricultural production has resumed. The ex-post evaluation
reported that one of the factors for the low usage is due to the fact that the GDA representative
resided outside of the assigned region, and his supervision was inadequate. The report identified a
possibility that this situation may improve by changing the GDA representative. The GDA
representative was replaced in August of 2008. However, this did not lead to the increase in
irrigation utilization. (See 3.1.1.1.2 for the reason for the lack of increase) According to the CRDA
of Béja, the pumping station of Medjez El Bab (governorate of Béja), upon its startup service in
2008 was utilized by only two industrial farmers and no GDA had been created. Given the presence
of a river nearby, water was sufficient and the irrigation had not been utilized.
The treated sewage water is utilized in Nabeul and M’saken, where rainfall is scarce and the lands
are arid, but not in the other regions. (Please refer to the explanation under 3.1.1.1.2) In addition,
according to the CRDA (interview and questionnaire), no new application for used waters supply has
been filed by the farmers.
Table 5 shows the irrigated area based on the data provided by the Ministry of Agriculture.
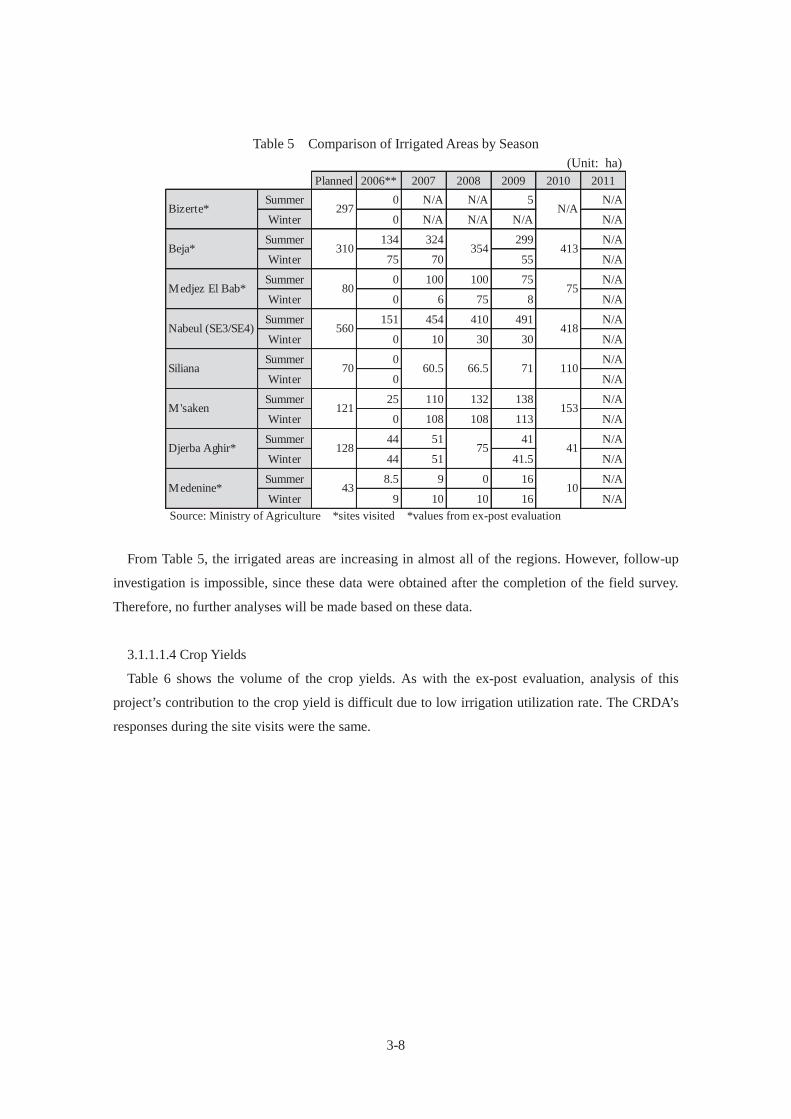
3-8
Table 5 Comparison of Irrigated Areas by Season (Unit: ha)
Planned 2006** 2007 2008 2009 2010 2011Summer 0 N/A N/A 5 N/A
Winter 0 N/A N/A N/A N/A
Summer 134 324 299 N/A
Winter 75 70 55 N/A
Summer 0 100 100 75 N/A
Winter 0 6 75 8 N/A
Summer 151 454 410 491 N/A
Winter 0 10 30 30 N/A
Summer 0 N/A
Winter 0 N/A
Summer 25 110 132 138 N/A
Winter 0 108 108 113 N/A
Summer 44 51 41 N/A
Winter 44 51 41.5 N/A
Summer 8.5 9 0 16 N/A
Winter 9 10 10 16 N/A10
N/A
354
75
413
75
418
153
41
60.5 66.5 71 11070
121
128
43
297
310
560
80
M'saken
Djerba Aghir*
Medenine*
Bizerte*
Beja*
Nabeul (SE3/SE4)
Siliana
Medjez El Bab*
Source: Ministry of Agriculture *sites visited *values from ex-post evaluation
From Table 5, the irrigated areas are increasing in almost all of the regions. However, follow-up
investigation is impossible, since these data were obtained after the completion of the field survey.
Therefore, no further analyses will be made based on these data.
3.1.1.1.4 Crop Yields
Table 6 shows the volume of the crop yields. As with the ex-post evaluation, analysis of this
project’s contribution to the crop yield is difficult due to low irrigation utilization rate. The CRDA’s
responses during the site visits were the same.

3-9
Table 6 Crop Yields (Unit: kg/ha)
Governorate Crop Planned 2006** 2007 2008 2009 2010 2011Sugar Beet 650 250 N/A N/A N/A N/A N/AWheat 60 52 N/A N/A N/A N/A N/AFodder 500 400 N/A N/A N/A N/A N/ASunflower 20 N/A N/A N/A N/A N/A N/ACitrus Fruits 200 150 N/A N/A N/A N/A N/ATobacco - 200 N/A N/A 0.44 N/A 1.1Fodder 400 15 3,424 3,915 3,278 2,865 2,550Olives 25 11 12 15 15 15 20Fruit Tree - 750 N/A N/A N/A N/A N/AWheat - N/A N/A N/A N/A N/A N/AOlives 28 N/A 100 100 150 130 180Fodder 600 N/A 650 800 800 900 1,200Dates 16 N/A N/A N/A N/A N/A N/AOlives - 30 40 50 70 50 30Barley - 16 30 30 60 60 15Fodder 600 300 300 400 480 150 N/AOlives 7 85 72 84 84 42 48Fodder 600 70 80 80 160 80 80Barley - 4 N/A N/A N/A 20 N/ASorghum - N/A N/A N/A N/A N/A N/A
Beja*
Nabeul(SE3/SE4)
Djerba Aghir*
Medenine*
M'saken
Source: CRDA * sites visited **values from ex-post evaluation
3.1.1.1.5 Volume of Treated Used Waters
The volume of treated sewage has increased since the ex-post evaluation (Table 7). However, not
all treated sewage is utilized for irrigation. As can be seen in Table 8, capacity of the treated sewage
irrigation facility is fixed. Therefore, it is logical to analyze the facility utilization rate of facilities
shown in table 8. Since corresponding data is not available from the ex-post evaluation report,
analysis will be carried out on numbers obtained for 2007 in this study. From table 8, it can be seen
that the volumes of utilization have increased in Beja, Nabeul, and M’saken. According to the CRDA
of Béja, treated sewage was barely utilized until the revolution of 2011. However, since 2012, treated
sewage ceased to be used due to pump shutdown from arrears of operation cost.

3-10
Table 7 Volume of Treated Sewage (Unit: liters/sec)
Planned 2006** 2007 2008 2009 2010 2011Bizerte* 300 N/A 181 177 206 202 213Beja*(Medjez El Bab)
163 95.57 82 83 75 74 66
Nabeul (SE3/SE4) 190 190.45 215 214 219 200 192
Siliana 30 N/A 34 28 24 28 27
M'saken 220 N/A 67 75 81 81 89
Djerba Aghir* 120 N/A 154 142 127 112 84
Medenine* 100 N/A 32 34 37 39 46 Source: ONAS * visited sites **values from ex-post evaluation
Table 8 Status of Sewage Treatment Facilities (Unit: liters/sec)
2007 2008 2009 2010 2011Capacity 25 25 25 25 25Treated Amount 0 0 0 0.09 0.32Usage Rate 0% 0% 0% 0% 1%Capacity 59 59 59 59 59Treated Amount 8.63 4.44 22.38 25.37 14.90Usage Rate 15% 8% 38% 43% 25%
Capacity 121 121 121 121 121Treated Amount 86.57 80.86 102.60 109.40 85.62Usage Rate 72% 67% 85% 90% 71%Capacity 19 19 19 19 19Treated Amount 14.27 13.32 16.08 18.07 11.10Usage Rate 75% 70% 85% 95% 58%Capacity 27 27 27 27 27Treated Amount 15.60 13.95 22.20 22.20 22.20Usage Rate 58% 52% 82% 82% 82%Capacity 12 12 12 12 12Treated Amount 6.79 6.34 7.93 8.56 6.34Usage Rate 57% 53% 66% 71% 53%Capacity 7 7 7 7 7Treated Amount 2.73 2.22 5.03 4.76 5.71Usage Rate 39% 32% 72% 68% 82%
Bizerte*
Medenine*
Djerba Aghir*
M'saken
Siliana
Nabeul(SE3/SE4)
Beja*(Medjez El Bab)
Source: ONAS *visited sites
In the North, the utilization rate of treated sewage utilization varies from 0% to 25%. In the South,
the utilization rates of treated sewage irrigation facilities are 70% to 95% of their capacity. These
rates prove that the demand for treated sewage irrigation exist in the arid regions. According to
ONAS, Bizerte and Siliana are supplied with treated sewage but the utilization is nil. A query was
made to ONAS concerning the decline in the treated sewage utilization rate in M’saken, but clear
answer could not be obtained. ONAS is merely supplying the treated sewage water, and is not
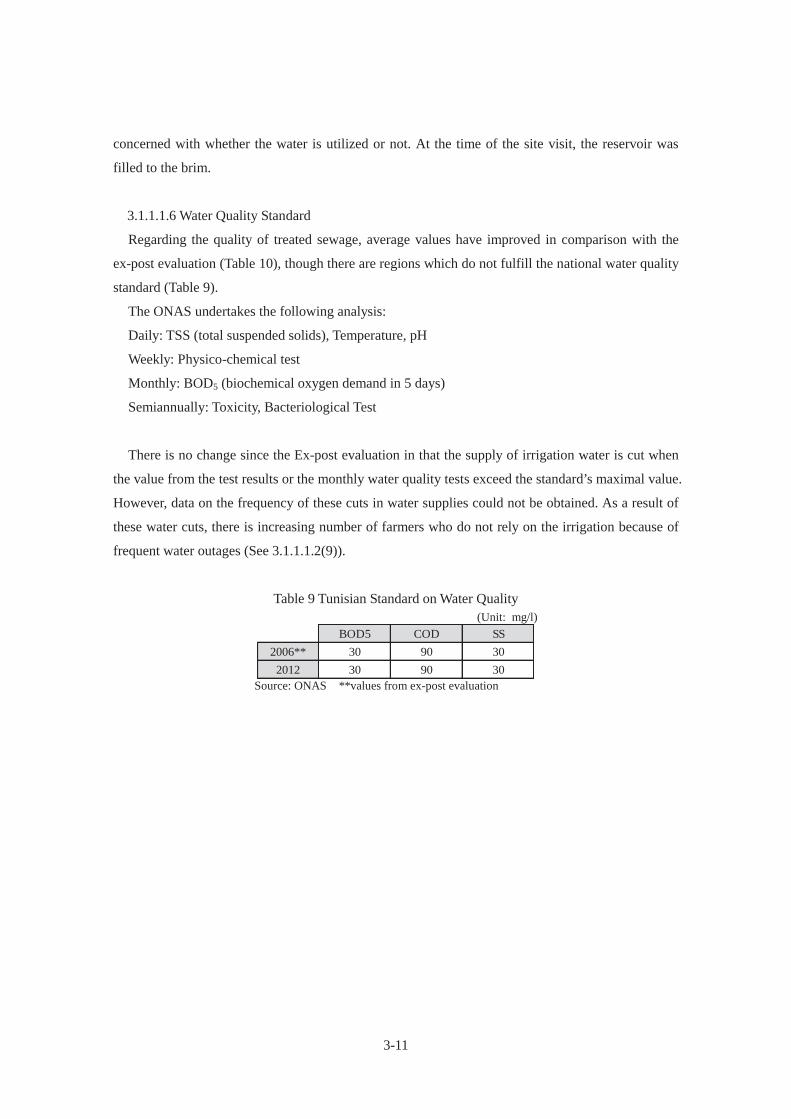
3-11
concerned with whether the water is utilized or not. At the time of the site visit, the reservoir was
filled to the brim.
3.1.1.1.6 Water Quality Standard
Regarding the quality of treated sewage, average values have improved in comparison with the
ex-post evaluation (Table 10), though there are regions which do not fulfill the national water quality
standard (Table 9).
The ONAS undertakes the following analysis:
Daily: TSS (total suspended solids), Temperature, pH
Weekly: Physico-chemical test
Monthly: BOD5 (biochemical oxygen demand in 5 days)
Semiannually: Toxicity, Bacteriological Test
There is no change since the Ex-post evaluation in that the supply of irrigation water is cut when
the value from the test results or the monthly water quality tests exceed the standard’s maximal value.
However, data on the frequency of these cuts in water supplies could not be obtained. As a result of
these water cuts, there is increasing number of farmers who do not rely on the irrigation because of
frequent water outages (See 3.1.1.1.2(9)).
Table 9 Tunisian Standard on Water Quality (Unit: mg/l)
BOD5 COD SS2006** 30 90 302012 30 90 30
Source: ONAS **values from ex-post evaluation
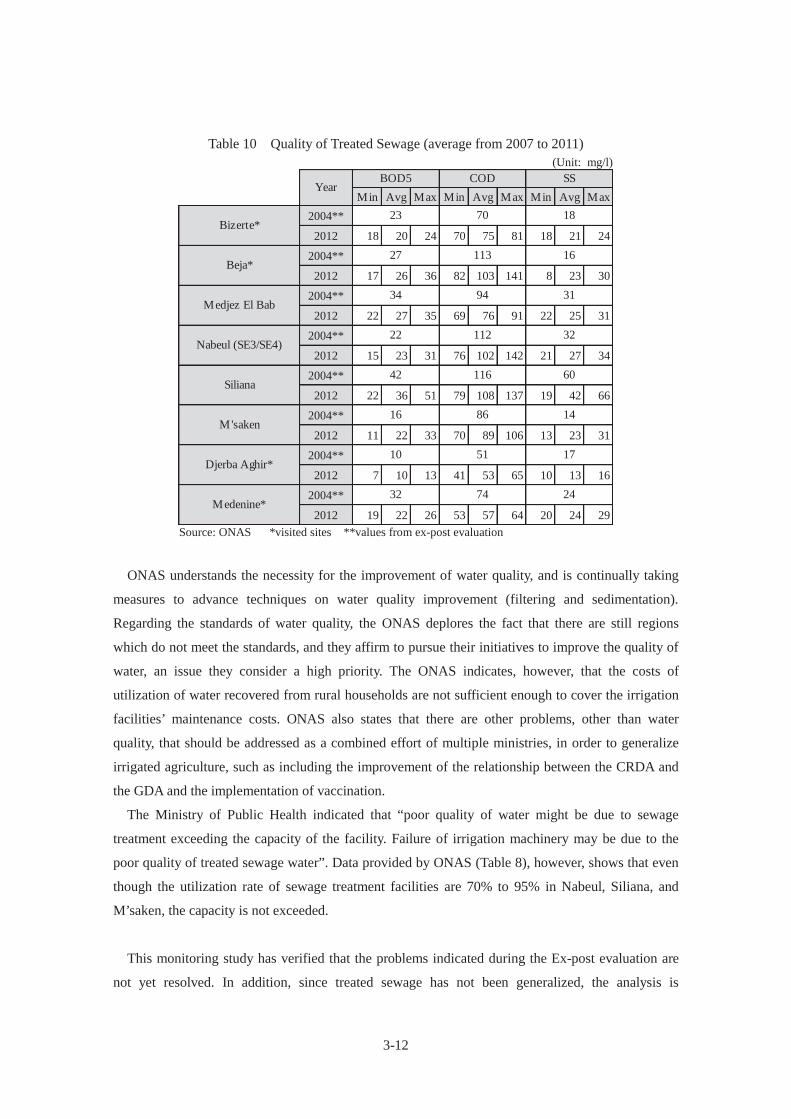
3-12
Table 10 Quality of Treated Sewage (average from 2007 to 2011) (Unit: mg/l)
Min Avg Max Min Avg Max Min Avg Max2004**
2012 18 20 24 70 75 81 18 21 24
2004**
2012 17 26 36 82 103 141 8 23 30
2004**
2012 22 27 35 69 76 91 22 25 31
2004**
2012 15 23 31 76 102 142 21 27 34
2004**
2012 22 36 51 79 108 137 19 42 66
2004**
2012 11 22 33 70 89 106 13 23 31
2004**
2012 7 10 13 41 53 65 10 13 16
2004**
2012 19 22 26 53 57 64 20 24 29
BOD5 COD SS
Bizerte*18
Year
M'saken
Djerba Aghir*
Medenine*
23 70
27 113
42 116
32 74
Beja*
Medjez El Bab
Nabeul (SE3/SE4)
Siliana
16
34 94 31
22 112 32
24
60
16 86 14
10 51 17
Source: ONAS *visited sites **values from ex-post evaluation
ONAS understands the necessity for the improvement of water quality, and is continually taking
measures to advance techniques on water quality improvement (filtering and sedimentation).
Regarding the standards of water quality, the ONAS deplores the fact that there are still regions
which do not meet the standards, and they affirm to pursue their initiatives to improve the quality of
water, an issue they consider a high priority. The ONAS indicates, however, that the costs of
utilization of water recovered from rural households are not sufficient enough to cover the irrigation
facilities’ maintenance costs. ONAS also states that there are other problems, other than water
quality, that should be addressed as a combined effort of multiple ministries, in order to generalize
irrigated agriculture, such as including the improvement of the relationship between the CRDA and
the GDA and the implementation of vaccination.
The Ministry of Public Health indicated that “poor quality of water might be due to sewage
treatment exceeding the capacity of the facility. Failure of irrigation machinery may be due to the
poor quality of treated sewage water”. Data provided by ONAS (Table 8), however, shows that even
though the utilization rate of sewage treatment facilities are 70% to 95% in Nabeul, Siliana, and
M’saken, the capacity is not exceeded.
This monitoring study has verified that the problems indicated during the Ex-post evaluation are
not yet resolved. In addition, since treated sewage has not been generalized, the analysis is

3-13
impossible for a majority of indicators.
3.1.1.2 Result of Calculations of Internal Rates of Return (IRR)
During the Ex-post evaluation, the IRR has been calculated as 7.0%. However, since the basis for
the calculation could not be obtained, EIRR will not be calculated in this ex-post monitoring.
3.1.2 Qualitative Effects
During the Ex-post evaluation, the qualitative effects as mentioned hereunder have been reported.
1. Conservation of the underground resources through water reuse
2. Expansion of irrigation area in the targeted regions, and ensuring/expanding the means of
agricultural production
3. Increase in production through irrigated farming and improvement in living conditions by
rise in income
4. Introduction of irrigated farming
5. Reinforcement of livestock industry by the introduction of summer fodder production
6. Improvement of production and economic activity
The presented effects in the ex-post evaluation seem, nevertheless, to have disappeared or never to
have existed. Regarding the qualitative effects of the project, the Ministry of Agriculture replied that
the reported qualitative effects could be expected if the use of treated sewage irrigation is widespread.
However, at present, the usage is sparse and, therefore, has not led to any effects.
The Ministry of the Environment thinks that “irrigation utilizing treated sewage is significant
considering that many regions of Tunisia is arid or semi-arid land”. The Ministry of Agriculture is
of the opinion that “using treated sewage to complement the water shortages in the southern regions
is significant”. From these opinions, it can be inferred that treated sewage irrigation is in
accordance with the regions’ water demands. However, at this time, since there are many obstacles
to the usage of treated water and the usage is sparse, it is impossible to find a correlation between
this project and the above stated qualitative effects.
3.2 Impact
3.2.1 Intended Impacts
3.2.1.1 Economic Impact
Income of the rural households differs by a few digits compared to the values presented in the
ex-post evaluation (Table 11). The obtained data for this study appear to be adequate, taking into
account the fact that the average income (annual) in Tunisia are around 7,200 TND (about 400,000
yen).
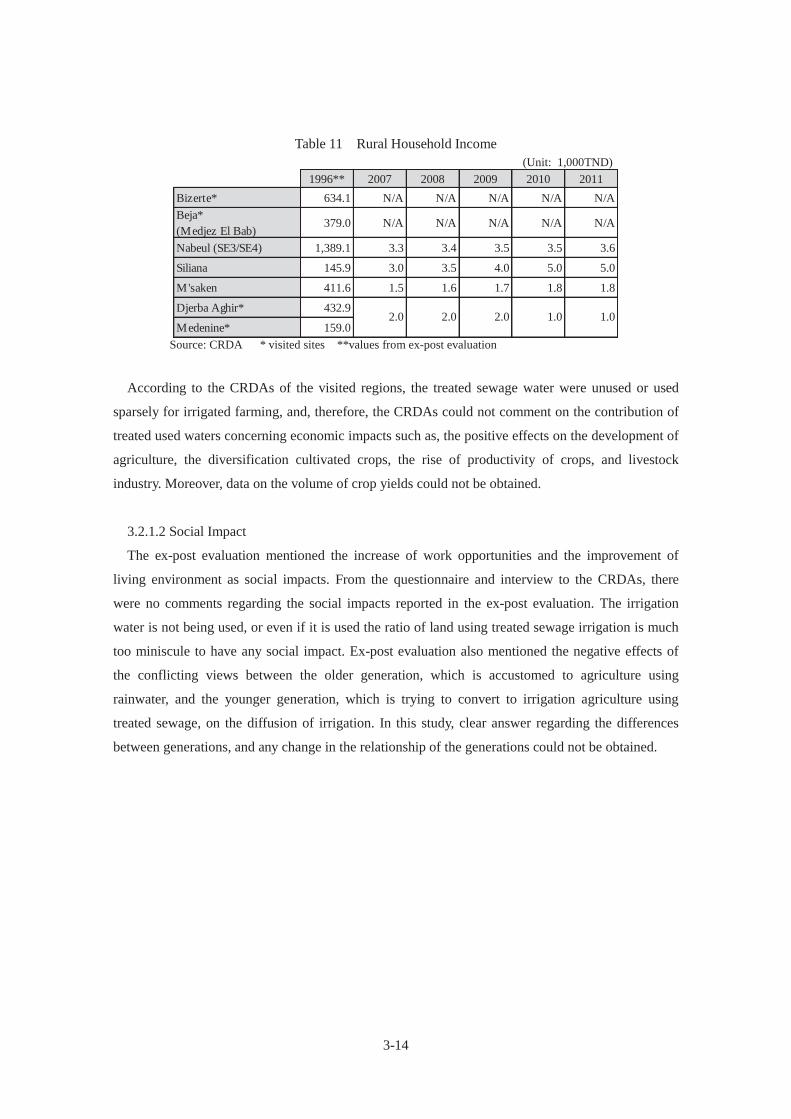
3-14
Table 11 Rural Household Income (Unit: 1,000TND)
1996** 2007 2008 2009 2010 2011Bizerte* 634.1 N/A N/A N/A N/A N/ABeja*(Medjez El Bab)
379.0 N/A N/A N/A N/A N/A
Nabeul (SE3/SE4) 1,389.1 3.3 3.4 3.5 3.5 3.6
Siliana 145.9 3.0 3.5 4.0 5.0 5.0
M'saken 411.6 1.5 1.6 1.7 1.8 1.8
Djerba Aghir* 432.9
Medenine* 159.02.0 2.0 2.0 1.0 1.0
Source: CRDA * visited sites **values from ex-post evaluation
According to the CRDAs of the visited regions, the treated sewage water were unused or used
sparsely for irrigated farming, and, therefore, the CRDAs could not comment on the contribution of
treated used waters concerning economic impacts such as, the positive effects on the development of
agriculture, the diversification cultivated crops, the rise of productivity of crops, and livestock
industry. Moreover, data on the volume of crop yields could not be obtained.
3.2.1.2 Social Impact
The ex-post evaluation mentioned the increase of work opportunities and the improvement of
living environment as social impacts. From the questionnaire and interview to the CRDAs, there
were no comments regarding the social impacts reported in the ex-post evaluation. The irrigation
water is not being used, or even if it is used the ratio of land using treated sewage irrigation is much
too miniscule to have any social impact. Ex-post evaluation also mentioned the negative effects of
the conflicting views between the older generation, which is accustomed to agriculture using
rainwater, and the younger generation, which is trying to convert to irrigation agriculture using
treated sewage, on the diffusion of irrigation. In this study, clear answer regarding the differences
between generations, and any change in the relationship of the generations could not be obtained.

3-15
3.2.2 Other Positive or Negative Impacts
3.2.2.1 Awareness for Vaccination and Protective Clothing
Table 12 Vaccinated Farmers (Unit: persons)
2007 2008 2009 2010 2011Bizerte* 0 0 0 0 0Beja*(Medjez El Bab)
0 0 0 0 0
Nabeul (SE3/SE4) 0 0 0 0 0
Siliana 0 0 0 0 0
M'saken 0 0 0 0 0
Djerba Aghir* 0 0 0 0 0
Medenine* 0 0 0 0 0 Source: Ministry of Public Health * visited sites
The Ministry of Public Health mandates vaccination and wearing of protective clothing to the
users of treated sewage, in order to prevent infectious disease such as tetanus. The Ministry of
Agriculture, the Ministry of Public Health, and the CRDA are conducting information seminars and
door-to-door visits to inform the farmers. However, at the visited project site, vaccination recipient
remains at zero, and protective clothing was not in use; no improvement could be seen from the time
of ex-post evaluation.
This can be explained by the high cost of vaccination, 60 TND, which is wholly borne by the
farmers. (According to table 11, the average monthly income in Medenine was 1,000 TND in 2011)
The Ministry of Public Health, which is the ministry responsible for vaccination of farmers using
treated sewage, insists that “the Ministry of Agriculture is responsible for this situation”, and the
Ministry of Environment asserts that “the Ministry of Public Health should cover the cost for
vaccination”. Role and responsibility of ministries regarding this issue have not yet been established.
3.2.2.2 Impact on the Natural Environment
The problem of foul odor from treated sewage in the summertime at Medenine, which was
referred in the ex-post evaluation, is still unresolved. At Medenine, only a part of the treated used
waters is utilized, and the rest is discharged in the nearby creek. There are persistent complaints from
residents as the drained treated sewage water causes infestation of insects and foul odor in the
summertime. In the interview, the CRDA claims taking no particular action against this problem. It
can be assumed that the CRDA is not in the state to solve this problem, as the structure of CRDA and
GDA has been unstable since the revolution. In an interview, the CRDA of Medenine and the
Ministry of the Environment stated that no serious impacts on health or pollution of the soil/crops
have been reported by utilizing the treated water; but no scientific study has been conducted on this
matter. According to the interview with the Ministry of Public Health, which undertakes health

3-16
examination twice a year for all rural households practicing treated sewage irrigation, the impact on
health is slight; the only effects reported were of itching nature, no serious effect having been
noticed. Besides, the Ministry of Environment states although they “have not undertaken a scientific
study on the effects of treated used waters on the environment, a new proposition of a study on the
effect on the underground waters in eight sites is being planned”.
3.2.2.3 Removal of Settlers and Land Acquisitions
There has been no removal of inhabitants or land acquisition since the ex-post evaluation.
In conclusion, most of the impacts indicated during the Ex-post evaluation could not be verified
within the confines of this study. The treated sewage water having not been utilized, it is difficult to
establish links between the impacts and the project. This study has, however, verified the persistence,
since the Ex-post evaluation, of the negative impacts of lack of vaccination and foul odor generated
by treated sewage.
3.3 Sustainability
3.3.1 Structural Aspect of Operation and Maintenance
Compared to the time of Ex-post evaluation, many regions are presently not able to carry out the
maintenance of the pumping stations. The GDAs, which should be conducting its supervising and
operating activities such as guarding the facility and pipelines, have dissolved or have become
dysfunctional since the revolution in 2011.
Overall, the distribution of tasks remains the same, for operation and maintenance of the irrigation
facilities, between the CRDAs and the GDAs ; the CRDA operate and maintain pumping stations
and reservoirs, while the GDAs manage the facilities within the irrigated lands (guarding the facility,
irrigation pipes, etc.) and conduct maintenance of small to medium scale. However, since the
Jasmine Revolution of 2011, many GDAs organized coercively by the former government, have
been dissolved3 or are no longer operational, and consequently, the maintenance of pumping stations
has become insufficient throughout the country. Specifically, the pumping stations are
non-operational or dilapidated due to the following reasons: 1. during the revolution, the supervisors
fled at the arrival of insurgents, and the copper wires of the electrical panel boards were stolen and
destroyed; 2. in the absence of the GDA, electric power bills have fallen into arrears and the power
supply was cut; 3. lack of personnel to conduct the necessary pump operations due to insufficient
funds. According to the Ministry of Agriculture, in the zones where the GDAs were dissolved, 3 Treated sewage irrigation was decided by the former government and imposed on the farmers regardless of their preference. Since the officials of the GDA were appointed directly by the former government, the farmers could not express their opinion. (Today, the concerned individuals of the CRDA and the farmers describe these officials as “farmers affiliated with the former President”.) These GDAs, operated by the former government, were dissolved or became dysfunctional with the collapse of the former regime by the revolution in 2011.
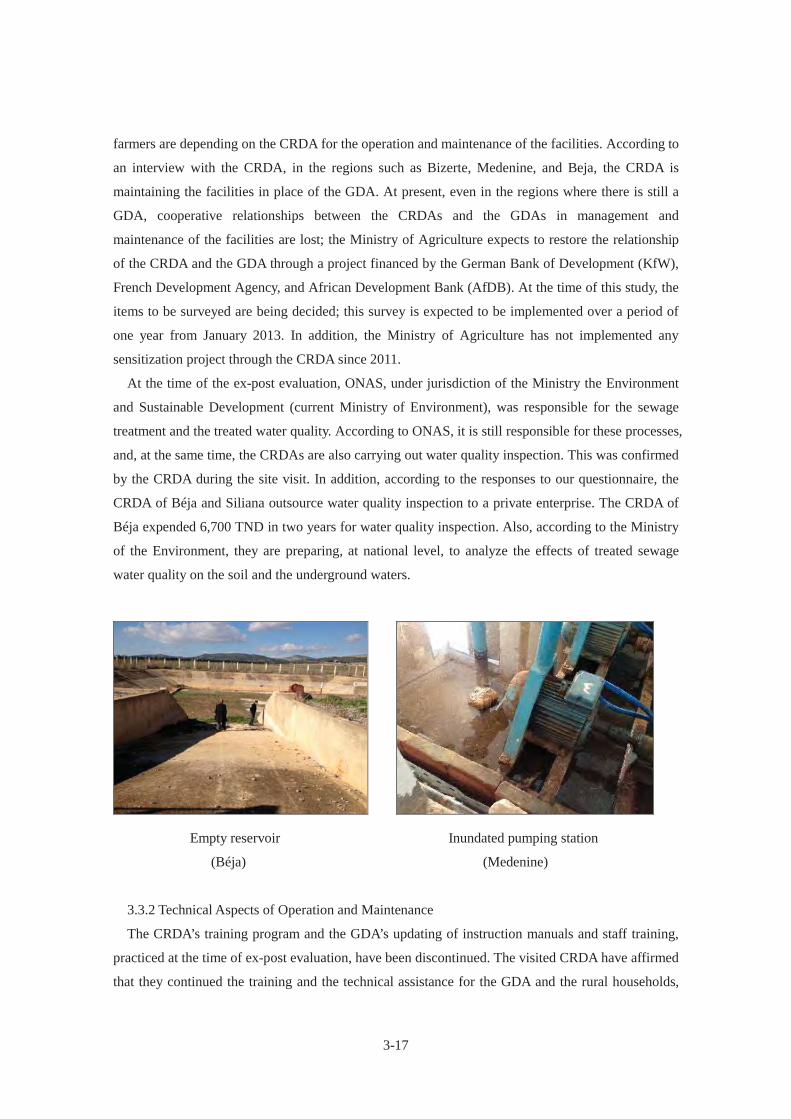
3-17
farmers are depending on the CRDA for the operation and maintenance of the facilities. According to
an interview with the CRDA, in the regions such as Bizerte, Medenine, and Beja, the CRDA is
maintaining the facilities in place of the GDA. At present, even in the regions where there is still a
GDA, cooperative relationships between the CRDAs and the GDAs in management and
maintenance of the facilities are lost; the Ministry of Agriculture expects to restore the relationship
of the CRDA and the GDA through a project financed by the German Bank of Development (KfW),
French Development Agency, and African Development Bank (AfDB). At the time of this study, the
items to be surveyed are being decided; this survey is expected to be implemented over a period of
one year from January 2013. In addition, the Ministry of Agriculture has not implemented any
sensitization project through the CRDA since 2011.
At the time of the ex-post evaluation, ONAS, under jurisdiction of the Ministry the Environment
and Sustainable Development (current Ministry of Environment), was responsible for the sewage
treatment and the treated water quality. According to ONAS, it is still responsible for these processes,
and, at the same time, the CRDAs are also carrying out water quality inspection. This was confirmed
by the CRDA during the site visit. In addition, according to the responses to our questionnaire, the
CRDA of Béja and Siliana outsource water quality inspection to a private enterprise. The CRDA of
Béja expended 6,700 TND in two years for water quality inspection. Also, according to the Ministry
of the Environment, they are preparing, at national level, to analyze the effects of treated sewage
water quality on the soil and the underground waters.
Empty reservoir Inundated pumping station
(Béja) (Medenine)
3.3.2 Technical Aspects of Operation and Maintenance
The CRDA’s training program and the GDA’s updating of instruction manuals and staff training,
practiced at the time of ex-post evaluation, have been discontinued. The visited CRDA have affirmed
that they continued the training and the technical assistance for the GDA and the rural households,
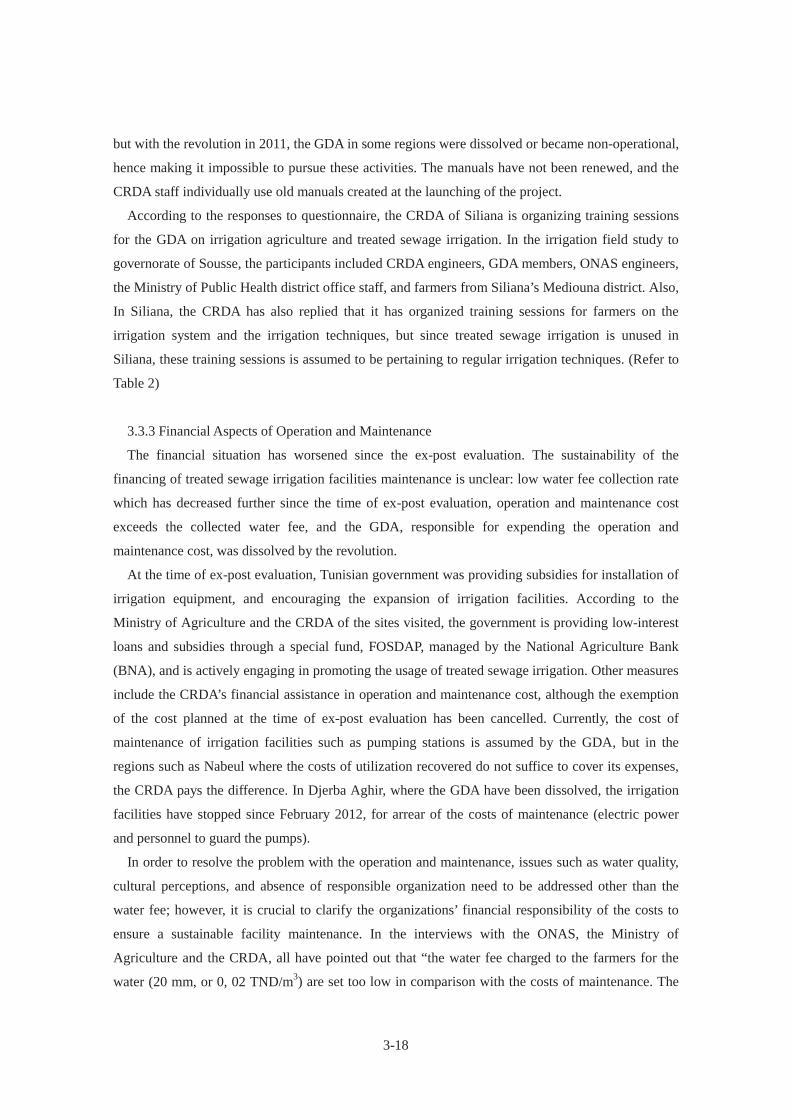
3-18
but with the revolution in 2011, the GDA in some regions were dissolved or became non-operational,
hence making it impossible to pursue these activities. The manuals have not been renewed, and the
CRDA staff individually use old manuals created at the launching of the project.
According to the responses to questionnaire, the CRDA of Siliana is organizing training sessions
for the GDA on irrigation agriculture and treated sewage irrigation. In the irrigation field study to
governorate of Sousse, the participants included CRDA engineers, GDA members, ONAS engineers,
the Ministry of Public Health district office staff, and farmers from Siliana’s Mediouna district. Also,
In Siliana, the CRDA has also replied that it has organized training sessions for farmers on the
irrigation system and the irrigation techniques, but since treated sewage irrigation is unused in
Siliana, these training sessions is assumed to be pertaining to regular irrigation techniques. (Refer to
Table 2)
3.3.3 Financial Aspects of Operation and Maintenance
The financial situation has worsened since the ex-post evaluation. The sustainability of the
financing of treated sewage irrigation facilities maintenance is unclear: low water fee collection rate
which has decreased further since the time of ex-post evaluation, operation and maintenance cost
exceeds the collected water fee, and the GDA, responsible for expending the operation and
maintenance cost, was dissolved by the revolution.
At the time of ex-post evaluation, Tunisian government was providing subsidies for installation of
irrigation equipment, and encouraging the expansion of irrigation facilities. According to the
Ministry of Agriculture and the CRDA of the sites visited, the government is providing low-interest
loans and subsidies through a special fund, FOSDAP, managed by the National Agriculture Bank
(BNA), and is actively engaging in promoting the usage of treated sewage irrigation. Other measures
include the CRDA’s financial assistance in operation and maintenance cost, although the exemption
of the cost planned at the time of ex-post evaluation has been cancelled. Currently, the cost of
maintenance of irrigation facilities such as pumping stations is assumed by the GDA, but in the
regions such as Nabeul where the costs of utilization recovered do not suffice to cover its expenses,
the CRDA pays the difference. In Djerba Aghir, where the GDA have been dissolved, the irrigation
facilities have stopped since February 2012, for arrear of the costs of maintenance (electric power
and personnel to guard the pumps).
In order to resolve the problem with the operation and maintenance, issues such as water quality,
cultural perceptions, and absence of responsible organization need to be addressed other than the
water fee; however, it is crucial to clarify the organizations’ financial responsibility of the costs to
ensure a sustainable facility maintenance. In the interviews with the ONAS, the Ministry of
Agriculture and the CRDA, all have pointed out that “the water fee charged to the farmers for the
water (20 mm, or 0, 02 TND/m3) are set too low in comparison with the costs of maintenance. The
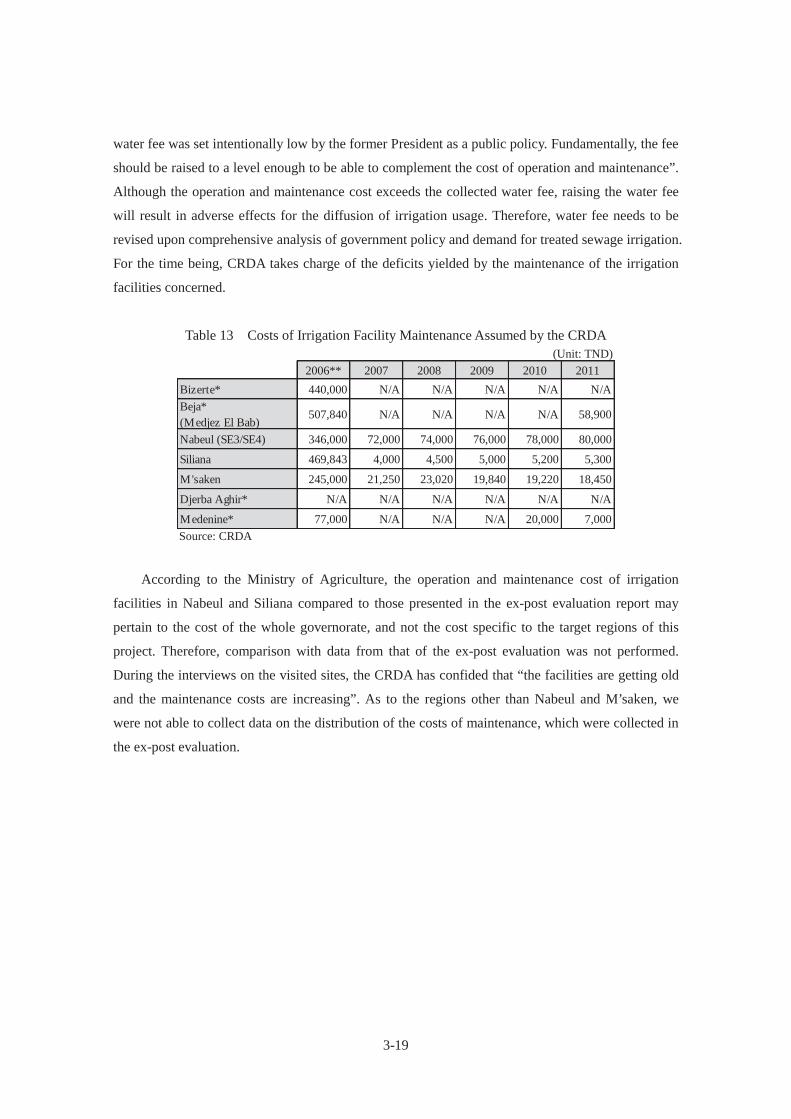
3-19
water fee was set intentionally low by the former President as a public policy. Fundamentally, the fee
should be raised to a level enough to be able to complement the cost of operation and maintenance”.
Although the operation and maintenance cost exceeds the collected water fee, raising the water fee
will result in adverse effects for the diffusion of irrigation usage. Therefore, water fee needs to be
revised upon comprehensive analysis of government policy and demand for treated sewage irrigation.
For the time being, CRDA takes charge of the deficits yielded by the maintenance of the irrigation
facilities concerned.
Table 13 Costs of Irrigation Facility Maintenance Assumed by the CRDA (Unit: TND)
2006** 2007 2008 2009 2010 2011Bizerte* 440,000 N/A N/A N/A N/A N/ABeja*(Medjez El Bab)
507,840 N/A N/A N/A N/A 58,900
Nabeul (SE3/SE4) 346,000 72,000 74,000 76,000 78,000 80,000
Siliana 469,843 4,000 4,500 5,000 5,200 5,300
M'saken 245,000 21,250 23,020 19,840 19,220 18,450
Djerba Aghir* N/A N/A N/A N/A N/A N/A
Medenine* 77,000 N/A N/A N/A 20,000 7,000 Source: CRDA
According to the Ministry of Agriculture, the operation and maintenance cost of irrigation
facilities in Nabeul and Siliana compared to those presented in the ex-post evaluation report may
pertain to the cost of the whole governorate, and not the cost specific to the target regions of this
project. Therefore, comparison with data from that of the ex-post evaluation was not performed.
During the interviews on the visited sites, the CRDA has confided that “the facilities are getting old
and the maintenance costs are increasing”. As to the regions other than Nabeul and M’saken, we
were not able to collect data on the distribution of the costs of maintenance, which were collected in
the ex-post evaluation.
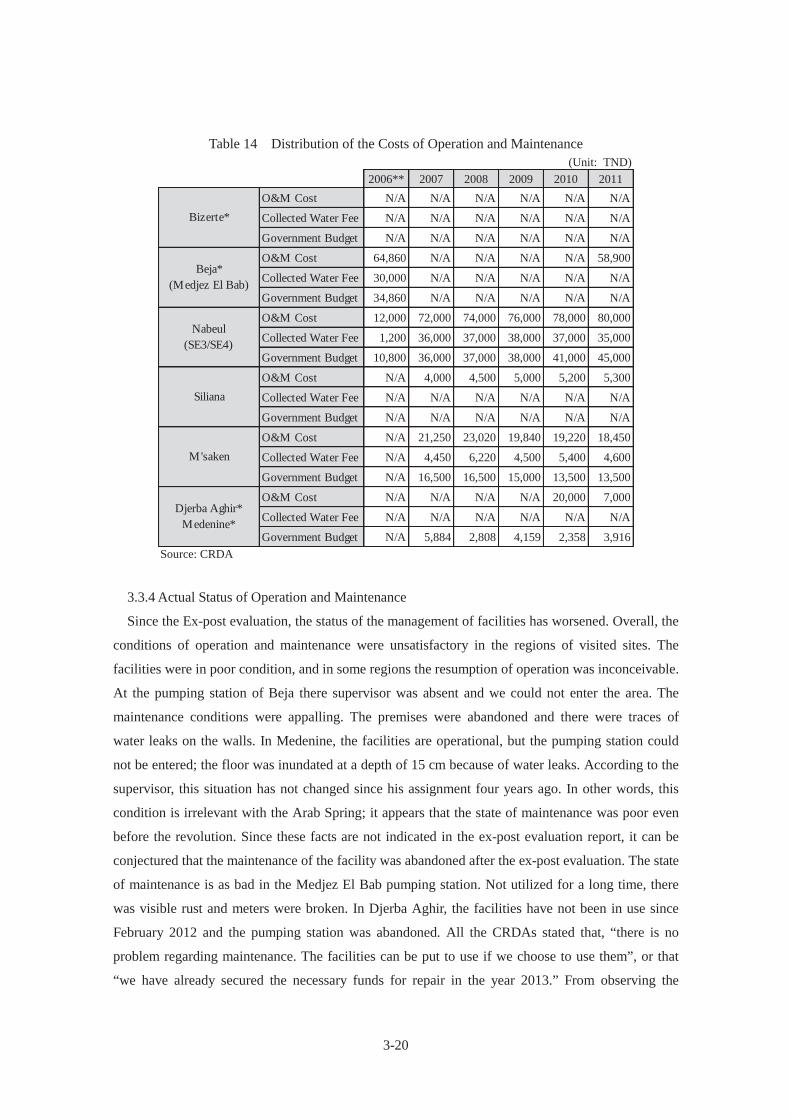
3-20
Table 14 Distribution of the Costs of Operation and Maintenance (Unit: TND)
2006** 2007 2008 2009 2010 2011O&M Cost N/A N/A N/A N/A N/A N/A
Collected Water Fee N/A N/A N/A N/A N/A N/A
Government Budget N/A N/A N/A N/A N/A N/A
O&M Cost 64,860 N/A N/A N/A N/A 58,900
Collected Water Fee 30,000 N/A N/A N/A N/A N/A
Government Budget 34,860 N/A N/A N/A N/A N/A
O&M Cost 12,000 72,000 74,000 76,000 78,000 80,000
Collected Water Fee 1,200 36,000 37,000 38,000 37,000 35,000
Government Budget 10,800 36,000 37,000 38,000 41,000 45,000
O&M Cost N/A 4,000 4,500 5,000 5,200 5,300
Collected Water Fee N/A N/A N/A N/A N/A N/A
Government Budget N/A N/A N/A N/A N/A N/A
O&M Cost N/A 21,250 23,020 19,840 19,220 18,450
Collected Water Fee N/A 4,450 6,220 4,500 5,400 4,600
Government Budget N/A 16,500 16,500 15,000 13,500 13,500
O&M Cost N/A N/A N/A N/A 20,000 7,000
Collected Water Fee N/A N/A N/A N/A N/A N/A
Government Budget N/A 5,884 2,808 4,159 2,358 3,916
Djerba Aghir*Medenine*
M'saken
Bizerte*
Beja*(Medjez El Bab)
Nabeul(SE3/SE4)
Siliana
Source: CRDA
3.3.4 Actual Status of Operation and Maintenance
Since the Ex-post evaluation, the status of the management of facilities has worsened. Overall, the
conditions of operation and maintenance were unsatisfactory in the regions of visited sites. The
facilities were in poor condition, and in some regions the resumption of operation was inconceivable.
At the pumping station of Beja there supervisor was absent and we could not enter the area. The
maintenance conditions were appalling. The premises were abandoned and there were traces of
water leaks on the walls. In Medenine, the facilities are operational, but the pumping station could
not be entered; the floor was inundated at a depth of 15 cm because of water leaks. According to the
supervisor, this situation has not changed since his assignment four years ago. In other words, this
condition is irrelevant with the Arab Spring; it appears that the state of maintenance was poor even
before the revolution. Since these facts are not indicated in the ex-post evaluation report, it can be
conjectured that the maintenance of the facility was abandoned after the ex-post evaluation. The state
of maintenance is as bad in the Medjez El Bab pumping station. Not utilized for a long time, there
was visible rust and meters were broken. In Djerba Aghir, the facilities have not been in use since
February 2012 and the pumping station was abandoned. All the CRDAs stated that, “there is no
problem regarding maintenance. The facilities can be put to use if we choose to use them”, or that
“we have already secured the necessary funds for repair in the year 2013.” From observing the
3-21
facilities during the site visit, they were not in the condition to resume operation; however, further
verifications could not be made. The pictures of the facilities were shown to the Ministry of
Agriculture to determine the possibility of utilization upon resumption of operation, and if the
budget necessary for repair were available. The Ministry declared that they were not aware of the
status of the irrigation facilities of each CRDA, and they had no knowledge of the breakdowns and
defects.
From the above, the conditions of the operation and maintenance have worsened since the ex-post
evaluation. This is due to a great extent to the absence of an organization that is responsible for
operating and maintenance, caused by the dissolution of many GDAs after the revolution. The
absence or functional deficiency of the GDA has negative effects not only on the framework of
operation and maintenance, but also on the irrigation technique and on financing. Further, there are
abandoned facilities, whose abandonment is irrelevant with the revolution of 2011. It is desirable
that the Ministry of Agriculture deploys radical efforts to improve the situation, but unfortunately,
the situation remains for the moment obscure as to its future development.
3.4 Others
(1) Follow-up of the Lessons Learned
In the ex-post evaluation, the following points were indicated as lessons learned: public education
campaign was insufficient regarding the convenience of treated sewage irrigation, and lack of
understanding by older generation farmers is the hindering the usage of treated sewage; cooperation
between ONAS, competent authorities, and relevant agencies is necessary. Currently, it was found
that public education campaign by the Ministry of Agriculture to the GDA and farmers is insufficient.
ONAS and the Ministry of Agriculture have begun to cooperate with the Ministry of Public Health
concerning the utilization of treated used waters (exchange of information and opinions), but this
cooperation is also insufficient and further initiatives should be deployed.
As other efforts, Ministry of Agriculture and Ministry of Environment is cooperating to conduct a
study of the attitudes and practices of farmers towards the use of treated sewage water. This will be
followed by an intensive public education campaign in 2013 and 2014 in all areas irrigated by
treated sewage water. Positive effects can be expected from this campaign.
(2) Follow-up of Recommendations
In the ex-post evaluation, the following recommendation was made: in order to further spread the
irrigation of farmland using treated sewage water, it is important to reduce the sense of anxiety about
using treated sewage water for irrigation – especially among the older generation of farmers who
adhere to the traditional methods of farming – by promoting understanding of the benefits of using
3-22
treated sewage water as irrigation water. After the ex-post evaluation until 2010, the Ministry of
Agriculture actively promoted the utilization of treated sewage water for irrigation through public
education campaign, seminars on safety of treated sewage water, and, in some regions, undertaking
of the facilities maintenance by the CRDA in place of the GDA. However, the GDAs of the project
location which were organized in the name of “operating the treated sewage irrigation facilities”
were dissolved or became non-operational during the revolution in 2011. Cooperative relationships
between the CRDAs and the GDAs in management and maintenance of the facilities have been lost
since the revolution in 2011. Consequently, the Ministry of Agriculture has ceased its public
education programs.
4. Conclusion, Lessons Learned and Recommendations
4.1 Conclusion
The utilization of facilities developed within the scope of this project for irrigation by treated used
waters has not been widely-used as expected initially. In many zones, these irrigation facilities are
either underutilized or not utilized altogether. Consequently, the quantitative effects and the impacts
that had been confirmed at the time of Ex-post evaluation could not be verified in this study.
Majority of the arable lands in Tunisia are arid or semi-arid, and project's objective to stabilize
agricultural production and promote regional economy through the use of recycled water is effective
in conserving the water resources of the country. However, in reality, treated sewage irrigation is
sparsely used and outlook for attaining of the project objective seems uncertain for the following
reasons: reluctance to use treated sewage from lack of understanding; irrigation is not necessary in
some areas due to adequate rainfall; aversion to treated sewage due to low quality of water;
unreliability of treated sewage due to instable supply; high cost of using treated sewage. The
Ministry of Agriculture had continued its public education programs after ex-post evaluation, but had
been discontinued after the revolution in 2011. As a result, treated sewage irrigation has not spread,
and its usage is declining. Moreover, after the revolution, no organization has replaced the GDA,
which was in charge of the maintenance of the irrigations facilities, and the facilities have been
damaged in certain regions. Sustainability of the project in certain areas has therefore become
questionable.
4.2 Recommendations
4.2.1 Recommendations to the Ministry of Agriculture
(1) The Ministry of Agriculture should assist in improving the CRDA GDA relations, and act
meticulously for the reestablishment of the GDA in the regions targeted by this project, which were
dissolved or non-operational. In addition, a re-examination is imperative on the future utilization of
irrigation facilities that are not utilized or where maintenance is inadequate. The Ministry of
3-23
Agriculture, with an objective of restoring the relationship between the GDAs and the CRDAs, is
anticipating on implementing a research in a new project financed by KfW, French Development
Agency, and AfDB for a period of one year as from January 2013 (the Ministry is actually at the
stage of identifying the elements of the research). It is expected that the Ministry of Agriculture, will
confer the highest priority to the follow-up on issues such as the dissolved GDAs that have not been
reinstated, and the determination of the organizational responsibilities regarding the maintenance of
the ill-maintained irrigation facilities.
(2) The cost of utilizing treated sewage waters being relatively low, the amounts paid to the GDAs
by farmers utilizing irrigation do not cover the costs of the facility maintenance. The former
president, from a political motive, intentionally set the utilization costs at a low level, without
considering the maintenance costs of the facilities. In case of operation and maintenance fund
shortages due to the aforementioned reasons, the CRDA bears the cost. However, in regions where
the CRDA is unable to make the payment, necessary maintenance cannot be conducted and,
therefore, the facilities are in dissatisfactory condition. Consequently, it is necessary to
comprehensively review the country's (MOE, Ministry of Agriculture) inclination on the diffusion of
treated sewage irrigation and the system of organizational responsibility, including the water cost
and rules for bearing operation and maintenance costs. These questions should be studied at the
occasion of the research project financed by the KfW, French Development Agency, and AfDB as
referred in (1)
(3) In some regions, the treated sewage waters contain foreign matters and salt. According to the
Ministry of Environment, quality of treated water has not reached its final ideal stage, which is
potable water. ONAS’ ultimate goal is “potable treated sewage water”. In addition to the
rehabilitation of sewage treatment facilities and improvement of operation and maintenance skills,
the Ministry of Agriculture should cooperate with ONAS by monitoring the quality of water while
conducting education campaigns to inform the public that treated sewage water is not "impure".
4.3 Lessons Learned
From the cultural background, treated sewage water is perceived as impure. This aroused
reluctance towards the usage and treated sewage water, and led to refusal of the usage by most
farmers. Although the reason behind the low utilization rate of treated sewage water is versatile,
cultural background is a factor that cannot be ignored. In the light of the above, a lesson was learned
that it is necessary to take into consideration the cultural aspects of the region when planning a
project. Also, since the regions differ in climate and agricultural produces, it is important to take
these factors into consideration when choosing the sites for the project.
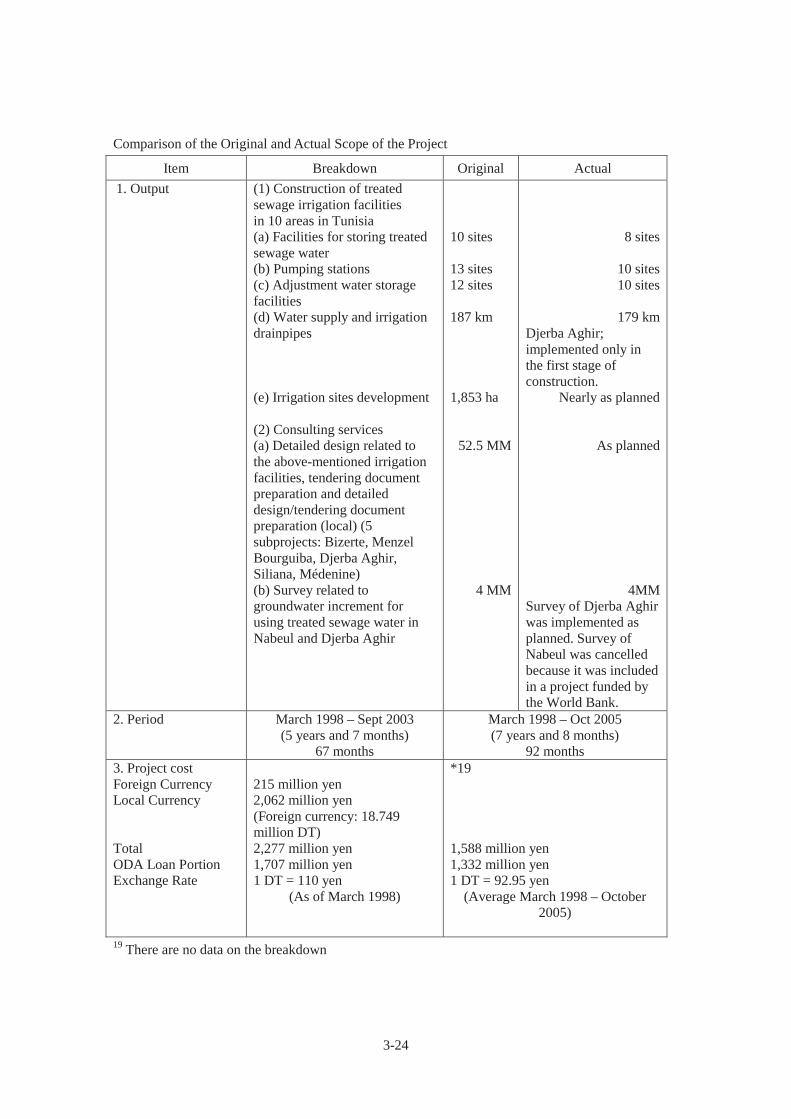
3-24
Comparison of the Original and Actual Scope of the Project
Item Breakdown Original Actual 1. Output (1) Construction of treated
sewage irrigation facilities in 10 areas in Tunisia (a) Facilities for storing treated sewage water (b) Pumping stations (c) Adjustment water storage facilities (d) Water supply and irrigation drainpipes (e) Irrigation sites development (2) Consulting services (a) Detailed design related to the above-mentioned irrigation facilities, tendering document preparation and detailed design/tendering document preparation (local) (5 subprojects: Bizerte, Menzel Bourguiba, Djerba Aghir, Siliana, Médenine) (b) Survey related to groundwater increment for using treated sewage water in Nabeul and Djerba Aghir
10 sites 13 sites 12 sites 187 km 1,853 ha
52.5 MM
4 MM
8 sites
10 sites 10 sites
179 km
Djerba Aghir; implemented only in the first stage of construction.
Nearly as planned
As planned
4MM Survey of Djerba Aghir was implemented as planned. Survey of Nabeul was cancelled because it was included in a project funded by the World Bank.
2. Period March 1998 – Sept 2003 (5 years and 7 months)
67 months
March 1998 – Oct 2005 (7 years and 8 months)
92 months 3. Project cost Foreign Currency Local Currency Total ODA Loan Portion Exchange Rate
215 million yen 2,062 million yen (Foreign currency: 18.749 million DT) 2,277 million yen 1,707 million yen 1 DT = 110 yen
(As of March 1998)
*19 1,588 million yen 1,332 million yen 1 DT = 92.95 yen
(Average March 1998 – October 2005)
19 There are no data on the breakdown
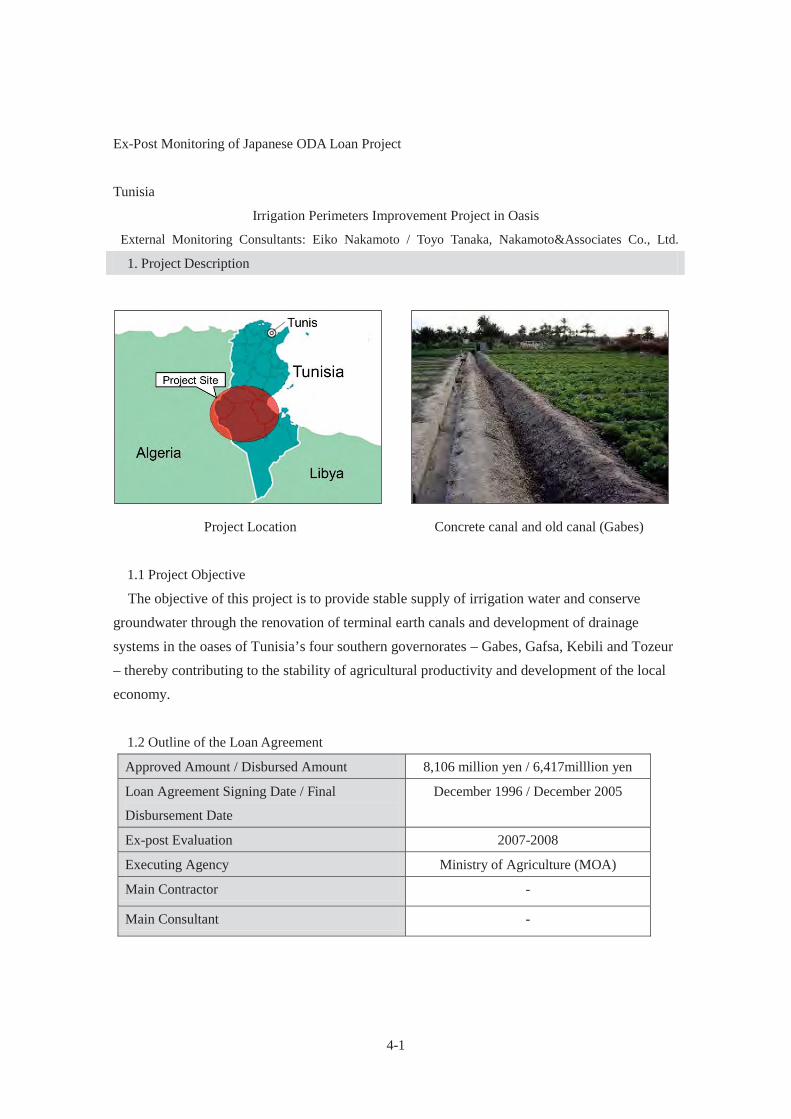
4-1
Ex-Post Monitoring of Japanese ODA Loan Project
Tunisia
Irrigation Perimeters Improvement Project in Oasis
External Monitoring Consultants: Eiko Nakamoto / Toyo Tanaka, Nakamoto&Associates Co., Ltd.
1. Project Description
Project Location Concrete canal and old canal (Gabes)
1.1 Project Objective
The objective of this project is to provide stable supply of irrigation water and conserve groundwater through the renovation of terminal earth canals and development of drainage systems in the oases of Tunisia’s four southern governorates – Gabes, Gafsa, Kebili and Tozeur – thereby contributing to the stability of agricultural productivity and development of the local economy.
1.2 Outline of the Loan Agreement Approved Amount / Disbursed Amount 8,106 million yen / 6,417milllion yen
Loan Agreement Signing Date / Final
Disbursement Date
December 1996 / December 2005
Ex-post Evaluation 2007-2008
Executing Agency Ministry of Agriculture (MOA)
Main Contractor -
Main Consultant -
4-2
1.3 Background of Ex-Post Monitoring
In Tunisia, the agricultural sector is extremely important, as 35% of the population live in rural
areas; agriculture accounts for 11% of its GDP; and agricultural products comprise 9.3% of all
exports. Date palms, an important export product, are a major agricultural product in the southern
oases. The southern oases are, however, in an arid region that receives only 100–200 mm of rainfall
per year; consequently, groundwater has been used to irrigate the land in this area since ancient times.
However, in the oases, due to a lack of adequate terminal channels, the irrigation systems are often
beset with water leakage, resulting in a low usability level. From the fact of lowering of the
groundwater level, and since the development of new water resources is not dependable,
improvement in the effective use of irrigation systems through water conservation was urgently
needed. In order to address this situation, this project has implemented the renovation of terminal
earth canals and development of drainage systems in the oases of Tunisia’s four southern
governorates – Gabes, Gafsa, Kebili and Tozeur.
At the time of ex-post evaluation report (2007), the number of beneficiary rural households of this
project were 18% less compared to the initial plan due to insufficient funds. In addition, the areas
under cultivation in three regions covered by the project were 40% to 60% less than the areas that
were originally planned in the project. From the financial aspect, some Agricultural Development
Groups (GDA) in Tozeur and Kebili were in deficit in 2006. Due to the government proposal to
reduce the budget, the ratio of maintenance cost (CRDA3:GDA7) borne by the GDA was rising.
Since 2005, the ratio of GDA’s funds to the operation and maintenance cost was exceeding 100%.
Also, in the ex-post evaluation report, deterioration of concrete canals was indicated. The cause for
the deterioration was under research at the time. From these situations, concern was shown over the
sustainability of the project.
Therefore, this project was selected for ex-post monitoring and reviewed under each criterion with
the findings from the field survey and other research activities with a final conclusion being drawn.
2. Outline of the Monitoring Study
2.1 External Monitoring Consultants
Eiko Nakamoto (Nakamoto & Associates Co., Ltd.)
Toyo Tanaka (Nakamoto & Associates Co., Ltd.)
2.2 Duration of Monitoring Study
Duration of the Study: September 2012 – June 2013
Duration of the Field Study: November 26, 2012 – December 14, 2012
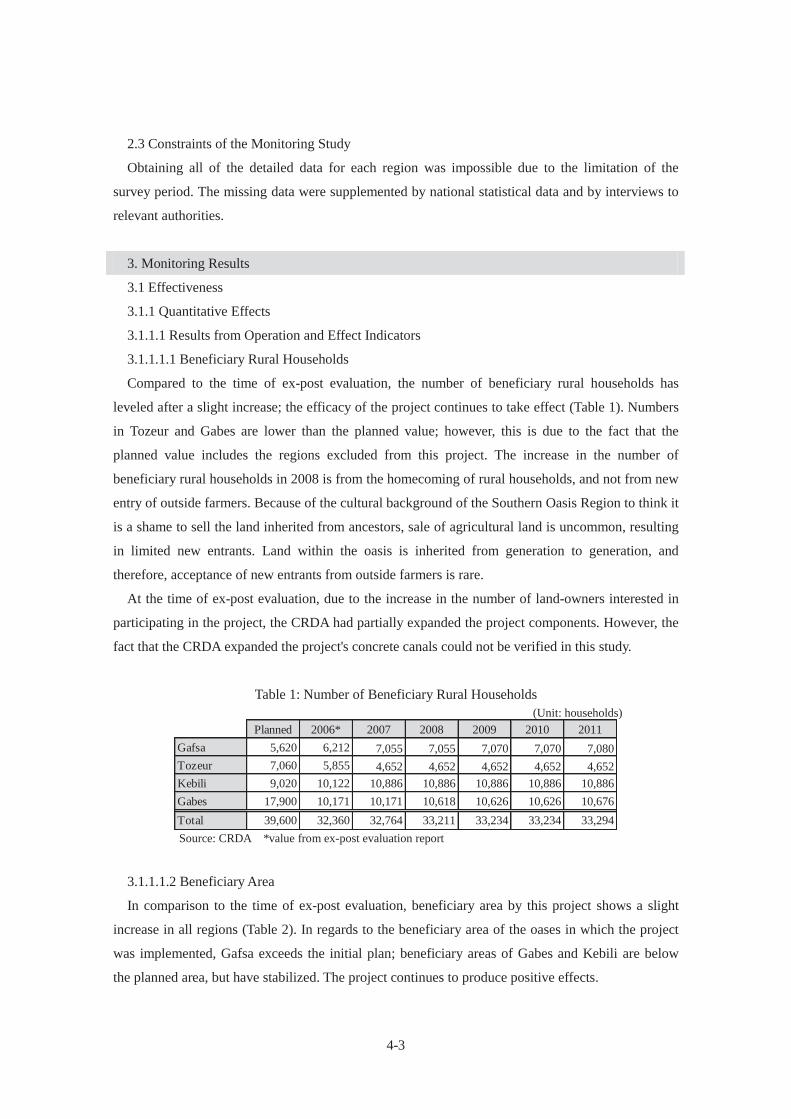
4-3
2.3 Constraints of the Monitoring Study
Obtaining all of the detailed data for each region was impossible due to the limitation of the
survey period. The missing data were supplemented by national statistical data and by interviews to
relevant authorities.
3. Monitoring Results
3.1 Effectiveness
3.1.1 Quantitative Effects
3.1.1.1 Results from Operation and Effect Indicators
3.1.1.1.1 Beneficiary Rural Households
Compared to the time of ex-post evaluation, the number of beneficiary rural households has
leveled after a slight increase; the efficacy of the project continues to take effect (Table 1). Numbers
in Tozeur and Gabes are lower than the planned value; however, this is due to the fact that the
planned value includes the regions excluded from this project. The increase in the number of
beneficiary rural households in 2008 is from the homecoming of rural households, and not from new
entry of outside farmers. Because of the cultural background of the Southern Oasis Region to think it
is a shame to sell the land inherited from ancestors, sale of agricultural land is uncommon, resulting
in limited new entrants. Land within the oasis is inherited from generation to generation, and
therefore, acceptance of new entrants from outside farmers is rare.
At the time of ex-post evaluation, due to the increase in the number of land-owners interested in
participating in the project, the CRDA had partially expanded the project components. However, the
fact that the CRDA expanded the project's concrete canals could not be verified in this study.
Table 1: Number of Beneficiary Rural Households (Unit: households)
Source: CRDA *value from ex-post evaluation report
3.1.1.1.2 Beneficiary Area
In comparison to the time of ex-post evaluation, beneficiary area by this project shows a slight
increase in all regions (Table 2). In regards to the beneficiary area of the oases in which the project
was implemented, Gafsa exceeds the initial plan; beneficiary areas of Gabes and Kebili are below
the planned area, but have stabilized. The project continues to produce positive effects.
Planned 2006* 2007 2008 2009 2010 2011Gafsa 5,620 6,212 7,055 7,055 7,070 7,070 7,080Tozeur 7,060 5,855 4,652 4,652 4,652 4,652 4,652Kebili 9,020 10,122 10,886 10,886 10,886 10,886 10,886Gabes 17,900 10,171 10,171 10,618 10,626 10,626 10,676Total 39,600 32,360 32,764 33,211 33,234 33,234 33,294
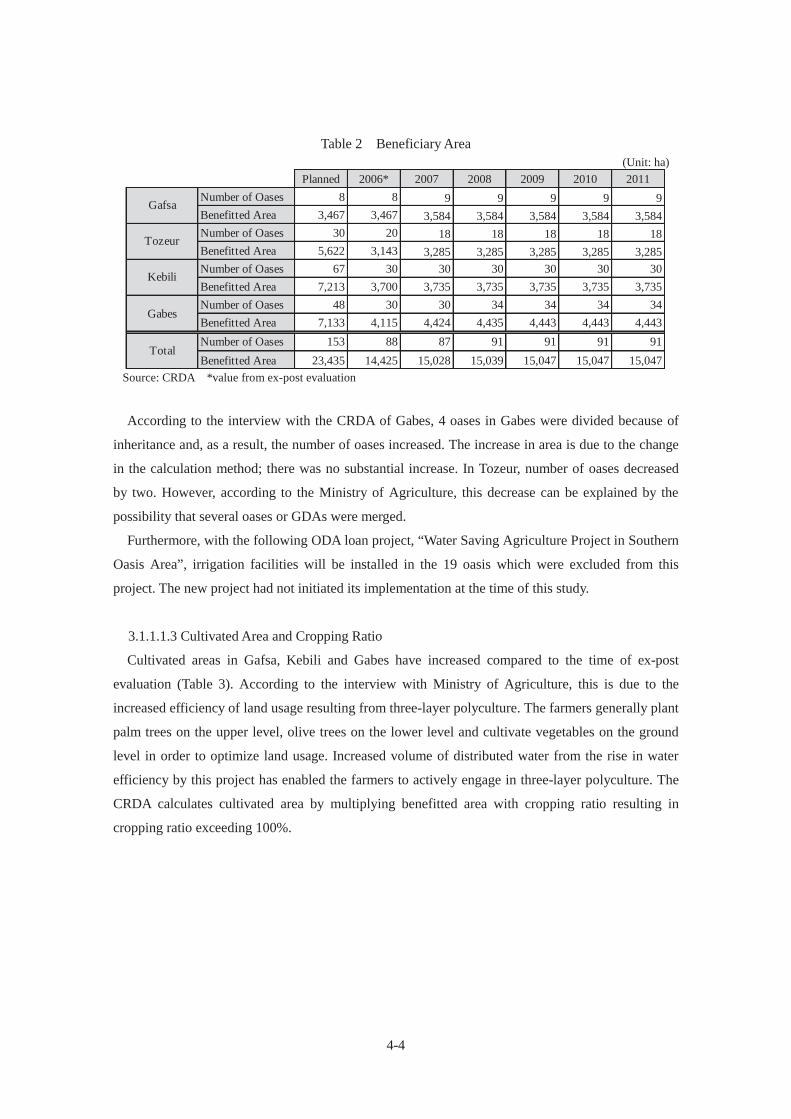
4-4
Table 2 Beneficiary Area (Unit: ha)
Source: CRDA *value from ex-post evaluation
According to the interview with the CRDA of Gabes, 4 oases in Gabes were divided because of
inheritance and, as a result, the number of oases increased. The increase in area is due to the change
in the calculation method; there was no substantial increase. In Tozeur, number of oases decreased
by two. However, according to the Ministry of Agriculture, this decrease can be explained by the
possibility that several oases or GDAs were merged.
Furthermore, with the following ODA loan project, “Water Saving Agriculture Project in Southern
Oasis Area”, irrigation facilities will be installed in the 19 oasis which were excluded from this
project. The new project had not initiated its implementation at the time of this study.
3.1.1.1.3 Cultivated Area and Cropping Ratio
Cultivated areas in Gafsa, Kebili and Gabes have increased compared to the time of ex-post
evaluation (Table 3). According to the interview with Ministry of Agriculture, this is due to the
increased efficiency of land usage resulting from three-layer polyculture. The farmers generally plant
palm trees on the upper level, olive trees on the lower level and cultivate vegetables on the ground
level in order to optimize land usage. Increased volume of distributed water from the rise in water
efficiency by this project has enabled the farmers to actively engage in three-layer polyculture. The
CRDA calculates cultivated area by multiplying benefitted area with cropping ratio resulting in
cropping ratio exceeding 100%.
Planned 2006* 2007 2008 2009 2010 2011Number of Oases 8 8 9 9 9 9 9Benefitted Area 3,467 3,467 3,584 3,584 3,584 3,584 3,584Number of Oases 30 20 18 18 18 18 18Benefitted Area 5,622 3,143 3,285 3,285 3,285 3,285 3,285Number of Oases 67 30 30 30 30 30 30Benefitted Area 7,213 3,700 3,735 3,735 3,735 3,735 3,735Number of Oases 48 30 30 34 34 34 34Benefitted Area 7,133 4,115 4,424 4,435 4,443 4,443 4,443Number of Oases 153 88 87 91 91 91 91Benefitted Area 23,435 14,425 15,028 15,039 15,047 15,047 15,047
Gafsa
Tozeur
Kebili
Gabes
Total
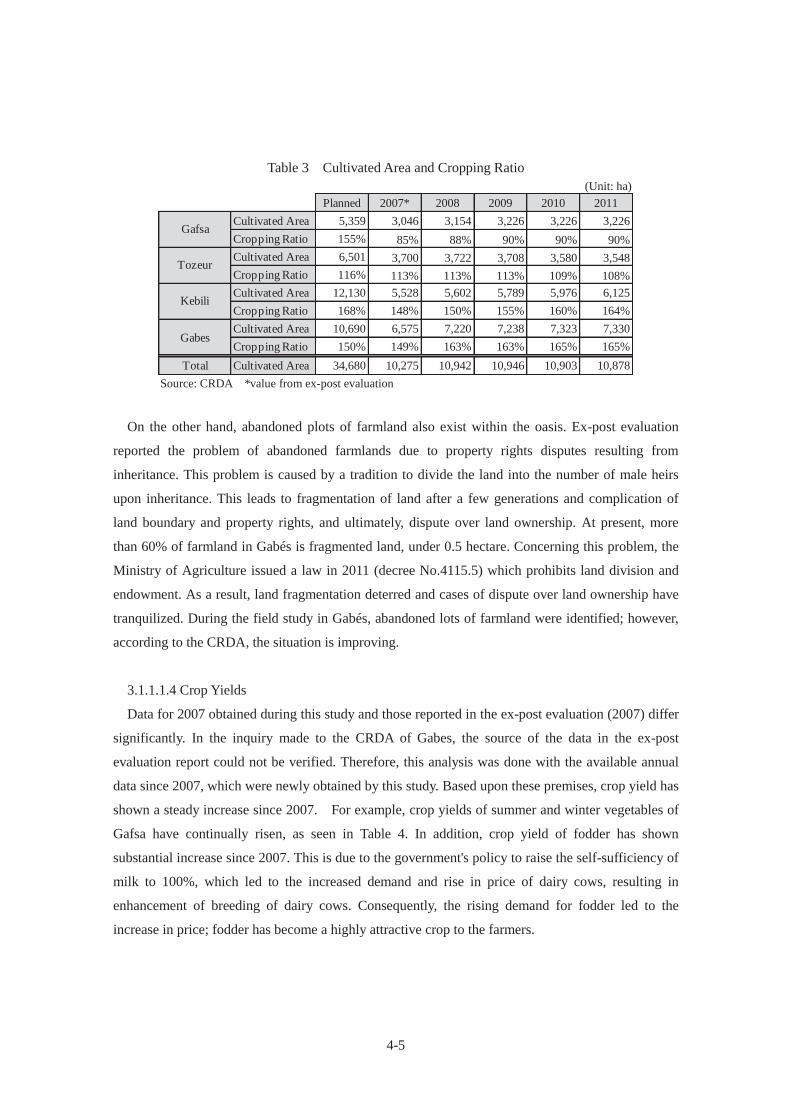
4-5
Table 3 Cultivated Area and Cropping Ratio (Unit: ha)
Source: CRDA *value from ex-post evaluation
On the other hand, abandoned plots of farmland also exist within the oasis. Ex-post evaluation
reported the problem of abandoned farmlands due to property rights disputes resulting from
inheritance. This problem is caused by a tradition to divide the land into the number of male heirs
upon inheritance. This leads to fragmentation of land after a few generations and complication of
land boundary and property rights, and ultimately, dispute over land ownership. At present, more
than 60% of farmland in Gabés is fragmented land, under 0.5 hectare. Concerning this problem, the
Ministry of Agriculture issued a law in 2011 (decree No.4115.5) which prohibits land division and
endowment. As a result, land fragmentation deterred and cases of dispute over land ownership have
tranquilized. During the field study in Gabés, abandoned lots of farmland were identified; however,
according to the CRDA, the situation is improving.
3.1.1.1.4 Crop Yields
Data for 2007 obtained during this study and those reported in the ex-post evaluation (2007) differ
significantly. In the inquiry made to the CRDA of Gabes, the source of the data in the ex-post
evaluation report could not be verified. Therefore, this analysis was done with the available annual
data since 2007, which were newly obtained by this study. Based upon these premises, crop yield has
shown a steady increase since 2007. For example, crop yields of summer and winter vegetables of
Gafsa have continually risen, as seen in Table 4. In addition, crop yield of fodder has shown
substantial increase since 2007. This is due to the government's policy to raise the self-sufficiency of
milk to 100%, which led to the increased demand and rise in price of dairy cows, resulting in
enhancement of breeding of dairy cows. Consequently, the rising demand for fodder led to the
increase in price; fodder has become a highly attractive crop to the farmers.
Planned 2007* 2008 2009 2010 2011Cultivated Area 5,359 3,046 3,154 3,226 3,226 3,226Cropping Ratio 155% 85% 88% 90% 90% 90%Cultivated Area 6,501 3,700 3,722 3,708 3,580 3,548Cropping Ratio 116% 113% 113% 113% 109% 108%Cultivated Area 12,130 5,528 5,602 5,789 5,976 6,125Cropping Ratio 168% 148% 150% 155% 160% 164%Cultivated Area 10,690 6,575 7,220 7,238 7,323 7,330Cropping Ratio 150% 149% 163% 163% 165% 165%
Total Cultivated Area 34,680 10,275 10,942 10,946 10,903 10,878
Gafsa
Tozeur
Kebili
Gabes

4-6
Table 4 Crop Yield (Unit: tons/ha)
Source: CRDA
According to the CRDA of Gabés, as described above, stable production as a result of increased
irrigation water supply has enabled the farmers to engage in three-layer polyculture. In addition,
irrigation water enabled the farmers to cultivate in the dry season, and the resulting increase in the
cultivation period has led to the rise in the crop yield. Crop yields of olives and pomegranates have
particularly increased. In addition, the drop in crop yields of fruit trees seen in 2010 is due to heavy
rainfall.
3.1.1.2 Results of Calculations of Internal Rates of Return (IRR)
In the ex-post evaluation report, Internal Rate of Return (IRR) was calculated to be 9.0%.
However, since the basis of this calculation used in the ex-post evaluation report could not be
obtained, IRR will not be calculated in this report.
3.1.2 Qualitative Effects
From the interview with the CRDA of Gabés, and from the responses to the questionnaires sent to
the CRDAs, positive quantitative effects of the project reported in the ex-post evaluation report were
Planned 2007 2008 2009 2010 2011
Fruit Trees 11.7 10.6 10.6 10.7 10.6 10.7
Summer Vegetables 18 4.3 4.4 4.5 4.6 4.6
Winter Vegetables 23.6 6.5 6.6 6.8 6.8 6.8
Fodder 59.3 65.8 65.7 65.9 66.0 66.1
Fruit Trees 2.5 525.0 533.0 582.0 582.0 611.0
Summer Vegetables 9.6
Winter Vegetables 12.5
Fodder 79.9 5,612.0 6,543.0 7,764.0 11,832.0 10,420.0
Fruit Trees 2.8 539.6 541.0 566.0 576.0 576.0
Summer Vegetables 10.1 50.0 58.0 59.0 48.0 6.0
Winter Vegetables 12.8 165.0 240.0 230.0 253.0 157.0
Fodder 20.1 1353.0 1443.0 1402.0 1370.0 1085.0
Fruit Trees 11.8 32.3 34.6 34.6 31.6 35.1
Summer Vegetables 15.2 11.1 11.7 12.3 13.4 13.4
Winter Vegetables 28.1 27.0 27.3 27.3 28.7 28.7
Fodder 59.4 59.0 71.3 75.4 77.6 81.7
Kebili
Gabes
1,350.0 1,336.0 1,269.01,724.0 1,596.0
Gafsa
Tozeur
4-7
confirmed. The installation of concrete irrigation canals has reduced water leakages and increased
water efficiency. The effects produced from this effect are as follows: First, salt damage has
decreased. Since irrigation water is periodically drawn into the farmland, salinity in the soil is
washed away, and salt damage was decreased from depressed salt concentration in the soil. However,
scientific research has not been performed on the salinity or the conservation of ground water
resources. Second, since the irrigation canals used before the projects were simple ditches dug in the
ground, there was substantial water loss. Concrete canals enabled efficient water use, and water
distribution to farmers farther downstream became possible. Third, with the stable volume of water
supply, accurate calculation of water distribution became possible, and as a result, water outages
decreased and led to the increase in crop yields. The distribution of water to farmers is done
according to a rotation system between users. The rotation system consists of deciding on the order
in which irrigation water is used by each farmer as well as the allocated time which is counted by
hours per user, in order to optimize the efficient use of irrigation water. The installation of concrete
water pipes has allowed for improved precision in terms of time and volume of water distributed to
each parcel. This has helped reduce water outages and led to increased production. Furthermore, the
improvement in water efficiency increased the volume of water distributed per hour, and reduced the
time for water distribution to each parcel. Fourth, diversification of crops resulting from more
farmers engaging in three-layer polyculture has led to a reduction in the fallow periods. The fallow
periods, in which the farmlands were unused, were between 20 to 50 days before the implementation
of the project. After the project, periods were reduced to 17 to 35 days. In addition, the qualities of
harvested products have improved compared to those before the project.
The above mentioned items confirm that the positive effects at the time of ex-post evaluation
continue to be produced. Although the problem of aforementioned abandoned farmlands resulting
from dispute over land ownership has not been solved, the problem is showing signs of steady
improvement from the efforts made by the Ministry of Agriculture.
3.2 Impact
3.2.1 Intended Impacts
Ex-post evaluation report indicated this project’s impact of younger generations’ return to
agriculture. According to the interview to the CRDA, the recent years have witnessed a growing
tendency for younger generation, between 39 and 50 years old, to return to agricultural activities.
This is due to the fact that increased irrigation efficiency has made irrigated agriculture more
accessible than before, and part-time agriculture, undertaking agricultural tasks as secondary
activities, became possible. There are also an increasing number of people returning to farming after
early retirement. It can be assured that the contribution of this project to the returning of those
4-8
aforementioned to agricultural activities is continually significant, since the ex-post evaluation.
Ex-post evaluation reported the increase in employment opportunities of seasonal workers during
harvesting season, resulting from the increase in agricultural production brought about by this
project. Currently, the increase in agricultural production continues to produce employment
opportunities for seasonal workers during the harvest season. However, the increase of agricultural
production in the oasis gave a rise to a new problem of insufficient seasonal labor. The olive harvest
season in the southern region requires a seasonal workforce of 120,000 workers, while in reality,
there only 20,000 workers are available. Seasonal workers receive low wages and do not have any
social insurance; such conditions are not attractive to young people. The majority of seasonal
workers (more than 80%) are women. In recent years, women’s advance into society have
accelerated in Tunisia, and women have better chances of finding work that offer better working
conditions compared to seasonal workers. This is also a factor in the shortage of seasonal workers. In
addition, political instability in neighboring country of Libya resulted in refugees flowing into
Tunisia. This has created a demand for vast quantities of food. While the farmers are increasing their
productions, the seasonal workers immigrate to countries paying higher wages such as the Gulf and
Libya creating a shortage of seasonal workers in Tunisia. In case of serious shortage, the government
assists the harvest of olives by sending military troops to the region. This problem has not yet been
solved. The problem not only concerns the targeted area covered by this project, but is in fact a
common issue for the entire southern region.
The project’s impact of improvement in salt damage from saline soil, decrease in water outage,
and increase in the diversity of crops continues to take effect. Decrease in the salt damage and
increase in the volume of distributed water have raised the precision of calculation for water
distribution, which led to diversification or crops and decreased water outage. Agricultural
production and household income increased as a result. This project’s positive impact on the
improvement of living standards of farmers in the target area continues to take effect. There are a
growing number of farmers that have purchased new cars or have built house extensions. In addition,
owing to the positive effects observed in terms of water efficiency through the concrete canals
installed by this project, some farmers have installed in their own parcel, concrete canals similar to
the ones used in the project at their own cost. This is also another positive effect of the project.
3.2.2 Other Impacts
3.2.2.1 Environmental Impact
The negative impact of the project that was mentioned in the ex-post evaluation concerning the
decrease in the number of birds as well as the decrease of cooling effect inside the oasis was not
based on empirical and scientific data, but rather on the personal opinion of the interviewed persons.
According to the Ministry of Environment, there has been no scientific study conducted concerning
4-9
the decrease in the number of birds or on the decrease in the cooling effect inside the oasis. The
Ministry of Agriculture, in collaboration with the Ministry of Environment and UNESCO, has
jointly proceeded to the starting of a project on the protection of the oasis, and the results of the
study are expected from this project. As for the decrease of cooling effects of the oasis, the CRDA of
Gabes is not aware of such impact.
The Ministry of Environment has stated that this project had a positive impact on the protection of
oases, protection of nonrenewable resources such as fossil water, protection of soil, and prevention
of desertification. Continual effects of these impacts reported in the ex-post evaluation were
confirmed.
According to the interview with the CRDA of Gabés, “water is rare in this region; carefully
attention is paid to maintain the balance between the production and the preservation of water
resources when using water for agriculture. Therefore, there are no negative changes concerning
water”.
3.2.2.2 Impact to Surrounding Regions
At the time of ex-post evaluation, it was confirmed that this project was contributing to the
improvement of economic and social life of the surrounding regions by reclamation of farmland in
the outer regions of the oasis using surplus water. According to the CRDA of Gabes, efficient water
distribution continues to be possible since the time of ex-post evaluation, and reclamation of oases’
outer region is also continually pursued; these impacts are continues to take effect. On the other hand,
the Ministry of Agriculture states that it is necessary to reinforce and enforce the law, since the
public order has become unstable after the revolution and more people are using the water illegally.
This issue is not peculiar only to the oases targeted by this project, but a common problem in all of
the oases. Since the illegal users do not pay the water fee, it is possible that there could be negative
effects on the sustainable management of the oasis. However, the Ministry of Agriculture considers
the current condition of Tunisia to be temporary, and expects this situation of the illegal usage of
water to improve in the future.
3.2.2.3 Land Acquisition, Relocation
There have been no land acquisitions or relocation since the time of ex-post evaluation.

4-10
Concrete canals Copied concrete canal
Delamination from salt damage can be seen
(See 3.3.3.1 and 3.3.4)
The continued consistency of the impact of this project was confirmed. However, there were no
scientific studies on the impact of the environment; the scientific results are expected from the
UNESCO project on oasis preservation.
3.3 Sustainability
3.3.1 Structural Aspects of Operation and Maintenance
3.3.1.1 CRDA
According to the Ministry of Agriculture, there were no notable changes in the maintenance and
operation system since the ex-post evaluation. The activities related to operation and maintenance of
the facilities and the equipment is shared between the CRDA and the GDA. However, the shared
roles differ by region. Relations between the CRDA and the GDA are good.1 The system of task
sharing between the CRDA and the GDA in the region of Gabes, based on the interviews and the site
visit, will be presented below.
The organization of the CRDA has been enhanced by the increase in the number of staff compared
to the time of ex-post evaluation. According to the answers to the questionnaire sent to the CRDA,
the CRDA is responsible for repairs of large-scale facilities (irrigation facilities, main irrigation
channels, secondary irrigation channels) and maintenance requiring certain expertise. This has not
changed since the ex-post evaluation. The CRDA also provides for the GDA the necessary
1 Cultural background of the oasis: Since water is scarce in the southern oases region, management of oases water has been carried out by communities since ancient times. Irrigation techniques were developed. Irrigational rotation system and the volume of water according to the area and types of crop were calculated by engineers. In the 16th century, an agricultural organization, a predecessor of the GDA, was established. This organization was carried over to the GDA, making a solid foundation. Therefore, after the revolution of 2011, while the GDAs in other regions were dissolved, those in the southern regions remained intact and have built a firm relationship with the CRDA.
4-11
calculations for water rotation system.2 In the CRDA of Gabes, the Maintenance Unit and the
Department of Operations of Irrigated Perimeters (DOIP) perform the operation and maintenance of
the facilities. The Maintenance Unit and the DOIP, which is under the Division of Hydraulics and
Rural Equipment, conducts the maintenance of pumping stations and cooling facilities upon the
request from the GDA.
At the time of ex-post evaluation, there were 1 to 2 engineers, several technicians, and 10 to 20
skilled workers at each CRDA. Currently, each CRDA hires, as full-time employees, 1 to 24
engineers, 7 to 40 technicians, and 10 to 33 skilled workers.
The ex-post evaluation report mentioned that there was a growing tendency for the CRDA to
outsource its activities. This tendency continues to be present within the CRDA. However, the
reason for outsourcing is not only the shortage of staff, but upon the expectation to stimulate the
local economy through promotion of sound competition.
3.3.1.2 GDA
Since the last assessment, there have been no significant changes regarding the organizational
system of the GDA. The GDA is in charge of small-scale repairs and daily maintenance of irrigation
facilities. However, there are regions such as Gabes, where most of the maintenance activities are
entrusted to the GDA by the CRDA. In Gabes, all the maintenance activities of the facilities and
equipment are performed by the GDA. The cost of the maintenance is borne by the GDA, and
collected from each rural household. Henceforth, the CRDA of Gabes is urging the GDA to directly
hire external subcontractors themselves for the repairs of the facilities and without the involvement
of the CRDA. According to the interviewed with the CRDA of Gabes, the GDA is increasingly
resorting to outsourcing to external subcontractors. However, the GDA desires to return to the
traditional system of the CRDA managing the large-scale repairs, and the GDA managing the
small-scale repairs. The cost of repair by the CRDA is considerably lower. On the other hand, the
CRDA claims that the GDA has sufficient financial capacity to manage the operation and
maintenance of the facilities as the policy of the State also promotes the GDA participation in
covering the operation and maintenance cost of water systems.
2 The frequency and duration of water distribution is determined by the area and the types of crop. Based on these factors, "calculation for rotation system" is the process of calculating frequency and time of irrigation usage.
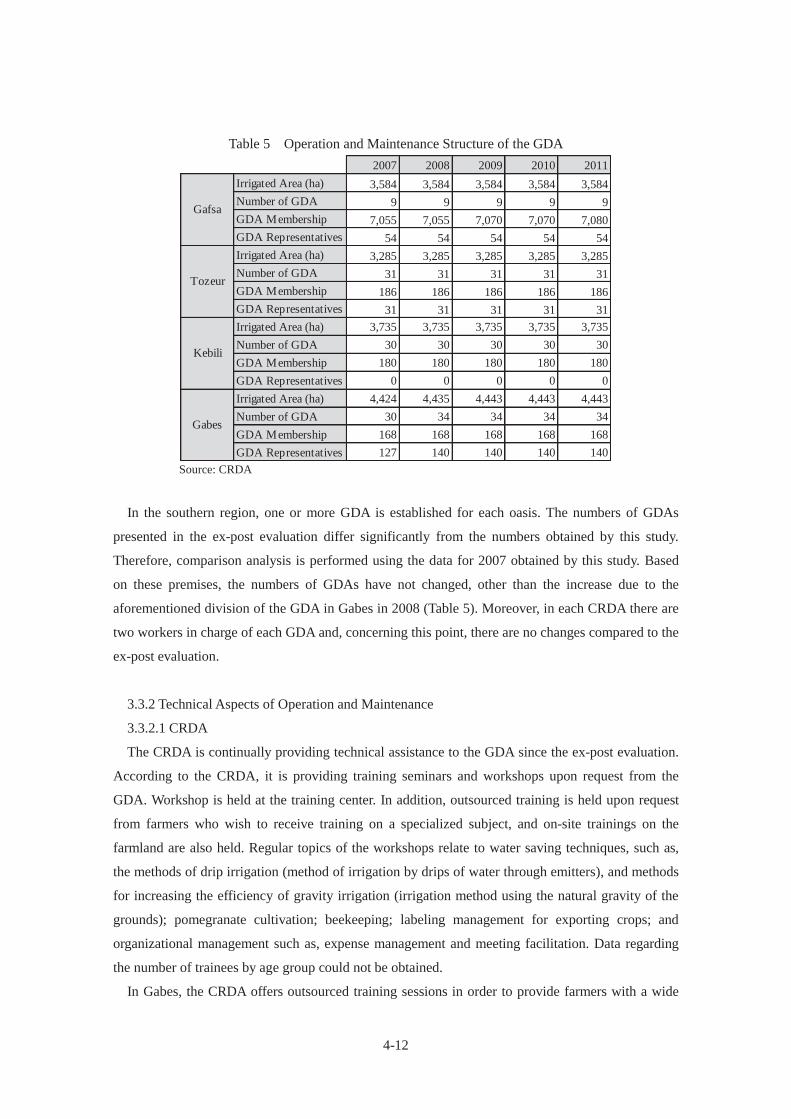
4-12
Table 5 Operation and Maintenance Structure of the GDA
Source: CRDA
In the southern region, one or more GDA is established for each oasis. The numbers of GDAs
presented in the ex-post evaluation differ significantly from the numbers obtained by this study.
Therefore, comparison analysis is performed using the data for 2007 obtained by this study. Based
on these premises, the numbers of GDAs have not changed, other than the increase due to the
aforementioned division of the GDA in Gabes in 2008 (Table 5). Moreover, in each CRDA there are
two workers in charge of each GDA and, concerning this point, there are no changes compared to the
ex-post evaluation.
3.3.2 Technical Aspects of Operation and Maintenance
3.3.2.1 CRDA
The CRDA is continually providing technical assistance to the GDA since the ex-post evaluation.
According to the CRDA, it is providing training seminars and workshops upon request from the
GDA. Workshop is held at the training center. In addition, outsourced training is held upon request
from farmers who wish to receive training on a specialized subject, and on-site trainings on the
farmland are also held. Regular topics of the workshops relate to water saving techniques, such as,
the methods of drip irrigation (method of irrigation by drips of water through emitters), and methods
for increasing the efficiency of gravity irrigation (irrigation method using the natural gravity of the
grounds); pomegranate cultivation; beekeeping; labeling management for exporting crops; and
organizational management such as, expense management and meeting facilitation. Data regarding
the number of trainees by age group could not be obtained.
In Gabes, the CRDA offers outsourced training sessions in order to provide farmers with a wide
2007 2008 2009 2010 2011Irrigated Area (ha) 3,584 3,584 3,584 3,584 3,584Number of GDA 9 9 9 9 9GDA Membership 7,055 7,055 7,070 7,070 7,080GDA Representatives 54 54 54 54 54Irrigated Area (ha) 3,285 3,285 3,285 3,285 3,285Number of GDA 31 31 31 31 31GDA Membership 186 186 186 186 186GDA Representatives 31 31 31 31 31Irrigated Area (ha) 3,735 3,735 3,735 3,735 3,735Number of GDA 30 30 30 30 30GDA Membership 180 180 180 180 180GDA Representatives 0 0 0 0 0Irrigated Area (ha) 4,424 4,435 4,443 4,443 4,443Number of GDA 30 34 34 34 34GDA Membership 168 168 168 168 168GDA Representatives 127 140 140 140 140
Gafsa
Tozeur
Kebili
Gabes
4-13
variety of expertise, in addition to the seminars given by its own engineers. Also, the CRDA holds
meetings semi-annually with representatives from each GDA to share the knowledge concerning
irrigation and water efficiency.
3.3.2.2 GDA
Technical assistance by the CRDA is continually being provided since the ex-post evaluation.
Through CRDA’s technical assistance, the GDA has become able to carry out the maintenance
operations by themselves. The training sessions offered by the CRDA are basically free of charge.
The GDA actively attend these training courses and apply the knowledge such as new irrigational
techniques and cultivation of various crops them in the agricultural lands they are managing, to their
agricultural activities.
According to the interview with the GDA, apart from the various free training courses offered by
the CRDA, they attend the CRDA’s outsourced training sessions such as pomegranate cultivation
and labeling management for exporting pomegranates. The CRDA bears the cost of the training;
however, if the training topic benefits only some of the farmers, then the beneficiaries share the cost.
At the time of ex-post evaluation, GDAs were hiring technical experts, such as engineers. However,
the number of technical experts could not be obtained. Currently, most GDAs hire a technical
director who manages the technical and financial affairs of the GDA.
3.3.2.3 Ministry of Agriculture
In the ex-post assessment of the project, it was mentioned that the Ministry of Agriculture
organizes orientation meetings for the farmers. Currently, these meetings are held by the CRDA and
not the Ministry of Agriculture as the CRDA is the regional office of the Ministry of Agriculture.
Actual implementation such as technical assistance to the GDA is done by the CRDA, and the
Ministry of Agriculture is responsible for general affairs and overall management. Ministry of
Agriculture holds irregular sensitization sessions and training sessions for water-saving and
irrigation techniques for the GDAs and the farmers. In addition, the Ministry of Agriculture holds a
meeting once a month with the representatives of all CRDAs to provide the necessary information.
According to the Ministry of Agriculture, the water efficiency is one of the national agenda. It is
cooperating with the Ministry of Environment to carry out water saving campaigns through
television commercials and regional television programs. Annual “Water Day” was established to
send a variety of messages for the importance of water resource.
3.3.3 Financial Aspects of Operation and Maintenance
3.3.3.1 CRDA
Water fee collection rate from the GDA continues to be close to 100% since the ex-post evaluation.
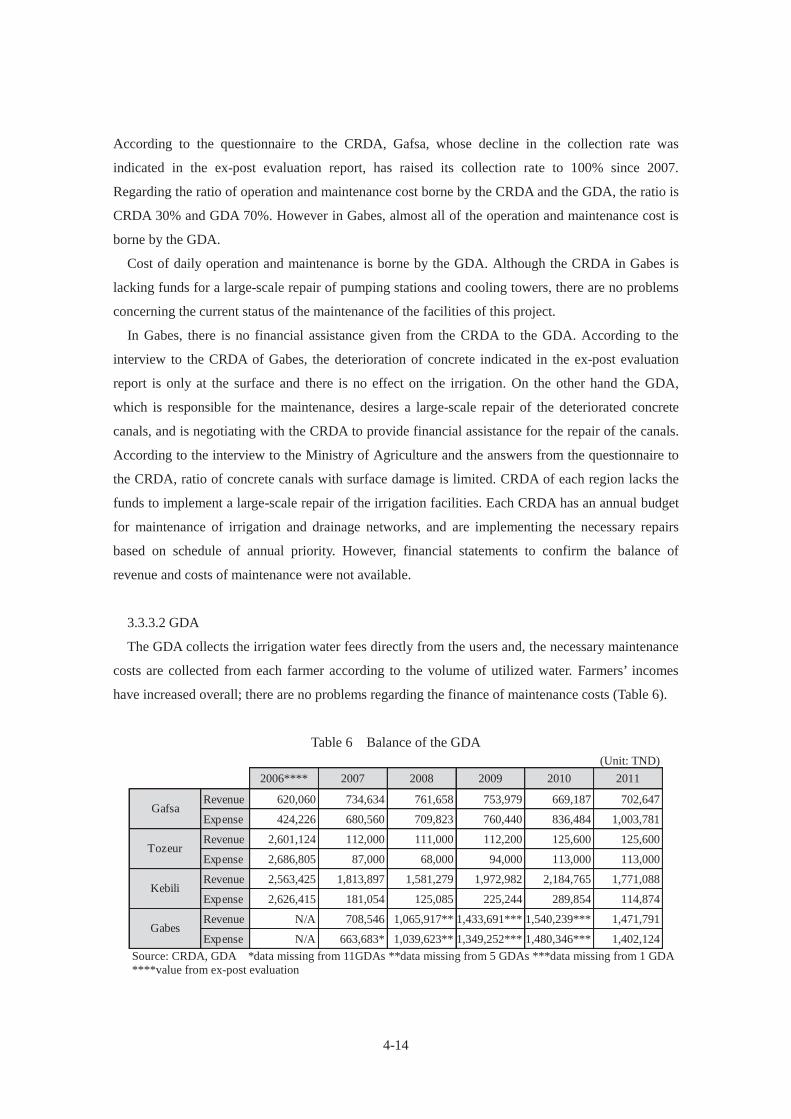
4-14
According to the questionnaire to the CRDA, Gafsa, whose decline in the collection rate was
indicated in the ex-post evaluation report, has raised its collection rate to 100% since 2007.
Regarding the ratio of operation and maintenance cost borne by the CRDA and the GDA, the ratio is
CRDA 30% and GDA 70%. However in Gabes, almost all of the operation and maintenance cost is
borne by the GDA.
Cost of daily operation and maintenance is borne by the GDA. Although the CRDA in Gabes is
lacking funds for a large-scale repair of pumping stations and cooling towers, there are no problems
concerning the current status of the maintenance of the facilities of this project.
In Gabes, there is no financial assistance given from the CRDA to the GDA. According to the
interview to the CRDA of Gabes, the deterioration of concrete indicated in the ex-post evaluation
report is only at the surface and there is no effect on the irrigation. On the other hand the GDA,
which is responsible for the maintenance, desires a large-scale repair of the deteriorated concrete
canals, and is negotiating with the CRDA to provide financial assistance for the repair of the canals.
According to the interview to the Ministry of Agriculture and the answers from the questionnaire to
the CRDA, ratio of concrete canals with surface damage is limited. CRDA of each region lacks the
funds to implement a large-scale repair of the irrigation facilities. Each CRDA has an annual budget
for maintenance of irrigation and drainage networks, and are implementing the necessary repairs
based on schedule of annual priority. However, financial statements to confirm the balance of
revenue and costs of maintenance were not available.
3.3.3.2 GDA
The GDA collects the irrigation water fees directly from the users and, the necessary maintenance
costs are collected from each farmer according to the volume of utilized water. Farmers’ incomes
have increased overall; there are no problems regarding the finance of maintenance costs (Table 6).
Table 6 Balance of the GDA (Unit: TND)
Source: CRDA, GDA *data missing from 11GDAs **data missing from 5 GDAs ***data missing from 1 GDA ****value from ex-post evaluation
2006**** 2007 2008 2009 2010 2011
Revenue 620,060 734,634 761,658 753,979 669,187 702,647
Expense 424,226 680,560 709,823 760,440 836,484 1,003,781
Revenue 2,601,124 112,000 111,000 112,200 125,600 125,600
Expense 2,686,805 87,000 68,000 94,000 113,000 113,000
Revenue 2,563,425 1,813,897 1,581,279 1,972,982 2,184,765 1,771,088
Expense 2,626,415 181,054 125,085 225,244 289,854 114,874
Revenue N/A 708,546 1,065,917** 1,433,691*** 1,540,239*** 1,471,791
Expense N/A 663,683* 1,039,623** 1,349,252*** 1,480,346*** 1,402,124
Gafsa
Tozeur
Kebili
Gabes
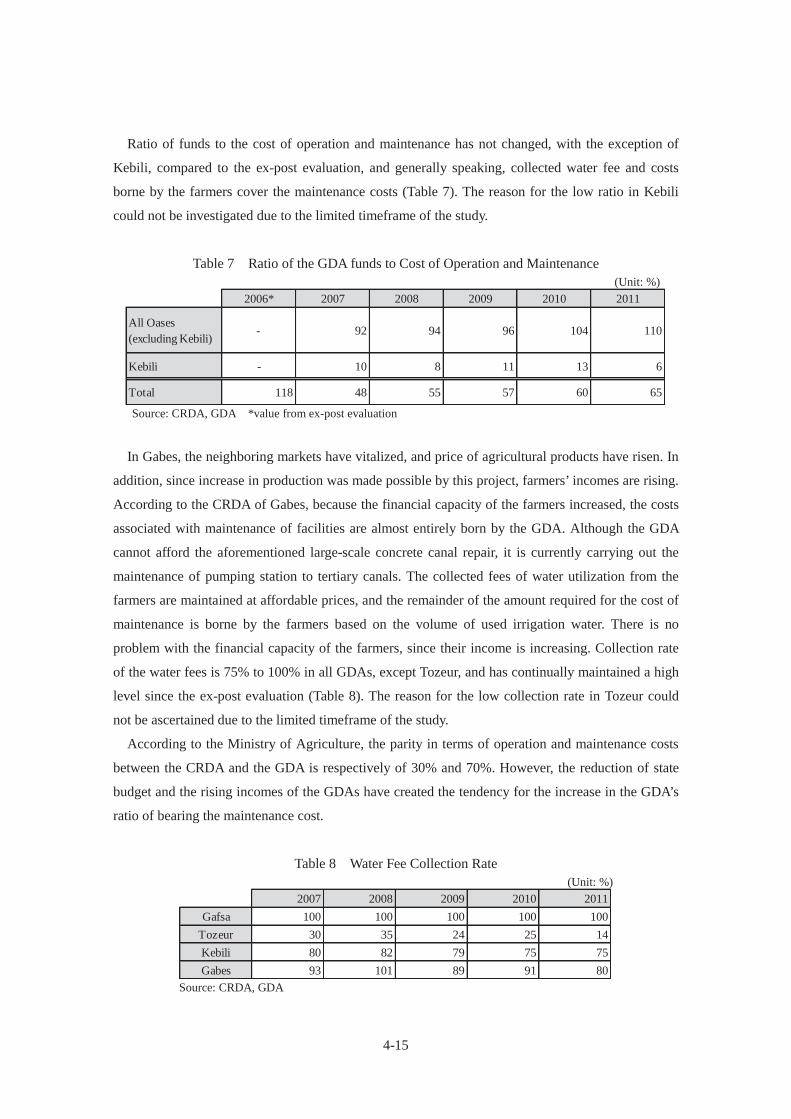
4-15
Ratio of funds to the cost of operation and maintenance has not changed, with the exception of
Kebili, compared to the ex-post evaluation, and generally speaking, collected water fee and costs
borne by the farmers cover the maintenance costs (Table 7). The reason for the low ratio in Kebili
could not be investigated due to the limited timeframe of the study.
Table 7 Ratio of the GDA funds to Cost of Operation and Maintenance (Unit: %)
Source: CRDA, GDA *value from ex-post evaluation
In Gabes, the neighboring markets have vitalized, and price of agricultural products have risen. In
addition, since increase in production was made possible by this project, farmers’ incomes are rising.
According to the CRDA of Gabes, because the financial capacity of the farmers increased, the costs
associated with maintenance of facilities are almost entirely born by the GDA. Although the GDA
cannot afford the aforementioned large-scale concrete canal repair, it is currently carrying out the
maintenance of pumping station to tertiary canals. The collected fees of water utilization from the
farmers are maintained at affordable prices, and the remainder of the amount required for the cost of
maintenance is borne by the farmers based on the volume of used irrigation water. There is no
problem with the financial capacity of the farmers, since their income is increasing. Collection rate
of the water fees is 75% to 100% in all GDAs, except Tozeur, and has continually maintained a high
level since the ex-post evaluation (Table 8). The reason for the low collection rate in Tozeur could
not be ascertained due to the limited timeframe of the study.
According to the Ministry of Agriculture, the parity in terms of operation and maintenance costs
between the CRDA and the GDA is respectively of 30% and 70%. However, the reduction of state
budget and the rising incomes of the GDAs have created the tendency for the increase in the GDA’s
ratio of bearing the maintenance cost.
Table 8 Water Fee Collection Rate (Unit: %)
Source: CRDA, GDA
2006* 2007 2008 2009 2010 2011
All Oases(excluding Kebili)
- 92 94 96 104 110
Kebili - 10 8 11 13 6
Total 118 48 55 57 60 65
2007 2008 2009 2010 2011Gafsa 100 100 100 100 100
Tozeur 30 35 24 25 14Kebili 80 82 79 75 75Gabes 93 101 89 91 80
4-16
3.3.3.3 Ministry of Agriculture
Ex-post evaluation reported that the Ministry of Agriculture was granting subsidy to the GDA.
However, the subsidy is currently not being given. The Ministry of Agriculture undertakes measures
through the CRDA, and no direct subsidy towards the GDA is being implemented. According to the
interview, large-scale repair is being undertaken by cooperation of the CRDA and the GDA, and
small-scale repair and daily maintenance is undertaken by the GDA; granting subsidy is not
necessary.
Moreover, as additional information, from an interview with the Ministry of Agriculture, and
information on the website of the Ministry of Planning and Regional Development, there is a fund
called FOSDAP (Special Fund for Agriculture and Fisheries Development), intended for small-scale
farmers. The fund is managed by the BNA (National Agriculture Bank) and allocated indirectly to
small farmers through the CRDAs in order to assist in financing of the costs associated with
irrigation activities. The fund also assists the GDAs through financing the costs for the renovation
and maintenance of the irrigational network. The allocated amounts are limited to 60% of the cost,
and in 2012, 23.5million Dinars have been disbursed to the 24 CRDAs.
3.3.4 Current Status of Operation and Maintenance
The deterioration of the concrete irrigation channels, mentioned in the ex-post evaluation, was
seen in certain facilities during the field survey at the CRDA of Gabes. According to the Ministry of
Agriculture, delamination of concrete is due to salt damage from the salinity of soil and salt
contained in the moisture. According to the CRDA of Gabes, it is due to salinity and sulfurization
from the soil, and also, the effect of the quality of concrete used for the project. At the time of
construction, the concrete with “high resistance to salinity” was selected. However, since the
selection was made considering the balance between cost and quality, the selected concrete was not
of highest quality, but one that can withstand the use for irrigation. Therefore, the concrete has
deteriorated with time. However, the deterioration is only on the surface, and there is no influence on
the capacity of irrigation. During the site visit, new concrete canals could not be seen, but the surface
of the canals was repaired with additional layer of concrete. According to the answers to the
questionnaires, in Kebili and Tozeur, repair has not been undertaken since the deterioration is only
on the surface of the concrete, and is evident in only 3% of all canals. The repair of the concrete
surface is being undertaken by the CRDA, but due to budget constraints, the repair work is
undertaken according to priority. At the CRDA of Kebili, maintenance is thoroughly conducted
whereas all water pipes in the cooling facilities, descaling of the cooling tower, replacing of pipes
and wooden grids are done once every two years. In Tozeur, maintenance of cooling facilities
maintenance is jointly executed by the CRDA and the GDA. During the site visit in Gabes, the
4-17
facilities were in order, and no problems could be detected.
Thus, the operation and maintenance has been properly carried out by the cooperation of the
CRDA and the GDA. The study confirmed that there is no problem from the time of ex-post
evaluation.
4. Conclusion, Lessons Learned and Recommendations
4.1 Conclusion
The number of beneficiary rural households as well as that of the cultivated areas is increasing.
On the other hand, qualitative effects reported in the ex-post evaluation such as the increase in the
number of the returned farmers, the reduction of soil salinity, the rise in the standard of living, have
once again been confirmed. Deteriorations of concrete canals, indicated in the ex-post evaluation,
were also confirmed. However, the authorities noted that this deterioration was only on the surface
of the concrete. Also, from the fact that the CRDA judged that there were no problems with the
function of the canal, and although elementary efforts to repair the deteriorating surface were seen, it
can be concluded that there is no problem with the sustainability of the project. Taking into
consideration the above-mentioned findings, it is concluded that the positive effects of the project
continue to be seen after the ex-post evaluation.
4.2 Recommendations
None.
4.3 Lessons Learned
From ancient times, certain distinctive culture exists in the southern region of Tunisia which
stipulates that selling oasis lands inherited from the ancestors is perceived as a shame. This is the
cause for limited sales of land, and few new entrants. Therefore, utilizing “the number of beneficiary
rural households” as an indicator to assess the effect of project is inappropriate. Rather, indicators
such as “irrigation usage rate”, “change in agricultural production” should have been analyzed.
Based on this, when selecting operation and effect indicators for this type of project, it is necessary
to take into account the regional cultural background and characteristics of the targeted region.
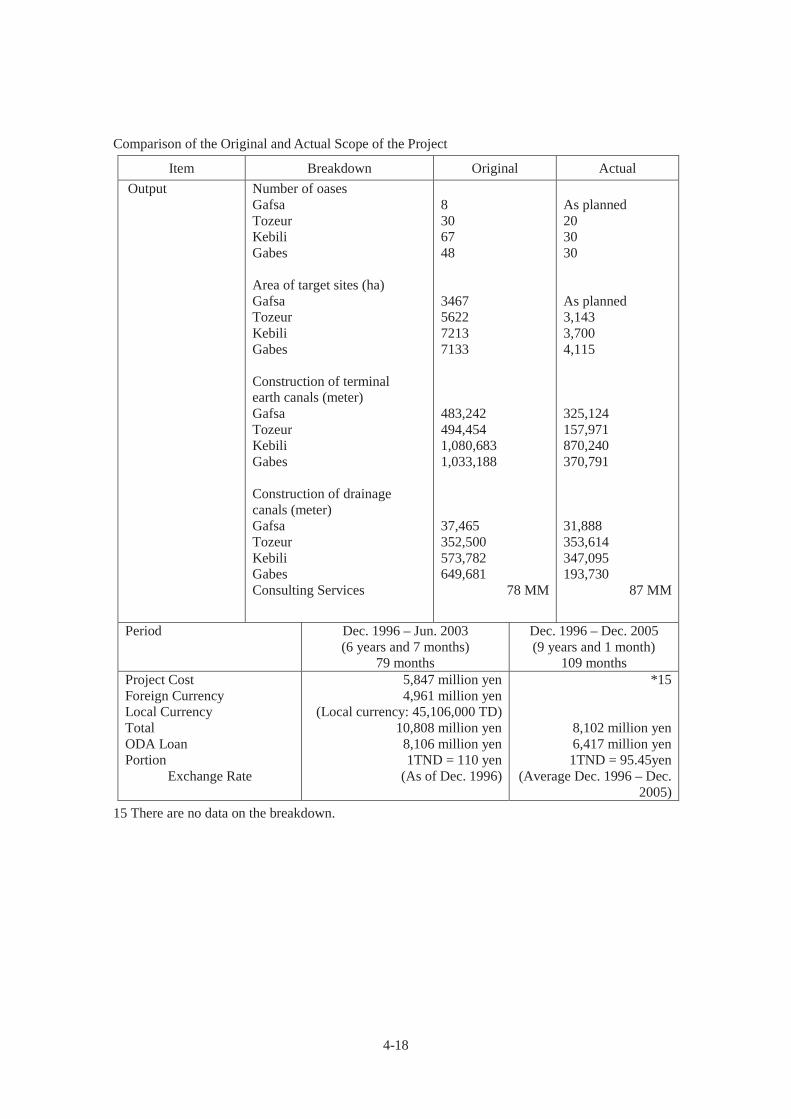
4-18
Comparison of the Original and Actual Scope of the Project
Item Breakdown Original Actual Output Number of oases
Gafsa Tozeur Kebili Gabes Area of target sites (ha) Gafsa Tozeur Kebili Gabes Construction of terminal earth canals (meter) Gafsa Tozeur Kebili Gabes Construction of drainage canals (meter) Gafsa Tozeur Kebili Gabes Consulting Services
8 30 67 48 3467 5622 7213 7133 483,242 494,454 1,080,683 1,033,188 37,465 352,500 573,782 649,681
78 MM
As planned 20 30 30 As planned 3,143 3,700 4,115 325,124 157,971 870,240 370,791 31,888 353,614 347,095 193,730
87 MM
Period Dec. 1996 – Jun. 2003 (6 years and 7 months)
79 months
Dec. 1996 – Dec. 2005 (9 years and 1 month)
109 months Project Cost Foreign Currency Local Currency Total ODA Loan Portion
Exchange Rate
5,847 million yen 4,961 million yen
(Local currency: 45,106,000 TD) 10,808 million yen
8,106 million yen 1TND = 110 yen
(As of Dec. 1996)
*15
8,102 million yen 6,417 million yen 1TND = 95.45yen
(Average Dec. 1996 – Dec. 2005)
15 There are no data on the breakdown.
5-1
Ex-Post Monitoring of Japanese ODA Loan Project
Tunisia
Barbara Irrigation Project
External Monitoring Consultant: Eiko Nakamoto / Toyo Tanaka, Nakamoto&Associates Co., Ltd.
1. Project Description
Project Location Irrigation Water Reservoir (Fernana)
1.1 Project Objective
The project’s objective is to promote improvement in agricultural productivity and increase of agricultural production by irrigating 2,070 ha of farmland (cf. about one-third of the area inside Tokyo’s Yamanote loop line (approx. 6,300 ha)) in Fernana and Hammam Bourguiba which are located in Barbara, Jendouba Governorate (population approx. 410,000), northwest of the capital city of Tunis, and thereby contribute to improvement of the farmers’ livelihoods and standard of living.
1.2 Outline of Loan Agreement
Approved Amount / Disbursed Amount 1,913 million yen/1,518 million yen
Loan Agreement Signing Date / Final
Disbursement Date
March 1998/ October 2004
Ex-post Evaluation 2006-2007
Executing Agency Ministry of Agriculture (MOA)
Main Contractor -
Main Consultant -
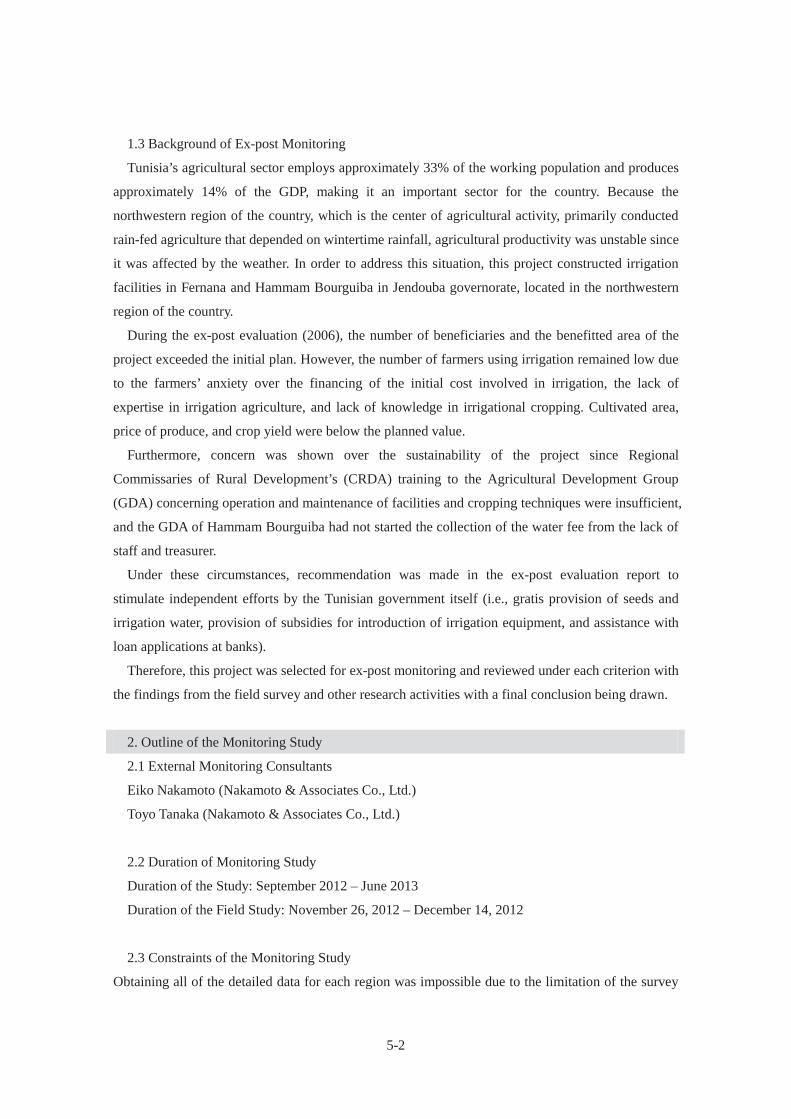
5-2
1.3 Background of Ex-post Monitoring
Tunisia’s agricultural sector employs approximately 33% of the working population and produces
approximately 14% of the GDP, making it an important sector for the country. Because the
northwestern region of the country, which is the center of agricultural activity, primarily conducted
rain-fed agriculture that depended on wintertime rainfall, agricultural productivity was unstable since
it was affected by the weather. In order to address this situation, this project constructed irrigation
facilities in Fernana and Hammam Bourguiba in Jendouba governorate, located in the northwestern
region of the country.
During the ex-post evaluation (2006), the number of beneficiaries and the benefitted area of the
project exceeded the initial plan. However, the number of farmers using irrigation remained low due
to the farmers’ anxiety over the financing of the initial cost involved in irrigation, the lack of
expertise in irrigation agriculture, and lack of knowledge in irrigational cropping. Cultivated area,
price of produce, and crop yield were below the planned value.
Furthermore, concern was shown over the sustainability of the project since Regional
Commissaries of Rural Development’s (CRDA) training to the Agricultural Development Group
(GDA) concerning operation and maintenance of facilities and cropping techniques were insufficient,
and the GDA of Hammam Bourguiba had not started the collection of the water fee from the lack of
staff and treasurer.
Under these circumstances, recommendation was made in the ex-post evaluation report to
stimulate independent efforts by the Tunisian government itself (i.e., gratis provision of seeds and
irrigation water, provision of subsidies for introduction of irrigation equipment, and assistance with
loan applications at banks).
Therefore, this project was selected for ex-post monitoring and reviewed under each criterion with
the findings from the field survey and other research activities with a final conclusion being drawn.
2. Outline of the Monitoring Study
2.1 External Monitoring Consultants
Eiko Nakamoto (Nakamoto & Associates Co., Ltd.)
Toyo Tanaka (Nakamoto & Associates Co., Ltd.)
2.2 Duration of Monitoring Study
Duration of the Study: September 2012 – June 2013
Duration of the Field Study: November 26, 2012 – December 14, 2012
2.3 Constraints of the Monitoring Study
Obtaining all of the detailed data for each region was impossible due to the limitation of the survey
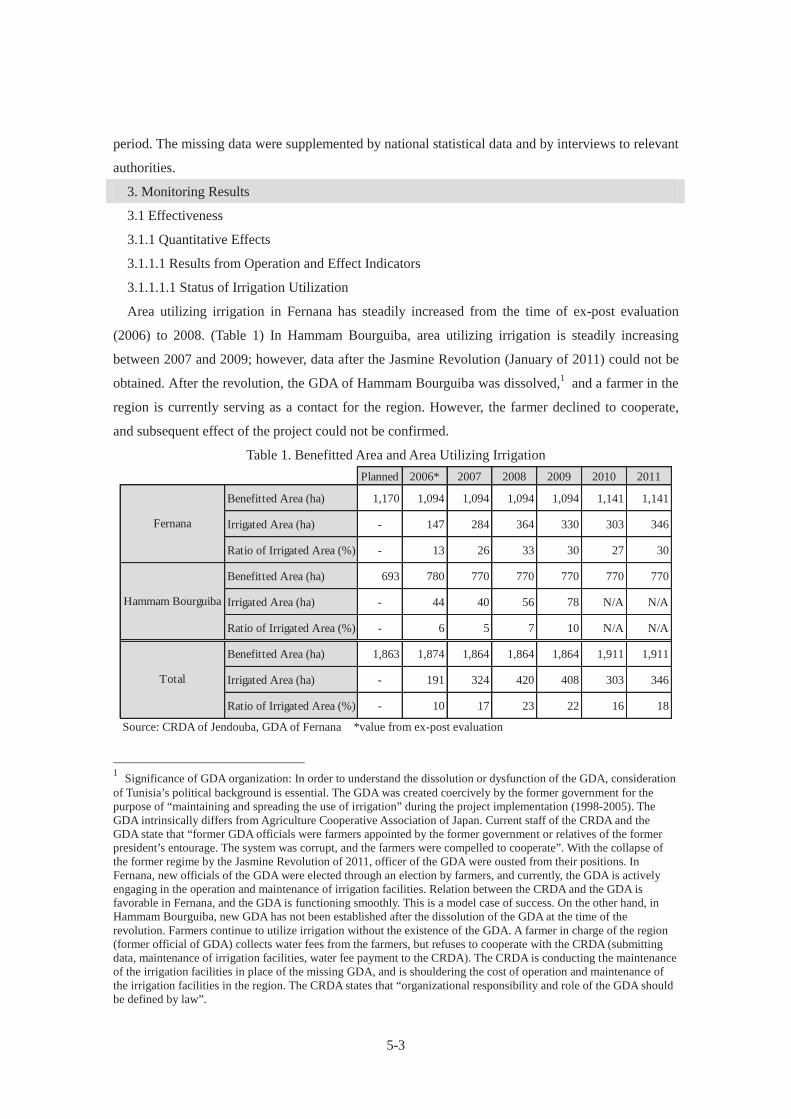
5-3
period. The missing data were supplemented by national statistical data and by interviews to relevant
authorities.
3. Monitoring Results
3.1 Effectiveness
3.1.1 Quantitative Effects
3.1.1.1 Results from Operation and Effect Indicators
3.1.1.1.1 Status of Irrigation Utilization
Area utilizing irrigation in Fernana has steadily increased from the time of ex-post evaluation
(2006) to 2008. (Table 1) In Hammam Bourguiba, area utilizing irrigation is steadily increasing
between 2007 and 2009; however, data after the Jasmine Revolution (January of 2011) could not be
obtained. After the revolution, the GDA of Hammam Bourguiba was dissolved,1 and a farmer in the
region is currently serving as a contact for the region. However, the farmer declined to cooperate,
and subsequent effect of the project could not be confirmed.
Table 1. Benefitted Area and Area Utilizing Irrigation
Source: CRDA of Jendouba, GDA of Fernana *value from ex-post evaluation
1 Significance of GDA organization: In order to understand the dissolution or dysfunction of the GDA, consideration of Tunisia’s political background is essential. The GDA was created coercively by the former government for the purpose of “maintaining and spreading the use of irrigation” during the project implementation (1998-2005). The GDA intrinsically differs from Agriculture Cooperative Association of Japan. Current staff of the CRDA and the GDA state that “former GDA officials were farmers appointed by the former government or relatives of the former president’s entourage. The system was corrupt, and the farmers were compelled to cooperate”. With the collapse of the former regime by the Jasmine Revolution of 2011, officer of the GDA were ousted from their positions. In Fernana, new officials of the GDA were elected through an election by farmers, and currently, the GDA is actively engaging in the operation and maintenance of irrigation facilities. Relation between the CRDA and the GDA is favorable in Fernana, and the GDA is functioning smoothly. This is a model case of success. On the other hand, in Hammam Bourguiba, new GDA has not been established after the dissolution of the GDA at the time of the revolution. Farmers continue to utilize irrigation without the existence of the GDA. A farmer in charge of the region (former official of GDA) collects water fees from the farmers, but refuses to cooperate with the CRDA (submitting data, maintenance of irrigation facilities, water fee payment to the CRDA). The CRDA is conducting the maintenance of the irrigation facilities in place of the missing GDA, and is shouldering the cost of operation and maintenance of the irrigation facilities in the region. The CRDA states that “organizational responsibility and role of the GDA should be defined by law”.
Planned 2006* 2007 2008 2009 2010 2011
Benefitted Area (ha) 1,170 1,094 1,094 1,094 1,094 1,141 1,141
Irrigated Area (ha) - 147 284 364 330 303 346
Ratio of Irrigated Area (%) - 13 26 33 30 27 30
Benefitted Area (ha) 693 780 770 770 770 770 770
Irrigated Area (ha) - 44 40 56 78 N/A N/A
Ratio of Irrigated Area (%) - 6 5 7 10 N/A N/A
Benefitted Area (ha) 1,863 1,874 1,864 1,864 1,864 1,911 1,911
Irrigated Area (ha) - 191 324 420 408 303 346
Ratio of Irrigated Area (%) - 10 17 23 22 16 18
Fernana
Hammam Bourguiba
Total
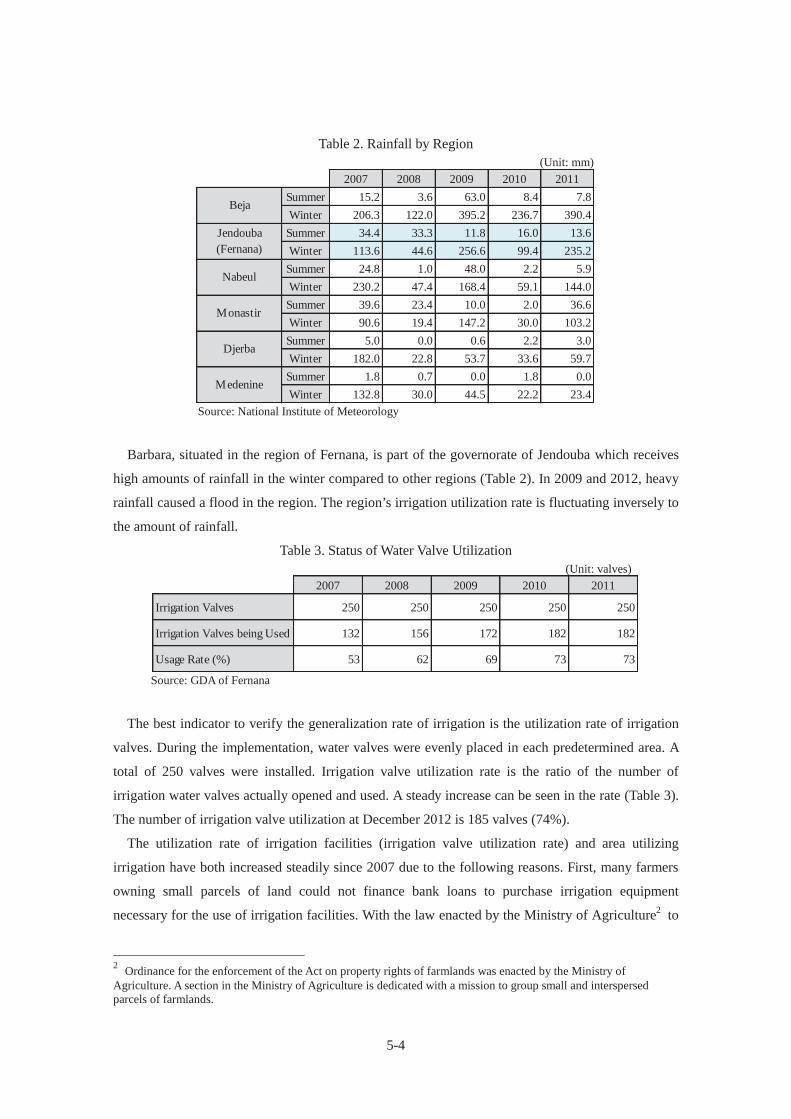
5-4
Table 2. Rainfall by Region (Unit: mm)
Source: National Institute of Meteorology
Barbara, situated in the region of Fernana, is part of the governorate of Jendouba which receives
high amounts of rainfall in the winter compared to other regions (Table 2). In 2009 and 2012, heavy
rainfall caused a flood in the region. The region’s irrigation utilization rate is fluctuating inversely to
the amount of rainfall.
Table 3. Status of Water Valve Utilization (Unit: valves)
Source: GDA of Fernana
The best indicator to verify the generalization rate of irrigation is the utilization rate of irrigation
valves. During the implementation, water valves were evenly placed in each predetermined area. A
total of 250 valves were installed. Irrigation valve utilization rate is the ratio of the number of
irrigation water valves actually opened and used. A steady increase can be seen in the rate (Table 3).
The number of irrigation valve utilization at December 2012 is 185 valves (74%).
The utilization rate of irrigation facilities (irrigation valve utilization rate) and area utilizing
irrigation have both increased steadily since 2007 due to the following reasons. First, many farmers
owning small parcels of land could not finance bank loans to purchase irrigation equipment
necessary for the use of irrigation facilities. With the law enacted by the Ministry of Agriculture2 to
2 Ordinance for the enforcement of the Act on property rights of farmlands was enacted by the Ministry of Agriculture. A section in the Ministry of Agriculture is dedicated with a mission to group small and interspersed parcels of farmlands.
2007 2008 2009 2010 2011Summer 15.2 3.6 63.0 8.4 7.8Winter 206.3 122.0 395.2 236.7 390.4Summer 34.4 33.3 11.8 16.0 13.6Winter 113.6 44.6 256.6 99.4 235.2Summer 24.8 1.0 48.0 2.2 5.9Winter 230.2 47.4 168.4 59.1 144.0Summer 39.6 23.4 10.0 2.0 36.6Winter 90.6 19.4 147.2 30.0 103.2Summer 5.0 0.0 0.6 2.2 3.0Winter 182.0 22.8 53.7 33.6 59.7Summer 1.8 0.7 0.0 1.8 0.0Winter 132.8 30.0 44.5 22.2 23.4
Medenine
Beja
Jendouba(Fernana)
Nabeul
Monastir
Djerba
2007 2008 2009 2010 2011
Irrigation Valves 250 250 250 250 250
Irrigation Valves being Used 132 156 172 182 182
Usage Rate (%) 53 62 69 73 73
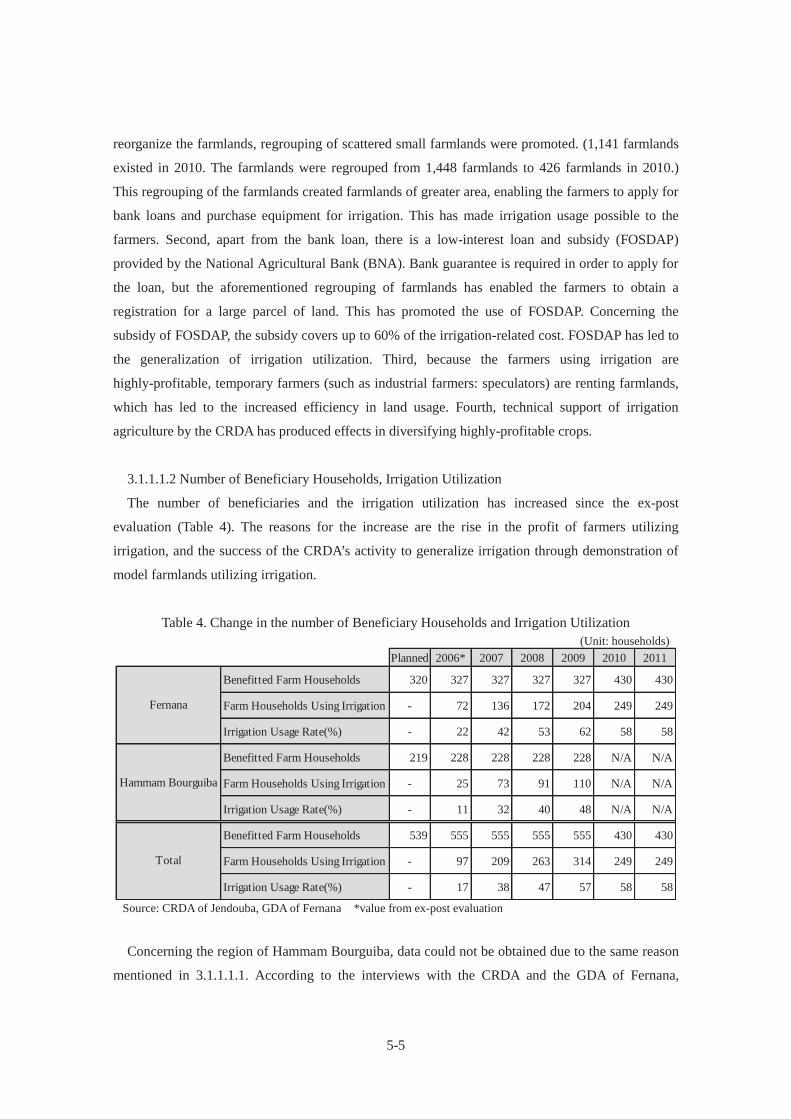
5-5
reorganize the farmlands, regrouping of scattered small farmlands were promoted. (1,141 farmlands
existed in 2010. The farmlands were regrouped from 1,448 farmlands to 426 farmlands in 2010.)
This regrouping of the farmlands created farmlands of greater area, enabling the farmers to apply for
bank loans and purchase equipment for irrigation. This has made irrigation usage possible to the
farmers. Second, apart from the bank loan, there is a low-interest loan and subsidy (FOSDAP)
provided by the National Agricultural Bank (BNA). Bank guarantee is required in order to apply for
the loan, but the aforementioned regrouping of farmlands has enabled the farmers to obtain a
registration for a large parcel of land. This has promoted the use of FOSDAP. Concerning the
subsidy of FOSDAP, the subsidy covers up to 60% of the irrigation-related cost. FOSDAP has led to
the generalization of irrigation utilization. Third, because the farmers using irrigation are
highly-profitable, temporary farmers (such as industrial farmers: speculators) are renting farmlands,
which has led to the increased efficiency in land usage. Fourth, technical support of irrigation
agriculture by the CRDA has produced effects in diversifying highly-profitable crops.
3.1.1.1.2 Number of Beneficiary Households, Irrigation Utilization
The number of beneficiaries and the irrigation utilization has increased since the ex-post
evaluation (Table 4). The reasons for the increase are the rise in the profit of farmers utilizing
irrigation, and the success of the CRDA’s activity to generalize irrigation through demonstration of
model farmlands utilizing irrigation.
Table 4. Change in the number of Beneficiary Households and Irrigation Utilization (Unit: households)
Source: CRDA of Jendouba, GDA of Fernana *value from ex-post evaluation
Concerning the region of Hammam Bourguiba, data could not be obtained due to the same reason
mentioned in 3.1.1.1.1. According to the interviews with the CRDA and the GDA of Fernana,
Planned 2006* 2007 2008 2009 2010 2011
Benefitted Farm Households 320 327 327 327 327 430 430
Farm Households Using Irrigation - 72 136 172 204 249 249
Irrigation Usage Rate(%) - 22 42 53 62 58 58
Benefitted Farm Households 219 228 228 228 228 N/A N/A
Farm Households Using Irrigation - 25 73 91 110 N/A N/A
Irrigation Usage Rate(%) - 11 32 40 48 N/A N/A
Benefitted Farm Households 539 555 555 555 555 430 430
Farm Households Using Irrigation - 97 209 263 314 249 249
Irrigation Usage Rate(%) - 17 38 47 57 58 58
Fernana
Hammam Bourguiba
Total

5-6
incomes of farmers in Fernana are higher than the neighboring regions due to the utilization of
irrigation. Farmers from surrounding regions and corporate farmers are increasingly renting
farmlands temporarily in Fernana. In 2010, irrigated area was expanded and new farmlands were
created upon request from the farmers of surrounding regions.
These farmers from surrounding regions and speculators, renting the land for irrigation agriculture,
are relatively small in scale, or temporary farmers. Since the data for beneficiary farm households
after 2010 includes farmers of different scale and temporary farmers, the number of farmers utilizing
irrigation and utilization rate cannot be compared to those before 2010. Therefore, irrigation valve
utilization rate as indicated in Table 3 can be said to be the most effective indicator in representing
the generalization rate of irrigation utilization.
3.1.1.1.3 Cultivated Area and Yield per Unit Area
Cultivated area was steadily increasing until 2008; however, due to heavy rainfall and flood in
2009 and 2011, the area has decreased (Table 5). There are no changes in the major crops since the
time of ex-post evaluation, but tobacco production has decreased and highly-profitable crops such as
potatoes, watermelons and green pepper have increased. Cultivated area for potatoes and
watermelons exceed the initial planned value.
Table 5. Cultivated Area of Major Crops in Fernana (Unit: ha)
Source: GDA of Fernana
In the ex-post evaluation, cultivated area was shown as a total of Fernana and Hammam
Bourguiba. As mentioned before, data for Hammam Bourguiba after 2010 could not be obtained, and
therefore, comparison and analysis could not be performed. Instead, analysis will be done on the data
for 2007 obtained by this study. Hereafter, for other indicators, the same will be done in cases which
the data was not obtained at the time of ex-post evaluation, or the reliability of the data presented in
the ex-post evaluation is questionable. In Fernana, cultivated areas of highly-profitable crops such as
2007 2008 2009 2010 2011
Wheat N/A 48.00 N/A 19.00 N/A
Oat (Fodder) N/A 0.50 4.64 8.30 11.02
Barley N/A N/A N/A N/A N/A
Sugar Beet N/A N/A N/A N/A N/A
Tobacco 27.00 9.35 4.21 7.95 5.50
Potato 75.00 100.00 97.56 95.75 174.21
Watermelon 44.00 37.40 14.50 40.33 33.55
Other 86.00 192.20 138.39 90.55 98.17
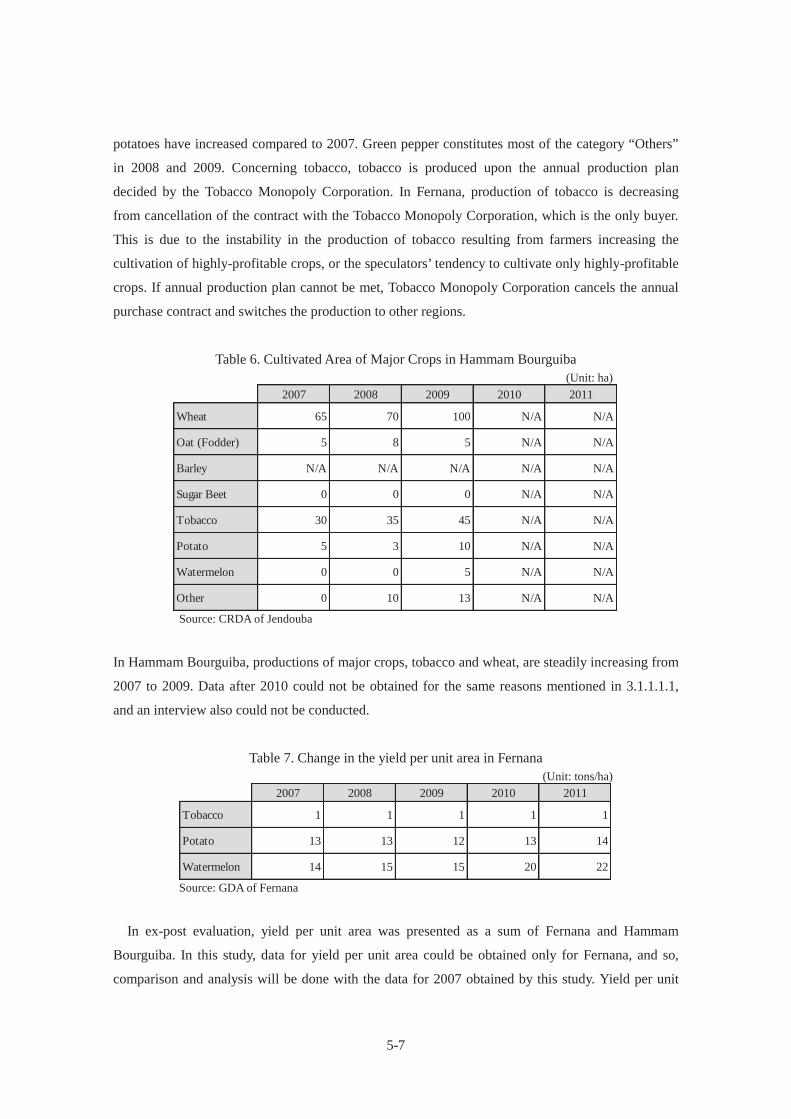
5-7
potatoes have increased compared to 2007. Green pepper constitutes most of the category “Others”
in 2008 and 2009. Concerning tobacco, tobacco is produced upon the annual production plan
decided by the Tobacco Monopoly Corporation. In Fernana, production of tobacco is decreasing
from cancellation of the contract with the Tobacco Monopoly Corporation, which is the only buyer.
This is due to the instability in the production of tobacco resulting from farmers increasing the
cultivation of highly-profitable crops, or the speculators’ tendency to cultivate only highly-profitable
crops. If annual production plan cannot be met, Tobacco Monopoly Corporation cancels the annual
purchase contract and switches the production to other regions.
Table 6. Cultivated Area of Major Crops in Hammam Bourguiba (Unit: ha)
Source: CRDA of Jendouba
In Hammam Bourguiba, productions of major crops, tobacco and wheat, are steadily increasing from
2007 to 2009. Data after 2010 could not be obtained for the same reasons mentioned in 3.1.1.1.1,
and an interview also could not be conducted.
Table 7. Change in the yield per unit area in Fernana (Unit: tons/ha)
Source: GDA of Fernana
In ex-post evaluation, yield per unit area was presented as a sum of Fernana and Hammam
Bourguiba. In this study, data for yield per unit area could be obtained only for Fernana, and so,
comparison and analysis will be done with the data for 2007 obtained by this study. Yield per unit
2007 2008 2009 2010 2011
Wheat 65 70 100 N/A N/A
Oat (Fodder) 5 8 5 N/A N/A
Barley N/A N/A N/A N/A N/A
Sugar Beet 0 0 0 N/A N/A
Tobacco 30 35 45 N/A N/A
Potato 5 3 10 N/A N/A
Watermelon 0 0 5 N/A N/A
Other 0 10 13 N/A N/A
2007 2008 2009 2010 2011
Tobacco 1 1 1 1 1
Potato 13 13 12 13 14
Watermelon 14 15 15 20 22
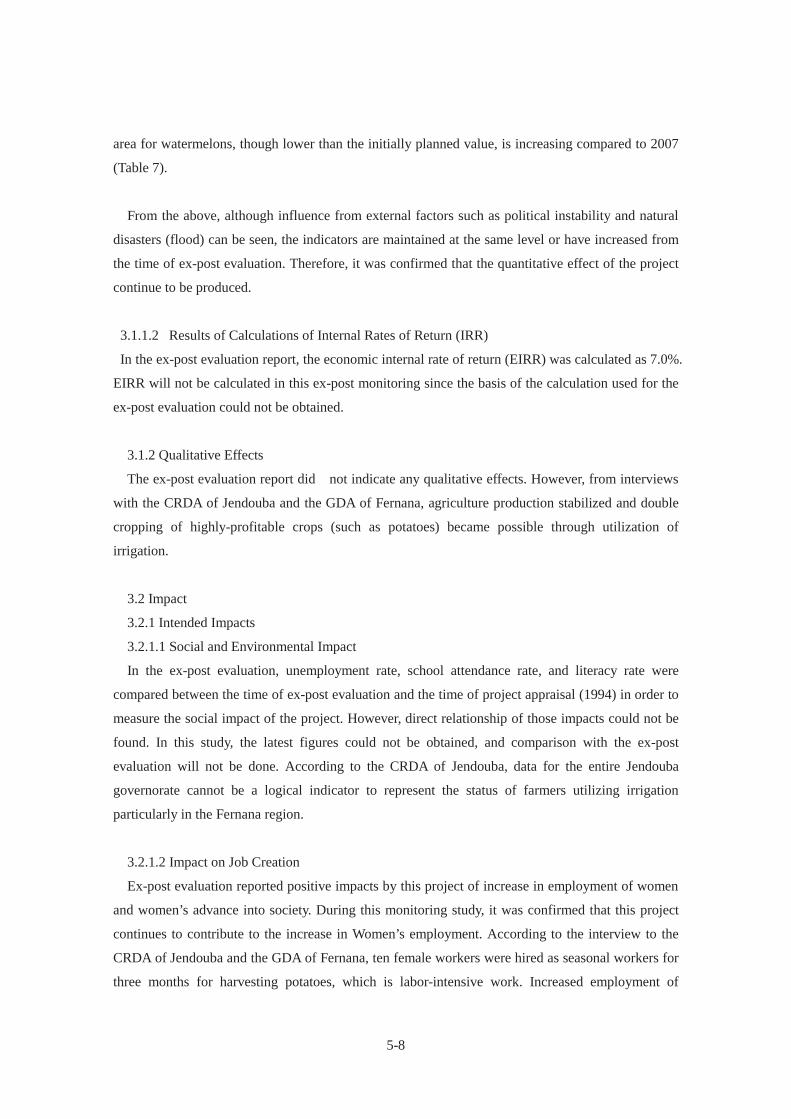
5-8
area for watermelons, though lower than the initially planned value, is increasing compared to 2007
(Table 7).
From the above, although influence from external factors such as political instability and natural
disasters (flood) can be seen, the indicators are maintained at the same level or have increased from
the time of ex-post evaluation. Therefore, it was confirmed that the quantitative effect of the project
continue to be produced.
3.1.1.2 Results of Calculations of Internal Rates of Return (IRR)
In the ex-post evaluation report, the economic internal rate of return (EIRR) was calculated as 7.0%.
EIRR will not be calculated in this ex-post monitoring since the basis of the calculation used for the
ex-post evaluation could not be obtained.
3.1.2 Qualitative Effects
The ex-post evaluation report did not indicate any qualitative effects. However, from interviews
with the CRDA of Jendouba and the GDA of Fernana, agriculture production stabilized and double
cropping of highly-profitable crops (such as potatoes) became possible through utilization of
irrigation.
3.2 Impact
3.2.1 Intended Impacts
3.2.1.1 Social and Environmental Impact
In the ex-post evaluation, unemployment rate, school attendance rate, and literacy rate were
compared between the time of ex-post evaluation and the time of project appraisal (1994) in order to
measure the social impact of the project. However, direct relationship of those impacts could not be
found. In this study, the latest figures could not be obtained, and comparison with the ex-post
evaluation will not be done. According to the CRDA of Jendouba, data for the entire Jendouba
governorate cannot be a logical indicator to represent the status of farmers utilizing irrigation
particularly in the Fernana region.
3.2.1.2 Impact on Job Creation
Ex-post evaluation reported positive impacts by this project of increase in employment of women
and women’s advance into society. During this monitoring study, it was confirmed that this project
continues to contribute to the increase in Women’s employment. According to the interview to the
CRDA of Jendouba and the GDA of Fernana, ten female workers were hired as seasonal workers for
three months for harvesting potatoes, which is labor-intensive work. Increased employment of
5-9
women has led to rise in women’s income. Younger women save their money for marriage and
independence, and married women actively contribute to their household.
3.2.1.3 Annual Income from Farming
Ex-post evaluation mentioned increase in the annual agricultural income per household. In this
study, statistical data concerning rural household income could not be obtained, however, according
to the interviews with the CRDA and the GDA of Fernana, the income is increasing. According to
interviews with the GDA of Fernana and farmers, agricultural production stabilized from irrigation
as mentioned in 3.1.2, and double cropping of highly-profitable crops (such as potatoes) have led to
an increase in income. More farmers are building extensions to their houses or purchasing
automobiles. During the site visit to Fernana, relatively new houses and new cars could be seen. Also,
increase in income enabled the farmers to send their children to school, and, further, to college.
However, neither the CRDA nor the GDA possessed specific data on household income from
farming, and so, the information could not be obtained.
3.2.1.4 Asset Ownership of Rural Households
Increase in the number of farmers possessing various assets, such as automobiles or mobile
phones, was indicated in the ex-post evaluation. During this monitoring study, newly built houses
and farmers owning automobiles were verified from the site visit.
3.2.2 Other Impacts
3.2.2.1 Organizational Impact
Improvement in the relations between the CRDA and the GDA is a new impact found by this
monitoring study. Before the revolution, the GDA were managed by farmers appointed by the former
government, and there were no substantial participation of other farmers to the GDA. After the
revolution, the GDA is managed by officials elected by an election. All farmers are actively
participating in the GDA activities, and communication with the CRDA has improved. By this
increase in communication through irrigational activities and generalization efforts, relation between
the CRDA and the GDA has been improved.
3.2.2.2 Resettlement and Land Acquisition
There continues to be no resettlement nor land acquisition from the time of ex-post evaluation.
3.2.2.3 Salt Damage
There continues to be no salt damage from the time of ex-post evaluation.

5-10
From the above, the impact of improvement in the lives of farmers in Fernana, reported in the
ex-post evaluation, continues to take effect.
3.3 Sustainability
3.3.1 Structural Aspects of Operation and Maintenance
3.3.1.1 CRDA
There is no change in the organizational structure of operation and maintenance from the time of
the ex-post evaluation. Staffs from Irrigation Development Section and the Irrigation Facilities
Operation and Maintenance Section of the Water Supply Rural Facilities Department, in addition to
irrigation support staff from the Irrigation Generalization Unit (CTV) perform the operation and
maintenance.
10 staffs work for Irrigation Development Section and the Irrigation Facilities Operation and
Maintenance Section of the CRDA, an increase of 4 staffs from the time of ex-post evaluation. The
reason for the increase is the necessity to implement operation and maintenance by the CRDA in
place of the GDA of Hammam Bourguiba, which was dissolved after the revolution. Out of the four
staffs, three are responsible for operation and maintenance of pumping stations, and one is in charge
of network maintenance. In Fernana, operation and maintenance of the pumping station is carried out
by total of six staffs, three shifts with two staff in each shift. There is no problem with the
organizational aspect of operation and maintenance.
The CRDA has hired another three staffs to further promote irrigation in the Fernana region.
Currently, a total of 7 staffs (3 technicians, 3 workers, and 1 security guard) work for the CTV of
Fernana. Main activities are assistance with applications for subsidies as financial support, and
assistance with loan application, and drafting contracts.
In the ex-post evaluation, delay in the organization assistance of the GDA, resulting from
insufficient staff of the CTV, was indicated. The CRDA was aiming to establish 10 GDAs. However,
at the time of this monitoring study, the number of GDA has decreased from two GDAs to one. After
the dissolution of the GDA of Hammam Bourguiba, the CTV for Hammam Bourguiba region has not
been organized; the prospect of resumption of Hammam Bourguiba GDA is unclear.
3.3.1.2 GDA
At the time of the ex-post evaluation, the GDA of Fernana was composed of one president, one
treasurer, four clerks, one engineer, and two security guards. The GDA of Hammam Bourguiba was
expected to have the same structure, but treasurer, clerk, and technician had not yet been hired.
Currently, there is only one GDA in Fernana. The GDA of Fernana consists of one president, one
treasurer, three engineers, and four officials. The number of staff is the same as the time of ex-post
evaluation, but the names of the positions have changed as have the substantial operation and
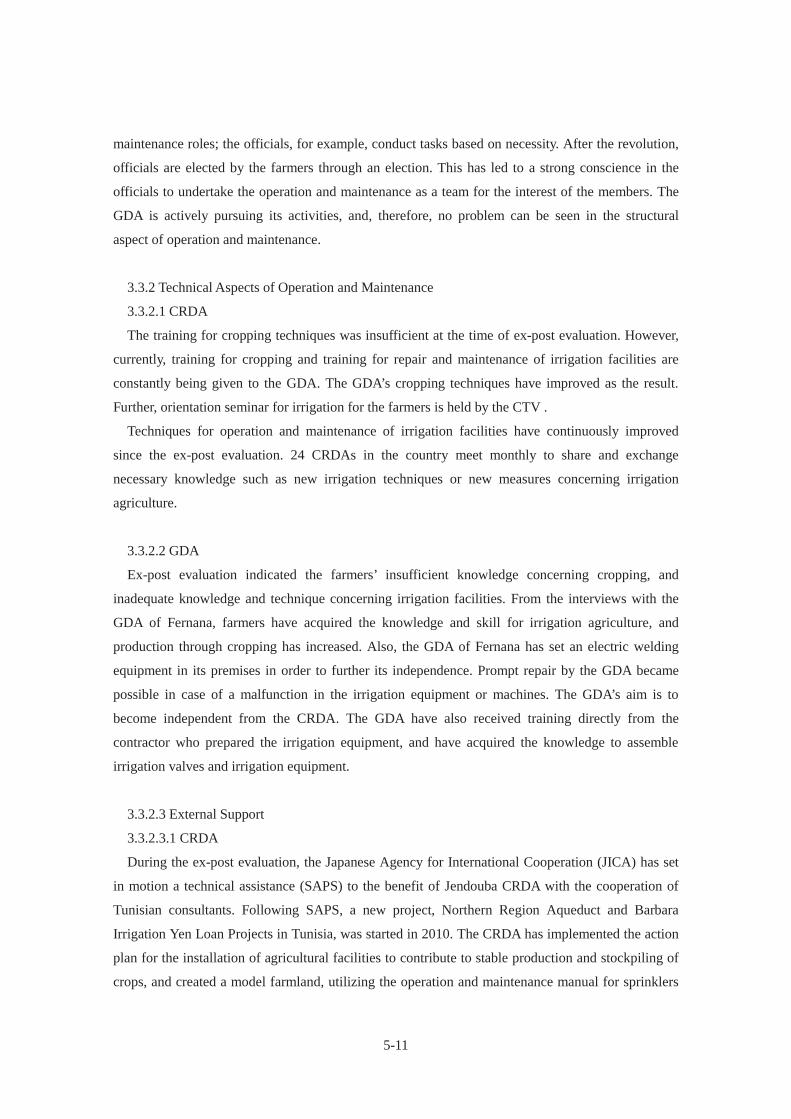
5-11
maintenance roles; the officials, for example, conduct tasks based on necessity. After the revolution,
officials are elected by the farmers through an election. This has led to a strong conscience in the
officials to undertake the operation and maintenance as a team for the interest of the members. The
GDA is actively pursuing its activities, and, therefore, no problem can be seen in the structural
aspect of operation and maintenance.
3.3.2 Technical Aspects of Operation and Maintenance
3.3.2.1 CRDA
The training for cropping techniques was insufficient at the time of ex-post evaluation. However,
currently, training for cropping and training for repair and maintenance of irrigation facilities are
constantly being given to the GDA. The GDA’s cropping techniques have improved as the result.
Further, orientation seminar for irrigation for the farmers is held by the CTV .
Techniques for operation and maintenance of irrigation facilities have continuously improved
since the ex-post evaluation. 24 CRDAs in the country meet monthly to share and exchange
necessary knowledge such as new irrigation techniques or new measures concerning irrigation
agriculture.
3.3.2.2 GDA
Ex-post evaluation indicated the farmers’ insufficient knowledge concerning cropping, and
inadequate knowledge and technique concerning irrigation facilities. From the interviews with the
GDA of Fernana, farmers have acquired the knowledge and skill for irrigation agriculture, and
production through cropping has increased. Also, the GDA of Fernana has set an electric welding
equipment in its premises in order to further its independence. Prompt repair by the GDA became
possible in case of a malfunction in the irrigation equipment or machines. The GDA’s aim is to
become independent from the CRDA. The GDA have also received training directly from the
contractor who prepared the irrigation equipment, and have acquired the knowledge to assemble
irrigation valves and irrigation equipment.
3.3.2.3 External Support
3.3.2.3.1 CRDA
During the ex-post evaluation, the Japanese Agency for International Cooperation (JICA) has set
in motion a technical assistance (SAPS) to the benefit of Jendouba CRDA with the cooperation of
Tunisian consultants. Following SAPS, a new project, Northern Region Aqueduct and Barbara
Irrigation Yen Loan Projects in Tunisia, was started in 2010. The CRDA has implemented the action
plan for the installation of agricultural facilities to contribute to stable production and stockpiling of
crops, and created a model farmland, utilizing the operation and maintenance manual for sprinklers
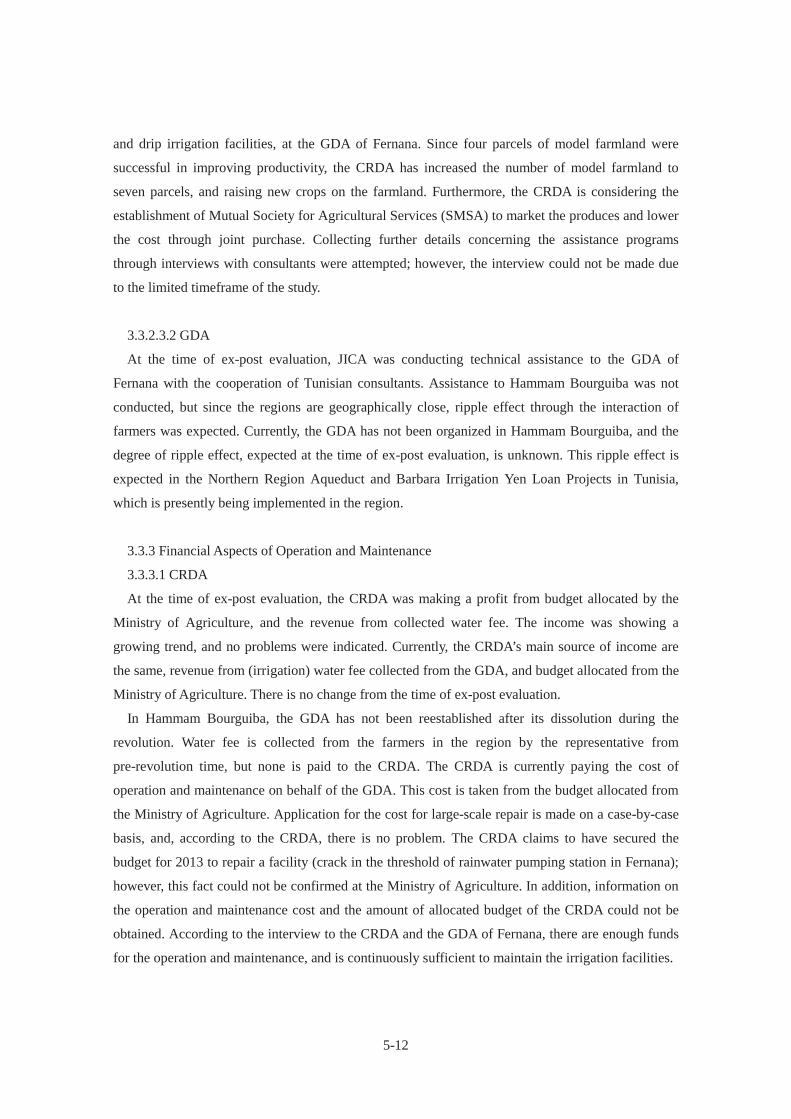
5-12
and drip irrigation facilities, at the GDA of Fernana. Since four parcels of model farmland were
successful in improving productivity, the CRDA has increased the number of model farmland to
seven parcels, and raising new crops on the farmland. Furthermore, the CRDA is considering the
establishment of Mutual Society for Agricultural Services (SMSA) to market the produces and lower
the cost through joint purchase. Collecting further details concerning the assistance programs
through interviews with consultants were attempted; however, the interview could not be made due
to the limited timeframe of the study.
3.3.2.3.2 GDA
At the time of ex-post evaluation, JICA was conducting technical assistance to the GDA of
Fernana with the cooperation of Tunisian consultants. Assistance to Hammam Bourguiba was not
conducted, but since the regions are geographically close, ripple effect through the interaction of
farmers was expected. Currently, the GDA has not been organized in Hammam Bourguiba, and the
degree of ripple effect, expected at the time of ex-post evaluation, is unknown. This ripple effect is
expected in the Northern Region Aqueduct and Barbara Irrigation Yen Loan Projects in Tunisia,
which is presently being implemented in the region.
3.3.3 Financial Aspects of Operation and Maintenance
3.3.3.1 CRDA
At the time of ex-post evaluation, the CRDA was making a profit from budget allocated by the
Ministry of Agriculture, and the revenue from collected water fee. The income was showing a
growing trend, and no problems were indicated. Currently, the CRDA’s main source of income are
the same, revenue from (irrigation) water fee collected from the GDA, and budget allocated from the
Ministry of Agriculture. There is no change from the time of ex-post evaluation.
In Hammam Bourguiba, the GDA has not been reestablished after its dissolution during the
revolution. Water fee is collected from the farmers in the region by the representative from
pre-revolution time, but none is paid to the CRDA. The CRDA is currently paying the cost of
operation and maintenance on behalf of the GDA. This cost is taken from the budget allocated from
the Ministry of Agriculture. Application for the cost for large-scale repair is made on a case-by-case
basis, and, according to the CRDA, there is no problem. The CRDA claims to have secured the
budget for 2013 to repair a facility (crack in the threshold of rainwater pumping station in Fernana);
however, this fact could not be confirmed at the Ministry of Agriculture. In addition, information on
the operation and maintenance cost and the amount of allocated budget of the CRDA could not be
obtained. According to the interview to the CRDA and the GDA of Fernana, there are enough funds
for the operation and maintenance, and is continuously sufficient to maintain the irrigation facilities.
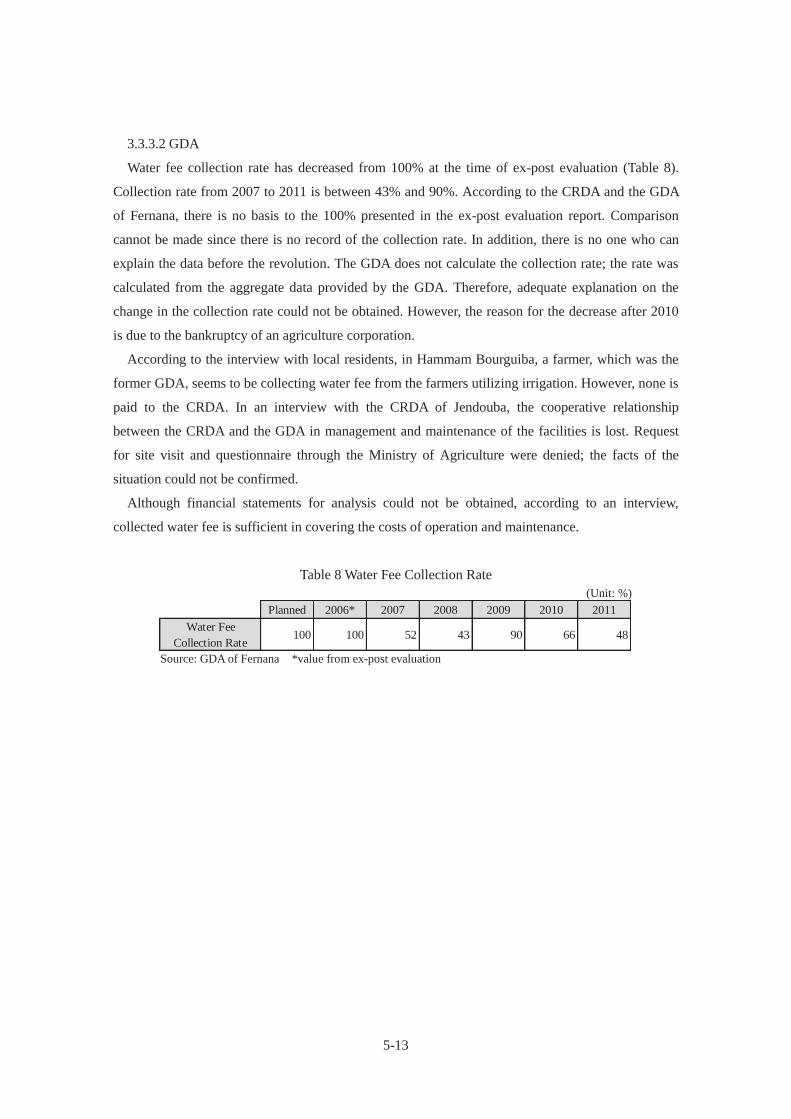
5-13
3.3.3.2 GDA
Water fee collection rate has decreased from 100% at the time of ex-post evaluation (Table 8).
Collection rate from 2007 to 2011 is between 43% and 90%. According to the CRDA and the GDA
of Fernana, there is no basis to the 100% presented in the ex-post evaluation report. Comparison
cannot be made since there is no record of the collection rate. In addition, there is no one who can
explain the data before the revolution. The GDA does not calculate the collection rate; the rate was
calculated from the aggregate data provided by the GDA. Therefore, adequate explanation on the
change in the collection rate could not be obtained. However, the reason for the decrease after 2010
is due to the bankruptcy of an agriculture corporation.
According to the interview with local residents, in Hammam Bourguiba, a farmer, which was the
former GDA, seems to be collecting water fee from the farmers utilizing irrigation. However, none is
paid to the CRDA. In an interview with the CRDA of Jendouba, the cooperative relationship
between the CRDA and the GDA in management and maintenance of the facilities is lost. Request
for site visit and questionnaire through the Ministry of Agriculture were denied; the facts of the
situation could not be confirmed.
Although financial statements for analysis could not be obtained, according to an interview,
collected water fee is sufficient in covering the costs of operation and maintenance.
Table 8 Water Fee Collection Rate (Unit: %)
Source: GDA of Fernana *value from ex-post evaluation
Planned 2006* 2007 2008 2009 2010 2011Water Fee
Collection Rate100 100 52 43 90 66 48
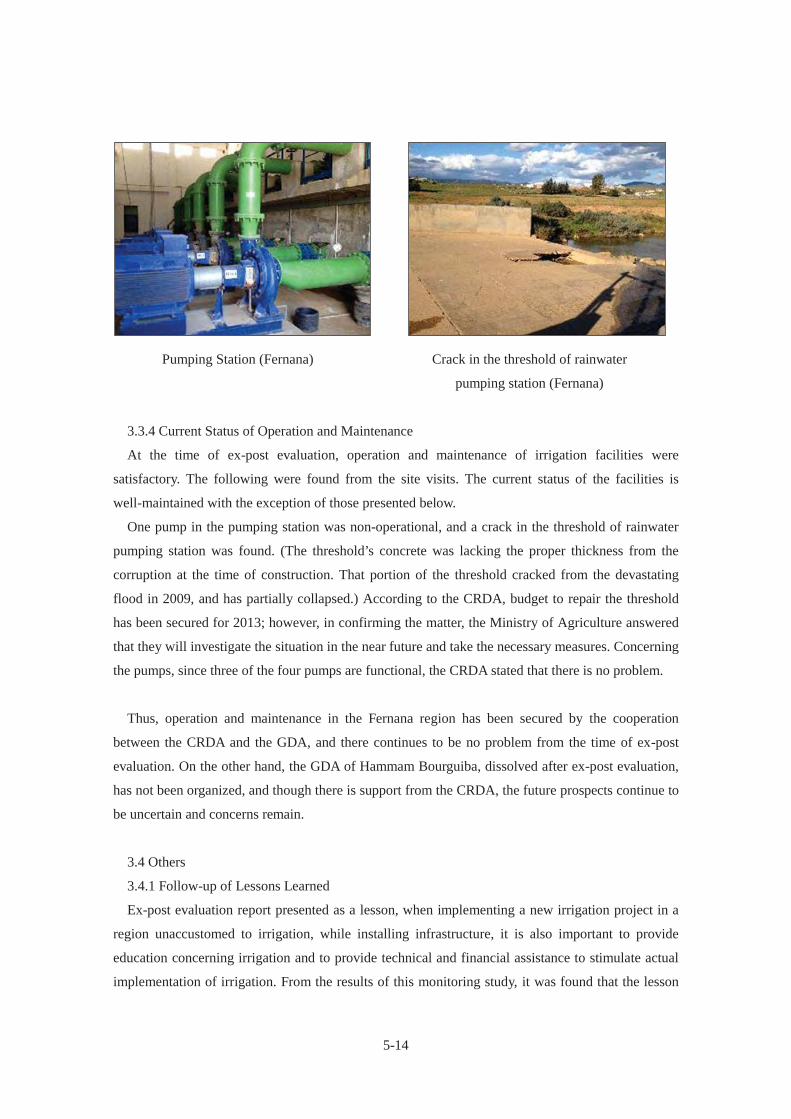
5-14
Pumping Station (Fernana) Crack in the threshold of rainwater
pumping station (Fernana)
3.3.4 Current Status of Operation and Maintenance
At the time of ex-post evaluation, operation and maintenance of irrigation facilities were
satisfactory. The following were found from the site visits. The current status of the facilities is
well-maintained with the exception of those presented below.
One pump in the pumping station was non-operational, and a crack in the threshold of rainwater
pumping station was found. (The threshold’s concrete was lacking the proper thickness from the
corruption at the time of construction. That portion of the threshold cracked from the devastating
flood in 2009, and has partially collapsed.) According to the CRDA, budget to repair the threshold
has been secured for 2013; however, in confirming the matter, the Ministry of Agriculture answered
that they will investigate the situation in the near future and take the necessary measures. Concerning
the pumps, since three of the four pumps are functional, the CRDA stated that there is no problem.
Thus, operation and maintenance in the Fernana region has been secured by the cooperation
between the CRDA and the GDA, and there continues to be no problem from the time of ex-post
evaluation. On the other hand, the GDA of Hammam Bourguiba, dissolved after ex-post evaluation,
has not been organized, and though there is support from the CRDA, the future prospects continue to
be uncertain and concerns remain.
3.4 Others
3.4.1 Follow-up of Lessons Learned
Ex-post evaluation report presented as a lesson, when implementing a new irrigation project in a
region unaccustomed to irrigation, while installing infrastructure, it is also important to provide
education concerning irrigation and to provide technical and financial assistance to stimulate actual
implementation of irrigation. From the results of this monitoring study, it was found that the lesson
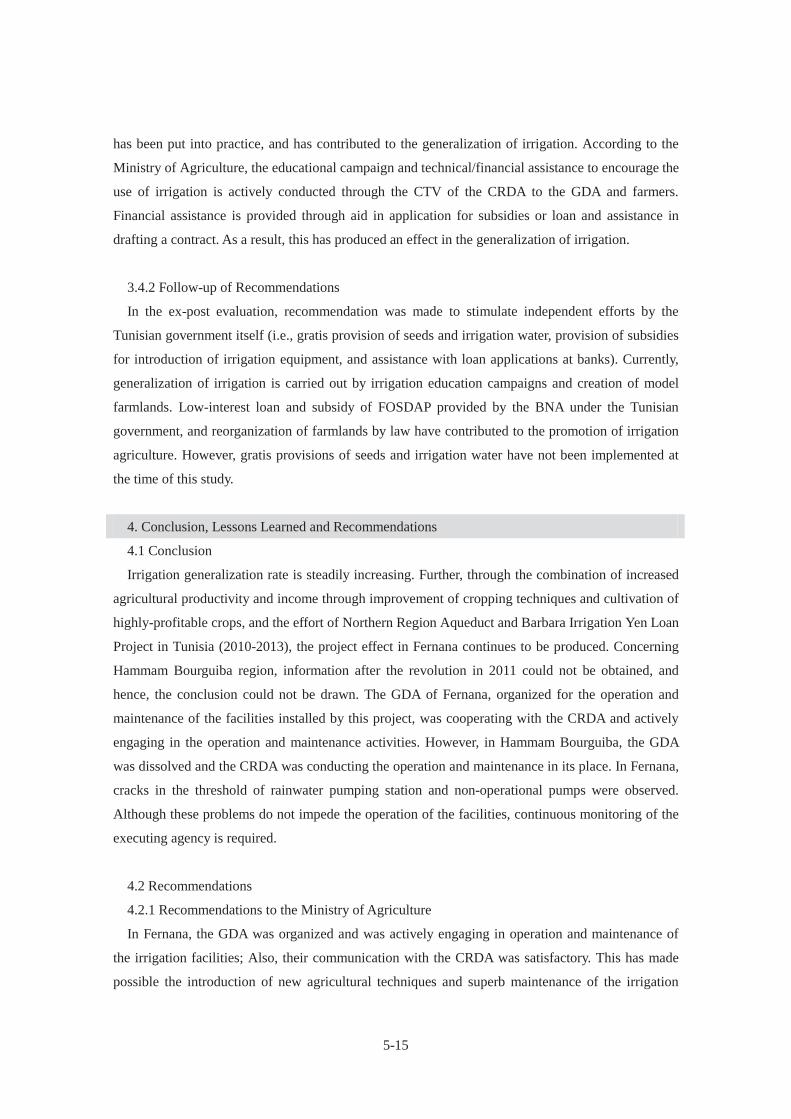
5-15
has been put into practice, and has contributed to the generalization of irrigation. According to the
Ministry of Agriculture, the educational campaign and technical/financial assistance to encourage the
use of irrigation is actively conducted through the CTV of the CRDA to the GDA and farmers.
Financial assistance is provided through aid in application for subsidies or loan and assistance in
drafting a contract. As a result, this has produced an effect in the generalization of irrigation.
3.4.2 Follow-up of Recommendations
In the ex-post evaluation, recommendation was made to stimulate independent efforts by the
Tunisian government itself (i.e., gratis provision of seeds and irrigation water, provision of subsidies
for introduction of irrigation equipment, and assistance with loan applications at banks). Currently,
generalization of irrigation is carried out by irrigation education campaigns and creation of model
farmlands. Low-interest loan and subsidy of FOSDAP provided by the BNA under the Tunisian
government, and reorganization of farmlands by law have contributed to the promotion of irrigation
agriculture. However, gratis provisions of seeds and irrigation water have not been implemented at
the time of this study.
4. Conclusion, Lessons Learned and Recommendations
4.1 Conclusion
Irrigation generalization rate is steadily increasing. Further, through the combination of increased
agricultural productivity and income through improvement of cropping techniques and cultivation of
highly-profitable crops, and the effort of Northern Region Aqueduct and Barbara Irrigation Yen Loan
Project in Tunisia (2010-2013), the project effect in Fernana continues to be produced. Concerning
Hammam Bourguiba region, information after the revolution in 2011 could not be obtained, and
hence, the conclusion could not be drawn. The GDA of Fernana, organized for the operation and
maintenance of the facilities installed by this project, was cooperating with the CRDA and actively
engaging in the operation and maintenance activities. However, in Hammam Bourguiba, the GDA
was dissolved and the CRDA was conducting the operation and maintenance in its place. In Fernana,
cracks in the threshold of rainwater pumping station and non-operational pumps were observed.
Although these problems do not impede the operation of the facilities, continuous monitoring of the
executing agency is required.
4.2 Recommendations
4.2.1 Recommendations to the Ministry of Agriculture
In Fernana, the GDA was organized and was actively engaging in operation and maintenance of
the irrigation facilities; Also, their communication with the CRDA was satisfactory. This has made
possible the introduction of new agricultural techniques and superb maintenance of the irrigation
5-16
facilities possible. In order to sustain the irrigational equipment installed by this project and continue
to produce the expected effects, establishment of a new organization to assume the responsibility of
former GDA in Hammam Bourguiba is necessary. To do so, , careful consideration of cultural and
political background is essential. In addition, monitoring and supervision should be continued to
ensume the repair of the crack in the threshold of rainwater pumping station and the non-operational
pump (one out of the four).
4.3 Lessons Learned
None
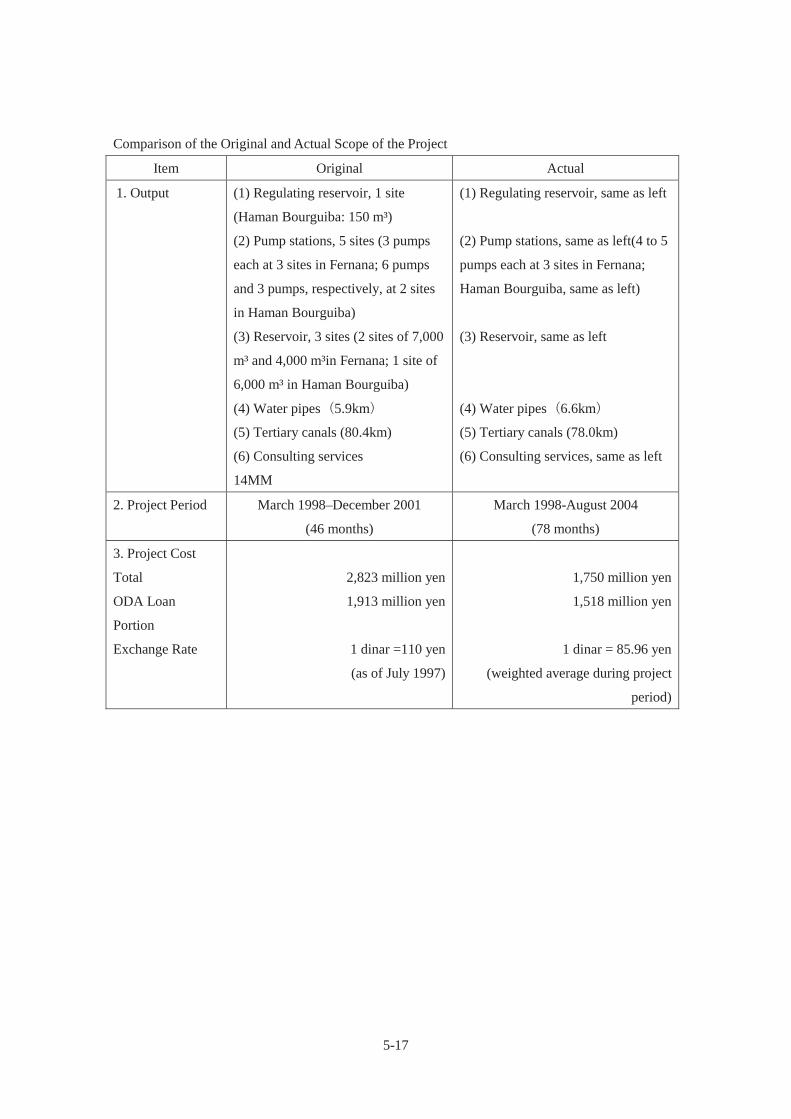
5-17
Comparison of the Original and Actual Scope of the Project
Item Original Actual
1. Output (1) Regulating reservoir, 1 site
(Haman Bourguiba: 150 m³)
(2) Pump stations, 5 sites (3 pumps
each at 3 sites in Fernana; 6 pumps
and 3 pumps, respectively, at 2 sites
in Haman Bourguiba)
(3) Reservoir, 3 sites (2 sites of 7,000
m³ and 4,000 m³in Fernana; 1 site of
6,000 m³ in Haman Bourguiba)
(4) Water pipes 5.9km
(5) Tertiary canals (80.4km)
(6) Consulting services
14MM
(1) Regulating reservoir, same as left
(2) Pump stations, same as left(4 to 5
pumps each at 3 sites in Fernana;
Haman Bourguiba, same as left)
(3) Reservoir, same as left
(4) Water pipes 6.6km
(5) Tertiary canals (78.0km)
(6) Consulting services, same as left
2. Project Period March 1998–December 2001
(46 months)
March 1998-August 2004
(78 months)
3. Project Cost
Total
ODA Loan
Portion
Exchange Rate
2,823 million yen
1,913 million yen
1 dinar =110 yen
(as of July 1997)
1,750 million yen
1,518 million yen
1 dinar = 85.96 yen
(weighted average during project
period)

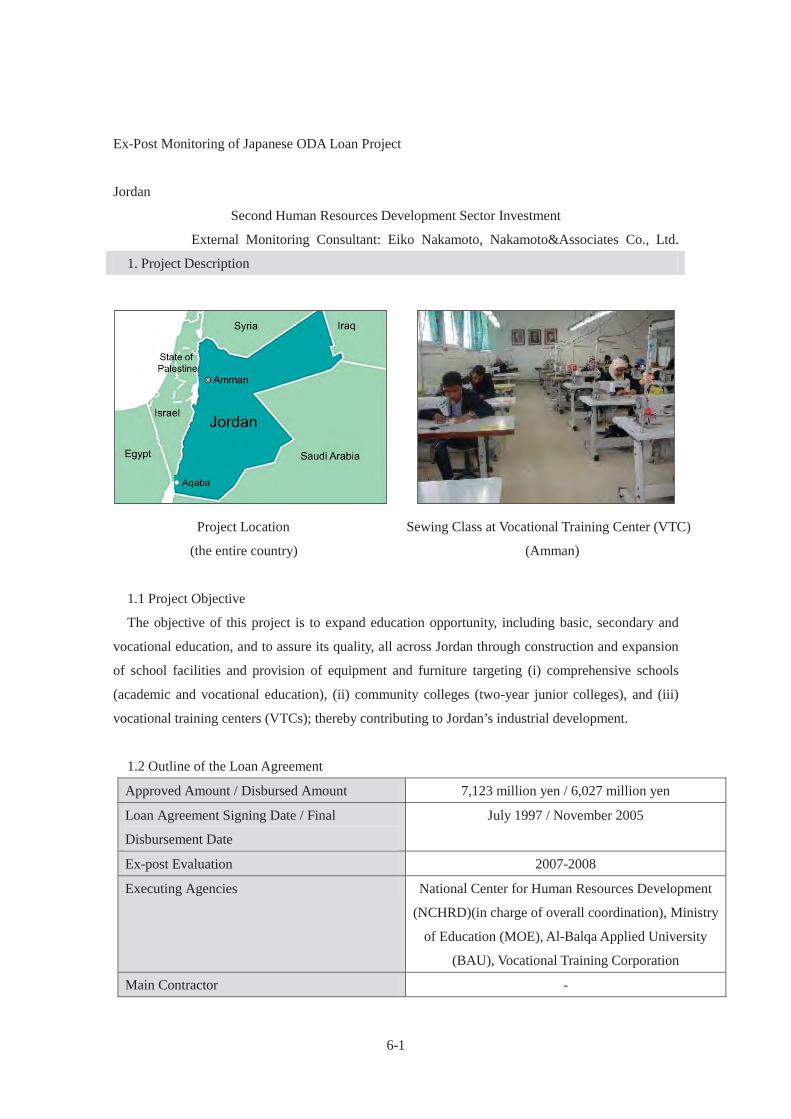
6-1
Ex-Post Monitoring of Japanese ODA Loan Project
Jordan
Second Human Resources Development Sector Investment
External Monitoring Consultant: Eiko Nakamoto, Nakamoto&Associates Co., Ltd.
1. Project Description
Project Location Sewing Class at Vocational Training Center (VTC)
(the entire country) (Amman)
1.1 Project Objective
The objective of this project is to expand education opportunity, including basic, secondary and
vocational education, and to assure its quality, all across Jordan through construction and expansion
of school facilities and provision of equipment and furniture targeting (i) comprehensive schools
(academic and vocational education), (ii) community colleges (two-year junior colleges), and (iii)
vocational training centers (VTCs); thereby contributing to Jordan’s industrial development.
1.2 Outline of the Loan Agreement
Approved Amount / Disbursed Amount 7,123 million yen / 6,027 million yen
Loan Agreement Signing Date / Final
Disbursement Date
July 1997 / November 2005
Ex-post Evaluation 2007-2008
Executing Agencies National Center for Human Resources Development
(NCHRD)(in charge of overall coordination), Ministry
of Education (MOE), Al-Balqa Applied University
(BAU), Vocational Training Corporation
Main Contractor -

6-2
Main Consultant -
1.3 Background of Ex-post Monitoring
Since the availability of a highly skilled labor force is what attracts direct investments to Jordan,
which is otherwise poor in natural resources, provision of high-quality education is unalterably a
challenge of national importance to Jordan. In the National Conference on Education Development,
which the Government of Jordan held in 1987, “improving the quality of education” was selected as
one of the national agenda, and the government of Jordan had been striving to upgrade and expand
academic and vocational education. Under these circumstances, this project has implemented the
construction and the expansion of school facilities and the provision of equipment and furniture
targeting (i) comprehensive schools (academic and vocational education), (ii) community colleges
(two-year junior colleges), and (iii) VTCs.
At the time of ex-post evaluation in 2007, the project goals had been partially attained. However,
since the demand for vocational education did not increase throughout Jordan as expected, a
decreasing tendency could be seen in the number of students in comprehensive schools' vocational
education program. The number of enrolled students for VTC was also level, and the filling rate,
graduation rate, and employment rate were showing a downward trend. In this context, it was
concluded that the effectiveness of this project was limited. In addition, the operation rate of school
facilities and equipment implemented by this project remained lower than expected, and some of the
equipment provided by this project remained unused. Therefore, the sustainability of this project was
rated as “moderate”.
Under these circumstances, the ex-post evaluation made a recommendation to the Jordanian
government to vigorously promote measures that will expand the demand for vocational
education/training.
In this context, this project was selected for ex-post monitoring and was reviewed through the
findings from the field survey and other research activities. Its final conclusion was drawn based on
all these findings concerned.
2. Outline of the Monitoring Study
2.1 External Monitoring Consultants
Eiko Nakamoto (Nakamoto & Associates Co., Ltd.)
2.2 Duration of Monitoring Study
Duration of the Study: September 2012 – June 2013
Duration of the Field Study: November 18, 2012 – November 26, 2012
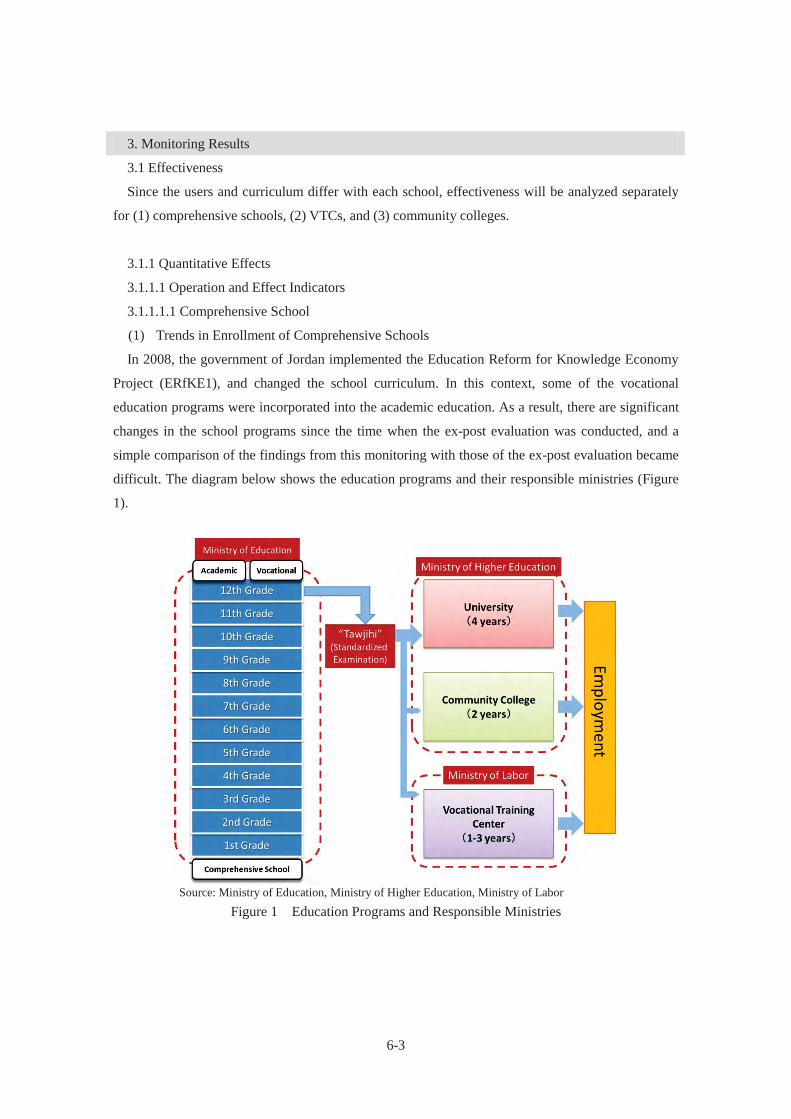
6-3
3. Monitoring Results
3.1 Effectiveness
Since the users and curriculum differ with each school, effectiveness will be analyzed separately
for (1) comprehensive schools, (2) VTCs, and (3) community colleges.
3.1.1 Quantitative Effects
3.1.1.1 Operation and Effect Indicators
3.1.1.1.1 Comprehensive School
(1) Trends in Enrollment of Comprehensive Schools
In 2008, the government of Jordan implemented the Education Reform for Knowledge Economy
Project (ERfKE1), and changed the school curriculum. In this context, some of the vocational
education programs were incorporated into the academic education. As a result, there are significant
changes in the school programs since the time when the ex-post evaluation was conducted, and a
simple comparison of the findings from this monitoring with those of the ex-post evaluation became
difficult. The diagram below shows the education programs and their responsible ministries (Figure
1).
Source: Ministry of Education, Ministry of Higher Education, Ministry of Labor
Figure 1 Education Programs and Responsible Ministries
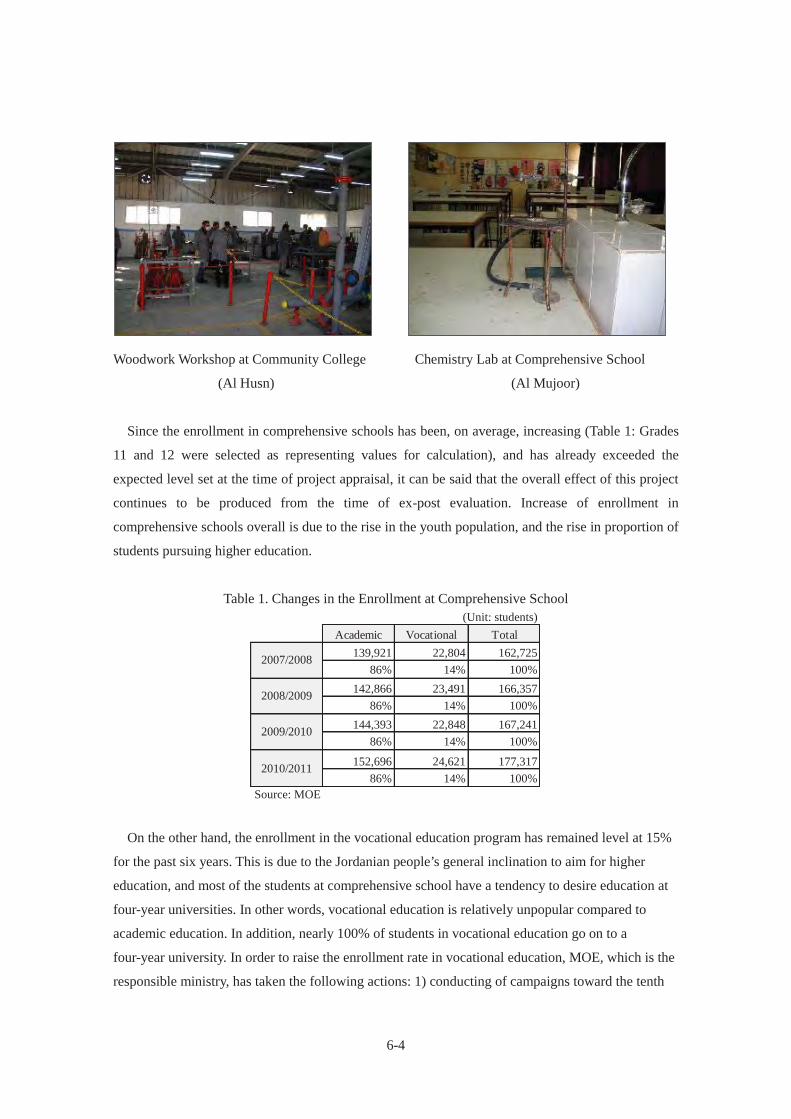
6-4
Woodwork Workshop at Community College Chemistry Lab at Comprehensive School
(Al Husn) (Al Mujoor)
Since the enrollment in comprehensive schools has been, on average, increasing (Table 1: Grades
11 and 12 were selected as representing values for calculation), and has already exceeded the
expected level set at the time of project appraisal, it can be said that the overall effect of this project
continues to be produced from the time of ex-post evaluation. Increase of enrollment in
comprehensive schools overall is due to the rise in the youth population, and the rise in proportion of
students pursuing higher education.
Table 1. Changes in the Enrollment at Comprehensive School (Unit: students)
Source: MOE
On the other hand, the enrollment in the vocational education program has remained level at 15%
for the past six years. This is due to the Jordanian people’s general inclination to aim for higher
education, and most of the students at comprehensive school have a tendency to desire education at
four-year universities. In other words, vocational education is relatively unpopular compared to
academic education. In addition, nearly 100% of students in vocational education go on to a
four-year university. In order to raise the enrollment rate in vocational education, MOE, which is the
responsible ministry, has taken the following actions: 1) conducting of campaigns toward the tenth
Academic Vocational Total139,921 22,804 162,725
86% 14% 100%142,866 23,491 166,357
86% 14% 100%144,393 22,848 167,241
86% 14% 100%
152,696 24,621 177,31786% 14% 100%
2009/2010
2010/2011
2007/2008
2008/2009
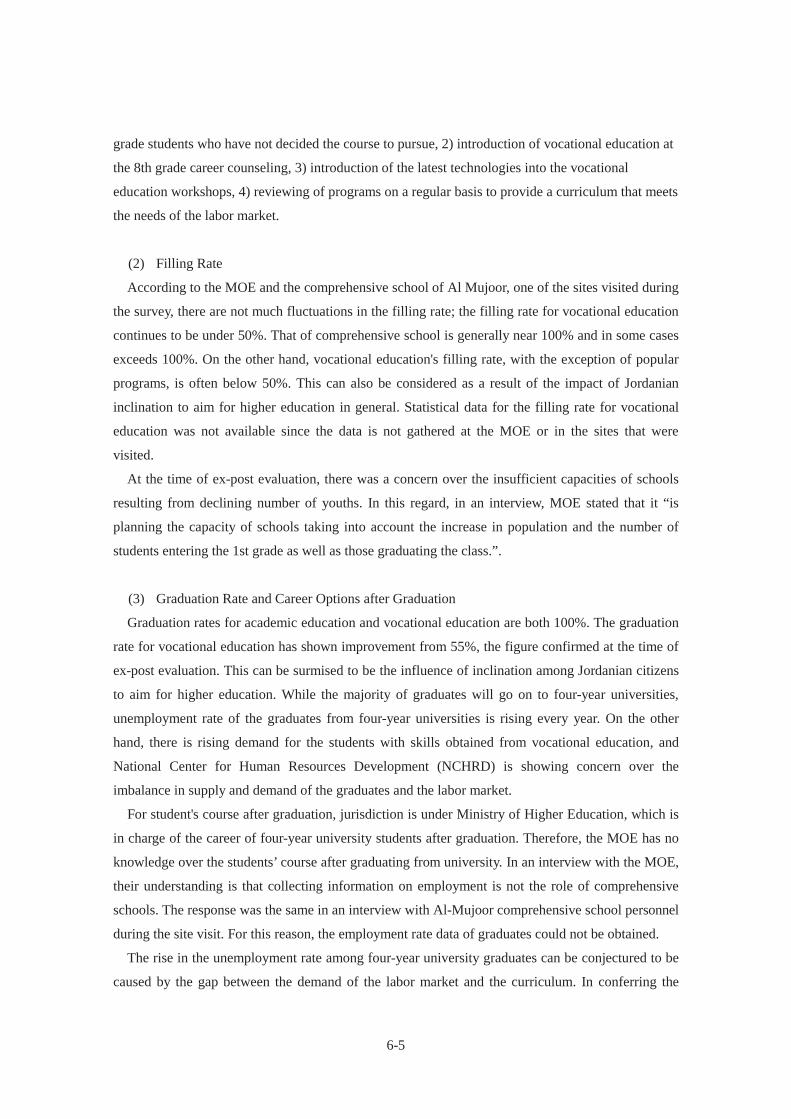
6-5
grade students who have not decided the course to pursue, 2) introduction of vocational education at
the 8th grade career counseling, 3) introduction of the latest technologies into the vocational
education workshops, 4) reviewing of programs on a regular basis to provide a curriculum that meets
the needs of the labor market.
(2) Filling Rate
According to the MOE and the comprehensive school of Al Mujoor, one of the sites visited during
the survey, there are not much fluctuations in the filling rate; the filling rate for vocational education
continues to be under 50%. That of comprehensive school is generally near 100% and in some cases
exceeds 100%. On the other hand, vocational education's filling rate, with the exception of popular
programs, is often below 50%. This can also be considered as a result of the impact of Jordanian
inclination to aim for higher education in general. Statistical data for the filling rate for vocational
education was not available since the data is not gathered at the MOE or in the sites that were
visited.
At the time of ex-post evaluation, there was a concern over the insufficient capacities of schools
resulting from declining number of youths. In this regard, in an interview, MOE stated that it “is
planning the capacity of schools taking into account the increase in population and the number of
students entering the 1st grade as well as those graduating the class.”.
(3) Graduation Rate and Career Options after Graduation
Graduation rates for academic education and vocational education are both 100%. The graduation
rate for vocational education has shown improvement from 55%, the figure confirmed at the time of
ex-post evaluation. This can be surmised to be the influence of inclination among Jordanian citizens
to aim for higher education. While the majority of graduates will go on to four-year universities,
unemployment rate of the graduates from four-year universities is rising every year. On the other
hand, there is rising demand for the students with skills obtained from vocational education, and
National Center for Human Resources Development (NCHRD) is showing concern over the
imbalance in supply and demand of the graduates and the labor market.
For student's course after graduation, jurisdiction is under Ministry of Higher Education, which is
in charge of the career of four-year university students after graduation. Therefore, the MOE has no
knowledge over the students’ course after graduating from university. In an interview with the MOE,
their understanding is that collecting information on employment is not the role of comprehensive
schools. The response was the same in an interview with Al-Mujoor comprehensive school personnel
during the site visit. For this reason, the employment rate data of graduates could not be obtained.
The rise in the unemployment rate among four-year university graduates can be conjectured to be
caused by the gap between the demand of the labor market and the curriculum. In conferring the
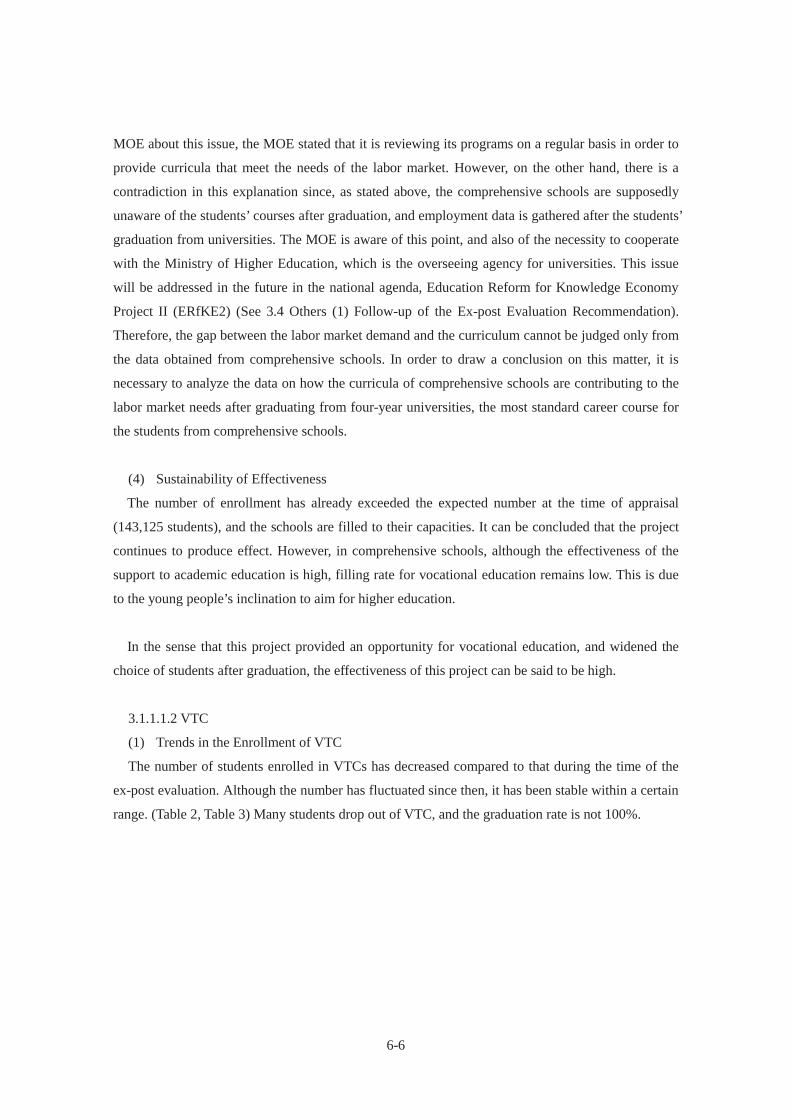
6-6
MOE about this issue, the MOE stated that it is reviewing its programs on a regular basis in order to
provide curricula that meet the needs of the labor market. However, on the other hand, there is a
contradiction in this explanation since, as stated above, the comprehensive schools are supposedly
unaware of the students’ courses after graduation, and employment data is gathered after the students’
graduation from universities. The MOE is aware of this point, and also of the necessity to cooperate
with the Ministry of Higher Education, which is the overseeing agency for universities. This issue
will be addressed in the future in the national agenda, Education Reform for Knowledge Economy
Project II (ERfKE2) (See 3.4 Others (1) Follow-up of the Ex-post Evaluation Recommendation).
Therefore, the gap between the labor market demand and the curriculum cannot be judged only from
the data obtained from comprehensive schools. In order to draw a conclusion on this matter, it is
necessary to analyze the data on how the curricula of comprehensive schools are contributing to the
labor market needs after graduating from four-year universities, the most standard career course for
the students from comprehensive schools.
(4) Sustainability of Effectiveness
The number of enrollment has already exceeded the expected number at the time of appraisal
(143,125 students), and the schools are filled to their capacities. It can be concluded that the project
continues to produce effect. However, in comprehensive schools, although the effectiveness of the
support to academic education is high, filling rate for vocational education remains low. This is due
to the young people’s inclination to aim for higher education.
In the sense that this project provided an opportunity for vocational education, and widened the
choice of students after graduation, the effectiveness of this project can be said to be high.
3.1.1.1.2 VTC
(1) Trends in the Enrollment of VTC
The number of students enrolled in VTCs has decreased compared to that during the time of the
ex-post evaluation. Although the number has fluctuated since then, it has been stable within a certain
range. (Table 2, Table 3) Many students drop out of VTC, and the graduation rate is not 100%.
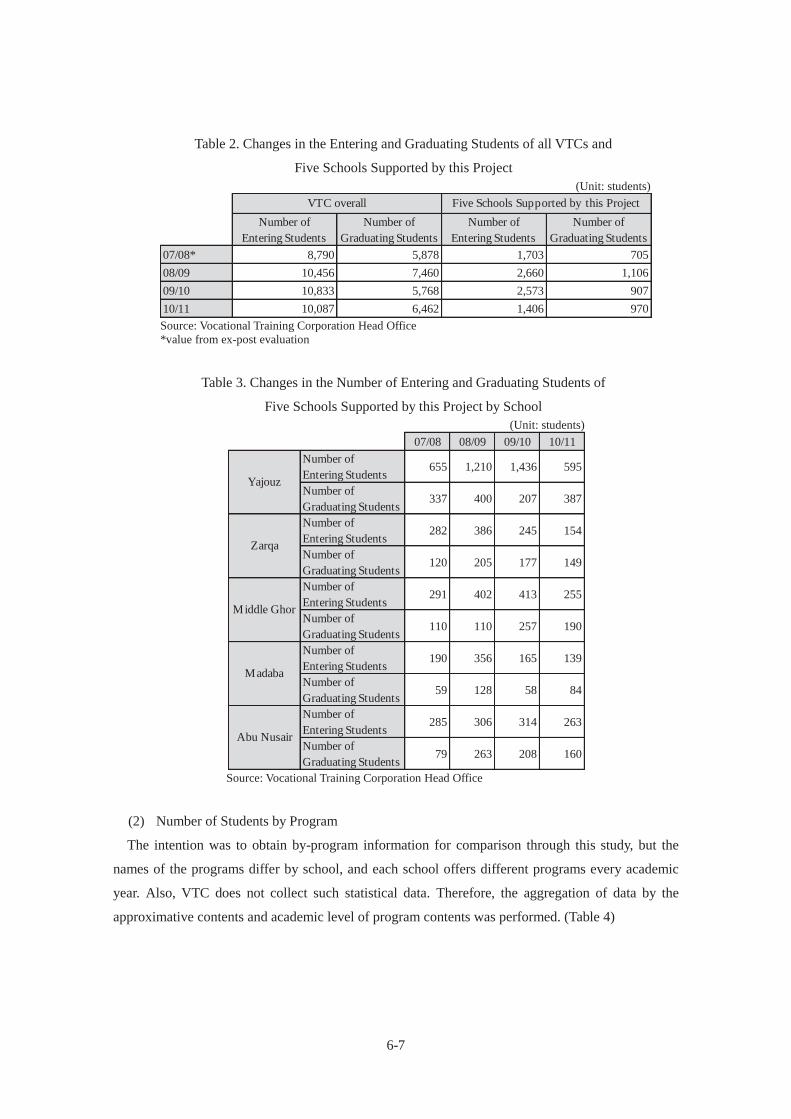
6-7
Table 2. Changes in the Entering and Graduating Students of all VTCs and
Five Schools Supported by this Project (Unit: students)
Source: Vocational Training Corporation Head Office *value from ex-post evaluation
Table 3. Changes in the Number of Entering and Graduating Students of
Five Schools Supported by this Project by School (Unit: students)
Source: Vocational Training Corporation Head Office
(2) Number of Students by Program
The intention was to obtain by-program information for comparison through this study, but the
names of the programs differ by school, and each school offers different programs every academic
year. Also, VTC does not collect such statistical data. Therefore, the aggregation of data by the
approximative contents and academic level of program contents was performed. (Table 4)
Number ofEntering Students
Number ofGraduating Students
Number ofEntering Students
Number ofGraduating Students
07/08* 8,790 5,878 1,703 70508/09 10,456 7,460 2,660 1,10609/10 10,833 5,768 2,573 90710/11 10,087 6,462 1,406 970
VTC overall Five Schools Supported by this Project
07/08 08/09 09/10 10/11Number ofEntering Students
655 1,210 1,436 595
Number ofGraduating Students
337 400 207 387
Number ofEntering Students
282 386 245 154
Number ofGraduating Students
120 205 177 149
Number ofEntering Students
291 402 413 255
Number ofGraduating Students
110 110 257 190
Number ofEntering Students
190 356 165 139
Number ofGraduating Students
59 128 58 84
Number ofEntering Students
285 306 314 263
Number ofGraduating Students
79 263 208 160Abu Nusair
Yajouz
Zarqa
Middle Ghor
Madaba
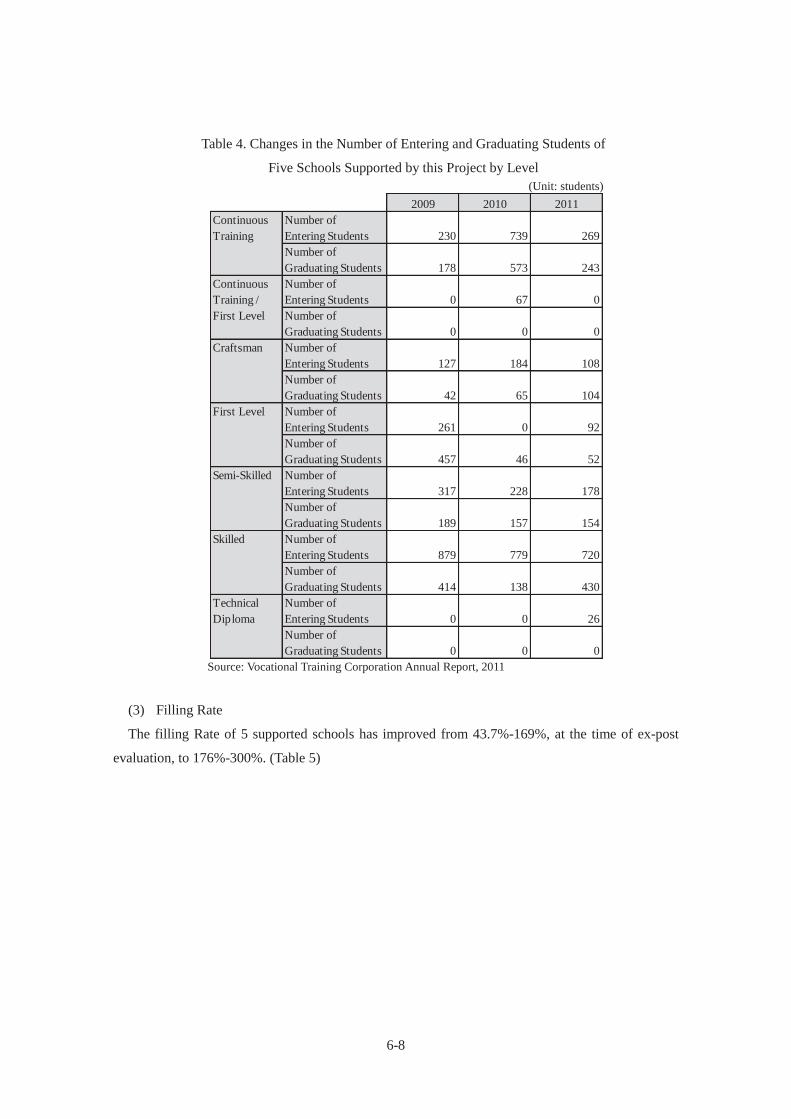
6-8
Table 4. Changes in the Number of Entering and Graduating Students of
Five Schools Supported by this Project by Level (Unit: students)
Source: Vocational Training Corporation Annual Report, 2011
(3) Filling Rate
The filling Rate of 5 supported schools has improved from 43.7%-169%, at the time of ex-post
evaluation, to 176%-300%. (Table 5)
2009 2010 2011Number ofEntering Students 230 739 269Number ofGraduating Students 178 573 243Number ofEntering Students 0 67 0Number ofGraduating Students 0 0 0Number ofEntering Students 127 184 108Number ofGraduating Students 42 65 104Number ofEntering Students 261 0 92Number ofGraduating Students 457 46 52Number ofEntering Students 317 228 178Number ofGraduating Students 189 157 154Number ofEntering Students 879 779 720Number ofGraduating Students 414 138 430Number ofEntering Students 0 0 26Number ofGraduating Students 0 0 0
Skilled
TechnicalDiploma
ContinuousTraining
ContinuousTraining /First Level
Craftsman
First Level
Semi-Skilled

6-9
Table 5. Changes in the Filling Rate of Five Schools Supported by this Project (Unit: students)
Source: Vocational Training Corporation Head Office
Filling rate, for the most part, is over 100%. This is due to the revisions in the course capacity
resulting from discontinuation of unpopular courses, and switching to popular courses, rather than
the increase in the number of students. Filling rate exceeds 300% in some years, and inquiry was
done to the responsible government officials on the "accuracy of data" during an interview.
According to one of the interviewees at the Vocational Training Corporation, "this is the effect from
frequently reviewing the capacity of each course, and there is no problem”. There was no
information available on filling rate by program.
Capacity of VTC has been slightly decreasing since 2009. According to VTC, this is due to
discontinuations and modifications of unpopular courses in order to conform to the demands of the
industry. The process of modification and resumption of a course to conform to the market needs
generally take nearly one year. As a result, this is reflected in the fluctuation in the capacity of the
schools.
07/08 08/09 09/10 10/11Number of Male Students 933 1,116 1,337 1,440Number of Female Students 123 94 99 54Total Number of Students 1,056 1,210 1,436 1,494School Capacity 337 450 450 386Filling Rate 313% 269% 319% 387%Number of Male Students 10 0 6 7Number of Female Students 524 386 322 257Total Number of Students 534 386 328 264School Capacity 213 200 200 105Filling Rate 251% 193% 164% 251%Number of Male Students 171 132 163 165Number of Female Students 120 270 343 191Total Number of Students 291 402 506 356School Capacity 102 100 100 143Filling Rate 285% 402% 506% 249%Number of Male Students 156 305 320 172Number of Female Students 34 51 11 39Total Number of Students 190 356 331 211School Capacity 184 200 200 120Filling Rate 103% 178% 166% 176%Number of Male Students 170 196 189 208Number of Female Students 331 299 326 203Total Number of Students 501 495 515 411School Capacity 161 200 200 161Filling Rate 311% 248% 258% 255%Capacity 7,423 10,044 9,660 8,838Filling Rate 120% 104% 112% 114%
Total VTC
Yajouz
Zarqa
Middle Ghor
Madaba
Abu Nusair
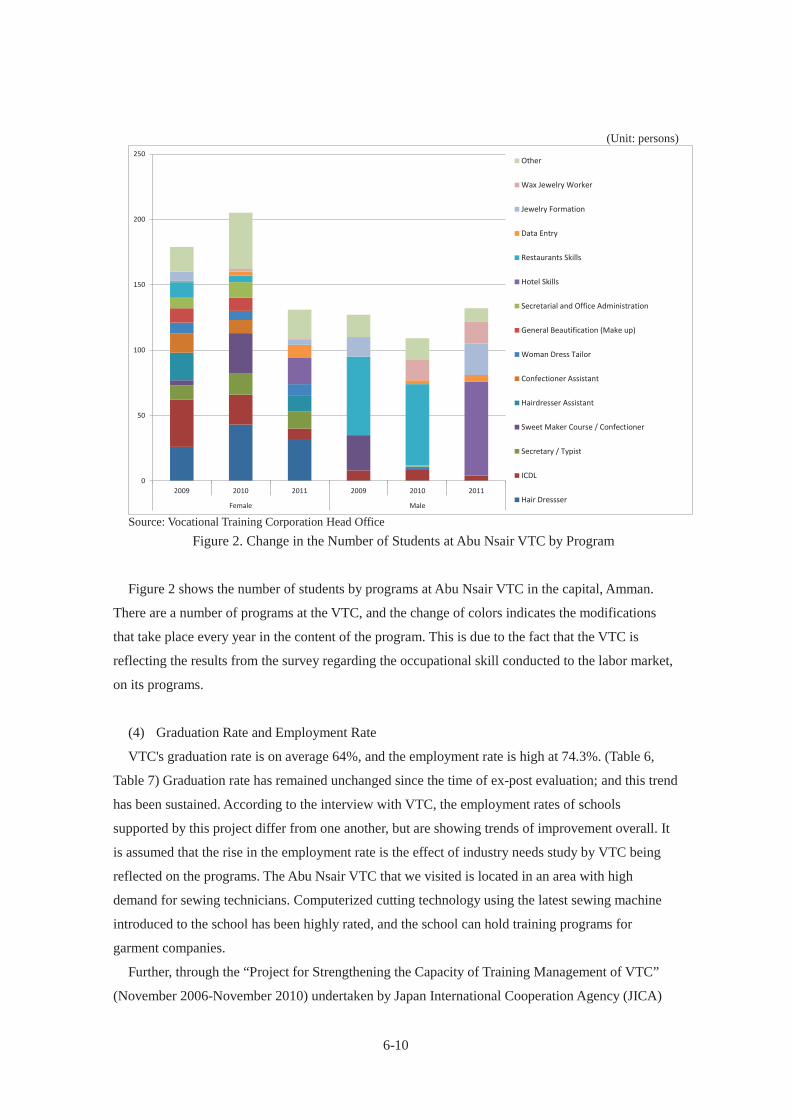
6-10
(Unit: persons)
Source: Vocational Training Corporation Head Office
Figure 2. Change in the Number of Students at Abu Nsair VTC by Program
Figure 2 shows the number of students by programs at Abu Nsair VTC in the capital, Amman.
There are a number of programs at the VTC, and the change of colors indicates the modifications
that take place every year in the content of the program. This is due to the fact that the VTC is
reflecting the results from the survey regarding the occupational skill conducted to the labor market,
on its programs.
(4) Graduation Rate and Employment Rate
VTC's graduation rate is on average 64%, and the employment rate is high at 74.3%. (Table 6,
Table 7) Graduation rate has remained unchanged since the time of ex-post evaluation; and this trend
has been sustained. According to the interview with VTC, the employment rates of schools
supported by this project differ from one another, but are showing trends of improvement overall. It
is assumed that the rise in the employment rate is the effect of industry needs study by VTC being
reflected on the programs. The Abu Nsair VTC that we visited is located in an area with high
demand for sewing technicians. Computerized cutting technology using the latest sewing machine
introduced to the school has been highly rated, and the school can hold training programs for
garment companies.
Further, through the “Project for Strengthening the Capacity of Training Management of VTC”
(November 2006-November 2010) undertaken by Japan International Cooperation Agency (JICA)
0
50
100
150
200
250
2009 2010 2011 2009 2010 2011
Female Male
Other
Wax Jewelry Worker
Jewelry Formation
Data Entry
Restaurants Skills
Hotel Skills
Secretarial and Office Administration
General Beautification (Make up)
Woman Dress Tailor
Confectioner Assistant
Hairdresser Assistant
Sweet Maker Course / Confectioner
Secretary / Typist
ICDL
Hair Dressser

6-11
created three model VTCs which can provide training programs meeting the needs of the industrial
market. Because this project was successful, VTC has expanded the project to nine schools, and
currently is proceeding to apply this project to all the remaining schools. Zarqa, a school supported
by this program, is included in the nine schools to which the application was extended.
Table 6. Change in the Employment Situation of all VTC (Unit: %)
Source: Vocational Training Corporation Head Office
Table 7. Change in the Graduation Rate of Five Schools Supported by this Project (Unit: %)
Source: Vocational Training Corporation Head Office
Although the numbers of students are fluctuating, they are stable within a certain range in the long
run. Employment rate has exceeded 70%, and is stable. It can be concluded that the project continues
to take effect.
3.1.1.1.3 Community College
(1) Trends in the Enrollment at Community College
The reasons for the increase in the enrollment in community colleges are, Balqa University, which
is the regulatory agency for community colleges, undertaking a significant reform of the programs to
reflect the needs of the labor market; community colleges’ constant reviewing of their programs and
the attractive programs after the reform; and provision of a chance for the students to transfer to a
four-year university which is appealing to Jordanian people with general inclination to aim for
higher education. (Figure 3)
07/08 08/09 09/10 10/11Employment Rate 74.6 - 77.1 74.3
Students with JobCompatible to theirTraining
36.6 - 28.4 25.4
07/08 08/09 09/10 10/11
Yajouz 51.5 33.1 14.4 65.0
Zarqa 42.6 53.1 72.2 96.8
Middle Ghor 37.8 27.4 62.2 74.5
Madaba 31.1 36.0 35.2 60.4
Abu Nusair 27.7 85.9 66.2 60.8
VTC Total 66.9 78.0 53.2 64.0
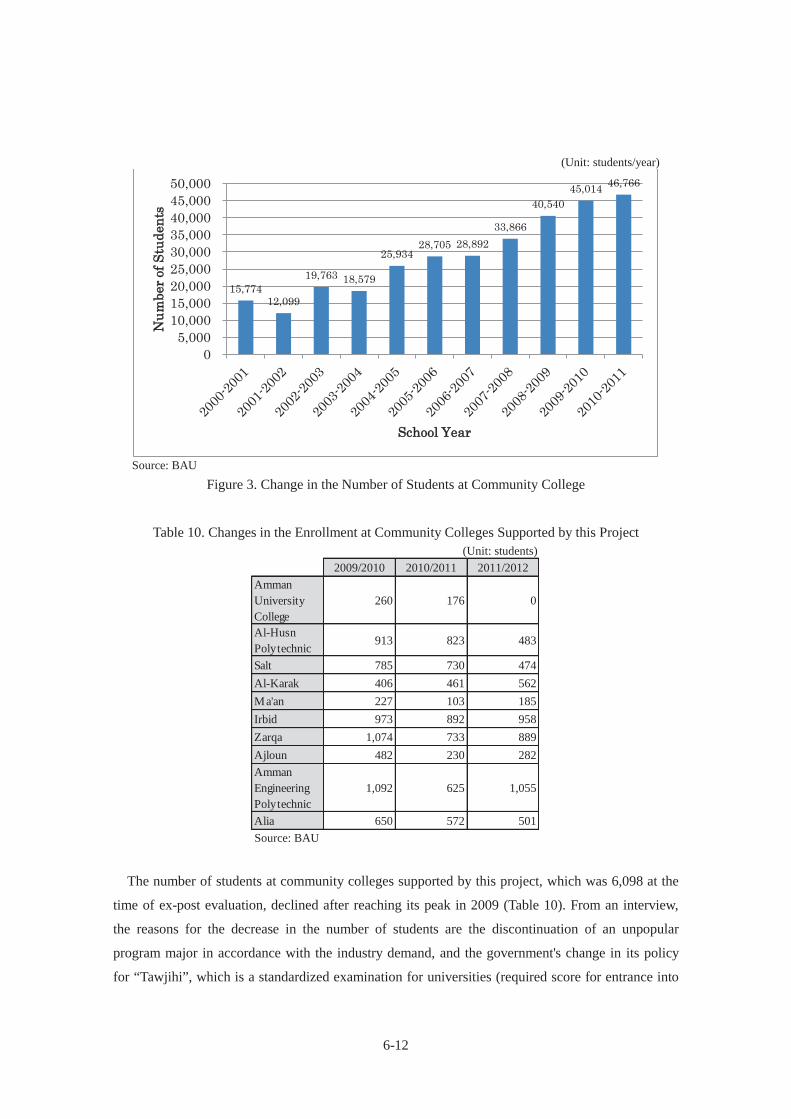
6-12
(Unit: students/year)
Source: BAU
Figure 3. Change in the Number of Students at Community College
Table 10. Changes in the Enrollment at Community Colleges Supported by this Project (Unit: students)
Source: BAU
The number of students at community colleges supported by this project, which was 6,098 at the
time of ex-post evaluation, declined after reaching its peak in 2009 (Table 10). From an interview,
the reasons for the decrease in the number of students are the discontinuation of an unpopular
program major in accordance with the industry demand, and the government's change in its policy
for “Tawjihi”, which is a standardized examination for universities (required score for entrance into
15,774 12,099
19,763 18,579
25,934 28,705 28,892
33,866
40,540 45,014 46,766
05,000
10,00015,00020,00025,00030,00035,00040,00045,00050,000
Num
ber o
f Stu
dent
s
School Year
2009/2010 2010/2011 2011/2012AmmanUniversityCollege
260 176 0
Al-HusnPolytechnic
913 823 483
Salt 785 730 474Al-Karak 406 461 562Ma'an 227 103 185Irbid 973 892 958Zarqa 1,074 733 889Ajloun 482 230 282AmmanEngineeringPolytechnic
1,092 625 1,055
Alia 650 572 501
6-13
university was reduced and community college lost students to universities). The government of
Jordan is tackling this problem in the national agenda, ERfKE2. (See “3.4 Follow-up of
Recommendation (1)”) From the information obtained from Balqa University and from an interview
with a school director of each school, reasons for the fluctuation by school are as follows:
- Amman University College: Number of enrollment is zero in 2011, because of the
discontinuation of Banking and Finance Program from a lack of market demand. The students
attended their classes at another community college (Alia College), and the facilities were
continually utilized by the college.
- Al Husn Polytechnic University: The number of students decreased in 2011 because of its
closure of the Department of Literature. The purpose of this closure was to make the school a 100%
science and technology university, and construction work for expansion of its facilities is under way.
In the near future, the school is planning to start new programs in the fields of health and safety, and
energy.
- Salt: The number of students in 2011 decreased because of the discontinuation of two-thirds of
the juvenile education program due to limited market needs.
- Ma'an: Decrease in the number of students in 2010 is due to the policy of Ma'an municipality to
reduce the passing score of Tawjihi. This resulted in more students choosing to attend four-year
universities. The passing score was restored to its original score the following year, and number of
students has also returned to its previous level.
- Ajloun: The decrease in the number of students from 2010 is due to the replacement of programs
which were unpopular with the students. It takes approximately two years to recruit the desired
number of students following the renewal of program content, dissemination, and recruitment of
students.
- Amman Engineering Polytechnic: The reason for the increase in the number of students after its
decline in 2010 is the government's policy, which lowered the passing score of Tawjihi to 55% in
2010, and raising the score to 65% in the subsequent year. In the year the score was lowered, more
students chose to go to universities instead of community colleges.
Concerning the impact of the change in the passing score of Tawjihi, it can be reasoned upon
observation that the government should take measures in order to conform to the country’s policy to
increase the number of student enrollment in community colleges.
(2) Graduation Rate and Employment Rate
Employment rate for graduates from community colleges continues to be near 100% due to the
high demand for graduates who have mastered the professional skills to meet the community-based
needs. Data on the overall employment rate of community colleges are not compiled, but other than
female students, who do not wish to work, close to 100% is employed. Graduates often work in
6-14
occupations that meet the needs of the community. In addition, many students are working in foreign
countries such as the Gulf.
Overall, the number of students at community colleges is increasing. At the community colleges
supported by this project, the numbers of students have shown fluctuation, but have remained within
a certain range. The main reasons for the fluctuation are the effects of the change in market demand,
and the change in the entering number of students from the government’s policy to change the
passing score of Tawjihi. Students have a tendency to choose four-year universities over community
colleges when the Tawjihi score is lowered. Under these circumstances, community colleges are
committed on reviewing the programs to reflect the needs of the market, and employment rate is
high for graduates with skills that match the needs of the market.
3.1.1.2 Internal Rates of Return (IRR)
In ex-post evaluation report, the internal rate of return was calculated to be 3.1%. In this study, the
calculation of the internal rate of return will not be performed, since the basis of calculation used at
the time of ex-post evaluation could not be obtained.
3.1.2 Qualitative Effects
(1) Improvement in the Quality of Vocational Education
As can be seen in majors utilizing new technology and establishment of majors utilizing modern
facilities, project's contribution to the improvement of the quality of vocational education continues
to take effect.
(2) Provision of Vocational Education that Meets Market Needs
project's contribution to the provision of vocational education that meets market needs continues
to take effect through establishment of new majors that match the industry needs and through
reviewing of existing majors,
(3) Improvement in the Quality of Academic Education
The project’s contribution to the improvement in the quality of academic education continues to
take effect. The number of students per class was optimized and double-shifts were reduced as a
result of renovation and construction of school facilities. In addition, stable learning environment is
now secured from the reduction of leased schools.
6-15
3.2 Impact
3.2.1 Intended Impacts
3.2.1.1 Improvement of the Balance of Payments and Foreign Currency
It cannot be said that this project has had a direct effect on the balance of international accounts.
However, in the interviews with Vocational Training Corporation and BAU, there were comments
that there is contribution to the acquisition of foreign currency through remittances from graduates
working in foreign countries, such as the Gulf. Also, the MOE stated that “one of the goals is that
this project will ultimately lead to an increase in GDP”.
3.2.1.2 Industrial Structure
Although VTC and BAU continue to produce high-level technicians, contribution of this project
to the advancement of industrial structure is unknown.
3.2.1.3 Women's Advance into Society
The project continues to support the social advancement of women through provision of
vocational training which are useful for their employment. From this effort, increase in the
employment opportunities of women can be seen particularly in occupations such as fashion,
childcare, and secretary. In an interview, BAU stated that "pertaining to employment of women, even
if they do not work after graduation, the level of higher education will ultimately have a positive
impact on society as a whole through parenting".
3.2.1.4 Social Stability
Although the project has continued to contribute to the employment of younger generations, the
contribution to social stability is unclear.
3.2.1.5 Regional Development
At VTC and community college, the project continues to provide community-based vocational
training that meets the needs of local industry, and has contributed to the industry in the region. Also,
the project has contributed to regional development through cooperative vocational training with
local companies and providing special courses for the companies utilizing the latest facilities
installed in the schools. By constantly reviewing the curriculum to reflect the market needs, and
producing the graduates with the demanded skills, BAU and VTC has served as a bridge between
industry (society) and human resources.
3.2.2 Other Impacts
None
6-16
From the above, this project is playing an important role in the social advancement of women and
the development of the region. It can be determined that at the time of ex-post monitoring, the
impact of this project continues to take effect.
3.3 Sustainability
3.3.1 Structural Aspects of Operation and Maintenance
There has been no change since the ex-post evaluation, and sustainable structure has been
maintained. The central executing agency of this project is NCHRD, and presiding agencies for each
schools system are: MOE (comprehensive schools), Balqa University under the Ministry of Higher
Education (community colleges), and Vocational Training Corporation under the Ministry of Labor
(VTCs).
(1) Status of the Operation and Maintenance of Facilities and Equipment
According to the observation and the interview at the time of the site visit, improvement could be
seen in the management conditions of buildings, equipment, and facilities invested by this project
from the time of ex-post evaluation. From the site visits, it was confirmed that the statuses of the
facilities were satisfactory, and they were properly managed. However, since the list of assets which
were invested by this project did not exist, the only sources of information were memories and
records kept by school staff. There were also cases where the personnel in charge has moved to
another school or the record did not exist (fixed asset ledgers exist, but there is no information
linking the project and assets), and therefore, overall assessment of the equipment could not be made.
According to the interview, service life of most of the equipment provided by this project has already
expired; there is much equipment such as computers which need to be replaced, or those which
operation and maintenance cost have become substantial.
(2) Other Status of the Operation and Maintenance
Processes for reviewing and modifying the curriculum have been established, and improvement
can be seen in the operation and maintenance. VTC and community college is conducting a unified
research on employment and market needs, and reflecting these results during the review of the
program.
Since almost all of the comprehensive school students proceed to universities, comprehensive
schools do not have information on the employment of graduates. In order to conduct a follow-up
research for the career path from comprehensive school to university, VTC, or community college,
cooperation between the ministries (MOE, Ministry of Higher Education, and Ministry of Labor) is
necessary. In response to ERfKE1, NCHRD created an information database in 2012, encompassing
6-17
comprehensive schools, universities, and community colleges. Such information is useful in the
operation and maintenance of this project. This information is also distributed as a booklet in
summarized version, and is planned to be disclosed over the internet in the near future. This data is
expected to be used in decision-making for the operation and maintenance of the education system.
There is also a plan to encompass data for VTC.
3.3.2 Technical Aspects of Operation and Maintenance
The technical skills of operation and maintenance continue to be provided, and high level of
sustainability can be expected. Each school receives adequate technical support from its supervising
agencies: comprehensive school, VTC, and Balqa University. In addition, concerning operation and
maintenance of curriculum, through the implementation of JICA's “Project for Strengthening the
Capacity of Training management of Vocational Training Corporation” the findings from research on
employment and industrial needs are reflected systematically to the review processes of the curricula.
Its effect can be seen in the employment rate and the filling rate. Application of this successful case
of the initial model school is planned to be expanded to all schools.
3.3.3 Financial Aspects of Operation and Maintenance
(1) Government Budget
10% of the government budget, 4.5% of the GDP, is allocated for education (2011). This remains
unchanged since the ex-post evaluation.
(2) Budget for Facility Operation and Maintenance Expense
The overall budget of the MOE is 6 million Jordan Dinars (JOD). This is the budget for the
maintenance cost of the existing facilities, and does not include the replacement cost. Budget for the
VTC, which fluctuates by year, is 85,000 to 100,000 JOD. Tuition revenue per student at Balqa
University is one-third of the total cost; university budgets are in a tight situation. At Balqa
University, the shortfall is complemented by the revenues from the diploma programs.
As a shared comment from the interviews, the budget is insufficient for the replacement of
facilities and equipment which is near or past its service life. The costs for maintaining these
equipment are increasing every year. At the time of this study, no measures have been taken for
budget allowance. However, the state of the facilities and equipment were satisfactory; by using the
equipment with care, the equipment continued to be fully utilized after the expiration of its service
life.
From the above, no problem was detected concerning the operation and maintenance, and there is
no problem with sustainability. However, regarding the equipment ending its service life in the near
6-18
future, action is necessary since the allowance budget has not been secured.
3.4 Others
(1) Follow-up of the Ex-Post Evaluation Recommendation
Jordan is committed to the realization of the recommendations mentioned in the ex-post
evaluation report, through the national agenda, ERfKE2. Until now, the Jordanian government has
continually placed emphasis on vocational education. However, in actuality, there were discrepancies
in the supply and demand such as those mentioned below, and the plan could not be realized:
1. Student’s general inclination to aim for higher education, and high unemployment rate of
university graduates.
2. Demands are high for skilled workers such as industrial technicians, but those occupations are
unpopular with students.
The government of Jordan is aiming to ultimately expand the vocational education by reviewing
the career path and vocational training through cooperation with MOE, Ministry of Higher
Education, and Ministry of Labor, which are the three ministries responsible for the educational
system. This objective is also listed in the action plan of National Agenda, ERfKE2, and is targeted
to be achieved by 2015.
Currently, VTC is conducting an assessment every two years for training needs and follow-up
study of graduates, and utilizing this information to review its programs. BAU is building an
information database of all graduates, and advancing the construction of Career Development Center.
There is currently one Center operating in the middle region. BAU is planning on building one
center each in the northern and southern regions, and utilize these three centers to cover the entire
country.
4. Conclusion, Lessons Learned and Recommendations
4.1 Conclusion
Educational equipment and facilities built and renovated by this project continue to be utilized,
and are contributing to the expansion of educational opportunities and to improving the quality of
education. Also, the impact on the acquisition of foreign currency and on the contribution to the local
economy continues to take effect. The enrollment rate for the vocational education remains low, just
under 15%, but this is recognized to be a problem solved by cooperation between ministries, and its
resolution is set as an objective in the context of education reform. It is expected that the efforts by
policy makers continue in the future. As for sustainability, equipment invested by this project is
maintained in good condition, and, as a result of ERfKE, a review of vocational training to meet the
market needs is being held every year. In addition, it can be concluded that the sustainability of this
6-19
project has improved, since it was confirmed that the source of funds needed to sustain this
education system was secured.
4.2 Recommendations
4.2.1 Recommendations to the Implementing Agency
It was generally noted that, there is insufficient budget for replacement of certain facilities and
equipment which is near to or has already passed its service life (especially computers). These
equipment's operation and maintenance cost is substantial and therefore requires replacement.
School personnel commonly asserted that the budget was insufficient. It is desirable for the
government of Jordan to consider provision of budget for the replacement of these equipment and
facilities.
4.3 Lessons Learned
When verifying the status of the operation and maintenance of equipment and facilities, there was
no choice but to rely on the memory of school staff and on the records kept by individual school staff
since the list of the assets invested by this project did not exist. In this context, a comprehensive
checking of the equipment could not be performed, since the personnel in charge have moved to
another school since, and the records in the schools’ fixed asset ledger did not mention the project
name by which the equipment was invested. It is desirable for the recipient government to create and
store a list of equipment upon the completion of the project, and to utilize this at the time of ex-post
evaluation and ex-post monitoring.

6-20
Comparison of the Original and Actual Scope of the Project
Item Original Actual
(1) Output
(a) Comprehensive Schools
(b) Community Colleges
(c) VTCs
New construction: 31 schools
Expansion: 21 schools
Procurement of equipment
and furniture: 66 schools
Expansion: 7 schools
Procurement of equipment
and furniture: 11 schools
Expansion: 3 schools
Procurement of equipment
and furniture: 5 schools
New construction: 31 schools
Expansion: 21 schools
Procurement of equipment and
furniture: 66 schools
Expansion: 7 schools
Procurement of equipment and
furniture: 10 schools
Expansion: 3 schools
Procurement of equipment and
furniture: 5 schools
(2) Project Period July 30, 1997–June 2002 July 30, 1997–Nov. 13, 2005
(3) Project Cost
Total of ODA Loan Portion
Civil Works
Equipment & Furniture
Consulting Services
Slush Fund
Exchange Rate
7,123 million yen
3,914 million yen
2,761 million yen
110 million yen
638 million yen
1JD = 154.62 yen
(Jan. 1997
at time of appraisal)
6,027 million yen
3,826.85 million yen
2,235.62 million yen
87.91 million yen
1JD = 169.49 yen
(Nov.2005
completion of disbursement)
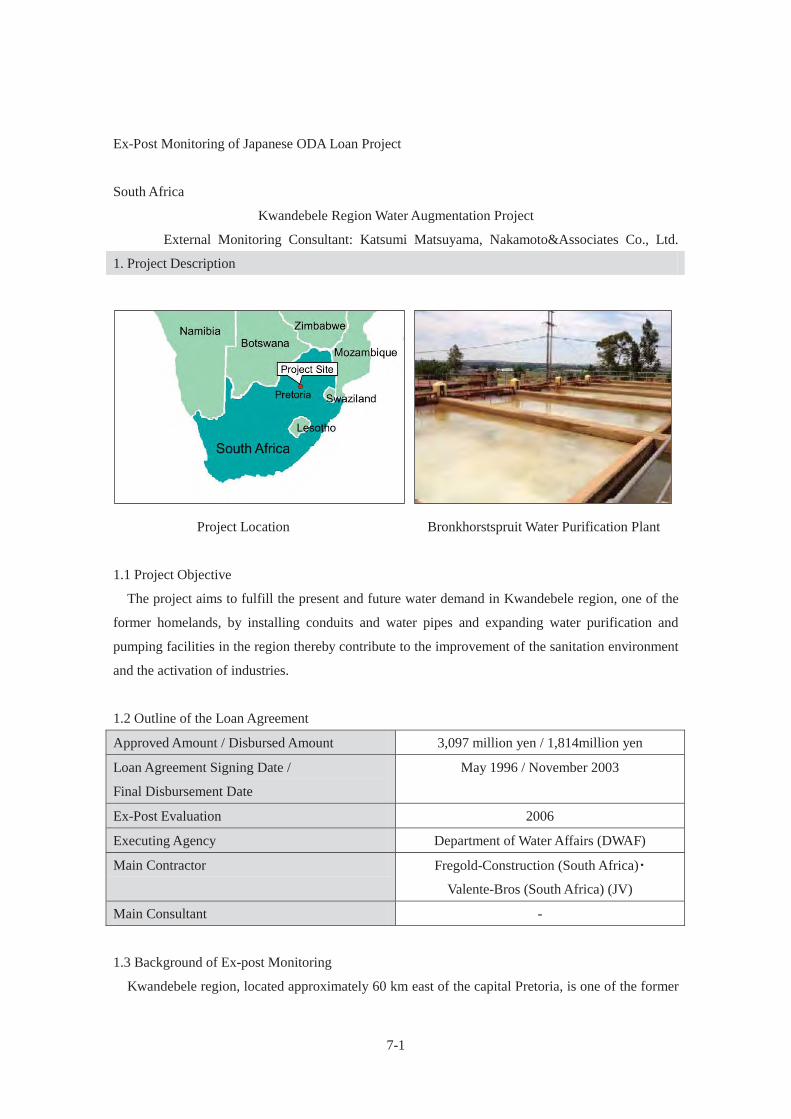
7-1
Ex-Post Monitoring of Japanese ODA Loan Project
South Africa
Kwandebele Region Water Augmentation Project
External Monitoring Consultant: Katsumi Matsuyama, Nakamoto&Associates Co., Ltd.
1. Project Description
Project Location Bronkhorstspruit Water Purification Plant
1.1 Project Objective
The project aims to fulfill the present and future water demand in Kwandebele region, one of the
former homelands, by installing conduits and water pipes and expanding water purification and
pumping facilities in the region thereby contribute to the improvement of the sanitation environment
and the activation of industries.
1.2 Outline of the Loan Agreement
Approved Amount / Disbursed Amount 3,097 million yen / 1,814million yen
Loan Agreement Signing Date /
Final Disbursement Date
May 1996 / November 2003
Ex-Post Evaluation 2006
Executing Agency Department of Water Affairs (DWAF)
Main Contractor Fregold-Construction (South Africa)
Valente-Bros (South Africa) (JV)
Main Consultant -
1.3 Background of Ex-post Monitoring
Kwandebele region, located approximately 60 km east of the capital Pretoria, is one of the former
7-2
homelands. Because of its geographical location, Kwandebele region was developing as the largest
township for black residents commuting to Pretoria. The region was experiencing rapid population
growth marking an annual growth rate of approximately 7.5% for several years prior to the appraisal
of this project. However, Kwandebele region did not have sufficient infrastructure such as water
supply. To improve this situation, this project implemented installation of water pipes, construction
of water treatment plants, and expansion of pump facilities.
However, with the enactment of the Constitution of the Republic of South Africa in 1997, Water
Service Act was signed into law according to a policy on water supply and sanitation and water
supply policies of local municipalities were reviewed on a national scale.1 Review of the water
policy of the Kwandebele region uncovered the fact that expending a large capital for drawing water
from Great Dry Dam was unnecessary. Hence, the project was cancelled in 2000. As a result of the
policy change of the country, the jurisdiction of water supply was planned to be transferred from
Ministry of Water Affairs (DWAF) to local municipalities. But since the local governments had not
been established, and organizations to assume the role of water service provider (WSP) in the region
were nonexistent, Ikangala Water Board (IWB) was organized as a body to implement the
installation of water supply infrastructure and the operation and maintenance of the facilities. At the
time of ex-post evaluation (2006), the DWAF was providing IWB with personnel and financial
support. However, they were insufficient. The local municipalities had not entered into a water
supply agreement with IWB, and payments for water supply were not being made. Based upon the
fact that the IWB had not employed any engineers, and the resignation of CEO and five members of
the management staff, it was judged that IWB was lacking the capacity to sustain the water supply
service. There was concern over the sustainability over the project, as the capacity was insufficient to
effectively utilize the facilities installed by this project and satisfy the water needs for the region.
Under these circumstances, in the ex-post evaluation report, recommendations were made to Japan
International Cooperation Agency (JICA) to organize the problems, carefully analyze the situation,
and apply the lessons learned from this project to future project formation. Recommendation was
also made to the South African local governments to establish relations with appropriate Water
Service Providers (WSP) as Water Service Authority (WSA) as soon as possible.
Therefore, this project was selected for ex-post monitoring and reviewed under each criterion with
the findings from the field survey and other research activities with a final conclusion being drawn.
1 (1) Water Services Authority (WSA): Functions of administration, planning, and regulations
concerning water supply services (it was stipulated that the local municipalities having jurisdiction over each service area shall serve as WSAs) (2) Water Services Provider (WSP): Functions of designing, construction, ownership, operation, maintenance and customer relations concerning water supply services
7-3
2. Outline of the Monitoring Study
2.1 External Monitoring Consultant
Katsumi Matsuyama (Nakamoto & Associates Co., Ltd.)
2.2 Duration of Monitoring Study
Duration of the Study: September 2012 – June 2013
Duration of the Field Study: November 16, 2012 – November 24, 2012
2.3 Constraints During the Monitoring Study
At the time of the appraisal of this project in 1996, current Western Highveld region (former
Kwandebele region) represented an administrative area of former homeland. However, according to
the interview with DWAF, Western Highveld is merely a name for the historical region, in which,
currently, its boundary passes through four local municipalities (There were five municipalities at the
time of ex-post evaluation. The municipalities were reorganized subsequently). The region name is
used by the water suppliers for the operation of the facilities, since multiple municipalities share the
facilities within the region. The water supplied by the facility is utilized by municipalities inside and
outside of the region.

7-4
Source: Reference obtained from Japan International Cooperation Agency (JICA) MM (Metropolitan Municipality): administrative body of metropolitan area. Also holds authority as regional district municipality. DM (District Municipality): administrative organization under the state and above LM LM (Local Municipality): administrative organization under DM. Lowest in the hierarchy of administrative bodies.
Figure 1 Western Highveld Region
This study revealed that the data pertaining to this area does not exist, since Western Highveld
region is neither a name of an administrative district nor a collection of administrative districts.
Western Highveld is a region designated for the purpose of operating the water service facilities, and
its boundary passes through parts of the four neighboring local municipalities.
Since Western Highveld is not an administrative district, water supply and consumption data
pertaining to this particular region could not be obtained. Therefore, efforts were made to obtain
alternative data which are comparable to the ex-post evaluation.
3. Monitoring Results
3.1 Effectiveness
3.1.1 Quantitative Effects
3.1.1.1 Results from Operation and Effect Indicators
(1) Volume of Water Supply and Water Supplied Population
According to "Blue Drop Report 2011" issued by DWAF, the water-supplied populations of four
municipalities, which are partially a part of Western Highveld (Greater Sekhukhune, Dr. JS Moroka,
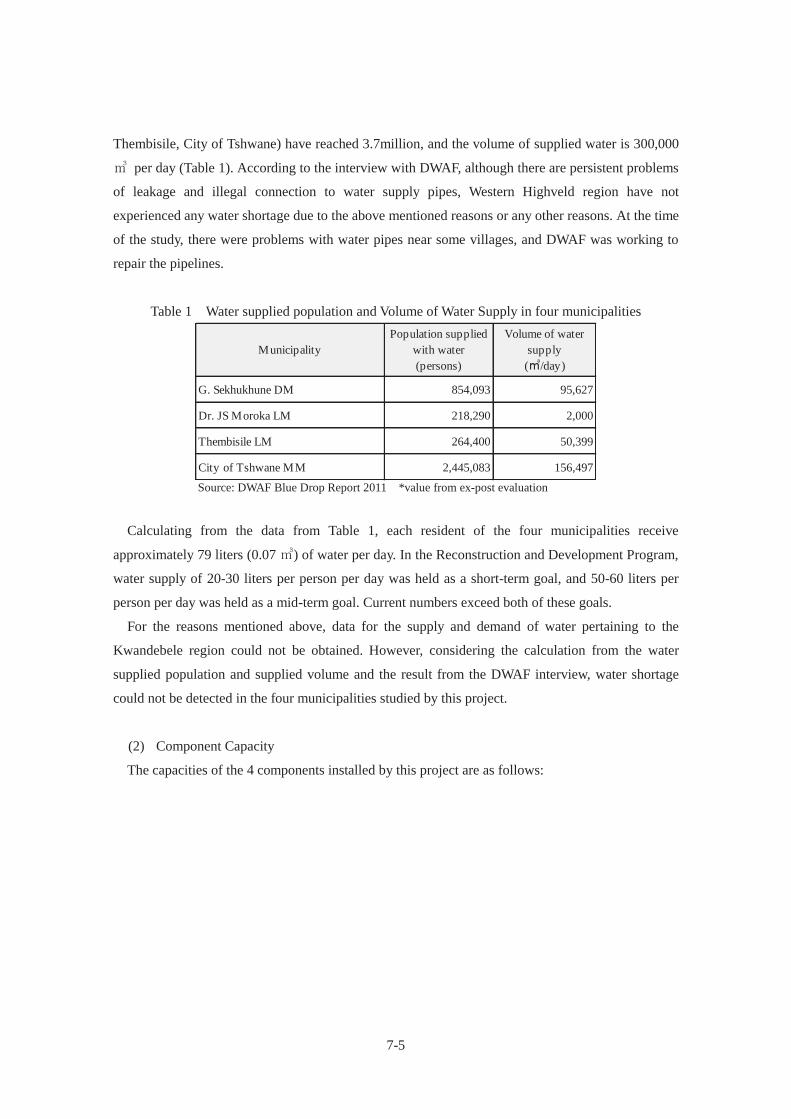
7-5
Thembisile, City of Tshwane) have reached 3.7million, and the volume of supplied water is 300,000
per day (Table 1). According to the interview with DWAF, although there are persistent problems
of leakage and illegal connection to water supply pipes, Western Highveld region have not
experienced any water shortage due to the above mentioned reasons or any other reasons. At the time
of the study, there were problems with water pipes near some villages, and DWAF was working to
repair the pipelines.
Table 1 Water supplied population and Volume of Water Supply in four municipalities
Source: DWAF Blue Drop Report 2011 *value from ex-post evaluation
Calculating from the data from Table 1, each resident of the four municipalities receive
approximately 79 liters (0.07 ) of water per day. In the Reconstruction and Development Program,
water supply of 20-30 liters per person per day was held as a short-term goal, and 50-60 liters per
person per day was held as a mid-term goal. Current numbers exceed both of these goals.
For the reasons mentioned above, data for the supply and demand of water pertaining to the
Kwandebele region could not be obtained. However, considering the calculation from the water
supplied population and supplied volume and the result from the DWAF interview, water shortage
could not be detected in the four municipalities studied by this project.
(2) Component Capacity
The capacities of the 4 components installed by this project are as follows:
MunicipalityPopulation supplied
with water(persons)
Volume of watersupply( /day)
G. Sekhukhune DM 854,093 95,627
Dr. JS Moroka LM 218,290 2,000
Thembisile LM 264,400 50,399
City of Tshwane MM 2,445,083 156,497
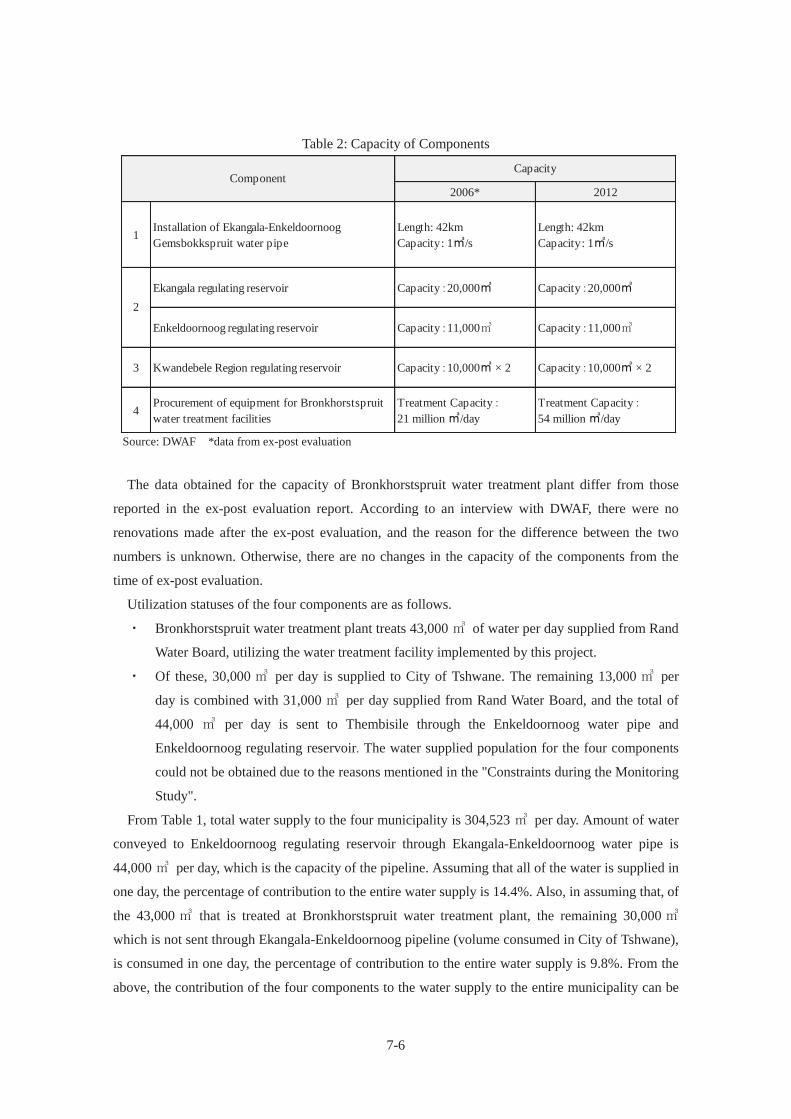
7-6
Table 2: Capacity of Components
Source: DWAF *data from ex-post evaluation
The data obtained for the capacity of Bronkhorstspruit water treatment plant differ from those
reported in the ex-post evaluation report. According to an interview with DWAF, there were no
renovations made after the ex-post evaluation, and the reason for the difference between the two
numbers is unknown. Otherwise, there are no changes in the capacity of the components from the
time of ex-post evaluation.
Utilization statuses of the four components are as follows.
Bronkhorstspruit water treatment plant treats 43,000 of water per day supplied from Rand
Water Board, utilizing the water treatment facility implemented by this project.
Of these, 30,000 per day is supplied to City of Tshwane. The remaining 13,000 per
day is combined with 31,000 per day supplied from Rand Water Board, and the total of
44,000 per day is sent to Thembisile through the Enkeldoornoog water pipe and
Enkeldoornoog regulating reservoir. The water supplied population for the four components
could not be obtained due to the reasons mentioned in the "Constraints during the Monitoring
Study".
From Table 1, total water supply to the four municipality is 304,523 per day. Amount of water
conveyed to Enkeldoornoog regulating reservoir through Ekangala-Enkeldoornoog water pipe is
44,000 per day, which is the capacity of the pipeline. Assuming that all of the water is supplied in
one day, the percentage of contribution to the entire water supply is 14.4%. Also, in assuming that, of
the 43,000 that is treated at Bronkhorstspruit water treatment plant, the remaining 30,000
which is not sent through Ekangala-Enkeldoornoog pipeline (volume consumed in City of Tshwane),
is consumed in one day, the percentage of contribution to the entire water supply is 9.8%. From the
above, the contribution of the four components to the water supply to the entire municipality can be
2006* 2012
1Installation of Ekangala-EnkeldoornoogGemsbokkspruit water pipe
Length: 42kmCapacity: 1 /s
Length: 42kmCapacity: 1 /s
Ekangala regulating reservoir Capacity 20,000 Capacity 20,000
Enkeldoornoog regulating reservoir Capacity 11,000 Capacity 11,000
3 Kwandebele Region regulating reservoir Capacity 10,000 × 2 Capacity 10,000 × 2
4Procurement of equipment for Bronkhorstspruitwater treatment facilities
Treatment Capacity21 million /day
Treatment Capacity54 million /day
Capacity
2
Component
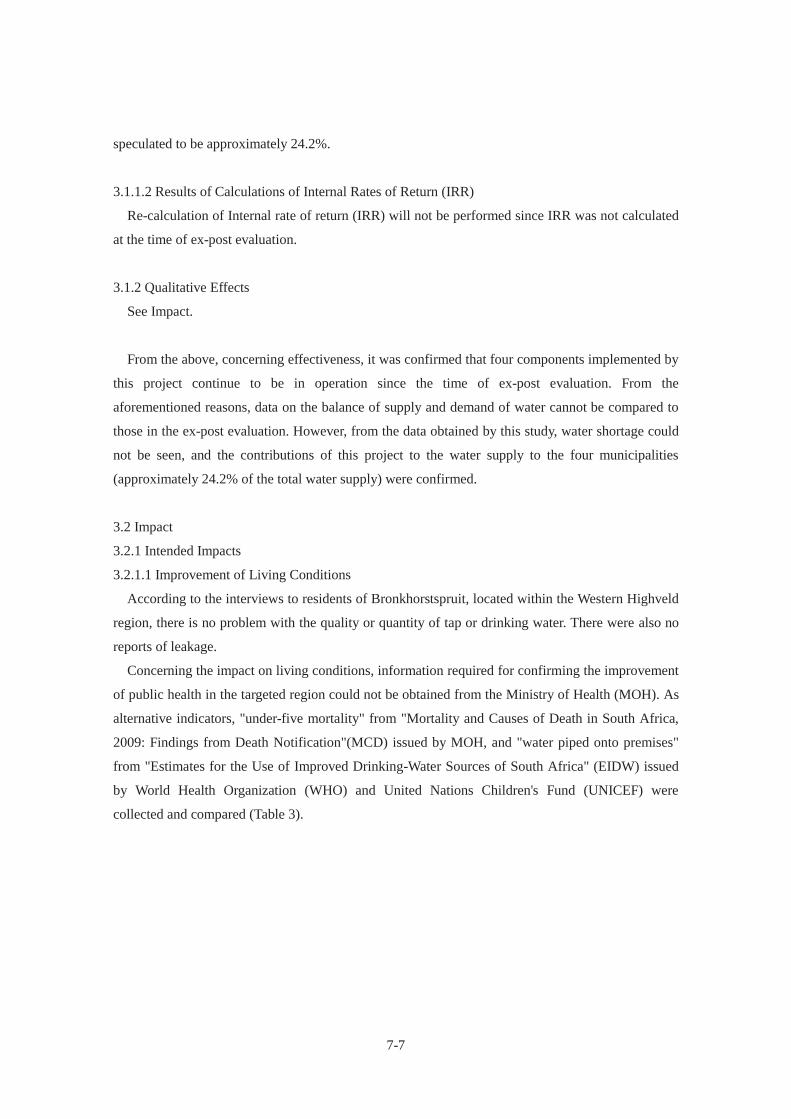
7-7
speculated to be approximately 24.2%.
3.1.1.2 Results of Calculations of Internal Rates of Return (IRR)
Re-calculation of Internal rate of return (IRR) will not be performed since IRR was not calculated
at the time of ex-post evaluation.
3.1.2 Qualitative Effects
See Impact.
From the above, concerning effectiveness, it was confirmed that four components implemented by
this project continue to be in operation since the time of ex-post evaluation. From the
aforementioned reasons, data on the balance of supply and demand of water cannot be compared to
those in the ex-post evaluation. However, from the data obtained by this study, water shortage could
not be seen, and the contributions of this project to the water supply to the four municipalities
(approximately 24.2% of the total water supply) were confirmed.
3.2 Impact
3.2.1 Intended Impacts
3.2.1.1 Improvement of Living Conditions
According to the interviews to residents of Bronkhorstspruit, located within the Western Highveld
region, there is no problem with the quality or quantity of tap or drinking water. There were also no
reports of leakage.
Concerning the impact on living conditions, information required for confirming the improvement
of public health in the targeted region could not be obtained from the Ministry of Health (MOH). As
alternative indicators, "under-five mortality" from "Mortality and Causes of Death in South Africa,
2009: Findings from Death Notification"(MCD) issued by MOH, and "water piped onto premises"
from "Estimates for the Use of Improved Drinking-Water Sources of South Africa" (EIDW) issued
by World Health Organization (WHO) and United Nations Children's Fund (UNICEF) were
collected and compared (Table 3).
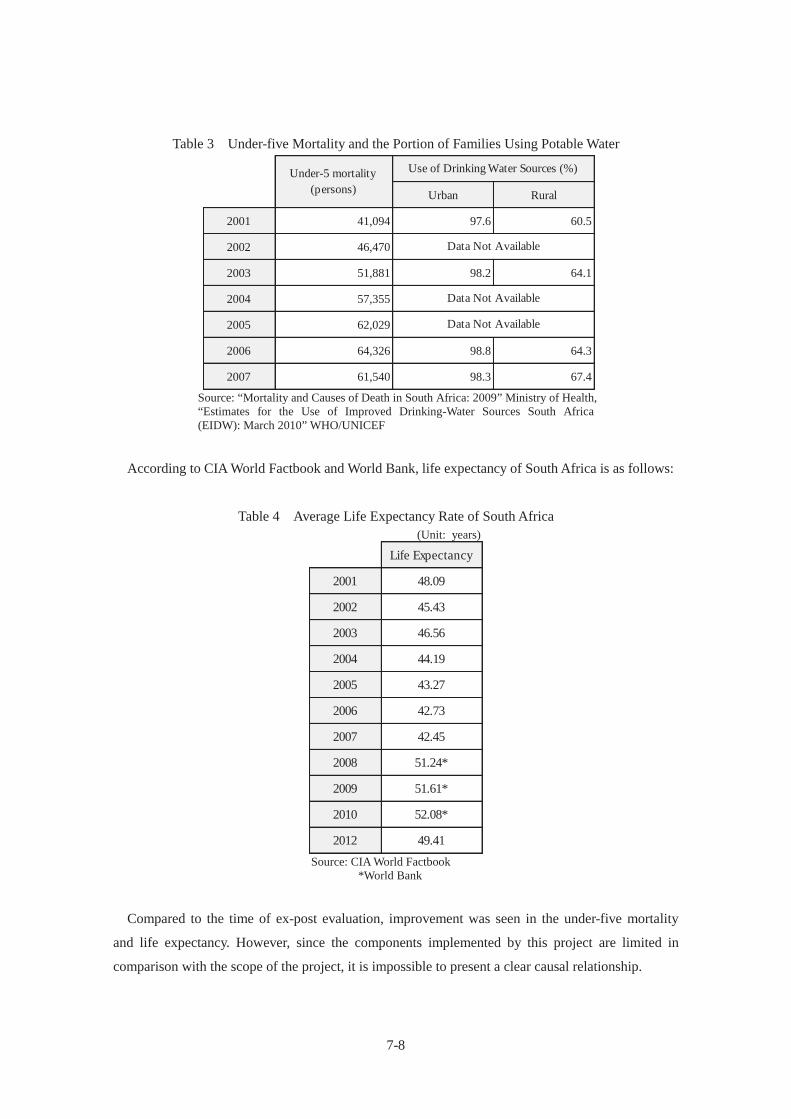
7-8
Table 3 Under-five Mortality and the Portion of Families Using Potable Water
Source: “Mortality and Causes of Death in South Africa: 2009” Ministry of Health, “Estimates for the Use of Improved Drinking-Water Sources South Africa (EIDW): March 2010” WHO/UNICEF
According to CIA World Factbook and World Bank, life expectancy of South Africa is as follows:
Table 4 Average Life Expectancy Rate of South Africa (Unit: years)
Source: CIA World Factbook
*World Bank
Compared to the time of ex-post evaluation, improvement was seen in the under-five mortality
and life expectancy. However, since the components implemented by this project are limited in
comparison with the scope of the project, it is impossible to present a clear causal relationship.
Urban Rural
2001 41,094 97.6 60.5
2002 46,470
2003 51,881 98.2 64.1
2004 57,355
2005 62,029
2006 64,326 98.8 64.3
2007 61,540 98.3 67.4
Data Not Available
Under-5 mortality(persons)
Use of Drinking Water Sources (%)
Data Not Available
Data Not Available
Life Expectancy
2001 48.09
2002 45.43
2003 46.56
2004 44.19
2005 43.27
2006 42.73
2007 42.45
2008 51.24*
2009 51.61*
2010 52.08*
2012 49.41
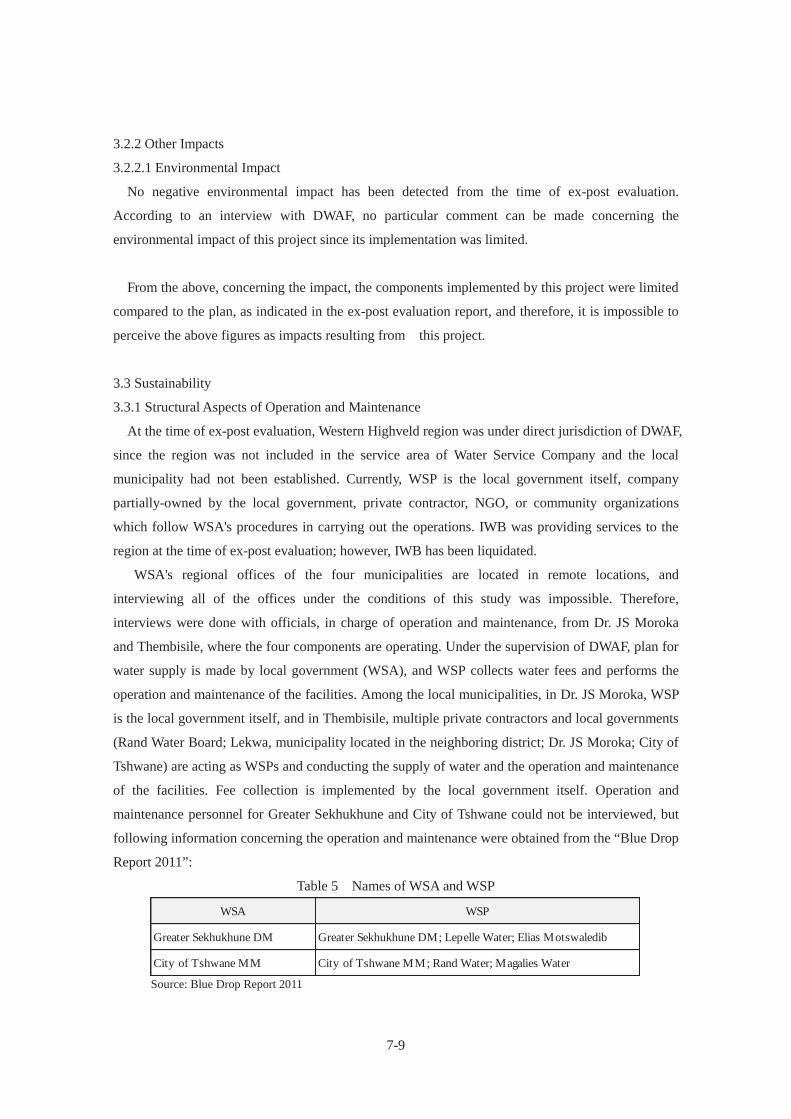
7-9
3.2.2 Other Impacts
3.2.2.1 Environmental Impact
No negative environmental impact has been detected from the time of ex-post evaluation.
According to an interview with DWAF, no particular comment can be made concerning the
environmental impact of this project since its implementation was limited.
From the above, concerning the impact, the components implemented by this project were limited
compared to the plan, as indicated in the ex-post evaluation report, and therefore, it is impossible to
perceive the above figures as impacts resulting from this project.
3.3 Sustainability
3.3.1 Structural Aspects of Operation and Maintenance
At the time of ex-post evaluation, Western Highveld region was under direct jurisdiction of DWAF,
since the region was not included in the service area of Water Service Company and the local
municipality had not been established. Currently, WSP is the local government itself, company
partially-owned by the local government, private contractor, NGO, or community organizations
which follow WSA's procedures in carrying out the operations. IWB was providing services to the
region at the time of ex-post evaluation; however, IWB has been liquidated.
WSA's regional offices of the four municipalities are located in remote locations, and
interviewing all of the offices under the conditions of this study was impossible. Therefore,
interviews were done with officials, in charge of operation and maintenance, from Dr. JS Moroka
and Thembisile, where the four components are operating. Under the supervision of DWAF, plan for
water supply is made by local government (WSA), and WSP collects water fees and performs the
operation and maintenance of the facilities. Among the local municipalities, in Dr. JS Moroka, WSP
is the local government itself, and in Thembisile, multiple private contractors and local governments
(Rand Water Board; Lekwa, municipality located in the neighboring district; Dr. JS Moroka; City of
Tshwane) are acting as WSPs and conducting the supply of water and the operation and maintenance
of the facilities. Fee collection is implemented by the local government itself. Operation and
maintenance personnel for Greater Sekhukhune and City of Tshwane could not be interviewed, but
following information concerning the operation and maintenance were obtained from the “Blue Drop
Report 2011”:
Table 5 Names of WSA and WSP
Source: Blue Drop Report 2011
WSA WSP
Greater Sekhukhune DM Greater Sekhukhune DM; Lepelle Water; Elias Motswaledib
City of Tshwane MM City of Tshwane MM; Rand Water; Magalies Water
7-10
In the ex-post evaluation, concern was shown over the relationship between the IWB, which was
the WSP, and the local municipality. However, the IWB has already been liquidated, and service
agreement between WSA and WSP is stable. The contract is renewed every year. Information on the
number of workers could not be obtained, but through an interview with the officials in charge of
operation and maintenance at Thembisile and Dr. JS Moroka, there are no shortages of workers.
Every year, DWAF conducts an audit targeting all WSAs over water quality, maintenance status of
the facilities, and management structure, and publishes the results as the “Blue Drop Report”.
Municipality with a high score receives an award. Similar audit is also done for sewage treatment,
and the results are published annually as the “Green Drop Report”. The water service framework of
DWAF-WSA-WSP is currently established throughout the country. Under these circumstances,
DWAF conducts audit and rating to each WSA, and the results are disclosed to the public. This
procedure has been carried out for the past several years. Therefore, it can be concluded that the
operation and maintenance structure has improved since the time of ex-post evaluation.
According to an interview with DWAF, concerning the operation and maintenance structure of the
four municipalities, imbalance in the supply and demand of water has been recognized as a common
problem. Intake of water is ultimately twice the volume of consumed water. In other words, treated
water is twice the amount of the water demand, and there exists an imbalance. The causes of this
imbalance are: lack of technical knowledge to draft a plan and control the volume of intake based on
ascertained demand volume of water, inefficiency of water treatment facilities due to deterioration
and leaks from water pipes, and the consumer's low awareness towards economizing water
consumption. In order to improve the situation, WSA is working to repair the failing facilities and
educating the consumers on water economy through seminars and pamphlets.
Although adequate system for operation and maintenance is organized, there is still room for
improvement in water economy such as, systematic planning of water supplier, facility improvement,
and educating and raising public awareness on water economy.
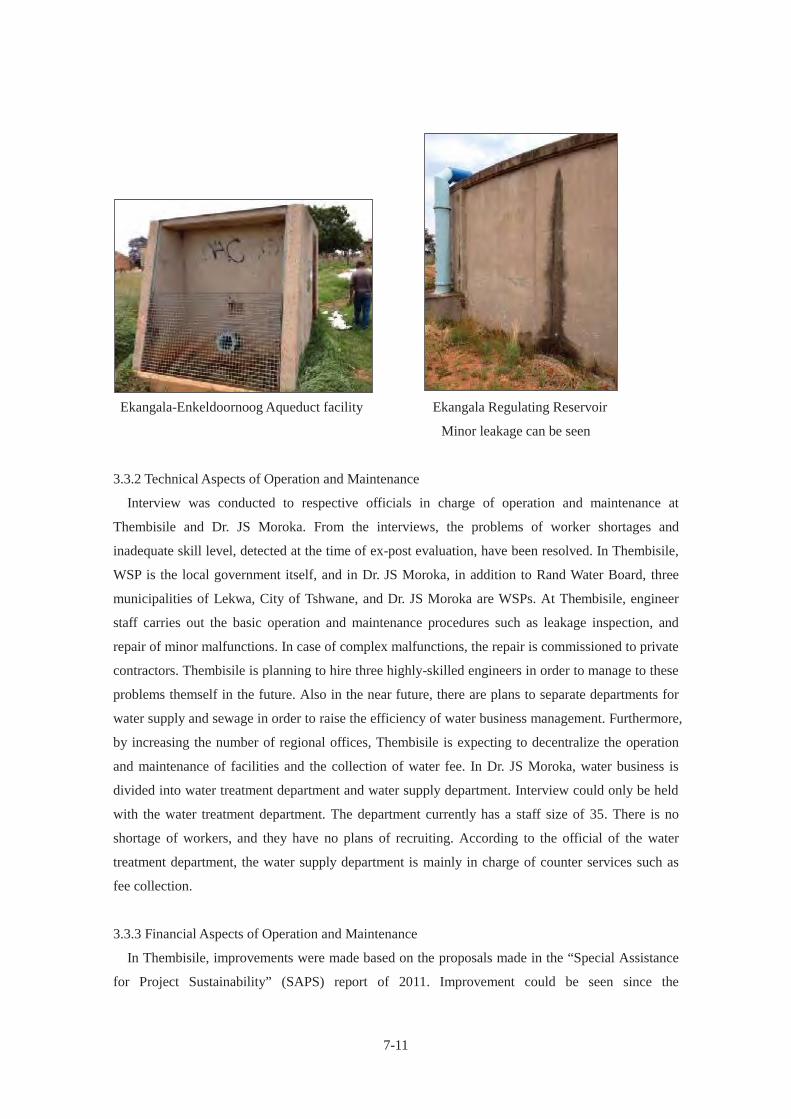
7-11
Ekangala-Enkeldoornoog Aqueduct facility Ekangala Regulating Reservoir
Minor leakage can be seen
3.3.2 Technical Aspects of Operation and Maintenance
Interview was conducted to respective officials in charge of operation and maintenance at
Thembisile and Dr. JS Moroka. From the interviews, the problems of worker shortages and
inadequate skill level, detected at the time of ex-post evaluation, have been resolved. In Thembisile,
WSP is the local government itself, and in Dr. JS Moroka, in addition to Rand Water Board, three
municipalities of Lekwa, City of Tshwane, and Dr. JS Moroka are WSPs. At Thembisile, engineer
staff carries out the basic operation and maintenance procedures such as leakage inspection, and
repair of minor malfunctions. In case of complex malfunctions, the repair is commissioned to private
contractors. Thembisile is planning to hire three highly-skilled engineers in order to manage to these
problems themself in the future. Also in the near future, there are plans to separate departments for
water supply and sewage in order to raise the efficiency of water business management. Furthermore,
by increasing the number of regional offices, Thembisile is expecting to decentralize the operation
and maintenance of facilities and the collection of water fee. In Dr. JS Moroka, water business is
divided into water treatment department and water supply department. Interview could only be held
with the water treatment department. The department currently has a staff size of 35. There is no
shortage of workers, and they have no plans of recruiting. According to the official of the water
treatment department, the water supply department is mainly in charge of counter services such as
fee collection.
3.3.3 Financial Aspects of Operation and Maintenance
In Thembisile, improvements were made based on the proposals made in the “Special Assistance
for Project Sustainability” (SAPS) report of 2011. Improvement could be seen since the
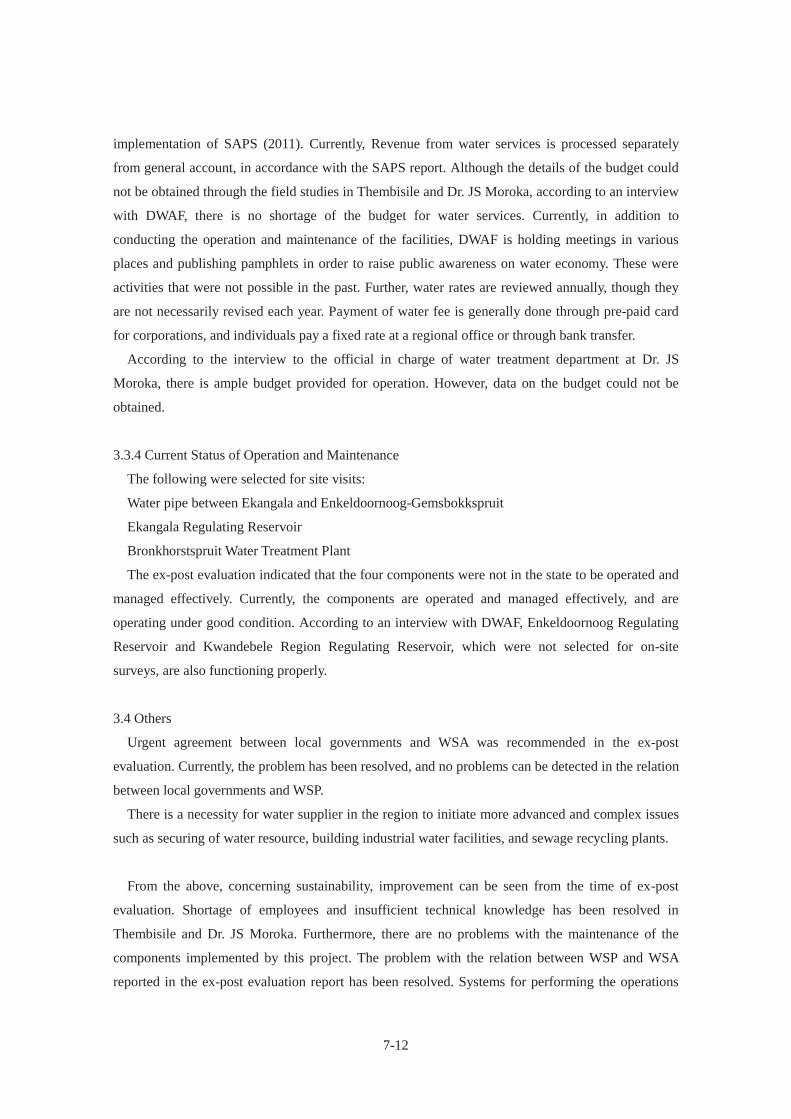
7-12
implementation of SAPS (2011). Currently, Revenue from water services is processed separately
from general account, in accordance with the SAPS report. Although the details of the budget could
not be obtained through the field studies in Thembisile and Dr. JS Moroka, according to an interview
with DWAF, there is no shortage of the budget for water services. Currently, in addition to
conducting the operation and maintenance of the facilities, DWAF is holding meetings in various
places and publishing pamphlets in order to raise public awareness on water economy. These were
activities that were not possible in the past. Further, water rates are reviewed annually, though they
are not necessarily revised each year. Payment of water fee is generally done through pre-paid card
for corporations, and individuals pay a fixed rate at a regional office or through bank transfer.
According to the interview to the official in charge of water treatment department at Dr. JS
Moroka, there is ample budget provided for operation. However, data on the budget could not be
obtained.
3.3.4 Current Status of Operation and Maintenance
The following were selected for site visits:
Water pipe between Ekangala and Enkeldoornoog-Gemsbokkspruit
Ekangala Regulating Reservoir
Bronkhorstspruit Water Treatment Plant
The ex-post evaluation indicated that the four components were not in the state to be operated and
managed effectively. Currently, the components are operated and managed effectively, and are
operating under good condition. According to an interview with DWAF, Enkeldoornoog Regulating
Reservoir and Kwandebele Region Regulating Reservoir, which were not selected for on-site
surveys, are also functioning properly.
3.4 Others
Urgent agreement between local governments and WSA was recommended in the ex-post
evaluation. Currently, the problem has been resolved, and no problems can be detected in the relation
between local governments and WSP.
There is a necessity for water supplier in the region to initiate more advanced and complex issues
such as securing of water resource, building industrial water facilities, and sewage recycling plants.
From the above, concerning sustainability, improvement can be seen from the time of ex-post
evaluation. Shortage of employees and insufficient technical knowledge has been resolved in
Thembisile and Dr. JS Moroka. Furthermore, there are no problems with the maintenance of the
components implemented by this project. The problem with the relation between WSP and WSA
reported in the ex-post evaluation report has been resolved. Systems for performing the operations

7-13
are established between DWAF, WSA, and WSP and functioning satisfactorily. However, since there
are problems such as the volume of water intake far exceeding the demand, there is still room for
improvement.
4. Conclusion, Lessons Learned and Recommendations
4.1 Conclusion
(1) Utilization and Contribution of Implemented Components
Four components installed by this project are operating in satisfactory condition, and provides
24% of the total water supply to the four municipalities which are part of Western Highveld region.
The components are serving a role in fulfilling the water demand of the region. However, since only
a limited portion of the planned components has been implemented, the project's contribution to the
improvement of living environment and industrial development was unclear.
WSA of Thembisile and Dr. JS Moroka have ample personnel and the maintenance of the facilities
was adequately performed. In addition, accounting issues identified by the SAPS report have been
addressed. According to the interviews to the officials of each region, sufficient budget is secured for
the operation and maintenance expenses.
This project was terminated without the implementation of all planned components. Since ex-post
evaluation was conducted based upon the evaluation plan to evaluate all of the planned components,
this ex-monitoring was also conducted under the same premises. Therefore, there were many
difficulties in the verification of the direct effects of this project and analyses of information. Under
these circumstances, the following conclusion was drawn. Although the installed component
provides 24%, which is only a portion, of the volume of water demand of the region, no water
shortage could be seen in the region. Therefore, there is a possibility that the original plan for water
intake was too large.
(2) Situation of Local Government
Local government is functioning as WSA, but there are recommendations described in the
following sections.
(3) Operation and Maintenance
Although there are no problems with water supply to the Western Highveld Region with respect to
the region’s water demand, there are recommendations described in the following section.
4.2 Recommendations
4.2.1 Recommendation to WSA
WSA has currently initiated a reparation project with Rand Water Board to replace corroded water
7-14
pipes as indicated in the SAPS report. It is desirable to continue to ensure future repairs and extend
the lifespan of the components.
4.2.2 Recommendation to DWAF and the Government of South Africa
1. It is desirable to continue to provide adequate budgetary measures and guidance on the
operation and maintenance, including the maintenance of facilities, to the water suppliers of local
municipalities. Also, as mentioned in the SAPS report, DWAF is expected to take initiative in
combining WSAs and organizing the joint management of water supply facilities, which is currently
being managed by individual WSAs.
2. South Africa's water service environment has changed considerably from the 1990s. Actions
toward problems resulting from economic development such as, preventing water resources
pollution, securing industrial water and construction of water treatment facilities, installation of
sewage pipelines as a premise of the increase in flush toilets from improved living standards,
securing a dependable water source to respond to the progression of desertification need to be
addressed promptly with central government and local government as a team. Meanwhile, DWAF
and municipalities are aware of their technical inability and insufficient management knowledge to
solve these problems. It is desirable therefore to strengthen the cooperation with other countries to
obtain the necessary technology and knowledge.
4.3 Lessons Learned
None.
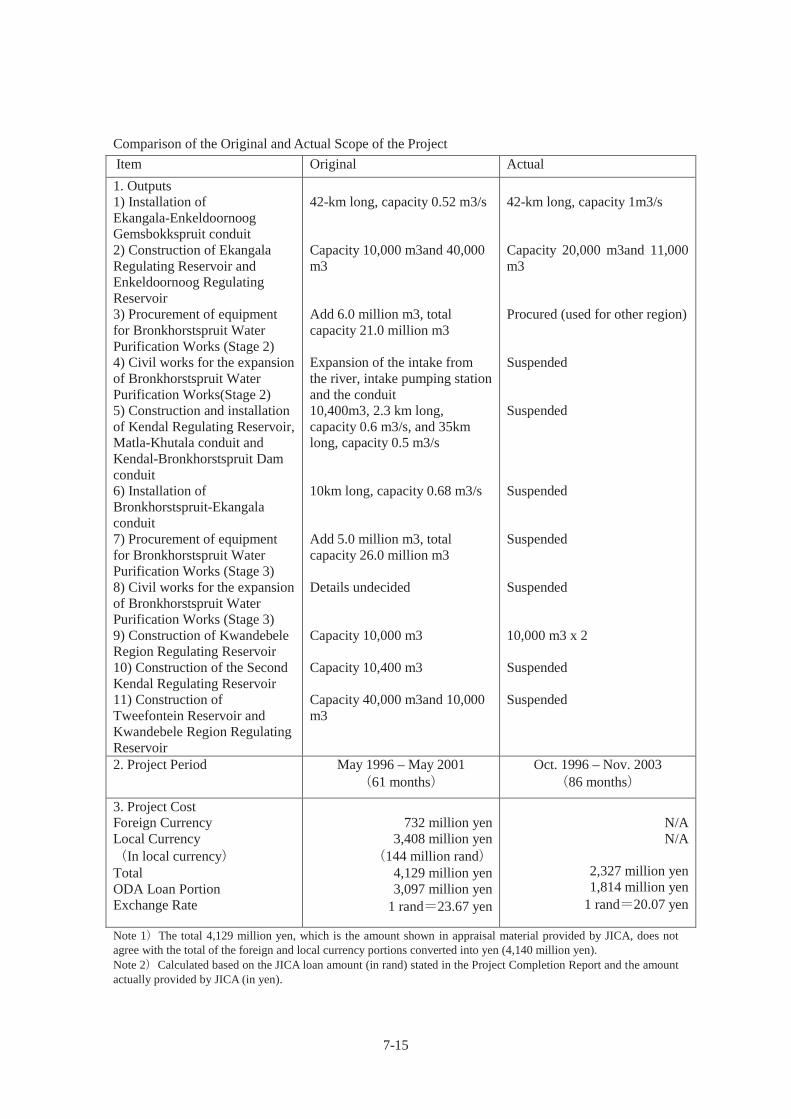
7-15
Comparison of the Original and Actual Scope of the Project Item Original Actual 1. Outputs 1) Installation of Ekangala-Enkeldoornoog Gemsbokkspruit conduit 2) Construction of Ekangala Regulating Reservoir and Enkeldoornoog Regulating Reservoir 3) Procurement of equipment for Bronkhorstspruit Water Purification Works (Stage 2) 4) Civil works for the expansion of Bronkhorstspruit Water Purification Works(Stage 2) 5) Construction and installation of Kendal Regulating Reservoir, Matla-Khutala conduit and Kendal-Bronkhorstspruit Dam conduit 6) Installation of Bronkhorstspruit-Ekangala conduit 7) Procurement of equipment for Bronkhorstspruit Water Purification Works (Stage 3) 8) Civil works for the expansion of Bronkhorstspruit Water Purification Works (Stage 3) 9) Construction of Kwandebele Region Regulating Reservoir 10) Construction of the Second Kendal Regulating Reservoir 11) Construction of Tweefontein Reservoir and Kwandebele Region Regulating Reservoir
42-km long, capacity 0.52 m3/s Capacity 10,000 m3and 40,000 m3 Add 6.0 million m3, total capacity 21.0 million m3 Expansion of the intake from the river, intake pumping station and the conduit 10,400m3, 2.3 km long, capacity 0.6 m3/s, and 35km long, capacity 0.5 m3/s 10km long, capacity 0.68 m3/s Add 5.0 million m3, total capacity 26.0 million m3 Details undecided Capacity 10,000 m3 Capacity 10,400 m3 Capacity 40,000 m3and 10,000 m3
42-km long, capacity 1m3/s Capacity 20,000 m3and 11,000 m3 Procured (used for other region) Suspended Suspended Suspended Suspended Suspended 10,000 m3 x 2 Suspended Suspended
2. Project Period May 1996 – May 2001 61 months
Oct. 1996 – Nov. 2003 86 months
3. Project Cost Foreign Currency Local Currency
In local currency Total ODA Loan Portion Exchange Rate
732 million yen
3,408 million yen 144 million rand
4,129 million yen 3,097 million yen
1 rand 23.67 yen
N/A N/A
2,327 million yen 1,814 million yen
1 rand 20.07 yen
Note 1 The total 4,129 million yen, which is the amount shown in appraisal material provided by JICA, does not agree with the total of the foreign and local currency portions converted into yen (4,140 million yen). Note 2 Calculated based on the JICA loan amount (in rand) stated in the Project Completion Report and the amount actually provided by JICA (in yen).

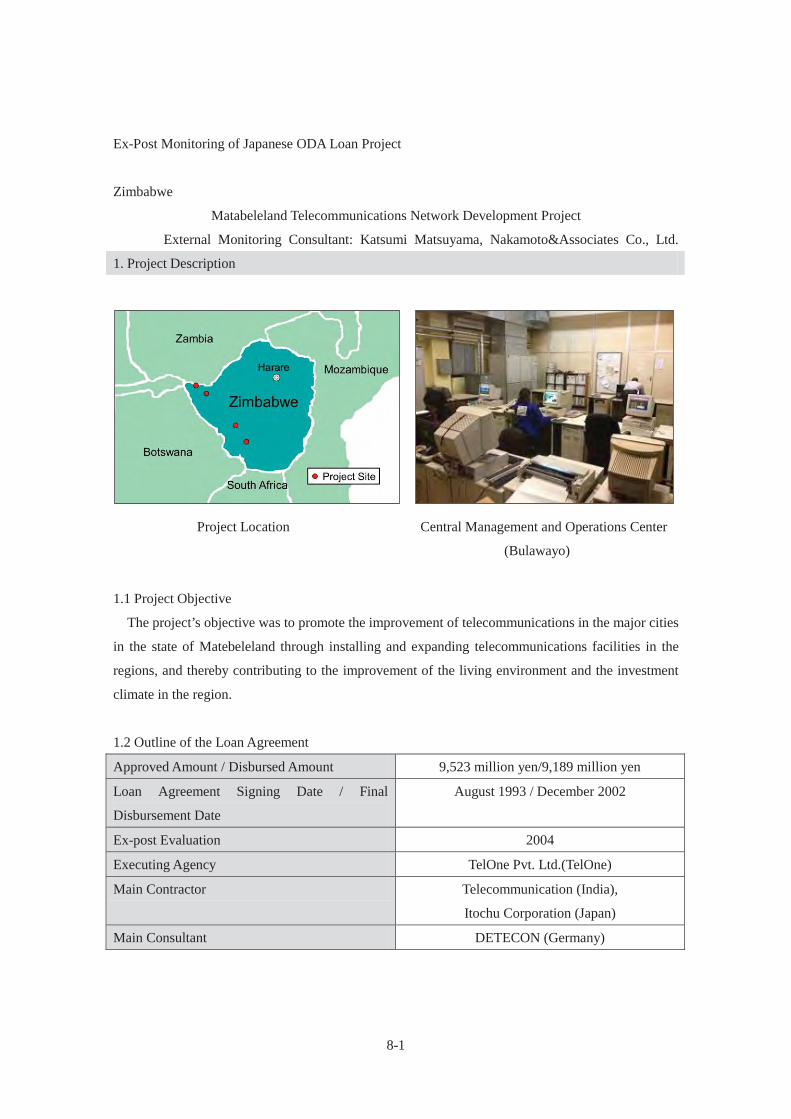
8-1
Ex-Post Monitoring of Japanese ODA Loan Project
Zimbabwe
Matabeleland Telecommunications Network Development Project
External Monitoring Consultant: Katsumi Matsuyama, Nakamoto&Associates Co., Ltd.
1. Project Description
Project Location Central Management and Operations Center
(Bulawayo)
1.1 Project Objective
The project’s objective was to promote the improvement of telecommunications in the major cities
in the state of Matebeleland through installing and expanding telecommunications facilities in the
regions, and thereby contributing to the improvement of the living environment and the investment
climate in the region.
1.2 Outline of the Loan Agreement
Approved Amount / Disbursed Amount 9,523 million yen/9,189 million yen
Loan Agreement Signing Date / Final
Disbursement Date
August 1993 / December 2002
Ex-post Evaluation 2004
Executing Agency TelOne Pvt. Ltd.(TelOne)
Main Contractor Telecommunication (India),
Itochu Corporation (Japan)
Main Consultant DETECON (Germany)
8-2
1.3 Background of Ex-post Monitoring
The state of Matebeleland (cf. approximately three times the size of Kyushu in Japan) is located in
southwestern Zimbabwe, and its capital city of Bulawayo (population 500,000 in 1993 appraisal (cf.
nearly the same size at Matsuyama City in Aichi Prefecture in Japan)) is the second largest city in
the country. Matebeleland was a region central to the support of the country’s thriving processing
industry and manufacturing industry. However, at the time of the appraisal, the existing
communications facilities including the switchboards, transmission lines, and subscriber cables were
conspicuously aged. Moreover, there were as many as 23,700 telephone service applications on the
waiting list, which amounted to approximately 30% of the entire domestic waiting list for telephone
service. Thus, improvement of telecommunications was an important issue for the development of
the industrial infrastructure in the state. Thus, this project installed and expanded
telecommunications network in Matabeleland's Bulawayo and surrounding cities.
At the time of ex-post evaluation (2004) several problems were pointed out as there was an
outflow of workers and difficulty obtaining spare parts. Also, there were concerns over the
sustainability of the project. TelOne incurred losses of 184 billion Zimbabwe dollars due to the
inflation which occurred as a result of economic downturn.
Therefore, this project was selected for ex-post monitoring and reviewed under each criterion with
the findings from the field survey and other research activities with a final conclusion being drawn.
2. Outline of the Monitoring Study
2.1 External Monitoring Consultant
Katsumi Matsuyama (Nakamoto & Associates Co., Ltd.)
2.2 Duration of Monitoring Study
Duration of the Study: September 2012 – June 2013
Duration of the Field Study: November 24, 2012 – December 5, 2012
3. Monitoring Results
3.1 Effectiveness
3.1.1 Quantitative Effects
3.1.1.1 Operation and Effect Indicators
(1) Number of Subscriber Cables
The number of subscriber cables has increased from the time of ex-post evaluation. However, as
shown in Table 1, the number has declined since 2009. According to the interview with TelOne, this
is due to customer outflow by the spread of cell-phones.
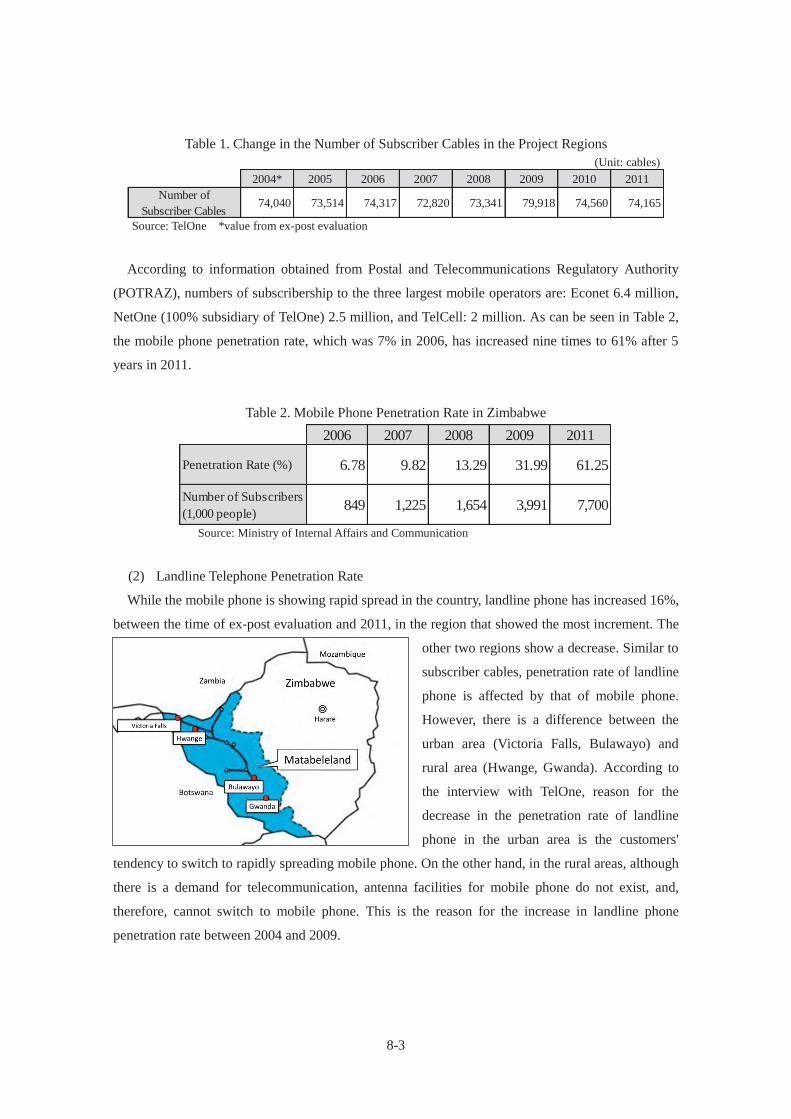
8-3
Table 1. Change in the Number of Subscriber Cables in the Project Regions (Unit: cables)
Source: TelOne *value from ex-post evaluation
According to information obtained from Postal and Telecommunications Regulatory Authority
(POTRAZ), numbers of subscribership to the three largest mobile operators are: Econet 6.4 million,
NetOne (100% subsidiary of TelOne) 2.5 million, and TelCell: 2 million. As can be seen in Table 2,
the mobile phone penetration rate, which was 7% in 2006, has increased nine times to 61% after 5
years in 2011.
Table 2. Mobile Phone Penetration Rate in Zimbabwe
Source: Ministry of Internal Affairs and Communication
(2) Landline Telephone Penetration Rate
While the mobile phone is showing rapid spread in the country, landline phone has increased 16%,
between the time of ex-post evaluation and 2011, in the region that showed the most increment. The
other two regions show a decrease. Similar to
subscriber cables, penetration rate of landline
phone is affected by that of mobile phone.
However, there is a difference between the
urban area (Victoria Falls, Bulawayo) and
rural area (Hwange, Gwanda). According to
the interview with TelOne, reason for the
decrease in the penetration rate of landline
phone in the urban area is the customers'
tendency to switch to rapidly spreading mobile phone. On the other hand, in the rural areas, although
there is a demand for telecommunication, antenna facilities for mobile phone do not exist, and,
therefore, cannot switch to mobile phone. This is the reason for the increase in landline phone
penetration rate between 2004 and 2009.
2004* 2005 2006 2007 2008 2009 2010 2011Number of
Subscriber Cables74,040 73,514 74,317 72,820 73,341 79,918 74,560 74,165
2006 2007 2008 2009 2011
Penetration Rate (%) 6.78 9.82 13.29 31.99 61.25
Number of Subscribers(1,000 people) 849 1,225 1,654 3,991 7,700
8-4
Table 3. Landline Telephone Penetration Rate in Zimbabwe (Unit: %)
Source: TelOne *value from ex-post evaluation
(3) Number of Lines on the Waiting List
According to the interview with TelOne, the number of lines on the waiting list from 2005 to 2011
is zero. Since the source of the numbers cannot be identified, it is unknown whether the number of
lines on the waiting list was completely solved in 2005, or the number obtained in the ex-post
evaluation was erroneous. Reason for the zero number of waiting lines is the fact that there is still
reserve capacity in the switchboards, although the penetration rate of landline phones are rising in
the rural areas. In addition, it can be conjectured that the decrease in the penetration rate of landline
phones in the urban area has led to a decrease in the required number of subscriber cables.
(4) Switchboard Usage Rate
Switchboard Usage Rate is shown in Table 4. The average switchboard usage rates for the targeted
four regions have decreased since the time of ex-post evaluation. The fact that the numbers decline
after reaching its peak in 2009 reflects the decrease seen in the number of subscriber cables.
Improvement could be seen in the delay in the laying of landlines, which was indicated in the
ex-post evaluation report. After 2004, extension was made to the cable facility, and, compared to
before, connection area has been extended.
Table 4. Switchboard Usage Rate (Unit: %)
Source: TelOne *value from ex-post evaluation
2004* 2009 2010 2011Difference
(2004-2011)
Victoria Falls 14.8 17.0 10.7 9.6 -5.2
Bulawayo 9.7 9.6 9.2 9.1 -0.6
Hwange 2.2 6.3 6.0 6.2 4.0
Gwanda 1.3 18.1 17.9 17.8 16.5
2004* 2009 2010 2011
Victoria Falls - 81.8 79.5 71.4
Bulawayo - 81.3 77.6 77.5
Hwange - 65.4 63.1 65.2
Gwanda - 78.5 72.5 71.8
Average 75.0 76.8 73.2 71.5
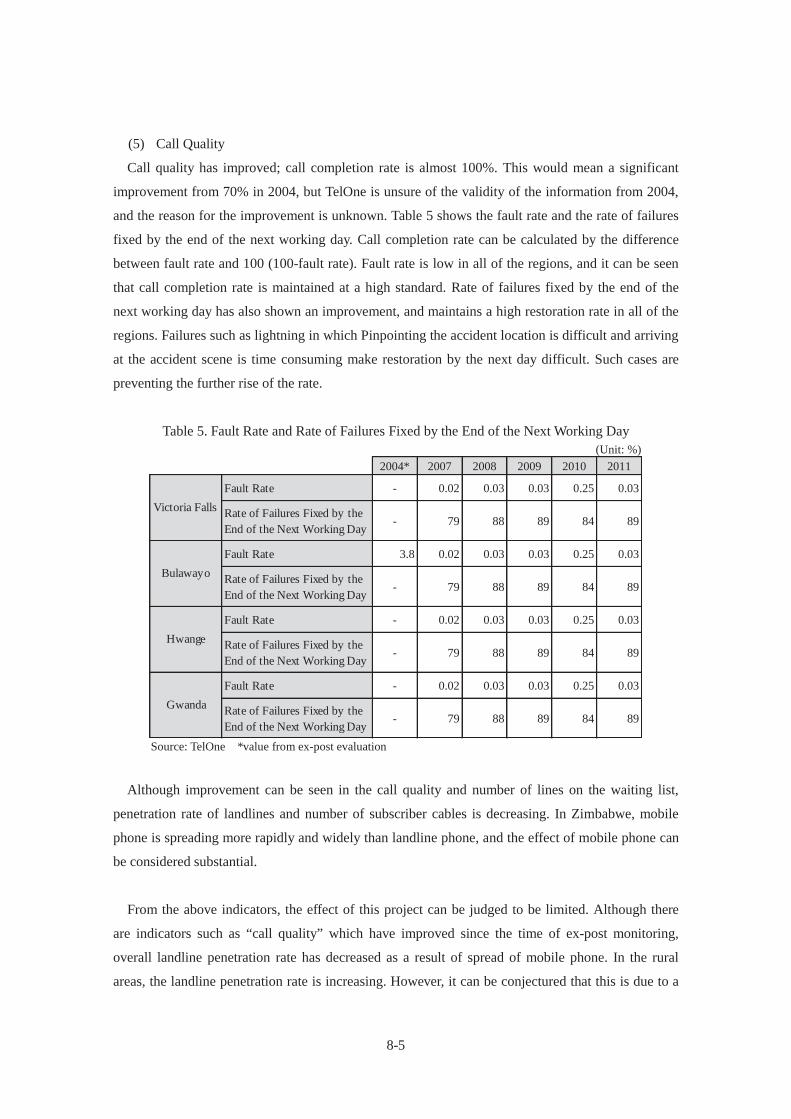
8-5
(5) Call Quality
Call quality has improved; call completion rate is almost 100%. This would mean a significant
improvement from 70% in 2004, but TelOne is unsure of the validity of the information from 2004,
and the reason for the improvement is unknown. Table 5 shows the fault rate and the rate of failures
fixed by the end of the next working day. Call completion rate can be calculated by the difference
between fault rate and 100 (100-fault rate). Fault rate is low in all of the regions, and it can be seen
that call completion rate is maintained at a high standard. Rate of failures fixed by the end of the
next working day has also shown an improvement, and maintains a high restoration rate in all of the
regions. Failures such as lightning in which Pinpointing the accident location is difficult and arriving
at the accident scene is time consuming make restoration by the next day difficult. Such cases are
preventing the further rise of the rate.
Table 5. Fault Rate and Rate of Failures Fixed by the End of the Next Working Day (Unit: %)
Source: TelOne *value from ex-post evaluation
Although improvement can be seen in the call quality and number of lines on the waiting list,
penetration rate of landlines and number of subscriber cables is decreasing. In Zimbabwe, mobile
phone is spreading more rapidly and widely than landline phone, and the effect of mobile phone can
be considered substantial.
From the above indicators, the effect of this project can be judged to be limited. Although there
are indicators such as “call quality” which have improved since the time of ex-post monitoring,
overall landline penetration rate has decreased as a result of spread of mobile phone. In the rural
areas, the landline penetration rate is increasing. However, it can be conjectured that this is due to a
2004* 2007 2008 2009 2010 2011
Fault Rate - 0.02 0.03 0.03 0.25 0.03
Rate of Failures Fixed by theEnd of the Next Working Day
- 79 88 89 84 89
Fault Rate 3.8 0.02 0.03 0.03 0.25 0.03
Rate of Failures Fixed by theEnd of the Next Working Day
- 79 88 89 84 89
Fault Rate - 0.02 0.03 0.03 0.25 0.03
Rate of Failures Fixed by theEnd of the Next Working Day
- 79 88 89 84 89
Fault Rate - 0.02 0.03 0.03 0.25 0.03
Rate of Failures Fixed by theEnd of the Next Working Day
- 79 88 89 84 89Gwanda
Hwange
Bulawayo
Victoria Falls

8-6
passive motive that the mobile phone facility has not been constructed in the area. Since it is
foreseeable that the cell-phone service will be available for the rural area in the future, further spread
of landline phones cannot be expected.
3.1.1.2 Internal Rates of Return (IRR)
According to the interview with TelOne, the facilities installed by this project are only in a part of
Matabeleland, and it is impossible to calculate the revenue by each facility. Therefore, financial IRR
will not be calculated. Regarding economic IRR, the calculation will not be performed since the
economic IRR was not calculated at the time of ex-post evaluation.
3.1.2 Qualitative Effects
See Impact for optimization and facilitation of the industry.
3.2 Impact
3.2.1 Intended Impacts
3.2.1.1 Contribution to the Improvement of Investment Environment
Ex-post evaluation reported that foreign direct investment was fluctuating yearly since 2000.
However, according to the information obtained through this study, the amount of foreign direct
investment from 2009 to 2011 is zero. The reasons are as follows: First, following the Lehman Crisis
in 2008, many countries suffered from global economic crisis. As a result, government loan
programs were reduced. Second, Zimbabwe economy was unstable; Zimbabwe has experienced
repeated hyper-inflation and currency devaluation, and switched its national currency to U.S. Dollars
in 2009. Third, developed countries are keeping a distance from the tyrannical government of
Zimbabwe, and the countries are paying attention to the outcome of the general election to take place
in 2013.
3.2.1.2 Contribution to the Improvement of Living Environment
According to the interview with the Customer Service Department of TelOne, there are no
significant problems with the call quality, and there are no problems which might hinder the living
environment. However, data concerning customer satisfaction could not be obtained, and
contribution to the improvement of living environment could not be ascertained.
3.2.2 Resettlement, Land Acquisition, and Other Impacts
According to the interview with TelOne, there have been no resettlement or land acquisitions
resulting from this project since the ex-post evaluation. There are no other positive or negative
impacts.
8-7
As mentioned above, impact of this project could not be confirmed. Furthermore, foreign direct
investment in Bulawayo continues to be zero. However, since factors such as economic instability,
which the period of recovery cannot be determined, are involved, prediction of the future impacts of
this project is difficult.
3.3 Sustainability
3.3.1 Structural Aspects of Operation and Maintenance
There is no change in TelOne's status of shareholders or the organization of Customer Service
Department since the time of ex-post evaluation. 100% of TelOne's stock is owned by the
government of Zimbabwe, and there is no plan of privatization. Operation and maintenance is
conducted by Central Management and Operations Center (CMOC) in the Customer Service
Division under the Commercial Department of TelOne. It is responsible for new installation of
telephone, maintenance and inspection, telephone fee collection, and directory assistance. At the
time of ex-post evaluation, insufficient manpower as a result of the economic downturn was
indicated, but currently, there are no shortages of personnel. There is always an application to fill the
vacant position, and there are no problems. According to "Zimbabwe 2012 Facts and Figures"
published by World Food Program, Zimbabwe's unemployment rate is 60%. Therefore, there should
be plenty of applicants, and TelOne is equipped with a training facility. From these facts, it is
conceivable that there is no shortage of personnel. Regarding the shortage of workers reported in the
ex-post evaluation report, TelOne had no knowledge of the problem.
3.3.2 Technical Aspects of Operation and Maintenance
There are no significant changes in the procedure of sharing technical information or the level of
technical skill concerning the telecommunications system installed by this project. Regarding the
operation and maintenance of telecommunications system installed by this project, there are
maintenance manuals, and knowledge concerning operation and management is being spread by
sharing of technical skills between workers at the workplace. Training on new technology such as
optical fiber or technical training for new services is conducted at TelOne Training Center in Harare,
when entering the company or when there is a change in personnel.
During nighttime, CMOC uses computers to conduct centralized management. However,
computer's operating system and hardware of the computer management system installed by this
project have become obsolete. Storage medium for the hardware are no longer in production and
new storage cannot be obtained. There is a possibility to obstruct business performance.

8-8
3.3.3 Financial Aspects of Operation and Maintenance
At the time of ex-post evaluation, operating profit ratio was 4.1%. Currently, consolidated
operating profit ratio, including NetOne, is 2%, and have worsened since the time of ex-post
evaluation. In 2011, Revenue was 150 million US dollars (13.5 billion yen / 16% decrease from
previous year), total comprehensive income was 3 million US dollars (260 million yen / 50%
decrease from previous year), and balance in equity was insolvency of 160 million US dollars.
Operating loss was 30 million dollars. The main reasons for the loss are decrease in revenue due to
the expansion of the mobile telephone market, constant appropriation of bad debt loss, and increases
in personnel expenses resulting from the inflation from the switching of national currency in 2009.
Loss for a single fiscal year has decreased by 20 billion yen from the time of ex-post evaluation, but
this is due to the fact that temporary factors such as inflation and currency devaluation were not
present in 2010. Although TelOne has an insolvency of 160 million US dollars, 150 million US
dollars which amounts to 90% is ODA loan from the Japanese government. 40 million US dollars is
a loan from African Development Bank.
It is very unlikely that TelOne will suspend its business. TelOne is a state-owned enterprise, and is
engaging in an investment negotiation from a foreign company (South Africa). Its subsidiary is
NetOne (established 1996), which is the second largest mobile phone company in Zimbabwe.
However, the company's operating funds are insufficient, that obsolete switchboards cannot be
replaced immediately. Furthermore, according to the interview with TelOne, landline telephone
business is currently dominated by TelOne, but within the next few years, a foreign
telecommunications company is planning to move into Zimbabwe. The company has made
preparations for constructing cable facilities. Since cooperation between the foreign
telecommunications company and TelOne’s landline phone business cannot be expected, there is
concern over the worsening financial status of TelOne from price competition.
Switchboards: empty slots can be seen Mini-disc drive used as storage medium
8-9
3.3.4 Current Status of Operation and Maintenance
At nighttime, CMOC uses computers to conduct centralized management of operation and
maintenance. However, operating system and hardware of computer management system installed
by this project has become obsolete. Storage medium for the hardware are no longer in production
and new storage medium cannot be obtained. Since new storage mediums are unavailable, CMOC is
constantly reusing the existing mediums. In addition, new computer applications cannot be used due
to the obsolete operating system. These factors cause problems which obstruct business
performance.
Switchboards installed by this project consist of the main component and the backup component,
which operates in case of the failure of the main component. However, backup component is
currently not functioning due to the lack of spare parts. This would mean that if the main component
fails, telephone of the region covered by the switchboard will go down. The lack of spare parts is the
result of Fujitsu closing its Zimbabwe office in 2004. The local manufacturer for the switchboard has
also stopped its production. Problem with obtaining spare parts has persisted since 2005. Also, since
there are also difficulties in obtaining other spare parts, the operating capacity of the facility has
decreased to 70%.
From the above, concerning sustainability, technical skills of workers have been maintained from
the time of ex-post evaluation, and no problem was detected. The number of workers is sufficient. As
for financial aspects, although there are external factors such as economic instability, because
TelOne is a state-owned business, and plus, it is the parent company of the country's second largest
mobile phone company, it can be said that the continuity of the company is secured. However,
TelOne’s constant state of deficit has impeded the prompt upgrading of the equipment. Aged
facilities and equipment are hindering the conducting of business as a telecommunications company.
No solutions have been presented, and concerns remain.
4. Conclusion, Lessons Learned and Recommendations
4.1 Conclusion
Operation status of facilities installed by this project is unsatisfactory due to aging and lack of
spare parts. The project has contributed to the improvement of telecommunications in the region
since the installed facilities increased its capacity. However, its contribution to the improvement of
living environment and investment climate in the country is unclear. TelOne is continually in a
deficit, and this has led to negative effects in its operation such as its inability to promptly replace
obsolete switchboards. In a few years, a foreign telecommunications company is planned to enter the
Zimbabwe telecommunications market, and further losses by TelOne is expected as a result of
competition. On the other hand, there is sufficient number of workers, and communication of

8-10
technical knowledge is effectively done through seminars and utilization of training centers.
Although outflow of workers to rapidly growing mobile phone industry can be seen , TelOne has
been constantly hiring new workers to fill the vacant posts, and there is no problem. At the time of
ex-post evaluation, outflow of workers due to inflation was indicated, but in this study, no such
outflow was detected. Also, concerning the problem of the lack of spare parts, the primary factor is
not inflation, but the withdrawal of the parts vendor from Zimbabwe.
The effect of the spread of mobile phone on this project is prominent. Mobile phone is spreading
rapidly. Between 2006 and 2011, the mobile phone penetration rate has risen nine times to 61%. On
the other hand, the penetration rate of landline phones of the target area of this study was 17% in the
highest region, and in almost all the regions, the numbers show a decrease after 2009. Zimbabwe's
telecommunication demand is changing, and the penetration rate of the landline phone is not
expected to increase dramatically in the near future.
4.2 Recommendations
None.
4.3 Lessons Learned
None.

8-11
Comparison of the Original and Actual Scope of the Project
Item Original Actual 1. Output (1) Switchboard renovations and new installations a) 4 locations in cities -Bulawayo -Hwange -Victoria Falls -Gwanda b) 3 locations outside cities -Bulawayo -Hwange -Victoria Falls -Gwanda (2) Installation of Transmission Lines a) In city(in Bulawayo city) b) Outside city(between Bulawayo, Hwange, and Victoria Falls) (3) Installation of Subscriber Cables (4) Consulting Service
Total: 75,000 lines 67,000 lines 3,000 lines 2,000 lines 3,000 lines Total: 1,180 lines - 500 lines 180 lines 500 lines Optic cable 53 km Digital microwave 674 km Optic cable 18 km 239,400 pairs 233 M/M
Total: 95,000 lines 83,000 lines 4,000 lines 4,500 lines 3,500 lines Total: 10,000 lines 7,000 lines 1,500 lines 500 lines 1,000 lines As planned As planned 388,769 pairs 438 M/M
2. Project Period August 1993 – March 1998 (56 months)
August 1993 – September 2002 (110 months)
(excluding additional output of 84 months)
3. Project Cost Foreign Currency Local Currency Total ODA Loan Portion Exchange Rate
9,523 million yen 2,204 million yen (ZW$87 million)
11,727 million yen 9,523 million yen
US$1 ZW$4.97=125 yen (March 1992)
(unclear) million yen (unclear) million yen
(local currency) (unclear) million yen
9,180 million yen US$1 ZW$27.94 114 yen (average of rates from 1994 to
2002)

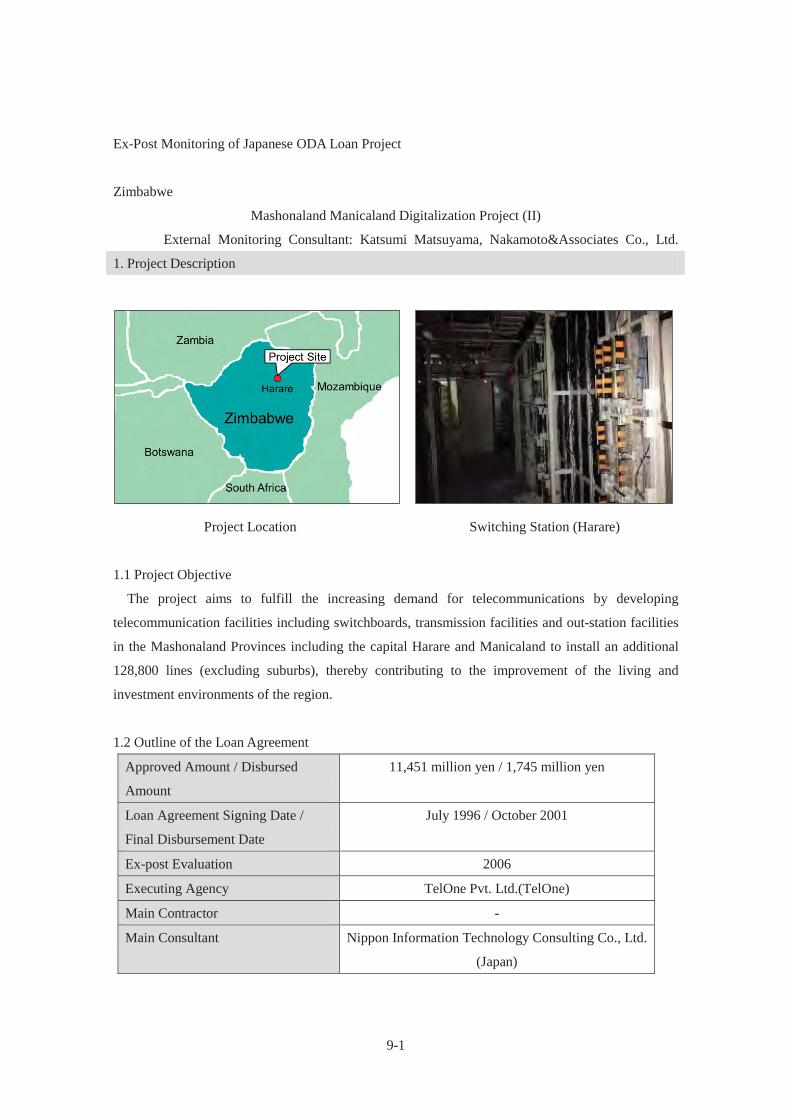
9-1
Ex-Post Monitoring of Japanese ODA Loan Project
Zimbabwe
Mashonaland Manicaland Digitalization Project (II)
External Monitoring Consultant: Katsumi Matsuyama, Nakamoto&Associates Co., Ltd.
1. Project Description
Project Location Switching Station (Harare)
1.1 Project Objective
The project aims to fulfill the increasing demand for telecommunications by developing
telecommunication facilities including switchboards, transmission facilities and out-station facilities
in the Mashonaland Provinces including the capital Harare and Manicaland to install an additional
128,800 lines (excluding suburbs), thereby contributing to the improvement of the living and
investment environments of the region.
1.2 Outline of the Loan Agreement
Approved Amount / Disbursed
Amount
11,451 million yen / 1,745 million yen
Loan Agreement Signing Date /
Final Disbursement Date
July 1996 / October 2001
Ex-post Evaluation 2006
Executing Agency TelOne Pvt. Ltd.(TelOne)
Main Contractor -
Main Consultant Nippon Information Technology Consulting Co., Ltd.
(Japan)
9-2
1.3 Background and Reason of Ex-post Monitoring
Zimbabwe's existing facilities such as analogue switchboards were decrepit, and could not fulfill
the rapidly growing telephone demand. Especially in central regions of Zimbabwe’s economy such
as Mashonaland and Manicaland which include the capital, Harare, there was concern over the
shortage of telecommunication facilities that could be a bottleneck for business activities and
constitute an obstacle to everyday life. In addition, shortage of subscriber cables created problems in
the effective utilization of the telecommunication system as a whole, making it difficult to satisfy the
tight demand for telephone services. In order to improve this situation, this project follows the
installation of telecommunications facilities by Japanese ODA Loan, “Telecommunication
Expansion Project (ZI-P3)”, and implemented the installation of switchboards, switchboards,
transmission facilities and out-station facilities in the Mashonaland Provinces including the capital
Harare and Manicaland.
However, due to a series of problems related to the implementation process, the project was
canceled. Of the planned installation of 125,800 subscriber cables, only 38,300 cables (excluding
long-distance) were installed in Mashonaland; and in Manicaland, neither the replacement of the
switchboards nor the installation of subscriber cables was implemented. In Zimbabwe, there is a
problem of communication failure due to capacity shortage and aging of subscribed cables; the effect
of the installation of switchboards only is believed to be limited.
This project was planned to be managed by Post & Telecommunication Corporation (PTC), but
PTC was split and incorporated in July 2000 and the telecommunication service division was
succeeded by TelOne (Pvt) Ltd. (TelOne).At the time of ex-post evaluation (2006), the government
of Zimbabwe owned all shares of TelOne, but it had been decided by the Cabinet that TelOne will be
privatized. Shares after privatization were planned as, Zimbabwe holding 70% of the share and the
remaining 30% by a private entity. However, the specifics of the privatization had not been decided,
and the future of TelOne was unclear. In addition, TelOne was continually in a deficit due to the
country's economic downturn, and there were concerns over the procurement of spare parts and
securing of budget necessary for personnel training.
Therefore, this project was selected for ex-post monitoring and reviewed under each criterion with
the findings from the field survey and other research activities with a final conclusion being drawn.
2. Outline of the Monitoring Study
2.1 External Monitoring Consultant
Katsumi Matsuyama (Nakamoto & Associates Co., Ltd.)
9-3
2.2 Duration of Monitoring Study
Duration of the Study: September 2012 – June 2013
Duration of the Field Study: November 24, 2012 – December 5, 2012
3. Monitoring Results
3.1 Effectiveness
3.1.1 Quantitative Effects
3.1.1.1 Operation and Effect Indicators
(1) Installation of Switchboards
Switchboards installed by this project were only a part the switchboards operating in Mashonaland
and Manicaland. In the region, there are older switchboards still operating, and there has been
installation of subscriber cables. From 2002, year following the completion of the project, to present,
TelOne is implementing the gradual replacement of operating outdated switchboards to switchboards
made by Chinese manufacturer, Huawei. The replacement is taking time due to the limited budget
provided by the government of Zimbabwe. In addition, switchboards installed by this project are
classified as outdated, and is targeted for replacement. Regarding the number of subscriber cables,
according to the interview with TelOne, currently there is a total capacity of 400,000 lines for
switchboards and subscriber cables in Mashonaland and Manicaland. Capacities of the switchboards
installed by this project, which are a part of the 400,000 lines, have decreased its capacity to 60% of
its original capacity due to the lack of spare parts. The number of subscriber cables only for
switchboards installed by this project could not be obtained.
On the contrary, ex-post evaluation report reported the number of subscriber cables as a total of
38,300 cables. From the fact that the difference in the number of subscriber cable is nearly 10 times
between the number of subscriber cables reported in the ex-post evaluation and the findings of this
study, and from the finding from an interview result that the older switchboards were in operation at
the time of ex-post evaluation, it can be assumed that the ex-post evaluation's report pertained only
to the switchboards installed by this project. Therefore, the comparison is not possible, since the
definition for the number of subscriber cables seems to differ. However, according to the interview
with TelOne, the capacity of switchboards and subscriber cables have increased as a result of the
replacement of switchboards to Huawei switchboards and the additional installation of subscriber
cables.
Table 1 shows the utilization rate of switchboards in Mashonaland and Manicaland. Utilization
rate from 2006 to 2011 is approximately 70% in Mashonaland and 50% in Manicaland; there is
surplus in capacity.
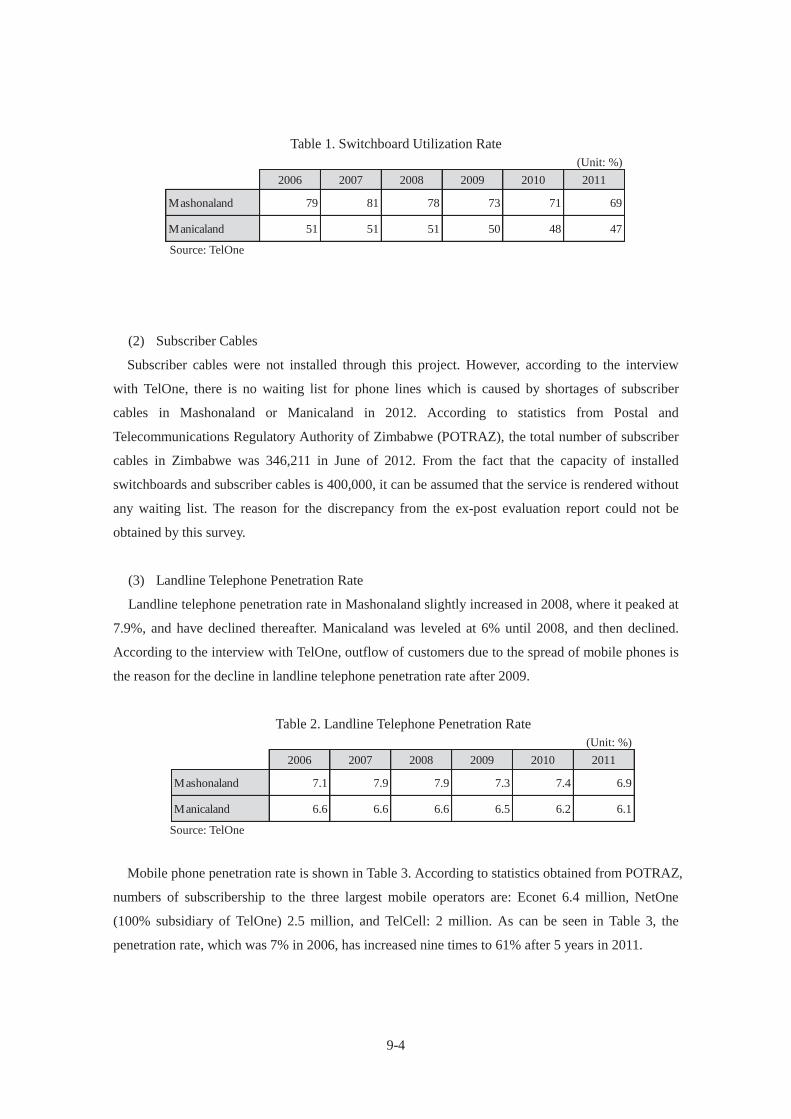
9-4
Table 1. Switchboard Utilization Rate (Unit: %)
Source: TelOne
(2) Subscriber Cables
Subscriber cables were not installed through this project. However, according to the interview
with TelOne, there is no waiting list for phone lines which is caused by shortages of subscriber
cables in Mashonaland or Manicaland in 2012. According to statistics from Postal and
Telecommunications Regulatory Authority of Zimbabwe (POTRAZ), the total number of subscriber
cables in Zimbabwe was 346,211 in June of 2012. From the fact that the capacity of installed
switchboards and subscriber cables is 400,000, it can be assumed that the service is rendered without
any waiting list. The reason for the discrepancy from the ex-post evaluation report could not be
obtained by this survey.
(3) Landline Telephone Penetration Rate
Landline telephone penetration rate in Mashonaland slightly increased in 2008, where it peaked at
7.9%, and have declined thereafter. Manicaland was leveled at 6% until 2008, and then declined.
According to the interview with TelOne, outflow of customers due to the spread of mobile phones is
the reason for the decline in landline telephone penetration rate after 2009.
Table 2. Landline Telephone Penetration Rate (Unit: %)
Source: TelOne
Mobile phone penetration rate is shown in Table 3. According to statistics obtained from POTRAZ,
numbers of subscribership to the three largest mobile operators are: Econet 6.4 million, NetOne
(100% subsidiary of TelOne) 2.5 million, and TelCell: 2 million. As can be seen in Table 3, the
penetration rate, which was 7% in 2006, has increased nine times to 61% after 5 years in 2011.
2006 2007 2008 2009 2010 2011
Mashonaland 79 81 78 73 71 69
Manicaland 51 51 51 50 48 47
2006 2007 2008 2009 2010 2011
Mashonaland 7.1 7.9 7.9 7.3 7.4 6.9
Manicaland 6.6 6.6 6.6 6.5 6.2 6.1
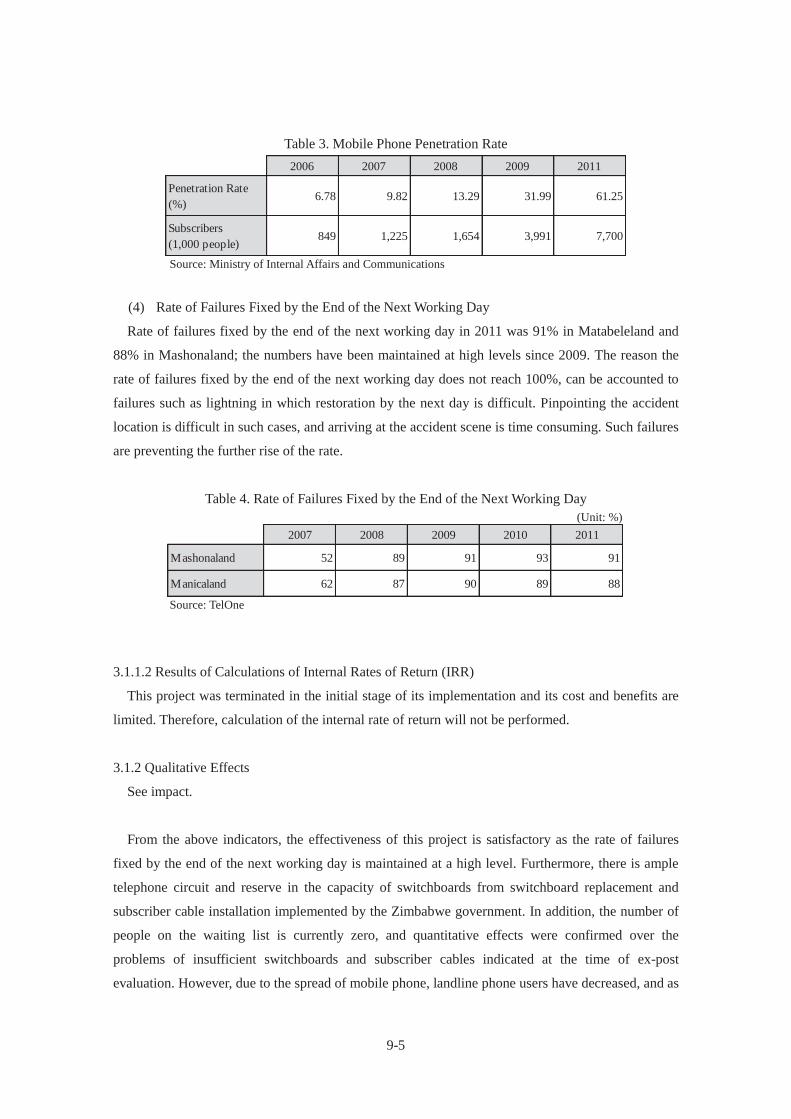
9-5
Table 3. Mobile Phone Penetration Rate
Source: Ministry of Internal Affairs and Communications
(4) Rate of Failures Fixed by the End of the Next Working Day
Rate of failures fixed by the end of the next working day in 2011 was 91% in Matabeleland and
88% in Mashonaland; the numbers have been maintained at high levels since 2009. The reason the
rate of failures fixed by the end of the next working day does not reach 100%, can be accounted to
failures such as lightning in which restoration by the next day is difficult. Pinpointing the accident
location is difficult in such cases, and arriving at the accident scene is time consuming. Such failures
are preventing the further rise of the rate.
Table 4. Rate of Failures Fixed by the End of the Next Working Day (Unit: %)
Source: TelOne
3.1.1.2 Results of Calculations of Internal Rates of Return (IRR)
This project was terminated in the initial stage of its implementation and its cost and benefits are
limited. Therefore, calculation of the internal rate of return will not be performed.
3.1.2 Qualitative Effects
See impact.
From the above indicators, the effectiveness of this project is satisfactory as the rate of failures
fixed by the end of the next working day is maintained at a high level. Furthermore, there is ample
telephone circuit and reserve in the capacity of switchboards from switchboard replacement and
subscriber cable installation implemented by the Zimbabwe government. In addition, the number of
people on the waiting list is currently zero, and quantitative effects were confirmed over the
problems of insufficient switchboards and subscriber cables indicated at the time of ex-post
evaluation. However, due to the spread of mobile phone, landline phone users have decreased, and as
2006 2007 2008 2009 2011
Penetration Rate(%)
6.78 9.82 13.29 31.99 61.25
Subscribers(1,000 people)
849 1,225 1,654 3,991 7,700
2007 2008 2009 2010 2011
Mashonaland 52 89 91 93 91
Manicaland 62 87 90 89 88
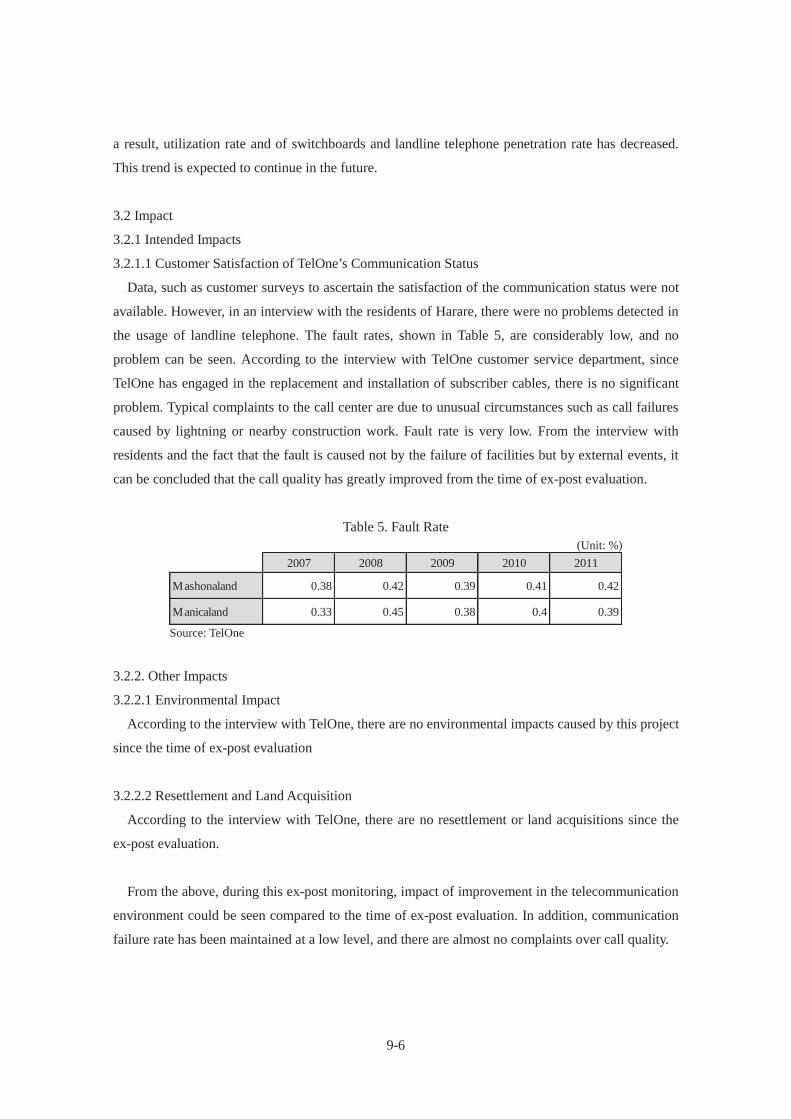
9-6
a result, utilization rate and of switchboards and landline telephone penetration rate has decreased.
This trend is expected to continue in the future.
3.2 Impact
3.2.1 Intended Impacts
3.2.1.1 Customer Satisfaction of TelOne’s Communication Status
Data, such as customer surveys to ascertain the satisfaction of the communication status were not
available. However, in an interview with the residents of Harare, there were no problems detected in
the usage of landline telephone. The fault rates, shown in Table 5, are considerably low, and no
problem can be seen. According to the interview with TelOne customer service department, since
TelOne has engaged in the replacement and installation of subscriber cables, there is no significant
problem. Typical complaints to the call center are due to unusual circumstances such as call failures
caused by lightning or nearby construction work. Fault rate is very low. From the interview with
residents and the fact that the fault is caused not by the failure of facilities but by external events, it
can be concluded that the call quality has greatly improved from the time of ex-post evaluation.
Table 5. Fault Rate (Unit: %)
Source: TelOne
3.2.2. Other Impacts
3.2.2.1 Environmental Impact
According to the interview with TelOne, there are no environmental impacts caused by this project
since the time of ex-post evaluation
3.2.2.2 Resettlement and Land Acquisition
According to the interview with TelOne, there are no resettlement or land acquisitions since the
ex-post evaluation.
From the above, during this ex-post monitoring, impact of improvement in the telecommunication
environment could be seen compared to the time of ex-post evaluation. In addition, communication
failure rate has been maintained at a low level, and there are almost no complaints over call quality.
2007 2008 2009 2010 2011
Mashonaland 0.38 0.42 0.39 0.41 0.42
Manicaland 0.33 0.45 0.38 0.4 0.39
9-7
3.3 Sustainability
3.3.1 Structural Aspects of Operation and Maintenance
At the time of ex-post evaluation, TelOne's privatization was decided by the Cabinet. However,
the government of Zimbabwe continues to hold all shares of TelOne. According to the interview with
TelOne, there is no plan of privatization in the future. There is no change in the status of
shareholders or the organizational structure of TelOne from the time of the ex-post evaluation.
Considering the innovation and the rapid spread of mobile phones, TelOne does not have an
optimistic outlook of the landline telephone sector. However, TelOne is planning to expand its ISDN
business focusing on services to companies that use landline telephones. Also, NetOne, the second
largest mobile phone company in the country, is a 100% subsidiary of TelOne. Expansion of new
business apart from landline telephone has become an urgent management issue.
Operation and maintenance of facilities in Mashonaland and Manicaland is conducted by the Central
Management and Operations Center (CMOC) in the Customer Service Division under the
Commercial Department of TelOne. Problems of staff shortage and outflow of engineers indicated at
the time of ex-post evaluation have been resolved. Although information on the number of staff were
not available, according to the interviews, there is approximately 105 exchange facilities with more
than one engineer at each facility; and so, there is no problem of staff shortage. Engineers regularly
receive training at TelOne's training center, and new engineers are recruited constantly to fill vacant
positions. Application form for job seekers is available on the company website.
3.3.2 Technical Aspects of Operation and Maintenance
TelOne has a training center in Harare, where technical training is offered to its employees. The
center is also the country's only training institution where acquisition of a variety of national
qualifications related to communication is possible. Staff shortage, anticipated at the time of
ex-post evaluation, has not occurred. According to the interview with TelOne, technical skills of
individual workers, in addition to maintenance manuals, are shared at the working site, and there
are currently no problem with the necessary technical skills for operation and maintenance.
However, there is a need for TelOne to upgrade its training contents in order to expand its business
to ISDN. Currently, TelOne is searching for a partner that can provide the knowledge of this
technology.
3.3.3 Financial Aspects of Operation and Maintenance
At the time of ex-post evaluation, operating profit ratio was 4.1%. Currently, consolidated
operating profit ratio, including NetOne, is 2%, and have worsened since the time of ex-post
evaluation. In 2011, Revenue was 150 million US dollars (13.5 billion yen / 16% decrease from
previous year), total comprehensive income was 3 million US dollars (260 million yen / 50%

9-8
decrease from previous year), and balance in equity was insolvency of 160 million US dollars.
Operating loss was 30 million dollars. The main reasons for the loss are decrease in revenue due to
the expansion of the mobile telephone market, constant appropriation of bad debt loss, and increases
in personnel expenses resulting from the inflation from the switching of national currency in 2009.
Loss for a single fiscal year has decreased by 20 billion yen from the time of ex-post evaluation, but
this is due to the fact that temporary factors such as inflation and currency devaluation were not
present in 2010. Although TelOne has an insolvency of 160 million US dollars, 150 million US
dollars which amounts to 90% is ODA loan from the Japanese government. 40 million US dollars is
a loan from African Development Bank.
It is very unlikely that TelOne will suspend its business. TelOne is a state-owned enterprise, and is
engaging in an investment negotiation from a foreign company. Its subsidiary is NetOne (established
1996), which is the second largest mobile phone company in Zimbabwe. However, the company's
operating funds are insufficient, and obsolete switchboards cannot be replaced immediately.
Furthermore, according to the interview with TelOne, although landline telephone business is
currently dominated by TelOne, a foreign telecommunications company is planning to move into
Zimbabwe within the next few years. The company has begun preparations for constructing cable
facilities. Since cooperation between the foreign telecommunications company and TelOne’s
landline phone business cannot be expected, there is concern over the worsening of the financial
status of TelOne from price competition.
Switching board: empty slots can be seen Fan is used to substitute for cooling system
3.3.4 Current Status of Operation and Maintenance
The CMOC, visited during this study, acts as the central management center for all the switching
stations. Switchboards installed by this project are also operated and maintained, according to the
maintenance manual, by the CMOC, and the switchboards are properly operated. Regarding the
status of operation and maintenance, the equipment is showing significant signs of deterioration
9-9
compared to the time of ex-post evaluation due to lack of spare parts. Switchboards installed by this
project have already become obsolete. Fujitsu, which is the vendor of the parts, closed its Zimbabwe
office in 2004. The local manufacturer of spare parts has also stopped its operation. Spare parts have
been lacking since 2005, and the usage rate of the switchboards is declining. In addition to the lack
of spare parts, from the rapid innovation of information technology, the switchboards have become
obsolete. TelOne is planning on replacing the switchboards to those made by Huawei as soon as
budget is secured.
From the above, problems with organizational structure and technical capacity, which were
indicated in the ex-post evaluation report, could not be seen. However, financial situation has
continued to be insolvent, and this has led to an obstruction to the company's operations, such as its
inability to promptly replace obsolete switchboards. In addition, the entry of the private company has
been scheduled in the near future, and the current monopoly of the telephone business by TelOne
will cease. It is likely that the financial situation of TelOne will worsen. Although the existing
facilities are managed properly, the equipment is dilapidated due to the lack of replacement parts.
However, for the budget is insufficient to replace the existing switchboards.
4. Conclusion, Lessons Learned and Recommendations
4.1 Conclusion
According to the interview with TelOne, overall capacities of the switchboards and subscriber
cables have increased since the time of ex-post evaluation. TelOne has engaged in the replacement of
cables and additional construction of cable facilities, and there is no significant problem with the call
quality. However, the operation of facilities installed by this project is unsatisfactory due to aging
and lack of spare parts. Concerning impact, communication environment has improved in the
regions where the facilities were constructed by this project, leading to the reinforcement of the
capacity. However, the project's contribution to the living environment and the improvement in
investment condition in the country is unclear.
In financial terms, TelOne is in a deficit, and this has resulted in the obstruction of some of the
company's operations such as its inability to promptly replace obsolete switchboards. In addition,
foreign telecommunications company is planned to enter Zimbabwe in a few years, therefore
TelOne's financial situation is expected to worsen. On the other hand, concerning the structural and
technical aspects of operation and maintenance, there is sufficient number of staff, and
communication of technical knowledge is effectively done through seminars and utilization of
training centers; no problem could be seen in this respect Concerning the outflow of engineers, there
are cases where the engineers move to the rapidly-growing mobile phone industry, but TelOne
recruits new engineers in such cases and there is no problem. The effect of the spread of mobile

9-10
phone on this project is prominent. Mobile phone is spreading rapidly. Between 2006 and 2011, the
penetration rate has risen nine times to 61%. On the other hand, comparing the values landline phone
penetration rate for 2006 and 2011, decrease can be seen in all of the regions targeted by this project.
Zimbabwe's telecommunication demand is changing, and the penetration rate of the landline phone
is not expected to increase dramatically in the near future.
4.2 Recommendations
None.
4.3 Lessons Learned
None.
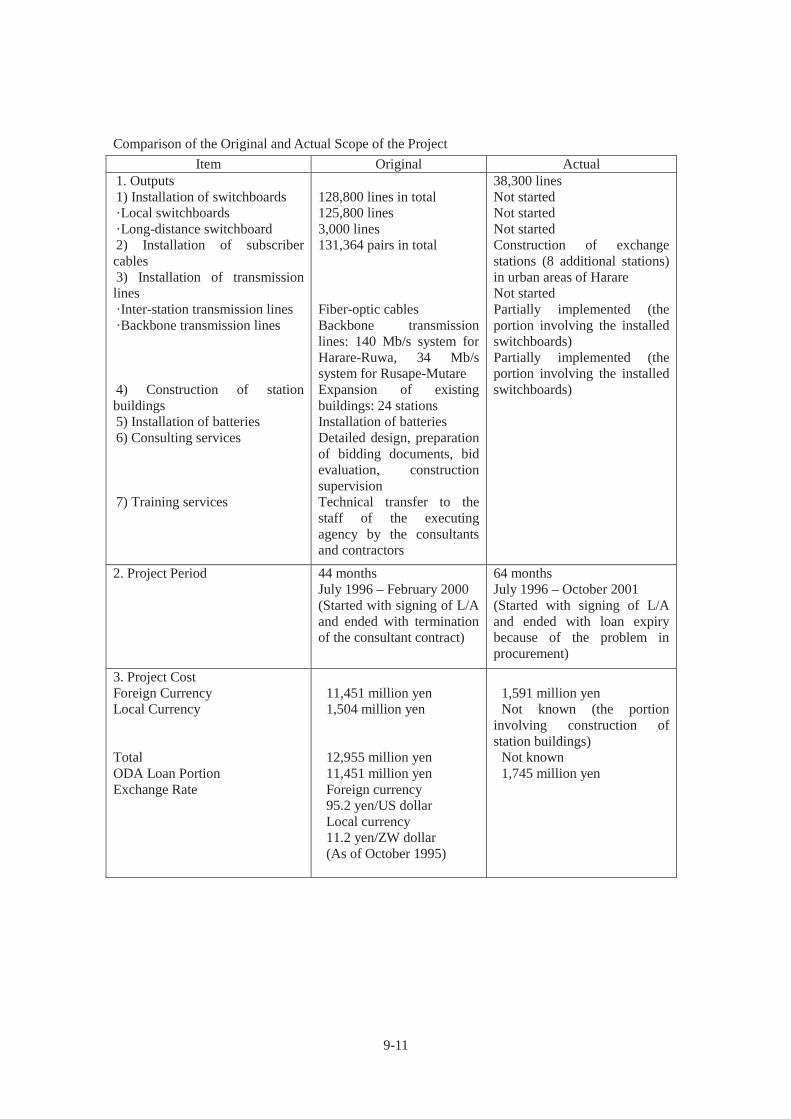
9-11
Comparison of the Original and Actual Scope of the ProjectItem Original Actual
1. Outputs 1) Installation of switchboards ·Local switchboards ·Long-distance switchboard 2) Installation of subscriber cables 3) Installation of transmission lines ·Inter-station transmission lines ·Backbone transmission lines 4) Construction of station buildings 5) Installation of batteries 6) Consulting services 7) Training services
128,800 lines in total 125,800 lines 3,000 lines 131,364 pairs in total Fiber-optic cables Backbone transmission lines: 140 Mb/s system for Harare-Ruwa, 34 Mb/s system for Rusape-Mutare Expansion of existing buildings: 24 stations Installation of batteries Detailed design, preparation of bidding documents, bid evaluation, construction supervision Technical transfer to the staff of the executing agency by the consultants and contractors
38,300 lines Not started Not started Not started Construction of exchange stations (8 additional stations) in urban areas of Harare Not started Partially implemented (the portion involving the installed switchboards) Partially implemented (the portion involving the installed switchboards)
2. Project Period 44 months July 1996 – February 2000 (Started with signing of L/A and ended with termination of the consultant contract)
64 months July 1996 – October 2001 (Started with signing of L/A and ended with loan expiry because of the problem in procurement)
3. Project Cost Foreign Currency Local Currency Total ODA Loan Portion Exchange Rate
11,451 million yen 1,504 million yen 12,955 million yen 11,451 million yen Foreign currency 95.2 yen/US dollar Local currency 11.2 yen/ZW dollar (As of October 1995)
1,591 million yen Not known (the portion
involving construction of station buildings)
Not known 1,745 million yen