USPTO PAR FY 2015
224
UNITED STATES PATENT AND TRADEMARK OFFICE PERFORMANCE AND ACCOUNTABILITY REPORT FISCAL YEAR
-
Upload
khangminh22 -
Category
Documents
-
view
0 -
download
0
Transcript of USPTO PAR FY 2015

UNITED STATES PATENT AND TRADEMARK OFFICE
PERFORMANCE ANDACCOUNTABILITY REPORT
FISC
AL
YEA
R

PERFORMANCE AND ACCOUNTABILITY REPORT
FINANCIAL AND RELATED HIGHLIGHTS
(Dollars In Thousands) % Change2015 over 2014
For the year ended September 30, 2015
For the year ended September 30, 2014
Fund Balance with Treasury (0.4%) $ 2,494,267 $ 2,504,977
Property, Plant, and Equipment, Net 23.6% 405,740 328,290
Other Assets 70.3% 23,916 14,041
Total Assets 2.7% $ 2,923,923 $ 2,847,308
Deferred Revenue (5.7%) $ 1,027,460 $ 1,089,812
Accounts Payable 3.0% 116,211 112,809
Accrued Payroll, Benefits, and Leave 7.6% 217,666 202,362
Other Liabilities 9.9% 161,429 146,917
Total Liabilities (1.9%) $ 1,522,766 $ 1,551,900
Net Position 8.2% 1,401,157 1,295,408
Total Liabilities and Net Position 2.7% $ 2,923,923 $ 2,847,308
Total Program Cost 10.3% $ 3,012,833 $ 2,732,378
Total Earned Revenue 1.9% (3,074,001) (3,018,044)
Net Income from Operations (78.6%) $ (61,168) $ (285,666)
Budgetary Resources Available for Spending 0.9% $ 3,680,369 $ 3,648,414
Net Outlays/(Collections) (104.7%) $ 23,140 $ (494,974)
Federal Personnel 1.7% 12,667 12,450
On-Time Payments to Vendors (2.0%) 97% 99%
PERFORMANCE HIGHLIGHTSPerformance Measures FY 2015 Target FY 2015 Actual Performance Results*
Patent Average First Action Pendency (months) 16.4 17.3 Not Met
Patent Average Total Pendency (months) 27.7 26.6 Met
Patent Quality Composite Score 83–91 42.9 Not Met
Trademark Average First Action Pendency (months) 2.5–3.5 2.9 Met
Trademark Average Total Pendency (months) 12.0 10.1 Met
Trademark First Action Compliance Rate 95.5% 96.7% Met
Trademark Final Compliance Rate 97.0% 97.6% Met
Exceptional Office Action 36.0% 48.3% Met
Trademark Applications Processed Electronically 80.0% 82.2% Met
Percentage of prioritized countries for which country teams have made progress on at least 75% of action steps in the country-specific action plans along the following dimensions:• Institutional improvements of intellectual property (IP)
office administration for advancing IP rights,• Institutional improvements of IP enforcement entities,• Improvements in IP laws and regulations, and• Establishment of government-to-government cooperative
mechanisms.
75% 100% Met
Number of Foreign Government Officials Trained on Best Practices to Protect and Enforce IP 6,300 5,283 Not Met
* The performance result of a given measure is either met (100% or greater of target), slightly below (95–99% of the target), or not met (below 95% of target).

i
Table of Contents
MESSAGE 1From the Under Secretary of Commerce for Intellectual Property and Director of the United States Patent and Trademark Office
INTRODUCTION 6About This Report 7Your Guide to Using This Report 8
MANAGEMENT’S DISCUSSION AND ANALYSIS 10Mission and Organization of the USPTO 11
Our Organization 11 Patent Organization 13 Trademark Organization 13 Our People 14
Significant Case Law Developments 15 Recent Decisions 15
Performance Highlights 17Introduction to Performance 17Strategic Performance Framework 17Summary of Strategic Goal Results 20
Management Challenges and What’s Ahead 22Sustainable Funding 22Managing the Patent Business’ Transition to Maintenance Mode 22Administering AIA Provisions 22
Establishment of Office of the Deputy Commissioner for Trademark Administration 23 Relationships with Oversight Entities 23 Reliance on Information Technology 24 Legal Challenges 24
Systems and Controls 25Management Assurances 25Other Compliance with Laws and Regulations 26Other Systems and Control Considerations 28
Financial Discussion and Analysis 29 Financial Highlights 29
PERFORMANCE INFORMATION 47Introduction to the USPTO’s Performance Goals and Results 48White House Executive Actions for Innovation 48Performance Audits and Evaluations 49Performance Data Verification and Validation 50Commissioners’ Performance for FY 2015 51

PERFORMANCE AND ACCOUNTABILITY REPORT
ii
Patents: Strategic Goal I 52 Strategic Goal I: Optimize Patent Quality and Timeliness 54
Trademarks: Strategic Goal II 72 Strategic Goal II: Optimize Trademark Quality and Timeliness 74
Intellectual Property: Strategic Goal III 85 Strategic Goal III: Provide Domestic and Global Leadership to Improve Intellectual Property Policy,
Protection, and Enforcement Worldwide 87
Management Goal 100 Management Goal: Achieve Organizational Excellence 101
FINANCIAL SECTION 118Message 119
From the Chief Financial Officer Principal Financial Statements and Related Notes 122Required Supplementary Information 155Independent Auditor's Report 157
OTHER INFORMATION 166Combined Schedule of Spending 167Inspector General’s Top Management Challenges Facing the USPTO 168Summary of Financial Statement Audit & Management Assurances 169Improper Payments Information Act (IPIA) of 2002, as Amended 170Freeze the Footprint 174Civil Monetary Penalty Act 175FY 2015 USPTO Campus Updates 176The Nature of the Training Provided to USPTO Examiners 178FY 2015 USPTO Workload Tables 183
GLOSSARY OF ACRONYMS AND ABBREVIATION LIST 213
INDEX OF URLs 216

www.uspto.gov
1
MESSAGE
PERFORMANCE AND ACCOUNTABILITY REPORT
2
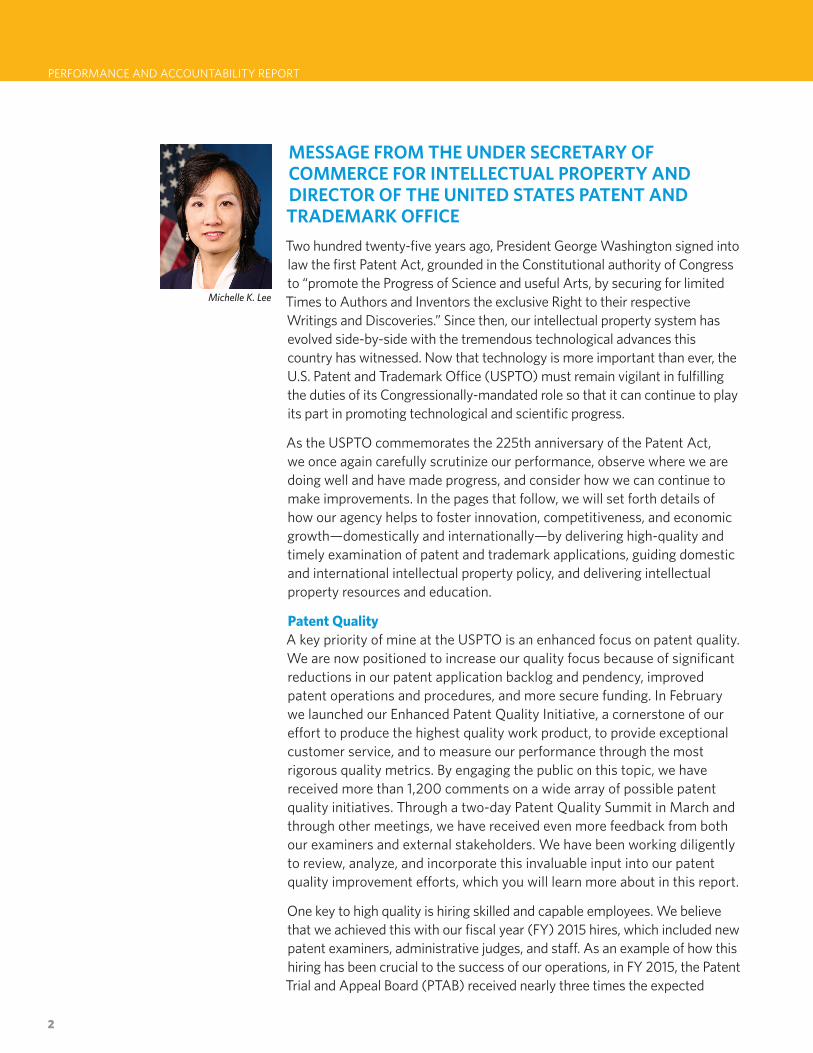
Michelle K. Lee
MESSAGE FROM THE UNDER SECRETARY OF COMMERCE FOR INTELLECTUAL PROPERTY AND DIRECTOR OF THE UNITED STATES PATENT AND TRADEMARK OFFICE Two hundred twenty-five years ago, President George Washington signed into law the first Patent Act, grounded in the Constitutional authority of Congress to “promote the Progress of Science and useful Arts, by securing for limited Times to Authors and Inventors the exclusive Right to their respective Writings and Discoveries.” Since then, our intellectual property system has evolved side-by-side with the tremendous technological advances this country has witnessed. Now that technology is more important than ever, the U.S. Patent and Trademark Office (USPTO) must remain vigilant in fulfilling the duties of its Congressionally-mandated role so that it can continue to play its part in promoting technological and scientific progress.
As the USPTO commemorates the 225th anniversary of the Patent Act, we once again carefully scrutinize our performance, observe where we are doing well and have made progress, and consider how we can continue to make improvements. In the pages that follow, we will set forth details of how our agency helps to foster innovation, competitiveness, and economic growth—domestically and internationally—by delivering high-quality and timely examination of patent and trademark applications, guiding domestic and international intellectual property policy, and delivering intellectual property resources and education.
Patent QualityA key priority of mine at the USPTO is an enhanced focus on patent quality. We are now positioned to increase our quality focus because of significant reductions in our patent application backlog and pendency, improved patent operations and procedures, and more secure funding. In February we launched our Enhanced Patent Quality Initiative, a cornerstone of our effort to produce the highest quality work product, to provide exceptional customer service, and to measure our performance through the most rigorous quality metrics. By engaging the public on this topic, we have received more than 1,200 comments on a wide array of possible patent quality initiatives. Through a two-day Patent Quality Summit in March and through other meetings, we have received even more feedback from both our examiners and external stakeholders. We have been working diligently to review, analyze, and incorporate this invaluable input into our patent quality improvement efforts, which you will learn more about in this report.
One key to high quality is hiring skilled and capable employees. We believe that we achieved this with our fiscal year (FY) 2015 hires, which included new patent examiners, administrative judges, and staff. As an example of how this hiring has been crucial to the success of our operations, in FY 2015, the Patent Trial and Appeal Board (PTAB) received nearly three times the expected

www.uspto.gov
3
number of petitions for the PTAB trials created by the Leahy-Smith America Invents Act and yet still met every legally mandated deadline. Critically important to meeting this Congressional mandate was the hiring of 33 new judges, including 13 in our regional offices.
In addition, we continue to believe in the importance of hiring highly qualified veterans throughout the agency. By the end of FY 2015, nearly 26 percent of all non-patent examiner hires and nearly 15 percent of patent examiner hires had veterans’ preference status.
New LeadershipWe also made key senior leadership appointments in FY 2015. In December of last year, U.S. Secretary of Commerce Penny Pritzker named Mary Boney Denison as our new Commissioner for Trademarks; in March of this year, named Russ Slifer as the new Deputy Undersecretary of Commerce for Intellectual Property and Deputy Director of the USPTO; and finally, in July of this year, named Andrew Hirshfeld as the new Commissioner for Patents. Commissioners Denison and Hirshfeld both have had distinguished careers at the agency, and we are pleased to have hired Russ Slifer, a highly regarded intellectual property practitioner from the private sector. We are grateful to all three for their service to the American people.
Regional Offices (formerly “Satellite Offices”)FY 2015 has also been a time of progress for our four regional offices. We had the grand openings for the permanent locations of our Silicon Valley United States Patent and Trademark Office in San Jose, CA, in October 2015 and our Texas Regional United States Patent and Trademark Office in Dallas, TX, in November 2015. Even before the “official” openings, these offices were serving as local hubs of innovation, education, and outreach in temporary offices. Our two other regional offices—the Elijah J. McCoy Midwest Regional United States Patent and Trademark Office in Detroit, MI, and the Rocky Mountain Regional United States Patent and Trademark Office in Denver, CO—marked their three- and one-year anniversaries, respectively, this past year. All four offices provide a broad range of USPTO services to the local innovation communities, while acting as a more direct and convenient conduit for feedback from stakeholders on how the agency can better serve their needs.
Information TechnologyEvery aspect of USPTO’s operation relies on information technology (IT) systems. Indeed, the quality of patent and trademark operations is directly related to IT performance. In FY 2015, we began to deliver next generation software and service platforms, transforming and streamlining our patent and trademark IT systems. Improved technological capabilities also provided further reliability and enhancements to our telework program, a vital part of the USPTO that both saves us millions of dollars each year by allowing continued operations during shutdowns of the physical office and contributes to USPTO’s consistent ranking as one of the “Best Places to Work in the Federal Government®.”

PERFORMANCE AND ACCOUNTABILITY REPORT
4
Trademark PerformanceThe Trademarks business unit continues to excel. Despite record levels of new trademark applications, the agency in FY 2015 not only met but exceeded its target performance levels. Moreover, trademark fee reductions for new filings and maintenance of registrations saved applicants and registrants more than $21.6 million in user fees over the past year. Those fee reductions were given to applicants who agreed to forgo paper correspondence, thereby leading to a more efficient and cost-effective examination process.
Global Intellectual Property LeadershipThe USPTO successfully transitioned to the Cooperative Patent Classification (CPC) system on January 1, 2015, playing a global leadership role in its early adoption and implementation. The CPC was developed in partnership with the European Patent Office, and using it will help to improve access to prior art, increase efficiency, lower costs, and improve quality. In addition, in early FY 2015, I signed a Memorandum of Agreement with the Korean IP Office that commits that nation to converting to CPC, thus ensuring the adoption and use of CPC across three continents.
Another important international development in FY 2015 was the U.S. ratification of the Hague Agreement concerning the international registration of industrial designs. Critically important for American businesses and entrepreneurs, the treaty—which took effect on May 13, 2015—enables U.S. applicants pursuing protection for industrial designs to file a single application with either the USPTO or the World Intellectual Property Organization. USPTO also issued new rules for filing under the Hague Agreement, allowing for applicants to register a design in more than 60 territories with only one filing.
In FY 2015, the agency entered into a new Memorandum of Agreement with China’s State Intellectual Property Office, further strengthening our ties to China’s principal intellectual property agencies and allowing for advancement of U.S. interests. In addition, I had the opportunity to meet with Chinese Vice Premier Wang Yang, amongst other key officials, while in Beijing in May. During the meeting, Premier Yang emphasized China’s desire to strengthen intellectual property protection and enforcement, explaining that his nation needs intellectual property protection to transition from a manufacturing-based economy of inventions developed elsewhere to an innovation-based economy with technologies developed in China. This is a welcome message. Its receipt, however, does not lessen this Administration’s determination to ensure strong intellectual property protections and rule of law in all foreign markets. The USPTO continues to work with China and U.S. companies in China by providing input on its

www.uspto.gov
5
legislative proposals and training for its judiciary, examiners, and law enforcement officials, and helping to address intellectual property issues of concern to our stakeholders.
Assessment of Data Reliability/Independent Auditors ReportWe are confident that the USPTO’s financial and performance data are complete, reliable, accurate, and consistent as we improve our ability to measure progress toward our performance goals. For the 23rd consecutive year, we earned an unmodified audit opinion on our annual financial statements. For FY 2015 financial reporting, the independent auditors did not identify any material weaknesses, or instances of non-compliance with laws and regulations.
So, as we at America’s “Innovation Agency” reflect on our past and look to our future, we recommit to fulfilling the central promise of the Patent Act of 1790 and the Progress Clause of the U.S. Constitution that authorized its passage. I am very honored and proud of the role that I play in advancing this mission while guiding an exceptional and dedicated workforce.
Michelle K. Lee
Under Secretary of Commerce for Intellectual Property and Director of the United States Patent and Trademark Office
November 12, 2015

PERFORMANCE AND ACCOUNTABILITY REPORT
6
INTRODUCTION
www.uspto.gov
7
About This Report
The U.S. Patent and Trademark Office (USPTO) Performance and Accountability Report (PAR) provides information on the USPTO’s
programs and the results of the agency’s programmatic and financial performance for fiscal year (FY) 2015. This report demonstrates to Congress, the Administration, and to the public the USPTO’s efforts to promote transparency and accountability over the resources entrusted to the agency. This report is available on the USPTO’s website at www.uspto.gov/annualreport and satisfies the reporting requirements contained in the following legislation:
• Title 35 U.S.C. § 13;• Leahy–Smith America Invents Act (AIA) of 2011;• Federal Managers’ Financial Integrity Act of 1982;• GPRA Modernization Act of 2010;• Government Management Reform Act of 1994;• Accountability of Tax Dollars Act of 2002;• Improper Payments Information Act of 2002, as amended;• Reports Consolidation Act of 2000;• Federal Financial Management Improvement Act of 1996; and• Chief Financial Officers Act of 1990.
The USPTO’s program and financial performance is summarized in the USPTO Citizen Centric Report, available on the USPTO website at www.uspto.gov/annualreport.
Last year’s PAR cover and AGA’s Certificate of Excellence in Accountability Reporting

PERFORMANCE AND ACCOUNTABILITY REPORT
8
Your Guide to Using This Report
THIS REPORT IS ORGANIZED INTO FOUR MAJOR SECTIONS, PLUS A
GLOSSARY AND URL INDEX.
MANAGEMENT’S DISCUSSION AND ANALYSIS SECTION This section provides an overview of the USPTO’s historical facts, mission, organization, and its strategic framework. A summary of significant case law developments and the agency’s FY 2015 program and financial performance is also provided along with management’s assessment of the challenges the USPTO faces and assurances on the USPTO’s internal controls. The program performance information is provided in more detail in the Performance Information Section and the financial information is provided in more detail
in the Financial Section.
PERFORMANCE INFORMATION SECTION The Performance Information Section details the USPTO’s performance accomplishments relative to the agency’s strategic plan as required by Office of Management and Budget (OMB) Circular A-11, “Preparation, Submission, and Execution of the Budget.” This section identifies the USPTO’s key and supporting performance metrics and results achieved under the strategic goals and objectives. An overview is also provided of how the performance data are verified and validated.
FINANCIAL SECTION A message from the USPTO’s Chief Financial Officer opens this section, followed by the agency’s audited financial statements, accompanying notes, required supplementary information, and the independent auditors’ report.
OTHER INFORMATION SECTION This section provides a Schedule of Spending, which ties back to the Statement of Budgetary Resources in the Financial Section, detailing resources available and how and where money was spent. This section also provides the top management challenges facing the USPTO, as identified by the Inspector General; matters related to the Civil Monetary Penalty Act; a summary table of financial statement audit and management assurances; information on the agency’s efforts to eliminate improper payments; information on the government-wide effort to freeze the federal footprint; the FY 2015 USPTO Campus Update; and reporting requirements required under USPTO legislation (FY 2015 Workload Tables and the Nature of Training Provided to the USPTO examiners).

www.uspto.gov
9
GLOSSARY OF ACRONYMS AND ABBREVIATIONS The glossary details and lists the acronyms used throughout this report.
URL INDEXFor those using the paper version of the USPTO PAR, the items underlined can be found in the Uniform Resource Locator (URL) Index on page 216. It provides full Web addresses for all hyperlinks included in the Management’s Discussion and Analysis narrative.

PERFORMANCE AND ACCOUNTABILITY REPORT
10
MANAGEMENT’S DISCUSSION AND
ANALYSIS

www.uspto.gov
11
Mission and Organization of the USPTO
The USPTO’s mission is derived from Article I, Section 8, Clause 8, of the Constitution, “to promote the progress of science and useful arts, by securing for limited times to authors and inventors the exclusive right to their respective writing and discoveries,” and the Commerce Clause of the Constitution (Article 1, Section 8, Clause 3) supporting the federal registration of trademarks.
For most of the last century, the United States has been the clear leader in developing new technologies, products, and entire industries that provide high-value jobs for Americans, enabling the USPTO to maintain its economic and technological leadership.
As an agency of the U.S. Department of Commerce, the USPTO is uniquely situated to support the Department’s mission to create conditions for economic growth and opportunity by promoting innovation, entrepreneurship, competitiveness, and stewardship.
OUR ORGANIZATION As shown in Figure 1, the USPTO is led by the Under Secretary of Commerce for Intellectual Property and Director of the USPTO, who consults with the Patent Public Advisory Committee (PPAC) and the Trademark Public Advisory Committee (TPAC). The USPTO is composed of two major components, the Patent Business Line and the Trademark Business Line, both of which are teamed with several other supporting units, as shown in the organization chart labeled Figure 1.
In FY 2015, the USPTO saw the swearing in of a new Under Secretary of Commerce for Intellectual Property and Director and also a Deputy Under Secretary of Commerce for Intellectual Property and Deputy Director. Michelle K. Lee was sworn in as the USPTO’s Under Secretary on January 13, 2015. Russ Slifer was sworn in as Deputy Under Secretary in March. Secretary of Commerce Penny Pritzker also appointed a new Commissioner for Patents and a new Commissioner for Trademarks. Andrew Hirshfeld was appointed the new Commissioner for Patents on July 30, 2015. Earlier this fiscal year, Mary Boney Denison was sworn in as the Commissioner for Trademarks.
Headquartered in Alexandria, VA, the USPTO also has regional offices in Detroit, MI, and in Denver, CO. In early FY 2016, the USPTO opened its Silicon Valley Regional Office in San Jose, CA, on October 15, 2015, and opened its Texas Regional Office in Dallas on November 9, 2015 (Figure 2). The USPTO began referring to satellite offices as regional offices in FY 2015.
USPTO MISSION“Fostering innovation, competitiveness and economic growth, domestically and abroad by delivering high quality and timely examination of patent and trademark applications, guiding domestic and international intellectual property policy, and delivering intellectual property information and education worldwide, with a highly-skilled, diverse workforce.”

PERFORMANCE AND ACCOUNTABILITY REPORT
12
Figure 1.U.S. PATENT AND TRADEMARK OFFICE ORGANIZATIONAL CHART
Under Secretary of Commerce for Intellectual Property andDirector of the United States Patent and Trademark Office
Deputy Under Secretary of Commerce for Intellectual Property andDeputy Director of the United States Patent and Trademark Office
Patent PublicAdvisory Committee
Patent Trial andAppeal Board
Trademark PublicAdvisory Committee
Trademark Trial andAppeal Board
Commissionerfor Patents
Commissioner for Trademarks
Chief Policy Officer and Director for
International Affairs
Chief Administrative
Officer
ChiefCommunications
Officer
Chief Financial
Officer
ChiefInformation
Officer
Director of EEO and
Diversity
General Counsel
See www.uspto.gov/about-us for more details about the USPTO organization.
Figure 2. MAP OF THE USPTO AND REGIONAL OFFICES
This change reflects the expanded presence these offices have assumed in their respective regions. Finally, the USPTO has two storage facilities located in Virginia and Pennsylvania.
The USPTO has evolved into a unique government agency. In 1991, under the Omnibus Budget Reconciliation Act (OBRA) of 1990, the USPTO became fully supported by user fees to fund its operations. In 1999,
the American Inventors Protection Act (AIPA) established the USPTO as an agency with performance-based attributes, for example, a clear mission statement, measurable services, a performance measurement system, and known sources of funding. In 2011, President Obama signed into law the Leahy–Smith America Invents Act (AIA). The AIA promotes innovation and job creation by improving patent quality, clarifying patent rights, reducing the application backlog, and offering effective alternatives to costly patent litigation. It also provides temporary fee-setting authority that is essential to the USPTO’s sustainable funding model.

www.uspto.gov
13
As the clearinghouse for U.S. patent rights, the USPTO is an important catalyst for U.S. economic growth, because it plays a key role in fostering the innovation that drives job creation, investment in new technology, and economic recovery. Through the prompt granting of patents, the USPTO promotes the economic vitality of American business, paving the way for investment, research, scientific development, and the commercialization of new inventions. The USPTO also promotes economic vitality by ensuring that only valid patent applications are granted, thus providing certainty that enhances competition in the marketplace.
PATENT ORGANIZATION The Patent organization examines patent applications to determine whether the claimed invention is eligible for patent protection, useful, adequately disclosed, clearly defined, and evaluates the claimed invention in comparison to a large body of technological information to determine whether it is novel and non-obvious. Patent examiners also respond to Appeal Briefs on applications appealed to the Patent Trial and Appeal Board (PTAB) and prepare preliminary examination reports for international applications filed under the Patent CooperationTreaty (PCT). The patent process includes performing an administrative review of newly filed applications, publishing pending applications, issuing patents to successful applicants, and disseminating issued patents to the public.
TRADEMARK ORGANIZATION The Trademark organization registers marks (trademarks, service marks, certification marks, and collective membership marks) that meet the requirements of the Trademark Act of 1946, as amended, and provides notice to the public and businesses of the trademark rights claimed in the pending applications and existing registrations of others. The core process of the Trademark organization is the examination of applications for trademark registration. As part of that process, examining attorneys make determinations of registrability under the provisions of the Trademark Act, which includes searching the electronic databases for any pending or registered marks that are confusingly similar to the mark in a subject application, preparing letters informing applicants of the attorney’s findings, approving applications to be published for opposition, and examining statements of use in applications filed under the Intent-to-Use provisions of the Trademark Act.
In the domestic arena, the USPTO provides technical advice and information for executive branch agencies on intellectual property (IP) matters and trade-related aspects of IP rights. In the international arena, the USPTO works with foreign governments to establish regulatory and

PERFORMANCE AND ACCOUNTABILITY REPORT
14
Figure 3. USPTO STAFFING
Patent Examiners (9,161)
Trademark Examining Attorneys (456)
Remaining USPTO Staff (3,050)
enforcement mechanisms that meet international obligations relating to the protection of IP.
Contributors The financial and program performance information presented in this report is the joint effort of the Under Secretary’s office, the Patent organization, the Trademark organization, the Office of Policy and International Affairs (OPIA), the Office of the Chief Information Officer (OCIO), the Office of the Chief Administrative Officer (OCAO), the Office of Equal Employment Opportunity and Diversity (OEEOD), the Office of the Chief Communications Officer (OCCO), the Office of the General Counsel (OGC), and the Office of the Chief Financial Officer (OCFO).
OUR PEOPLE At the end of FY 2015, the USPTO workforce (Figure 3) was composed of 12,667 federal employees (including 9,161 patent examiners and 456 trademark examining attorneys).
www.uspto.gov
15
Significant Case Law Developments
RECENT DECISIONS The USPTO continues to play a critical role in shaping IP law through litigation, as both a party and as an amicus (i.e., “friend of the court”). The agency’s IP litigation responsibilities fall primarily on the Office of the Solicitor within the USPTO’s OGC. The Solicitor’s Office defends, among other things, the decisions of the agency’s two administrative boards (i.e., the PTAB and Trademark Trial and Appeal Board (TTAB)), the decisions of the Director, and the agency’s rulemaking and policies in court. This litigation encompasses a wide variety of subject matter, affecting both agency practice and substantive patent and trademark law, and implicating a broad spectrum of legal issues.
Notably, the USPTO is currently involved in two controversial appeals arising from separate TTAB decisions issued pursuant to section 2(a) of the Lanham Act (15 U.S.C. § 1052(a)), which prohibits the registration of marks that may disparage persons or bring them into contempt or disrepute: BlackHorse v. Pro-Football, Inc., and In re Tam. The appeals will be decided by different appellate courts with potentially different results, though involving the same statutory provision.
In the more highly publicized of the two cases, Blackhorse v. Pro-Football, Inc., a Native American group seeks the cancellation of various trademark registrations for use of the term “REDSKINS” in relation to professional football services. The TTAB found that the petitioner, Blackhorse, presented sufficient evidence to establish that the marks were disparaging to Native Americans at the time of their registration, and issued a decision holding that the registrations must be canceled. Pro-Football challenged the TTAB’s decision in the U.S. District Court for the Eastern District of Virginia, making various constitutional claims, for example, arguing that barring federal registration of disparaging marks violates Pro-Football’s right to freedom of speech under the First Amendment. On the USPTO’s recommendation, the United States intervened to defend the constitutionality of Section 2(a), and the Solicitor’s Office worked closely with the Department of Justice on the briefs. In its July 8, 2015, decision, the District Court upheld the statute’s constitutionality and affirmed the TTAB’s determination that the marks were disparaging to Native Americans at the time they were registered. Pro-Football has appealed to the U.S. Court of Appeals for the Fourth Circuit, which will hear argument in the case in 2016.

PERFORMANCE AND ACCOUNTABILITY REPORT
16
Though less well publicized than BlackHorse, Tam may potentially have more significant implications for federal trademark law because the U.S. Court of Appeals for the Federal Circuit—that is, the primary reviewing court for TTAB decisions—will rehear this case to decide whether Section 2(a)’s bar to registration of disparaging marks is unconstitutional. Tam involves an unsuccessful attempt by The Slants, a Portland-based band composed of musicians of Asian-American descent, to federally register with the USPTO the term “THE SLANTS” for use in music entertainment services. On initial appeal to the Federal Circuit, the Solicitor’s Office defended and won an affirmance of the TTAB’s determination that the mark disparages Asian Americans, despite the applicant’s contention that the band’s adoption of the name The Slants was “a way to reclaim a racial slur and to assert Asian pride.” The Federal Circuit panel also rejected the applicant’s First Amendment challenge under binding circuit precedents, such as In re McGinley, 660 F.2d 481 (C.C.P.A. 1981), which hold that the First Amendment is not implicated by the USPTO’s refusal to register a mark under an analogous provision in Section 2(a), barring registration of scandalous or immoral marks because denial of federal registration does not proscribe any conduct or suppress any tangible form of expression. That is, an applicant can still use its mark and assert any common law rights that may exist in a mark without a federal registration. The en banc (i.e., as a body made up of all the judges of the Court rather than as a smaller panel) Court subsequently vacated the panel decision and ordered that the case be heard en banc to decide if McGinley’s holding should be revisited. The Solicitor’s Office worked closely with the Department of Justice on the Director’s en banc brief, which argues that Section 2(a) does not restrict Mr. Tam’s speech and that the First Amendment does not otherwise compel Congress, through its optional federal registration program, to underwrite the commercial use of racially disparaging marks, record them on the government’s Principal Register, and certify their registration under the official seal of the USPTO.

www.uspto.gov
17
Performance Highlights
INTRODUCTION TO PERFORMANCE This section of the Management’s Discussion and Analysis describes the USPTO’s strategic and performance-planning framework and provides highlights of the agency’s FY 2015 performance results. The USPTO issued its 2014–2018 Strategic Plan in 2014. The Plan demonstrates the progress made to date by building on the tangible successes of recent years with a focus on achieving the USPTO’s vision as a global IP leader by:
• Establishing the optimal pendency and quality levels for both patentsand trademarks that will enable the USPTO to operate efficiently andeffectively within the expectations of the IP community;
• Administering effectively the provisions of the AIA;• Continuing to transform the USPTO with next-generation technology
and services;• Maintaining a strong and diverse leadership team, agile management
structure, and a diverse and engaged cadre of employees in achievingthe agency’s mission and vision;
• Continuing to work with other government agencies, Congress, andUSPTO’s global partners to establish IP systems that benefit innovation,create jobs, and lead to strong economies around the world; and
• Recruiting and retaining the highest quality employees to accomplishthe agency’s important work.
The USPTO’s 2014–2018 Strategic Plan recognizes that innovation has become a principal driver of the modern economy by stimulating economic growth and creating high-paying jobs. America’s innovators rely on the U.S. patent and trademark systems to secure investment capital and to bring their products and services to the marketplace as soon as possible. As a result, it is critical that the USPTO thrive for American innovation to succeed.
STRATEGIC PERFORMANCE FRAMEWORK To fulfill the mission and goals included in the FY 2014–2018 Strategic Plan, the USPTO developed a comprehensive Strategic Performance Framework that guides and monitors implementation of its objectives, initiatives, and performance measures and indicators. The comprehensive framework also includes the balanced scorecard that is included in the Accompanying Information section of the 2014–2018 Strategic Plan (pp. 28–38). Each responsible business unit prepared action plans for implementing each of the initiatives, and results are documented semiannually and reported to the Director and executive staff.

PERFORMANCE AND ACCOUNTABILITY REPORT
18
The USPTO’s strategic goals are aligned to the U.S. Department of Commerce’s strategic goals and objectives. These priorities support the U.S. Department of Commerce’s strategic objectives of increasing opportunities for U.S. companies by opening markets globally, increasing the capacity of U.S. regional economies to accelerate the production of value-added goods and services, strengthening the Nation’s digital economy by championing policies that maximize the potential of the Internet, expanding broadband capacity, enhancing cybersecurity, and accelerating growth of innovation-intensive economic sectors by building public and private capacity to invent, improve, and commercialize new products and services.
For 2015 there were 11 Strategic Plan key performance outcome measures all designed to achieve the USPTO’s strategic goals. Annual performance targets were developed for each measureable outcome. Supporting measures are metrics that support or facilitate progress on the key performance measures. In FY 2015, the USPTO met or exceeded its targets for 8 out of 11 key performance metrics. A summary of the key performance measurement results is provided in Tables 1 and 2.
TABLE 1 : Summary of FY 2015 Key Performance Measure Results
Strategic Goal Total Number of Objectives
Total Number of Key Performance
Measures
Key Performance Measures that
Met Target
Key Performance Measures that Were Slightly Below Target
Key Performance Measures Where
the Target was Not Met
Goal I: Optimize Patent Quality and Timeliness
7 3 1 – 2
Goal II: Optimize Trademark Quality and Timeliness
5 6 6 – –
Goal III: Provide Domestic and Global Leadership to Improve Intel-lectual Property Policy, Protection, and Enforcement Worldwide
2 2 1 – 1
Management Goal:* Achieve Organization Excellence
5 – – – –
TOTAL 19 11 8 – 3* At the USPTO, the Management Goal enables the two primary strategic goals for patent and trademark pendency and quality. Management Goal performancemeasures are subsets of the performance indicators contained within the first two strategic goals. Moreover, the cost of these Management Goal activities is rolled into the expense of executing the agency’s primary strategic goals. It is for this reason that financial splits in Table 2 are reported among the first three goals, rather than among all four goals. The USPTO does, however, ensure that major or significant accomplishments and challenges in the Management Goal area are faithfully reported in its Performance and Accountability Reports.

www.uspto.gov
19
The FY 2015 USPTO performance results are illustrated in Table 1 and Figure 4. The goals and objectives for these performance commitments are outlinedin the strategic framework presented in Table 3. A summary of strategic goal results by strategic goal is presented in Figure 4.
TABLE 2Summary of Key Strategic Goal Results for FY 2011–2015
Strategic Goals Key Performance Measures FY 2011Actual
FY 2012Actual
FY 2013Actual
FY 2014Actual
FY 2015Target
FY 2015Actual*
GOAL I: Optimize Patent Quality and TimelinessAverage First Action Pendency (in months) 28.0 21.9 18.2 18.4 16.4 17.3
Average Total Pendency (in months) 33.7 32.4 29.1 27.4 27.7 26.6
Patent Quality Composite Score 30.7 72.4 71.9 75.0 83–91 42.9
GOAL II: Optimize Trademark Quality and TimelinessAverage First Action Pendency (in months) 3.1 3.2 3.1 3.0 2.5–3.5 2.9
Average Total Pendency (in months) 10.5 10.2 10.0 9.8 12.0 10.1
First Action Compliance Rate 96.5% 96.2% 96.3% 95.8% 95.5% 96.7%
Final Compliance Rate 97.0% 97.1% 97.1% 97.2% 97.0% 97.6%
Exceptional Office Action 23.6% 26.1% 35.1% 43.0% 36.0% 48.3%
Trademark Applications Processed Electronically 73.0% 77.0% 79.0% 80.7% 80.0% 82.2%
GOAL III: Provide Domestic and Global Leadership to Improve Intellectual Property Policy, Protection, and Enforcement WorldwidePercentage of prioritized countries for which country teams have made progress on at least 75% of action steps in the country- specific action plans along the following dimensions:• Institutionalimprovementsofintellectualproperty(IP)office
administration for advancing IP rights,• InstitutionalimprovementsofIPenforcemententities,• ImprovementsinIPlawsandregulations,and• Establishmentofgovernment–to–governmentcooperative
mechanisms.
100.0% 75.0% 100.0% 100.0% 75.0% 100.0%
Number of Foreign Government Officials Trained on Best Practices to Protect and Enforce Intellectual Property
N/A N/A N/A 4,960 6,300 5,283
*Current year actuals are preliminary and may change after the publication of this report. Subsequent changes, if any, will be reported in the FY 2016 Performance and Accountability Report.
Met (100% of target) Slightly below (95–99% of target) Not met (below 95% of target)

PERFORMANCE AND ACCOUNTABILITY REPORT
20
Figure 4.2015 PERFORMANCE RESULTS BY STRATEGIC GOAL
GOAL I GOAL II GOAL III TOTAL
mea
sure
s
1211
10987654321
Met (100% of target)Slightly below (95–99% of target)Not met (below 95% of target)
SUMMARY OF STRATEGIC GOAL RESULTSTable 2 highlights the FY 2015 actual performance results for the USPTO’s key performance measures against established goal objectives and performance targets. For those measures that have been retained from prior fiscal years, the table also includes actual performance results for the past four fiscal years. For the latest updated status of these and other performance measures, please visit the USPTO’s Data Visualization Center. More complete performance data are included in the Performance Information Section.

www.uspto.gov
21
TABLE 32014–2018 Strategic Plan
MISSIONFostering innovation, competitiveness and economic growth, domestically and abroad by delivering high quality and timely examination
of patent and trademark applications, guiding domestic and international intellectual property policy, and delivering intellectual property information and education worldwide, with a highly-skilled, diverse workforce.
VISIONLeading the Nation and the World in Intellectual Property (IP) Protection and Policy
Strategic Goals with Resources Invested Objectives
Goal I:Optimize Patent Quality and Timeliness
Obligations: $2,804.3 million Total Program Cost: $2,683.5 million
Refine Optimal Patent Pendency
Increase Efficiencies and Patent Examination Capacity to Align with the Optimal Patent Pendency
Increase International Cooperation and Work Sharing
Continue to Enhance Patent Quality
Ensure Optimal Information Technology (IT) Service Delivery to All Users
Continue and Enhance Stakeholder and Public Outreach
Maintain the Patent Trial and Appeal Board’s (PTAB's) Ability to Provide Timely and High-Quality Decisions
Goal II:Optimize Trademark Quality and Timeliness
Obligations: $312.3 million Total Program Cost: $276.6 million
Maintain Trademark First Action Pendency on Average Between 2.5–3.5 Months with 12 Months Pendency
Maintain High Trademark Quality
Ensure Optimal IT Service Delivery to All Users
Continue and Enhance Stakeholder and Public Outreach
Enhance Operations of the Trademark Trial and Appeal Board (TTAB)
Goal III:Provide Domestic and Global Leadership to Improve Intellectual
Property Policy, Protection, and Enforcement WorldwideObligations: $59.4 million
Total Program Cost: $52.7 million
Provide Leadership and Education on IP Policy and Awareness
Provide Leadership and Education on International Agreements and Policies for Improving the Protection and Enforcement of IP Rights
MANAGEMENT GOAL:Achieve Organizational Excellence*
Leverage IT Investments to Achieve Business Results
Continue to Build and Maintain a Flexible, Diverse, and Engaged Workforce
Enhance Internal and External Relations
Secure Sustainable Funding to Deliver Value to Fee-Paying Customers and the Public
Establish Regional (formerly Satellite) Offices and a Regional Presence
* The cost associated with Management Goal activities is distributed among the agency’s primary Strategic Goals I, II, and III.

PERFORMANCE AND ACCOUNTABILITY REPORT
22
Management Challenges and What’s AheadSUSTAINABLE FUNDING Attaining and maintaining full sustainable funding continues to be a challenge, particularly in this era of increased budgetary pressures. Success promotes increased demand, and the USPTO must be positioned to respond to this demand for quality and timely services that benefit the American business community in a fiscally responsible manner. The USPTO will continue to pursue full access to all fee collections, maintain an operating reserve, stay current with business-oriented financial tools, optimize the fee structure under existing authorities, and seek permanent fee-setting authority. Failure could mean loss of fee-payer confidence if the USPTO cannot fulfill the performance commitments it makes when setting fees.
As a fully user-fee-reliant government entity, the USPTO must not only justify its annual budget requirements, but also must plan and project for the fee collections that will be used to fund those requirements. Because its business activities cross fiscal year lines, the USPTO conducts multiyear planning at both the strategic and operational levels. Multiyear planning and budgeting help to identify long-term trends, develop long-term operational goals supported by long-term financial strategies, and address long-term issues. This process reinforces the commitment to financial stability by looking beyond the one-year time horizon in funding operating programs and capital improvements and promotes more orderly spending patterns, which are a critical component for successful achievement of performance targets, revenue planning, and fee-setting.
MANAGING THE PATENT BUSINESS’ TRANSITION TO MAINTENANCE MODE As the patent business comes closer to achieving its pendency and inventory targets, it will become increasingly more challenging to effectively manage the transition to a steady-state operation. To this end, the patent business unit is looking to gain efficiencies in the pre-examination process, align workforce size with workload, and address the reality of achieving pendency targets in certain technology areas sooner than in others.
ADMINISTERING AIA PROVISIONS The AIA significantly affected the operations of the PTAB. Success in implementing the patent dispute resolution portions of the AIA has made the PTAB a preferred tribunal, attracting business away from district courts and thereby increasing the PTAB’s case workload to levels that make

www.uspto.gov
23
meeting the AIA’s 12-month pendency requirements more challenging. One of the things PTAB has been doing to address this rise in case workload is to increase its staff to accommodate these changes. For more discussion on how PTAB is currently addressing this issue, please see Goal I, Objective 7,
“Maintain PTAB’s Ability to Provide Timely and High-Quality Decisions.”
ESTABLISHMENT OF OFFICE OF THE DEPUTY COMMISSIONER FOR TRADEMARK ADMINISTRATION Trademarks will establish the Office of the Deputy Commissioner for Trademark Administration early next fiscal year. The primary responsibilities of the Office will be to guide the strategic vision, lead the completion and transformation of the next generation of trademark information technology (IT) systems, and lead the performance planning and financial management of the Trademark organization. This new trademark office will be formed by realigning functions and employees responsible for business user requirements for the development and support of trademark IT systems; strategic planning, performance and financial management; and positions within the Legal Policy Office that support the Trademark Electronic Application System (TEAS), external Web pages, and the interactions of trademark applicants and their attorneys with respect to trademark IT systems. As the Trademark organization expands, the challenge facing the Office of the Deputy Commissioner for Trademark Administration is ensuring that the USPTO has the resources and knowledge necessary to help the agency modernize its IT systems and assure its future as the world’s best trademark office.
RELATIONSHIPS WITH OVERSIGHT ENTITIES As a fully fee-funded performance-based organization, the USPTO does not receive any appropriated tax dollars like traditional federal agencies. The USPTO functions like a business in that it provides patent and trademark goods for a fee. Fee collections are deposited into an account with the Department of Treasury and then a budget justification is used to acquire the money from Congress. The taxpayer does not provide any additional money to support agency operations; thus, the appropriation is $0.
Oversight groups sometimes have difficulty understanding the difference between traditional federal agencies and a fully user-fee-funded agency (e.g., the USPTO must manage fee collections in addition to traditional spending; it must carry out multiyear planning, etc.). In addition, because the USPTO has to deposit the money into an account with Treasury and then essentially request it back, it looks at first glance like a regular appropriation. This arrangement sets several of USPTO’s functions, particularly finance, apart from customary appropriations-based federal agencies.
The challenge for the USPTO is to enhance awareness and understanding of this somewhat unique revenue status with oversight groups. The agency

PERFORMANCE AND ACCOUNTABILITY REPORT
24
accomplishes this through outreach, testimony to oversight groups, and explanations to the public about what the USPTO does and how it does it.
RELIANCE ON INFORMATION TECHNOLOGY The core mission of IT at the USPTO is to utilize technology to find ways to help the agency run more smoothly as a business. With that in mind, IT is a mission-critical enabler for every aspect of its operations. The challenge is to manage employee and customer expectations, implement changes brought on by new legislation and the adoption of new technology, address evolving cybersecurity requirements, and plan long-term projects.
IT systems must scale with the business need, support a nationwide workforce with “24/7/365” operational capability, improve examination and revenue-collection capabilities, provide recovery needs to sustain the business, make successful and reliable IT deployments, and enhance the understanding of the interactions between IT and performance, business functions, services, and data.
The USPTO will continue to enhance the IT capabilities offered for both patent and trademark business areas. These include implementing core electronic examination tools for document management and searching; improving interactions with the office for filing, searching, payment, and communication; and making doing business with the USPTO easier and more secure.
LEGAL CHALLENGES The USPTO has already experienced a wave of legal challenges to its interpretation of the AIA and to the agency’s regulations implementing the statute. By the end of FY 2015, the attorneys in the USPTO’s Office of the Solicitor intervened in more than 70 appeals from PTAB decisions in AIA post-grant proceedings. It is important to note that the U.S. Court of Appeals for the Federal Circuit has already affirmed the PTAB in over 35 appeals from AIA trials and has reversed in part only one AIA trial appeal (Microsoft v. Proxyconn), which nevertheless was a significant procedural victory for the agency in that it expressed approval of the PTAB’s post-grant claim amendment practice. The USPTO expects these legal challenges to continue over the next few years as more cases implementing the new AIA procedures become ripe for review.

www.uspto.gov
25
Systems and Controls
MANAGEMENT ASSURANCES
On the basis of the USPTO’s comprehensive internal control program during FY 2015, the USPTO can provide reasonable assurance that its internal control over the effectiveness and efficiency of operations and compliance with applicable laws and regulations as of September 30, 2015, was operating effectively. Accordingly, I am pleased to certify with reasonable assurance that our agency’s
systems of internal control, taken as a whole, comply with Section 2 of the Federal Managers’ Financial Integrity Act of 1982. Our agency also is in substantial compliance with applicable federal accounting standards and the U.S. Standard General Ledger at the transaction level and with federal financial system requirements. Accordingly, our agency fully complies with Section 4 of the Federal Managers’ Financial Integrity Act of 1982, with no material non-conformances.
In addition, the USPTO conducted its assessment of the effectiveness of our agency’s internal control over financial reporting, which includes safeguarding of assets and compliance with applicable laws and regulations, in accordance with OMB Circular A-123, Management’s Responsibility for Internal Control. Based on the results of this evaluation, the USPTO provides reasonable assurance that its internal control over financial reporting as of June 30, 2015, was operating effectively and no material weaknesses were found in the design or operation of the internal control over financial reporting. In addition, no material weaknesses related to internal control over financial reporting were identified between July 1, 2015, and September 30, 2015.
Michelle K. LeeUnder Secretary of Commerce for Intellectual Property and Director of the United States Patent and Trademark OfficeOctober 14, 2015
Federal Managers’ Financial Integrity Act (FMFIA)The FMFIA requires federal agencies to provide an annual statement of assurance regarding management controls and financial systems. USPTO management is responsible for establishing and maintaining effective internal control and financial management systems that meet the objectives of the FMFIA. The objectives of internal control are to ensure:
• Effectiveness and efficiency of operations;• Reliability of financial reporting; and• Compliance with laws and regulations.
The statement of assurance is based on the wide variety of evaluations, control assessments, internal analyses, reconciliations, reports, and other information, including the Department of Commerce’s Office of Inspector General (OIG) audits, and the independent public accountants’ opinion on the USPTO’s financial statements and their reports on internal control and compliance with laws and regulations. In addition, the USPTO is not identified on the Government Accountability Office’s High Risk List related to controls governing various areas.

PERFORMANCE AND ACCOUNTABILITY REPORT
26
Federal Financial Management Improvement Act (FFMIA)The FFMIA requires federal agencies to report on an agency’s substantial compliance with federal financial management system requirements, federal accounting standards, and the U.S. Standard General Ledger at the transaction level. In accordance with OMB Circular A-123, Appendix D, substantial compliance is achieved when an agency’s financial management systems routinely provide reliable and timely financial information for managing day-to-day operations as well as to produce reliable financial statements, maintain effective internal control, and comply with legal and regulatory requirements. The USPTO complied substantially with the FFMIA for FY 2015.
OTHER COMPLIANCE WITH LAWS AND REGULATIONS Federal Information Security Management Act (FISMA)The USPTO remains vigilant in reviewing administrative controls over information systems and is always seeking methods of improving its security program. During FY 2015, the USPTO continued its dedicated efforts in support of compliance with FISMA standards and improvement of its security program. The USPTO IT Security Program includes a strategy for continuous monitoring, which conducts credentialed compliance and vulnerability scans on servers, network devices, databases, and Web-applications on a quarterly basis. The quarterly analysis is being performed to ensure that operating systems have been configured in accordance with their security baseline and appropriate software patch levels. New secure baseline configuration guides are being developed with current configuration settings based on the addition of the newer operating systems devices. Additionally, the IT Security program has integrated artifacts to support Security Impact Analysis within the systems development lifecycle that allow assessment of testing requirements for systems undergoing new developments, enhancements, or maintenance. This proactive approach to security within the development process has successfully assessed changes and enabled security compliance for systems as they are being developed or updated.
As a result, the Chief Information Security Officer and the OCIO staff working together made a concerted effort to meet the compliance requirements of FISMA, while also meeting the reporting requirements to OMB. These endeavors were a success. All USPTO systems achieved a 100 percent FISMA compliance reporting level for FY 2015. There were no deficiencies identified that are considered to be the result of any material weaknesses in internal control. As a result of the work accomplished, the USPTO was able to continue with continuous monitoring and provide an accurate summary of information consistent with OMB reporting requirements for year-end reporting.
The Inspector General’s Statement of Management Challenges for the Department of Commerce (summarized in the Other Information section of this report) identifies IT security as a cause for concern department-wide, to include the USPTO. While the OIG continues to report IT security as a Commerce-wide concern, USPTO management does not agree that any of the USPTO-specific FISMA findings, either individually or collectively, rise

www.uspto.gov
27
to the level that would require treating the matter as a material weakness. As indicated, the USPTO’s continuous monitoring and proactive approach to security compliance for systems provides the support for removing the material weakness at the USPTO.
The USPTO continues to coordinate closely with the OIG throughout the year, as well as review annual assessments with the OIG, to gain additional insight and ensure compliance with requirements.
Improper Payments Elimination and Recovery ActThe USPTO continues to maintain internal control procedures that help monitor disbursement of federal funds for valid obligations. The USPTO continues to assess improper payment risks covering all programs and activities, as required by OMB Circular A-123, Appendix C, Requirements for Effective Measurement and Remediation of Improper Payments. These improper payment risk assessments include assessments of the control and procurement environments, and are now in the continuous process stage of being updated annually. Additional details can be found in the Other Information section of this report (see page 170).
Prompt Payment ActThe Prompt Payment Act requires federal agencies to report on their efforts to make timely payments to vendors, including interest penalties for late payments. In FY 2015, the USPTO did not pay interest penalties on 97.3 percent of the 11,712 vendor invoices processed, representing payments of approximately $862.5 million. Of the 324 invoices that were not processed in a timely manner, the USPTO was required to pay interest penalties on 321 invoices. The USPTO paid $20 in interest penalties for every million dollars disbursed in FY 2015. Virtually all recurring payments were processed by electronic funds transfer (EFT) in accordance with the EFT provisions of the Debt Collection Improvement Act of 1996.
Debt Collection Improvement ActThe Debt Collection Improvement Act prescribes standards for the administrative collection, compromise, suspension, and termination of federal agency collection actions, and referral to the proper agency for litigation. Although the Act has no material effect on the USPTO since it operates with minimal delinquent debt, all debt more than 120 days old has been transferred to the U.S. Department of the Treasury for cross-servicing.
Biennial Review of FeesThe Chief Financial Officers Act of 1990 requires a biennial review of agency fees, rents, and other charges imposed for services and things of value it provides to specific beneficiaries, as opposed to the American public in general. The objective of the review is to identify such activities and to begin charging fees, where permitted by law, and to periodically adjust existing fees to reflect current costs or market value so as to minimize general taxpayer subsidy of specialized services or things of value (such as rights or privileges) provided directly to identifiable non-federal beneficiaries. The USPTO is a fully fee-funded agency without subsidy of general taxpayer revenue. The USPTO

PERFORMANCE AND ACCOUNTABILITY REPORT
28
uses Activity Based Costing (ABC) to calculate the cost of activities performed for each fee, and uses this information to evaluate and inform when setting fees. When appropriate, fees are adjusted to be consistent with legislative requirements to recover full cost of the goods or services provided to the public.
Consistent with the provisions of the AIA, the USPTO will continue to assess fees on at least a biennial basis. In FY 2015, the USPTO completed the first comprehensive review of all fees following the initial patent fee adjustments published in January 2013 and trademark fee adjustments published in December 2014. The USPTO will follow the direction of Section 10 of the AIA for the setting and adjusting of fees. Section 10(c) of the AIA directs the USPTO to consult the PPAC and TPAC, respectively, annually on the advisability of reducing fees set or adjusted under Section 10(a).
OTHER SYSTEMS AND CONTROL CONSIDERATIONS Financial Management Systems Strategy The USPTO’s Consolidated Financial System (CFS) provides support for financial management, fee collections, procurement, and travel management functions to the USPTO. CFS leverages several Commercial-off-the-shelf (COTS)/Government-off-the-shelf (GOTS) products, including a core financial and acquisition system (Momentum Financials), an eTravel system (Concur), a budget execution and compensation projection system (Corporate Planning Tool using the Cognos Planning tool), a cost accounting system (Activity Based Information System built using the Profitability and Cost Management tool), and a data warehouse (Enterprise Data Warehouse accessed using the Business Objects tool). Additionally, CFS includes an internally developed fee collection system (Revenue Accounting and Management (RAM)), an imaging system (Office of Finance Imaging System built using the Documentum tool), and an internally developed application to automate the transit subsidy program (Transit Subsidy System).
The Fee Processing Next Generation (FPNG) investment will replace RAM, the USPTO’s legacy fee collection system, currently scheduled for implementation in FY 2017. FPNG will use a combination of COTS, GOTS, and open source code, as well as a custom user interface that has the same look-and-feel as other USPTO websites. Developing and implementing FPNG supports USPTO’s Strategic Priority, “Leverage IT Investments to Achieve Business Results,” and will replace legacy RAM with modern 21st century technology that has more automated internal controls, electronic commerce capabilities, and will be able to meet the patent and trademark fee collection needs of the future. As the USPTO progresses with its Patent and Trademark IT strategies (Patents End-to-End and Trademarks Next Generation), the fee processing system also needs to progress to the next generation, with the goals of improving financial and budget management agency-wide. The lack of modern technology in legacy RAM hinders the USPTO from taking full advantage of the potential benefits from Patents End-to-End and Trademarks Next Generation initiatives.

www.uspto.gov
29
Financial Discussion and Analysis
FINANCIAL HIGHLIGHTS The USPTO received an unmodified (clean) audit opinion from the independent public accounting firm of KPMG LLP on its FY 2015 financial statements, provided in the Financial Section of this report. This is the 23rd consecutive year that the USPTO received a clean opinion. Our unmodified audit opinion provides independent assurance to the public that the information presented in the USPTO financial statements is fairly presented, in all material respects, in conformity with accounting principles generally accepted in the United States of America. In addition, KPMG LLP reported no material weaknesses in the USPTO’s internal control, and no instances of non-compliance with laws and regulations affecting the financial statements. Refer to the Other Information section for the Summary of Financial Statement Audit and Management Assurances.
The summary financial highlights presented in this section provide an analysis of the information that appears in the USPTO’s FY 2015 financial statements. The USPTO financial management process ensures that management financial decision-making information is dependable, internal controls over financial reporting are effective, and that compliance with laws and regulations is maintained. The issuance of these financial statements is a component of the USPTO’s objective to continually improve the accuracy and usefulness of its financial management information.
Balance Sheet and Statement of Changes in Net PositionAt the end of FY 2015, the USPTO’s consolidated Balance Sheet presents total assets of $2,923.9 million, total liabilities of $1,522.8 million, and a net position of $1,401.1 million.
Total assets increased 57.8 percent over the last four years, resulting largely from the increase in Fund Balance with Treasury. The following graph shows the changes in assets during this period.

PERFORMANCE AND ACCOUNTABILITY REPORT
30
Fund Balance with Treasury is the single largest asset on the Balance Sheet and represents 85.3 percent of total assets at the end of FY 2015. Over half of the Fund Balance with Treasury represents fees the USPTO has collected, but has not been authorized to spend through the annual appropriation process—this includes temporarily unavailable fees of $937.8 million and unavailable special fund receipts under OBRA of $233.5 million, which total $1,171.3 million in unavailable fees. This asset is also comprised of unpaid obligated funds of $671.3 million, other funds held on deposit for customers of $147.3 million, and unobligated funds carried over from one year to the next (operating reserve) of $504.4 million.
The temporarily unavailable funds and the unavailable special fund receipts require Congressional appropriation before they will be available for USPTO’s use. These funds, together with amounts obligated and held on deposit, represent 79.8 percent of the Fund Balance with Treasury.
The operating reserve is available for use without further Congressional appropriation and is maintained to permit the USPTO to plan for long-term financial stability, as well as temporary changes in our cash flow. As such, the operating reserve is not tied to a specific event and enables the USPTO to address fluctuations in revenues or unexpected demands on resources. In addition, the operating reserve is used to manage cash flow at the beginning of the fiscal year to ensure the agency has adequate resources to sustain current operations. Total fee collections are lower than operating requirements early in the year, and do not fully cover the necessary expenses such as payroll and contractual obligations that occur close to the fiscal year start. The operating reserve is intended to provide sufficient resources to continue current operations until the collection of fees builds over the subsequent months.
As required by 35 U.S.C. § 42(c)(3), the USPTO maintains and tracks two separate and distinct operating reserve balances—one for Patent operations and one for Trademark operations. At the end of FY 2015, the Patent operating reserve was $402.6 million and the Trademark operating reserve was $101.8 million, or 1.8 and 4.4 months of operating expenses, respectively.
The other major asset is property, plant, and equipment. The net balance of this asset has increased by $199.1 million during the past four years, with the acquisition values of property, plant, and equipment increasing by $380.6 million. The USPTO is beginning to completely re-invent its IT systems from end-to-end, which will lead to future increases in IT hardware, software, and software in development values. This was evidenced by an increase of $374.2 million from FY 2011 through FY 2015 for IT hardware, software, and software in development.
Total liabilities decreased from $1,551.9 million at the end of FY 2014 to $1,522.8 million at the end of FY 2015, representing a decrease of $29.1 million, or 1.9 percent. The following graph shows the composition of liabilities during the past five years.

www.uspto.gov
31
The USPTO’s deferred revenue is the largest liability on the Balance Sheet. The liability for deferred revenue is calculated by analyzing the process for completing each fee service provided. The percent incomplete based on the inventory of pending work and completion status is applied to fee collections to estimate the amount for deferred revenue liability.
FY 2015 resulted in a decrease to the deferred revenue liability of $62.3 million, or 5.7 percent from FY 2014. The deferred revenue liability includes unearned patent and trademark fees, as well as undeposited checks. The unearned patent fees represented 92.9 percent of this liability for FY 2015. The following graph depicts the composition of the deferred revenue liability, in addition to the change in this liability during each of the past five years.

PERFORMANCE AND ACCOUNTABILITY REPORT
32
Deferred revenue at the USPTO is largely impacted by the change in patent and trademark filings, changes in the first action pendency rates, and changes in fee rates. Increases in patent and trademark filings, first action pendency rates, and fee rates result in increases in deferred revenue.
The following table depicts the changes in the filings and pendency rates during the past five years.
Filings and Pendencies FY 2011 FY 2012 FY 2013 FY 2014 FY 2015
Patent Filings 537,171 565,566 601,464 618,457 617,216*
Percentage Change in Patent Filings 5.3% 5.3% 6.3% 2.8% (0.2)%
Patent First Action Pendency (months) 28.0 21.9 18.2 18.4 17.3
Percentage Change in Patent First Action Pendency 8.9% (21.8)% (16.9)% 1.1% (6.0)%
Total Patent Pendency (months) 33.7 32.4 29.1 27.4 26.6
Percentage Change in Total Patent Pendency (4.5)% (3.9)% (10.2)% (5.8)% (2.9)%
Trademark Filings 398,667 415,026 433,654 455,017 503,889
Percentage Change in Trademark Filings 8.1% 4.1% 4.5% 4.9% 10.7%
Trademark First Action Pendency (months) 3.1 3.2 3.1 3.0 2.9
Percentage Change in Trademark First Action Pendency 3.3% 3.2% (3.1)% (3.2)% (3.3)%
Total Trademark Average Pendency (months) 10.5 10.2 10.0 9.8 10.1
Percentage Change in Total Trademark Average Pendency –% (2.9)% (2.0)% (2.0)% 3.1%
* Preliminary data
In FY 2015, unearned patent fees decreased 6.1 percent as a result of the decrease in first action pendency of 1.1 months, combined with decreased application filings. Deferred revenue associated with the patent process is expected to decrease in the upcoming years due to the anticipated decreases in pendencies. In the FY 2016 President’s Budget, the number of patent applications filed from FY 2016 through FY 2020 is expected to gradually increase, with first action pendency decreasing to 10.5 months and total pendency to 19.2 months by FY 2020. The pendency decreases will result in patent deferred revenue decreases.
The deferred revenue associated with the trademark process decreased in FY 2015. Trademark deferred revenue decreased by $0.4 million, or 0.5 percent, from FY 2014, with an overall 11.6 percent increase over the past four years. The FY 2015 decrease was consistent with trademark first action pendency decreasing to 2.9 months, offset by an increase in trademark applications and total trademark average pendency increasing to 10.1 months. Estimates included in the FY 2016 President’s Budget project the pendencies to remain constant in the upcoming years.
The Statement of Changes in Net Position presents the changes in the financial position of the USPTO due to results of operations. The movement

www.uspto.gov
33
in net position is primarily the result of the net income or net cost for the year. The change in the net position during the past five years is presented in the following graph.
The increase in net position from $1,295.4 million at the end of FY 2014 to $1,401.1 million at the end of FY 2015, or 8.2 percent, is attributable to the results of operations and other adjustments.
Statement of Net CostThe Statement of Net Cost presents the USPTO’s results of operations by the following responsibility segments—Patent, Trademark, and Intellectual Property Policy, Protection and Enforcement Worldwide. The following table presents the total USPTO’s results of operations for the past five fiscal years. In FY 2015, the USPTO generated a net income of $61.2 million. A significant portion of the increase was due to an increase in revenue recognition of previously deferred revenue collected as we work off the backlog.
Net Income(dollars in millions)
FY 2011 FY 2012 FY 2013 FY 2014 FY 2015
Earned Revenue $ 2,236.4 $ 2,427.1 $ 2,719.9 $ 3,018.1 $ 3,074.0
Program Cost (2,148.1) (2,321.0) (2,540.4) (2,732.4) (3,012.8)
Net Income $ 88.3 $ 106.1 $ 179.5 $ 285.7 $ 61.2
The Statement of Net Cost compares earned fees to costs incurred during a specific period of time. It is not necessarily an indicator of net income or net cost over the life of a patent or trademark. Net income or net cost for the fiscal year is dependent upon work that has been completed over the various phases of the production life cycle. The net income calculation is based on earned fees during the fiscal year being reported, regardless of when those fees were collected. Maintenance fees also play a large part

PERFORMANCE AND ACCOUNTABILITY REPORT
34
in whether a total net income or net cost is recognized, as these fees are considered earned immediately. Maintenance fees collected in FY 2015 are a reflection of patent issue levels 3.5, 7.5, and 11.5 years ago, rather than a reflection of patents issued in FY 2015. Therefore, maintenance fees can have a significant impact on matching costs and revenue.
During FY 2015, the Patent organization disposed of 0.7 percent more applications than were disposed of during FY 2014. In addition, the number of patent filings decreased by 0.2 percent over the prior year. These two changes, combined with pendency reductions and decreased fee collections, resulted in a decrease in patent deferred revenue and an increase in earned revenue.
During FY 2015, with the number of trademark applications increasing by 10.7 percent over the prior year, the Trademark organization was able to continue to address the existing inventory and maintain pendency between 2.5 and 3.5 months. The Trademark organization was able to do this while recognizing a slight decrease in deferred revenue and corresponding increase in revenue earned.
Earned RevenueThe USPTO’s earned revenue is derived from the fees collected for patent and trademark products and services. Fee collections are recognized as earned revenue when the activities to complete the work associated with the fee are completed. The earning process is the same for all collections even though a certain portion of the fees may not be made available to the USPTO for spending. Temporarily unavailable fee collections occur when the USPTO is not appropriated the authority to spend all fees collected during a given year. The USPTO did not collect any fees that were designated as unavailable during FY 2015.
Earned revenue totaled $3,074.0 million for FY 2015, an increase of $55.9 million, or 1.9 percent, over FY 2014 earned revenue of $3,018.1 million. Of revenue earned during FY 2015, $804.4 million related to fee collections that were deferred for revenue recognition in prior fiscal years; $1,187.6 million related to maintenance fees collected during FY 2015, which were considered earned immediately; $1,076.1 million related to work performed for fees collected during FY 2015; and $5.9 million were not fee-related.
For fees, other than maintenance fees, collected and earned during FY 2015, there was a decrease of $74.0 million over these same earned fees during FY 2014. This decrease can primarily be attributed to the decrease in customer payments in the areas of Patent post-allowance (issue, post-grant publication, and recording) and petition fees, offset by an increase in earnings for other Patent services.
FY 2015 Earned Revenue
Patent, 91.1%Trademark, 8.9%

www.uspto.gov
35
PatentTraditionally, the major components of earned revenue derived from patent operations are maintenance fees; initial application fees for filing, search, and examination; and issue fees. These fees account for approximately 83 percent of total patent income. The accompanying chart depicts the relationship among the most significant patent fee types.
Patent maintenance fees are the largest source of earned revenue by fee type. During FY 2015, maintenance fees collected decreased $59.5 million, or 4.8 percent, from FY 2014. Since these fees are recognized immediately as earned revenue, any fluctuations in the rates of renewal have a significant impact on the total earned revenue of the USPTO. To some extent, renewals recoup costs incurred during the initial patent process. As shown below, the renewal rates for all three stages of maintenance fees decreased this year.
FY 2015 Patent Revenue by Fee Type
Maintenance, 42.5%Filing, Search, and Examination, 31.3%Issue, 9.6%Extensions of Time, 5.2%PCT, 1.5%Services, 0.1%Other, 9.8%
Patent Renewal Rates* FY 2011** FY 2012** FY 2013 FY 2014 FY 2015First Stage 101.3% 78.3% 92.0% 91.8% 84.7%
Second Stage 80.6% 55.7% 63.3% 78.8% 66.1%
Third Stage 60.0% 47.0% 47.0% 50.7% 46.7%
* Note: The First Stage refers to the end of the 3rd year after the initial patent is issued; the Second Stage refers to the end of the 7th year after the initial patent is issued; and the Third Stage refers to the end of the 11th year after the initial patent is issued. For example, in FY 2015, 84.7 percent of the patents issued three years ago were renewed, 66.1 percent of the patents issued seven years ago were renewed, and 46.7 percent of the patents issued 11 years ago were renewed.
** Note: Due to the implementation of the 15 percent fee surcharge on September 26, 2011, the FY 2011 renewal rates include some early renewals that would have otherwise been renewed in FY 2012.
Application fee revenue earned upon filing increased from $101.6 million in FY 2014 to $103.5 million in FY 2015 (increase of 1.9 percent), with the number of applications decreasing from 618,457 to 617,216 over the same period (decrease of 0.2 percent). The decrease in application filings is a result of decreased customer demand. The FY 2016 President’s Budget projects an increase in patent applications filed beginning in FY 2016 through FY 2020, which will contribute to continued budgetary resources, as well as earned fee revenue.
Earned issue fee revenue decreased from $345.8 million in FY 2014 to $268.7 million in FY 2015 (decrease of 22.3 percent), with the number of patents issued decreasing from 329,612 to 322,448 over the same period (decrease of 2.2 percent). The decrease in patent issues is in line with the decreases in production and the patent allowance rate (see page 56). The FY 2016 President’s Budget projects that patents issued will gradually increase, which will result in increases in maintenance fees in future years.

PERFORMANCE AND ACCOUNTABILITY REPORT
36
TrademarkTrademark fees are comprised of application filing, renewals, services, and Trademark Trial and Appeal Board fees. Additional fees are charged for intent-to-use filed applications, as additional requirements must be met for registration. The accompanying chart depicts the relationship among the most significant trademark fee types.
Earned revenue for trademark applications increased from $140.4 million in FY 2014 to $145.1 million in FY 2015, with the number of trademarks registered increasing from 279,282 to 282,091 over the same period, increases of 3.3 percent and 1.0 percent, respectively. The FY 2016 President’s Budget projects that trademark applications filed will continue to increase, which will contribute to the continued growth in budgetary resources, as well as earned fee revenue.
Trademark registrations are a recurring source of revenue. To some extent, renewal fees recoup costs incurred during the initial examination process. As shown below, the renewal rates for trademarks have remained fairly stable over the last five years, indicating continued earned revenue from this source. Further, in the FY 2016 President’s Budget, earned revenue from trademark renewals is expected to continue at approximately the same renewal rates in the future.
FY 2015 Trademark Revenue by Fee Type
Use-Based and Intent-to-Use Applications for Registration, 53.1%Renewal Fees, 9.2%Services, 7.3%Trademark Trial and Appeal Board, 13.8%Other Intent-to-Use Fees, 16.6%
Trademark Renewal Rates* FY 2011 FY 2012 FY 2013 FY 2014 FY 2015†
Renewals 29.3% 30.2% 31.5% 32.4% 29.5%
* Note: The renewals occur every 10th year for registered trademarks. For example, in FY 2015, 29.5 percent of the trademarks granted 10 years ago were renewed.
† Preliminary data

www.uspto.gov
37
Program CostsProgram costs totaled $3,012.8 million for the year ended September 30, 2015, an increase of $280.4 million, or 10.3 percent, over FY 2014 program costs of $2,732.4 million. The USPTO’s most significant program cost is personnel services and benefits, which comprise approximately 63 percent of the USPTO’s total program costs. Any significant change or fluctuation in staffing or pay rate directly impacts the change in total program costs from year-to-year. Total personnel services and benefits costs for the year ended September 30, 2015, were $2,057.2 million, an increase of $114.2 million, or 5.9 percent, over FY 2014 personnel services and benefits costs of $1,943.0 million. This change was predominantly the result of a net increase of 217 personnel, from 12,450 at the end of FY 2014 to 12,667 at the end of FY 2015.
The USPTO directs maximum resources to the priority functions of patent and trademark examination, as well as IP policy, protection, and enforcement worldwide. For FY 2015, costs directly attributable to the Patent, Trademark, and IP protection business areas represent 81.0 percent of total USPTO costs. The remaining costs, representing support costs, are allocated to the business areas using ABC accounting. Allocated costs increased 24.3 percent over the past year in line with increased IT investments.
FY 2015 Program Costs
Personnel Costs, 62.9%Rent, Communication, and Utilities, 3.0% Printing, 4.3%Contractual Services, 7.6% Other, 1.7%Depreciation, 1.5%Allocated Costs, 19.0%

PERFORMANCE AND ACCOUNTABILITY REPORT
38
PatentTotal costs for the Patent business unit increased $770.2 million, 40.3 percent, from FY 2011 through FY 2015. The Patent organization’s most significant program costs relate to personnel services, and account for 58.6 percent of the increase in total cost of Patent operations during the past four years. Patent personnel costs for the year ended September 30, 2015, were $1,732.6 million, an increase of $92.0 million, or 5.6 percent, over FY 2014 personnel costs of $1,640.6 million. Rent, communications, utilities, printing and reproduction, and contractual service costs represent 14.9 percent of the Patent program costs for FY 2015. During FY 2015, contractual costs increased as a result of support costs increases for Patent IT systems.
Patent costs were predominantly spread over two patent products: utility patents and 371 filings (an international application). The cost percentages presented are based on direct and indirect costs allocated to patent operations and are a function of the volume of applications processed in each product area.
FY 2015 Patent Cost by Product
Utility, 73.3%371 Filing, 15.9% Patent Trial and Appeal Board, 3.8%Other, 2.7%PCT, 2.2%Design, 1.9%Plant, 0.2%

www.uspto.gov
39
TrademarkTotal costs for the Trademark business unit increased $84.8 million, 44.2 percent, from FY 2011 through FY 2015. The Trademark organization’s most significant program costs relate to personnel services, and account for most of the increase in total direct cost of Trademark operations during the past four years. This increase of $24.0 million was offset by other cost increases and decreases.
The overall cost percentages presented below are based on both direct costs and indirect costs allocated to trademark operations and are a function of the volume of applications processed in each product area.
FY 2015 Trademark Cost by Product
New Applications, 76.1%Trademark Trial and Appeal Board, 8.7%Other Services, 4.7%Intent-to-Use Marks, 5.1%Renewals and Post Registration, 4.6%Madrid Protocol, 0.8%

PERFORMANCE AND ACCOUNTABILITY REPORT
40
Intellectual Property Policy, Protection, and Enforcement WorldwideTotal costs for IP Protection increased $9.7 million, or 22.6 percent, from FY 2011 through FY 2015. The most significant program costs for IP Protection in FY 2015 relate to personnel services, and account for 47.6 percent of the total cost for IP Protection operations. The next largest cost associated with the policy, protection, and enforcement of intellectual property worldwide is contractual services, which include joint project agreements. These costs were incurred in line with the activities discussed on pages 85 to 99.

www.uspto.gov
41
Statement of Budgetary ResourcesDuring FY 2015, total budgetary resources available for spending was 0.9 percent over the amount available in the preceding year, with a 57.4 percent increase over the past five fiscal years. The increase in budgetary resources available for use is depicted by the graph below.
The USPTO was provided appropriation authority to spend anticipated fee collections in FY 2015 for an amount up to $3,458.0 million. In FY 2015, the USPTO did not collect the entire amount of anticipated fee collections appropriated; patent and trademark fee collections amounted to $3,008.8 million (see Sources of Funds chart). The appropriation was more than the amount of total fees collected in FY 2015. In past years, when the USPTO has not been appropriated the authority to spend all fees collected, the excess has been recognized as temporarily unavailable fee collections. However, the AIA established a statutory provision allowing the USPTO to collect and deposit in the Patent and Trademark Fee Reserve Fund fees collected in excess of the appropriated levels for each fiscal year. During FY 2014, the USPTO collected $148.2 million of user fees that were deposited in the Patent and Trademark Fee Reserve Fund. The FY 2014 appropriation provided the authorization for the USPTO to spend those fees and they are available without fiscal limitation until expended. After successfully working through the reprogramming process with congressional appropriators early in FY 2015, the USPTO was able to gain access to these funds, which were transferred into our operating reserve, where they remain available to support the agency’s future needs. In FY 2013, sequestration was enacted government-wide to effect an annual five percent reduction in spending, which restricted full access to agency fee collections. As we are an agency funded entirely by user fees, this reduced our available budgetary resources and affects our operations significantly.
In FY 2013, we used the new authority in the AIA to set patent fees so that we are able to have sufficient resources to reduce the backlog of patent applications, improve our information technology, and manage patent and trademark revenue fluctuations and properly align fees in a timely, fair, and

PERFORMANCE AND ACCOUNTABILITY REPORT
42
consistent manner. In FY 2014, we proposed to reduce trademark fees to promote efficiency in operations and offer additional electronic application process options. Consequently, certain Trademark fee rates were reduced effective January 2015. During FY 2015, we continued to assess patent and trademark fees to assure that we are using the fee-setting authority in a responsible manner. As a result of the comprehensive review of all fees completed during FY 2015, we will work with the public advisory committees through the AIA fee-setting process to propose setting and adjusting certain patent and trademark fees.
The accompanying charts present the budgetary resources made available to the USPTO in FY 2015, and the use of such funds representing FY 2015 total obligations incurred and the operating reserve, as reflected on the Statement of Budgetary Resources.
Sources of Funds (dollars in millions)
Operating Reserve, $651.0 Recovery of Prior Year Obligations, $15.4 Patent Fee Collections, $2,736.8Trademark Fee Collections, $272.0Other Fee Collections, $5.2
Total $3,680.4
Uses of Funds (dollars in millions)
Patent Direct, $1,929.4Trademark Direct, $117.1 IP Policy, Protection, and Enforcement Direct, $37.1 IT Allocated, $622.3Operating Reserve, $504.4 Other Allocated, $470.1
Total $3,680.4

www.uspto.gov
43
USPTO operations rely on patent maintenance fees to fund a portion of the work being completed each fiscal year. During FY 2015, maintenance fees collected decreased $59.5 million, or 4.8 percent, from FY 2014. As maintenance fees are one of the largest sources of budgetary resources and are recognized immediately as earned revenue, any fluctuations in the rates of renewal have a significant impact on the total resources available to the USPTO. To some extent, renewals recoup costs incurred during the initial patent process. As shown on page 35, the renewal rates for all three stages of maintenance fees decreased during FY 2015.
As defined earlier, temporarily unavailable fee collections occur when the USPTO is not appropriated the authority to spend all fees collected during a given year. During FY 2015, the USPTO did not collect any fee collections that were designated as temporarily unavailable. As a result, the $937.8 million in temporarily unavailable fee collections at the end of FY 2013 remained the same through FY 2015.
The below chart illustrates amounts of fees that Congress has appropriated to the USPTO for spending over the past five fiscal years, as well as the cumulative unavailable fee collections.
Temporarily Unavailable Fee Collections(dollars in millions)
FY 2011 FY 2012 FY 2013 FY 2014 FY 2015
Fiscal year fee collections $ 2,298.9 $ 2,406.8 $ 2,815.7 $ 3,172.2 $ 3,008.8
Fiscal year collections appropriated (2,090.0) (2,406.8) (2,668.0) (3,172.2) (3,008.8)
Fiscal year unavailable collections $ 208.9 $ – $ 147.7 $ – $ -
Prior year collections unavailable 581.2 790.1 790.1 937.8 937.8
Subtotal $ 790.1 $ 790.1 $ 937.8 $ 937.8 $ 937.8
Special fund unavailable receipts 233.5 233.5 233.5 233.5 233.5
Cumulative temporarily unavailable fee collections $ 1,023.6 $ 1,023.6 $ 1,171.3 $ 1,171.3 $ 1,171.3
These cumulative unavailable fee collections remain in the USPTO’s general fund account at the U.S. Department of the Treasury (Treasury) until appropriated for use by Congress. In addition to these annual restrictions, collections of $233.5 million are unavailable in accordance with the OBRA of 1990, and deposited in a special fund receipt account at the Treasury.

PERFORMANCE AND ACCOUNTABILITY REPORT
44
Statement of Cash FlowsThe Statement of Cash Flow, while not a required financial statement, is audited and is presented for purposes of additional analysis. The Cash Flow statement records the company’s cash transactions (the inflows and outflows) during the given period. The document provides aggregate data regarding all cash inflows received from both its ongoing operations and external investment sources, as well as all cash outflows that pay for business activities and investments during the period. Cash flow is calculated by making certain adjustments to net income/cost by adding or subtracting differences in revenue and expense transactions (appearing on the Balance Sheet and Statement of Net Cost) resulting from transactions that occur from one year to the next. These adjustments are made because non-cash items are included in preparing the net income/cost (Statement of Net Cost) and total assets and liabilities (Balance Sheet). Since not all transactions involve actual cash items, many items have to be adjusted when calculating cash flow.
The USPTO receives fees for its primary activities of issuing patents and registering trademarks and chooses to include information on the sources and amounts of cash provided to assist report users in understanding its operating performance. While the fees received are an increase in cash flow, they may not necessarily be available for spending based on budgetary restrictions. Over half of the Fund Balance with Treasury represents fees the USPTO has collected, but has not been authorized to spend through the annual appropriation process. Cash flow is determined by looking at three components by which cash enters and leaves the USPTO: operations, investing, and financing.
Composition of USPTO Cash Flow (dollars in millions)
FY 2011 FY 2012 FY 2013 FY 2014 FY 2015
Cash Flow from Operations
Net Income $ 88.3 $ 106.1 $ 179.5 $ 285.7 $ 61.2
Operating Adjustments
Depreciation $ 52.7 $ 67.9 $ 71.9 $ 90.7 $ 105.3
Accrued Payroll, Leave, and Benefits 47.2 32.9 5.0 87.4 61.8
Deferred Revenue 71.4 (14.8) 100.6 158.3 (62.4)
Other Adjustments 20.0 4.1 7.3 38.3 3.7
Total Adjustments $ 191.3 $ 90.1 $ 184.8 $ 374.7 $ 108.4
Net Cash Provided by Operating Activities $ 279.6 $ 196.2 $ 364.3 $ 660.4 $ 169.6
Net Cash Used in Investing Activities
Property, Plant, and Equipment $ (84.9) $ (98.2) $ (91.4) $ (150.5) $ (179.4)
Financing Activities
Non-Expenditure Transfer $ – $ (1.0) $ (2.0) $ (2.0) $ (2.0)
Net Cash Used in Investing Activities $ – $ (1.0) $ (2.0) $ (2.0) $ (2.0)
Net Cash Provided/(Used) $ 194.7 $ 97.0 $ 270.9 $ 507.9 $ (11.8)

www.uspto.gov
45
Historically at the USPTO, cash flow adjustments to operational activities result in an increase to net cash provided by operational activities. Depreciation and Accrued Payroll, Leave, and Benefits operate similarly, as the accrued expenses that do not affect the cash flow are adjusted for, thereby increasing net cash provided by operational activities. Deferred revenue is also a significant factor, as the USPTO has received the fees, but not completed all of the work; in a year when the deferred revenue liability decreases, such as FY 2015, net income increases without a corresponding increase in the cash flow; the increase to net income is removed for determining cash flow. Other adjustments are predominantly comprised of changes in accounts payable balances; in a year when the overall liability balance decreases, then a reader can conclude that an increased amount of cash was disbursed, thereby requiring a reduction to net cash provided by operational activities; alternately, in a year when the overall liability balance increases, a reader can conclude that a lesser amount of cash was disbursed.
The investment of property, plant, and equipment is a cash transaction that has not been accounted for in net income/cost and must be adjusted for in calculating net cash used in investing activities. The USPTO has been focused on upgrading our IT systems from end-to-end, which resulted in increases beginning in FY 2011 in IT software and software in development values. In addition, the USPTO began deploying Universal Laptops agency-wide in FY 2011, replacing outdated desktop computers and work-at-home laptops.
Adjustments to financing-type activities are infrequent at the USPTO. Non-expenditure transfers at the USPTO are cash transactions reflecting the movement of appropriated fee collections to other federal governmental entities that have not been accounted for in net income/cost and must be adjusted for in calculating net cash used in financing activities.
Limitation on Financial StatementsThe principal financial statements included in this report have been prepared by USPTO management to report the financial position and results of operations of the USPTO, pursuant to the requirements of 31 U.S.C. § 3515(b). While the statements have been prepared from the books and records of the USPTO in accordance with Generally Accepted Accounting Principles (GAAP) for federal entities and the formats prescribed in OMB Circular A-136 (revised), the statements are in addition to the financial reports used to monitor and control budgetary resources, which are prepared from the same books and records. The statements should be read with the understanding that they are for a component of the U.S. Government, a sovereign entity.
46
Management ResponsibilitiesUSPTO management is responsible for the fair presentation of information contained in the principal financial statements, in conformity with GAAP, the requirements of OMB Circular A-136, and guidance provided by the Department of Commerce. Management is also responsible for the fair presentation of the USPTO’s performance measures in accordance with OMB requirements. The quality of the USPTO’s internal control rests with management, as does the responsibility for identifying and complying with pertinent laws and regulations.

47
PERFORMANCE INFORMATION
www.uspto.gov
Unaudited, please see the accompanying auditors’ report.

PERFORMANCE AND ACCOUNTABILITY REPORT
48
Introduction to the USPTO’s Performance Goals and ResultsThe Performance Section presents a detailed discussion of the USPTO’s performance results by objectives within each strategic goal based upon the USPTO 2014–2018 Strategic Plan. This is the second year that USPTO has operated under this plan. The 2014–2018 Strategic Plan is available at www.uspto.gov/about/stratplan/. The USPTO’s FY 2017 President’s Budget will be aligned with the USPTO 2014–2018 Strategic Plan. The USPTO strategic performance framework, provided in the Performance Highlights section of the Management’s Discussion and Analysis, is designed to strengthen the capacity of the USPTO by focusing on a specific set of goals and the steps the USPTO must take to reach them, which include:
• Provide timely examination of patent applications—Reduce the average time to first Office action for patent applications to 10 months (average time from filing until an examiner’s initial determination on patentability) and average total pendency to 20 months (average time from filing until the application is issued as a patent or abandoned);
• Enhance quality of patent examination;• Improve patent appeal and post-grant processes;• Optimize trademark quality and maintain pendency;• Demonstrate global leadership in all aspects of IP policy development;• Improve IT infrastructure and tools;• Implement a sustainable funding model for operations; and• Continue to improve relations with employees and stakeholders.
These steps also support the U.S. Department of Commerce’s focus on economic growth and its goal of delivering the tools, systems, policies, and technologies critical to transforming the U.S. economy, fostering U.S. competitiveness, and driving the development of new businesses.
WHITE HOUSE EXECUTIVE ACTIONS FOR INNOVATIONOn June 4, 2013, President Obama announced five executive actions
“to help bring about greater transparency to the patent system and level the playing field for innovators.” Four of these actions were undertaken by the USPTO. On February 20, 2014, the President announced three new initiatives aimed at encouraging innovation and strengthening the “quality and accessibility of the patent system.” What follows is a summary of the initiatives that the USPTO has implemented to realize the President’s vision. The USPTO continued its implementation of seven executive actions related to the White House Task Force on High-Tech Patent Issues.

www.uspto.gov
49
These actions are being addressed through the implementation of the USPTO’s 2014–2018 Strategic Plan. Progress to date on these actions is discussed in detail on the USPTO Web page. More on the Executive Actions can be found on the USPTO Web site by clicking here.
The Balanced Scorecard included in the USPTO’s 2014–2018 Strategic Plan aligns the agency’s goals and objectives with the associated performance indicators that provide meaningful information on the status and performance of every initiative provided in the plan.
PERFORMANCE AUDITS AND EVALUATIONS The U.S. Department of Commerce OIG completed and issued three final audit reports in FY 2015. The first report, Patent and Trademark IT Modernization Is Progressing, but Improvements Are Needed, focused on the early development stages of the Patents End-to-End (PE2E) and Trademark next Generation (TMNG) portfolios to identify any issues that might hamper the success of the overall projects. The OIG made five recommendations for USPTO to improve their development and acquisition planning as well as portfolio oversight. The USPTO concurred with the OIG’s audit findings and began implementation of all recommendations. As of September 30, 2015, the USPTO still had five outstanding recommendations from the final report. The recommendations of this evaluation are being implemented in support of Goal I, Objective 5, and Goal II, Objective 3: Ensure Optimal Information Technology Service Delivery to All Users.
The second audit, USPTO’s Awarding and Administering of Time-and-Materials and Labor-Hour Contracts Needs Improvement, focused on improving the documentation, awarding, and oversight of time-and-material and labor-hour contracts. This audit objective was to review contracting and program officials’ compliance with Office of Federal Procurement Policy, Federal Acquisition Regulation, the Commerce Acquisition Manual, and USPTO policies for awarding and administering time-and-material and labor-hour contracts. The OIG made eight recommendations mainly focused on documentation in the final report. The USPTO concurred with the OIG’s audit findings and began implementation of all recommendations. As of September 30, 2015, the USPTO had four outstanding recommendations in the final report. The recommendations of this evaluation are being implemented in support of the Management Goal, Objective 1: Leverage IT Investments to Achieve Business Results.
The third audit, USPTO Needs to Strengthen Patent Quality Assurance Practices, focused on whether patent examiners were issuing high-quality patents and the performance appraisal plans effectiveness at measuring the quality of the patents. The OIG has four recommendations mainly focusing on refining performance plans and developing and documenting additional internal controls. The USPTO concurred with the OIG’s audit findings and began implementation of all recommendations. As of September 30, 2015, the USPTO had four outstanding recommendations in the final report.

PERFORMANCE AND ACCOUNTABILITY REPORT
50
The recommendations of this evaluation are being implemented in support of Goal I, Objective 4: Continue to Enhance Patent Quality.
PERFORMANCE DATA VERIFICATION AND VALIDATION In accordance with the Government Performance and Results Act Modernization Act of 2010 requirements, the USPTO is committed to making certain that the performance information it reports is complete, accurate, and consistent. The USPTO developed a strategy to validate and verify the quality, reliability, and credibility of USPTO performance results as follows:
ACCOUNTABILITY—Responsibility for providing performance data lies with managers of USPTO programs who are held accountable for making certain that procedures are in place to ensure the accuracy of data and that performance measurement sources are complete and reliable.
QUALITY CONTROL—Automated systems and databases that collect, track, and store performance indicators are monitored and maintained by USPTO program managers, with systems support provided by the OCIO. Each system, such as the Patent Application Location and Monitoring or Trademark Reporting and Application Monitoring, incorporates internal program edits to control the accuracy of supporting data. The edits typically evaluate data for reasonableness, consistency, and accuracy. Crosschecks between other internal automated systems also provide assurances of data reasonableness and consistency. In addition to internal monitoring of each system, experts outside of the business units routinely monitor the data-collection methodology. The OCFO is responsible for monitoring the agency’s performance, providing direction and support on data-collection methodology and analysis, ensuring that data-quality checks are in place, and reporting performance-management data.
DATA ACCURACY—The USPTO conducts verification and validation of performance measures periodically to ensure quality, reliability, and credibility. At the beginning of each fiscal year, and at various points throughout the reporting or measurement period, sampling techniques and sample counts are reviewed and adjusted to ensure that data are statistically reliable for making inferences about the population as a whole. Data analyses are also conducted to assist the business units in interpreting program data, such as the identification of statistically significant trends and underlying factors that may impact a specific performance indicator. For examination quality measures, the review programs themselves under review are assessed in terms of reviewer variability, data-entry errors, and various potential biases.

www.uspto.gov
51
COMMISSIONERS’ PERFORMANCE FOR FY 2015 The AIPA, Title VI, Subtitle G, the Patent and Trademark Office Efficiency Act, requires that an annual performance agreement be established between the Commissioner for Patents and the Secretary of Commerce, and the Commissioner for Trademarks and the Secretary of Commerce. The Commissioners for Patents and Trademarks have FY 2015 performance agreements with the Secretary of Commerce, which outline the measurable organizational goals and objectives for which they are responsible. They may be awarded a bonus, based on an evaluation of their performance as defined in the agreement, of up to 50 percent of their base salary. The results achieved in FY 2015 are documented in this report in the performance information for Strategic Goals l and ll. FY 2015 bonus information was not available at publishing time. That information will be provided in next year’s PAR. For FY 2014, the Commissioner for Patents was awarded a bonus of 13.8 percent of base salary. The Commissioner for Trademarks did not receive a bonus.

PERFORMANCE AND ACCOUNTABILITY REPORT
52
PATENTS: STRATEGIC GOAL I
WHAT IS A PATENT?A patent is an intellectual property right granted by the government of the United States
of America to an inventor “to exclude others from making, using, offering for sale, or selling the invention throughout the United States or importing the invention
into the United States” for a limited time in exchange for public disclosure of the invention when the patent is granted.
There are three types of patents: utility, design, and plant. Utility patents may be granted to anyone who invents or discovers any new
and useful process, machine, article of manufacture, or composition of matter, or any new and useful improvement thereof. Design patents may be granted
to anyone who invents a new, original, and ornamental design for an article of manufacture. Plant patents may be granted to anyone who invents or discovers
and asexually reproduces any distinct and new variety of plant.
For a detailed look at how the patent application examination process works, please visit www.uspto.gov/patents/process/.

www.uspto.gov
53
Patent Average Total PendencyTrend: The trend line indicates that the performance trend is positive with little variability of the direction of the trend line in predicting future results. Additional discussion for this measure can be found on page 57.
Patent Average First Action PendencyTrend: The trend line indicates that the performance trend is positive with some variability of the direction of the trend line in predicting future results. Additional discussion for this measure can be found on page 57.
What follows are those Strategic Goal I key measures for which enough data are available to establish performance trends.1
TargetActualm
onth
s
40
30
20
10
0
FY 2010 FY 2011 FY 2012 FY 20 13 FY 2014 FY 2015
TargetActual
30
20
10mon
ths
FY 2010 FY 2011 FY 2012 FY 20 13 FY 2014 FY 2015
1 Patent Quality Composite Score. The USPTO is working with internal and external stakeholders to reevaluate the entire quality process at the USPTO by engaging in public forums and roundtables to increase the effective-ness, clarity, and simplicity of the USPTO’s quality review process by focusing on excellence in work products, excellence in measuring patent quality, and excellence in customer service. As part of this effort, the USPTO aims to define and introduce revised quality metrics based on stakeholder input by September 2017. Because the precise contours of the metric will likely change in the upcoming years, it is not useful to portray trends for the current measure.

PERFORMANCE AND ACCOUNTABILITY REPORT
54
Strategic Goal I:Optimize Patent Quality and Timeliness
On April 10, 2015, the USPTO marked the 225th anniversary of President George Washington signing into law the First Congress’ Patent Act of 1790 with a celebration that paid tribute to the origins of the USPTO’s work and to the dedicated and talented employees who carry it forward.
New Commissioner for PatentsOn July 30, 2015, Andrew Hirshfeld was sworn in as Commissioner for Patents. Hirshfeld replaced former Commissioner Margaret (Peggy) Focarino, who retired in July after 38 years of USPTO service. In his previous senior leadership posts at the USPTO, Hirshfeld played key roles in managing patent operations, policy, and quality. Since November 2011, as the Deputy Commissioner for Patent Examination Policy, Hirshfeld developed numerous patent examination guidance documents on topics such as patent subject-matter eligibility and clarity of the prosecution record. Hirshfeld also played a key role in the creation of the position of Deputy Commissioner for Patent Quality to help the USPTO focus on improving patent quality. In addition, multiple provisions of the AIA were implemented under his guidance, including the provisions for First-Inventor-to-File, Preissuance Submissions, Inventor’s Oath/Declaration, and Supplemental Examination.
The Commissioner for Patents oversees all aspects of the USPTO’s patents organization, including administration of patent operations, examination policy, patent quality management, international patent cooperation, resources and planning, and budget administration. Furthermore, through the preservation, classification, and dissemination of patent information, the Commissioner promotes technological progress by providing would-be inventors with critical information. As such, the Commissioner plays a primary role in advancing the agency’s mission to promote American innovation.
Patent Quality and TimelinessStrategic Goal I recognizes the importance of innovation as the foundation of American economic growth and national competitiveness, as documented in the Strategy for American Innovation.2 Through this goal, the USPTO has committed to reducing the excess inventory of unexamined patent applications and pendency, both of which affect the delivery of innovative goods and services to market and the related economic growth and creation of high-paying jobs.
FY 2015 was a year of notable accomplishments and challenges for the agency and the Patent organization. The USPTO is proud of its ongoing, concurrent efforts to improve the patent examination process and to quickly move important innovations to the marketplace. 2 Published by the President’s Economic Council in February 2011, available at
www.whitehouse.gov/sites/default/files/uploads/InnovationStrategy.pdf
Russell Slifer, Deputy Under Secretary of Commerce for Intellectual Property and Deputy Director of the USPTO, swears in Andrew Hirshfeld as Commissioner for Patents on July 30, 2015.Photo: Jay Premack/USPTO

www.uspto.gov
55
The USPTO continues to make great strides in reducing the unexamined patent application backlog and patent pendency. The backlog of unexamined applications was reduced from 605,646 at the end of FY 2014 to 553,221 at the end of FY 2015. This represents a decline of 8.7 percent below FY 2014.
Average first action pendency and total pendency continue to decline. Average first action pendency decreased to 17.3 months, and total pendency was reduced to 26.6 months. The USPTO is on track to attain its long-term goal of 10-month first action pendency and 20-month total pendency by FY 2019.
The USPTO’s request for continued examination (RCE) backlog reduction efforts, introduced in FY 2013, continue to show great progress in reducing the RCE backlog to a steady-state. The RCE backlog was reduced from 46,441 at the end of FY 2014 to 26,901 at the end of FY 2015. In addition, the time from filing of an RCE to the next Office action has been reduced from 6.2 months at the end of FY 2014 to 3.3 months at the end of FY 2015.
The USPTO is also continuing its efforts toward enhancing patent quality. These efforts focus on improving patent operations and procedures to provide the best possible work products, to enhance the customer experience, and to improve existing quality metrics. In pursuit of these goals, the USPTO launched a comprehensive and enhanced quality initiative. This initiative began with a request for public comments on the set of proposals outlined in this document and will continue with a two-day “Quality Summit” with the public to discuss the outlined proposals. The conversation with the public held at this Quality Summit, complemented by written comments to these proposals, is the first of many steps toward developing a new paradigm of patent quality at the USPTO.
The USPTO also launched a new, wide-ranging initiative to enhance the quality of patents issued by the USPTO. High-quality patents permit certainty and clarity of rights, which in turn fuels innovation and reduces needless litigation. Moreover and importantly, for the first time in recent history, the USPTO has the financial resources to consider longer-term and more expensive improvements to patent quality by leveraging the sustainable funding model provided by the fee-setting provisions in the America Invents Act. Although the agency still has progress to make in further reducing both the backlog and pendency, the confluence of these events make it the optimal time for the USPTO to pursue this enhanced quality initiative.
OBJECTIVE 1: REFINE OPTIMAL PENDENCYThrough this objective, the USPTO recognizes the importance of continually refining and defining optimal pendency to take into consideration the external environment affecting workload inputs, the commitments madeto the fee-paying public, and the need to ensure that there is a balance between workload and production capacity.
Timely and quality issuance of patents provides certainty in the market and allows businesses and innovators to make informed and timely decisions on
AVERAGE FIRSTACTION PENDENCY:The average time it takes for a patent examiner to take first action on a patent application.
AVERAGE TOTAL PENDENCY: The average time it takes for a patent examiner to conclude work on a patent application.

PERFORMANCE AND ACCOUNTABILITY REPORT
56
product and service development. The longer it takes to review a patent application, the longer it takes for the benefit of the IP protection to accrue. Failure to complete the examination in a timely manner creates uncertainty regarding the scope and timing of any IP rights. This not only impacts the innovators, but it has a negative impact on other innovators and businesses in that field that are awaiting the outcome of the pending application.
FY 2015 Pendency TargetsThe USPTO achieved its total pendency target; however, it missed its first action pendency target. The successful completion of the RCE backlog reduction efforts in FY 2014, and the successful implementation of the Cooperative Patent Classification (CPC) system in January 2015, enabled the USPTO to shift examination priorities back toward the unexamined patent application backlog and patent pendency; however, the age of applications awaiting an initial determination of patentability continued to rise during this timeframe, thus ultimately impacting the average first action pendency result for FY 2015. In addition, the USPTO will continue to review and adjust out-year hiring as part of its efforts to reduce patent pendency and to maintain an acceptable level of working inventory.
Work with Stakeholders to Define Long-Term Pendency GoalsIn July 2014, the USPTO published a “Request for Comments on First Action and Total Pendency” in the Federal Register. Several stakeholders responded and expressed confidence in the USPTO’s existing pendency metrics; however, respondents requested that the USPTO provide additional performance indicators.
In direct response to feedback received from the public, the USPTO updated its online Patents Dashboard. The Patents Dashboard is one of several tools the USPTO makes available to the public to track its progress in areas such as pendency, quality, backlog reduction, and timeliness.
The new Dashboard provides information on major metrics with subpages organized by topic. A considerable amount of additional data has been added that relates to designs, petitions, after final responses, amendment turnaround, patent term adjustment, and other pendency metrics and filing information. Each quarter, a specific new statistic is highlighted in a new feature of the updated dashboard known as the “statistic of the quarter.”
Much of the data, including the statistic of the quarter and petitions and patent term adjustment, were publicly requested and are being provided for the first time.
In addition, patent processing times are primarily gauged by two measures: Average First Action Pendency (Table 4) and Average Total Pendency (Table 5). As shown in Tables 4 and 5, the USPTO has made strides in its ongoing efforts to reduce average pendency of filed patent applications.
A design patent is directed to the visual ornamental characteristics
embodied in, or applied to, an article of manufacture. Because a design is
manifested in appearance, the subject matter of a design patent application
may relate to the configuration or shape of an article, to the surface
ornamentation applied to an article, or to the combination of configuration and surface ornamentation. Currently,
the most active areas for filings include design applications for recording,
communication, or information retrieval equipment. Applications in
this area will cover designs of computer equipment, cell phones, and
other handheld electronic devices. For more information about design
patents, please click here.

www.uspto.gov
57
A request for continued examination (RCE) is a request by an applicant for continued prosecution after prosecution has been closed. An application can be closed for several reasons, such as a final rejection or, in the alternative, an allowance of the application. An RCE is not considered a continuing patent application; rather, prosecution of the pending application is reopened. There is a fee that the applicant must pay for this service. For more technical details about RCEs, please click here.
TABLE 4Measure: Patent Average First Action Pendency (Months)
Fiscal Year Target Actual2011 23.0 28.0
2012 22.6 21.9
2013 18.0 18.2
2014 17.4 18.4
2015 16.4 17.3
2016 14.7
2017 13.2
Target Not Met.
TABLE 5Measure: Patent Average Total Pendency (Months)
Fiscal Year Target Actual2011 34.5 33.7
2012 34.7 32.4
2013 30.1 29.1
2014 26.7 27.4
2015 27.7 26.6
2016 23.9
2017 22.6
Target Met.
OBJECTIVE 2: INCREASE EFFICIENCIES AND PATENT EXAMINATION CAPACITY TO ALIGN WITH OPTIMAL PATENT PENDENCYHire/Retain a Nationwide WorkforceThrough the USPTO’s second strategic objective, the agency put in place those initiatives needed to meet and maintain the pendency and inventory targets established via the first objective. Of particular importance is the need to retain experienced examiners and to continue establishment of a nationwide workforce.
FY 2015 was an exciting time for the USPTO as it continued to reach out to entrepreneurs across the country, hired new patent examiners, and prepared for the opening of its permanent office space in Dallas, TX, and Silicon Valley, CA. June 30, 2015, marked the one-year anniversary of the USPTO’s Rocky Mountain Regional Office in Denver, CO, and July 12, 2015, marked the three-year anniversary of the Elijah J. McCoy Midwest Regional Office in Detroit, MI.
The USPTO’s regional offices help protect American innovation and competitiveness, and each office is dedicated to providing services to

PERFORMANCE AND ACCOUNTABILITY REPORT
58
entrepreneurs, inventors, and small businesses, while actively engaging communities and local industries.
Cost-Effectiveness of Patent Examination ProcessIn FY 2015, the USPTO received over 9,200 Track One (accelerated) applications, and the average time from petition grant to final disposition was 6.5 months. As a comparison, average total pendency of all applications was 26.6 months in FY 2015. The USPTO extended both the Quick Patent Information Disclosure Statement (QPIDS)3 program and the After Final Consideration Pilot Program through the end of FY 2015. To date, over 5,600 RCE filings have been avoided.
Table 6 provides the relative cost-effectiveness of the entire patent examination process over time, or the efficiency with which the organization applies its resources to production.
TABLE 6Total Cost Per Patent Production Unit
Fiscal Year Target Actual2011 $4,041 $3,594
2012 $3,970 $3,617
2013 $4,041 $3,686
2014 $4,633 $3,940
2015 $4,646 $4,086
2016 $4,687
2017 $4,905
Target Met.
The “total cost of the patent production unit” is a relative measure of efficiency. This measure is calculated by taking the total cost of the Patent process for the fiscal year, including all support costs, and dividing it by the total number of Patent Production Units (PUs) for the same period, including design and PCT PUs. PUs are an internal measure of work completed by patent examiners. Although this measure is described as the “total cost of the patent production unit,” it is not a true “total cost.” One reason is because, although a certain number of PUs are completed in a given fiscal year, the activities that contribute to this PU often occur over multiple years.
OBJECTIVE 3: INCREASE INTERNATIONAL COOPERATION AND WORK SHARINGThe third objective will help attain pendency targets through international collaboration, which is a critical component of an increasingly global IP system. Although foreign countries continue to maintain sovereign control over their patent laws and systems, collaboration among the various offices is increasingly important in fulfilling the needs of the global IP community.3 For more discussion of QPIDS, please see Objective 4.
A Technology Center is a subdivision of patent examiners whose expertise falls generally under one of the following technologies:
• BiotechnologyandOrganic Chemistry;
• ChemicalandMaterialsEngineering;• ComputerArchitecture,Software,
and Information Security;• ComputerNetworks,Multiplex
Communication, Video Distributionand Security;
• Communications;• Semiconductors,Electricaland
Optical Systems and Components;• Designs;• Transportation,Construction,
Electronic Commerce, Agriculture,NationalSecurityandLicense&Review; and
• MechanicalEngineering,Manufacturing, Products.
For more information about our Technology Centers, please click here.
Michelle K. Lee, Under Secretary of Commerce for Intellectual Property and Director of the USPTO, awards patent number 9,000,000 to Matthew Carroll of WiperFill during ceremonies commemorating the 225th anniversary of the Patent Act on April 10, 2015.Photo: Jeff Isaacs/USPTO

www.uspto.gov
59
Fully Implement the Cooperative Patent ClassificationOn January 1, 2015, the USPTO successfully transitioned to the CPC system from the United States Patent Classification (USPC) system. The CPC system is a collaborative venture between the USPTO and the European Patent Office (EPO), designed to develop a common, internationally compatible classification system for technical documents used in the patent-granting process. It offers a more robust and agile classification system for both offices’ user communities and enables more technical documents to be classified because the USPTO and EPO are both entering documents into the system.
As the USPTO transitioned to the CPC system, the office made sure to keep patent applicants and owners updated on the transition process. Leading up to the changeover, throughout 2013 and 2014, numerous bilateral CPC events were held with external stakeholders, providing notice that the USPC system would become a static document collection for utility patents after December 2014.
As a leader in the global patent community, the USPTO is dedicated to providing a quality classification system for employees and stakeholders, one that is compatible with the international patent community. Most important, the USPTO will ensure that the quality of the classification system remains strong and agile.
Searching based on CPC provides a more comprehensive search result set that includes national documents from China and Korea, as well as other countries that classify their national documents into the CPC, documents that were not previously available for viewing or retrieval under the USPC.
International Design ApplicationsOn December 18, 2012, the Patent Law Treaties Implementation Act of 2012 (PLTIA) was signed into law. The PLTIA is a major component that sets forth provisions implementing the 1999 Geneva Act of the Hague Agreement Concerning the International Registration of Industrial Designs (“Hague Agreement”). These provisions (Title I of the PLTIA) took effect on May 13, 2015.
The Hague Agreement is an international registration system that offers the possibility of obtaining protection for up to 100 industrial designs in designated member countries and intergovernmental organizations (referred to as Contracting Parties) by filing a single international application in a single language either directly with the International Bureau of the World Intellectual Property Organization (WIPO) or indirectly through the applicant’s Contracting Party.
Beginning May 13, 2015, U.S. applicants can file international design applications through the USPTO as an office of indirect filing, and applicants filing international design applications will be able to designate the United States for design protection. In addition, U.S. design patents resulting from applications filed on or after May 13, 2015, will have a 15-year term from issuance.

PERFORMANCE AND ACCOUNTABILITY REPORT
60
Implement the Global DossierGlobal Patent System ModernizationThe Global Dossier is a proposed set of business services aimed at modernizing the global patent system and delivering benefits to all stakeholders through a single portal/user interface. The first service includes secure, online access to the file histories of related applications from participating Offices.
A Global Dossier Task Force was created to ensure that the services developed align with the needs of all stakeholders. It is made up of the IP5 Offices, the WIPO, and IP5 Industry Groups: American Intellectual Property Law Association, Intellectual Property Owners Association, Business Europe, Japan Intellectual Property Association, Korea Intellectual Property Association, and Patent Protection Association of China.
The business services of Global Dossier will be delivered incrementally. In spring 2015, USPTO examiners were given access to the dossier information of the related IP5 applications. In June 2015, the USPTO became a providing Office, allowing access to U.S. dossiers through IP5 Global Dossier User Interfaces.
The USPTO-hosted User Interface for Global Dossier will be released in November 2015. This will give public stakeholders access to the full file history on a patent application family from the participating Intellectual Property Offices.
The advantages envisioned from Global Dossier include: facilitation of preplanned cross-filings, one-portal management of cross-filed applications, elimination of the need to file duplicate documents in multiple offices (e.g., priority documents, prior art citations, etc.), and other functions that allow for greater stakeholder involvement in application management.
The project is an initiative of the IP5, who agreed to make available information produced by each office in a family of patent applications. The aim is to simplify access to important information pertaining to these dossiers both for users and the public, and to enhance the transparency of the patent system. The addition of this new data will complete the coverage of file wrapper information from the IP5 Offices. Access by USPTO patent examiners was piloted, with full-scale deployment accomplished in May 2015. Finally, the agency continues development of public access to the Global Dossier, with full deployment scheduled in November 2015.
Other InitiativesThe USPTO also launched an initiative aimed at direct re-use of International Search Authority/United States International Searching Authority (ISA/US) work in the U.S. National phase. The ISA/US is either a national Office or an intergovernmental organization whose tasks include the establishment of documentary patent search reports on prior art with respect to inventions that are the subject of international applications. This will allow an international patent applicant to use the previous USPTO-originated international patent search results as part of the international applicant’s U.S. patent application.
In patent file terminology, a “dossier” is simply an
electronic compilation of a patent application file.

www.uspto.gov
61
The USPTO continued working with international IP offices to generate work sharing efficiencies, such as initiating a bilateral priority document exchange agreement with China’s IP office (SIPO). This is a new free service that will allow the two offices to electronically exchange patent application priority documents directly. This new service will help streamline the patent application process and reduce costs for businesses, which are increasingly pursuing patent rights globally. The new service will allow the USPTO and the SIPO, with appropriate permissions, to obtain electronic copies of priority documents filed with the other office from its electronic records management system at no cost to the applicant. With this new service, applicants will no longer need to obtain and file paper copies of the priority documents; however, they are still responsible for ensuring that priority documents are provided in a timely manner.
On November 19, 2014, the USPTO hosted a roundtable on International Harmonization of Substantive Patent Law at its headquarters in Alexandria, VA. Roundtables like this one are essential tools for the USPTO to hear and understand stakeholder views on key IP topics and their effects on various stakeholder and public policy interests.
Under Secretary of Commerce for Intellectual Property and Director of the USPTO Michelle K. Lee discussed how the USPTO and offices around the world have in recent years invested significantly in work sharing, and how the lack of harmonized laws related to key examination issues remains a barrier to more efficient and effective reuse of work. These key issues include the definition and scope of prior art, the grace period, and issues related to conditions for patentability, including novelty and obviousness.
OBJECTIVE 4: CONTINUE TO ENHANCE PATENT QUALITYThe quality of application review is critical to ensure the value of an issued patent. Without well-defined claims, for example, the value of a patent is uncertain. Uncertainty means that there is a risk that a patent is invalid, does not cover the patentee’s product, or that a competitor infringes the patent because they cannot determine its scope. Such patents exact a high cost by decreasing public confidence in the IP system. On the other hand, the economic value of a patent increases when its metes and bounds are clearly defined and consistently interpreted under the law. Clarity leads to certainty, which enables efficient and confident determination of value. This in turn creates high value for quality patents, which bolsters public confidence.
The USPTO issued new examination guidance on subject matter eligibility under 35 U.S.C. § 101 in view of the U.S. Supreme Court’s recent decisions in Alice Corp., Myriad, and Mayo. The guidance was published in a Federal Register notice on December 16, 2014, titled “2014 Interim Guidance on Patent Subject Matter Eligibility.” Claim examples that illustrate the analysis set forth in the guidance relating to nature-based products and abstract ideas are posted on the USPTO website.

PERFORMANCE AND ACCOUNTABILITY REPORT
62
Deputy Commissioner for Patent QualityIn an important step to improve its commitment to patent quality, the USPTO appointed its first Deputy Commissioner for Patent Quality in January 2015. The Deputy Commissioner for Patent Quality manages and leads the Patent Organization’s quality initiatives and is responsible for sustaining the high quality of the USPTO’s patent examination processes and products by implementing and maintaining a comprehensive quality management system.
Evaluate and Refine the Measurement of Patent Quality DataEnhancing Patent QualityIn February 2015, the USPTO released a Federal Register notice seeking public input and guidance to direct its continued efforts towards enhancing patent quality. This notice was the first step in the USPTO’s comprehensive Enhanced Patent Quality Initiative (EPQI). Through an active and long-term partnership with the public, the USPTO seeks to ensure the issuance of the best quality patents and provide the best customer service possible.
The USPTO’s EPQI targets three aspects of patent quality, termed the patent quality pillars. These pillars are:
1. Excellence in work products, in the form of issued patents and Office actions;
2. Excellence in measuring patent quality, including appropriate quality metrics; and
3. Excellence in customer service.
In the first pillar, the USPTO focuses on the quality of the work products provided at every stage of the patent process. This pillar includes both the quality of issued patents and the quality of all work products during the filing, examination, and issuance process. The USPTO is committed to issuing patents that clearly define the scope of the rights therein, that are within the bounds of the patent statutes as interpreted by the judiciary, and that provide certainty as to their validity to encourage investment in research, development, and commercialization.
Regarding the second pillar, the USPTO focuses on its measurement of quality to evaluate work products and customer interactions. At present, the USPTO measures quality through its Patent Quality Composite Score. The composite score is comprised of seven individual quality metrics that were developed in conjunction with external stakeholders. As part of the new quality initiative, the USPTO aims to increase the effectiveness, transparency, clarity, and simplicity of USPTO review; employ a system that measures both errors by commission and omission; and obtain examination metrics that are specifically tied to procedures for improving performance, based on identified trends. Until existing metrics are validated and new metrics are developed, the USPTO will continue to track quality through the use of the seven quality metrics that comprise the Patent Quality Composite.

www.uspto.gov
63
The third pillar focuses on the quality of the customer experience. The USPTO wants to ensure that customers are treated promptly, fairly, consistently, and professionally at all stages of the examination process. The USPTO also is focused on maximizing the effectiveness and professionalism of all customer interactions, be it through examiner interviews, official USPTO communications, or call center exchanges.
In March 2015, the USPTO engaged in a productive exchange of ideas with the public on patent quality by holding an unprecedented event, a Patent Quality Summit at its headquarters in Alexandria, VA. Over 300 participants attended in person and over 1,200 participated online over the two-day event.
The Patent Quality Summit provided a forum for a robust discussion in a productive exchange of ideas in which the public, experts from the USPTO (including some examiners), industry, and academia examined ways to enhance patent quality, and considered six specific proposals. In particular, participants discussed whether applicants prefer to conduct in-person interviews with examiners, and if so, what logistical arrangements would need to be made to enable those interviews given the agency’s telework program. In addition, the discussion focused on what steps patent examiners and applicants could take to clarify the prosecution history record and how the agency might better achieve compact prosecution. Further discussion centered on whether the agency should conduct an automated preexamination search for all applications and what tools might be available to do so, how to best measure patent quality, and whether applicants should be able to request a quality review of selected actions during prosecution of the application.
As a result of the Quality Summit, in June 2015, the USPTO commenced the first of six monthly Patent Quality webinars that focus on specific topics related to the new quality initiatives. The first webinar, which focused on Clarity of the Record, was held June 9, 2015, at the USPTO’s headquarters in Alexandria, VA.
In response to various requests for feedback on the EPQI from both internal and external stakeholders, the USPTO received more than 1,200 substantive suggestions. Some themes identified from these suggestions are as follows:
• Clear articulation of the office’s position on the record is a critical component of quality.
• How the USPTO measures patent quality should be clearly explained.• More detailed documentation of oral discussions on the record would be
very helpful.• Consider increased usage of reason(s) for allowance to clarify claim
construction.• Improve training on the use of form paragraphs for prior art rejections. • Increase the use of 35 U.S.C. § 112 for purposes of clarifying claim scope
and clarity.

PERFORMANCE AND ACCOUNTABILITY REPORT
64
• The quality of the interview is much more important than the type of interview (e.g., telephonic, video conferencing, in-person).
Responsive to the themes, the USPTO is considering several programs, which are divided into three sub-groups: (1) data analysis; (2) examiners’ resources, tools, and training; and (3) changes to examination processes and products. The programs being considered are:
Data Analysis• Clarity and Correctness Data Capture (Master Review Form or MRF)• Topic Submission for Case Studies• Quality Metrics
Examiners’ Resources, Tools and Training• Pilot Automated Pre-Examination• Scientific and Technical information Center (STIC) Awareness Campaign• Post Grant Outcomes • Interview Specialist
Changes to Process/Product• Clarity of the Record Pilot• Re-evaluate After Final Consideration Pilot (AFCP), Pre-Appeal, and QPIDS• Design Patent Publication Quality
Executive Actions on Patent Quality and AccessibilityLast fiscal year, the White House issued three new executive actions aimed, in part, at strengthening the quality and accessibility of the USPTO patent system. One of these initiatives focused on the critical need for examiners to stay up-to-date in their technical fields of expertise through more robust technical training to enable them to perform the best examination possible. The USPTO addressed this request from the president via the Patent Examiner Technical Training Program (PETTP).
PETTP allows scientists, engineers, professors, industrial designers, and other technology experts the opportunity to provide technical training directly to patent examiners. Specifically, volunteer guest lecturers share their expertise on technical developments, the state of the art, emerging trends, maturing technologies, and recent innovations. Experts have already provided training to examiners on topics ranging from nanotechnology to virtual reality, welding to the chemistry of chocolate.
PETTP events were hosted throughout the year. Presentation formats were flexible and were generally up to two hours in length, including a question-and-answer session.
For the first time this fiscal year, the USPTO hosted a Tech Week for patent examiners to offer training during a concentrated span of five days. From December 1 to 5, 2014, speakers from all technical fields gave lectures to the examiners in all of the USPTO’s Technology Centers.
Claim language is “functional” when it describes a feature
by what it does rather than by what it is.

www.uspto.gov
65
Table 7 provides the USPTO’s Quality Composite Score for the past four years. The USPTO missed its end-of-year composite target range in FY 2014. The substantial drop in the composite score from FY 2014 is not the result of a single factor, rather, it is a cumulative effect of small, less-significant changes for all of the subcomponents that make up the composite score. The largest declines come from the final disposition compliance rate and the internal quality survey: both of these items were at or near stretch goal levels in Fourth Quarter, FY 2014 and the subsequent declines. Although rather minor in numerical values, they had a somewhat exaggerated effect on the composite, as the overall composite score reacts sharply when it is at or near stretch goal levels for a particular component. This sensitivity, which may not mirror the true performance of the composite subcomponents, is one of the key reasons the composite is being revisited for FY 2016.
TABLE 7Measure: Patent Quality Composite Score
Fiscal Year Target Actual2011 N/A 30.7
2012 48–56 72.4
2013 65–73 71.9
2014 83–91 75.0
2015 83–91 42.9
2016 83–91
2017 100
Target Not Met.
The USPTO also extended the Glossary Pilot, which began on June 2, 2014, and continued through June 2, 2015. In this program, applicants in certain fields of art (technology) submitted glossaries in patent specifications to help define claim terminology made in patent applications. The pilot was designed to enhance claim clarity in the specification of software-related patent applications by encouraging and gauging the use of glossaries by patent applicants.
The agency has made a series of process improvements, such as refinements of the third-party submission process, including providing a direct link from the Third-Party micro-site to EFS-Web, providing applicants with the opportunity to provide their email address to receive notifications regarding the status of their applications, and providing applicants with additional information regarding the submission of foreign and nonpatent documents. The “Third Party Preissuance Submission” initiative provides a mechanism for third parties to submit patents, published patent applications, or other printed publications of potential relevance to a patent application along with a concise description of the asserted relevance of each document submitted. In this way, the public may take an active role in ensuring that only quality patents are granted.
The Patent Quality Composite is designed to represent percent progress towards stretch goals. A score of 100 (or 100 percent) indicates that all stretch goal targets have been met. The composite coincides with a specific strategic plan period and the stretch goals are the levels the office plans to achieve by the end of the strategic plan period. The beginning of the strategic plan period is referred to as the baseline and the score at that time is 0. The Patent Quality Composite score at any reported period is simply the office’s current progress in meeting the desired stretch goals. Increases in scores represent quality improvements, while declines represent setbacks.

PERFORMANCE AND ACCOUNTABILITY REPORT
66
OBJECTIVE 5: ENSURE OPTIMAL INFORMATION TECHNOLOGY SERVICE DELIVERY TO ALL USERSAn important component of the Patent goal is to leverage IT to accomplish the USPTO’s mission-related objectives. This Patent objective reaffirms the agency’s commitment to patent end-to-end processing and lays out the USPTO’s plans for ensuring optimal IT service delivery to both internal and external users.
Stabilize the Patent Application Location Monitoring SystemThe USPTO progressed this fiscal year on a multipronged effort to stabilize the Patent Application Location and Monitoring (PALM) legacy system used for patent examining. The Patent Reporting System was improved for examiners and managers and increased usage of the PALM services gateway as demonstrated by an increase in services. The USPTO also launched a project to improve the computing power of the automated biotech sequence search system.
The USPTO recently launched a critical new tool for patent examiners, marking the beginning of the retirement of certain legacy IT tools and furthering the agency’s commitment to sharpening operating efficiencies as it modernizes IT systems. Newly released to the patent-examining corps is Version 2.0 of the Docket and Application Viewer (DAV), a customizable, searchable tool to help examiners manage their work load and prioritize tasks. This tool replaces the electronic Desktop Application Navigator (eDAN) tool.
This new tool, like others to come, will help the agency in the drive to increase patent quality. Once fully-deployed, the USPTO’s PE2E system will provide examiners with an improved way of processing patent applications, integrating activities currently managed across separate systems into a central place, and leveraging modern technology. Late in 2016, the USPTO expects to launch more releases that are critical to examiners, including Office Action and Search tools.
The DAV was successfully deployed to over 120 servers in 48 hours in April by the USPTO’s Office of the Chief Information Officer (OCIO) in close collaboration with the USPTO’s Office of Patent Information Management and the Patent Office Professional Association union. Training for this tool began in late March 2015. The DAV tool also reflects the USPTO’s use of “agile” practices that focus on user involvement and feedback, whereas Development/Operations (DevOps), provides a method of emphasizing tight collaboration. In the last few years, the USPTO has used agile and user-centered design to enhance how it develops and delivers new software to users.
As previously mentioned, the USPTO deployed public access to One Portal Dossier (OPD), which is an IP5 initiative to provide “secure, one-stop access and management to global patent applications.” The USPTO will serve as the providing office, and integrated OPD with the WIPO CASE system will serve as a providing office.
The WIPO CASE system enables patent offices to
securely share search and examination documentation
related to patent applications in order to facilitate work
sharing programs. www.wipo.int/case/en/

www.uspto.gov
67
Redesign and Rearchitect Current Patent IT SystemsIn August 2015, the USPTO announced the development of its newest initiative, eCommerce Modernization (eMod), which will improve the electronic patent application process by modernizing the filing and viewing systems. Development started in the summer of 2015, with the initial pilot program anticipated to start in the summer of 2016. The new system will be implemented in phases over the next few years, and once completed, will replace the USPTO’s current EFS-Web, Public PAIR (Patent Application Information Retrieval), and Private PAIR.
For patent applicants, eMod will help provide a simpler authentication process, improved functionality, and a more user-friendly interface and documents. For patent examiners, the updated systems will streamline patent submission, review, and management processes, and increase accuracy of application processing and publication. Overall, a more easy-to-use electronic patent application process will improve efficiency, communication, and patent quality.
OBJECTIVE 6: CONTINUE AND ENHANCE STAKEHOLDER AND PUBLIC OUTREACHBy leveraging the agency’s presence in its regional offices, the USPTO’s commitment to promoting the availability of educational resources for applicants and other users will be continued and enhanced. This will enable the agency to engage with stakeholders to refine USPTO patent policies and processes. The USPTO is expanding outreach around the country by holding roundtables for and engaging stakeholders in an open discussion with USPTO patent staff, for example, to discuss the use of crowdsourcing concepts to enhance the third-party submission of prior art and to share ideas, feedback, experiences, and insights on RCE-related prosecution strategies.
In conjunction with the Colorado Bar Association and the Mi Casa Resource Center, the Colorado Pro Bono Patent Initiative (or ProBoPat program) was extended to New Mexico, Utah, and Wyoming on May 12, 2015.
Finally, the USPTO held over 400 legal, technical, and stakeholder education and outreach engagement events at its regional offices, such as
“Protecting Your IP in the Age of Collaborative Economy,” held at the San Francisco Center for Economic Development. This was a panel discussion with entrepreneurs, the business community, and legal practitioners on IP matters. One of the featured speakers for this event was John Cabeca, Director of the USPTO Silicon Valley Regional Office in San Jose, CA.
Dallas, TXThe Texas Regional Office is located in the Terminal Annex Federal Building, a prime location in downtown Dallas. The USPTO participated in high-profile events such as Dallas’s first Startup Weekend Women’s Edition, at which

PERFORMANCE AND ACCOUNTABILITY REPORT
68
several top USPTO leaders spoke in late May 2015. On July 12, Deputy Director Russell Slifer opened the second annual National Summer Teacher Institute on Innovation, STEM, and Intellectual Property at the University of Texas at Dallas. This multiday professional development training opportunity was designed to help middle and high school teachers incorporate concepts of making, inventing, and IP creation and protection into classroom instruction.
San Jose, CAA regional office in Silicon Valley opened on October 15, 2015, in San Jose. In March, the office held a livestreamed recruitment webinar in cooperation with the office of U.S. Representative Zoe Lofgren, in which a panel of USPTO patent examiners discussed their careers by sharing their personal experiences and taking questions from prospective candidates.
The Silicon Valley Regional United States Patent and Trademark Office has been active in outreach efforts with various organizations, including the San Francisco Economic Development Council, Maker Faire Bay Area, Licensing Executives Society, and IP law associations across the region. The office is actively engaging startups and incubators, providing technology-focused and industry-specific workshops and presentations. Furthermore, in June 2015, the office worked with the USPTO’s IP Attaché program to hold outreach meetings in San Diego and Los Angeles. The purpose of these meetings was to hear directly from stakeholders about their international IP-related concerns and challenges, and how the IP Attaché Program can help. Denver, COThe Rocky Mountain Regional United States Patent and Trademark Office in Denver opened in June 2014, a one-stop shop for innovators in the region. The Rocky Mountain Regional Office has been working with important industries in the region, such as clean tech and biotech, and organizations and events such as the Denver Mini-Maker Faire, Rocky Mountain IP Institute, and South by Southwest® (SXSW V2V).
The Rocky Mountain Regional Office, in conjunction with the Colorado Bar Association Intellectual Property Section and the Mi Casa Resource Center, also helped spearhead the recent expansion of the USPTO’s Patent Pro Bono program to Colorado. The Colorado Pro Bono Patent Initiative, or the ProBoPat program, seeks to connect low-income Colorado inventors with Colorado patent professionals for patent preparation and prosecution legal services on a pro bono or significantly reduced-fee basis.
Detroit, MIIn April of this year, the Elijah J. McCoy Midwest Regional United States Patent and Trademark Office in Detroit, the USPTO’s first regional office, held a roundtable on patent innovation with Senator Gary Peters, Congressman John Conyers, and Congresswoman Debbie Dingell. Participants discussed IP issues that impact the region and how the USPTO and other stakeholders can work together to promote economic growth. The Elijah J. McCoy

www.uspto.gov
69
Midwest Regional Office continues to actively engage with the innovation community, as well as hold Saturday seminars, which are free events open to the public.
Assisting Small BusinessesHelping small businesses and independent inventors with limited resources is an important goal of the USPTO and supports the Obama Administration’s commitment to leveling the playing field for all American workers and businesses. Despite comprising only 1 percent of all businesses, entrepreneurs and small business owners have generated more than 65 percent of new jobs over the last two decades, and start-ups in high-tech hubs account for more than 40 percent of new jobs each year (Small Business Administration, May 2014). The USPTO has several free or reduced-fee programs to assist independent inventors and small businesses in securing patent protection for their inventions, such as the Patent Pro Bono Program, the Pro Se Assistance Program, and the Certified Law School Clinic Program.
Continue Facilitating Growth of the Patent Pro Bono ProgramFirst, through the Patent Pro Bono Program, the USPTO partners with nonprofit organizations and law schools to establish regional programs throughout the country. By working with their regional patent pro bono program, under-resourced independent inventors and small businesses may secure free legal representation to help them file and prosecute patent applications. Each regional program has certain requirements that independent inventors and small businesses must meet. In general, an independent inventor or small business owner need only show income in a certain range, some knowledge about the patent system, and possession of an invention, not just an idea.
Second, after ascertaining that the eligibility criteria are met, the regional pro bono program matches independent inventors and small businesses with volunteer patent attorneys to provide them with assistance. To date, patent pro bono programs are available in all 50 states.
The USPTO recognizes that many independent inventors and small businesses file patent applications without the assistance of a registered patent attorney or agent, also known as pro se filing. The USPTO has tools to assist pro se filers with this process, as well as a dedicated team available to answer filing questions.
Third, the USPTO has partnered with 45 law schools to offer programs through which law students draft and file either patent applications or trademark applications for clients under the supervision of law school faculty. Since its inception, over 1,850 law students have participated in the program and have filed more than 340 patent applications for clients.
Another advantage that the USPTO offers for independent inventors is reduced fees for “micro entities” and “small entities.” Applicants meeting
PAIR is the USPTO’s safe, simple, and secure Web-based means of electronically viewing the status of, and documents for, patent applications. PAIR utilizes standard Web-based screens to view the status and documents online within minutes of sending them to the USPTO and can be used to securely check the progress of pending patent applications any time.
PERFORMANCE AND ACCOUNTABILITY REPORT
70
micro entity requirements are eligible for a 75-percent reduction on most fees, and small entity status offers a 50-percent fee reduction
The Patent Pro Bono Program, the Pro Se Assistance Program, and the Law School Certification Clinic Program, along with our discounted fee programs, serve vital roles in the marketplace of innovation. They ensure that all creators benefit from their IP and, in turn, that society can benefit from their inventions.
OBJECTIVE 7: MAINTAIN PTAB’S ABILITY TO PROVIDE TIMELY AND HIGH-QUALITY DECISIONS In September 2012, the AIA re-established the Board of Patent Appeals and Interferences as the PTAB. At that time, the PTAB began accepting petitions for some of the new AIA post-grant proceedings. The PTAB has been increasing the size of its staff to address both the appeals inventory and the new AIA proceedings.
In FY 2015, the PTAB received over 1,900 petitions under the AIA, and although meeting all AIA-related statutory deadlines, decided over 12,000 appeals. This reduced the PTAB Ex Parte Appeal4 backlog from over 25,000 in FY 2014 to below 22,000 in FY 2015. To keep pace with this rapidly increasing workload, PTAB aggressively recruited and hired 33 administrative patent judges by emphasizing geographical diversity as a strategy to expand the talent pool. In support of its management operations, the PTAB hired an Administrative Officer and Chief Clerk. In addition, PTAB judges occupy permanent USPTO offices in Detroit, MI; Denver, CO; San Jose, CA; and Dallas, TX.
In conjunction with the OCIO, PTAB continued development work on the PTAB End-to-End (PTAB E2E) project, a fully integrated IT system that is being designed to meet the specific business needs of its stakeholders. The PTAB E2E project will be designed and built to interface with aspects of the PE2E system and to leverage the technical and business lessons learned in the development of other USPTO systems. Development efforts will continue with iterative releases targeted for 2016.
To ensure consistency, PTAB formed a training committee that provides comprehensive training to all new judges and continuous legal training in emerging areas of the law to all PTAB judges. PTAB also instituted formal and recurring meetings of the judges to discuss Supreme Court and Federal Circuit opinions that may have an impact on matters before the PTAB. A Published Cases Committee also convenes regularly to identify appropriate opinions to be designated as precedential or informative. In addition, the PTAB has implemented procedures for reviewing trial and appeals decisions, ensuring quality and consistency in PTAB opinions. 4 For more information about Ex Parte Appeals, please visit the USPTO’s website at
www.uspto.gov/ip/boards/bpai/ptab appeals.jsp
The Patent Pro Bono Program provides free legal assistance
(with certain limitations) to under-resourced inventors
interested in securing patent protection for their inventions.
For more information about the Pro Bono program,
please click here.

www.uspto.gov
71
During FY 2015, the PTAB made presentations or participated in panel discussions at numerous IP events and presented a series of roundtables across the nation. The roundtables served as a vehicle for sharing information about the AIA trials and for receiving feedback. Each roundtable featured a panel discussion to elicit public input.

PERFORMANCE AND ACCOUNTABILITY REPORT
72
TRADEMARKS: STRATEGIC GOAL II
WHAT IS A TRADEMARK OR SERVICE MARK?A trademark or service mark is a word, name, symbol, device,
or any combination thereof, used to identify and distinguish the goods and services of one seller or provider from those of others and to indicate the source
of the goods and services. Although federal registration of a mark is not mandatory, it has several advantages, including notice to the public of the registrant’s claim of
ownership of the mark, legal presumption of ownership nationwide, and a presumption of the exclusive right to use the mark on or in connection with the goods and services listed
in the registration. Recordation of a registered trademark with U.S. Customs and Border Protection enables the owner to stop infringing goods from entering the United
States. For a look at the steps involved for obtaining a trademark from the USPTO, please visit www.uspto.gov/trademarks/process/.

www.uspto.gov
73
4
2.5 2
FY 2010 FY 2011 FY 2012 FY 2013 FY 2014 FY 2015
mon
ths
Target 0 Actual
perc
enta
ge
100
98
96
94 Target 92
90 Actual FY 2010 FY 2011 FY 2012 FY 2013 FY 2014 FY 2015
Target Actual pe
rcen
tage
97.0
97.5
98.0
FY 2010 FY 2011 FY 2012 FY 2013 FY 2014 FY 2015
FY 2010 FY 2011 FY 2012 FY 2013 FY 2014 FY 2015
Target Actual pe
rcen
tage
50 55 60
65
70 75 80
Target Actual 0
10
20
30
40
50
perc
enta
ge
FY 2011 FY 2012 FY 2013 FY 2014 FY 2015
mon
ths
16
12
8
4 Target 0 Actual
FY 2010 FY 2011 FY 2012 FY 2013 FY 2014 FY 2015
What follows are those Strategic Goal II measures for which enough data are available to establish performance trends.
Trademark Average First Action Pendency Trend: The trend line indicates that the performance is meeting goals within the expected target range of 2.5 to 3.5 months. Additional discussion for this measure can be found on page 76.
Trademark Average Total Pendency Trend: The trend line indicates that the performance trend is meeting goals within the target range. Additional discussion for this measure can be found on page 76.
Trademark First Action Compliance Rate Trend: The trend line indicates that the performance is maintaining standards within the target. This measure is the percentage of applications reviewed meeting the criteria for decision making for the first Office action under the Trademark Act. Additional discussion for this measure can be found on page 78.
Trademark Final Compliance Rate Trend: The trend line indicates that the performance is maintaining standards within the target. This measure is the percentage of applications reviewed meeting the criteria for decision making for registration based on the examiner’s approval or denial of the application including first Office actions under the Trademark Act. The trend line indicates that the performance is maintaining standards within the target. Additional discussion for this measure can be found on page 78.
Trademark Exceptional Office Action Trend: The trend line indicates positive performance. Additional discussion for this measure can be found on page 77.
Trademark Applications Processed Electronically Trend: The trend line indicates positive performance. Additional discussion for this measure can be found on page 81.

PERFORMANCE AND ACCOUNTABILITY REPORT
74
Strategic Goal II:Optimize Trademark Quality and Timeliness
The USPTO’s Trademark operations are guided by the strategic goal to optimize trademark quality and timeliness. The USPTO protects consumers and provides benefits to businesses by effectively and efficiently carrying out the trademark laws of the United States. Through federal trademark registrations, consumers can identify the source of products and services, and businesses have reliable indicators of the quality of their marks.
The USPTO consistently delivers strong performance with record-low trademark pendency and high-quality results. Trademarks have been registered in less than 12 months on average since 2008. An indication of registrability via a first action has been provided in less than 3.5 months every month since April 2007. The USPTO and its trademark stakeholders consider these to be optimal pendency rates. The USPTO strives now to maintain these results as filings increase.
The USPTO is dedicated to serving the public in the most efficient and cost-effective manner possible. In January 2015, the USPTO implemented reduced trademark application and renewal fees for applicants who choose to file and communicate electronically with the office. Lower fees lessen the burden for entrepreneurs and small businesses to obtain the crucial trademark protection they need to grow their businesses, while increased electronic processing enhances the USPTO’s efficiency of examination.
An important part of the USPTO’s mission is to optimize trademark quality and timeliness. The TEAS allows for easy electronic filing by applicants. A new reduced trademark application filing fee option, TEAS Reduced Fee (TEAS RF), has been available to the public since January 17, 2015. This new filing option promotes electronic communication and application processing while giving applicants more flexibility in identifying their goods and services. With the TEAS RF option, applicants pay a reduced fee if they agree to two-way electronic communication throughout the process. This option has proven to be popular with the majority of trademark filers. In addition to introducing TEAS RF, the USPTO also reduced the TEAS Plus initial application fee and reduced the fee to renew a trademark registration electronically. Visit the Trademarks page of the USPTO website for specific information on the reduced fees.
First and final action compliance rates, which measure trademark quality, exceed 96 percent. The number of trademark applications processed completely electronically increased to 82.2 percent in 2015.
The trademark process begins when a customer desires information on
trademarks or becomes interested in registering a trademark and proceeds
to submit a trademark application based on a mark currently used,
or intended for use, in commerce. During the examination process, trademark-examining attorneys
evaluate applications for compliance with current trademark laws,
regulations, and policies. During examination, the applicant may submit
amendments and the examining attorney may enter amendments or
refuse registration unless certain requirements are met. Upon
completion of the examination process, a trademark application is published
in the electronic Official Gazette. Trademarks are published prior to
registration to permit interested parties to file an opposition if they believe
that they may be harmed by the registration. The next step is issuance
of either a trademark registration for an application based on use, or a notice of
allowance for an application based on intent to use. Please click here for more
information on the trademark application process.

www.uspto.gov
75
This sustained level of performance will continue under the 2014–2018 Strategic Plan. The following objectives focus on the management actions required to continually ensure that staffing, resources, and refined processes are aligned with demand for products and services.
OBJECTIVE 1: MAINTAIN TRADEMARK FIRST ACTION PENDENCY ON AVERAGE BETWEEN 2.5–3.5 MONTHS WITH 12.0 MONTHS FINAL PENDENCY Trademark application filings can be volatile, and the USPTO will continue to align trademark examination capacity with incoming workloads through various management techniques, such as hiring, judicious use of overtime, production incentives, and the approval of career development details.
Over the past few years, economic uncertainty has persisted at high levels, affecting business decisions and investments. Economic recovery remains steady but unusually slow and fragile. Economic uncertainty contributes to inherently volatile application filings and the challenge of developing accurate forecasts. Despite the uncertainty and the volatility, the USPTO managed its resources and staffing to maintain the service timeliness that the agency’s stakeholders have come to expect from the USPTO. In response to a 10.7-percent increase in trademark filings for FY 2015, the USPTO plans to continue hiring to ensure that trademark examination capacity remains properly aligned with incoming work.
Continue to Define and Validate Optimal PendenciesFirst action pendency—the length of time between receipt of a trademark application and when the USPTO makes a preliminary decision—remains well within the optimum target range of 2.5 to 3.5 months. Average total pendency—the average number of months from date of filing to notice of abandonment, notice of allowance, or registration—is equally impressive at 10.1 months. The USPTO has achieved and sustained optimal pendency results (see Tables 8 and 9), which serve as an important indicator for our stakeholders when making business decisions. Trademarks will continue to make process and IT improvements to further its commitment to deliver quality service and enhanced capabilities to all its stakeholders. The USPTO is committed to continuing the revalidation of the agency’s overall targets with its IP community.
In addition to managing trademark examination capacity, the USPTO will continue to encourage its applicants to make greater use of electronic communication throughout the registration and maintenance processes. To achieve this, the USPTO will continue to reach out and solicit feedback from applicants and user groups to improve the current rate of applications processed and managed electronically.
Director Michelle K. Lee swears in Mary Boney Denison as Commissioner for Trademarks on January 23, 2015.

PERFORMANCE AND ACCOUNTABILITY REPORT
76
TABLE 8 Measure: Trademark Average First Action Pendency (Months)
Fiscal Year Target Actual2011 2.5 to 3.5 3.1
2012 2.5 to 3.5 3.2
2013 2.5 to 3.5 3.1
2014 2.5 to 3.5 3.0
2015 2.5 to 3.5 2.9
2016 2.5 to 3.5
2017 2.5 to 3.5
Target Met.
Prior to January 17, 2015, the electronic trademark application options consisted of a TEAS “regular” application and a lower-cost TEAS Plus application with stricter filing requirements, introduced to encourage complete applications and end-to-end electronic processing of trademark applications. Although these options did increase the number of applicants submitting initial applications electronically, the stricter filing requirements did not meet everyone’s needs. The USPTO conducted outreach to determine what specifically discouraged filers from filing electronically. The feedback received from this outreach led the USPTO to add the TEAS RF option and to reduce the TEAS Plus fee and trademark registration fee for electronic filings.
Since introducing the reduced fees in January of this year, trademark applicants and registrants have “saved” more than $21.6 million in reduced fees by selecting TEAS RF, TEAS Plus, and by electronically filing renewal applications. The shift in electronic filing is beneficial to the USPTO’s users, workflow processes, data collection, and file management, while supporting the objective of end-to-end electronic processing of trademark applications. The USPTO will continue to engage with the public to identify ways to streamline processes, lessen the financial burden on applicants, and efficiently process trademark applications.
TABLE 9 Measure: Trademark Average Total Pendency (Months)
Fiscal Year Target Actual2011 12.5 10.5
2012 12.0 10.2
2013 12.0 10.0
2014 12.0 9.8
2015 12.0 10.1
2016 12.0
2017 12.0
Target Met.

www.uspto.gov
77
OBJECTIVE 2: MAINTAIN HIGH TRADEMARK QUALITY Quality measurement takes into consideration adherence to registrability standards and the comprehensive excellence of Office actions, including research, writing, legal decision making, and evidence. Trademark quality targets are routinely achieved, and the USPTO continues to sustain these high performance levels by improving training and feedback, promoting electronic filing and processing, making greater use of online tools and enhanced processes, and adopting more rigorous customer-centric measures. All three Trademark quality targets were met again in FY 2015, providing compelling evidence that the specialized training, online tools, and enhanced communication efforts are effective.
The most comprehensive exceptional Office action measures have consistently exceeded their targets (see Table 10), illustrating the commitment of the examiners and the USPTO to provide and sustain excellence in constructing search strategy, preparing supporting evidence, writing the Office action, and communicating the decision. The measure has proven to be a success, emphasizing a holistic approach to quality. The USPTO continues to address quality by developing guidelines specific to quality review findings. Incentive awards have been successful in motivating more examiners to strive for exceptional work products. The target has been raised consistently to reflect not only the new level of quality, but also to consider the impact of hiring a significant number of new examiners and implementing new procedures or processes.
The USPTO will continue its multifaceted training program for its trademark-examining attorneys and support staff. New examiners are provided with classroom training and work with a mentor for an extended period. Experienced examiners are provided with continuing training resources to improve performance. This includes in-house legal training by the USPTO’s office of quality review, ongoing trademark case law updates and examination guidelines by the legal policy office, as well as the use of IT to provide new
TABLE 10Measure: Exceptional Office Action
Fiscal Year Target Actual2011 22.7% 23.6%
2012 20.0% 26.1%
2013 23.0% 35.1%
2014 28.0% 43.0%
2015 36.0% 48.3%
2016 37.0%
2017 37.0%
Target Met.
An Office action is issued to notify the applicant regarding problems with the application. This will include the reason why registration is being refused or what requirements must be satisfied for an application to proceed to registration. There are two types of Office actions: non-final and final. A non-final Office action raises an issue for the first time. A final Office action is issued when the applicant’s response to the prior Office action fails to address or overcome all issues.
For more information about responding to an Office action, please watch the news broadcast-style video titled
“Response to Office Action” (video #14 in the Trademark Information Network(TMIN)series).

PERFORMANCE AND ACCOUNTABILITY REPORT
78
research resources and procedures to minimize errors. For example, in FY 2015 training was conducted on the “The Internet of Things” to address how industry is adapting its use of technology. Users of the Trademark operation’s services are another source for feedback and educational resources to maintain and enhance examination quality. The USPTO continues to engage stakeholders in validating trademark-quality findings; offer user-group–provided, industry-specific training; and work with industry experts on updating identifications for goods and services. Regular meetings with outside constituent groups, a customer call center, and an email box for customer problems also provide valuable feedback about examination quality.
Trademark examination quality is indicated by the first and final compliance rate, which is determined through an in-process review evaluation of the statutory bases for which the USPTO raises issues and/or refuses marks for registration based on the first Office action and the examiner’s approval or denial of the application (see Tables 11 and 12).
TABLE 11Measure: Trademark First Action Compliance Rate
Fiscal Year Target Actual2011 95.5% 96.5%
2012 95.5% 96.2%
2013 95.5% 96.3%
2014 95.5% 95.8%
2015 95.5% 96.7%
2016 95.5%
2017 95.5%
Target Met.
TABLE 12Measure: Trademark Final Compliance Rate
Fiscal Year Target Actual2011 97.0% 97.0%
2012 97.0% 97.1%
2013 97.0% 97.1%
2014 97.0% 97.2%
2015 97.0% 97.6%
2016 97.0%
2017 97.0%
Target Met.

www.uspto.gov
79
Table 13 shows how the USPTO evaluates the efficiency of the trademark examination process, as measured by the average cost of a trademark disposal compared with trademark direct and indirect costs. This efficiency measure is calculated by dividing total expenses associated with the examination and process of trademarks (including associated overhead and allocated expenses), including multiyear investments in IT by outputs or office disposals. Actual results are based on total trademark-related expenditures officewide compared with office disposals (issuances, rejections, etc.).
TABLE 13Total Cost Per Trademark Office Disposal
Fiscal Year Target Actual2011 $650 $541
2012 $607 $560
2013 $609 $552
2014 $650 $559
2015 $673 $667
2016 $590
2017 $559
Target Met.
OBJECTIVE 3: ENSURE OPTIMAL INFORMATION TECHNOLOGY SERVICE DELIVERY TO ALL USERS Modernize IT Systems through Developing the Trademark Next GenerationIn response to direction from the USPTO Under Secretary to separate the trademark IT infrastructure from the rest of the USPTO IT infrastructure and to implement an integrated IT system for end-to-end electronic processing of trademark applications and trademark registration maintenance, work began in late 2010 on the TMNG. TMNG will enable end-to-end processing that is faster, more practical, more feature-rich, and more reliable for the USPTO employees, trademark applicants, trademark owners, and the public at large. User-centered design is a core component of the TMNG development effort that works with end users (both internal and external) to identify the features they desire in the new system interface. Work continues on the development of the initial replacement of systems used by examiners to perform their work.

PERFORMANCE AND ACCOUNTABILITY REPORT
80
TMNG development takes advantage of virtualization and cloud computing. Using this technology requires a redesign of the Trademark organization’s 26 computer systems. This modernization effort is a multiyear investment that delivered enhancements to existing tools such as Trademark Status and Document Retrieval, the internal search program known as X-search, and expanded search functionality for other tools, such as the Electronic Official Gazette and the ID Manual. Progress was made in FY 2015 on the development and eventual replacement of FAST 1 (the online examination system used by examining attorneys) and the Trademark Reporting Data Mart, which is intended to enhance management tools for reporting and analysis of performance results. FAST 1 is currently scheduled for full replacement in FY 2016.
The USPTO delivered an enhanced Trademark Electronic Official Gazette for the public in FY 2015. Additional “search and sort” functionality was delivered to support improved quality review for managers. The USPTO enhanced trademark examination capabilities to include the functionality to deliver a system that will support examination up to the first action approval for publication.
Electronic processing of trademark applications rose to 82.2 percent of applications in FY 2015, as shown in Table 14. These applications were exclusively processed electronically from filing to disposition.
In 2015 the USPTO released a new online front end for the Trademark Official Gazette.

www.uspto.gov
81
TABLE 14 Measure: Trademark Applications Processed Electronically
Fiscal Year Target Actual2011 68.0% 73.0%
2012 74.0% 77.0%
2013 76.0% 79.0%
2014 78.0% 80.7%
2015 80.0% 82.2%
2016 81.0%
2017 82.0%
Target Met.
OBJECTIVE 4: CONTINUE AND ENHANCE STAKEHOLDER AND PUBLIC OUTREACH Much progress has been made on Objective 4, which emphasizes USPTO’s outreach to stakeholders and the public. The USPTO continues to expand outreach to practitioners across the country by holding roundtables for open discussion to explore a number of topics, including the current state of trademark operations; updates and improvements for entries in the Identifications and Classifications Manual for social media, finance, and computer terminology; and the impact of technology changes on descriptions of goods and services in registered marks. Roundtables were held in conjunction with different stakeholder groups, including multiple bar associations and the International Trademark Association, in cities throughout the United States.
Providing Access to Pro Bono Trademark Legal Services through Law School ClinicThe USPTO also assists patent and trademark applicants by providing pro bono services through its law school clinic program, now expanded to include 36 participating colleges and universities. The program benefits both law school programs and the business owners they represent in filing applications and obtaining trademark protection. This program allows law students enrolled in participating law schools to practice both patent and trademark law before the USPTO and under the strict guidance of a faculty supervisor. In December 2014, legislation was enacted to make the USPTO Law School Clinic a permanent program. As a result of the legislation and the expansion of the clinic program, 521 trademark applications were filed. This represents a 45 percent increase compared to the same time period in FY 2014.

PERFORMANCE AND ACCOUNTABILITY REPORT
82
The USPTO reaches out to provide small businesses around the country with information about trademark basics, enforcement measures, and available tools for protecting and enforcing trademark rights. These educational programs and materials are geared to those generally not acquainted with trademark information, such as nontrademark attorneys, the small business community, the entrepreneurial community, and students. The USPTO partners with colleges and universities, entrepreneurship clubs, and similar groups to present informational lectures on trademarks and the importance of a strong mark that is both federally registrable and legally protectable.
The USPTO has also increased information available through its website by updating the Basic Facts About Trademarks booklet and corresponding videos, which are available in both English and Spanish languages. “What Every Small Business Should Know Now, Not Later” is one of several new informational videos designed specifically for anyone interested in starting a business. The video highlights the important role of trademarks in starting a business, including a discussion of how trademarks, patents, copyrights, domain names, and business name registrations differ, and gives guidelines on how to select the right mark. The video also explains the benefits of federal registration and suggests resources if help is needed in preparing and filing an application. The video makes it clear why addressing trademarks in a business plan can be critical to success. This video has been watched over 360,000 times since it was launched in August 2013.
A still from one of the latest additions to the Trademark Information Network (TMIN) educational video series.

www.uspto.gov
83
Engagement of Stakeholders for the Trademark RegistryThe USPTO is working with stakeholders to ensure the integrity of the Trademark Register. The agency held a roundtable in December 2014 to discuss the results of the Post Registration Pilot to assess the accuracy of the Trademark Register. Given that over half of the registrations randomly selected for the pilot were unable to provide the requested proof of use of the mark, stakeholders sought changes to improve the integrity of the Register. Based on stakeholder input, the USPTO plans to pilot a permanent program in FY 2016 in which random audits of registration maintenance filings will occur to ensure use. In addition, at the behest of stakeholders, the USPTO is developing a proposal for a streamlined non-use expungement proceeding to quickly and inexpensively cancel the registration of a mark not in use. The USPTO will publish recommendations, informed by stakeholder feedback, to address accuracy on the Register. In addition, the USPTO has implemented a new pilot program regarding goods and services impacted by technology evolution, ensuring the integrity of the Register to reflect marks that still remain in use in the relevant industry.
OBJECTIVE 5: ENHANCE OPERATION OF THE TRADEMARK TRIAL AND APPEAL BOARD The TTAB continued its commitment to transparent reporting of data and performance measures and welcomes comments on these from the TPAC and other stakeholders. Data reported in FY 2015 show continuing improvement (reductions) in overall average pendency (from commencement to completion) of appeals, trial cases and Accelerated Case Resolution trial cases. Significantly, FY 2015 marks the fourth consecutive year that the TTAB reduced overall average pendency in trial cases.
In January 2015, the TTAB hosted a users’ forum for the Board’s electronic filing system, Electronic System for Trademark Trials and Appeals (ESTTA). This forum: (1) resulted in valuable comments and suggestions (from forum participants such as the American Bar Association, American Intellectual Property Law Assocation, etc.), which TTAB used to set the requirements for two legacy IT system improvement packages; and (2) aided the Board’s planning for the future implementation of the USPTO’s end-to-end electronic processing of trademark matters (TMNG), which will significantly increase the functionality and flexibility of the USPTO’s systems and its appeal and trial processes. Because TMNG is a long-term project, the legacy system improvements to ESTTA and TTABVUE (the Board’s electronic docket and case file repository and viewer) will provide needed near-term improvements, for example, an enhanced process for ensuring the accuracy and utility of TTABVUE electronic case file prosecution history entries and enhanced processing of critical consented motion filings made in ESTTA.

PERFORMANCE AND ACCOUNTABILITY REPORT
84
Apart from its important focus on IT improvements and planning, TTAB also focused on appeal and trial process and procedure improvements. This process began with a February 2015 Roundtable on Evolving TTAB Processes, which was attended by representatives of IP stakeholder organizations. The broad consensus on an array of process improvements that was reached during the roundtable led to the Board’s revision of its Standard Protective Order for trial cases, which was posted for public comment in the IdeaScale application. In addition, a group of TTAB attorneys and judges actively identified numerous other process improvements, including many that will become part of a Notice of Proposed Rulemaking in FY 2016. A draft of the proposed rules changes was shared with the TPAC at its last meeting for FY 2015, with comments and reaction expected in the first quarter of FY 2016.
In June 2015, TTAB maintained its commitment to issue its annual revision of the Trademark Board Manual of Procedure in a searchable format and Portable Document Format (PDF). The manual was revised to incorporate new material related to amendments of the Trademark Act, the Trademark Rules of Practice, and the Federal Rules of Civil Procedure, as applicable, as of February 28, 2015. In addition, the Board continued to fufill its commitment to developing the law by issuing a substantial number of precedential opinions and orders, with 42 such decisions issued on a wide variety of substantive and procedural matters.

www.uspto.gov
85
INTELLECTUAL PROPERTY:
STRATEGIC GOAL III
WHAT IS THE ROLE OF THE USPTO AND INTELLECTUAL PROPERTY POLICY?The USPTO advises the President—through the Secretary of Commerce—
and all federal agencies on national and international intellectual property policy issues, including IP protection in other countries. The USPTO’s
strategic plan highlights these activities in the USPTO’s Strategic Goal III: Provide Domestic and Global Leadership to Improve Intellectual
Property Policy, Protection, and Enforcement Worldwide. OPIA oversees and implements this policy role.

PERFORMANCE AND ACCOUNTABILITY REPORT
86
What follows is the Strategic Goal III measure for which sufficient data are available to establish performance trends. The measure, “Number of Foreign Government Officials Trained on Best Practices to Protect and Enforce Intellectual Property” was introduced just last year. Although there is prior year data going back to FY 2011, performance targets were not introduced to the metric until FY 2014. Therefore, the measure has only two fiscal years of measurable performance and is currently unsuitable for trend analysis until more data are accumulated (e.g., 2018).
www.uspto.gov 67
,
FY 2010 FY 2011 FY 2012 FY2013 FY 2014 FY 2015
TargetActual
100
75
50
perc
enta
ge
Percentage of prioritized countries for which country teams have made progress on at least 75% of action steps in the country-specific action plans along the following dimensions:
1. Institutional improvements of IP office administration for advancing IP rights 2. Institutional improvements of IP enforcement entities 3. Improvements in IP laws and regulations 4. Establishment of government-to-government cooperative mechanisms.
Trend: The trend line indicates that the performance trend is maintaining standards with significant variability of the direction of the trend line in predicting future results. Additional discussion for this measure can be found on page 98.

www.uspto.gov
87
Strategic Goal III:Provide Domestic and Global Leadership to Improve Intellectual Property Policy, Protection, and Enforcement Worldwide
The USPTO has a statutory mandate to advise the President and all federal agencies, through the Secretary of Commerce, on national and international IP policy issues, including IP protection in other countries. In addition, the USPTO is authorized by statute to provide guidance, to conduct programs and studies, and to interact with IP offices worldwide and with international intergovernmental organizations on matters involving IP.
The USPTO fulfills this mandate by working to meet Strategic Goal III. Through the OPIA, it leads negotiations on behalf of the United States at WIPO; advises the Administration on the negotiation and implementation of the IP provisions of international trade agreements; advises the Secretary of Commerce and the Administration on a full range of IP policy matters, including in the areas of patent, copyright, trademarks, and trade secrets; conducts empirical research on IP; and provides educational programs on the protection, use, and enforcement of IP.
OBJECTIVE 1: PROVIDE LEADERSHIP AND EDUCATION ON INTELLECTUAL PROPERTY POLICY AND AWARENESS The USPTO works to meet Objective 1 by conducting a wide variety of educational programs on IP, by leveraging technology to enhance those programs, by encouraging and enhancing empirical studies on the economic impacts of IP and innovation, and by improving access to IP-related data. In addition, the USPTO plays a leadership role in domestic and international IP initiatives and policy development for the Administration, and engages with Congress and U.S. government agencies on legislation that improves the IP system.
Provide Empirical Evidence on the Economic Impact of USPTO OperationsOne aspect of OPIA’s mission of providing domestic leadership on IP policy issues is enhancing understanding of the economics of IP. Through the Office of Chief Economist, OPIA encourages and supports empirical studies of the economic impacts of IP and innovation.
This is achieved partly through the Thomas Alva Edison Visiting Scholars Program, a program that enlists the services of academic researchers to study IP matters. Since its debut in 2012, the program has supported Edison Scholars in studying ways to improve USPTO’s efficiency and performance, decrease burdens on applicants, and improve patent quality and clarity,

PERFORMANCE AND ACCOUNTABILITY REPORT
88
among other topics. FY 2015 Edison Scholars include Joshua Sarnoff (Professor of Law at DePaul University), who is examining the implications of patent claim scope and clarity for patent quality, and FY 2015 Edison Fellows, which include Joseph P. Bailey (Research Associate Professor at the University of Maryland’s Robert H. Smith School of Business), who is considering the application of machine-learning approaches to prior art searching, and Deepak Hegde (Assistant Professor of Management and Organization at New York University’s Stern School of Business), who is focused on patent-examination quality and the role of IP in securing venture capital funding.
Over the past year, two USPTO Economic Working Papers were accepted for publication: one provides a comparative historical perspective on U.S. patenting from China; the other examines the probability of receiving a U.S. patent. In addition, reflecting research conducted in collaboration with two other USPTO offices, the Office of Chief Economist produced a report linking patent examination characteristics to subsequent litigation and inter partes review activity.
To further enhance understanding of IP-related matters, the USPTO co-sponsored two events in FY 2015 to encourage empirical economic research and inform IP policy: the 2015 Works-in-Progress Intellectual Property Colloquium in February 2015 and the Eighth Annual Conference on Innovation Economics in June 2015.
Improve Transparency and Access to Intellectual-Property–Related DataIn July 2015, the USPTO released an Economic Working Paper entitled “The USPTO Historical Patent Data Files: Two Centuries of Innovation” and four accompanying research datasets on applications, grants, and in-force patents by technology categories since 1840. In addition, in August 2015, the USPTO published an Economic Working Paper entitled “The USPTO Patent Assignment Dataset: Descriptions and Analysis,” along with a public-use dataset that contained detailed information on assignments, mergers, security interests, and other transactions involving patents and patent applications that were recorded at the USPTO. These data were released as part of an ongoing initiative to make patent and trademark information available in a form convenient for public use and academic research.
Provide Domestic Education Outreach and Capacity BuildingThe USPTO, through the Global Intellectual Property Academy (GIPA) in OPIA, provides IP educational programs for U.S. government officials, domestic small- and medium-sized enterprises (SMEs), universities, and the public. In FY 2015, GIPA conducted a total of 148 such training programs.
GIPA also works with various other agencies and components of the U.S. government, including the Small Business Administration and its partnership with the Small Business Development Centers; bureaus of the U.S. Department of Commerce, including the International Trade

www.uspto.gov
89
Administration and the Minority Business Development Agency; the U.S. Export Assistance Centers of the U.S. Commercial Service; and the U.S. Department of Interior Indian Arts and Crafts Board.
Leverage Technology to Increase Domestic and International Education, Training, and Outreach at all Levels GIPA continues to utilize technology to make its training programs more efficient and to expand the reach of those programs. For example, GIPA hosts distance-learning modules on the USPTO website. The modules are available in five different languages and have received over 58,678 hits since they were first made available in FY 2010.
Engage Congress and U.S. Government Agencies on Legislation that Improves the Intellectual Property SystemThroughout FY 2015, the USPTO continued to engage Congress, other U.S. government agencies, and stakeholders to discuss, develop, promote, and implement effective and balanced IP-related legislation and administrative actions. The USPTO’s discussions and briefings focused on Congressional proposals to reduce or eliminate abusive tactics in patent litigation, effectively address cybersecurity threats, provide a federal civil cause of action for trade secrets theft, update provisions of the copyright statute and consider restructuring the Copyright Office, formally establish USPTO’s law school clinic certification program, and address IP issues relevant to the Internet Corporation for Assigned Names and Numbers (ICANN). The USPTO also worked with other agencies and briefed Congress on a range of matters, including the USPTO’s budget and funding, various operational issues, the USPTO’s IP Attaché program, and developments at the WIPO, such as WIPO’s adoption of the Geneva Act of the Lisbon Agreement for the Protection of Appellations of Origin.
During FY 2015, the Senate Judiciary Committee held two confirmation hearings—December 10, 2014, and January 21, 2015—on the nomination of Michelle K. Lee to the position of Under Secretary of Commerce for Intellectual Property and Director of the USPTO. The full Senate approved the nomination by a unanimous vote on March 9, 2015. On April 14, 2015, the Under Secretary and Director testified before the House Judiciary Committee at a legislative hearing on H.R. 9, the Innovation Act. In addition, on November 18, 2014, then Commissioner for Patents Peggy Focarino testified at a joint hearing before the House Judiciary Committee and the House Committee on Oversight and Government Reform on “Abuse of the USPTO’s Telework Program: Ensuring Oversight, Accountability, and Quality.” Finally, Senior Counsel on China Mark Cohen testified at a hearing on January 28, 2015, before the U.S.–China Economic and Security Review Commission on “The Foreign Investment Climate in China: Present Challenges and Potential for Reform.”
In FY 2015, the USPTO continued to provide information and advice in connection with the Administration’s effort to seek targeted and balanced
Under Secretary of Commerce for Intellectual Property and Director of the USPTO Michelle K. Lee appeared before the House Judiciary Committee at an April 14, 2015, legislative hearing to discuss H.R. 9, “The Innovation Act.”

PERFORMANCE AND ACCOUNTABILITY REPORT
90
reform to reduce or eliminate patent litigation abuse while ensuring that any patent owner will be able to enforce a patent that is valid and infringed. The U.S. IP environment benefited from the legislative changes enacted in the 2011 AIA. These included changes to operations at the USPTO, support for further patent harmonization, and providing an alternative to district court litigation when challenging patentability. The USPTO believes that additional legislative changes can build upon the AIA to further enhance patent quality and to lessen litigation abuses. In FY 2015, with these principles in mind, Under Secretary and Director Lee and USPTO’s Office of Governmental Affairs worked with both House and Senate Judiciary Committee staff to support efforts to develop consensus legislation by providing briefings and technical assistance at the request of various members of Congress.
The USPTO participated in caucus-related events on Capitol Hill during FY 2015. These included the Capitol Hill Maker Faire in conjunction with the White House National Week of Making; the relaunch of the Congressional Caucus on Intellectual Property Promotion and Piracy Protection (with Under Secretary and Director Lee serving on a panel); the launch of the Diversifying Tech Caucus to increase representation of women, minorities, and veterans in the tech sector; and a Trademark Expo Hill event with the newly formed Trademark Caucus. The USPTO also invited Congressional staff to participate in events at USPTO headquarters, including a trade secret symposium and an annual program on China issues.
Finally, consistent with requirements in the AIA, the USPTO continued its efforts to establish regional offices and engaged Congressional members, state and local officials, and various stakeholders in four locations: Detroit, MI; Denver, CO; Silicon Valley, CA; and Dallas, TX. June 2015 marked the one-year anniversary of the Rocky Mountain Regional Office in Denver, CO, and July 2015 marked the three-year anniversary of the Elijah J. McCoy Midwest Regional Office in Detroit, MI. The USPTO opened permanent space in Silicon Valley, CA, in October 2015 and in Dallas, TX, in November 2015. This is an exciting time for the four regional offices as the USPTO actively engages communities and local industries with education and assistance, while enabling it to more effectively recruit the workforce it needs.
Provide Policy Formulation and Guidance on Key Intellectual Property Issues in all Fields of Intellectual Property Protection and EnforcementThroughout the fiscal year, USPTO officials provided policy formulation and guidance by organizing numerous briefings for congressional staff on various IP policy matters—including on curbing abusive patent litigation and on protecting trade secrets—by conducting public meetings to solicit stakeholder views on a range of IP policy matters and by continuing to carry forth the work flowing out of the U.S. Department of Commerce’s Internet Policy Task Force (IPTF) 2013 paper “Copyright Policy, Creativity, and Innovation in the Digital Economy” (the “Green Paper”).
As function of its duty to provide policy formulations and guidance on key
issues related to IP protections and enforcement, the USPTO prepares from time to time so-called Green
Papers and White Papers. A Green Paper, such as a 2013 paper on
copyright in the digital economy, provides an overview of a topic and
is designed to stimulate further discussion and review. A White
Paper, however, serves as a statement of policy.

www.uspto.gov
91
In April 2015, the USPTO and the National Telecommunications and Information Administration (NTIA) hosted a public meeting on facilitating the development of the online licensing environment for copyrighted works. That followed up on a recommendation in the Green Paper that the IPTF would solicit public comment and convene roundtables regarding an appropriate role for the government to help improve the online licensing environment. In addition, the USPTO and NTIA are finalizing a policy paper on three issues identified in the Green Paper, namely, the legal framework for the creation of remixes, the relevance and scope of the first sale doctrine in the digital environment, and the application of statutory damages in the context of individual file-sharers and secondary liability for large-scale online infringement. In April 2015, as an outgrowth of the Green Paper, a multi-stakeholder forum established by the USPTO and NTIA reached agreement on a set of good and bad practices aimed at improving the operation of the notice and takedown system under the Digital Millennium Copyright Act.
In November 2014, the USPTO held a Roundtable on Harmonization of Substantive Patent Law where it sought input on certain matters relating to international harmonization of substantive patent law. The USPTO hoped to obtain stakeholder comments on key patent examination-related issues, including the definition and scope of prior art, the grace period, and standards for assessing novelty and obviousness/inventive step. Following the roundtable, and as discussed further in this report, the USPTO continued to work with international partners on harmonization.
In January 2015, the USPTO hosted a symposium on trade secret protection. Topics included legislative proposals, losses due to trade secret theft and challenges to protecting trade secrets, the intersection of patent and trade secret protection, issues in civil litigation, trade secret protection in foreign jurisdictions, and proposed responses to the threat of trade secret theft in the United States.
In February 2015, the USPTO hosted a roundtable to gather views about how best to protect communications between patent practitioners and their clients from disclosure, particularly in an international setting. Stakeholders presented a range of views on these matters at the roundtable, and in June, 2015, the USPTO published a report on its website summarizing the feedback received from stakeholders.
OBJECTIVE 2: PROVIDE LEADERSHIP AND EDUCATION ON INTERNATIONAL AGREEMENTS AND POLICIES FOR IMPROVING THE PROTECTION AND ENFORCEMENT OF INTELLECTUAL PROPERTY RIGHTSThis second objective focuses primarily on the USPTO’s activities in the international IP system, which includes multilateral and bilateral activities worldwide. On an ongoing basis, the USPTO provides technical expertise in the negotiation and implementation of bilateral and multilateral agreements that
Shira Perlmutter, USPTO’s Chief Policy Officer and Director of International Affairs, moderates a panel at the Department of Commerce Internet Policy Task Force’s April 1, 2015 Public Meeting on Facilitating the Development of the Online Licensing Environment for Copyrighted Works.

PERFORMANCE AND ACCOUNTABILITY REPORT
92
improve IP rights protection and enforcement. The USPTO continues to lead the promotion of harmonization by working closely with other international entities. Innovators need cost-effective ways of obtaining reliable rights in multiple jurisdictions; therefore, pursuing the alignment of laws and procedures among IP systems is critical for ensuring consistency and clarity of rights for innovators as they seek to tap into global markets. The AIA moved this effort forward with the adoption of the first-inventor-to-file principle in the United States. The Patent Prosecution Highway (PPH) and CPC efforts are examples of international work sharing cooperation programs that both benefit from
and contribute to international harmonization of patent laws and operations. See Figure 5 to see our cumulative PPH filings for this fiscal year.
Figure 5.CUMULATIVE PPH FILINGS IN FY 2015
05,000
10,00015,000
20,00025,00030,00035,00040,000
27,428 27,964 28,632 29,326 29,918 30,638 31,350 31,931 32,603 33,179 33,746 34,349
Month and Year of First PPH Petition Filing
Oct 2014
Nov 2014
Dec 2014
Jan2015
Feb2015
Mar2015
Apr2015
May2015
Jun2015
Jul2015
Aug2015
Sep2015
Cum
ulat
ive
PPH
Fili
ngs
Lead Efforts at the WIPO and Other Intergovernmental Organizations to Improve International Intellectual Property Rights Systems Throughout FY 2015, the USPTO continued to seek enhanced cooperation and improved protection for IP in several fora, including the WIPO, the World Trade Organization (WTO), and several additional intergovernmental organizations. The USPTO achieved improvements in the WIPO filing and registration systems for patents (PCT system), trademarks (Madrid system), and designs (Hague system). The USPTO continued to press WIPO for increased transparency, accountability, and good governance in its overall program and budget.
In addition, one of WIPO’s strategic goals is to further the “[b]alanced evolution of the international normative framework for IP.” During FY 2015, the USPTO actively participated in the norm-setting bodies of WIPO, including the Standing Committees related to Patents, Trademarks, and Copyright, in working groups established under the Madrid, PCT, and Hague systems, and in the Intergovernmental Committee on IP and Genetic Resources, Traditional Knowledge and Folklore. Progress was made in maintaining balanced programs of work in the Standing Committees.

www.uspto.gov
93
The USPTO also participated with the Office of the U.S. Trade Representative on the accession of countries to the WTO and on the trade policy reviews of current WTO members, and participated in the ongoing discussions in the WTO TRIPS Council throughout the fiscal year.
International Union for the Protection of New Varieties of PlantsThe USPTO continued to provide leadership at the International Union for the Protection of New Varieties of Plants (UPOV), an intergovernmental organization based in Geneva, Switzerland. UPOV improved communication and understanding concerning the importance of plant variety protection under the 1991 Act of the UPOV Convention by formulating and obtaining consensus on the frequently asked questions and responses (UPOV-FAQs). The UPOV-FAQs are now posted on the UPOV website and are accessible to the public.
The USPTO continued its efforts to promote an effective plant variety protection system in Western Africa. This helped bring about significant results in FY 2015: The African Intellectual Property Organization (OAPI) became a UPOV member, and 17 OAPI member countries implemented the regional plant variety protection provided for under the protocols of the 1991 Act of the UPOV Convention.
Geneva Act of the Lisbon AgreementThe USPTO actively participated in the May 2015 diplomatic conference for adoption of the Geneva Act of the Lisbon Agreement on the International Registration of Appellations of Origin and Geographical indications, although the office was blocked from full participation and voting rights. The Geneva Act expands the predecessor Lisbon Agreement—which covered only appellations of origin—to also cover geographical indications (GIs). The Geneva Act is inconsistent in several important ways with U.S. law and other trademark-based systems for protecting GIs, which means that many major countries will not be able to join. Moreover, the overly broad protection for GIs could improperly interfere with U.S. exporters’ use of trademarks and common food names. The USPTO led the U.S. delegation and worked to limit the most damaging provisions. Nevertheless, the Geneva Act was ultimately adopted by the 28 Lisbon Union Members, over the strong objections of the United States and many other WIPO members.
Going forward, the USPTO will continue to raise concerns about the negative trade impacts of this new act. In addition, the USPTO will insist that the Geneva Act’s registration system must be financially self-sustained, like all of the other WIPO registration systems. In the past, the system has been funded almost entirely by revenue from other registration systems.
Geneva Act of the Hague Agreement Concerning the International Registration of Industrial DesignsThe Geneva Act of the Hague Agreement Concerning International Registration of Industrial Designs (Hague Agreement) allows applicants for design patents to apply for design protection in multiple jurisdictions by filing

PERFORMANCE AND ACCOUNTABILITY REPORT
94
a single, standardized application. In 2015, the United States took the final steps necessary to become a member of the Hague Agreement: United States applicants can now file a single application either directly with WIPO or indirectly through the USPTO, and Hague applicants from other jurisdictions can designate the United States as a jurisdiction in which they wish their design to have effect.
In the three months between becoming a member of the Hague Union and the Hague Agreement taking effect, the USPTO was active in finalizing and publishing in the Federal Register its Hague Agreement Final Rules Package.5 To further prepare potential U.S. applicants and users of the Hague System, in April 2015, the USPTO hosted a forum at USPTO headquarters on the Geneva Act and the associated Final Rules.
Engage Additional Countries in Patent Prosecution Highway Agreements: Improving Efficiency and Cooperation in the Global Intellectual Property System—Patents Work sharing continued to be a key element of the USPTO’s international engagement throughout FY 2015. Work sharing helps to reduce examination backlogs, improve examination quality, and promote streamlining of the international patent system. The PPH, first launched in 2006, remained the USPTO’s cornerstone of work sharing cooperation. The PPH allows an applicant who receives a positive ruling on patent claims from one participating office to request accelerated prosecution of corresponding claims in another participating office. This enables the applicant to potentially obtain patents faster in multiple jurisdictions and at less expense, while also enabling the participating offices to leverage each other’s work, thereby improving examination efficiency and quality.
The USPTO continues to engage with additional countries to increase participation in the Global PPH program. The Global PPH, launched in January 2014, is intended to simplify and streamline the existing PPH network by replacing the dozens of bilateral PPH arrangements that are currently in place among participating IP offices with a single, centralized framework of common requirements to which all participating offices will subscribe. This common set of standards will make it both easier for offices to administer the program and more user-friendly for applicants in navigating their applications through the participating offices. The United States is one of 21 offices currently accepting PPH requests under the Global PPH pilot, and other offices have signaled their intent to join the framework in the near future.
During FY 2015, work sharing received attention at the highest political levels. A joint communiqué issued on June 30, 2015, by President Obama and Brazilian President Dilma Rousseff highlighted all of the major areas of cooperation between the two countries, including patent work sharing5 Changes to Implement the Hague Agreement Concerning International Registration of Industrial
Designs, Final Rule, 80 Fed. Reg. 17918–17971 (April 2, 2015).

www.uspto.gov
95
between the USPTO and Brazil’s national IP office. A formal Joint Statement on Patent Work Sharing was signed that same day in Washington, DC, by U.S. Secretary of Commerce Penny Pritzker and her Brazilian counterpart, Minister Armando Monteiro of the Brazilian Ministry of Development, Industry and Foreign Trade.
A nine-year trend of year-on-year increases in PPH filings continued in FY 2015. The monthly average of PPH requests currently approaches 600 new filings per month, as shown in Figure 5. The USPTO is continuing to engage current and prospective PPH partner offices on training, outreach, and other programs designed to boost awareness and usage of the PPH. Likewise, the USPTO continues to work with other partner offices on possible enhancements to the PPH program to maximize efficiency and quality.
The USPTO also made significant advances in other areas of cooperation related to work sharing. One key effort that saw notable progress in FY 2015 was our cooperation with partner offices on substantive patent law harmonization. The USPTO recognizes that to truly maximize work sharing efficiencies and improve the quality of patents issued from existing and future work sharing programs, it must explore harmonization of the underlying legal frameworks. Harmonization of the examination aspects of patent law enhances work sharing: if offices employ similar examination practices, then they will be able to more easily—and confidently—rely on one another’s work, including, for example, search and examination reports. In conjunction with a subgroup of other like-minded IP offices, the USPTO developed a working document that specifies both the principles for an internationally harmonized patent system and the goals that such a system should aim to achieve.
Improve Efficiency and Cooperation in the Global Intellectual Property System—Trademarks In FY 2015, the USPTO continued to collaborate with a variety of trademark partners throughout the world to improve users’ interactions with national trademark offices. To make it easier for trademark applicants to conduct global trademark clearance searches, the USPTO provides its trademark data to several global search databases, which allow users to conduct single searches of multiple databases. In addition, to help make the results of such searches more understandable, the USPTO joined with other IP offices to develop “common status descriptors,” or uniform terms and symbols that multiple national offices can use to signify the particular status of trademark registrations and applications. In partnership with other national trademark offices, the USPTO developed a harmonized global “pick list” with preapproved and preclassified identifications of goods or services and their translations. By including entries from this pick list in trademark applications

PERFORMANCE AND ACCOUNTABILITY REPORT
96
filed in any of the participating countries, trademark applicants will avoid a refusal on the grounds that the identification is indefinite or otherwise unacceptable. In FY 2015, the USPTO helped develop a public online searchable database of such preapproved identifications.
The USPTO also continued its efforts to minimize the incidence of bad faith trademark filings around the world by working with other national trademark offices to provide more transparent information to users on how the largest trademark offices in the world combat such filings. In particular, the USPTO worked with its partner offices to complete and publish a report that summarizes each office’s practices and procedures for handling bad faith trademark applications.
In addition, in collaboration with the NTIA, the USPTO engaged in discussions at ICANN to address concerns about the potential for an increase in bad faith domain name registrations in the new generic top-level domains currently being introduced in the domain name system. The USPTO has supported the work of IP stakeholders through the ICANN Governmental Advisory Committee (GAC) to encourage the development of new and improved global trademark enforcement tools that will ensure consumer confidence along with a vibrant, modern Internet.
Improve Enforcement and Provide Capacity Building and Technical Assistance to Key Countries and Regions In providing technical assistance programs on the enforcement of IP, the USPTO developed a series of workshops in coordination with trading partners to combat trademark counterfeiting and copyright piracy. These programs were conducted for customs, police, prosecutors, judges, and IP office officials in Southeast Asia, Central America, Europe, the Middle East, and South and Central Asia. A regional workshop for Southeast Asia countries was also held on the protection and enforcement of trade secrets.
Table 15 shows the total number of foreign government officials trained on best practices to protect and enforce IP in FY 2015. This is the second year of aligning this measure directly with the USPTO’s performance progress in Goal III. For a variety of reasons, GIPA was unable to train foreign government officials at the levels originally planned. In the fourth quarter of FY 2015, GIPA hired a Training Administrator who will assist GIPA/OPIA in supplementing its training in the field and expanding its outreach with additional online training modalities to improve performance in this area.

www.uspto.gov
97
TABLE 15 Measure: Number of Foreign Government Officials Trained on Best Practices
to Protect and Enforce Intellectual PropertyFiscal Year Target Actual
2011 N/A 4,338
2012 N/A 9,214
2013 N/A 7,078
2014 4,300 4,960
2015 6,300 5,283
2016 5,000
2017 5,500
Target Not Met.
Provide Policy Advice and Expertise to Other U.S. Government Agencies Throughout FY 2015, the USPTO provided policy advice and technical expertise on domestic and international IP matters to departments of the Executive Office of the President, including the Office of Science and Technology Policy and the Office of the U.S. Intellectual Property Coordinator, the U.S. Department of Commerce, and to other federal agencies. The USPTO advised the U.S. Trade Representative (USTR) on trade policy reviews undertaken at the WTO and on the WTO accession process of several countries, as well as in connection with the annual Special 301 Report review of the IP systems of U.S. trading partners.
Provide Technical Expertise in Negotiation and Implementation of Bilateral and Multilateral Agreements Throughout FY 2015, the USPTO continued to provide expert technical advice on IP protection in connection with ongoing negotiation of multilateral agreements. For example, the USPTO supported the Office of the USTR in negotiations regarding the IP portions of the Trans-Pacific Partnership and the Trans-Atlantic Trade and Investment Partnership free trade agreements.
Increase the Effectiveness of Intellectual Property Attachés in Prioritized Countries and Regions In FY 2015, the USPTO placed its first IP attaché in Brussels, Belgium, and established new IP attaché positions in Lima, Peru, and Kyiv, Ukraine. The IP attaché in Brussels will work on IP matters that arise within the European Union and will coordinate with the European Commission in work in WIPO, the WTO, and third countries. The IP attaché in Lima will work on IP matters in Peru and the Andean Region. The IP attaché in Kyiv will work on IP matters in Ukraine, the Commonwealth of Independent States, and Eastern Europe. The addition of these positions expanded the USPTO’s overseas presence from 8 countries to 11, with the total number of IP attaché positions in the program growing from 11 to 14.
The USPTO posts IP attachés in U.S. embassies and consulates around the world. The attachés advocate to improve IP policies, laws, and regulations abroad for the benefit of U.S. stakeholders.

PERFORMANCE AND ACCOUNTABILITY REPORT
98
The USPTO continued its successful implementation of country-specific action plans in prioritized countries, as shown in Table 16. In addition, the USPTO expanded efforts to educate the public on the services that are provided by the IP attachés. The USPTO also made progress in building a pipeline of prospective applicants for IP attaché positions.
TABLE 16Measure: Percentage of prioritized countries for which country teams
have made progress on at least 75% of action steps in the country-specific action plans*
Fiscal Year Target Actual2011 75.0% 100.0%
2012 75.0% 75.0%
2013 75.0% 100.0%
2014 75.0% 100.0%
2015 75.0% 100.0%
2016 75.0%
2017 75.0%
Target Met.
*Progress of action steps in the country-specific action plans were made along the following dimensions: (1) institutional improvements of IP office administration for advancing IP rights, (2) institutional improvements of IP enforcement entities, (3) improvements in IP laws and regulations, and (4) establishment of government-to-government cooperative mechanisms.
Educational ProgramsIn FY 2015, GIPA conducted 106 training programs for foreign government officials. GIPA also conducted 35 programs targeted to U.S. SMEs. The Academy also trained seven groups of college students and faculty in IP-related programs of study from the U.S. and abroad. Figure 6 shows by quarter the number of GIPA educational programs during FY 2015.
IP capacity-building programs are offered by GIPA to patent, trademark, and copyright officials; judges; prosecutors; police; customs officials; foreign policy makers; examiners; and IP rights owners, as well as college students and faculty in IP-related programs of study. Figure 7 shows the number of individuals GIPA trained, by quarter, in FY 2015. During this time, GIPA provided training to a total of 8,304 individuals, including 5,283 foreign government officials, 320 members of academic groups, and 2,701 individuals associated with U.S. SMEs.
Participants from 106 countries participated in GIPA training during FY 2015. Figure 8 shows the number of countries by quarter. To view a complete list of all countries represented at GIPA training in FY 2015, visit the USPTO Data Visualization Center.

www.uspto.gov
99
Figure 6. EDUCATIONAL PROGRAMS CONDUCTED
Figure 7. NUMBER OF ATTENDEES TRAINED
Figure 8. CUMULATIVE NUMBER OF COUNTRIES TRAINED FOR THE FISCAL YEAR

PERFORMANCE AND ACCOUNTABILITY REPORT
100
MANAGEMENTGOAL
WHAT IS MANAGEMENT’S FOCUS ON MAXIMIZING THE USPTO’S MISSION PERFORMANCE?
The USPTO’s overarching management goal focuses on shared responsibility that is a prerequisite for achieving success as the USPTO grows and modernizes. This goal advances the USPTO’s performance on its three core mission strategic
goals through effective alignment and management of human capital, information resources, infrastructure and security management,
and sustainable financial capital.

www.uspto.gov
101
Management Goal:Achieve Organizational Excellence
OBJECTIVE 1: LEVERAGE INFORMATION TECHNOLOGY INVESTMENTS TO ACHIEVE BUSINESS RESULTS This first objective focuses on USPTO’s IT activities that are required to support and move the USPTO toward the next generation of tools and services for all mission-specific systems that are identified under the strategic goals. The USPTO will continue to provide cost-effective and transparent operations, processes, and information as it moves to accomplish its goals as stated in the USPTO’s 2014–2018 Strategic Plan. These efforts include:
• Enhancing the internal and external user experience through a new and enhanced website that provides a customer transactional portal and the ability to operate in a mobile environment;
• Leveraging IT to improve internal and external collaboration and information-sharing by developing the ability to conduct fully electronic dissemination interactions and by increasing Web-conferencing capabilities;
• Continuing to provide transparent operations, processes, and information, striving toward “24/7/365” operational capability to meet the business needs of customers and employees so that they can communicate, collaborate, and share information seamlessly and securely across the world;
• Evolving and improving the USPTO’s IT infrastructure and services to be more modern, efficient, secure, and available through the use of virtual and cloud capabilities; and
• Delivering cost-effective and seamless next-generation IT solutions apart from legacy systems, including integrations of PE2E, TMNG, and Fee-Processing Next Generation systems to meet the business needs of USPTO customers.
The USPTO has made progress toward improved operations and services in FY 2015, as well as for its next-generation systems. For PE2E, the USPTO deployed version 2.0 of the DAV, replacing the legacy tool eDAN. DAV is a customizable, searchable tool to help examiners manage their work load and prioritize tasks. For the TMNG system, the USPTO deployed enhancements to existing tools such as the Trademark Status and Document Retrieval, the internal image search system known as X-search, and expanded functionality for other tools such as the ID Manual and the Trademark Electronic Official Gazette.
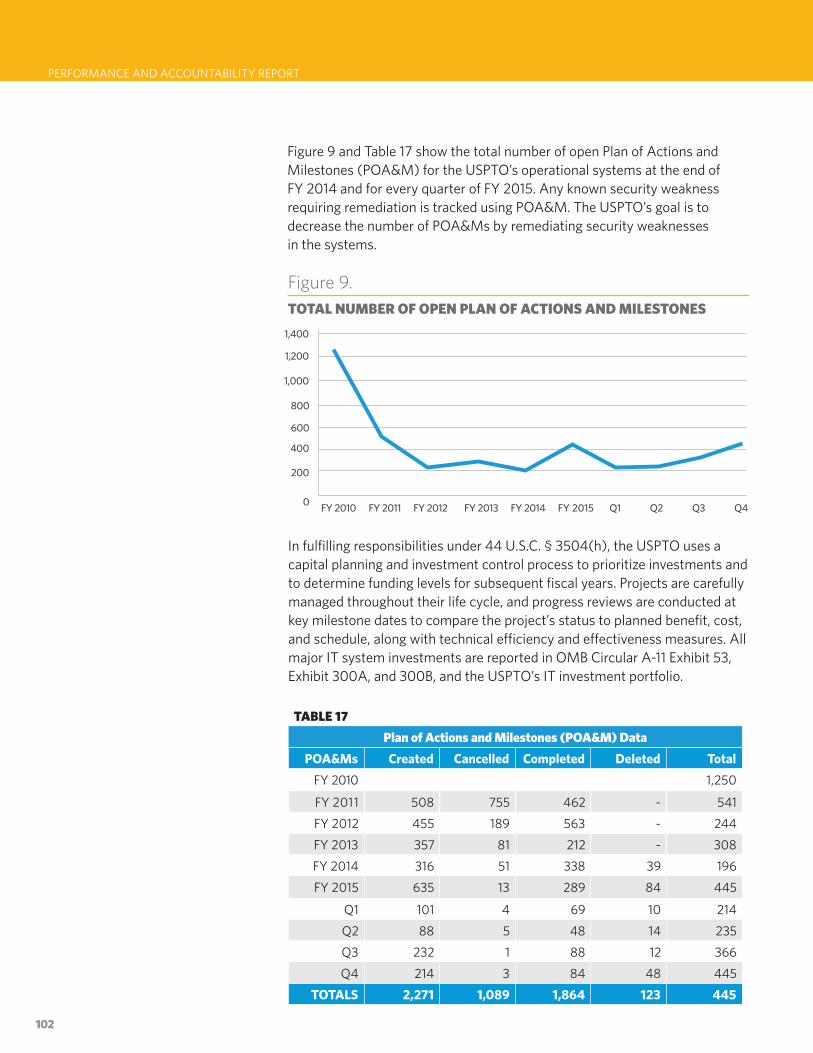
PERFORMANCE AND ACCOUNTABILITY REPORT
102
Figure 9 and Table 17 show the total number of open Plan of Actions and Milestones (POA&M) for the USPTO’s operational systems at the end of FY 2014 and for every quarter of FY 2015. Any known security weakness requiring remediation is tracked using POA&M. The USPTO’s goal is to decrease the number of POA&Ms by remediating security weaknesses in the systems.
Figure 9.TOTAL NUMBER OF OPEN PLAN OF ACTIONS AND MILESTONES
0
600
800
1,000
1,200
1,400
400
200
FY 2010 FY 2011 FY 2012 FY 2013 FY 2014 FY 2015 Q1 Q2 Q3 Q4
In fulfilling responsibilities under 44 U.S.C. § 3504(h), the USPTO uses a capital planning and investment control process to prioritize investments and to determine funding levels for subsequent fiscal years. Projects are carefully managed throughout their life cycle, and progress reviews are conducted at key milestone dates to compare the project’s status to planned benefit, cost, and schedule, along with technical efficiency and effectiveness measures. All major IT system investments are reported in OMB Circular A-11 Exhibit 53, Exhibit 300A, and 300B, and the USPTO’s IT investment portfolio.
TABLE 17Plan of Actions and Milestones (POA&M) Data
POA&Ms Created Cancelled Completed Deleted TotalFY 2010 1,250
FY 2011 508 755 462 - 541FY 2012 455 189 563 - 244FY 2013 357 81 212 - 308FY 2014 316 51 338 39 196FY 2015 635 13 289 84 445
Q1 101 4 69 10 214Q2 88 5 48 14 235Q3 232 1 88 12 366Q4 214 3 84 48 445
TOTALS 2,271 1,089 1,864 123 445

www.uspto.gov
103
OBJECTIVE 2: CONTINUE TO BUILD AND MAINTAIN A FLEXIBLE, DIVERSE, AND ENGAGED WORKFORCE
Continue to Enhance the USPTO Telework Environment by Expanding Telework Opportunities and Developing Skill Sets Specific to Managing in a Telework Environment Telework at the USPTO is a corporate business strategy, which supports mission achievement and goal fulfillment via a distributed workforce. At the end of FY 2015, 10,114 employees agency-wide were working from home at least one day per week, translating to 80 percent of the USPTO workforce. This is an increase of nearly 682 teleworking employees from last fiscal year. Including situational teleworkers, the USPTO had a total of 10,410 teleworkers at the end of FY 2015. Figure 10 represents the USPTO telework growth since FY 2007.
Figure 10.TELEWORK GROWTH
FY 2007
Since its start 18 years ago with 18 Trademark examining attorneys, telework has grown dramatically at the USPTO. The graph shows the growth of the total population, positions eligible to telework, and eligible positions teleworking agency-wide.
Total population
Positions eligible to telework
Eligible positions teleworking
% of total population teleworking
FY 2015FY 2008 FY 2009 FY 2010 FY 2011 FY 2012 FY 2013 FY 2014
41%
82%
77%
73%
63%
65%
60%54%
46%
8,888
4,418
3,604
9,258
5,163
4,268
9,641
6,311
5,176
9,778
7,136
5,915
10,198
8,058
6,668
11,597
8,520
7,363
11,779
10,694
8,554
12,568
11,441
9,650
12,623
11,734
10,410
In addition, between FY 2014 and FY 2015, the percentage of positions eligible to telework increased from 91 percent to 93 percent (+293 eligible positions agency-wide). See Figure 11 for the state-by-state breakout of full-time teleworker participants in FY 2015. Figure 12 shows the percentage of eligible employees’ teleworking by organization in FY 2015.
As part of the Telework Enhancement Act of 2010, the USPTO was granted legislative authority to conduct the federal government’s initial Telework Travel Expenses Test Program. The USPTO Telework Enhancement Act Pilot Program (TEAPP) allows employees to waive their right to travel expenses for up to six annual mandatory trips back to the USPTO headquarters in
A situational teleworker is an employee who is not on a regular telework schedule. Situational teleworkers only telework when certain situations warrant off-site work (e.g., weather closures, campus power outages, etc.).

PERFORMANCE AND ACCOUNTABILITY REPORT
104
Figure 11.FULL-TIME TELEWORKERS BY STATE, FY 2015
Alexandria, VA. Hoteling (or full-time teleworking) employees may now elect, voluntarily and for their own convenience, to live greater than 50 miles from the USPTO campus by becoming a TEAPP participant, thereby changing their official duty station. As of the end of FY 2015, 2,043 employees were participating in the TEAPP, which is an increase of 30 percent over the FY 2014 numbers.
Figure 12.PERCENT OF EMPLOYEES TELEWORKING BY BUSINESS UNIT
100
80
60
40
20
0TM PAT
OGCTTAB
PTABOPIA
OCCO EEODCAO CIO CFO
business unit
perc
enta
ge o
f elig
ible
em
ploy
ees
tele
wor
king
86.0% 82.8% 82.8%87.0%
79.0%84.7%
75.0%68.7% 71.1% 75.2%
92.2%

www.uspto.gov
105
A structured telework program provides cost savings by reducing the need for additional office space, enhancing recruitment and retention, fostering greater efficiency in production and management, and providing opportunities for expanded work flexibility and better work–life balance for participating employees. For example, during federal inclement weather closures in the Washington, DC, metropolitan area, telework and hoteling employees remain productive. During the 2015 winter season, on average, patent examiners maintained a nearly 92-percent production rate, and trademark examining attorneys maintained a 106-percent production rate compared with a non-inclement weather day. Figure 14 highlights production rate statistics during inclement weather days in FY 2015.
USPTO’s teleworkers have a dramatic impact on the environment in the Washington, DC, metropolitan area, and in FY 2015, spared the environment more than 44,000 tons of CO2 emissions. Figure 13 highlights the environmental impact of telework in FY 2015.
In October 2014, the USPTO hired the National Academy of Public Administration (NAPA) to conduct an independent evaluation of its internal controls used to manage time and attendance reporting, as well as the efficiency and effectiveness of its telework programs. The purpose of the review was three-fold:
• To determine whether the USPTO telework programs comply with applicable laws and regulations;
• To determine whether the USPTO telework programs have adequate management controls; and
• To determine whether the USPTO telework programs are operating effectively and efficiently to achieve programmatic goals.
Figure 13.ENVIRONMENTAL IMPACT OF TELEWORK

PERFORMANCE AND ACCOUNTABILITY REPORT
106
Key Findings and Recommendations of the NAPA ReportThe NAPA Panel determined that the telework program has provided important benefits to the USPTO, including saving money, enhancing employee quality of life, potentially increasing recruitment and retention, and ensuring ongoing work during emergencies. The panel found that the USPTO has the controls in place to manage time and attendance for both on-site workers and teleworkers. The panel recommended that the USPTO continue its telework and hoteling programs, while enhancing oversight mechanisms and strengthening its management practices. The USPTO is carefully studying the findings and recommendations of the NAPA Report and has already taken a variety of efforts to implement some of these recommendations.
To ensure the continued high performance and integrity of USPTO’s telework program, in FY 2015, the USPTO undertook a number of concrete steps to bolster the management of the program, including revising and making more accessible guidance documents concerning proper recordation of teleworkers’ time and attendance, conducting numerous trainings on proper telework procedures, hosting a series of telework tune-ups for managers and employees, and reviewing individual Business Unit telework guidelines to ensure consistency. The USPTO intends to continue to implement these and other program management improvements and controls in 2016.
Implement Programs Aimed at Enhancing Employee Engagement and Ensuring the Nationwide Workforce Stays Integrated with the Corporate CultureThe USPTO recognizes that highly engaged employees make it possible to serve the public more efficiently and effectively and is extremely proud of its
Figure 14.2015 SNOW DAYS - THE IMPACT OF TELEWORK

www.uspto.gov
107
employees’ contributions. As such, the USPTO emphasizes employee engagement as a key component to achieving its mission.
The 2015–2018 USPTO People Plan, released in August 2015, outlines the USPTO’s intent to focus on its employees and leverage new and existing programs to ensure that it maintains a high-performing organization. By leveraging the three pillars—lead, engage, and enable—to address future challenges and guide the strategy, the People Plan serves as a roadmap to generate motivation and commitment. It also seeks to empower employees, increase commitment and discretionary effort, and create a supportive work environment to achieve exceptional business results through its greatest asset—its people.
In an effort to maintain a high level of employee engagement, the USPTO administered its first ever agency-wide Employee Engagement Survey (EES) in November and December of 2014. The EES consisted of 61 rated items across 14 different dimensions and allowed for a full census survey, with questions that were specific to the USPTO culture and environment, and for benchmarking against private sector organizations (particularly in the technology sector). Finally, it provided the opportunity for feedback and action-planning at the first line supervisor (team) level. Managers received both a personalized link to access their individual manager-level results and training modules for understanding and interpreting the results, preparing for feedback meetings, and translating the results into action. Overall, the results were very favorable, with a high response rate of 62 percent (7,585 out of 12,332 employees invited to participate) and an overall 82 percent employee engagement score.
Beginning in January 2015, the EES data were analyzed across multiple levels of the USPTO organization—from the Business Unit down to individual teams—who used the analyses to create tailored action plans. Agency-wide plans are underway to conduct the EES for a second time between October and November of 2015.
Another employee engagement effort, the official ideation program (The Suggestion Zone) of the USPTO, welcomes all employees and encourages the submission of suggestions that can be applied at any organizational level. The intent of the Suggestion Zone is to leverage these suggestions to actively foster employee engagement and tap into the expertise and innovation of the USPTO workforce. Within one year of implementing the Suggestion Zone, it has yielded more than 500 suggestions, which experienced the full ideation lifecycle to include evaluation by senior management to determine feasibility for implementation.
Promote Learning and Job Opportunities for All Levels of EmployeesIn August 2015, the USPTO procured a vendor to assist with the design, and build the framework for, an unrivaled Leadership Academy for senior executive service (SES) employees. The new Leadership Academy will transform the Agency’s existing Leadership Development and Executive

PERFORMANCE AND ACCOUNTABILITY REPORT
108
Education Programs. The goal of the Leadership Academy is to provide SES with an initial comprehensive, cohort-based leadership learning experience with assessments, coaching, knowledge, and skills-building training and developmental activities, as well as immersive, off-site follow-up events.
The USPTO launched a pilot Enterprise-Wide Mentoring program. The goal of the program is to enable employees at all levels of the organization to partner with others to achieve their professional goals, build stronger networks, and enhance their skills and knowledge. Of the available 250 mentoring pairs (250 mentee and 250 mentor slots), 185 mentoring pairs participated in the pilot, which received a 92 percent program effectiveness level evaluation rating from its participants.
The USPTO Career Enhancement Opportunity (CEO) Program is designed to provide opportunities for employees to enhance their career potential through a variety of educational and developmental activities, including three major components: (1) After Work Education Program; (2) USPTO Learning Center courses, such as resume writing and interviewing skills; and (3) Upward Mobility Program opportunities. A fourth component of the CEO, Career Coaching, is projected to be implemented in FY 2016.
Enhance Recruitment and Hiring Efforts to Help Sustain and Develop a Highly Qualified and Diverse Workforce, Including the Senior Team The Office of Human Resources Marketing Team continues to develop and refine its digital recruitment strategy throughout FY 2015. At the forefront of these efforts remains social media and targeted outreach to build awareness and engagement among key demographics including (but not limited to) students, Veterans, African-Americans, and women, as well as disciplines and roles. The Marketing Team also successfully amplified targeted messaging to potential candidates in key geographic locations to support the USPTO’s nationwide expansion and the grand opening of its San Jose, CA, and Dallas, TX, regional offices. For a look at the hiring distribution among USPTO business units for FY 2015, please see Figure 15.
On the heels of an extremely successful unpaid marketing pilot in 2014 through LinkedIn, the USPTO launched its first-ever paid program through the world’s largest digital recruitment platform in January 2015. The paid campaign through LinkedIn included:
• Five career pages targeted by role and/or demographic,• RecruiterSeat—one license for robust candidate-sourcing feature,• Job slots, and • Banner ads.
Six months in, the USPTO’s recruitment efforts on LinkedIn outperformed industry averages.
In April 2015, the USPTO launched a strategic pilot partnership with the United Negro College Fund–Innovation, Commercialization, and Entrepreneurship (UNCF-ICE), to further drive innovation and entrepreneurship among minority
Figure 15.TOTAL HIRED BY BUSINESS UNITS (BUs)
0
100
200
300
400
500
600
700
800
Trademark and Corporate BUs
Patent BUs
*Total hired included patent examiners.
347
587*

www.uspto.gov
109
populations, in particular as it relates to tech-transfer capacities. The partnership also reaffirmed the agency’s institutional commitment to leverage diversity and inclusion to drive innovation, not just within the workforce but also across the global marketplace.
Stakeholders across the organization have collaborated on UNCF-hosted events to lend messaging, accessibility to USPTO leadership, and pathways for employment opportunities. Agency representatives participated in the 2015 White House National Historically Black Colleges and Universities Week Conference in September 2015, and will participate in the upcoming UNCF-ICE Innovation Summit in Silicon Valley, CA, in November 2015.
The USPTO is forging new grounds in connecting young women and established professionals with their inner inventor and nurturing their entrepreneurial spirit. Over the next several fiscal years, the Marketing Team will launch new and improved recruitment strategies to engage, attract and retain women in science, technology, engineering, and mathematics (STEM).
Veterans hired from the 2014 event anchored the 2015 advertisement campaign for the 2nd Annual OCIO’s Veterans Hiring Fair. Designed to capture a qualified, relevant, and engaged audience, online paid advertising allowed the marketing team to get granular and target by domain (i.e., .mil and .gov). Increased social media engagement through the Department of Commerce blog, Facebook, Twitter and LinkedIn, as well as featured on regional TV, radio, print, and military bases, succeeded in reaching the right audience. The OCIO Veteran Hiring Fair registration site saw a 34 percent increase in the number of visits since 2014.
The two-day hiring event provided attendees with a personalized experience—that the USPTO can recruit and retain veterans. Attendees heard directly from OCIO senior leadership about their important role in supporting the organization’s mission, met current veteran IT employees who shared their experiences, and networked and learned more about the USPTO culture. Attendees also learned more about the OCIO organization and available positions and participated in on-site interviews for direct hire. The Marketing Team live-tweeted and posted live updates on LinkedIn by using the hashtag #USPTOHiresHeroes, to extend engagement and continue to build awareness among potential walk-ins.
This year’s career fair outperformed across all year-over-year metrics. There were 192 pre-registrations (+11 percent), 187 interviews conducted (+21 percent), 97 preliminary selections, 16 selections approved to make an offer, and 10 selectees hired and on-boarded, which contributed to exceeding the agency-wide veteran-hiring target.
Overall, the USPTO’s effective recruiting strategies produced substantial gains in critical hires and veteran hires. Today, veterans represent 18 percent of the USPTO workforce, and the number of veterans hired each year continues to increase. Since FY 2012, the USPTO has substantially increased the percentage

PERFORMANCE AND ACCOUNTABILITY REPORT
110
of veterans and transitioning service members hired each fiscal year. Contributing factors include an increase in the number of veteran-targeted career fairs attended, agency participation on panels hosted by veteran organizations, and the expansion of the Veteran Internship Program to include veterans attending colleges and universities from across the nation. End-of-year hiring results indicate that the agency exceeded the veteran hiring goal of 10 percent for patent examiners (actual: 15 percent) and exceeded the veteran hiring goal of 20 percent (actual: 26 percent) for non-patent examiner hires. For summaries of veteran hiring distribution in FY 2015, please see Figures 16 and 17.
In other hiring initiatives, the USPTO set an aggressive hiring target of 48 administrative patent judges for this fiscal year, bringing in a total of 33 judges, with 13 additional selections made but not yet reported on board by September 30, 2015. Please see Figure 18 for a detailed look at the USPTO’s FY 2015 critical hiring activities.
Continue to Foster and Enhance Strong Labor Management RelationshipsThe establishment of the formal USPTO-wide Labor Management Forum (LMF) represents management’s and the unions’ continued commitment to enhance strong labor-management–working relationships and promote measurable improvements at the USPTO. As the USPTO workforce increasingly disperses from the Alexandria, VA, headquarters through telework and the opening of regional offices, the need for work-schedule notification, communication, and collaboration tools correspondingly grows. To promote a consistent, agency-wide approach to effectively managing a remote workforce, the LMF implemented the Policy on Work Schedule Notification, Communication, and Collaboration in February 2015. In concert with the development of this new policy, the agency conducted enterprise-wide training, designed a biweekly intended time-entry tool, and disseminated work schedule notification FAQs. Development of metrics to measure and evaluate the success of the LMF to date will commence in FY 2016.
Figure 16.PERCENTAGE OF HIRES BY VETERAN STATUS
0
50
100
150
200
250
300
350
Patent Examiner Non-Patent Examiner
Total hired
Total veterans hired
338351
15%92
49
26%
Figure 17.VETERANS AS PERCENTAGE OF HIRES, BY BUSINESS UNIT
* Includes patent examiners
CAO CCO CFO CIO EEO OGC OPIA PAT PTAB TM TTAB U/S& DIR
0
10
20
30
40
50
31.7%
0.0% 0.0% 0.0%
43.8%
34.1%
23.1%
9.1%
36.4%*
21.4%
2.0%
33.3%

www.uspto.gov
111
Figure 18.USPTO CRITICAL HIRES
ACTUAL HIRES TO GOALS
0
50
100
150
200
250
300
350
400
Patent Examiners
Trademark ExaminingAttorneys
Hiring goal
Total hired to date
Patent Judges
All InformationTechnology
All Others
340 340
4832
116 123
40 43 3565
Continue to Build Collaborative Relationships with USPTO’s Affinity GroupsThe USPTO is proud to have an incredibly diverse workforce with so many employees of various backgrounds and cultures. The USPTO has a network of 14 affinity groups, which are voluntary employee organizations that are based on a shared common background and/or special interest. Each group is led by a team of volunteers to host cultural, social, and career-development programs and events for their members and the wider USPTO community.
OEEOD continues to work with the USPTO’s affinity groups to host programs that promote cultural understanding. For example, OEEOD partnered with various affinity groups to host events to celebrate special emphasis months, such as Black History Month and Women’s History Month. OEEOD also works to support the events of affinity groups that are unique to the USPTO, for example, the Asian Pacific American Network’s annual Lunar New Year Celebration and the USPTO Military Association’s annual “Walk of Thankful Recognition” to commemorate Memorial Day.
OBJECTIVE 3: ENHANCE INTERNAL AND EXTERNAL RELATIONS Increase the Number of Individuals and Educators Reached by Intellectual Property–Related Programming In FY2015, the USPTO received exciting news about the agency’s efforts to promote and expand IP education and pro bono services. On December 16, 2014, the President signed Public Law No. 113–227 removing the “pilot” designation from USPTO’s Law School Clinic Certification Program and making the highly successful nationwide program permanent through 2024. The program enables law school students enrolled in a participating law school’s clinic to acquire firsthand patent and trademark application

PERFORMANCE AND ACCOUNTABILITY REPORT
112
preparation and prosecution experience (under the guidance of an approved faculty clinic supervisor and guidelines established by the Office of Enrollment and Discipline) while providing free legal services to individuals and small businesses throughout the country.
In FY 2015, the program continued its rousing upward trend of expanding IP education and pro bono services. The program’s participating law schools filed 93 patent applications and 521 trademark applications. The FY 2015 filings reflect the program’s continued significant annual growth, and it is expected that the total year end filings will reach historic highs surpassing the filings in prior years (113 patent applications and 407 trademark applications in FY 2014 and 108 patent applications and 209 trademark applications in FY 2013). This enthusiastic voluntary participation evinces the Program’s success to date.
Support Government-Wide Efforts to Promote Science, Technology, Engineering, and Mathematics Education InitiativesThe Office of Education and Outreach (OEO) provides educational and outreach programming for students, educators, and young inventors and innovators of all ages. The OEO is managed through the Office of the Under Secretary and Director of the USPTO and supports the mission of the agency by providing relevant IP, innovation, and invention resources to school administrators, teachers, students, and parents. OEO goals and objectives are also aligned to support government-wide efforts to attract and retain students (K–12) in STEM-based education to increase STEM competence and to support an internal and external stakeholder base for the USPTO.
STEM is vital to invention, innovation, and the development of a future USPTO workforce. Integration of STEM knowledge, especially as it relates to IP, is also vital to the development of a future stakeholder base for the USPTO; that is, inventors, innovators, and creators who will file better and higher quality patent and trademark applications based on their attained knowledge of IP.
OEO goals are achieved by building and expanding strategic partnerships, collaborations, and linkages with other federal agencies, non-profit organizations, and, where possible, private sector organizations in order to reach the most diverse group of students and educators. FY 2015 saw the USPTO, along with the Department of Commerce and Columbia University, sponsor the Future of Urban Innovation Summit in New York regarding the present and future state of innovation and how government, academics, and industry work together to spur economic growth.
In July, the USPTO conducted its Second Annual National Summer Teacher Institute on Innovation, STEM, and Intellectual Property. Fifty-two teachers representing 30 states participated in the five-day conference offered in collaboration with the University of Texas at Dallas (UTD). This program was designed to help middle and high school teachers incorporate concepts of making, inventing, and IP creation and protection into classroom instruction.

www.uspto.gov
113
U.S. Congresswoman Johnson kicked off the opening session. During the week, educators were immersed in project-based learning by working with USPTO subject matter experts, utilizing the UTD’s Maker/Design Studio to craft their own invention projects, studying models of successful innovation curriculum, and participating in discussions with the White House Office of Science and Technology Policy.
In September, Under Secretary and Director Michelle K. Lee launched an “ALLinSTEM” initiative to encourage women at all stages—from girls to entrepreneurs—to pursue STEM degrees and work in STEM careers for the benefit of our economy and society. She has promoted this platform in many public forums, including the delivery of remarks at the “Million Women Mentors” Summit and Gala promoting mentorship of girls and women in STEM. She emphasized that the Million Women Mentors movement is and should continue to be one of collaboration, perseverance, and empowerment for mentoring girls and women interested in pursuing academic and professional careers in STEM. FY 2015 USPTO programming echoed the Director’s message of inclusion and access to opportunity by broadening participation and outreach to a myriad of youth and educator programming, with partners such as Y of the USA, FIRST Robotics, and MakerEd.
OBJECTIVE 4: SECURE SUSTAINABLE FUNDING TO DELIVER VALUE TO FEE-PAYING CUSTOMERS AND THE PUBLIC The USPTO continues its work to establish a funding model that provides for a reliable and sustainable source of funding. The USPTO’s operating structure is like a business in that it receives requests for services—applications for patents and trademark registrations—and charges fees projected to cover the cost of performing the services the USPTO provides. Enactment of the AIA represented a significant leap forward in achieving a sustainable funding model. This objective continues the effort to supplement or refine those authorities.
The USPTO made significant progress toward implementing a sustainable funding model for operations under the USPTO 2010–2015 Strategic Plan, particularly through the enactment and implementation of the AIA. This effort is moving forward under the 2014–2018 Strategic Plan by continuing to supplement or refine the authorities through initiatives to ensure spending authorization to use all fees collected, make fee-setting authority permanent, continuously optimize the fee structure, seek out new financial tools, and maximize cost efficiency and transparency.
A primary consideration for the USPTO and its fee-paying users is to ensure access to, and authority to use, all fee collections. The AIA established the Patent and Trademark Fee Reserve Fund in which collections in excess of appropriated spending levels would be deposited for later use. This provides

PERFORMANCE AND ACCOUNTABILITY REPORT
114
greater transparency; however, it does not guarantee that the USPTO will gain access to those fee collections. FY 2014 marks the first year that the USPTO deposited funds into the Patent and Trademark Fee Reserve Fund. Early in FY 2015, the USPTO worked with Congress to successfully transfer those funds to the agency’s salaries and expenses operating account, making them available for spending.
Although the AIA gave the USPTO authority to set fees by regulation, it also includes a seven-year sunset provision for fee-setting. The USPTO is committed to taking the steps necessary to ensure that fee-setting is made permanent. Among those steps is demonstrating the agency’s ability to make constructive, well-thought-out changes to the fee structure under its current authority. This was achieved on January 18, 2013, when the agency issued a final rule to set and adjust patent fees with effective dates in March 2013 and January 2014. During implementation, the agency consulted with its PPAC, stakeholders, and the public. In addition, on December 16, 2014, the USPTO issued a final rule to reduce certain trademark fees. The efficiencies achieved by trademark electronic filing and communications have put the USPTO in a position to provide for a reduction for electronically filed trademark application and renewal fees in a way that further promotes efficiency both for users and the USPTO. The adjustments are designed to encourage greater efficiency by increasing end-to-end electronic communications.
The USPTO is committed to continuously optimizing the fee structure, and in support of this initiative, in FY 2015 the agency conducted its first comprehensive biennial fee review since the implementation of the major patent-fee schedule changes. The comprehensive fee review has been conducted in accordance with the USPTO fee structure philosophy, which is to provide sufficient financial resources to facilitate the effective administration of the U.S. IP system. The following objectives support this fee structure philosophy:
• Promote the Administration Innovation Strategy, • Align fees with the full cost of products and services, • Set fees to facilitate the effective administration of the patent and
trademark systems, and • Offer application-processing options.
The USPTO completed a comprehensive biennial fee review in FY 2015 and will share fee adjustment proposals and engage with its Public Advisory Committees and the public in early FY 2016 toward the development of a fee schedule that benefits all—stakeholders, the agency, and the country.
The USPTO will also continue to pursue tested private sector business tools, such as maintaining an operating reserve policy, continuing to fund an operating reserve, and determining whether any other tools are viable for USPTO to secure a sustainable funding model. For example, investment authority may be a viable tool once the USPTO reaches an optimal operating reserve.

www.uspto.gov
115
Finally, maximizing cost-efficiency and transparency is of utmost importance and is the USPTO’s responsibility as good financial stewards. Given the trust Congress and the agency’s stakeholders place in the USPTO with fee-setting authority and having an operating reserve, the agency needs to demonstrate that it is taking all steps possible to have a cost-efficient organization. In addition, the USPTO takes into consideration the public policy issue of curtailing government spending and ensuring stewardship of financial resources on behalf of its fee-paying constituents. In recognition of these responsibilities and of the dynamic financial environment that the USPTO operates within, the agency acted on the need for regular in-depth strategic and operational financial discussions and established a formal Financial Advisory Board to review and analyze data and proposals impacting both fee collections and spending. The Board makes recommendations to executives on financial risk management, priorities for spending, revenue estimates and collections, fee-adjustment proposals, and the size of operating reserves to mitigate financial and operational risk. The USPTO continues to strive to focus its spending on behalf of its fee-paying customers by striking the appropriate balance among improvements in quality, pendency, and IT improvements as it continues to improve operations and the customer experience with the agency.
The USPTO continues to address the need for viable operating reserve levels for both patents and trademarks. The USPTO has modified its operating reserve policy to focus on the need to mitigate operational risk caused by a reduced level of financial resources; therefore, the USPTO plans to manage its two operating reserves within a range of acceptable balances, with a minimal balance target set for two years and a longer term optimal balance it strives for in the future.
OBJECTIVE 5: ESTABLISH REGIONAL OFFICES (FORMERLY SATELLITE OFFICES) AND A REGIONAL PRESENCE Given the ever-increasing diversity of 21st-century IP creators and users across the nation, the USPTO recognizes the need to serve its stakeholders from different regions of the country through physical presence. Among other things, the opportunities to expand the avenues through which innovators can have face-to-face interactions with the USPTO, build outreach partnerships that ramp up the academic disciplines of STEM and innovation in all regions, and recruit examiners from all areas to process quality patents all combine to make the creation of regional offices a clear fulfillment of the USPTO’s constitutional mandate to promote the progress of science and useful arts.
Building off of the AIA—in which Congress directed the USPTO to establish regional (formerly referred to as satellite) offices—and with significant stakeholder input regarding choice of location, the USPTO has moved to establish regional offices in four cities: Detroit, MI; Denver, CO; San Jose, CA (Silicon Valley); and Dallas, TX. These offices provide a permanent USPTO presence beyond the Washington, DC, region for the first time and represent a historic shift in the way the world’s strongest IP organization does business.

PERFORMANCE AND ACCOUNTABILITY REPORT
116
Locations and Facilities The Elijah J. McCoy Midwest Regional Office in Detroit, MI, and the Rocky Mountain Regional Office in Denver, CO, have been up and fully functional since FY 2014. The Silicon Valley and Texas Regional Offices (located in San Jose, CA, and Dallas, TX, respectively) were fully opened in early FY 2016.
Each location was chosen for the many benefits it offers to the USPTO and its employees, such as a lower cost of living, access to highly trained technical talent, and engagement opportunities with local IP stakeholder communities, particularly some with considerable IP experience and many patent grants. Spread out across the country, the four regional offices together give the USPTO an active presence in every continental time zone of the United States, from the East Coast to the West Coast.
Despite the Silicon Valley and Texas Regional Offices not yet being fully opened in FY 2015, they were active in their role of regional outreach. As discussed in Goal I, the Silicon Valley Regional Office was able to engage in several outreach activities, such as the San Francisco Economic Development Council, Maker Faire Bay Area, Licensing Executives Society, and others. They also actively engaged startups and incubators, providing technology-focused workshops and presentations. The Texas Regional Office participated in the Startup Weekend Women’s Edition, the Second Annual National Summer Teacher Institute on Innovation, STEM and Intellectual Property at the University of Texas at Dallas, and the Dallas Entrepreneur Conference, which was held at the Southern Methodist University Dedman School of Law in Dallas, TX.
Regional Outreach The USPTO has made considerable progress in integrating into the IP communities in each of the regions and building goodwill, despite delayed permanent office openings. The Elijah J. McCoy Midwest Regional Office held a patent innovation roundtable with Senator Gary Peters, Congressman John Conyers, and Congresswoman Debbie Dingell, where the impact of IP issues on the region were discussed, including stakeholder collaboration and the promotion of economic growth. In April, the Elijah J. McCoy Midwest Regional Office participated in the Detroit Techweek LAUNCH Competition and the entrepreneurship summit.
The Rocky Mountain Regional Office worked with important regional industries, such as clean tech, biotech, and organizations and events such as the Denver Mini-Maker Faire, Rocky Mountain IP Institute, and South by Southwest® (SXSW V2V). They also helped spearhead the expansion of The USPTO’s Patent Pro Bono program to Colorado, in partnership with the Colorado Bar Association Intellectual Property Section and the Mi Casa Resource Center.

www.uspto.gov
117
Hiring The USPTO has successfully hired and trained 78 examiners in Detroit, MI, and in Denver, CO, in FY 2015. Examiners in the regional offices help to reduce the patent application backlog while maintaining and improving patent examination quality. The USPTO also has been able to hire administrative patent judges in each of the regional offices to manage the PTAB’s appeal and trial inventory.
Access Last, the regional offices provide easier access to USPTO services for inventors of all stripes. The regional offices enable applicants to conduct a search by using the world’s leading prior art databases in Detroit, MI; convene in a Collaboration Center in Denver, CO; conduct an interview via videoconference with an examiner based in Alexandria, VA, from Silicon Valley, CA; and hold a hearing for an AIA trial in Dallas, TX. Such services support inventors’ efforts to innovate faster, smarter, and more profitably.
The regional offices give tremendous possibilities to the USPTO and its stakeholders for building an even stronger IP system, and each of the four offices is well on its way to establishing a strong foothold in its respective region. The USPTO looks forward to continuing to take advantage of the possibilities provided through its regional offices to deliver high-quality patents efficiently and expeditiously.

PERFORMANCE AND ACCOUNTABILITY REPORT
118
FINANCIALSECTION
Members of the 2015 Performance and Accountability Report Team. From Left to Right: David Fitzpatrick, Dennis Detar, Shana Willard, John Hassett, Walter Schlueter

www.uspto.gov
119
Message
FROM THE CHIEF FINANCIAL OFFICER The USPTO is a dynamic organization that is constantly adapting and responding to the ever-changing environment in which we operate. The Office of the Chief Financial Officer strives to be similarly agile in its delivery of resource management policy, planning, and advice, financial accounting and reporting, financial management systems, and acquisition services to the Agency. Now more than ever, it is important that we proactively partner with other parts of the USPTO to embrace changes that will help the Agency thrive.
The USPTO 2014–2018 Strategic Plan recognizes the challenges associated with operating in an unpredictable fiscal environment, and includes an objective to secure sustainable funding for the organization. To this end, FY 2014 was the first year in which the Agency leveraged a new mechanism —the Patent and Trademark Fee Reserve Fund (PTFRF)—established by the Leahy-Smith America Invents Act (AIA) and aimed at securing the USPTO’s authority to retain and spend all user fees collected in excess of the Office’s annual appropriated level. At the end of FY 2014, the Office deposited $148 million into the PTFRF. After successfully working through the reprogramming process with congressional appropriators early in FY 2015, we were able to gain access to these funds, which were transferred into our operating reserve, where they remain available to support the Agency’s future needs.
The USPTO’s operating reserve is a critical component of our multi-year financial strategy. Time and again it has proven to be a valuable tool for more effectively managing our cash flow. In late FY 2014, we began seeing signs of lower than planned patent fee collections. This continued into and throughout FY 2015, resulting in a 5.2 percent decrease ($163.5 million) in fee collections in FY 2015 as compared to FY 2014. A combination of factors is likely contributing to this decline, including the global economy and international filings, recent judicial rulings, and internal process changes. In years past, such a downturn would have triggered an immediate series of budget reductions; in FY 2015 though, the operating reserve enabled us to continue moving forward with critical investments while taking a measured and long-term approach to managing this financial uncertainty.
Examples like this highlight the ongoing importance of a sustainable funding model to effectively support agency operations. We will continue to take the steps necessary to assure access to spending authority for all fee collections, to make permanent our fee-setting authority, which expires in 2018, and to leverage private-sector business tools—like our operating reserve—to help the USPTO operate in an efficient and cost-effective way.
Anthony P. Scardino

PERFORMANCE AND ACCOUNTABILITY REPORT
120
At the same time, we recognize that we can not let our desire to take advantage of strategic opportunities put the financial and operational health of the USPTO unnecessarily at risk. We continue to exercise prudence in monitoring the health of the organization, making informed assessments of risks and implications, and modifying and aligning spending priorities in a proactive and timely manner.
As the Agency continues making the longer-term paradigm shift away from crisis-driven resource management toward more proactive budget planning, we have identified a need to approach the Agency’s finances in a more holistic, strategic way. In FY 2015, the USPTO established an internal financial advisory board. Comprised of financial and operational subject matter experts from a cross-section of the Agency, this body has been charged with reviewing the USPTO’s multi-year business needs and its corresponding fee-setting, budget planning, and spending activities, and making risk-based recommendations to Agency leadership. It is our hope that this collaborative, comprehensive approach to stewardship will promote the financial integrity of the USPTO as we look to the future.
We are determined to continuously improve and to be on the leading edge of Federal financial management. We are in the process of enhancing the Agency’s risk management processes, which will allow management to better leverage existing programmatic and financial risk mitigation activities and make more informed decisions that enable the USPTO to pursue opportunities that support the goals established in the 2014–2018 Strategic Plan. We continue to review financial management and related processes to identify areas to advance our efficiency, our financial and performance data integration, and our internal controls to ensure unmatched reliability in financial activities.
With all of this in mind, I am pleased to report the following:
• This fiscal year marks our 23rd year of receiving an unmodified opinion on the Agency’s financial statements; the auditors reported no material weaknesses in the design and operation of the USPTO’s system of internal control over financial reporting; however, one significant deficiency arose during FY 2015, for which remediation efforts are already underway to address the underlying concerns;
• As part of the annual audit, it was determined that our financial system complies with federal financial systems requirements;
• The Association of Government Accountants (AGA) awarded the USPTO the Certificate of Excellence in Accountability Reporting for the 13th consecutive year for our Fiscal Year 2014 Performance and Accountability Report; and
• The USPTO won the Certificate of Excellence in Citizen-Centric Reporting for our 4th Citizen-Centric Report, awarded by AGA for 2014, again clearly demonstrating the USPTO’s excellence in integrating performance and accountability reporting.

www.uspto.gov
121
The USPTO’s highly talented workforce is more satisfied, more engaged, and more productive than ever. The USPTO was ranked the #2 out of 314 agency subcomponents in the 2014 Best Place to Work in the Federal Government®, with a score that increased over our 2013 score. Our talented employees continue to display great dedication and vigilance toward producing a high standard of financial management at the USPTO. We look to the future with confidence, as we continue to serve the Agency as a trusted business partner, working to provide the sound advice necessary to enable informed program and financial decision-making, and to support the strategic direction and mission of the USPTO.
Anthony P. ScardinoChief Financial OfficerNovember 12, 2015

PERFORMANCE AND ACCOUNTABILITY REPORT
122
UNITED STATES PATENT AND TRADEMARK OFFICE
Consolidated Balance Sheets
2015 2014
ASSETS Intragovernmental:
Fund Balance with Treasury (Note 2) $ 2,494,267 $ 2,504,977
Accounts Receivable (Note 3) 56 120
Other Assets—Advances and Prepayments (Note 6) 2,224 1,450
Total Intragovernmental 2,496,547 2,506,547
Cash (Note 4) 4,008 5,091
Accounts Receivable, Net (Note 3) 242 134
Property, Plant, and Equipment, Net (Note 5) 405,740 328,290
Other Assets—Advances and Prepayments (Note 6) 17,386 7,246
Total Assets $ 2,923,923 $ 2,847,308
LIABILITIES Intragovernmental:
Accounts Payable $ 7,026 $ 7,761
Accrued Payroll and Benefits 11,635 9,420
Accrued Workers' and Unemployment Compensation 1,930 2,015
Customer Deposit Accounts (Note 7) 7,687 5,948
Total Intragovernmental 28,278 25,144
Accounts Payable 109,185 105,048
Accrued Payroll and Benefits 104,391 95,052
Accrued Leave 101,640 97,890
Customer Deposit Accounts (Note 7) 140,239 127,673
Deferred Revenue (Note 9) 1,027,460 1,089,812
Actuarial FECA Liability (Note 10) 11,003 11,031
Contingent Liability (Note 12) 570 250
Total Liabilities (Note 8) $ 1,522,766 $ 1,551,900
NET POSITION Cumulative Results of Operations—Funds from Dedicated Collections (Note 14) $ 1,401,157 $ 1,295,408
Total Net Position $ 1,401,157 $ 1,295,408
Total Liabilities and Net Position $ 2,923,923 $ 2,847,308
The accompanying notes are an integral part of these consolidated financial statements.
As of September 30, 2015 and 2014(Dollars in Thousands)

www.uspto.gov
123
UNITED STATES PATENT AND TRADEMARK OFFICE
Consolidated Statements of Net Cost
2015 2014 Strategic Goal 1: Optimize Patent Quality and Timeliness
Total Program Cost $ 2,683,522 $ 2,461,573
Total Program Earned Revenue (2,800,792) (2,745,933)
Net Program Income (117,270) (284,360)
Strategic Goal 2: Optimize Trademark Quality and Timeliness
Total Program Cost 276,593 225,394
Total Program Earned Revenue (273,209) (272,111)
Net Program Cost/(Income) 3,384 (46,717)
Strategic Goal 3: Provide Domestic and Global Leadership to Improve Intellectual Property Policy, Protection and Enforcement Worldwide
Total Program Cost 52,718 45,411
Net Income from Operations (Notes 14 and 15) $ (61,168) $ (285,666)
TOTAL ENTITY
Total Program Cost (Notes 16 and 17) $ 3,012,833 $ 2,732,378
Total Earned Revenue (3,074,001) (3,018,044)
Net Income from Operations (Notes 14 and 15) $ (61,168) $ (285,666)
The accompanying notes are an integral part of these consolidated financial statements.
For the years ended September 30, 2015 and 2014(Dollars in Thousands)

PERFORMANCE AND ACCOUNTABILITY REPORT
124
UNITED STATES PATENT AND TRADEMARK OFFICE
Consolidated Statements of Changes in Net Position
2015 2014
Funds from Dedicated Collections
Funds from Dedicated Collections
Cumulative Results of Operations
Beginning Balances $ 1,295,408 $ 949,237
Budgetary Financing Sources:
Transfers Out Without Reimbursement (2,000) (2,000)
Other Financing Sources:
Imputed Financing 46,581 62,505
Total Financing Sources 44,581 60,505
Net Income from Operations 61,168 285,666
Net Change 105,749 346,171
Cumulative Results of Operations $ 1,401 ,157 $ 1,295,408
Net Position, End of Year $ 1,401 ,157 $ 1,295,408
The accompanying notes are an integral part of these consolidated financial statements.
For the years ended September 30, 2015 and 2014(Dollars in Thousands)

www.uspto.gov
125
UNITED STATES PATENT AND TRADEMARK OFFICE
Combined Statements of Budgetary Resources
2015 2014BUDGETARY RESOURCES
Unobligated Balance—Brought Forward, October 1 $ 650,957 $ 442,291
Recoveries of Prior Year Unpaid Obligations 15,468 29,894
Spending Authority from Offsetting Collections (discretionary) 3,014,013 3,176,229
Total Budgetary Resources $ 3,680,438 $ 3,648,414
STATUS OF BUDGETARY RESOURCES
Obligations Incurred $ 3,176,085 $ 2,997,457
Unobligated Balance, End of Year:
Apportioned 504,284 650,957
Unapportioned 69 -
Total Status of Budgetary Resources $ 3,680,438 $ 3,648,414
CHANGE IN OBLIGATED BALANCE
Unpaid Obligations:
Unpaid Obligations, Brought Forward, October 1 $ 549,941 $ 265,560
Obligations Incurred 3,176,085 2,997,457
Gross Outlays (3,039,217) (2,683,182)
Recoveries of Prior Year Unpaid Obligations (15,468) (29,894)
Unpaid Obligations, End of Year $ 671,341 $ 549,941
Uncollected Payments:
Uncollected Customer Payments from Federal Sources, Brought Forward, October 1 $ (120) $ (47)
Change in Uncollected Customer Payments from Federal Sources 64 (73)
Uncollected Customer Payments from Federal Sources, End of Year $ (56) $ (120)
Memorandum (non-add) entries:
Obligated Balance, Net, Start of Year $ 549,821 $ 265,513
Obligated Balance, Net, End of Year $ 671,285 $ 549,821
BUDGET AUTHORITY AND NET OUTLAYS
Budget Authority, Gross (discretionary) $ 3,014,013 $ 3,176,229
Actual Offsetting Collections (discretionary) (3,016,077) (3,178,156)
Change in Uncollected Customer Payments from Federal Sources (discretionary) 64
(73)
Budget Authority, Net (discretionary) $ (2,000) $ (2,000)
Gross Outlays (discretionary) $ 3,039,217 $ 2,683,182
Actual Offsetting Collections (discretionary) (3,016,077) (3,178,156)
Net Outlays/(Collections)(discretionary) $ 23,140 $ (494,974)
The accompanying notes are an integral part of these consolidated financial statements.
For the years ended September 30, 2015 and 2014(Dollars in Thousands)

PERFORMANCE AND ACCOUNTABILITY REPORT
126
UNITED STATES PATENT AND TRADEMARK OFFICE
Consolidated Statements of Cash Flows (Indirect Method)
2015 2014CASH FLOWS FROM OPERATING ACTIVITIES
Net Income from Operations $ 61,168 $ 285,666
Adjustments Affecting Cash Flow:
Imputed Financing from Cost Absorbed by Others 46,581 62,505
Increase in Accounts Receivable (44) (77)
(Increase)/Decrease in Advances and Prepayments (10,914) 962
Increase in Accounts Payable 82 20,988
Increase in Accrued Payroll and Benefits 11,554 14,923
Increase in Accrued Leave and Workers' and Unemployment Compensation 3,665 10,046
Increase in Customer Deposit Accounts 14,305 14,940
(Decrease)/Increase in Deferred Revenue (62,352) 158,264
Increase in Contingent Liability 320 250
(Decrease)/Increase in Actuarial Liability (28) 1,320
Depreciation, Amortization, or Loss on Asset Dispositions 105,298 90,629
Total Adjustments 108,467 374,750
Net Cash Provided by Operating Activities 169,635 660,416
CASH FLOWS FROM INVESTING ACTIVITIES
Purchases of Property and Equipment (179,428) (150,489)
Net Cash Used in Investing Activities (179,428) (150,489)
CASH FLOWS FROM FINANCING ACTIVITIES
Transfers Out Without Reimbursement (2,000) (2,000)
Net Cash Used in Financing Activities (2,000) (2,000)
Net Cash (Used in)/Provided by Operating, Investing, and Financing Activities $ (11,793) $ 507,927
Fund Balance with Treasury and Cash, Beginning of Year $ 2,510,068 $ 2,002,141
Net Cash (Used in)/Provided by Operating, Investing, and Financing Activities (11,793) 507,927
Fund Balance with Treasury and Cash, End of Year $ 2,498,275 $ 2,510,068
The accompanying notes are an integral part of these consolidated financial statements.
For the years ended September 30, 2015 and 2014(Dollars in Thousands)

www.uspto.gov
127
Reporting EntityThe United States Patent and Trademark Office (USPTO) is an agency of the United States within the U.S. Department of Commerce. The USPTO administers the laws relevant to patents and trademarks, and advises the Secretary of Commerce, the President of the United States, and the Administration on patent, trademark, and copyright protection, and trade-related aspects of intellectual property.
These financial statements include the USPTO’s three core business activities—granting patents, registering trademarks, and intellectual property policy, protection, and enforcement—that promote the use of intellectual property rights as a means of achieving economic prosperity. These activities give innovators, businesses, and entrepreneurs the protection and encouragement they need to turn their creative ideas into tangible products, and also provide protection for their inventions and trademarks.
The federal budget classifies the USPTO under the Other Advancement of Commerce (376) budget function. The USPTO does not have lending or borrowing authority. The USPTO does not transact business among its own operating units, and therefore, no intra-entity eliminations are necessary.
The USPTO is not subject to federal, state, or local income taxes. Accordingly, no provision for income taxes is recorded.
Basis of PresentationAs required by the Chief Financial Officers Act of 1990 and 31 United States Code (U.S.C.) § 3515(b), the accompanying financial statements present the financial position, net cost of operations, budgetary resources, and cash flows for the USPTO’s core business activities. The books and records of the USPTO serve as the source of this information.
These financial statements were prepared in accordance with accounting principles generally accepted in the United States (GAAP) and the form and content for entity financial statements specified by the Office of Management and Budget (OMB) in Circular No. A-136, Financial Reporting Requirements, as amended, as well as the accounting policies of the USPTO. Therefore, they may differ from other financial reports submitted pursuant to OMB directives for the purpose of monitoring and controlling the use of the USPTO’s budgetary resources. The GAAP for federal entities are the standards
UNITED STATES PATENT AND TRADEMARK OFFICE
Notes to Financial StatementsAs of and for the years ended September 30, 2015 and 2014
NOTE 1. Summary of Significant Accounting Policies

PERFORMANCE AND ACCOUNTABILITY REPORT
128
prescribed by the Federal Accounting Standards Advisory Board, which is the official body for setting the accounting standards of the federal government.
Throughout these financial statements, assets, liabilities, revenues, and costs have been classified according to the type of entity with which the transactions are associated. Intra-governmental assets and liabilities are those from or to other federal entities. Intra-governmental earned revenues are collections or accruals of revenue from other federal entities and intra-governmental costs are payments or accruals to other federal entities.
Certain prior year balances were reclassified to conform with current year presentation.
Allocation transfers are legal delegations by one department of its authority to obligate budget authority and outlay funds to another department. The USPTO does not receive any allocation transfers.
Basis of AccountingThese financial statements reflect both accrual and budgetary accounting transactions. Under the accrual method of accounting, revenues are recognized when earned and expenses are recognized when incurred, without regard to the receipt or payment of cash. Budgetary accounting is designed to recognize the obligation of funds according to legal requirements, which in many cases is made prior to the occurrence of an accrual-based transaction. Budgetary accounting is essential for compliance with legal constraints and controls over the use of federal funds.
Funds from Dedicated CollectionsFunds from dedicated collections are financed by specifically identified revenues, which remain available over time. These specifically identified revenues are required by statute to be used for designated activities, benefits, or purposes, and must be accounted for separately from the government’s general revenues. At the USPTO, funds from dedicated collections include the salaries and expenses fund (013X1006), fee reserve fund (013X1008), and the special fund receipts (0135127). Additional details are provided in Note 14.
Fiduciary ActivitiesFiduciary activities are not recognized on the financial statements, but reported on schedules in the notes to the financial statements. Fiduciary balances are not assets of the federal government. Fiduciary activities are the collection or receipt, and the management, protection, accounting, and disposition by the federal government of cash or other assets in which non-federal individuals or entities have an ownership interest that the federal government must uphold. At the USPTO, fiduciary activities are recorded in the Patent Cooperation Treaty fund (013X6538) and the Madrid Protocol fund (013X6554). Additional details are provided in Note 20.
NOTE 1. Summary of Significant Accounting Policies (continued)

www.uspto.gov
129
Use of EstimatesThe preparation of financial statements in conformity with GAAP requires management to make estimates and assumptions that affect the reported amounts of assets and liabilities and the disclosure of contingent assets and liabilities as of the date of the financial statements and the reported amounts of revenues and expenses during the reporting period. Actual results could differ from estimates.
Revenue and Other Financing SourcesExchange Revenue: The USPTO has fee setting authority under section 10 of the Leahy-Smith America Invents Act (AIA). Section 10(a) of the AIA authorizes the Director of the USPTO to set or adjust by rule all patent and trademark fees to recover the aggregate estimated cost to the USPTO. Provided that the fees in the aggregate achieve overall aggregate cost recovery, the Director of USPTO may set individual fees under section 10, at, below, or above their respective cost. Since FY 1993, the USPTO’s funding has been primarily through the collection of user fees. Fees that are remitted with initial applications and requests for other services are recorded as exchange revenue when received, with an adjustment to defer revenue for services that have not been performed. All amounts remitted by customers without a request for service are recorded as liabilities in customer deposit accounts until services are ordered.
The USPTO also receives financial gifts and gifts-in-kind. All such transactions are included in the consolidated Gifts and Bequests Fund financial statements of the U.S. Department of Commerce. These gifts are not reflected in the USPTO’s financial statements. Most gifts-in-kind are used for official travel to further attain the USPTO mission and objectives.
Imputed Financing Sources from Cost Absorbed by Others (and Related Imputed Costs): In certain cases, operating costs of the USPTO are paid for in full or in part by funds appropriated to other federal entities. For example, Civil Service Retirement System (CSRS) pension benefits for applicable USPTO employees are paid for in part by the U.S. Office of Personnel Management (OPM), and certain legal judgments against the USPTO are paid for in full from the Judgment Fund maintained by Treasury. Also, the cost of collections for the USPTO are paid for in full by Treasury. The USPTO includes applicable Imputed Costs on the Consolidated Statements of Net Cost. In addition, an Imputed Financing Source from Cost Absorbed by Others is recognized on the Consolidated Statements of Changes in Net Position.
Transfers Out: Intragovernmental transfers of budget authority without reimbursement are recorded at book value.
Entity/Non-EntityAssets that an entity is authorized to use in its operations are termed entity assets, while assets that are held by an entity and are not available for the entity’s use are termed non-entity assets. Most of the USPTO’s assets are
NOTE 1. Summary of Significant Accounting Policies (continued)

PERFORMANCE AND ACCOUNTABILITY REPORT
130
entity assets and are available to carry out the mission of the USPTO, as appropriated by Congress, with the exception of a portion of the Fund Balance with Treasury and cash. Additional details are provided in Note 7.
Fund Balance with TreasuryThe USPTO deposits fees collected in commercial bank accounts maintained by the Treasury’s Bureau of the Fiscal Service (BFS). All moneys maintained in these accounts are transferred to the Federal Reserve Bank on the next business day following the day of deposit. In addition, many customer deposits are wired directly to the Federal Reserve Bank. All banking activity is conducted in accordance with the directives issued by the BFS. Treasury processes all disbursements. Additional details are provided in Note 2.
Accounts ReceivableAccounts receivable balances are established for amounts owed to the USPTO from its customers. The USPTO’s accounts receivable balances are comprised of amounts due from current and former employees for the reimbursement of education expenses and other benefits, amounts due from foreign intellectual property offices for the reimbursement of services provided, amounts due from other federal agencies for the reimbursement of services provided, and other revenue-related receivables. This balance in accounts receivable remains as a very small portion of the USPTO’s assets, as the USPTO requires payment prior to the provision of goods or services during the course of its core business activities. Additional details are provided in Note 3.
The USPTO has established an allowance for certain accounts receivables that are considered not collectible. These offsets are established for receivables older than two years with little or no collection activity that have been transferred to Treasury, subsequently adjusting the gross amount of its employee-related accounts receivable to the net realizable value. The USPTO regards all of the intergovernmental receivables balances as fully collectable.
Advances and PrepaymentsThe USPTO prepays amounts in anticipation of receiving future benefits. Although a payment has been made, an expense is not recorded until goods have been received or services have been performed. The USPTO has prepayments and advances with non-governmental, as well as governmental vendors. Additional details are provided in Note 6.
CashThe USPTO’s cash balance primarily consists of checks, electronic funds transfer, and credit card payments for deposits that are in transit and have not been credited to the USPTO’s Fund Balance with Treasury. The cash balance also consists of undeposited checks for fees that were not processed at the Balance Sheet date due to the lag time between receipt and initial review. All such undeposited check amounts are considered to
NOTE 1. Summary of Significant Accounting Policies (continued)

www.uspto.gov
131
be cash equivalents. Cash is also held outside the Treasury to be used as imprest funds. Additional details are provided in Note 4.
Property, Plant, and Equipment, Net The USPTO’s capitalization policies are summarized below:
Classes of Property, Plant, and Equipment
Capitalization Threshold for Individual Purchases
Capitalization Threshold for Bulk Purchases
IT Equipment $50 thousand or greater $250 thousand or greater
Software $50 thousand or greater $250 thousand or greater
Software in Progress $50 thousand or greater $250 thousand or greater
Furniture $50 thousand or greater $50 thousand or greater
Equipment $50 thousand or greater $250 thousand or greater
Leasehold Improvements $50 thousand or greater Not applicable
Costs capitalized are recorded at actual historical cost. Depreciation is expensed on a straight-line basis over the estimated useful life of the asset with the exception of leasehold improvements, which are depreciated over the remaining life of the lease or over the useful life of the improvement, whichever is shorter. Additional details are provided in Note 5.
Contractor costs for developing custom internal use software are capitalized when incurred for the design, coding, and testing of the software. Software in progress is not amortized until placed in service.
Property, plant, and equipment acquisitions that do not meet the capitalization criteria are expensed upon receipt.
Workers’ CompensationThe Federal Employees’ Compensation Act (FECA) provides compensation and medical cost protection to covered federal civilian employees injured on the job and for those who have contracted a work-related occupational disease, and beneficiaries of employees whose death is attributable to a job-related injury or occupational disease. Claims incurred for benefits under the FECA for the USPTO’s employees are administered by the DOL and are paid ultimately by the USPTO.
Accrued Liability: The DOL bills the USPTO annually as its claims are paid, but payment on these bills is deferred approximately two years to allow for funding through the budget process.
Actuarial Liability: The DOL estimates the future workers compensation liability by applying actuarial procedures developed to estimate the liability for FECA benefits. The actuarial liability estimates for FECA benefits include the expected liability for death, disability, medical, and miscellaneous costs for approved compensation cases, plus a component for incurred but not reported claims. The actuarial liability is updated annually.
NOTE 1. Summary of Significant Accounting Policies (continued)

PERFORMANCE AND ACCOUNTABILITY REPORT
132
Unemployment CompensationUSPTO employees who lose their jobs through no fault of their own may receive unemployment compensation benefits under the unemployment insurance program administered by the DOL. The DOL bills each agency quarterly as its claims are paid.
Annual, Sick, and Other LeaveAnnual leave and compensatory time are accrued as earned, with the accrual being reduced when leave is taken. An adjustment is made each fiscal quarter to ensure that the balances in the accrued leave accounts reflect current pay rates. No portion of this liability has been obligated. To the extent current year funding is not available to pay for leave earned but not taken, funding will be obtained from future financing sources. Sick leave and other types of non-vested leave are expensed as used.
Employee Retirement Systems and Post-Employment BenefitsUSPTO employees participate in either the CSRS or the Federal Employees Retirement System (FERS). The FERS was established by the enactment of Pub. L. No. 99-335. Pursuant to this law, the FERS and Social Security automatically cover most employees hired after December 31, 1983. Employees who had five years of federal civilian service prior to 1984 and who are rehired after a break in service of more than one year may elect to join the FERS and Social Security system or be placed in the CSRS offset retirement system. The USPTO’s financial statements do not report CSRS or FERS assets, accumulated plan benefits, or liabilities applicable to its employees. The reporting of such amounts is the responsibility of the OPM, who administers the plans. While the USPTO reported no liability for future payments to employees under these programs, the federal government is liable for future payments to employees through the OPM who administers these programs. The USPTO financial statements recognize a funded expense for the USPTO’s share of the costs to the federal government of providing pension, post-retirement health, and post-retirement life insurance benefits to all eligible USPTO employees. In addition to the funded expense, the USPTO financial statements also recognize an imputed cost for the OPM’s share of the costs to the federal government of providing pension, post-retirement health, and post-retirement life insurance benefits to all eligible USPTO employees. The USPTO’s appropriation requires full funding of the present costs, as determined by the OPM, of post-retirement benefits for the Federal Employees Health Benefit Program (FEHB), the Federal Employees Group Life Insurance Program (FEGLI), and pensions under the CSRS. While ultimate administration of any post-retirement benefits or retirement system payments will continue to be administered by the OPM, the USPTO is responsible for the payment of the present value associated with these costs calculated using the OPM factors. Any difference between the OPM factors for funding purposes and the OPM factors for reporting purposes is recognized as an imputed cost. Additional details are provided in Note 13.
NOTE 1. Summary of Significant Accounting Policies (continued)

www.uspto.gov
133
For the years ended September 30, 2015 and 2014, the USPTO made current year contributions through agency payroll contributions and quarterly supplemental payments to OPM equivalent to approximately 22.0 percent and 19.0 percent of the employee’s basic pay for those employees covered by CSRS, based on OPM cost factors. For the years ended September 30, 2015 and 2014, the USPTO made current year contributions through agency payroll contributions equivalent to approximately 13.0 percent and 11.9 percent of the employee’s basic pay for those employees covered by FERS, based on OPM cost factors. As contribution funding increases, imputed costs will correspondingly decrease.
All employees are eligible to contribute to a Thrift Savings Plan. For those employees participating in the FERS, a Thrift Savings Plan is automatically established, and the USPTO makes a mandatory contribution to this plan equal to one percent of the employees’ compensation. In addition, the USPTO makes matching contributions ranging from one to four percent of the employees’ compensation for FERS-eligible employees who contribute to their Thrift Savings Plans. No matching contributions are made to the Thrift Savings Plans for employees participating in the CSRS. Employees participating in the FERS are also covered under the Federal Insurance Contributions Act (FICA), for which the USPTO contributes a matching amount to the Social Security Administration.
Deferred RevenueDeferred revenue represents fees that have been received by the USPTO for requested services that have not been substantially completed. Two types of deferred revenue are recorded. The first type results from checks received, accompanied by requests for services, which were not yet deposited due to the lag time between receipt and initial review. The second type of deferred revenue relates primarily to fees for applications that have been partially processed. The deferred revenue balance is calculated by analyzing the process for completing each service that the USPTO provides. The percent incomplete based on the inventory of pending work and completion status is applied to fee collections to estimate the amount for deferred revenue. Deferred revenue at the USPTO is largely impacted by the change in patent and trademark filings, changes in the first action pendency rates, and changes in fee rates. Increases in patent and trademark filings, first action pendency rates, and fee rates result in increases in deferred revenue. The components of the liability are provided in Note 9.
Net PositionNet Position is the residual difference between assets and liabilities, and is composed of Cumulative Results of Operations.
Cumulative Results of Operations is the net result of the USPTO’s operations since inception.
Environmental CleanupThe USPTO does not have any known liabilities for environmental cleanup.
NOTE 1. Summary of Significant Accounting Policies (continued)

PERFORMANCE AND ACCOUNTABILITY REPORT
134
NOTE 2. Fund Balance with Treasury
(Dollars in Thousands) 2015 2014Fund Balances by Treasury Fund Type:
Special Funds $ 233,529 $ 233,529
General Funds 2,113,456 2,138,596
Deposit Funds 147,282 132,852
Total Fund Balance with Treasury $ 2,494,267 $ 2,504,977
Status of Fund Balance with Treasury:
Obligated Balance Not Yet Disbursed $ 671,285 $ 549,821
Unobligated Balance Available 504,284 650,957
Unobligated Balance Unavailable 69 -
Temporarily Not Available Pursuant to Public Law 937,818 937,818
Non-Budgetary Fund Balance with Treasury 380,811 366,381
Total Fund Balance with Treasury $ 2,494,267 $ 2,504,977
No discrepancies exist between the Fund Balance reflected in the general ledger and the balance in the Treasury accounts.
To help smooth the impact of economic downturns on operations and to help mitigate funding uncertainty, the USPTO has been reserving a portion of the amount Congress makes available annually through appropriations to the USPTO Salaries and Expenses fund as a designated operating reserve that will be carried over for use in future years. As of September 30, 2015, the total Patent reserve was $402,556 thousand and the total Trademark reserve was $101,797 thousand. As of September 30, 2014, the total Patent reserve was $493,711 thousand and the total Trademark reserve was $157,246 thousand.
As of September 30, 2014, $148,236 thousand of fee collections in excess of appropriated levels were deposited into the Patent and Trademark Fee Reserve Fund. Of this amount, $128,692 thousand was related to excess patent fee collections and $19,544 thousand were related to excess trademark fee collections. After successfully working through the reprogramming process with congressional appropriators early in FY 2015, the USPTO was able to gain access to these funds, which were transferred into our operating reserve, where they remain available to support the
As of September 30, 2015 and 2014, Fund Balance with Treasury consisted of the following:

www.uspto.gov
135
Agency’s future needs. As of September 30, 2015, the USPTO collected less fees than appropriated for the fiscal year. As a result, there were no funds deposited into the Patent and Trademark Fee Reserve Fund. Additional details are provided in Note 14.
As of September 30, 2015 and 2014, the Non-Budgetary Fund Balance with Treasury includes surcharge receipts of $233,529 thousand for each year presented and non-entity customer deposit accounts of $147,282 thousand and $132,852 thousand, respectively.
NOTE 3. Accounts Receivable, Net
As of September 30, 2015, USPTO entity accounts receivables consisted of the following:
(Dollars in Thousands)
Accounts Receivable,
Gross
Allowance for Uncollectible Accounts
Accounts Receivable, Net
Intragovernmental $ 56 $ – $ 56
With the Public $ 362 $ (120) $ 242
As of September 30, 2014, USPTO entity accounts receivables consisted of the following:
(Dollars in Thousands)
Accounts Receivable,
Gross
Allowance for Uncollectible Accounts
Accounts Receivable, Net
Intragovernmental $ 120 $ – $ 120
With the Public $ 251 $ (117) $ 134
NOTE 4. Cash
As of September 30, 2015 and 2014, cash consisted of the following:
(Dollars in Thousands) 2015 2014Deposits in Transit $ 3,928 $ 4,959
Undeposited Collections 80 132
Total $ 4,008 $ 5,091
NOTE 2. Fund Balance with Treasury (continued)

PERFORMANCE AND ACCOUNTABILITY REPORT
136
NOTE 5. Property, Plant, and Equipment, Net
As of September 30, 2015, property, plant, and equipment, net consisted of the following:
(Dollars in Thousands)
Classes of Property, Plant, and Equipment
Service Life(Years)
Acquisition Value
Accumulated Depreciation/ Amortization
Net Book Value
IT Equipment 3–5 $ 435,662 $ 356,910 $ 78,752
Software 3–5 500,282 348,678 151,604
Software in Progress – 109,967 - 109,967
Furniture 5–7 7,757 1,442 6,315
Equipment 3–8 12,021 9,459 2,562
Leasehold Improvements 5–20 115,460 58,920 56,540
Total Property, Plant, and Equipment
$ 1,181,149 $ 775,409 $ 405,740
As of September 30, 2014, property, plant, and equipment, net consisted of the following:
(Dollars in Thousands)
Classes of Property, Plant, and Equipment
Service Life (Years)
Acquisition Value
Accumulated Depreciation/ Amortization
Net Book Value
IT Equipment 3–5 $ 414,200 $ 333,128 $ 81,072
Software 3–5 437,343 339,667 97,676
Software in Progress – 89,989 - 89,989
Furniture 5–7 6,150 3,001 3,149
Equipment 3–8 11,549 9,262 2,287
Leasehold Improvements 5–20 106,500 52,383 54,117
Total Property, Plant, and Equipment
$ 1,065,731 $ 737,441 $ 328,290

www.uspto.gov
137
NOTE 6. Other Assets—Advances and Prepayments
As of September 30, 2015 and 2014, other assets consisted of the following:
(Dollars in Thousands) 2015 2014Intragovernmental
Advances and Prepayments $ 2,224 $ 1,450
With the Public
Advances and Prepayments $ 17,386 $ 7,246
Total $ 19,610 $ 8,696
The largest governmental prepayments include the USPTO deposit accounts held with the U.S. Government Publishing Office to facilitate recurring transactions, the U.S. Postal Service for postage, and the Department of Commerce for centralized services.
The largest prepayments with the public as of September 30, 2015 and 2014 were $13,653 thousand and $5,610 thousand, respectively, for various hardware and software maintenance agreements and $3,733 thousand and $1,533 thousand, respectively, for various library and online database subscriptions.

PERFORMANCE AND ACCOUNTABILITY REPORT
138
NOTE 7. Entity and Non-Entity Assets
Non-entity assets are amounts held on deposit for the convenience of the USPTO’s customers.
Customers have the option of maintaining a deposit account at the USPTO to facilitate the order process. Customers can draw from their deposit account when they place an order and can replenish their deposit account as desired. Funds maintained in customer deposit accounts are not available for the USPTO use until an order has been placed. Once an order has been placed, the funds are reclassified to entity funds.
As of September 30, 2015 and 2014, entity and non-entity assets consisted of the following:
(Dollars in Thousands) 2015 2014Fund Balance with Treasury:
Intragovernmental Customer Deposit Accounts $ 7,687 $ 5,948
Customer Deposit Accounts with the Public 139,595 126,904
Total Fund Balance with Treasury 147,282
132,852
Cash:
Customer Deposit Accounts with the Public 644 769
Total Non-Entity Assets 147,926 133,621
Total Entity Assets (Note 14) 2,775,997 2,713,687
Total Assets $ 2,923,923 $ 2,847,308
NOTE 8. Liabilities Covered and Not Covered by Budgetary Resources
The USPTO records liabilities for amounts that are likely to be paid as the direct result of events that have already occurred. The USPTO considers liabilities covered by three types of resources: realized budgetary resources; unrealized budgetary resources that become available without further Congressional action; and cash and Fund Balance with Treasury. Realized budgetary resources include obligated balances funding existing liabilities and unobligated balances (operating reserve) as of September 30, 2015. Unrealized budgetary resources are amounts that were not available for spending through September 30, 2015, but become available for spending on October 1, 2015 once apportioned by the OMB. In addition, cash and Fund Balance with Treasury cover liabilities that will never require the use of a budgetary resource. These liabilities consist of deposit accounts, refunds payable to customers for fee overpayments, and undeposited collections.

www.uspto.gov
139
Liabilities not covered by budgetary resources include Accrued Workers’ Compensation, Accrued Payroll and Benefits, Accrued Leave, Deferred Revenue, Actuarial FECA Liability, and Contingent Liability. Although future appropriations to fund these liabilities are probable and anticipated, Congressional action is needed before budgetary resources can be provided.
As of September 30, 2015 and 2014, liabilities covered and not covered by budgetary resources were as follows:
(Dollars in Thousands) 2015 2014Liabilities Covered by Resources
Intragovernmental:
Accounts Payable $ 7,026 $ 7,761
Accrued Payroll and Benefits 11,635 9,420
Accrued Unemployment Compensation 18 181
Customer Deposit Accounts 7,687 5,948
Total Intragovernmental 26,366 23,310
Accounts Payable 109,185 105,048
Accrued Payroll and Benefits 46,341 39,582
Customer Deposit Accounts 140,239 127,673
Deferred Revenue 504,196 650,945
Total Liabilities Covered by Resources $ 826,327 $ 946,558
Liabilities Not Covered by Resources
Intragovernmental:
Accrued Workers' Compensation $ 1,912 $ 1,834
Total Intragovernmental 1,912 1,834
Accrued Payroll and Benefits 58,050 55,470
Accrued Leave 101,640 97,890
Deferred Revenue 523,264 438,867
Actuarial FECA Liability 11,003 11,031
Contingent Liability 570 250
Total Liabilities Not Covered by Resources $ 696,439 $ 605,342
Total Liabilities $ 1,522,766 $ 1,551,900
NOTE 8. Liabilities Covered and Not Covered by Budgetary Resources (continued)
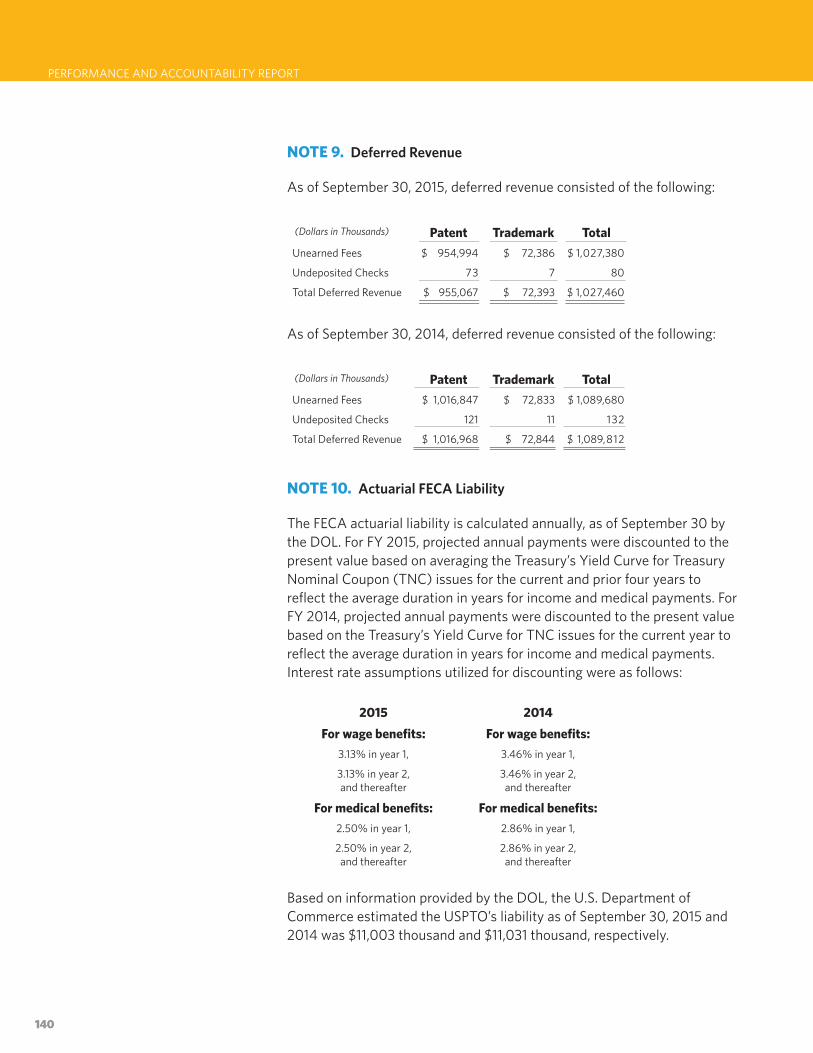
PERFORMANCE AND ACCOUNTABILITY REPORT
140
NOTE 9. Deferred Revenue
As of September 30, 2015, deferred revenue consisted of the following:
(Dollars in Thousands) Patent Trademark TotalUnearned Fees $ 954,994 $ 72,386 $ 1,027,380
Undeposited Checks 73 7 80
Total Deferred Revenue $ 955,067 $ 72,393 $ 1,027,460
As of September 30, 2014, deferred revenue consisted of the following:
(Dollars in Thousands) Patent Trademark TotalUnearned Fees $ 1,016,847 $ 72,833 $ 1,089,680
Undeposited Checks 121 11 132
Total Deferred Revenue $ 1,016,968 $ 72,844 $ 1,089,812
NOTE 10. Actuarial FECA Liability
The FECA actuarial liability is calculated annually, as of September 30 by the DOL. For FY 2015, projected annual payments were discounted to the present value based on averaging the Treasury’s Yield Curve for Treasury Nominal Coupon (TNC) issues for the current and prior four years to reflect the average duration in years for income and medical payments. For FY 2014, projected annual payments were discounted to the present value based on the Treasury’s Yield Curve for TNC issues for the current year to reflect the average duration in years for income and medical payments. Interest rate assumptions utilized for discounting were as follows:
2015 2014For wage benefits: For wage benefits:
3.13% in year 1, 3.46% in year 1,
3.13% in year 2,and thereafter
3.46% in year 2,and thereafter
For medical benefits: For medical benefits:2.50% in year 1, 2.86% in year 1,
2.50% in year 2, and thereafter
2.86% in year 2,and thereafter
Based on information provided by the DOL, the U.S. Department of Commerce estimated the USPTO’s liability as of September 30, 2015 and 2014 was $11,003 thousand and $11,031 thousand, respectively.

www.uspto.gov
141
NOTE 11. Leases
Operating Leases: The General Services Administration (GSA) negotiates long-term office space leases and levies rent charges, paid by the USPTO, approximate to commercial rental rates. These operating lease agreements for the USPTO’s office buildings expire at various dates between FY 2016 and FY 2026. During the years ended September 30, 2015 and 2014, the USPTO paid $96,258 thousand and $94,909 thousand, respectively, to the GSA for rent.
Under existing commitments, the future minimum lease payments as of September 30, 2015 are as follows:
Fiscal Year (Dollars in Thousands)
2016 $ 67,202
2017 67,080
2018 66,153
2019 62,436
2020 59,319
Thereafter 232,708
Total Future Minimum Lease Payments $ 554,898
The commitments shown above relate primarily to the operating lease for the USPTO headquarters in Alexandria, Virginia, beginning in FY 2004 and extending to FY 2026. The operating lease commitments for the USPTO offices in Shirlington, Virginia and the regional offices are also included above. The operating leases in Shirlington, Virginia and Detroit, Michigan will expire in FY 2019 and FY 2022, respectively. The operating lease in Denver, Colorado began in FY 2014 and will expire in FY 2024. The temporary lease in Dallas, Texas will expire in early FY 2016 and the long-term lease in Dallas, Texas will begin in FY 2016 and will expire in FY 2026. In addition, the long-term lease in San Jose, California began in FY 2015 and will expire in FY 2025.

PERFORMANCE AND ACCOUNTABILITY REPORT
142
NOTE 12. Commitments and Contingencies
The USPTO is a party to various routine administrative proceedings, legal actions, and claims brought by or against it, including threatened or pending litigation involving labor relations claims, some of which may ultimately result in settlements or decisions against the federal government.
As of September 30, 2015, management expects it is reasonably possible that approximately $2,700 thousand may be owed for awards or damages involving labor relations claims. Also, it is reasonably possible that an adverse outcome will result from two additional claims with no stated amount and a range of loss cannot be determined. As of September 30, 2014, management expects it is reasonably possible that approximately $5,800 thousand may be owed for awards or damages involving labor relations claims.
As of September 30, 2015, the USPTO was subject to a suit where an adverse outcome was probable and the claim was $570 thousand. As of September 30, 2014 the USPTO was subject to a suit where an adverse outcome was probable and the claim was $250 thousand.
For the years ended September 30, 2015 and 2014, the USPTO was not required to make any payments to the Judgment Fund.
As of September 30, 2015 and 2014, the USPTO did not have any major long-term commitments.
NOTE 13. Post-employment Benefits
For the years ended September 30, 2015 and 2014, the post-employment benefit expenses were as follows:
(Dollars in Thousands) 2015 2014Funded Imputed Total Funded Imputed Total
CSRS $ 10,700 $ 1,918 $ 12,618 $ 10,067 $ 3,451 $ 13,518
FERS 171,349 10,489 181,838 144,594 29,647 174,241
FEHB 53,278 7,637 60,915 50,315 4,735 55,050
FEGLI 229 – 229 214 – 214
FICA 99,299 – 99,299 92,418 – 92,418
Total Cost $ 334,855 $ 20,044 $ 354,899 $ 297,608 $ 37,833 $ 335,441

www.uspto.gov
143
NOTE 14. Funds from Dedicated Collections
Funds from dedicated collections are financed by specifically identified revenues, which remain available over time. These specifically identified revenues are required by statute to be used for designated activities, benefits, or purposes, and must be accounted for separately from the government’s general revenues. At the USPTO, funds from dedicated collections include the salaries and expenses fund, the fee reserve fund, and the special fund receipts. Non-entity funds, as disclosed in Note 7, are not funds from dedicated collections and are therefore excluded from the below amounts.
(Dollars in Thousands) Salaries and
Expenses Fund Fee Reserve
Fund Surcharge
Fund
Total Funds from Dedicated
CollectionsBalance Sheet as of September 30, 2015Fund Balance with Treasury $ 2,113,456 $ – $ 233,529 $ 2,346,985
Cash 3,364 – – 3,364
Accounts Receivable, Net 298 – – 298
Other Assets 425,350 – – 425,350
Total Assets $ 2,542,468 $ – $ 233,529 $ 2,775,997
Total Liabilities $ 1,374,840 $ – $ – $ 1,374,840
Cumulative Results of Operations 1,167,628 – 233,529 1,401,157
Total Liabilities and Net Position $ 2,542,468 $ – $ 233,529 $ 2,775,997
Statement of Net Cost For the Year Ended September 30, 2015Total Program Cost $ 3,012,833 $ – $ – $ 3,012,833
Less Program Earned Revenue (3,074,001) – – (3,074,001)
Net Income from Operations $ (61,168) $ – $ – $ (61,168)
Statement Changes in Net Position For the Year Ended September 30, 2015Net Position, Beginning of Year $ 971,517 $ 90,362 $ 233,529 $ 1,295,408
Budgetary Financing Sources:
Transfers In/(Out) Without Reimbursement 146,236 (148,236) – (2,000)
Other Financing Sources:
Imputed Financing 46,581 – – 46,581
Transfers In/(Out) Without Reimbursement (57,874) 57,874 – –
Net Income from Operations 61,168 – – 61,168
Change in Net Position 196,111 (90,362) – 105,749
Net Position, End of Year $ 1,167,628 $ – $ 233,529 $ 1,401,157

PERFORMANCE AND ACCOUNTABILITY REPORT
144
NOTE 14. Funds from Dedicated Collections (continued)
(Dollars in Thousands) Salaries and
Expenses Fund Fee Reserve
Fund Surcharge
Fund
Total Funds from Dedicated
CollectionsBalance Sheet as of September 30, 2014Fund Balance with Treasury $ 1,990,360 $ 148,236 $ 233,529 $ 2,372,125
Cash 4,322 – – 4,322
Accounts Receivable, Net 254 – – 254
Other Assets 336,986 – – 336,986
Total Assets $ 2,331,922 $ 148,236 $ 233,529 $ 2,713,687
Total Liabilities $ 1,360,405 $ 57,874 $ – $ 1,418,279
Cumulative Results of Operations 971 ,517 90,362 233,529 1,295,408
Total Liabilities and Net Position $ 2,331,922 $ 148,236 $ 233,529 $ 2,713,687
Statement of Net Cost For the Year Ended September 30, 2014Total Program Cost $ 2,732,378 $ – $ – $ 2,732,378
Less Program Earned Revenue (2,927,682) (90,362) – (3,018,044)
Net Income from Operations $ (195,304) $ (90,362) $ – $ (285,666)
Statement Changes in Net Position For the Year Ended September 30, 2014Net Position, Beginning of Year $ 715,708 $ – $ 233,529 $ 949,237
Budgetary Financing Sources:
Transfers Out Without Reimbursement (2,000) – – (2,000)
Other Financing Sources:
Imputed Financing 62,505 – – 62,505
Net Income from Operations 195,304 90,362 – 285,666
Change in Net Position 255,809 90,362 – 346,171
Net Position, End of Year $ 971,517 $ 90,362 $ 233,529 $ 1,295,408

www.uspto.gov
145
The Salaries and Expenses Fund contains moneys used for the administering of the laws relevant to patents and trademarks and advising the Secretary of Commerce, the President of the United States, and the Administration on patent, trademark, and copyright protection, and trade-related aspects of intellectual property. This fund is used for the USPTO’s three core business activities—granting patents, registering trademarks, and intellectual property policy, protection, and enforcement—that promote the use of intellectual property rights as a means of achieving economic prosperity. These activities give innovators, businesses, and entrepreneurs the protection and encouragement they need to turn their creative ideas into tangible products, and also provide protection for their inventions and trademarks. The USPTO may use moneys from this account only as authorized by Congress via appropriations.
The Patent and Trademark Fee Reserve Fund was created through the Leahy–Smith America Invents Act legislation enacted on September 16, 2011 (Pub. L. No. 112-29) modifying 35 U.S.C § 42(c). This established a statutory provision allowing the USPTO to collect and deposit in this fund fees collected in excess of the appropriated levels for each fiscal year. Annual appropriations provide further the authorization for the USPTO to spend those fees and are available without fiscal limitation until expended.
The Surcharge Fund was created through the Patent and Trademark Office Surcharge provision in the Omnibus Budget Reconciliation Act (OBRA) of 1990 (Section 10101, Pub. L. No. 101-508). This required that the USPTO impose a surcharge on certain patent fees and set in statute the amounts of money that the USPTO should deposit in a special fund receipt account at Treasury. This surcharge expired at the end of FY 1998. The USPTO may use moneys from this account only as authorized by Congress, and only as made available by the issuance of a Treasury warrant.
NOTE 14. Funds from Dedicated Collections (continued)

PERFORMANCE AND ACCOUNTABILITY REPORT
146
NOTE 15. Intragovernmental Costs and Exchange Revenue
Total intragovernmental costs and exchange revenue, by Strategic Goal, for the years ended September 30, 2015 and 2014 were as follows:
2015
(Dollars in Thousands) patent trademark intellectual
property protection
total
Strategic Goal 1: Optimize Patent Quality and Timeliness
Intragovernmental Gross Cost $ 553,063 $ – $ – $ 553,063
Gross Cost with the Public 2,130,459 – – 2,130,459
Total Program Cost 2,683,522 – – 2,683,522
Intragovernmental Earned Revenue (8,658) – – (8,658)
Earned Revenue from the Public (2,792,134) – – (2,792,134)
Total Program Earned Revenue (2,800,792) – – (2,800,792)
Net Program Income $ (117,270) $ – $ – $ (117,270)
Strategic Goal 2: Optimize Trademark Quality and Timeliness
Intragovernmental Gross Cost $ – $ 57,005 $ – $ 57,005
Gross Cost with the Public – 219,588 – 219,588
Total Program Cost – 276,593 – 276,593
Intragovernmental Earned Revenue – (567) – (567)
Earned Revenue from the Public – (272,642) – (272,642)
Total Program Earned Revenue – (273,209) – (273,209)
Net Program Cost $ – $ 3,384 $ – $ 3,384
Strategic Goal 3: Provide Domestic and Global Leadership to Improve Intellectual Property Policy, Protection, and Enforcement Worldwide
Intragovernmental Gross Cost $ – $ – $ 10,865 $ 10,865
Gross Cost with the Public – – 41,853 41,853
Total Program Cost – – 52,718 52,718
Net (Income)/Cost from Operations $ (117,270) $ 3,384 $ 52,718 $ (61,168)
Total Entity
Total Program Cost (Notes 16 and 17) $ 2,683,522 $ 276,593 $ 52,718 $ 3,012,833
Total Program Earned Revenue (2,800,792) (273,209) – (3,074,001)
Net (Income)/Cost from Operations $ (117,270) $ 3,384 $ 52,718 $ (61,168)

www.uspto.gov
147
NOTE 15. Intragovernmental Costs and Exchange Revenue (continued)
2014
(Dollars in Thousands) patent trademark intellectual property
protection total
Strategic Goal 1: Optimize Patent Quality and Timeliness
Intragovernmental Gross Cost $ 526,791 $ – $ – $ 526,791
Gross Cost with the Public 1,934,782 – – 1,934,782
Total Program Cost 2,461,573 – – 2,461,573
Intragovernmental Earned Revenue (8,656) – – (8,656)
Earned Revenue from the Public (2,737,277) – – (2,737,277)
Total Program Earned Revenue (2,745,933) – – (2,745,933)
Net Program Income $ (284,360) $ – $ – $ (284,360)
Strategic Goal 2: Optimize Trademark Quality and Timeliness
Intragovernmental Gross Cost $ – $ 48,236 $ – $ 48,236
Gross Cost with the Public – 177,158 – 177,158
Total Program Cost – 225,394 – 225,394
Intragovernmental Earned Revenue – (446) – (446)
Earned Revenue from the Public – (271,665) – (271,665)
Total Program Earned Revenue – (272,1 1 1 ) – (272,1 1 1 )
Net Program Income $ – $ (46,717) $ – $ (46,717)
Strategic Goal 3: Provide Domestic and Global Leadership to Improve Intellectual Property Policy, Protection, and Enforcement Worldwide
Intragovernmental Gross Cost $ – $ – $ 9,718 $ 9,718
Gross Cost with the Public – – 35,693 35,693
Total Program Cost – – 45,411 45,411
Net (Income)/Cost from Operations $ (284,360) $ (46,717) $ 45,411 $ (285,666)
Total Entity
Total Program Cost (Notes 16 and 17) $ 2,461,573 $ 225,394 $ 45,411 $ 2,732,378
Total Program Earned Revenue (2,745,933) (272,1 1 1 ) – (3,018,044)
Net (Income)/Cost from Operations $ (284,360) $ (46,717) $ 45,411 $ (285,666)
Intragovernmental expenses relate to the source of the goods or services, not the classification of the related revenue.

PERFORMANCE AND ACCOUNTABILITY REPORT
148
NOTE 16. Program Costs
Program costs consist of both costs related directly to the individual business lines and overall support costs allocated to the business lines. All costs are assigned to specific programs. Total program or operating costs for the years ended September 30, 2015 and 2014 by cost category were as follows:
2015(Dollars in Thousands) Direct Allocated TotalPersonnel Services and Benefits $ 1,893,845 $ 163,355 $ 2,057,200
Travel and Transportation 4,305 1,060 5,365
Rent, Communications, and Utilities 90,757 36,189 126,946
Printing and Reproduction 129,185 218 129,403
Contractual Services 227,407 246,952 474,359
Training 2,506 1,928 4,434
Maintenance and Repairs 2,001 38,868 40,869
Supplies and Materials 39,050 1,083 40,133
Equipment not Capitalized 6,059 22,730 28,789
Insurance Claims and Indemnities 26 11 37
Depreciation, Amortization, or Loss on Asset Dispositions
45,775 59,523 105,298
Total Program Costs $ 2,440,916 $ 571,917 $ 3,012,833
2014 (Dollars in Thousands) Direct Allocated TotalPersonnel Services and Benefits $ 1,792,370 $ 150,550 $ 1,942,920
Travel and Transportation 2,555 752 3,307
Rent, Communications, and Utilities 91,063 32,549 123,612
Printing and Reproduction 124,611 138 124,749
Contractual Services 189,652 165,021 354,673
Training 2,044 1,300 3,344
Maintenance and Repairs 2,978 42,452 45,430
Supplies and Materials 36,631 1,217 37,848
Equipment not Capitalized 1,725 4,063 5,788
Insurance Claims and Indemnities 30 48 78
Depreciation, Amortization, or Loss on Asset Dispositions 28,795 61,834 90,629
Total Program Costs $ 2,272,454 $ 459,924 $ 2,732,378

www.uspto.gov
149
NOTE 17. Program Costs by Category and Responsibility Segment
The program costs for the years ended September 30, 2015 and 2014 by cost category and business line were as follows:
2015
(Dollars in Thousands) patent trademark
intellectual property
protection
total
Direct Costs
Personnel Services and Benefits $ 1,732,622 $ 136,107 $ 25,116 $ 1,893,845
Travel and Transportation 2,538 137 1,630 4,305
Rent, Communications, and Utilities 80,562 7,141 3,054 90,757
Printing and Reproduction 129,149 27 9 129,185
Contractual Services 190,446 25,636 11,325 227,407
Training 2,124 315 67 2,506
Maintenance and Repairs 1,490 485 26 2,001
Supplies and Materials 36,954 1,297 799 39,050
Equipment not Capitalized 3,607 2,299 153 6,059
Insurance Claims and Indemnities 23 - 3 26
Depreciation, Amortization, or Loss on Asset Dispositions 31,726 13,799 250 45,775
Subtotal Direct Costs $ 2,211,241 $ 187,243 $ 42,432 $ 2,440,916
Allocated Costs
Automation $ 244,405 $ 54,122 $ 4,502 $ 303,029
Resource Management 227,876 35,228 5,784 268,888
Subtotal Allocated Costs $ 472,281 $ 89,350 $ 10,286 $ 571,917
Total Program Costs $ 2,683,522 $ 276,593 $ 52,718 $ 3,012,833

PERFORMANCE AND ACCOUNTABILITY REPORT
150
NOTE 17. Program Costs by Category and Responsibility Segment (continued)
2014
(Dollars in Thousands) patent trademark
intellectual property
protection total
Direct Costs
Personnel Services and Benefits $ 1,640,574 $ 128,857 $ 22,939 $ 1,792,370
Travel and Transportation 1,003 134 1,418 2,555
Rent, Communications, and Utilities 80, 311 7,920 2,832 91,063
Printing and Reproduction 124,646 (35) - 124,611
Contractual Services 166,385 14,048 9,219 189,652
Training 1,804 196 44 2,044
Maintenance and Repairs 2,155 656 167 2,978
Supplies and Materials 34,900 1,212 519 36,631
Equipment not Capitalized 520 1 ,137 68 1,725
Insurance Claims and Indemnities 28 1 1 30
Depreciation, Amortization, or Loss on Asset Dispositions 20,790 7,776 229 28,795
Subtotal Direct Costs $ 2,073,116 $ 161,902 $ 37,436 $ 2,272,454
Allocated Costs
Automation $ 202,235 $ 35,589 $ 3,475 $ 241,299
Resource Management 186,222 27,903 4,500 218,625
Subtotal Allocated Costs $ 388,457 $ 63,492 $ 7,975 $ 459,924
Total Program Costs $ 2,461,573 $ 225,394 $ 45,411 $ 2,732,378

www.uspto.gov
151
NOTE 18. Budgetary Resources
Total budgetary resources are primarily comprised of Congressional authority to spend current year fee collections. For FY 2015, the USPTO was appropriated up to $3,458,000 thousand for fees collected during the fiscal year. For FY 2014, the USPTO was appropriated up to $3,024,000 thousand for fees collected during the fiscal year. For the year ended September 30, 2015, the USPTO collected $449,518 thousand less than the amount apportioned through September 30, 2015 (under-collections of fees of $449,244 thousand and net under-collections of other budgetary resources of $274 thousand). For the year ended September 30, 2014, the USPTO collected $142,673 thousand more than the amount apportioned through September 30, 2014 (over-collections of fees of $148,236 thousand and net under-collections of other budgetary resources of $5,563 thousand); the excess fee collections of $148,236 thousand were deposited into the Patent and Trademark Fee Reserve Fund and remain available until expended.
Total budgetary resources also include carryover of prior year budgetary resources (operating reserve). Carryover is derived from year-end budgetary resources that have not been obligated. Usage of the fees in the following fiscal year is for compensation and operational requirements on a first-in, first-out basis. For FY 2015, the carryover amount that was brought into the fiscal year from FY 2014 was $650,957 thousand. For FY 2014, the carryover amount that was brought into the fiscal year from FY 2013 was $442,291 thousand.
The USPTO receives an apportionment of Category A funds from OMB, which apportions budgetary resources by fiscal quarter. The USPTO does not receive any Category B funds, or those exempt from apportionment. As of September 30, 2015 and 2014, reimbursable obligations incurred were $3,176,085 thousand and $2,997,457 thousand, respectively.
Funding LimitationsPursuant to the Patent and Trademark Office Fee Fairness Act of 1999 (35 U.S.C. § 42(c)), all fees available to the Director under section 31 of the Trademark Act of 1946 are used only for the processing of trademark registrations and for other activities, services, and materials relating to trademarks, as well as to cover a proportionate share of the administrative costs of the USPTO.
Pursuant to the Leahy–Smith America Invents Act (35 U.S.C. § 42(c)), all fees available to the Director under sections 41, 42, and 376 of 35 U.S.C. are used only for the processing of patent applications and for other activities, services, and materials relating to patents, as well as to cover a proportionate share of the administrative costs of the USPTO.
The total temporarily unavailable fee collections pursuant to Public Law as of September 30, 2015 are $1,171,347 thousand. Of this amount, certain USPTO collections of $233,529 thousand were withheld in accordance with the

PERFORMANCE AND ACCOUNTABILITY REPORT
152
OBRA of 1990, and deposited in a special fund receipt account at Treasury.
Pursuant to the Consolidated and Further Continuing Appropriations Act, 2013 (Pub. L. No. 113-6), the USPTO has sequestered funds of $147,733 thousand (8.6 percent of fees collected starting March 1, 2013 through the end of the fiscal year). The sequestered funds will not be available for spending without further Congressional action.
Undelivered OrdersIn addition to the future lease commitments discussed in Note 11, the USPTO is obligated for the purchase of goods and services that have been ordered, but not yet received. Total reimbursable undelivered orders for all of the USPTO’s activities were $516,915 thousand and $396,788 thousand as of September 30, 2015 and 2014, respectively. Of these amounts, $497,305 thousand and $388,092 thousand, respectively, were unpaid.
NOTE 19. Incidental Custodial Collections
Custodial collections represent miscellaneous general fund receipts, such as non-electronic patent filing fees, gains on foreign exchange rates, and employee debt finance charges. Custodial collection activities are considered immaterial and incidental to the mission of the USPTO.
(Dollars in Thousands) 2015 2014Revenue Activity:
Sources of Collections:
Miscellaneous $ 602 $ 629
Total Cash Collections 602 629
Accrual Adjustments – –
Total Custodial Revenue 602 629
Disposition of Collections:
Transferred to Others:
Treasury (602) (629)
(Increase)/Decrease in the Amounts Yet to be Transferred – –
Net Custodial Activity $ – $ –
NOTE 18. Budgetary Resources (continued)

www.uspto.gov
153
NOTE 20. Fiduciary Activities
Fiduciary activities are the collection or receipt, and the management, protection, accounting, and disposition by the federal government of cash or other assets in which non-federal individuals or entities have an ownership interest that the federal government must uphold. Fiduciary cash and other assets are not assets of the federal government and accordingly are not recognized on the proprietary financial statements.
The Patent Cooperation Treaty authorized the USPTO to collect patent filing and search fees on behalf of the World Intellectual Property Organization (WIPO), European Patent Office, Korean Intellectual Property Office, Russian Intellectual Property Organization, Australian Patent Office, Israeli Patent Office, and the Japanese Patent Office from U.S. citizens requesting an international patent. The Madrid Protocol Implementation Act authorized the USPTO to collect trademark application fees on behalf of the International Bureau of the WIPO from U.S. citizens requesting an international trademark.
2015 2014
(Dollars in Thousands)
PatentCooperation
Treaty
MadridProtocol
TotalFiduciary
Funds
Patent Cooperation
Treaty
Madrid Protocol
TotalFiduciary
FundsSchedule of Fiduciary Activity For the Years Ended September 30, 2015 and 2014
Fiduciary Net Assets, Beginning of Year
$ 15,795 $ 512 $ 16,307 $ 14,364 $ 484 $ 14,848
Contributions 159,753 22,274 182,027 186,630 21,818 208,448
Disbursements to and on Behalf of Beneficiaries (159,380) (22,171) (181,551) (185,199) (21,790) (206,989)
Increase in Fiduciary Net Assets 373 103 476 1,431 28 1,459
Fiduciary Net Assets, End of Year $ 16,168 $ 615 $ 16,783 $ 15,795 $ 512 $ 16,307
Fiduciary Net Assets As of September 30, 2015 and 2014
(Dollars in Thousands)
Patent Cooperation
Treaty
Madrid Protocol
TotalFiduciary
Funds
Patent Cooperation
Treaty
Madrid Protocol
TotalFiduciary
FundsCash and Cash Equivalents $ 16,168 $ 615 $ 16,783 $ 15,795 $ 512 $ 16,307
Total Fiduciary Net Assets $ 16,168 $ 615 $ 16,783 $ 15,795 $ 512 $ 16,307

PERFORMANCE AND ACCOUNTABILITY REPORT
154
NOTE 21. Reconciliation of Net Cost of Operations to Budget
Most entity transactions are recorded in both budgetary and proprietary accounts. However, because different accounting guidelines are used for budgetary and proprietary accounting, some transactions may appear in only one set of accounts. The following reconciliation provides a means to identify the relationships and differences that exist between the aforementioned budgetary and proprietary accounts.
The reconciliation of net cost of operations to budget for the years ended September 30, 2015 and 2014 is as follows:
(Dollars in Thousands) 2015 2014RESOURCES USED TO FINANCE ACTIVITIES
Budgetary Resources Obligated:
Obligations Incurred $ 3,176,085 $ 2,997,457
Spending Authority from Offsetting Collections and Recoveries (3,029,481) (3,206,123)
Net Obligations 146,604 (208,666)
Other Resources
Imputed Financing from Cost Absorbed by Others 46,581 62,505
Total Resources Generated/(Used) to Finance Activities 193,185 (146,1 61 )
RESOURCES USED TO FINANCE ITEMS NOT PART OF THE NET COST OF OPERATIONS
Change in Budgetary Resources Obligated for Goods, Services, and Benefits Ordered but not yet Provided (120,128) (240,415)
Resources that Fund Costs Recognized in Prior Periods (171) (165)
Budgetary Offsetting Collections that do not Affect Net Cost of Operations (63,393) 156,249
Resources that Finance the Acquisition of Assets Capitalized on the Balance Sheet (182,748) (161 ,911)
Total Resources Used to Finance Items not Part of the Net Cost of Operations (366,440) (246,242)
COMPONENTS OF NET COST OF OPERATIONS THAT WILL NOT REQUIRE OR GENERATE RESOURCES IN THE CURRENT PERIOD
Components Requiring or Generating Resources in Future Periods:
Costs that will be Funded by Resources in Future Periods 6,897 16 ,1 1 2
Total Components of Net Cost of Operations that will Require or Generate Resources in Future Periods 6,897 16 ,1 1 2
Components not Requiring or Generating Resources:
Depreciation, Amortization, or Loss on Asset Dispositions 105,298 90,629
Other Costs that will not Require Resources (108) (4)
Total Components of Net Cost of Operations that will not Require or Generate Resources 105,190 90,625
Total Components of Net Cost of Operations that will not Require or Generate Resources in the Current Period 112,087 106,737
Net Income from Operations $ (61,168) $ (285,666)

www.uspto.gov
155
Required Supplementary InformationUnaudited, please see the accompanying auditors’ report.
Combining Schedule of Budgetary Resources by Major Budget AccountThe following table illustrates the USPTO’s FY 2015 budgetary resources by major budget account.
Salaries and Expenses Fund Fee Reserve Fund Combining Total
(Dollars in Thousands) BUDGETARY RESOURCES
Unobligated Balance—Brought Forward, October 1 $ 502,721 $ 148,236 $ 650,957
Recoveries of Prior Year Unpaid Obligations 15,468 - 15,468
Spending Authority from Offsetting Collections (discretionary) 3,162,249 (148,236) 3,014,013
Total Budgetary Resources $ 3,680,438 $ - $ 3,680,438
STATUS OF BUDGETARY RESOURCES
Obligations Incurred $ 3,176,085 $ - $ 3,176,085
Unobligated Balance, End of Year:
Apportioned 504,284 - 504,284
Unapportioned 69 - 69
Total Status of Budgetary Resources $ 3,680,438 $ - $ 3,680,438
CHANGE IN OBLIGATED BALANCE
Unpaid Obligations:Unpaid Obligations, Brought Forward, October 1 $ 549,941 $ - $ 549,941
Obligations Incurred 3,176,085 - 3,176,085
Gross Outlays (3,039,217) - (3,039,217)
Recoveries of Prior Year Unpaid Obligations (15,468) - (15,468)
Unpaid Obligations, End of Year $ 671,341 $ - $ 671,341
Uncollected Payments: Uncollected Customer Payments from Federal Sources, Brought Forward, October 1 $ (120) $ - $ (120)
Change in Uncollected Customer Payments from Federal Sources 64 - 64
Uncollected Customer Payments from Federal Sources, End of Year $ (56) $ - $ (56)
Memorandum (non-add) entries: Obligated Balance, Net, Start of Year $ 549,821 $ - $ 549,821
Obligated Balance, Net, End of Year $ 671,285 $ - $ 671,285
BUDGET AUTHORITY AND NET OUTLAYS
Budget Authority, Gross (discretionary) $ 3,162,249 $ (148,236) $ 3,014,013
Actual Offsetting Collections (discretionary) (3,016,077) - (3,016,077)
Change in Uncollected Customer Payments from Federal Sources (discretionary) 64 - 64
Budget Authority, Net (discretionary) $ 146,236 $ (148,236) $ (2,000)
Gross Outlays (discretionary) $ 3,039,217 $ - $ 3,039,217
Actual Offsetting Collections (discretionary) (3,016,077) - (3,016,077)
Net Outlays (discretionary) $ 23,140 $ - $ 23,140

PERFORMANCE AND ACCOUNTABILITY REPORT
156
Deferred Maintenance and RepairsDeferred maintenance and repairs (DM&R) are maintenance and repairs that were not performed when they should have been, that were scheduled and not performed, or that were delayed for a future period. Maintenance and repairs are activities directed towards keeping Property, Plant, and Equipment (PP&E) in acceptable operating condition. These activities include preventive maintenance, normal repairs, replacement of parts and structural components, and other activities needed to preserve the asset so that it can deliver acceptable performance and achieve its expected life. Maintenance and repairs exclude activities aimed at expanding the capacity of an asset or otherwise upgrading it to serve needs different from, or significantly greater, than those originally intended.
PP&E at the USPTO consist of furniture and fixtures, information technology equipment, office and telecommunication equipment, leasehold improvements, and internal use software. It is entity policy to ensure that all PP&E, regardless of recorded value, is maintained, preserved, and managed in a safe and effective manner. The USPTO conducts periodic user feedback meetings to evaluate the effectiveness of training, operations, maintenance, facilities, continuity of operations, and supporting documentation of automated systems. The USPTO prioritizes maintenance and repair projects to sustain its PP&E in good operating condition, including maintaining warranties. Funds are used to replace equipment on a regular cycle in order to keep operations and maintenance costs stable and low. Accordingly, DM&R do not arise for PP&E at the USPTO and no periodic assessment is performed.

www.uspto.gov
157
INDEPENDENT AUDITORS’ REPORT

November 13, 2015
MEMORANDUM FOR: Michelle K. Lee
Under Secretary of Commerce for Intellectual Property and
Director of the U.S. Patent and Trademark Office
FROM: David Smith, Acting
SUBJECT: U.S. Patent and Trademark Office Fiscal Year 2015
Financial Statements—Final Report No. OIG-16-006-A
I am pleased to provide you with the attached audit report, which presents an unmodified
opinion on the U.S. Patent and Trademark Office’s (USPTO’s) fiscal year 2015 financial
statements. KPMG LLP, an independent public accounting firm, performed the audit in
accordance with U.S. generally accepted government auditing standards and Office of
Management and Budget Bulletin 15-02, Audit Requirements for Federal Financial Statements.
In its audit of USPTO, KPMG
determined that the financial statements were fairly presented, in all material respects,
and in conformity with U.S. generally accepted accounting principles;
identified one significant deficiency in internal control over financial reporting related to
information technology access and configuration management control weaknesses; and
identified no instances of reportable noncompliance with applicable laws, regulations,
and contracts.
My office oversaw the audit performance. We reviewed KPMG’s report and related
documentation and made inquiries of its representatives. Our review disclosed no instances
where KPMG did not comply, in all material respects, with generally accepted government
auditing standards. However, our review, as differentiated from an audit in accordance with
these standards, was not intended to enable us to express, and we do not express, any opinion
on USPTO’s financial statements, conclusions about the effectiveness of internal control, or
conclusions on compliance with applicable laws, regulations, and contracts. KPMG is solely
responsible for the attached audit report and the conclusions expressed in it.

We appreciate the cooperation and courtesies USPTO extended to KPMG during the audit.
Attachment

KPMG LLP Suite 12000 1801 K Street, NW Washington, DC 20006
Independent Auditors’ Report
Acting Inspector General, U.S. Department of Commerce, and
Under Secretary of Commerce for Intellectual Property and
Director of the U.S. Patent and Trademark Office:
Report on the Financial Statements
We have audited the accompanying consolidated financial statements of the United States Patent and
Trademark Office (USPTO), which comprise the consolidated balance sheets as of September 30, 2015 and
2014, and the related consolidated statements of net cost and changes in net position, and combined
statements of budgetary resources for the years then ended, and the related notes to the consolidated financial
statements.
Management’s Responsibility for the Financial Statements
Management is responsible for the preparation and fair presentation of these consolidated financial
statements in accordance with U.S. generally accepted accounting principles; this includes the design,
implementation, and maintenance of internal control relevant to the preparation and fair presentation of
consolidated financial statements that are free from material misstatement, whether due to fraud or error.
Auditors’ Responsibility
Our responsibility is to express an opinion on these consolidated financial statements based on our audits.
We conducted our audits in accordance with auditing standards generally accepted in the United States of
America; the standards applicable to financial audits contained in Government Auditing Standards issued by
the Comptroller General of the United States; and Office of Management and Budget (OMB) Bulletin
No. 15-02, Audit Requirements for Federal Financial Statements. Those standards and OMB Bulletin
No. 15-02 require that we plan and perform the audit to obtain reasonable assurance about whether the
consolidated financial statements are free from material misstatement.
An audit involves performing procedures to obtain audit evidence about the amounts and disclosures in the
consolidated financial statements. The procedures selected depend on the auditors’ judgment, including the
assessment of the risks of material misstatement of the consolidated financial statements, whether due to
fraud or error. In making those risk assessments, the auditor considers internal control relevant to the entity’s
preparation and fair presentation of the consolidated financial statements in order to design audit procedures
that are appropriate in the circumstances, but not for the purpose of expressing an opinion on the effectiveness
of the entity’s internal control. Accordingly, we express no such opinion. An audit also includes evaluating
the appropriateness of accounting policies used and the reasonableness of significant accounting estimates
made by management, as well as evaluating the overall presentation of the consolidated financial statements.
We believe that the audit evidence we have obtained is sufficient and appropriate to provide a basis for our
audit opinion.
KPMG LLP is a Delaware limited liability partnership, the U.S. member firm of KPMG International Cooperative (“KPMG International”), a Swiss entity.

United States Patent and Trademark Office
Independent Auditors’ Report
November 12, 2015
Page 2 of 4
Opinion on the Financial Statements
In our opinion, the consolidated financial statements referred to above present fairly, in all material respects,
the financial position of the United States Patent and Trademark Office as of September 30, 2015 and 2014,
and its net costs, changes in net position, and budgetary resources for the years then ended in accordance
with U.S. generally accepted accounting principles.
Other Matters
Management has elected to reference to information on websites or other forms of interactive data outside
the Performance and Accountability Report to provide additional information for the users of its financial
statements. Such information is not a required part of the basic consolidated financial statements or
supplementary information required by the Federal Accounting Standards Advisory Board. The information
on these websites or the other interactive data has not been subjected to any of our auditing procedures, and
accordingly we do not express an opinion or provide any assurance on it.
Required Supplementary Information
U.S. generally accepted accounting principles require that the information in the Management’s Discussion
and Analysis and Required Supplementary Information be presented to supplement the basic consolidated
financial statements. Such information, although not a part of the basic consolidated financial statements, is
required by the Federal Accounting Standards Advisory Board who considers it to be an essential part of
financial reporting for placing the basic consolidated financial statements in an appropriate operational,
economic, or historical context. We have applied certain limited procedures to the required supplementary
information in accordance with auditing standards generally accepted in the United States of America, which
consisted of inquiries of management about the methods of preparing the information and comparing the
information for consistency with management’s responses to our inquiries, the basic consolidated financial
statements, and other knowledge we obtained during our audits of the basic consolidated financial statements.
We do not express an opinion or provide any assurance on the information because the limited procedures
do not provide us with sufficient evidence to express an opinion or provide any assurance.
Other Information
Our audits were conducted for the purpose of forming an opinion on the basic consolidated financial
statements as a whole. The consolidated statements of cash flows for the years ended September 30, 2015
and 2014, Message, Introduction, Performance Information, Message from the Chief Financial Officer, Other
Information, Glossary of Acronyms and Abbreviation List, and the Index of URLs, as listed in the Table of
Contents, are presented for purposes of additional analysis and are not a required part of the basic
consolidated financial statements.
The consolidated statements of cash flows for the years ended September 30, 2015 and 2014 are the
responsibility of management and were derived from and relate directly to the underlying accounting and
other records used to prepare the basic consolidated financial statements. Such information has been
subjected to the auditing procedures applied in the audit of the basic consolidated financial statements and
certain additional procedures, including comparing and reconciling such information directly to the
underlying accounting and other records used to prepare the basic consolidated financial statements or to the
basic consolidated financial statements themselves, and other additional procedures in accordance with
auditing standards generally accepted in the United States of America. In our opinion, the consolidated

United States Patent and Trademark Office
Independent Auditors’ Report
November 12, 2015
Page 3 of 4
statements of cash flows for the years ended September 30, 2015 and 2014 are fairly stated in all material
respects in relation to the basic consolidated financial statements as a whole.
The information in the Message, Introduction, Performance Information, Message from the Chief Financial
Officer, Other Information, Glossary of Acronyms and Abbreviation List, and the Index of URLs, as listed
in the Table of Contents, have not been subjected to the auditing procedures applied in the audits of the basic
consolidated financial statements, and accordingly, we do not express an opinion or provide any assurance
on it.
Other Reporting Required by Government Auditing Standards
Internal Control Over Financial Reporting
In planning and performing our audit of the consolidated financial statements as of and for the year ended
September 30, 2015, we considered the USPTO’s internal control over financial reporting (internal control)
to determine the audit procedures that are appropriate in the circumstances for the purpose of expressing our
opinion on the consolidated financial statements, but not for the purpose of expressing an opinion on the
effectiveness of the USPTO’s internal control. Accordingly, we do not express an opinion on the
effectiveness of the USPTO’s internal control. We did not test all internal controls relevant to operating
objectives as broadly defined by the Federal Managers’ Financial Integrity Act of 1982.
A deficiency in internal control exists when the design or operation of a control does not allow management
or employees, in the normal course of performing their assigned functions, to prevent, or detect and correct,
misstatements on a timely basis. A material weakness is a deficiency, or a combination of deficiencies, in
internal control, such that there is a reasonable possibility that a material misstatement of the entity’s
financial statements will not be prevented, or detected and corrected, on a timely basis. A significant
deficiency is a deficiency, or a combination of deficiencies, in internal control that is less severe than a
material weakness, yet important enough to merit attention by those charged with governance.
Our consideration of internal control was for the limited purpose described in the first paragraph of this
section and was not designed to identify all deficiencies in internal control that might be material weaknesses
or significant deficiencies and therefore, material weaknesses or significant deficiencies may exist that were
not identified. Given these limitations, during our audit we did not identify any deficiencies in internal control
that we consider to be material weaknesses. We did identify the deficiency in internal control, described
below and in more detail in Exhibit I, that we consider to be a significant deficiency.
Information technology (IT) access and configuration management controls need improvement.
During fiscal year 2015, we noted underlying deficiencies surrounding system access and configuration
management. Specifically, the USPTO needs to make improvements in its IT controls to fully ensure that
financial data processed on its’ systems has integrity, is securely maintained, and is available only to
authorized users.
Compliance and Other Matters
As part of obtaining reasonable assurance about whether the USPTO’s consolidated financial statements are
free from material misstatement, we performed tests of its compliance with certain provisions of laws,
regulations, and contracts, noncompliance with which could have a direct and material effect on the
determination of financial statement amounts. However, providing an opinion on compliance with those
provisions was not an objective of our audit, and accordingly, we do not express such an opinion. The results

United States Patent and Trademark Office
Independent Auditors’ Report
November 12, 2015
Page 4 of 4
of our tests of compliance disclosed no instances of noncompliance or other matters that are required to be
reported herein under Government Auditing Standards or OMB Bulletin No. 15-02.
USPTO’s Response to Finding
The USPTO’s response to the finding identified in our audit is described in Exhibit I. The USPTO’s response
was not subjected to the auditing procedures applied in the audit of the consolidated financial statements and,
accordingly, we express no opinion on the response.
Purpose of the Other Reporting Required by Government Auditing Standards
The purpose of the communication described in the Other Reporting Required by Government Auditing
Standards section is solely to describe the scope of our testing of internal control and compliance and the
result of that testing, and not to provide an opinion on the effectiveness of the USPTO’s internal control or
compliance. Accordingly, this communication is not suitable for any other purpose.
Washington, D.C.
November 12, 2015

EXHIBIT I – SIGNIFICANT DEFICIENCY
Information Technology (IT) Access and Configuration Management Controls Need Improvement
Our fiscal year 2015 IT assessment, using Government Accountability Office’s (GAO’s) Federal Information
System Controls Audit Manual (FISCAM), was focused on the IT general controls over USPTO’s major financial
management systems and supporting infrastructure. The IT general controls that we considered collectively to be
a significant deficiency under the standards issued by the American Institute of Certified Public Accountants are
as follows:
Access controls. In close concert with an organization’s entity-wide information security program, access controls
for general support systems and applications should provide reasonable assurance that computer resources, such
as data files, application programs, and computer-related facilities and equipment are protected against
unauthorized modification, disclosure, or loss. Access controls are facilitated by an organization’s entity-wide
security program. Such controls include physical controls, such as keeping computers in locked rooms to limit
physical access, and logical controls, such as security software programs designed to prevent or detect unauthorized
access to data. Similar to security management, inadequate access controls diminish the reliability and integrity of
computerized data and increase the risk of destruction or inappropriate disclosure of information.
The objectives of limiting access are to ensure that users have only the access needed to perform their duties; that
access to sensitive resources, such as security software programs and source code, is limited to few individuals;
and that employees are restricted from performing incompatible functions or duties beyond their responsibility.
This is reiterated by Federal guidelines. The OMB Circular No. A-130, Management of Federal Information
Resources and supporting National Institute of Standards and Technology publications provide guidance related to
the maintenance of technical access controls. In addition, the Commerce IT Security Program Policy contains
requirements for operating Commerce IT devices in a secure manner.
During fiscal year 2015, we noted that access controls should be improved, through enhanced policies and
procedures by the USPTO, primarily in the areas of: (1) improving application, database and operating system
password controls, (2) strengthening access administration controls to the network and financial applications, and
(3) restricting logical access to financially significant source code. We recognize that the USPTO has certain
compensating controls in place to help reduce the risk of the identified weaknesses, and we have considered such
compensating controls as part of our USPTO financial statement audit.
Configuration management. Configuration management involves the identification and management of security
features for all hardware, software, and firmware components of an information system at a given point and
systematically controls configuration changes throughout the system’s life cycle. Configuration settings and the
related configuration management is a key component of many IT systems to ensure that hardware, software and
firmware programs, and program modifications are properly authorized, tested, and approved, and that access to
and distribution of programs is carefully controlled. Configuration settings may affect the design, implementation
and operating effectiveness of application controls, and may be subject to change control procedures to maintain
the integrity of the application controls. Without proper controls, there is a risk that security features could be
inadvertently or deliberately omitted or turned off, or that processing irregularities or malicious code could be
introduced into the IT environment.

EXHIBIT I – SIGNIFICANT DEFICIENCY, CONTINUED
During fiscal year 2015, we noted that configuration management controls should be improved through enhanced
policies and procedures to address the configuration and patch management weaknesses identified. We recognize
that the USPTO has certain compensating controls in place to help reduce the risk of the identified weaknesses,
and we have considered such compensating controls as part of our USPTO financial statement audit.
Recommendations
We provided USPTO management with specific recommendations to improve its general IT controls related to
financial systems in a separate limited distribution general IT controls report, issued as part of the fiscal year 2015
consolidated financial statement audit. USPTO management should monitor actions to ensure effective
implementation of our recommendations.
Management’s Response
In general, we agreed with the auditors’ findings, conclusions, and recommendations related to improving the
USPTO’s financial management systems controls. The USPTO is in the process of developing corrective action
plans to address the recommendations presented in the separate limited distribution IT general controls report.

PERFORMANCE AND ACCOUNTABILITY REPORT
166
OTHERINFORMATION
Unaudited, please see the accompanying auditors’ report.

www.uspto.gov
167
For the years ended September 30, 2015 and 2014(Dollars in Thousands)
2015 2014
What Money is Available to Spend?
This section presents resources that were available to spend by the USPTO.
Total Resources $ 3,680,438 $ 3,648,414
Less Amount Not Agreed to be Spent 504,284 650,957
Less Amount Not Available to be Spent 69 -
Total Amounts Agreed to be Spent $ 3,176,085 $ 2,997,457
How was the Money Spent?
This section presents services or items purchased; the items in this section align to OMB budget object class definitions found in OMB Circular No. A-11.
Personnel Compensation and Benefits $ 2,015,302 $ 1,875,483
Travel 6,501 4,704
Rent, Communication, and Utilities 128,197 128,313
Printing 134,626 146,886
Contractual Services 594,102 598,564
Supplies 41,197 40,339
Equipment 252,468 200,128
Land, Building, and Structures 538 898
Other 3,154 2,142
Total Amounts Agreed to be Spent $ 3,176,085 $ 2,997,457
Who did the Money go to?
This section presents with whom the USPTO is spending money.
Federal Government $ 215,858 $ 226,502
Non-Federal 2,960,227 2,770,955
Total Amounts Agreed to be Spent $ 3,176,085 $ 2,997,457
Combined Schedule of Spending
The Schedule of Spending provides an overview of how and where the USPTO is spending money. The Schedule of Spending presents amounts agreed to be spent for the current year, how the money was spent, and who received the money. The Schedule of Spending is presented on a budgetary basis, the same as the Statement of Budgetary Resources. The Total Amounts Agreed to be Spent lines agree with Obligations Incurred during the current year, as presented on the Statement of Budgetary Resources.

PERFORMANCE AND ACCOUNTABILITY REPORT
168
Inspector General’s Top Management Challenges Facing the USPTO
The full report can be found at www.oig.doc.gov.

www.uspto.gov
169
Summary of Financial Statement Audit & Management Assurances
TABLE 1. SUMMARY OF FINANCIAL STATEMENT AUDITAudit Opinion UnmodifiedRestatement No
Material Weaknesses Beginning Balance
New Resolved Consolidated Ending Balance
NONE 0 0 N/A N/A 0
Total Material Weaknesses 0 0 N/A N/A 0
TABLE 2. SUMMARY OF MANAGEMENT ASSURANCESEffectiveness of Internal Control over Financial Reporting (FMFIA §2)
Effectiveness of Internal Control over Operations (FMFIA §2)
Conformance with Financial Management System Requirements (FMFIA §4)
Statement of Assurance Unqualified
Material Weaknesses Beginning Balance New Resolved Consolidated Reassessed Ending BalanceNONE 0 0 N/A N/A N/A 0
Total Material Weaknesses 0 0 N/A N/A N/A 0
Statement of Assurance Unqualified
Material Weaknesses Beginning Balance New Resolved Consolidated Reassessed Ending BalanceNONE 0 0 N/A N/A N/A 0
Total Material Weaknesses 0 0 N/A N/A N/A 0
Compliance with Federal Financial Management Improvement Act (FFMIA)
Statement of Assurance Systems conform to financial management system requirements
Non-Conformances Beginning Balance New Resolved Consolidated Reassessed Ending BalanceNONE 0 0 N/A N/A N/A 0
Total Non-Conformances 0 0 N/A N/A N/A 0
Agency AuditorOverall Substantial Compliance Yes Yes
1. System Requirements Yes Yes
2. Accounting Standards Yes Yes
3. USSGL at Transaction Level Yes Yes
N/A - Not Applicable

PERFORMANCE AND ACCOUNTABILITY REPORT
170
Improper Payments Information Act (IPIA) of 2002, as AmendedThe IPIA of 2002, as amended by the Improper Payments Elimination and Recovery Act (IPERA) of 2010 and Improper Payments Elimination and Recovery Improvement Act (IPERIA) of 2012, requires agencies to periodically review all programs and activities and identify those that may be susceptible to significant improper payments, take multiple actions when programs and activities are identified as susceptible to significant improper payments, and annually report information on their improper payments monitoring and minimization efforts. OMB Circular A-123, Management’s Responsibility for Internal Control, Appendix C, Requirements for Effective Measurement and Remediation of Improper Payments, provides guidance to agencies to comply with IPIA, as amended, and for agency improper payments efforts. The USPTO has not identified any programs or activities susceptible to significant improper payments or any significant problems with improper payments.
The USPTO recognizes the importance of maintaining adequate internal controls to ensure the accuracy and integrity of payments made by the agency, and the USPTO maintains a strong commitment to continuous improvement in the overall disbursement management process. For FY 2015 and beyond, the USPTO will continue its efforts to ensure the integrity of its disbursements.
Risk AssessmentA review of all programs and activities that the USPTO administers is performed every three years to assist in identifying, reporting, and/or preventing erroneous or improper payments. This review was last completed in FY 2014.
The USPTO annually conducts an assessment of the effectiveness of internal control over financial reporting, in compliance with OMB Circular A-123, Management’s Responsibility for Internal Control. Furthermore, every three years, the assessment includes a review of internal controls over disbursement processes. The most recent review performed in FY 2013 indicated that current internal controls over disbursement processes were sound.
The USPTO completes an annual improper payments risk assessment covering all of its programs/activities as required by OMB Circular A-123, Appendix C. These improper payments risk assessments of the entity’s programs/activities also include assessments of the control and procurement environment. The improper payments program/activity risk assessment has revealed no risk-susceptible programs.
The results of the USPTO assessments revealed no risk-susceptible programs, and demonstrated that, overall, the USPTO has strong internal

www.uspto.gov
171
controls over disbursement processes, the amount of improper payments by the USPTO is immaterial, and the risk of improper payments is low.
Statistical SamplingAs the USPTO does not have any programs or activities that are susceptible to significant improper payments, a statistical sampling process has not been conducted to estimate the improper payment rate for USPTO programs and activities.
Improper Payments Reporting, Root Causes, and Corrective ActionsDuring FY 2015, the improper payments for all USPTO programs and activities amounted to $0.38 million, or 0.01 percent of total outlays. As the USPTO does not have any programs or activities that are susceptible to significant improper payments, an improper payment reduction outlook, root cause analyses, and corrective actions are not presented for USPTO programs and activities.
AccountabilityThe USPTO has not identified any significant problems with improper payments. During FY 2015, the improper payments for all USPTO programs and activities did not exceed the statutory thresholds for increased reporting. The USPTO recognizes the importance of maintaining adequate internal controls to ensure proper payments, and its commitment to continuous improvement in disbursement management processes remains very strong. The USPTO’s Chief Financial Officer (CFO) has responsibility for establishing policies and procedures for assessing USPTO and program risks of improper payments, taking actions to reduce improper payments, and reporting the results of the actions to management for oversight and other actions as deemed appropriate. The CFO has designated the Deputy CFO to oversee initiatives related to reducing improper payments within the USPTO.
Recaptures of Improper Payments Payment Recapture AuditsThe USPTO does not currently conduct recapture audits, as prior recapture audit activity did not yield any meaningful results. As recapture audits were deemed not cost effective for the USPTO, payment recapture rates, disposition of recaptured funds, and aging of outstanding overpayments are not presented for USPTO programs and activities.
Overpayments Recaptured Outside of Payment Recapture AuditsThe following table summarizes the USPTO’s overpayments identified, and overpayments verified as recaptured, through sources other than payment recapture audits that are reportable in the current fiscal year and that was reported in prior fiscal years. Prior fiscal years’ amounts represent amounts reported for FY 2011 through FY 2014, as FY 2011 was the first fiscal year for this reporting requirement. Amounts recaptured for current year reporting includes payment recaptures during FY 2015 of both improper payments reported in FY 2015 and improper payments previously reported in prior fiscal years.

PERFORMANCE AND ACCOUNTABILITY REPORT
172
Overpayments Recaptured Outside of Recapture Audits (Dollars in Millions)
Source of Overpayments
Current Year (CY) Prior Years (PY) Cumulative (CY + PY)Amounts Identified
for Payment Recapture
Amounts Recaptured
Amounts Identified
for Payment Recapture
Amounts Recaptured
Cumulative Amounts
Identified for Recapture
Cumulative Amounts
Recaptured
Post-payment reviews
$ 0.10 $ - $ 1.49 $ 1.49 $ 1.59 $ 1.49
Audits and other reviews
0.03 - - - 0.03 -
Reported by vendors
0.08 0.08 4.74 4.74 4.82 4.82
Total $ 0. 21 $ 0.08 $ 6.23 $ 6.23 $ 6.44 $ 6.31
The USPTO continues to enhance its processes and identify and implement additional procedures to prevent and detect improper payments. In FY 2015, the USPTO continued its reporting procedures to senior management and to the Department of Commerce on improper payments and payment recaptures data, identifying the nature and magnitude of any improper payments, along with any necessary control enhancements to prevent further occurrences of the types of improper payments identified. The USPTO’s analysis of the data reported reflects that improper payments were below one-fifth of one percent in FY 2015 and FY 2014. The USPTO has additionally reviewed all financial statement audit comments and results of other payment reviews for indications of breaches of disbursement controls. None of these audit comments or reviews have uncovered any significant problems with improper payments or the internal controls that surround disbursements.
The USPTO has improper payments monitoring and minimization efforts in place, including the identification of improper payments through post-payment reviews and contract closeout reviews. The USPTO seeks to identify overpayments and erroneous payments by reviewing (1) credit memos and refund checks issued by vendors or customers and (2) undelivered electronic payments returned by financial institutions. In addition, the USPTO has implemented process improvements to minimize erroneous payments resulting from vendor payment assignments, which has historically been the source of the larger improper payments. A master file is now being kept for all assignments and is being sent to all payment technicians and approvers. Technicians and approvers are also reminded periodically to monitor assignments.

www.uspto.gov
173
Agency Reduction of Improper Payments with the Do Not Pay InitiativeDuring FY 2013, the USPTO implemented a periodic vendor record eligibility validation process using Do Not Pay Initiative databases to prevent improper payments. This process is ongoing with no significant impact. In addition, the USPTO has incorporated the following IPERIA listed Do Not Pay databases into existing business processes and programs:
1. The Death Master File of the Social Security Administration, and 2. GSA’s Excluded Parties List System/System for Award Management.
The USPTO has implemented a monthly batch process post-payment screening of an applicable subset of payments to identify any improper payments and to take any appropriate recovery or corrective and preventative actions. The USPTO has also implemented continuous monitoring of an applicable subset of active vendor records to ensure that vendors are not subject to payment and procurement restrictions. Results are used to better maintain or vendor records to reduce or prevent improper payments and awards. During FY 2015, the validation processes using the Do Not Pay Initiative databases have not resulted in the identification or reduction of any improper payments or awards.
Results of the Do Not Pay Initiative in Preventing Improper Payments ($ in millions)
Number (#) of payments
reviewed for possible
improper payments
Dollars ($) of payments
reviewed for possible
improper payments
Number (#) of payments
stopped
Dollars ($) of payments
stopped
Number (#) of potential
improper payments
reviewed and determined
accurate
Dollars ($) of potential
improper payments
reviewed and determined
accurateReviews with the IPERIA specified databases
22,613 $900.20 0 $0 28 $0.01
Reviews with databases not listed in IPERIA
Not applicable Not applicable Not applicable Not applicable Not applicable Not applicable

PERFORMANCE AND ACCOUNTABILITY REPORT
174
Freeze the Footprint
The USPTO continues to grow in employee counts, with an increase of 1,053 employees since the FY 2012 baseline. The USPTO is in the process of restacking and reconfiguring spaces within the existing square footage to accommodate employees. Further, the Leahy-Smith America Invents Act (AIA), signed on September 16, 2011, required the USPTO to establish at least three satellite offices. The first permanent office opened in Detroit in FY 2012 and now houses 131 patent examiners and Patent Trial and Appeal Board judges. The second permanent office opened in Denver in FY 2014 and houses 102 patent examiners and judges. The USPTO established temporary offices in FY 2013 to house administrative judges in Silicon Valley, California and Dallas, Texas. The California office opened in October 2015 and the Texas office in November 2015. Patent examiner and administrative patent judge hires will progress in those offices through FY 2016. The temporary sites will be released once the moves to the final sites have occurred.
Freeze the Footprint Baseline Comparison
FY 2012Baseline
FY 2013 (Change from
FY 2012 Baseline)
FY 2014 (Change from
FY 2012 Baseline)
FY 2015 (Change from
FY 2012 Baseline)
(square footage (SF) in millions)
3.119 3.140(20,423 RSF increase
from FY 2012)
3.176(56,678 RSF increase
from FY 2012)
3.180(61,462 RSF increase
from FY 2012)
Reporting of Operations and Maintenance Costs—Direct Lease Buildings
FY 2012Reported Cost
FY 2013 (Change from
FY 2012 Baseline)
FY 2014 (Change from
FY 2012 Baseline)
FY 2015 (Change from
FY 2012 Baseline)
(dollars in millions)
$0.4 $0.3($0.1 million decrease
from FY 2012)
$0.4($0.0 million increase
from FY 2012)
$0.4($0.0 million increase
from FY 2012)
www.uspto.gov
175
Civil Monetary Penalty Act
The Federal Civil Penalties Inflation Adjustment Act of 1990, as amended, requires agencies to make regular and consistent inflationary adjustments of civil monetary penalties to maintain their deterrent effect. There were no civil monetary penalties assessed by the USPTO during FY 2015.
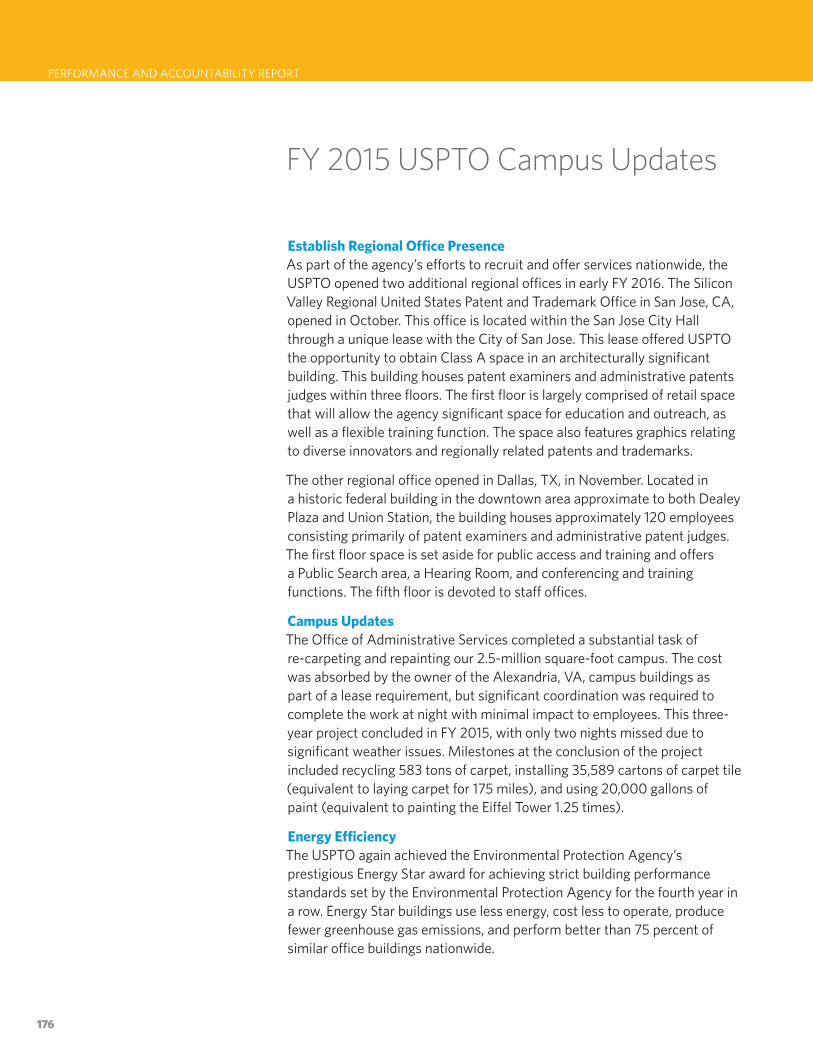
PERFORMANCE AND ACCOUNTABILITY REPORT
176
FY 2015 USPTO Campus Updates
Establish Regional Office Presence As part of the agency’s efforts to recruit and offer services nationwide, the USPTO opened two additional regional offices in early FY 2016. The Silicon Valley Regional United States Patent and Trademark Office in San Jose, CA, opened in October. This office is located within the San Jose City Hall through a unique lease with the City of San Jose. This lease offered USPTO the opportunity to obtain Class A space in an architecturally significant building. This building houses patent examiners and administrative patents judges within three floors. The first floor is largely comprised of retail space that will allow the agency significant space for education and outreach, as well as a flexible training function. The space also features graphics relating to diverse innovators and regionally related patents and trademarks.
The other regional office opened in Dallas, TX, in November. Located in a historic federal building in the downtown area approximate to both Dealey Plaza and Union Station, the building houses approximately 120 employees consisting primarily of patent examiners and administrative patent judges. The first floor space is set aside for public access and training and offers a Public Search area, a Hearing Room, and conferencing and training functions. The fifth floor is devoted to staff offices.
Campus UpdatesThe Office of Administrative Services completed a substantial task of re-carpeting and repainting our 2.5-million square-foot campus. The cost was absorbed by the owner of the Alexandria, VA, campus buildings as part of a lease requirement, but significant coordination was required to complete the work at night with minimal impact to employees. This three-year project concluded in FY 2015, with only two nights missed due to significant weather issues. Milestones at the conclusion of the project included recycling 583 tons of carpet, installing 35,589 cartons of carpet tile (equivalent to laying carpet for 175 miles), and using 20,000 gallons of paint (equivalent to painting the Eiffel Tower 1.25 times).
Energy EfficiencyThe USPTO again achieved the Environmental Protection Agency’s prestigious Energy Star award for achieving strict building performance standards set by the Environmental Protection Agency for the fourth year in a row. Energy Star buildings use less energy, cost less to operate, produce fewer greenhouse gas emissions, and perform better than 75 percent of similar office buildings nationwide.

www.uspto.gov
177
The USPTO engaged in a number of projects to promote energy efficiency. One such notable project was to replace over 1,150 metal halide light fixtures within the two parking garages with LED bulbs. This replacement garnered a significant savings on monthly utility bills as well as a substantial credit of $266,000 from the local utility company.
Safe, Secure, and Well-Maintained Workplace The Office of Security successfully held its second agency-wide Active Shooter Drill. The drill was sent to all employees’ desktop computers via the USPTO’s emergency notification system and alerted agency personnel to imagine an active-shooter-based scenario in order for them to take time to determine appropriate actions based on available options.
Based on the Office of Personnel Management’s 2014 Employee Viewpoint Survey of more than 700,000 federal employees, the USPTO exceeded government-wide ratings in the areas of security, health, and safety. Over 88 percent of USPTO employees believe that they are sufficiently protected from health and safety hazards on the job versus the government-wide average response of 76 percent, and over 92 percent of USPTO employees believe that the agency has prepared them for potential security threats versus the government-wide average response of 76 percent.
On a similar positive note, survey results indicate that the USPTO exceeded government-wide ratings with respect to a number of workplace conditions, involving lighting, noise level, cleanliness, etc. More specifically, 87 percent of USPTO employees believe that workplace conditions allow them to perform their jobs well versus the government-wide response of 65 percent.

PERFORMANCE AND ACCOUNTABILITY REPORT
178
TheNatureoftheTrainingProvidedto USPTO ExaminersAchieving organizational excellence demands a high-performing workforce that delivers high quality work products and provides customer service excellence. Training is a critical component in achieving consistently high quality products and services. Patent examiners and trademark examining attorneys received extensive legal, technical, and information technology systems training in FY 2015. The USPTO has a comprehensive training program for new patent examiners and trademark examining attorneys, with a well-established curriculum including initial legal training, systems training, and training in examination practice and procedure. Systems training is provided to all examiners as new IT systems are deployed and existing systems are enhanced. New technology-specific legal and technical training was conducted throughout the examining operations. This specific training either focuses on practices particular to a technology or was developed to address training needs identified through patent and trademark examination reviews, focus group feedback or staff requests.
The USPTO training staff works with the Patent and Trademark organizations to address specific training concerns and serve as consultants to design specific internal programs to fit the education needs of each business unit. Training is reviewed and evaluated on an ongoing basis to ensure it is up-to-date and that coursework reflects developments and changes that have taken place in the industry.
This training provides examiners with a working knowledge of the reforms under the America Invents Act. The training covers several new statutory provisions of patent law including first-inventor-to-file, pre-issuance submissions, supplemental examination, and inventor’s oath and declaration. The first-inventor-to-file in person or WebEx training was delivered in three phases: (i) introductory overview training with videos, (ii) comprehensive training session with videos, and (iii) a hands-on workshop designed to introduce examiners to situations that may arise in prosecution. A computer-based training library also was developed to cover more nuanced first-inventor-to-file specific topics not covered in the live/WebEx sessions along with a specialized internal website housing lecture materials, slides, and frequently asked questions. For the other provisions of law, computer-based training is available.

www.uspto.gov
179
PATENT EXAMINER TRAINING
U.S. Patent Training in the Academy Training Academy Two patent examiner training programs: Intellectual Property Experienced Examiner Training and an Entry Level Training, a two-phased program completed in 12 months. – Mandatory training
for first year patent • IntellectualPropertyExperiencedExaminerTrainingCurriculum examiners This curriculum includes enhanced instruction in legal, procedural, and automation training, in
areas such as: more than a dozen specialized applications used in patent examination, multiple search systems, databases, and commonly used office applications such as: USPC and CPC Classification Systems, Searching (classification, text), Claim Interpretation, Advanced Text Searching, Technology Center (TC) Specific tools such as STN and Dialog, Writing an Effective Examiner’s Answer, Appeal Procedure, and Practice (Appeal Conference and Pre-Conference; Prevent Administrative Remand).
• EntryLevelTwo-Phased12-MonthNewExaminerTrainingCurriculum
The legal and procedural training of this curriculum includes enhanced instruction in areas such as: USPC and CPC Classification Systems, Searching (classification, text), Claim Interpretation, Advanced Text Searching, Writing an Effective Examiner’s Answer, Appeal Procedure, and Practice (Appeal Conference and Pre-Conference; Prevent Administrative Remand).
Technical training includes: Introduction to examining applications in specific areas of technology, the current state of specific technologies, ongoing technology topics, etc.
Automation training includes classes in more than a dozen specialized applications used in patent examination, multiple search systems, databases, and commonly-used office applications.
Life skills training includes: time management, ethics training, stress management, balancing quality and production, professionalism, benefits and financial planning basics, balancing work and personal life, diversity training, and negotiating conflict.
• IndividualDevelopmentPlanThe Academy training program includes creating an Individual Development Plan (IDP) for each examiner. The IDP is composed of formal training courses, development assignments, and on-the-job training. The IDP is designed to assist the examiner from day one, through the first 12 months of employment. When the examiner graduates from the Academy, and is transferred to a TC, the IDP will continue to enable the examiner to acquire the competencies essential to perform as-signed duties and to prepare for further development.
Programs for all Legal Practice and Procedure Training Patent Examiners
• PatentExaminerRefresherTrainingCourses developed to enhance patent examiners’ knowledge and skills in procedural and legal topics pertaining to patent examination. Participants may enroll in one or more courses in consul-tation with their supervisor.
• AdvancedPatentExaminerTrainingThis is a program for examiners who have several years of patent examining experience. The program provides training in specific legal areas such as unexpected results and actual reduction to practice found in affidavit practice.

PERFORMANCE AND ACCOUNTABILITY REPORT
180
PATENT EXAMINER TRAINING
• PatentCorpsExaminationTraining: Patent Corps Examination Training is training on patent examination policy, practice, and procedures, including legal lectures, for examiners at any grade or level of experience.
• In-HousePatentLawandEvidenceCourseTraining for Patent examiners on authoritative court decisions on statutory issues under 35 U.S.C. §§ 101, 102, 103, and 112 and the handling of evidence during the examination of applications.
• PatentExaminerTechnicalTrainingProgram(PETTP)PETTP is one of seven Executive Actions and is aimed at encouraging innovation and strengthening the quality and accessibility of the patent system. Scientists, engineers, professors, industrial designers, and other technology experts volunteer to share their expertise with patent examiners within a learning environment. Presentations discuss advances in state of the art, emerging trends, and recent innovations in their fields. Courses offered in the past have covered topics such as cloud computing, green technologies, and nanotechnologies from participants such as Boeing, Duke University, and Toyota. Technology experts from outside USPTO who have value-added expertise teach these courses.
• SiteExperienceEducation(SEE)ProgramExperience technology at its source. This unique program provides opportunities for groups of examiners to visit sites of innovation within the continental U.S. to get updates on current and emerging technologies and see technology first-hand. Past visits have included Boeing, Google, IBM, Intel, NASA, Samsung, Syngenta Biotechnology, University of Texas at Austin, and Yahoo. Visits are bundled so examiners can compare and contrast experiences at multiple sites.
• ContinuingEducationSeriesTraining for patent examiners to enhance their technical and legal knowledge in the examination of patent applications.
Courses Offered:• Non-DutyHoursLegalStudiesProgram(BudgetDependent)• Non-DutyHoursTechnicalTrainingProgram(BudgetDependent)• UpdatedAutomationToolsTraining(incoordinationwithOfficeofPatentInformation Management) • PatentAdministrativeProfessionalTraining• PatentExaminationforNon-Examiners• LegalSecretariesandAdministratorsConference

www.uspto.gov
181
TRADEMARK EXAMINING ATTORNEY TRAINING
Trademarks trains newly hired Examining Attorneys in a classroom setting during their first 7-8 weeks at the USPTO. The classroom trainers are from our Office of Quality and Training. At the end of classroom training each Examining Attorney is integrated into their assigned Law Office where s/he is mentored by the Senior Attorney of that Law Office who also has other management responsibilities. Each Law Office typically would receive 1 to 3 new Attorneys at a time. Law Offices consist of about 25 Attorneys at various grade levels (GS 11-14) with the majority of the GS 13 and 14 Attorneys working full time at home and all of the GS 11s and 12s working the majority of time at headquarters. In the past fiscal year, a total of 43 Examining Attorneys were hired in two groups with the first group assigned to several Law Offices and second group to a single Law Office made up of all new hires.
In FY 2014 the Trademark organization prepared, using data gathered from the results of quality reviews that were analyzed, the content of online e-learning training materials for trademark examining attorneys. Live and web cast Training Sessions and Modules were developed and released covering the following list of topics.
• TMEP October 2013 Update Overview• New USPTO Ethics Rules • Examiner-Led 2(f) Workshop• INTA Industry Training—Big Data• INTA/USPTO Seminar Trademark Counterfeiting• INTA/USPTO Seminar on Right of Publicity• Recent Developments in Trademark Law• TEALE—New Examining Attorney Training• I.T. Services in the Real World • Trade Dress Training • OPIA International Hot Topics • Review of TM Legal Resources for Evidence Gathering
Law Office Presentations and Computer-Based Training Modules were developed and released covering the following list of topics.• ID Crafting Bootcamp• Madrid Training
One Exam Guide published:• Exam Guide on Specimens for Services (August 2014)
Other Guidance covering the following topics was also released.• Four issues of guidance newsletter (Two Quick Reminders)
PERFORMANCE AND ACCOUNTABILITY REPORT
182
TRADEMARK TRAINING LAW OFFICE PILOT
This year Trademarks piloted a new way to onboard and train one class of 23 new Examining Attorneys. Our objectives are to provide a new employee experience that promotes engagement, camaraderie, more consistent training among the class, more “real world” work experience earlier in the process, and a deeper understanding of examination and Trademark law earlier in the process. The new Law Office was established with an experienced Manager and outstanding Examining Attorney volunteers to act as mentors; spending most of their in that capacity. We will be studying the impact of this new approach throughout FY 2016. Our plans are to add another class to be similarly trained in FY 2016 to evaluate the results of this pilot.
Manager/mentor participation in TEALE• Immediate feedback/correction for presentations• Ongoing, real-time evaluation of employees• Unified message regarding how examination should be performed• Stronger manager/employee engagement
Elimination of tests/studying/fake files• Shorter classroom training - on production faster• Teach to the job, not the test
Shortened presentations• Less stress on attention spans• Wider variety of activities over course of a day
Daily real-file examination• Increased sense of responsibility• Less classroom burnout• Better chance of immediately applying lessons learned• Wider variety of topics covered
Daily case chats• Deeper understanding of how presentations apply to real-life topics• Mental “warm up” for day’s activities• Provides sense of how managers approach different situations• Introduction to gray areas of decision-making• Discussion with peers builds a sense of community

www.uspto.gov
183
FY 2015 USPTO Workload Tables
INDEX OF TABLESTable 1 Summary of Patent Examining Activities (FY 2011–FY 2015) (Preliminary for FY 2015)Table 2 Patent Applications Filed (FY 1995–FY 2015) (Preliminary for FY 2015)Table 3 Patent Applications Pending Prior to Allowance (FY 1995–FY 2015)Table 4 Patent Pendency Statistics (FY 2015)Table 5 Summary of Total Pending Patent Applications (FY 2015)Table 6 Patents Issued (FY 1995–FY 2015)Table 7 Patent Applications Filed by Residents of the United States (FY 2011–FY 2015)Table 8 Patents Issued to Residents of the United States (FY 2014–FY 2015)Table 9 United States Patent Applications Filed by Residents of Foreign Countries (FY 2011–FY 2015)Table 10 Patents Issued by the United States to Residents of Foreign Countries (FY 2011–FY 2015)Table 11 Utility Patents Issued to Small Entities (FY 2011–FY 2015)Table 12 Statutory Invention Registrations Published (FY 2011–FY 2015)Table 13 United States Government Agency Patents (FY 2011–FY 2015)Table 14a Ex Parte Reexamination (FY 2011–FY 2015)Table 14b Supplemental Examination (SE) (FY 2011–FY 2015)Table 15 Summary of Contested Patent Cases (Within the USPTO, as of September 30, 2015)Table 16 Summary of Trademark Examining Activities (FY 2011–FY 2015)Table 17 Trademark Applications Filed for Registration and Renewal and Trademark Affidavits Filed (FY 1995–FY 2015)Table 18 Summary of Pending Trademark Applications (FY 2015)Table 19 Trademarks Registered, Renewed, and Published Under Section 12(C) (FY 1995–FY 2015)Table 20 Trademark Applications Filed by Residents of the United States (FY 2015)Table 21 Trademarks Registered to Residents of the United States (FY 2015)Table 22 Trademark Applications Filed by Residents of Foreign Countries (FY 2011–FY 2015)Table 23 Trademarks Registered to Residents of Foreign Countries (FY 2011–FY 2015)Table 24 Summary of Contested Trademark Cases (Within the USPTO, as of September 30, 2015)Table 25 Actions on Petitions to the Director of the U.S. Patent and Trademark Office (FY 2011–FY 2015)Table 26 Cases in Litigation (Selected Courts of the United States, as of September 30, 2015)Table 27 Patent Classification Activity (FY 2011–FY 2015)Table 28 Scientific and Technical Information Center Activity (FY 2015)Table 29 End of Year Personnel (FY 2011–FY 2015)Table 30a Top 50 Trademark Applicants (FY 2015)Table 30b Top 50 Trademark Registrants (FY 2015)

PERFORMANCE AND ACCOUNTABILITY REPORT
184
TABLE 1: Summary of Patent Examining Activities (FY 2011–FY 2015) (Preliminary for FY 2015)1
Patent Examining Activity 2011 2012 2013 2014 2015
Applications filed, total1,2 537,171 565,566 601,464 618,457 617,216Utility3 504,663 530,915 564,007 579,873 578,321Reissue 1,158 1,212 1,074 1,207 887Plant 1,103 1,181 1,318 1,123 1,119Design 30,247 32,258 35,065 36,254 36,889
Provisional applications filed2,4 150,187 163,031 177,942 169,173 170,676First actions
Design 25,042 26,578 27,669 28,341 33,549Utility, Plant, and Reissue 505,651 542,081 595,110 578,352 632,337PCT/Chapter 13,297 18,400 15,060 19,787 22,193
Patent application disposals, total 533,943 574,854 605,994 637,263 641,665Allowed patent applications, total 266,580 305,840 334,560 346,909 353,700
Design 22,683 24,231 24,967 24,695 28,663Utility, Plant, and Reissue 243,897 281,609 309,593 322,214 325,037
Abandoned, total 267,353 269,009 271,424 290,354 287,965Design 2,701 2,567 2,705 2,828 3,725Utility, Plant, and Reissue 264,652 266,442 268,719 287,526 284,240
Statutory invention registration disposals, total 10 5 10 - -
PCT/Chapter II examinations completed 3,191 2,671 2,016 1,450 1,655Applications published5 321,115 328,620 339,775 382,056 362,536Patents issued2,6 244,430 270,258 290,083 329,612 322,448
Utility 221,350 246,464 265,979 303,930 295,459Reissue 969 921 809 661 531Plant 816 920 842 1,013 1,020Design 21,295 21,953 22,453 24,008 25,438
Pendency time of average patent application7 33.7 32.4 29.1 27.4 26.6Reexamination certificates issued 909 893 819 790 764PCT international applications received by USPTO as receiving office
48,285 52,417 56,226 62,697 56,480
National requirements received by USPTO as designated/elected office
65,463 67,573 73,488 78,213 85,387
Patents renewed under Public Law (Pub. L. No.) 102–2048
378,830 308,812 348,658 419,563 401,647
Patents expired under Pub. L. No. 102–2048 82,146 80,050 79,689 89,523 98,283
- Represents zero. 1 FY 2015 filing data are preliminary and will be finalized in the FY 2016 PAR. 2 FY 2014 application data has been updated with final end of year numbers. 3 Utility patents include chemical, electrical and mechanical applications. 4 Provisional applications provided for in Pub. L. No. 103–465. 5 Eighteen-month publication of patent applications provided for the American Inventors Protection Act of 1999, Pub. L. No. 106–113. 6 Excludes withdrawn numbers. Past years' data may have been revised from prior year reports. 7 Average time (in months) between filing and issuance or abandonment of utility, plant, and reissue applications. This average does not include design patents. 8 The provisions of Pub. L. No. 102–204 regarding the renewal of patents superseded Pub. L. No. 96–517 and Pub. L. No. 97–247.

www.uspto.gov
185
TABLE 2: Patent Applications Filed (FY 1995–FY 2015) (Preliminary for FY 2015)1
Year Utility Design Plant Reissue Total1995 220,141 15,375 516 647 236,679 1996 189,922 15,160 557 637 206,276 1997 219,486 16,272 680 607 237,045 1998 238,850 16,576 658 582 256,666 1999 259,618 17,227 759 664 278,268 2000 291,653 18,563 786 805 311,807 2001 324,211 18,636 914 956 344,717 2002 331,580 19,706 1,134 974 353,394 2003 331,729 21,966 785 938 355,418 2004 353,319 23,457 1,212 996 378,984 2005 381,797 25,304 1,288 1,143 409,532 2006 417,453 25,853 1,204 1,103 445,613 2007 439,578 26,693 1,002 1,057 468,330 2008 466,258 28,217 1,331 1,080 496,886 2009 458,901 25,575 988 1,035 486,499 2010 479,332 28,577 1,013 1,138 510,060 2011 504,663 30,247 1,103 1,158 537,171 2012 530,915 32,258 1,181 1,212 565,566 2013 564,007 35,065 1,318 1,074 601,464 2014 579,873 36,254 1,123 1,207 618,4572015 578,321 36,889 1,119 887 617,216
1 FY 2015 data are preliminary and will be finalized in the FY 2016 PAR.

PERFORMANCE AND ACCOUNTABILITY REPORT
186
TABLE 3: Patent Applications Pending Prior to Allowance1 (FY 1995–FY 2015)Year Awaiting Action by Examiner Total Applications Pending2
1995 124,275 298,5221996 139,943 303,7201997 112,430 275,2951998 224,446 379,4841999 243,207 414,8372000 308,056 485,1292001 355,779 542,0072002 433,691 636,5302003 471,382 674,6912004 528,685 756,6042005 611,114 885,0022006 701,147 1,003,8842007 760,924 1 ,112,5172008 771,529 1,208,0762009 735,961 1,207,7942010 726,331 1 ,163,7512011 690,967 1,168,9282012 633,812 1 ,157,1472013 616,409 1,148,8232014 642,949 1,127,701 2015 592,417 1,099,468
1 Includes patent applications pending at end of period indicated, and includes utility, reissue, plant, and design applications. Does not include allowed applications.
2 Applications under examination, including those in preexamination processing.
TABLE 4: Patent Pendency Statistics (FY 2015)
UPR Pendency Statistics by Technology Center (in months)Average First
Action PendencyTotal Average
Pendency
Total UPR Pendency 17.3 26.6Tech Center 1600—Biotechnology and Organic Chemistry 14.1 25.3 Tech Center 1700—Chemical and Materials Engineering 18.9 29.1 Tech Center 2100—Computer Architecture, Software, and Information Security 20.5 31.1Tech Center 2400—Networks, Multiplexing, Cable, and Security 18.6 29.6 Tech Center 2600—Communications 15.5 26.6Tech Center 2800—Semiconductor, Electrical, Optical Systems, and Components 15.5 25.3 Tech Center 3600—Transportation, Construction, Agriculture, and Electronic Commerce 16.3 25.8 Tech Center 3700—Mechanical Engineering, Manufacturing, and Products 20.4 30.8

www.uspto.gov
187
TABLE 5: Summary of Total Pending Patent Applications (FY 2015)
Stage of ProcessingUtility, Plant, and
Reissue ApplicationsDesign
ApplicationsTotal Patent Applications
Pending patent applications, total 1,147,595 56,180 1,203,775In preexamination processing, total 140,517 2,051 142,568Under examination, total 910,495 45,970 956,465
Undocketed 36,746 7,034 43,780Awaiting first action by examiner 375,958 30,111 406,069 Subtotal applications awaiting first action by examiner3 553,221 39,196 592,417RCE awaiting first action 26,901 - 26,901 Rejected, awaiting response by applicant 342,567 7,293 349,860Amended, awaiting action by examiner 87,724 1,358 89,082 In interference 61 - 61 On appeal, and other1 40,538 174 40,712
In postexamination processing, total 96,583 8,159 104,742Awaiting issue fee 78,125 6,925 85,050 Awaiting printing2 15,050 1,228 16,278D-10s (secret cases in condition for allowance) 3,408 6 3,414
- Represents zero.1 Includes cases on appeal and undergoing petitions.2 Includes withdrawn cases.3 Subtotal is not included in pending patent applications total.
TABLE 6: Patents Issued (FY 1995–FY 2015)1
Year Utility2 Design Plant Reissue Total1995 101,895 11,662 390 294 114,241 1996 104,900 11,346 338 291 116,875 1997 111,977 10,331 400 267 122,975 1998 139,297 14,419 577 284 154,577 1999 142,852 15,480 436 393 159,161 2000 164,486 16,718 453 561 182,218 2001 169,571 17,179 563 504 187,817 2002 160,839 15,096 912 465 177,312 2003 171,493 16,525 1,178 394 189,590 2004 169,295 16,533 998 343 187,169 2005 151,077 13,395 816 195 165,483 2006 162,509 19,072 1,106 500 183,187 2007 160,306 22,543 979 548 184,376 2008 154,699 26,016 1,179 662 182,556 2009 165,213 23,415 1,096 398 190,122 2010 207,915 23,373 978 861 233,127 2011 221,350 21,295 816 969 244,430 2012 246,464 21,953 920 921 270,258 2013 265,979 22,453 842 809 290,083 2014 303,930 24,008 1,013 661 329,612 2015 295,459 25,438 1,020 531 322,448
1 Past year's data may have been revised from prior year reports.2 Includes chemical, electrical, and mechanical applications.

PERFORMANCE AND ACCOUNTABILITY REPORT
188
TABLE 7: Patent Applications Filed by Residents of the United States1 (FY 2010–FY 2015)2
State/Territory
2011 2012 2013 20142 20153
Total 266,243 282,466 306,413 307,985 N/A
Alabama 986 988 1,016 1,089 N/A
Alaska 96 88 90 99 N/A
Arizona 4,407 4,544 5,023 5,039 N/A
Arkansas 417 502 633 601 N/A
California 70,720 77,273 85,932 87,709 N/A
Colorado 5,554 5,677 6,472 6,280 N/A
Connecticut 4,413 4,940 4,584 4,506 N/A
Delaware 1,006 947 930 833 N/A
District of Columbia
322 344 469 465 N/A
Florida 8,580 9,476 9,972 10,422 N/A
Georgia 5,307 5,390 6,097 6,066 N/A
Hawaii 295 330 294 344 N/A
Idaho 1,664 1,566 1,412 1,497 N/A
Illinois 9,770 10,450 11,155 11,540 N/A
Indiana 3,726 3,861 4,275 4,373 N/A
Iowa 1,585 1,577 1,749 1,771 N/A
Kansas 1,688 1,833 1,861 1,802 N/A
Kentucky 1,364 1,271 1,369 1,393 N/A
Louisiana 835 839 926 951 N/A
Maine 440 437 383 402 N/A
Maryland 3,760 3,786 4,118 4,108 N/A
Massachusetts 12,931 13,356 14,635 15,183 N/A
Michigan 8,243 8,956 9,808 10,295 N/A
Minnesota 7,984 7,981 9,051 8,317 N/A
Mississippi 336 313 330 337 N/A
Missouri 2,286 2,445 2,620 2,793 N/A
Montana 273 264 335 326 N/A
Nebraska 639 698 669 686 N/A
State/Territory
2011 2012 2013 20142 20153
Nevada 1,726 2,113 1,963 1,868 N/A
New Hampshire 1,690 1,656 1,693 1,895 N/A
New Jersey 9,669 9,919 10,271 10,206 N/A
New Mexico 873 850 929 984 N/A
New York 15,935 17,594 18,257 17,564 N/A
North Carolina 6,205 6,720 7,494 7,550 N/A
North Dakota 200 215 224 186 N/A
Ohio 8,086 7,934 8,611 8,394 N/A
Oklahoma 1,107 1,090 1,204 1,173 N/A
Oregon 4,473 4,686 5,721 4,907 N/A
Pennsylvania 8,085 8,297 8,729 8,883 N/A
Rhode Island 753 834 855 770 N/A
South Carolina 1,935 2,011 2,043 2,004 N/A
South Dakota 254 250 275 304 N/A
Tennessee 2,275 2,194 2,396 2,396 N/A
Texas 17,310 18,732 20,236 20,088 N/A
Utah 2,907 2,992 3,201 3,409 N/A
Vermont 804 791 810 683 N/A
Virginia 3,806 4,106 4,522 4,545 N/A
Washington 13,764 14,425 15,577 15,716 N/A
West Virginia 316 271 284 247 N/A
Wisconsin 4,179 4,337 4,558 4,615 N/A
Wyoming 180 218 248 244 N/A
Puerto Rico 74 84 83 93 N/A
Virgin Islands 5 12 13 14 N/A
U.S. Pacific Islands4 3 2 6 14 N/A
United States5 2 1 2 6 N/A
Other5 – – – – N/A
– Represents zero. 1 Data include utility, plant, design, and reissue applications. 2 Finalized data for FY 2014 provided. 3 FY 2015 preliminary data should be available January 2016 at www.uspto.gov, and finalized in the FY 2016 PAR.4 Represents residents of American Samoa, Guam, and miscellaneous U.S. Pacific Islands.5 State/Territory information not available.

www.uspto.gov
189
TABLE 8: Patents Issued to Residents of the United States1 (FY 2014–FY 2015)4
State/Territory 2014 2015Total 161,675 154,425Alabama 560 532Alaska 58 48Arizona 2,672 2,709Arkansas 247 286California 44,127 42,960Colorado 3,626 3,423Connecticut 2,603 2,369Delaware 488 395District of Columbia 165 165Florida 5,122 4,819Georgia 3,081 2,822Hawaii 161 152Idaho 1,122 895Illinois 6,073 5,788Indiana 2,300 2,200Iowa 1,108 1,054Kansas 1,108 995Kentucky 700 707Louisiana 486 451Maine 251 217Maryland 2,059 1,919Massachusetts 7,310 7,159Michigan 5,866 5,970Minnesota 5,257 4,755Mississippi 167 179Missouri 1,402 1,305Montana 124 163
State/Territory 2014 2015Nebraska 402 341Nevada 1,022 823New Hampshire 958 933New Jersey 5,678 5,090New Mexico 461 436New York 9,992 9,581North Carolina 3,693 3,708North Dakota 124 129Ohio 4,563 4,255Oklahoma 644 593Oregon 2,949 2,728Pennsylvania 4,614 4,169Rhode Island 429 402South Carolina 957 1,058South Dakota 134 126Tennessee 1,186 1,118Texas 10,848 10,553Utah 1,517 1,561Vermont 599 510Virginia 2,257 2,183Washington 7,342 6,863West Virginia 137 145Wisconsin 2,742 2,523Wyoming 134 111Puerto Rico 39 37Virgin Islands 7 6U.S. Pacific Islands2 4 5United States3 - 1
– Represents zero. 1 Data include utility, design, plant, and reissue patents. 2 Represents residents of American Samoa, Guam, and miscellaneous U.S. Pacific Islands. 3 No State indicated in database. 4 Past year's data may have been revised from prior year reports.

PERFORMANCE AND ACCOUNTABILITY REPORT
190
TABLE 9: United States Patent Applications Filed by Residents of Foreign Countries1 (FY 2011–FY 2015)Residence 2011 2012 2013 20142 20153
Total 270,928 283,100 295,051 310,472 N/A
Afghanistan 1 – 1 – N/AAlbania – – – 1 N/AAlgeria – – 2 3 N/AAndorra 3 5 4 11 N/AAngola 2 1 – 1 N/AAntigua and Barbuda 3 2 2 – N/AArgentina 159 167 170 149 N/AArmenia 8 11 14 18 N/AAruba 2 – – 1 N/AAustralia 4,174 3,964 4,115 4,029 N/AAustria 1,964 2,124 2,242 2,586 N/AAzerbaijan 1 1 3 2 N/ABahamas 8 13 8 26 N/ABahrain 1 5 6 7 N/ABangladesh 5 2 9 6 N/ABarbados 2 – 7 6 N/ABelarus 7 12 35 47 N/ABelgium 2,344 2,262 2,455 2,660 N/ABermuda 11 11 3 3 N/ABolivia 1 3 4 1 N/ABonaire, Sint Eustatius, and Saba 2 – – 1 N/A
Bosnia and Herzegovina 2 1 2 3 N/ABotswana – – 2 – N/ABrazil 684 683 829 901 N/ABritish Virgin Islands 3 2 12 6 N/ABrunei Darussalam – – 1 6 N/ABulgaria 70 72 88 89 N/ACambodia3 – – – 1 N/ACameroon 2 4 – 9 N/ACanada 12,921 14,256 14,730 14,074 N/ACayman Islands 17 10 31 24 N/AChad 1 – – 1 N/A
Chile 122 117 143 156 N/A
China (Hong Kong) 1,379 1,380 1,465 1,500 N/A
China (Macau) 16 10 20 43 N/A
China (People's Republic) 10,562 13,371 15,496 19,006 N/A
Colombia 68 49 62 86 N/A
Costa Rica 21 24 35 44 N/A
Cote d'Ivoire3 – – – 8 N/A
Croatia 38 38 39 38 N/A
Cuba 19 18 18 23 N/A
Residence 2011 2012 2013 20142 20153
Curacao 1 1 1 – N/A
Cyprus 16 17 18 17 N/A
Czech Republic 277 398 403 481 N/A
Denmark 2,162 2,323 2,276 2,443 N/A
Dominican Republic 8 7 8 7 N/A
Ecuador 18 9 9 5 N/AEgypt 58 59 72 93 N/A
El Salvador 1 5 2 3 N/A
Estonia 62 79 95 70 N/AEthiopia – 1 – – N/AFaroe Islands – – 1 – N/AFinland 2,574 2,819 3,037 3,167 N/AFrench Polynesia 1 – – 1 N/AFrance 11,436 11,310 11,972 12,423 N/AGabon – 1 – – N/AGeorgia 6 5 3 7 N/AGermany 29,543 30,250 31,531 31,997 N/AGhana 4 1 4 2 N/AGibraltar 7 8 4 14 N/AGreece 139 168 154 171 N/AGreenland – 1 – – N/AGuadeloupe3 – – – 2 N/AGuatemala 2 2 5 2 N/AGuernsey 1 5 4 1 N/AGuinea – 1 – – N/AHaiti 1 – – – N/AHonduras 1 – 1 2 N/AHungary 245 285 303 327 N/AIceland 63 80 79 105 N/AIndia 4,482 5,515 6,411 7,082 N/AIndonesia 21 29 43 41 N/AIran 87 69 39 58 N/AIraq – 3 1 3 N/AIreland 901 913 1,088 1,087 N/A
Isle of Man 4 9 21 22 N/A
Israel 5,666 6,414 7,320 7,543 N/A
Italy 4,947 5,086 5,139 5,374 N/A
Jamaica 7 14 9 10 N/A
Japan 88,861 90,240 87,369 89,255 N/A
Jersey 9 5 13 11 N/A
Jordan 16 16 26 22 N/A
Kazakhstan 4 5 15 6 N/A
Kenya 10 7 19 6 N/A
Korea, Republic of 28,474 30,618 34,795 39,535 N/A

www.uspto.gov
191
TABLE 9: United States Patent Applications Filed by Residents of Foreign Countries1 (FY 2010–FY 2015) (continued)Residence 2011 2012 2013 20142 20153
Kuwait 71 98 132 89 N/AKyrgyzstan – – 1 – N/ALatvia 10 8 13 16 N/ALebanon 28 23 21 28 N/ALesotho3 – – – 1 N/ALiberia – 1 – 2 N/ALiechtenstein 39 47 48 59 N/ALithuania 16 15 27 30 N/ALuxembourg 112 125 110 108 N/AMadagascar – 1 – – N/AMacedonia – – 3 3 N/AMalawi – – 1 – N/AMalaysia 426 375 485 545 N/AMalta 5 12 19 25 N/AMartinique3 – – – 1 N/AMauritius 1 – – 1 N/AMexico 351 407 430 494 N/AMoldova – – 1 2 N/AMonaco 43 37 36 44 N/AMongolia 4 – 2 – N/AMontenegro3 – – – 3 N/AMorocco 6 3 3 2 N/ANamibia 1 1 7 4 N/ANepal 1 2 1 1 N/ANetherlands 4,893 4,764 4,764 5,328 N/ANetherlands Antilles – – – – N/A
New Caldonia3 – – – 1 N/A
New Zealand 613 600 707 744 N/A
Nicaragua – 1 1 2 N/ANiger – – – – N/ANigeria 5 2 4 12 N/ANorway 1,026 1,151 1,166 1,282 N/AOman 5 5 5 5 N/APakistan 29 14 42 35 N/APanama 6 6 6 11 N/AParaguay 2 1 3 – N/APeru 16 3 11 12 N/APhilippines 99 76 87 120 N/APoland 249 279 397 481 N/APortugal 115 114 134 183 N/A
Qatar 20 17 20 36 N/A
Romania 102 86 117 140 N/A
Russian Federation 741 837 1,001 1,025 N/A
Saint Kitts and Nevis – 1 1 – N/A
Samoa – – – – N/A
San Marino 1 1 – – N/A
Saudi Arabia 337 397 648 622 N/A
Residence 2011 2012 2013 20142 20153
Senegal – 1 – – N/A
Serbia 23 22 26 33 N/A
Seychelles 4 9 9 8 N/A
Singapore 1,655 1,710 1,812 1,931 N/A
Sint Maartin4 – – 1 – N/A
Slovakia 36 42 45 67 N/A
Slovenia 98 107 97 113 N/A
South Africa 361 338 463 416 N/A
Spain 1,597 1,704 1,820 1,765 N/A
Sri Lanka 9 13 16 16 N/A
Swaziland3 – – – 1 N/A
Sweden 4,319 4,576 4,641 5,170 N/A
Switzerland 4,328 4,583 4,840 5,362 N/A
Syria Arab Republic 3 3 – 1 N/A
Taiwan 21,678 21,310 21,949 21,915 N/A
Tajikistan – – 1 – N/A
Tanzania3 – – – 2 N/A
Thailand 148 173 242 172 N/A
Trinidad and Tobago 8 12 14 8 N/A
Tunisia 6 10 15 10 N/A
Turkey 189 231 253 317 N/A
Turkmenistan – 1 – 1 N/A
Turks and Caicos Islands – 3 1 2 N/A
Uganda – 1 1 – N/A
Ukraine 92 132 131 152 N/A
United Arab Emirates 58 91 122 151 N/A
United Kingdom 12,149 13,015 13,680 14,304 N/A
Uruguay 16 23 20 22 N/A
Uzbekistan – 1 1 3 N/A
Vanuatu (New Hebrides) 1 2 1 1 N/A
Venezuela 26 51 35 33 N/A
Vietnam 9 26 17 24 N/A
West Bank/Gaza – 1 – 3 N/A
Zimbabwe 4 3 1 1 N/A
Other5 – – – – N/A
– Represents zero. 1 Data include utility, design, plant, and reissue applications. Country listings include possessions and territories of that country unless listed separately in the table. Data are subject to minor revisions.
2 FY 2014 data are updated and final. 3 FY 2015 preliminary data should be available in January 2016 at
www.uspto.gov, and finalized in the FY 2016 PAR. 4 Countries/Territories not previously reported. 5 Country of origin information not available.

PERFORMANCE AND ACCOUNTABILITY REPORT
192
TABLE 10: Patents Issued by the United States to Residents of Foreign Countries1,3 (FY 2011–FY 2015)2
Residence 2011 2012 2013 2014 2015
Total 124,252 138,607 150,014 167,937 168,023
Afghanistan – – 1 1 –Albania 1 – 1 – –Algeria – – – – 1Andorra 4 2 1 2 8Angola – 1 1 – 1Anguilla 1 1 – – –Antigua and Barbuda – 6 1 1 –Argentina 49 58 76 83 74Armenia 4 5 4 5 8Aruba – – 2 – –Australia 2,213 1,777 1,878 2,062 1,937Austria 916 986 1,065 1,296 1,247Azerbaijan 1 2 1 2 1Bahamas 12 8 5 4 15Bahrain – 1 1 4 1Bangladesh – 1 2 3 2Barbados 2 – – 3 5Belarus 4 6 10 7 16Belgium 945 996 1,111 1,267 1,235Bermuda 5 4 2 4 3Bolivia 1 – – 3 –Bosnia and Herzegovina – 2 1 – –Brazil 232 261 265 352 372British Virgin Islands 1 – 2 1 3Brunei Darussalam 1 – – – 1Bulgaria 45 30 23 52 37Cameroon – 2 5 1 1Canada 5,687 6,197 6,915 7,922 7,480Cayman Islands 4 7 18 7 17Chile 30 41 55 57 85China (Hong Kong) 680 715 733 828 804China (Macau) 6 2 7 14 15China (Mainland) 3,465 5,044 6,181 7,715 8,593
Colombia 15 18 22 22 36
Costa Rica 14 12 14 17 17
Croatia 18 23 17 30 16
Cuba 4 5 12 19 11
Curacao – – – 1 –
Cyprus 3 2 10 10 11
Czech Republic 76 137 174 196 198
Denmark 837 941 1,009 1,309 1,186
Dominican Republic 2 2 6 3 2
Ecuador 1 4 9 4 1
Residence 2011 2012 2013 2014 2015
Egypt 19 32 32 40 32El Salvador – – 2 – 1Estonia 14 37 37 38 37Ethiopia – – – 1 –Faroe Islands – – 1 – –Finland 1,030 1,111 1,205 1,499 1,436France 5,024 5,616 6,245 7,144 7,037French Polynesia4 – – – – 1Gabon – – – 1 –Georgia 2 2 3 5 2Germany 13,020 14,569 15,798 17,926 17,485Ghana 1 3 2 1 1Gibraltar 3 6 4 2 2Greece 57 80 81 70 66Greenland – – – 1 –Guatemala – 2 – 1 4Guernsey 2 5 3 2 2Guinea – – – 1 –Haiti – 1 1 – –Honduras 1 – 1 – –Hungary 103 107 135 167 146Iceland 27 26 17 39 67India 1,195 1,599 2,222 2,937 3,328Indonesia 10 12 15 10 24Iran 15 26 37 33 26Iraq – – – – 1Ireland 313 329 435 486 522Isle of Man 14 19 14 9 15Israel 2,054 2,432 2,948 3,561 3,825Italy 2,322 2,458 2,834 3,043 3,058Jamaica 2 2 4 4 9Japan 47,674 51,609 53,359 56,639 54,485Jersey 4 5 8 4 10
Jordan 4 5 3 8 9
Kazakhstan – 1 2 3 5
Kenya 1 2 2 7 2
Korea, Democratic People's Republic of 1 1 – – –
Korea, Republic of 12,858 13,956 15,058 17,815 19,614
Kuwait 23 26 72 97 78
Latvia 3 5 4 6 9
Lebanon 8 21 8 10 14
Liechtenstein 15 16 22 37 37
Lithuania 10 3 7 7 10

www.uspto.gov
193
TABLE 10: Patents Issued by the United States to Residents of Foreign Countries1,3 (FY 2011–FY 2015)2 (continued)Residence 2011 2012 2013 2014 2015Luxembourg 41 51 56 60 63Macedonia 1 1 – 1 2Madagascar4 – – – – 1Malawi4 – – – – 1Malaysia 175 199 247 242 267Malta 4 2 9 8 17Mexico 116 138 190 227 215Moldova4 – – – 1 –Monaco 8 9 11 23 19Mongolia – – 1 – 1Montenegro4 – – – – 1Morocco 2 3 2 1 3Nepal, Federal Democratic Republic of4 – – – 2 –
Netherlands 1,959 2,205 2,391 2,883 2,732New Zealand 238 295 285 308 342Nicaragua – – 1 1 1Nigeria 1 1 3 – –Norway 411 441 510 601 625Oman 3 1 5 3 5Pakistan 2 11 14 8 17Panama 1 4 3 1 2Paraguay – 1 2 – 1Peru 5 4 1 4 4Philippines 37 38 35 45 43Poland 61 108 101 172 201Portugal 34 47 58 52 68Qatar 1 3 6 7 8Romania 24 47 52 68 72Russian Federation 311 335 409 438 457Saint Barthelemy4 – – – – 1Saint Kitts and Nevis – – – 1 –San Marino – – 1 1 –Saudi Arabia 56 152 206 273 340
Senegal – – – 1 –
Serbia 5 11 8 12 7
Seychelles – 1 1 4 2
Residence 2011 2012 2013 2014 2015
Singapore 693 800 840 963 1,074
Slovakia 22 21 14 26 26
Slovenia 30 42 47 50 40
South Africa 134 156 179 179 197
Spain 528 708 739 862 858
Sri Lanka 8 3 5 6 6
Sweden 1,757 2,207 2,309 2,905 2,830
Switzerland 1,825 2,016 2,278 2,660 2,750
Syrian Arab Republic 1 – 1 1 2
Taiwan 9,584 11,309 12,169 12,271 12,315
Thailand 65 57 87 121 129
Trinidad and Tobago 1 3 9 7 6
Tunisia 2 5 2 8 4
Turkey 45 48 78 103 128
Turkmenistan4 – – – – 1
Turks and Caicos Islands – – 2 – –
Ukraine 13 42 35 42 62
United Arab Emirates 11 22 20 53 57
United Kingdom 4,905 5,605 6,292 7,232 7,143
Uruguay 4 7 9 10 4
Uzbekistan – 1 – – 1
Vanuatu 1 – – – –
Venezuela 19 22 16 21 24
Vietnam – 1 11 8 6
West Bank/Gaza4 – – – – 1
Zimbabwe – 1 3 – 1
– Represents zero. 1 Data include utility, design, plant, and reissue patents. ² Past years' data may have been revised from prior year reports to reflect patent
withdrawal information that was updated during the year. It is not uncommon for the withdrawal status of patents issued in prior years to change.
3 Each patent grant is listed under only one country of residence. Country listings include possessions and territories of that country unless separately listed in the table.
4 Countries/territories not previously reported.

PERFORMANCE AND ACCOUNTABILITY REPORT
194
TABLE 11: Utility Patents Issued to Small Entities (FY 2011–FY 2015)Fiscal Year of Grant 2011 2012 2013 2014 2015Percentage Micro Entity* – – 0.53% 1.54% 1.80%
US origin** – – 0.98% 2.82% 3.26%Foreign origin** – – 0.12% 0.34% 0.49%
Percentage Small Entity 19.80% 20.32% 20.54% 19.47% 19.40% US origin** 27.87% 28.21% 28.03% 25.84% 25.79% Foreign origin** 12.16% 13.04% 13.75% 13.47% 13.66%Percentage Large Entity 80.19% 79.68% 78.93% 78.99% 78.80% US origin** 72.13% 71.79% 70.99% 71.37% 70.96% Foreign origin** 87.84% 86.96% 86.13% 86.19% 85.85%
– Represents zero.*The Micro Entity Status category was introduced March 19, 2013.**Patent origin is based on residence of the first-named inventor.
TABLE 12: Statutory Invention Registrations Published (FY 2011–FY 2015)1
Assignee 2011 2012 2013 2014 2015Air Force 1 – – – – Army – – – 1 – Navy 7 3 8 – – VA 1 – – – – Other than U.S. Government 6 4 6 7 –
Total 15 7 14 8 –– Represents zero. 1 Past year's data may have been revised from prior year reports.

www.uspto.gov
195
TABLE 13: United States Government Agency Patents1 (FY 2011–FY 2015)3
Agency 2011 2012 2013 2014 2015 TotalAgriculture 44 52 54 66 59 275 Air Force 40 51 44 72 53 260Army 141 146 155 166 161 769Attorney General 1 – – – – 1Commerce 15 11 12 14 13 65DHS4 – – – 3 4 7Energy 25 36 41 33 29 164EPA 12 16 17 5 7 57HEW/HHS 146 137 131 182 147 743Interior 1 3 2 2 3 11NASA 106 106 95 108 114 529Navy 300 366 383 357 394 1,800 NSA 11 10 11 4 2 38NSF – 1 2 1 1 5 Postal Service 25 39 27 32 20 143State Department – 1 – – – 1 Transportation – – – 1 – 1USA2 3 6 7 5 3 24VA 13 9 8 7 18 55Total 883 990 989 1,058 1,028 4,948
– Represents zero. 1 Data in this table represent utility patents assigned to agencies at the time of patent issue. Data subject to minor revisions. 2 United States of America—no agency indicated in database. 3 Past years' data may have been revised from prior year reports to reflect patent withdrawal information that was updated during the year.
It is not uncommon for the withdrawal status of patents issued in prior years to change.

PERFORMANCE AND ACCOUNTABILITY REPORT
196
TABLE 14A: Ex Parte Reexamination (FY 2011–FY 2015)2011 2012 2013 2014 2015
Requests filed, total 759 747 298 343 278By patent owner 104 64 13 20 56By third party 654 683 285 323 222Commissioner ordered 1 – – – –
Determinations on requests, total 773 548 526 368 226Requests granted:
By examiner 685 502 486 346 213By petition 6 4 2 6 1
Requests denied 82 42 38 16 12Requests known to have related litigation 349 311 381 195 –Filings by discipline, total 759 747 298 343 255
Chemical 143 149 61 81 57Electrical 395 398 174 166 111Mechanical 221 192 55 96 84Design – 8 8 – 3
– Represents zero.
TABLE 14B: Supplemental Examination (SE) (FY 2011–FY 2015)2013 2014 2015
SEs filed, total 35 43 53SEs granted a filing date, total 25 33 35Determinations on SE granted a filing date, total 20 33 38 SNQ found: 16 22 26 SNQ not found: 4 11 12Requests known to have related litigation N/A 1 – Filings by discipline, total 35 43 53
Chemical 8 13 7Electrical 11 22 34Mechanical 12 7 12Design 4 1 –– Represents zero. Late-filed requests may not have had a determination by the end of the fiscal year. Numbers will be revised in the following year’s PAR, where necessary. Although the transition to Inter Partes Reexams began in FY 2011, no measurable caseload activity began until FY 2013. FY 2013 is the earliest date of activity for this workload table.

www.uspto.gov
197
TABLE 15: Summary of Contested Patent Cases (Within the USPTO, as of September 30, 2015)Item TotalEx parte casesAppeals
Cases pending as of 9/30/14 25,527Cases filed during FY 2015 8,055 Disposals during FY 2015, total
Decided 12,289Cases pending as of 9/30/15 21,293
RehearingsCases pending as of 9/30/15 34
Interference casesCases pending as of 9/30/14 31Cases declared or reinstituted during FY 2015 22Interference cases, FY 2015 total 53Cases terminated during FY 2015 31Cases pending as of 9/30/15 22
Inter Partes Review cases*Cases pending as of 9/30/14 1,221Cases filed during FY 2015 1,737Inter partes review cases, FY 2015 total 2,958Cases not instituted, terminated, decided during FY 2015 1,431Cases pending as of 9/30/15 1,527
Transitional Program for Covered Business Method casesCases pending as of 9/30/14 146Cases filed during FY 2015 149Transitional Program for Covered Business Method cases, FY 2015 total 295Cases not instituted, terminated, decided during FY 2015 160Cases pending as of 9/30/15 135
Post Grant Review casesCases pending as of 9/30/14 2Cases filed during FY 2015 11Post Grant Review cases, FY 2015 total 13Cases not instituted, terminated, decided during FY 2015 1
Cases pending as of 9/30/15 12
Derivation Proceeding casesCases pending as of 9/30/14 3Cases filed during FY 2015 5 Derivation Proceeding cases, FY 2015 total 8Cases not instituted, terminated, decided during FY 2015 –Cases pending as of 9/30/15 8
– Represents zero.*The Inter Partes Reexamination process had been replaced as a part of AIA implementation by the Inter Partes Review process in FY 2013 and Inter PartesReexamination cases are no longer counted at USPTO.

PERFORMANCE AND ACCOUNTABILITY REPORT
198
TABLE 16: Summary of Trademark Examining Activities (FY 2011–FY 2015)Item 2011 2012 2013 2014 2015Applications for Registration:
Applications including Additional Classes 398,667 415,026 433,654 455,017 503,889
Applications Filed 301,826 311,627 321,055 336,275 369,877
Disposal of Trademark Applications:
Registrations including Additional Classes 237,586 243,459 259,681 279,282 282,091
Abandonments including Additional Classes 141,908 139,832 145,731 150,587 156,929
Trademark First Actions including Additional Classes 389,084 420,621 441,615 458,162 500,368
Applications Approved for Publication including Additional Classes
323,072 345,649 360,958 374,870 403,570
Certificates of Registration Issued:1
1946 Act Principal Register 103,233 110,000 116,420 123,086 126,359
Principal Register
ITU-Statements of Use Registered 66,796 64,057 67,952 73,914 72,594
1946 Act Supplemental Register 7,632 8,704 8,749 9,555 9,707
Total Certificates of Registration 177,661 182,761 193,121 206,555 208,660
Renewal of Registration:*
Section 9 Applications Filed 49,000 63,636 74,280 67,865 63,981
Section 8 Applications Filed** 49,037 63,642 74,283 67,869 64,010
Registrations Renewed 44,873 59,871 63,709 56,166 58,284
Affidavits, Sec. 8/15:
Affidavits Filed 65,771 76,646 93,174 107,823 88,486
Affidavits Disposed 58,341 72,346 76,731 93,711 80,593
Amendments to Allege Use Filed 7,647 7,999 7,721 7,927 8,394
Statements of Use Filed 86,159 86,935 85,004 71,685 75,461
Notice of Allowance Issued 166,035 172,122 183,030 192,609 198,349
Total Active Certificates of Registration 1,719,247 1,838,007 1,903,849 2,013,462 2,074,702
Pendency—Average Months:
Between Filing and Examiner's First Action 3.1 3.2 3.1 3.0 2.9
Between Filing, Registration (Use Applications), Abandonments, and NOAs—including suspended and inter partes proceedings
12.6 12.0 11.7 11.5 11.5
Between Filing, Registration (Use Applications), Abandonments, and NOAs—excluding suspended and inter partes proceedings
10.5 10.2 10.0 9.8 10.1
– Represents zero.1 With the exception of Certificates of Registration, Renewal of Registration, Affidavits filed under Section 8/15 and 12(c), the workload count includes extra classes.
" Applications filed" refers simply to the number of individual trademark applications received by the USPTO. There are, however, 47 different classes of items in which a trademark may be registered. An application must request registration in at least one class, but may request registration in multiple classes. Each class application must be individually researched for registerability. "Applications filed, including additional classes" reflects this fact, and therefore more accurately reflects the Trademark business workload. With the exception of Certificates of Registration, Renewal of Registration, Affidavits filed under Section 8/15 and 12(c), the workload count includes extra classes.
*Renewal of registration is required beginning 10 years following registration concurrent with 20-year renewals coming due. **Section 8 Affidavit is required for filing a renewal beginning October 30, 1999 (FY 2000) with the implementation of the Trademark Law Treaty.

www.uspto.gov
199
TABLE 17: Trademark Applications Filed for Registration and Renewal and Trademark Affidavits Filed (FY 1995–FY 2015)Year For Registration For Renewal1 Section 8 Affidavit1995 175,307 7,346 23,497 1996 200,640 7,543 22,169 1997 224,355 6,720 20,781 1998 232,384 7,413 33,231 1999 295,165 7,944 33,104 2000 375,428 24,435 28,920 2001 296,388 24,174 33,547 2002 258,873 34,325 39,4842003 267,218 35,210 43,1512004 298,489 32,352 41,1572005 323,501 39,354 47,7522006 354,775 36,939 48,4442007 394,368 40,786 49,2412008 401,392 42,388 68,4702009 352,051 43,953 65,3222010 368,939 48,214 61,4992011 398,667 49,000 65,7712012 415,026 63,636 76,6462013 433,654 74,280 93,1742014 455,017 67,865 107,8232015 503,889 63,981 88,486
1 Renewal of registration term changed with implementation of the Trademark Law Reform Act (Pub. L. No. 100-667) beginning November 16, 1989 (FY 1990).
TABLE 18: Summary of Pending Trademark Applications (FY 2015)Stage of processing Application Files ClassesPending applications, total 496,842 706,477In preexamination processing 86,221 111,305Under examination, total 309,899 454,874
Applications under initial examination 102,623 154,044Amended, awaiting action by Examiner 97,562 147,252Awaiting first action by Examiner 5,061 6,792
Intent-to-Use applications pending Use 161,089 232,345Applications under second examination 9,881 13,862
Administrative processing of Statements of Use 54 66 Undergoing second examination 2,942 3,892Amended, awaiting action by Examiner 6,885 9,904
Other pending applications1 36,306 54,623In postexamination processing (Includes all applications in all phases of publication and issue and registration) 100,722 140,298
1 Includes applications pending before the Trademark Trial and Appeal Board, and suspended cases.

PERFORMANCE AND ACCOUNTABILITY REPORT
200
TABLE 19: Trademarks Registered, Renewed, and Published Under Section 12(C)1 (FY 1995–FY 2015)
Year Certificates of Registration Issued Renewed2 Registrations (Incl. Classes)
1995 65,662 6,785 75,3721996 78,674 7,346 91,3391997 97,294 7,389 112,5091998 89,634 6,504 106,2791999 87,774 6,280 104,3242000 106,383 8,821 127,7942001 102,314 31,477 124,5022002 133,225 29,957 164,4572003 143,424 34,370 185,1822004 120,056 34,735 155,9912005 112,495 32,279 143,3962006 147,118 37,305 188,8992007 150,064 47,336 194,3272008 209,904 42,159 274,2502009 180,520 42,282 241,6372010 164,330 46,734 221,0902011 177,661 44,873 237,5862012 182,761 59,871 243,4592013 193,121 63,709 259,6812014 206,555 56,166 279,2822015 208,660 58,284 282,091
– Represents zero. 1 Includes withdrawn numbers. 2 Includes Renewal of registration term changed with implementation of the Trademark Law Reform Act (Pub. L. No. 100-667)
beginning November 16, 1989 (FY 1990).

www.uspto.gov
TABLE 20: Trademark Applications Filed by Residents of the United States (FY 2015) State/Territory 2015 State/Territory 2015 State/Territory 2015
Total 378,428 Kentucky 2,234 Oklahoma 1,780 Louisiana 2,442 Oregon 4,376
Alabama 2,069 Maine 861 Pennsylvania 10,377 Alaska 327 Maryland 6,352 Rhode Island 1,244 Arizona 6,550 Massachusetts 9,850 South Carolina 2,769 Arkansas 1,312 Michigan 7,581 South Dakota 514 California 82,044 Minnesota 6,929 Tennessee 5,714 Colorado 8,684 Mississippi 844 Texas 24,636 Connecticut 4,893 Missouri 4,494 Utah 4,289 Delaware 3,997 Montana 774 Vermont 765 District of Columbia 3,092 Nebraska 1,342 Virginia 8,538 Florida 28,647 Nevada 6,517 Washington 8,076 Georgia 10,925 New Hampshire 1,352 West Virginia 325 Hawaii 1,211 New Jersey 13,532 Wisconsin 4,871 Idaho 1,296 New Mexico 957 Wyoming 564 Illinois 14,896 New York 38,641 Puerto Rico 541 Indiana 4,010 North Carolina 7,624 Virgin Islands 31 Iowa 1,755 North Dakota 344 U.S. Pacific Islands1 85 Kansas 1,826 Ohio 8,503 United States2 226
1 Represents residents of American Samoa, Guam, and miscellaneous U.S. Pacific Islands. 2 No State indicated in database, includes Army Post Office filings.
TABLE 21: Trademarks Registered to Residents of the United States1 (FY 2015) State/Territory 2015 State/Territory 2015 State/Territory 2015
Total 167,796 Kentucky 937 Oklahoma 1,000 Louisiana 1,123 Oregon 2,007
Alabama 1,002 Maine 456 Pennsylvania 4,966 Alaska 134 Maryland 2,848 Rhode Island 573 Arizona 3,001 Massachusetts 4,329 South Carolina 1,301 Arkansas 560 Michigan 3,443 South Dakota 199 California 34,470 Minnesota 3,270 Tennessee 2,554 Colorado 3,755 Mississippi 319 Texas 11,187 Connecticut 2,406 Missouri 2,306 Utah 1,938 Delaware 1,537 Montana 368 Vermont 308 District of Columbia 1,631 Nebraska 708 Virginia 3,994 Florida 12,447 Nevada 2,658 Washington 3,549 Georgia 4,702 New Hampshire 594 West Virginia 145 Hawaii 515 New Jersey 6,008 Wisconsin 2,254 Idaho 564 New Mexico 483 Wyoming 234 Illinois 6,594 New York 16,363 Puerto Rico 271 Indiana 1,934 North Carolina 3,581 Virgin Islands 21 Iowa 874 North Dakota 149 U.S. Pacific Islands2 17 Kansas 899 Ohio 4,259 United States3 51
1 When a trademark is registered, the trademark database is corrected to indicate the home state of the entity registering the trademark. 2 Represents residents of American Samoa, Guam, and miscellaneous U.S. Pacific Islands. 3 No State indicated in database, includes APO filings.
201

PERFORMANCE AND ACCOUNTABILITY REPORT
202
TABLE 22: Trademark Applications Filed by Residents of Foreign Countries (FY 2011–FY 2015)
Residence 2011 2012 2013 2014 2015
Total 85,116 89,100 99,949 99,913 125,461Afghanistan 11 4 8 6 4Albania 6 1 2 5 6Algeria – 2 – 1 1Andorra – 20 3 13 3Angola 11 1 3 4 4Anguilla 17 34 22 22 4Antigua & Barbuda 15 6 – 2 2Argentina 283 268 266 217 280Armenia 32 16 32 47 25Aruba 1 3 4 5 18Australia 3,154 3,381 3,960 4,011 5,144Austria 1,212 1,155 1,292 1,281 1,328Azerbaijan 8 3 1 4 6Bahamas 153 331 191 138 132Bahrain 31 21 10 9 12Bangladesh 7 6 1 3 1Barbados 161 198 116 162 122Belarus 35 43 30 20 29Belgium 760 917 1,093 976 944Belize 30 33 32 47 34Benin 1 1 – – – Bermuda 182 222 253 353 245Bolivia 4 5 1 2 6Bosnia & Herzegovinia 1 – 1 5 5Botswana 48 6 – 7 – Brazil 548 608 676 779 856British Virgin Islands 597 825 1,087 985 908Brunei Darussalam 2 4 8 1 3Bulgaria 72 109 178 218 150Cambodia – – – 2 2Cameroon 1 1 – – – Canada 9,257 9,823 9,984 10,268 11,585Cayman Islands 292 400 351 504 836Channel Islands 127 58 – – – Chile 263 178 170 205 300
China (Hong Kong) 1,492 1,768 1,785 2,430 2,926
China (Macau) – 8 – 23 –
China (mainland) 3,652 3,735 4,756 6,323 14,144
Colombia 184 300 296 272 344
Cook Islands – – – 5 –
Costa Rica 65 59 44 36 31
Cote D'Ivoire – – – 11 –
Croatia 14 40 64 62 65
Cuba 3 5 2 2 15
Curacao 60 65 41 63 170
Cyprus 210 718 333 375 393
Czech Republic 256 201 307 274 315
Denmark 827 869 1,120 1,095 1,387Dominica 2 – 6 12 1
Residence 2011 2012 2013 2014 2015Dominican Republic 51 71 63 86 84Ecuador 47 34 35 36 36Egypt 38 18 58 32 33El Salvador 36 25 56 34 44Estonia 37 56 86 114 73Ethiopia 1 4 3 5 1Faroe Islands 2 – 4 3 – Fiji 5 15 26 2 7Finland 675 714 1,117 797 959France 5,868 6,375 6,575 5,959 6,983French Polynesia 11 – 4 7 2Gabon 10 – – – – Georgia 27 9 18 25 24Germany 10,603 10,525 11,504 10,042 12,310Ghana 1 1 4 13 2Gibraltar 61 63 49 89 57Greece 166 135 203 173 188Grenada 1 4 3 – – Guadeloupe – – 1 2 – Guatemala 16 44 44 31 55Guernsey – – – 51 67Guyana 1 5 4 5 10Haiti 2 8 3 2 – Honduras 2 4 7 9 7Hungary 87 102 161 147 112Iceland 62 65 100 84 156India 717 606 684 824 963Indonesia 56 91 70 99 65Iran 28 11 31 69 41Iraq 1 – 1 1 12Ireland 615 619 699 1,036 1,117Isle of Man 56 48 113 53 79Israel 677 795 1,025 1,133 1,287Italy 4,284 3,960 4,382 4,502 5,200Jamaica 20 42 46 27 43Japan 5,054 5,358 6,110 5,786 6,521Jordan 33 30 32 42 89Kazakhstan 3 – 12 10 49Kenya 1 12 2 8 18
Korea, Dem. Republic of – – – – 1
Korea, Republic of 2,028 2,323 3,160 2,729 4,111
Kuwait 10 14 21 32 23
Kyrgyzstan – 3 2 2 1
Lao, People's Dem. Republic of – – – 1 –
Latvia 33 40 45 33 72
Lebanon 34 32 57 57 84
Liberia 1 1 1 2 21Liechtenstein 182 152 105 106 178Lithuania 30 26 41 51 65

www.uspto.gov
203
TABLE 22: Trademark Applications Filed by Residents of Foreign Countries (FY 2011–FY 2015) (continued)Residence 2011 2012 2013 2014 2015Luxembourg 807 831 1,044 887 945Macao 10 – 126 – 66Macedonia 4 27 11 14 9Madagascar – 1 – – 2Malaysia 89 89 131 148 201Malta 63 99 424 519 283Marshall Island 12 7 3 3 21Martinique 1 1 – 1 – Mauritania – – – 3 – Mauritius 64 29 74 45 46Mexico 1,792 1,990 1,898 2,124 2,285Micronesia 1 1 – – – Monaco 168 135 144 178 283Mongolia 30 3 1 11 6Montserrat 6 – – – 2Morocco 23 50 43 66 74Myanmar – – – – – Namibia 2 4 – – 5N. Marianas Island 2 7 4 5 – Nepal 5 1 1 5 1Netherlands 2,357 1,851 2,419 2,418 2,851Netherlands Antilles 41 – – 1 – New Zealand 520 522 520 674 733Nicaragua 8 16 6 8 13Nigeria 4 6 11 4 6Norway 638 434 813 629 733Oman 6 – – 8 – Pakistan 17 12 31 79 87Palau – – – 1 – Panama 148 126 159 193 261Papua New Guinea – – 3 – – Paraguay 12 6 18 14 11Peru 69 62 84 42 92Philippines 65 128 88 85 78Poland 240 330 381 354 563Portugal 261 232 301 384 373Qatar 43 26 56 89 77Republic Moldova 9 7 15 24 36Romania 83 61 94 73 129Russian Federation 591 1,036 1,025 799 850Saint Kitts & Nevis 31 18 22 30 15Saint Lucia 12 8 15 26 48Saint Marten 2 3 5 3 – Saint Vincent/ Grenadines 1 4 5 5 1
Samoa 11 11 10 17 21
Residence 2011 2012 2013 2014 2015San Marino 8 13 16 2 18Sao Tome/Principe 1 – – – – Saudi Arabia 66 108 71 141 109Scotland 56 57 46 48 76Senegal, Republic of 7 – – – 3Serbia/Montenegro 47 38 30 40 58Seychelles 38 27 37 72 77Singapore 695 627 880 769 1,132Slovakia 65 84 90 227 115Slovenia 129 89 98 68 123South Africa 253 271 294 278 268Spain 2,200 2,097 1,881 2,133 2,326Sri Lanka 19 21 13 45 44Suriname – 2 – 1 – Swaziland 1 – – – 1Sweden 1,536 1,709 1,804 1,760 2,168Switzerland 4,770 4,901 5,613 4,836 5,561Syria 7 – – 2 1Taiwan 1,525 1,661 1,464 1,673 1,782Tanzania 2 – 3 – – Thailand 174 190 167 134 146Timor–Leste 1 – – – – Togo 8 2 14 2 – Trinidad & Tobago 5 13 10 23 64Tunisia 17 6 30 1 19Turkey 571 610 868 570 1,052Turkmenistan – 6 – – – Turks and Caicos Islands 18 48 34 24 23
Uganda 3 2 1 1 – Ukraine 92 118 155 171 194United Arab Emirates 172 224 192 254 517United Kingdom 8,451 8,939 10,629 10,779 14,061Uruguay 35 14 53 59 38Uzbekistan – 2 3 1 4Vanuatu (New Hebrides) – 1 9 1 –
Venezuela 62 46 52 94 100Vietnam 61 99 108 98 126West Bank/Gaza 1 2 – – – Yemen 4 1 2 1 – Zambia 1 – 3Zimbabwe – 4 – – – Other1 8 3 – – 9
– Represents zero. 1 Country of Origin information not available or not indicated in database; includes African Regional Industrial Property Organization filings.

PERFORMANCE AND ACCOUNTABILITY REPORT
204
TABLE 23: Trademarks Registered to Residents of Foreign Countries (FY 2011–FY 2015)Residence 2011 2012 2013 2014 2015Total 33,752 34,003 36,916 38,498 40,864Afghanistan 4 2 8 3 – Albania – 3 – 3 1Algeria 2 1 2 2 – Andorra 4 3 4 – – Angola, Republic of 2 2 1 – 1Anguilla 7 25 17 8 16Antigua & Barbuda 3 4 5 1 – Argentina 161 150 158 126 140Armenia 17 11 12 20 1Aruba 2 2 – 1 – Australia 1,338 1,331 1,385 1,564 1,445Austria 337 361 361 369 305Azerbaijan 1 2 1 1 – Bahamas 60 71 60 56 63Bahrain 18 6 9 4 10Bangladesh 1 6 1 1 3Barbados 89 67 51 51 82Belarus 13 17 18 15 3Belgium 287 302 362 408 161Belize 12 29 25 16 20Benelux Convention 18 8 12 – – Benin – – 1 – – Bermuda 105 95 128 171 194Bhutan – 1 – – – Bolivia 1 3 2 4 1Bosnia & Herzegovina 1 2 1 – 1Botswana – 2 1 2 2Brazil 180 209 242 236 346British Virgin Islands 315 258 396 295 445Brunei Darussalam – – 3 3 5Bulgaria 21 28 45 59 23Burkina Faso 1 – – – – Cambodia 1 1 – 2 1Cameroon 3 2 4 – – Canada 4,069 3,888 3,944 4,010 6,420 Cayman Islands 133 124 155 123 250 Channel Islands 25 29 – – – Chile 100 122 92 92 128China (Hong Kong) 562 601 775 883 1,472China (Macau) 2 1 1 9 2China (mainland) 1,705 2,024 2,444 2,901 4,016Colombia 94 134 132 94 118Cook Islands – 1 2 – – Costa Rica 21 25 51 16 36Cote D'Ivoire 1 4 1 – 2Croatia 14 7 16 11 4Cuba 7 4 8 1 2Curacao 1 9 18 8 56Cyprus 78 80 135 159 67
Residence 2011 2012 2013 2014 2015Czech Republic 57 94 107 80 85Denmark 372 333 377 393 275Djibouti – 1 – – – Dominica 2 1 1 2 3Dominican Republic 47 29 24 26 29Ecuador 23 19 14 23 20 Egypt 8 16 16 12 14El Salvador 20 26 17 26 20Estonia 15 14 33 28 30Ethiopia 3 – 1 1 – Faroe Islands 1 1 1 – 3 Fiji 1 2 1 4 1Finland 225 212 217 263 190France 2,353 2,160 2,390 2,338 1,488French Polynesia 2 – 2 – 4 Gabon – 1 1 – – Georgia 4 14 8 10 9Germany 3,730 3,660 3,641 3,702 2,478Ghana 2 5 5 4 3Gibraltar 29 38 43 45 39Greece 42 67 55 55 63Grenada – 1 – 4Guernsey – – – 12 23Guinea – 1 – – – Guinea (Equitorial) 1 1 – – – Guinea–Bissau 1 3 1 – – Guyana 4 3 3 4 3Haiti 2 4 3 3 – Honduras 4 7 5 1 8Hungary 36 34 52 42 50Iceland 17 29 37 26 9India 252 259 294 249 364Indonesia 23 40 34 40 37Iran 4 17 8 1 – Iraq 2 – – – – Ireland 212 227 257 275 464Isle of Man 24 13 25 31 58Israel 341 412 462 443 470Italy 1,733 1,657 1,821 1,843 730Jamaica 21 28 27 19 12Japan 2,272 2,198 2,568 2,770 2,433Jordan 16 20 14 21 20Kazakhstan 1 1 3 1 – Kenya 3 1 4 5 – Korea, Dem. Republic of 2 9 7 – 6Korea, Republic of 904 1,043 1,153 1,272 1,997Kuwait 3 7 8 12 5Kyrgyzstan – 1 2 – – Laos 1 – – – 1Latvia 14 10 18 20 8

www.uspto.gov
205
Residence 2011 2012 2013 2014 2015Lebanon 15 15 16 17 33Liberia 8 6 4 – 1Liechtenstein 37 45 56 60 23Lithuania 11 16 15 25 2Luxembourg 246 270 271 312 343Macedonia 3 2 3 8 – Madagascar – – 1 – – Malawi 1 – – – – Malaysia 78 76 45 60 53 Mali – – – – – Malta 20 24 28 55 368 Martinique 1 – 2 – 1Marshall Islands 3 5 3 10 2Mauritius 15 28 15 31 26Mexico 954 897 1,040 921 1,123Micronesia 2 – – – – Monaco 25 19 29 37 14 Mongolia 3 1 1 – 1Montenegro – 1 2 16 43Montserrat – 1 – – – Morocco 9 8 10 4 3 Myanmar 1 – – – – N. Mariana Island 5 1 2 1 2Namibia – 1 3 1 – Nauru – – 1 – – Nepal 2 2 1 1 3Netherlands 831 897 810 891 582Netherlands Antilles 30 21 8 1 – New Zealand 285 223 219 283 299Nicaragua 6 10 7 4 8Nigeria 6 12 14 5 2Norway 197 195 167 197 122Oman 6 2 – – 2Pakistan 20 11 12 4 31Palistinian Authority 3 – 2 – –Panama 88 53 92 79 107Papua New Guinea – – – 1 – Paraguay 7 2 3 3 5Peru 31 33 32 33 37Philippines 38 34 37 54 51Poland 87 98 102 124 100Portugal 130 91 106 135 136Qatar 5 1 9 10 36Republic Moldova 4 1 6 3 3Romania 17 15 28 35 23Rwanda 1 – – – – Russian Federation 206 252 281 246 122Saint Christ & Nevis 10 31 36 15 16Saint Lucia 6 1 10 9 16
Residence 2011 2012 2013 2014 2015Saint Martin – 3 1 1 – Saint Vincent/Grenadines 2 2 2 4 1
San Marino – 1 1 6 – Saudi Arabia 10 38 22 23 58Scotland 17 12 16 19 23Senegal 2 1 1 – 6Serbia 6 9 7 6 6Serbia/Montenegro – – 2 – – Seychelles 14 18 17 14 31Sierra Leone 2 1 1 – – Singapore 230 239 324 277 311Slovakia 17 17 17 29 6Slovenia 29 31 30 18 11South Africa 119 93 138 119 189Spain 797 885 965 914 786Sri Lanka 16 12 15 8 33St Kitts & Nevis – – 36 – – Swaziland – 3 1 – – Sweden 524 655 661 636 604Switzerland 1,566 1,560 1,623 1,735 1,268Syria 5 3 1 1 1Taiwan 843 820 957 926 1,172Tanzania 1 1 1 3 – Thailand 49 67 74 91 92Timor–Leste – 1 – – – Togo – 2 1 – 11Trinidad & Tobago 5 6 7 2 12Tunisia 5 3 2 3 – Turkey 167 194 250 294 99Turks and Caicos Islands 12 8 11 20 15Uganda 1 2 2 – 2Ukraine 41 33 38 46 12United Arab Emirates 52 62 90 75 121United Kingdom 2,989 2,905 3,092 3,607 4,836Uruguay 24 19 16 22 22Uzbekistan 1 – 1 – – Vanuatu (New Hebrides) – – 2 1 – Vatican City 1 1 – – 3Venezuela 41 49 37 19 51Vietnam 37 43 52 49 23Western Samoa/Samoa 9 4 1 7 17Yemen – 4 1 1 – Yugoslavia 1 2 – – – Zambia 1 – – – 1Zimbabwe 4 2 1 – – Other1 14 16 20 1 4
– Represents zero. 1 Country of Origin information not available.
TABLE 23: Trademarks Registered to Residents of Foreign Countries (FY 2011–FY 2015) (continued)

PERFORMANCE AND ACCOUNTABILITY REPORT
206
TABLE 24: Summary of Contested Trademark Cases (Within the USPTO, as of September 30, 2015)
Activity Ex parte Opposition CancellationsConcurrent
Use Interference TotalCases pending as of 9/30/14, total 1,330 5,564 1,757 32 – 8,683
Cases filed during FY 2015 2,992 5,290 1,763 19 – 10,064
Disposals during FY 2015, total 3,038 5,604 1,760 14 – 10,416
Before oral hearing or briefing 2,599 5,514 1,728 13 – 9,854
After hearing (no oral hearing) 382 75 30 1 – 488
After oral hearing 57 15 2 – – 74
Cases pending as of 9/30/15, total 1,284 5,250 1,760 37 – 8,331
Awaiting decision 81 23 7 1 – 112
In process before hearing or final briefing1
1,203 5,227 1,753 36 – 8,219
Requests for extension of time to oppose FY 2015
– 17,132 – – – 17,132
– Represents zero. 1 Includes suspended cases.

www.uspto.gov
207
TABLE 25: Actions on Petitions to the Director of the U.S. Patent and Trademark Office (FY 2011–FY 2015)Nature of petition 2011 2012 2013 2014 2015Patent mattersActions on patent petitions, total 53,755 51,323 48,109 48,204 45,381
Acceptance of:Late assignments 892 739 804 698 631Late issue fees 1,920 1,529 1,765 1,500 1,498Late priority papers 4 6 5 74 75
Access 9 4 3 1 1Certificates of correction 26,033 25,441 24,738 25,088 26,443Deferment of issue 8 9 9 8 13Entity Status Change 2,842 3,016 2,874 2,831 2,425Filing date 531 413 432 276 104Maintenance fees 2,457 1,984 1,702 2,154 1,976Revivals 9,949 8,202 8,660 6,701 5,330Rule 47 (37 CFR 1.47) 3,077 2,748 1,648 977 354Supervisory authority 470 439 461 404 708Suspend rules 275 162 120 214 126Withdrawal from issue 1,948 2,196 3,363 4,417 4,859
Withdrawals of holding of aband 3,340 4,435 1,525 2,861 838
Late Claim for Priority 1,389 1,298 1,254 1,755 2,139Withdraw as Attorney 5,798 3,922 3,846 5,344 2,390Matters Not Provided For (37 CFR 1.182) 1,603 1,775 1,338 1,100 1,012To Make Special 10,573 12,832 17,805 20,283 19,026Patent Term Adjustment/Extension 2,117 1,298 964 9,957 4,900Trademark matters
Actions on trademark petitions, total 23,153 21,036 22,268 24,887 24,858Filing date restorations1 6 19 8 4 3Inadvertently issued registrations 78 81 118 192 76Letters of Protest 1,213 1,490 1,595 1,776 2,161Madrid Petitions 46 43 61 79 87Make special 170 302 244 371 343Reinstatements2 547 354 319 366 150Revive (reviewed on paper) 1,296 698 324 623 713Revive (granted electronically)3 18,802 16,913 18,165 19,900 19,857Waive fees/refunds 5 18 7 8 15Miscellaneous Petitions to the Director 840 967 1,223 1,208 1,217Board Matters 9 15 25 51 37Post Registration Matters 141 136 179 309 145Petitions awaiting action as of 9/30Trademark petitions awaiting response 60 26 29 41 36Trademark petitions awaiting action 2 5 17 – 8Trademark pending filing date issues – – – – –
– Represents zero.1 Trademark Applications entitled to a particular filing date; based on clear evidence of Trademark organization error. 2 Trademark Applications restored to pendency; inadvertently abandoned by the Trademark organization. 3 The petition to revive numbers were not separated into two categories (paper versus electronic) in previous years.

PERFORMANCE AND ACCOUNTABILITY REPORT
208
TABLE 26: Cases in Litigation (Selected Courts of the United States, as of September 30, 2015)Patents Trademarks OED Total
United States District CourtsCivil actions pending as of 9/30/14, total 70 1 – 71 Filed during FY 2015 14 7 3 24 Disposals, total 19 7 1 27
Reversed – – – – Remanded 2 – – 2 Dismissed 13 4 1 18 SJ Granted—USPTO 3 2 – 5 SJ Granted—Opposing Party – – – – Transfer 1 1 – 2
Civil actions pending as of 9/30/15, total 65 1 2 68United States Courts of Appeals1
Ex parte casesCases pending as of 9/30/14 49 10 – 59 Cases filed during FY 2015 57 13 – 70 Disposals, total 67 15 – 82
USPTO Affirmed 39 5 – 44 Affirmed-In-Part 2 – – 2
District Court Affirmed 3 – – 3 Reversed 2 2 – 4 Remanded 4 – – 4 Dismissed 13 8 – 21 Vacated – – – – Transfer – – – – Mandamus Denied 3 – – 3 Mandamus Granted 1 – – 1
Total ex parte cases pending as of 9/30/15 39 8 – 47United States Courts of Appeals2
Inter partes cases IntervenedCases pending as of 9/30/14 20 – – 20 Cases filed during FY 2015 56 2 – 58 Disposals, total 31 – – 31
USPTO Affirmed 27 – – 27 Affirmed-In-Part 1 – – 1Reversed – – – – Remanded – – – – Dismissed 3 – – 3
Total inter parte cases intervened pending as of 9/30/15 45 2 – 47
Inter partes casesCases pending as of 9/30/14 72 9 – 81Cases filed during FY 2015 287 8 – 295Disposals, total 160 12 – 172
Affirmed 45 6 – 51Affirmed-In-Part – 1 – 1Reversed 1 – – 1Remanded 6 2 – 8Dismissed 108 3 – 111Transferred – – – –

www.uspto.gov
209
Patents Trademarks OED Total
Total inter parte cases intervened pending as of 9/30/15
199 5 – 204
Total United States Courts of Appeals cases pending as of 9/30/15
283 15 – 298
Supreme CourtEx parte cases
Cases pending as of 9/30/14 1 1 – 2 Cases filed during FY 2015 4 – – 4 Disposals, total 5 1 – 6 Cases pending as of 9/30/15, total – – – –
– Represents zero.1 Includes Federal Circuit and Other Appellate Courts.2 New Case Type Reported - Previously Reported Under Ex Parte Appeals.
TABLE 26: Cases in Litigation (Selected Courts of the United States, as of September 30, 2015) (continued)

PERFORMANCE AND ACCOUNTABILITY REPORT
210
TABLE 27: Patent Classification Activity (FY 2011–FY 2015)Activity 2011 2012 2013 2014 2015
Subgroups established in CPC – – – – 1,297 Subgroups established in USPC 753 311 349 137 –
Reclassification of CPF families – – – – 67,947 Reclassification of USPC documents 165,019 31,232 40,007 10,812 –
TABLE 28: Scientific and Technical Information Center Activity (FY 2015)Activity QuantityPrior Art Search Services Provided
Commercial Database Searches Completed 29,945Genetic Sequence Searches Completed 6,681Number of Genetic Sequences Searched 27,845CRF Submissions Processed 18,209 PLUS Searches Completed 58,094Foreign Patent Searches Completed 5,649
Document Delivery Services Provided
Document Delivery/Interlibrary Loan Requests Processed 14,534Copies of Foreign Patents Provided 9,265
Information Assistance and Automation Services
One-on-One Examiner Information Assistance 25,694One-on-One Examiner Automation Assistance 40,391Patents Employee Attendance at Automation Classes 24,746Patents Employee Attendance for PTA Classes and Customized Training Classes Coordinated via STIC 10,062Patent Employee Attendance for Examiner Training on STIC Information Sources and Services 12,725Foreign Patents Assistance for Examiners and Public 7,322
Translation Services Provided for Examiners
Written Translations of Documents 3,524 Number of Words Translated (Written) 11,604,766Documents Orally Translated* 4,588
Total Number of Examiner Service Contacts 338,402Collection Usage and GrowthPrint/Electronic Non-Patent Literature (NPL) Collection Usage 1,727,089Print Books/Subscriptions Purchased 1,914Full Text Electronic Journal Titles Available 75,611Full Text Electronic Book Titles Available 345,299NPL Databases Available for Searching (est.) 1,588
* Includes orally translated requests for Trademarks.

www.uspto.gov
211
TABLE 29: End of Year Personnel1 (FY 2011–FY 2015)Activity 2011 2012 2013 2014 2015
Patent Business Line 9,234 10,632 10,847 11,484 11,855Trademark Business Line 976 899 926 966 812
Total USPTO 10,210 11,531 11,773 12,450 12,667
Examination StaffPatent Examiners
UPR Examiners 6,685 7,831 7,928 8,466 8,977Design Examiners 95 104 123 145 184
Total UPR and Design Examiners 6,780 7,935 8,051 8,611 9,161Patent Examiner Attrition Rate 2.96% 3.07% 4.23% 3.40% 4.32%Trademark Examining Attorneys 378 386 409 429 456Trademark Examining Attorneys Attrition Rate 2.83% 3.98% 1.92% 2.40% 3.51%
1 Number of positions.

PERFORMANCE AND ACCOUNTABILITY REPORT
212
TABLE 30A: Top 50 Trademark Applicants (FY 2015) Name of Applicant Classes1
LG Electronics Inc. 668Homer TLC, Inc. 534NOVARTIS AG 517Lidl Stiftung & Co. KG 309MATTEL, INC. 294SAMSUNG ELECTRONICS CO., LTD. 286JOHNSON & JOHNSON 271A&E Television Networks, LLC 268Twentieth Century Fox Film Corporation 253Koninklijke Philips N.V. 235Alibaba Group Holding Limited 234Glaxo Group Limited 226Yiwu Prudential Network Technology Co. 220Societe des Produits Nestle S.A. 205Eli Lilly and Company 202Bally Gaming, Inc. 193Miles-Bramwell Executive Services Limite 183Amazon Technologies, Inc. 180Disney Enterprises, Inc. 180Hewlett-Packard Development Company, L.P. 178GTECH Canada ULC 174LE SHI INTERNET INFORMATION & TECHNOLOGY 173Abbott Laboratories 171Universal City Studios LLC 169Google Inc. 167S. C. Johnson & Son, Inc. 166DreamWorks Animation L.L.C. 165Merck Sharp & Dohme Corp. 164Dr. Seuss Enterprises, L.P. 155Safeway Inc. 153TRADEMARK KING INC. 152IGT 149ALDI Inc. 148Daimler AG 141L'Oreal USA Creative, Inc. 138Pfizer Inc. 138Lions Gate Entertainment Inc. 135The Procter & Gamble Company 135Target Brands, Inc. 134Wayfair LLC 133Ainsworth Game Technology Limited 129The Cartoon Network, Inc. 129Wal-Mart Stores, Inc. 129 LUI Che Woo Prize Limited 128Hasbro, Inc. 124Columbia Insurance Company 122Multimedia Games, Inc. 121Tottenham Hotspur Limited 121Ingenious Designs LLC 120Marvel Characters, Inc. 119
1 Applications with Additional Classes.
TABLE 30B: Top 50 Trademark Registrants (FY 2015)Name of Applicant Registrations
MATTEL, INC. 356Samsung Electronics Co., Ltd. 290Novartis AG 262LG Electronics Inc. 225Disney Enterprises, Inc. 151The Procter & Gamble Company 126DISTRICT 12, LLC 125BALLY GAMING, INC. 121Glaxo Group Limited. 116Societe des Produits Nestle S.A. 105Lidl Stiftung & Co. KG 101L'Oreal 92IGT 90U.S. Marine Corps, a component of the U.S Navy 88L'Oreal USA Creative, Inc. 87Konami Gaming, Inc. 84Multimedia Games, Inc. 80ALDI Inc. 72JOHNSON & JOHNSON 72Marvel Characters, Inc. 70Twentieth Century Fox Film Corporation 70Boehringer Ingelheim International GmbH 68PPT, LLC 66King.com Limited 65VIACOM INTERNATIONAL INC. 65Conair Corporation 64Discovery Communications, LLC 63TARGET BRANDS, INC. 63Aristocrat Technologies Australia Pty Lt 61Diageo North America, Inc. 57Koninklijke Philips N.V. 56The Saul Zaentz Company 53Siemens Aktiengesellschaft 52Apple Inc. 51Columbia Insurance Company 51S. C. Johnson & Son, Inc. 51Sears Brands, LLC 51Abercrombie & Fitch Trading Co. 50Universal Entertainment Corporation 50Kimberly-Clark Worldwide, Inc. 49SYNGENTA PARTICIPATIONS AG 49Playtika Ltd. 48Skechers U.S.A., Inc. II 48Starbuzz Tobacco, Inc. 47Shiseido Company, Limited 46Televisa, S.A. de C.V. 45Amorepacific Corporation 44Hallmark Licensing, LLC 44Lincoln Global, Inc. 44A&E Television Networks, LLC 42

www.uspto.gov
213
GLOSSARY OF ACRONYMS AND
ABBREVIATION LISTUnaudited, please see the accompanying auditors’ report.

PERFORMANCE AND ACCOUNTABILITY REPORT
214
ABC Activity Based Costing
AGA Association of Government Accountants
AIA Leahy–Smith America Invents Act
AIPA American Inventors Protection Act
BFS Bureau of the Fiscal Service
CASE Centralized Access to Search and Examination
CEO Career Enhancement Opportunity
CFO Chief Financial Officer
CFS Consolidated Financial System
COTS Commercial-off-the-shelf
CPC Cooperative Patent Classification
CSRS Civil Service Retirement System
DAV Docket and Application Viewer
DM&R Deferred Maintenance and Repairs
DOL Department of Labor
E2E End-to-End
eDAN Electronic Desktop Application Navigator
EES Employee Engagement Survey
EFS Electronic Filing System
EFT Electronic Funds Transfer
eMod eCommerce Modernization
EPO European Patent Office
EPQI Enhanced Patent Quality Initiative
ESTTA Electronic System for Trademark Trials and Appeals
FAQs Frequently Asked Questions
FECA Federal Employees’ Compensation Act
FEGLI Federal Employees Group Life Insurance
FEHB Federal Employees Health Benefit
FERS Federal Employees Retirement System
FFMIA Federal Financial Management Improvement Act
FICA Federal Insurance Contributions Act
FISMA Federal Information Security Management Act
FMFIA Federal Managers’ Financial Integrity Act
FPNG Fee Processing Next Generation
FY Fiscal Year
GAAP Generally Accepted Accounting Principles
GIPA Global Intellectual Property Academy
GIs Geographical Indications
GOTS Government-off-the-shelf
GPRA Government Performance and Results (Modernization) Act
GSA General Services Administration
ICANN Internet Corporation for Assigned Names and Numbers
IDP Individual Development Plan
INTA International Trademark Association
IP Intellectual Property
IP5 Five Largest Intellectual Property Offices Worldwide
IPERA Improper Payments Elimination and Recovery Act
IPERIA Improper Payments Elimination and Recovery Improvement Act
IPTF Internet Policy Task Force
ISA/US International Search Authority/United States International Searching Authority
IT Information Technology
LED Light-Emitting Diode
LMF Labor Management Forum
MRF Master Review Form
NAPA National Academy of Public Administration
NTIA National Telecommunications and Information Administration
For more information about these acronyms and abbreviations, please consult the agency’s limited glossary containing some USPTO-specific definitions: www.uspto.gov/main/glossary/.

www.uspto.gov
215
OAPI African Intellectual Property Organization
OBRA Omnibus Budget Reconciliation Act
OCAO Office of the Chief Administrative Officer
OCCO Office of the Chief Communications Officer
OCFO Office of the Chief Financial Officer
OCIO Office of the Chief Information Officer
OEEOD Office of Equal Employment Opportunity and Diversity
OEO Office of Education and Outreach
OGC Office of the General Counsel
OIG Office of Inspector General
OMB Office of Management and Budget
OPD One Portal Dossier
OPIA Office of Policy and International Affairs
OPM Office of Personnel Management
PAIR Patent Application Information Retrieval
PALM Patent Application and Location Monitoring
PAR Performance and Accountability Report
PCT Patent Cooperation Treaty
PE2E Patents End-to-End
PETTP Patent Examiner Technical Training
PLTIA Patent Law Treaties Implementation Act of 2012
POA&M Plan of Actions and Milestones
PP&E Property, Plant, and Equipment
PPAC Patent Public Advisory Committee
PPH Patent Prosecution Highway
PTAB Patent Trial and Appeal Board
PTFRF Patent and Trademark Fee Reserve Fund
PU Production Units
Pub. L. No. Public Law Number
QPIDS Quick Patent Information Disclosure Statement
RAM Revenue Accounting and Management
RCE Request for Continued Examination
SES Senior Executive Service
SIPO State Intellectual Property Office
SMEs Small- and Medium-Sized Enterprises
STEM Science, Technology, Engineering, and Mathematics
SXSW V2V South by Southwest® Venture to Venture Event
TEAPP Telework Enhancement Act Pilot Program
TEAS RF Trademark Electronic Application System Reduced Fee
TEAS Trademark Electronic Application System
TM Trademark
TMEP Trademark Manual of Examining Procedure
TMIN Trademark Information Network
TMNG Trademark Next Generation
TNC Treasury Nominal Coupon
TPAC Trademark Public Advisory Committee
TRIPS Trade-Related Aspects of Intellectual Property Rights
TTAB Trademark Trial and Appeal Board
TTABVUE Trademark Trial and Appeal Board Inquiry System
U.S.C. United States Code
UNCF-ICE United Negro College Fund—Innovation, Commercialization, and Entrepreneurship
UPOV Union for the Protection of New Varieties of Plants
URL Uniform Resource Locator
USPC U.S. Patent Classification
USPTO U.S. Patent and Trademark Office
USTR U.S. Trade Representative
UTD University of Texas at Dallas
WIPO World Intellectual Property Organization
WTO World Trade Organization

PERFORMANCE AND ACCOUNTABILITY REPORT
216
INDEX OF URLsUnaudited, please see the accompanying auditors’ report.

www.uspto.gov
217
MANAGEMENT’S DISCUSSION AND ANALYSIS (MD&A)Performance Highlights FY 2014-2018 Strategic Planhttp://www.uspto.gov/about/stratplan/USPTO_2014-2018_Strategic_Plan.pdf 17
Data Visualization Centerhttp://www.uspto.gov/about-us/performance-and-planning/data-visualization-center 20
PERFORMANCE INFORMATIONIntroduction to the USPTO’s Performance Goals and Results five executive actionshttp://www.uspto.gov/patent/initiatives/uspto-led-executive-actions-high-tech-patent-issues 48
three new initiativeshttp://www.uspto.gov/patent/initiatives/uspto-led-executive-actions-high-tech-patent-issues 48
FY 2014–2018 Strategic Planhttp://www.uspto.gov/about/stratplan/USPTO_2014-2018_Strategic_Plan.pdf 49
the Executive Actions can be found on the USPTO Web site by clicking herewww.uspto.gov/executiveactions 49
Patent and Trademark IT Modernization Is Progressinghttps://www.oig.doc.gov/OIGPublications/OIG-15-004-A.pdf 49
USPTO’s Awarding and Administering of Time-and-Materials and Labor-Hour Contracts Needs Improvementhttps://www.oig.doc.gov/OIGPublications/OIG-15-012-A.pdf 49
USPTO Needs to Strengthen Patent Quality Assurance Practiceshttps://www.oig.doc.gov/OIGPublications/OIG-15-026-A.pdf 49
PATENTS: STRATEGIC GOAL IStrategic Goal I: Optimize Patent Quality and TimelinessJuly 2014http://www.gpo.gov/fdsys/pkg/FR-2014-07-09/pdf/2014-16031.pdf 56
Patents Dashboardhttp://www.uspto.gov/dashboards/patents/main.dashxml 56
about design patents, please click herehttp://www.uspto.gov/patents-getting-started/patent-basics/types-patent-applications/design-patent-application-guide 56
technical details about RCEs, please click herehttp://www.uspto.gov/patents/law/aipa/rcefaq.jsp 57
information about our Technology Centers, please click herehttp://www.uspto.gov/about/contacts/phone_directory/pat_tech/ 58
Patent Law Treaties Implementation Act of 2012http://www.uspto.gov/patent/initiatives/patent-law-treaty 59
“Hague Agreement”http://www.wipo.int/edocs/pubdocs/en/designs/453/wipo_pub_453.pdf 59
in the U.S. National phasehttp://www.uspto.gov/web/offices/pac/mpep/s1893.html 60
“2014 Interim Guidance on Patent Subject Matter Eligibility”http://www.uspto.gov/patent/laws-and-regulations/examination-policy/2014-interim-guidance-subject-matter-eligibility-0 61
Deputy Commissioner for Patent Qualityhttp://www.uspto.gov/patents/init_events/Deputy_Commissioner_for_Patent_Quality.jsp 62
Patent Examiner Technical Training Programhttp://www.uspto.gov/patent/initiatives/patent-examiner-technical-training-program-pettp-0 64

218
Tech Weekhttp://www.uspto.gov/sites/default/files/patents/tech-week-flyer.pdf 64
about the Pro Bono program, please click herehttp://www.uspto.gov/patents-getting-started/using-legal-services/pro-bono/patent-pro-bono-program 70
TRADEMARKS: STRATEGIC GOAL IIStrategic Goal II: Optimize Trademark Quality and TimelinessPlease click here for more information on the trademark application processhttp://www.uspto.gov/trademarks/process/sec1a_timeline.pdf 74
Trademarks pagehttp://www.uspto.gov/trademarks-application-process/filing-online/reduced-fees-teas-application-filing-options 74
Trademark Information Network (TMIN) serieshttp://www.uspto.gov/trademarks-getting-started/process-overview/trademark-information-network 77
legislationhttp://www.gpo.gov/fdsys/pkg/PLAW-113publ227/pdf/PLAW-113publ227.pdf 81
the Basic Fact About Trademarkshttp://www.uspto.gov/trademarks-getting-started/trademark-basics/basic-facts-about-trademarks-videos 82
INTELLECTUAL PROPERTY: STRATEGIC GOAL IIIProvide Domestic and Global Leadership to Improve Intellectual Property Policy, Protection, and Enforcement Worldwide“The USPTO Patent Assignment Dataset: Descriptions and Analysis”http://www.uspto.gov/sites/default/files/documents/USPTO_Patents_Assignment_Dataset_WP.pdf 88
Global Intellectual Property Academy (GIPA)http://www.uspto.gov/learning-and-resources/global-intellectual-property-academy 88
distance-learning moduleshttp://www.uspto.gov/learning-and-resources/global-intellectual-property-academy-gipa/uspto-webinars-and-ip-e-learning 89
“Copyright Policy, Creativity, and Innovation in the Digital Economy” (the “Green Paper”)http://www.uspto.gov/sites/default/files/news/publications/copyrightgreenpaper.pdf 90
WTO TRIPShttps://www.wto.org/english/tratop_e/trips_e/trips_e.htm 93
UPOV-FAQshttp://www.upov.int/about/en/faq.html 93
USPTO Data Visualization Centerhttp://www.uspto.gov/dashboards/externalaffairs/main.dashxml 98
MANAGEMENT GOALManagement Goal: Achieve Organizational Excellencean independent evaluationhttp://napawash.org/images/reports/2015/NAPA%20Final%20USPTO%20Report.pdf 105
2015-2018 USPTO People Planhttp://www.uspto.gov/sites/default/files/documents/USPTO%202015%20-%202018%20People%20Plan.pdf 107
http://www.uspto.gov/trademarks-getting-started/trademark-basics/basic-facts-about-trademarks-videos
http://www.uspto.gov/trademarks-getting-started/trademark-basics/basic-facts-about-trademarks-videos

www.uspto.gov
Acknowledgements
This Performance and Accountability Report was produced with the energies and talents of the USPTO staff.
To these individuals we would like to offer our sincerest thanks and acknowledgement.
In particular, we would like to recognize the following organizations and individuals for their contributions:
Office of the Under Secretary and Director – Robert Houser and Lisa Houston; Office of the Chief Communications Office – Paul Rosenthal, Jeffrey Isaacs, and Patrick Ross; Office of the Chief Administrative Officer – John Hassett; Office of the Chief Financial Officer – Sarah Brown; Frank Murphy; Office of Planning and Budget – Bonita Royall, Dianne Buie, Michael Shaver, Walter Schlueter, and Robert Fawcett; Office of Finance – Shana Willard, Dennis Detar, and Mark Krieger; Office of Policy and International Affairs – Ari Leifman and Janette Brown; Office of the Chief Information Officer – Kevin Smith and Maureen Brown; Office of the General Counsel – Mary Kelly; Patent Trial and Appeal Board – Patrick Martinez; Trademark Trial and Appeal Board – Karen Smith and Latoya Brown; Office of the Commissioner for Patents – David Fitzpatrick; Office of the Commissioner for Trademarks – Nabil Chbouki and Karen Strohecker.
We would also like to acknowledge the Office of the Inspector General and KPMG LLP for the professional manner in which they conducted the audit of the FY 2015 Financial Statements.
We offer special thanks to AOC Solutions, Inc., and Woodward Communications, Inc., for their outstanding contributions in the design and production of this report.
To send comments or provide feedback about this report, please contact:Office of Planning and Budget
600 Dulany StreetAlexandria, VA [email protected]: 571-272-3333
Fax: 571-273-0127

UNITED STATES PATENT AND TRADEMARK OFFICE
600 Dulany Street Alexandria, Virginia 22314www.uspto.gov
For electronic versions of USPTO PARs scan barcode