FY 2005 Business Results
35
0 FY 2005 Business Results FY 2005 Business Results February 10, 2006
-
Upload
khangminh22 -
Category
Documents
-
view
0 -
download
0
Transcript of FY 2005 Business Results

0
FY 2005 Business ResultsFY 2005 Business ResultsFebruary 10, 2006

1
Disclaimer
The figures for the 2005 fiscal year herein, which were prepared in accordance with Korea GAAP, are based on the pre-audited financial statements of Hana Financial Group Inc. (“the Company”), therefore, are subject to any possible changes in the due course. Therefore, certain subsequent events or circumstances, which may occur between the time of reading this presentation and the audit report date, could have a material impact on the accompanying financial statements and notes thereto.
The Company was incorporated, by stock swap transactions among its subsidiaries, Hana Bank, DI&S, Hana I&S, and Hana Institutes of Finance, on December 1, 2005.
The Company’s net income for the 2005 fiscal year was drawn using equity method for subsidiaries’operation results from October 1, 2005 (Deemed acquisition date) to December 31, 2005. However, its consolidated income was prepared using subsidiaries’ operating results for the full year ended December 31, 2005 to enhance comparability with those of previous years.
The operating results of Daehan Investment & Securities Co. Ltd. (“DI&S”) for the year ended December 31, 2005 contains extra-ordinary losses, incurred before Hana Bank’s acquisition, resulted from business restructuring process, which was led by Korean Deposit Insurance Co. (ex-shareholder of DI&S, “KDIC”). Accordingly, normalized operating results of DI&S were used for estimation of the Company’s normal operating results.
Reflecting such grounds mentioned above, the information contained in these slides does not require independent verification. No representation or warranty, express or implied, is made as to, and no reliance should be placed on, the fairness, accuracy, completeness or correctness of any information contained herein, must be presented by the management of the Company, and can not be used for any other purposes other than for the activities related to IR of the Company.

2
Contents
• The Group Overview
• Profitability
• Business Volume
• Asset Quality
• Vision and Strategy

3
The Group Overview
• Financial Statements
• Business Highlights
• Milestone
• Structure and Roles
• Snapshot
4
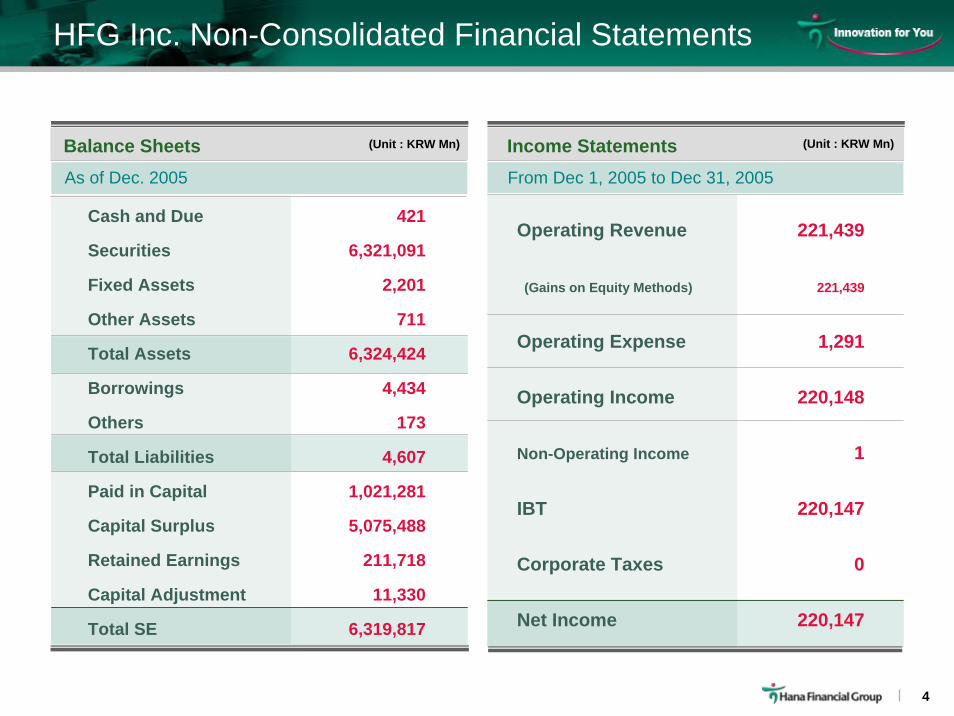
HFG Inc. Non-Consolidated Financial Statements
From Dec 1, 2005 to Dec 31, 2005As of Dec. 2005
Balance Sheets (Unit : KRW Mn)
Cash and Due 421
Securities 6,321,091
Fixed Assets 2,201
Other Assets 711
Total Assets 6,324,424
Borrowings 4,434
Others 173
Total Liabilities 4,607
Paid in Capital 1,021,281
Capital Surplus 5,075,488
Retained Earnings 211,718
Capital Adjustment 11,330
Total SE 6,319,817
Income Statements (Unit : KRW Mn)
Operating Revenue 221,439
(Gains on Equity Methods) 221,439
Operating Expense 1,291
Operating Income 220,148
Non-Operating Income 1
IBT 220,147
Corporate Taxes 0
Net Income 220,147

5
From Jan. 1, 2005 to Dec. 31, 2005
General Operating Income 2,427.2
Interest Income 1,726.0
Non-Interest Income 701.7
SG&A 1,316.3
Income before Provisioning 1,111.4
Provisioning 91.3
Operating Income 1,020.1
Non-Operating Income 225.5
Income before Taxes 1,245.6
Taxes 277.4
Net Income 951.4
As the end of Dec. 2005
* Pro-Forma Income Statements was prepared using subsidiaries’ operating results for the full year ended Dec 31, 2005 to enhance comparability with those of previous years.
Pro-Forma Consolidated Financial Statements of the Group
Balance Sheets (Unit: KRW Bn)
Loans 62,666.4
Securities 15,632
Dues from Banks 1,682.6
Other Revenue Earning Assets 18,211.5
Non Revenue Earning Assets 8,115.3
Total Assets 106,308.5
Deposits 62,024.6
Borrowings/Debentures 20,422.3
Other Liabilities 17,232.5
Total Liabilities 99,679.4
Shareholders’ Equity 6,629.1
Total Liab. & SE 106,308.5
(Unit: KRW Bn)Income Statements

6
2005 Business Highlights of the Group
Net Income 951.4 KRW Bn
ROE 16.28%
EPS 4,658 KRW
ROA 1.07%

7
Milestone of the Group
80%
100%
120%
140%
160%
180%
MarketCAP
4.9 KRW Tn
+76%
22%p outperformed relative to the market
Promotion Committee for the Establishment of HFG. May 16, 2005
Acquisition of DI&SMay 2, 2005
Establishment of HFG Dec. 1, 2005
Obtained Approval for the Establishment of HFG. Oct. 18, 2005
Moody’s Baa1
S&P A-
Fitch A-
MarketCAP
9.5 KRW Tn
Jan.1,2005 Dec.31,2005
HanaBank and HFG
Kospi index

8
Structure and Roles of the Group
Credit Card
Products CombiningFinance & Distribution
Hana Securities
Pipeline for Derivatives& Capital Market Product Supply
ITMC
World ClassAsset Mgmt. Company
Hana Life Insurance
Optimized Insurance Portfolio for Customer Needs
Hana CapitalProduct Development in Consumer Finance
Hana Bank
Main Distribution Channelof Financial Group
DI&S
Open ArchitectureFund Store
Hana I&S
IT Support for Financial Group
Hana Institute of Finance
Think Tank of Financial GroupShared Knowledge Center
HFG
Group Planning & Strategy,Financial Management
Strategy &Shared Services
Product Development Engine
Distribution Channel

9
The Snapshot of the Group
Net Income
Asset
144
3616
Capital
1991 1995 2000 2005 1991 1995 2000 2005
Branch & Employees
1995 2000 2005
951
106.3
51.2
16.02.4
1991
0.3 0.81.8
6.3
1991 1995 2000 2005 1991 1995 2000 2005
Branch Employees
1156
267
682
522 1,456
3,276
7,120
(unit : KRW Tn) (unit : KRW Tn)
(unit : KRW Bn)
Hana Bank HFG

10
Profitability• Pro-Forma Consolidated I/S (Group)
• Operating Income Breakdown
• NIS & NIM Trends (Bank)
• Non- Interest Income (Bank)
• Fees and Commissions (Group)
• Credit Card (Bank)
• C/I Ratio (Group)
11
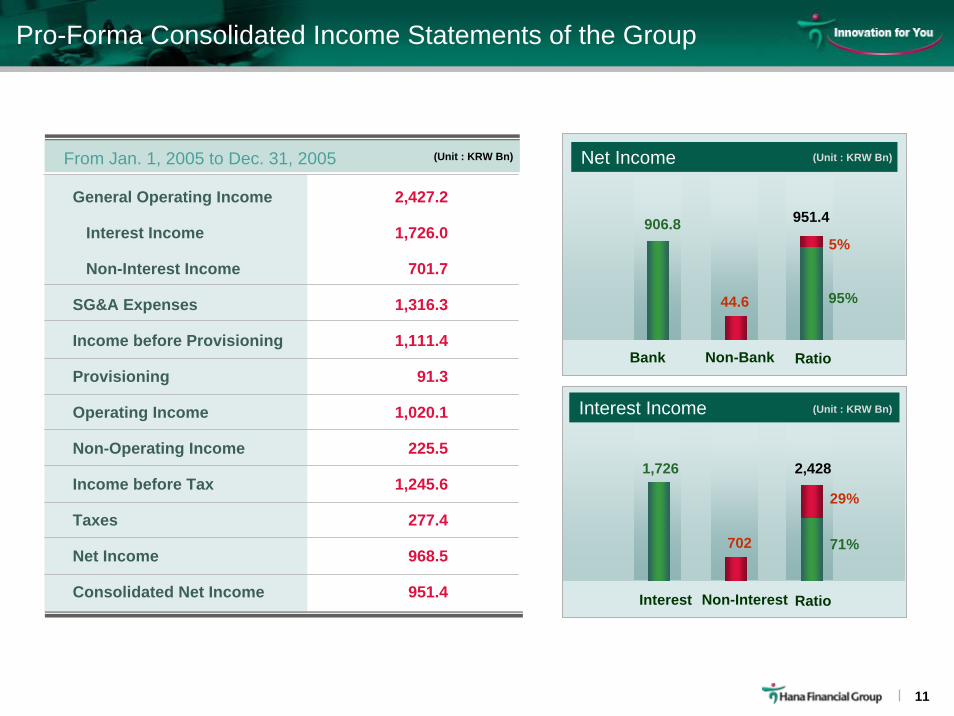
Net Income
Interest Non-Interest Ratio
1,726
702 71%
29%
Pro-Forma Consolidated Income Statements of the Group
906.8
44.6
Bank Non-Bank Ratio
General Operating Income 2,427.2
Interest Income 1,726.0
Non-Interest Income 701.7
SG&A Expenses 1,316.3
Income before Provisioning 1,111.4
Provisioning 91.3
Operating Income 1,020.1
Non-Operating Income 225.5
Income before Tax 1,245.6
Taxes 277.4
Net Income 968.5
Consolidated Net Income 951.4
95%
5%
Interest Income
2,428
From Jan. 1, 2005 to Dec. 31, 2005
951.4
(Unit : KRW Bn)
(Unit : KRW Bn)
(Unit : KRW Bn)

12
Operating Income Breakdown
Interest 76
Commissions 72
Disposition &
Valuation- 100
Others- 83
Interest38
Securities115
Brokerage102
Others109
2004
Bank
2005
Bank
2005
HFG
(unit : KRW Bn)Bank->HFG
2,4272,099 2,064
363363

13
Interest Revenue & Interest Expense
NISNIS 2.18 2.19 2.09 2.18 2.19 2.09 2.22 2.13 2.42*
Average Lending Rate 5.81 5.76 5.55 5.63 5.53 5.94
Average Funding Rate 3.63 3.57 3.46 3.41 3.40 3.52
NIMNIM 2.14 2.14 2.06 2.14 2.14 2.06 2.19 2.15 2.50*
NIM & NIS Trends (Bank)
2004 3Q 4Q 2005 1Q 2Q 3Q 4Q
(Unit : KRW Bn)
Int. RevenueInt. Expense
4,070 4,1484,362
2,0472,606 2,573
2,8982,690
2002 2003 2004 2005
(Unit : %, Quarterly Cumulative Basis)
* New FSS Standard. Previous FSS Standard: NIM 2.22%, NIS 2.21% [Quarterly Cumulative Base]
** New FSS Standard. Previous FSS Standard: NIM 2.16%, NIS 2.16% [Yearly Cumulative Base]
NIS & NIM (Unit : %)
1.96
2.21
2.38**
2.35**
2.372.14
2.032.10
2002 2003 2004 2005
NIMNIS

14
Fee IncomeFee Income 835.4
Credit Card 245.5
Beneficiary Certi. 142.0
Others in KRW 119.1
Others in FC 56.3
Trust 63.5
Brokerage 102.1
Bancassurance 49.4
Other Fee Income 57.5
OthersOthers -133.7
NonNon--Interest IncomeInterest Income 701.7
2005
566
269 68%
32%
BANK Non-Bank Ratio
(Unit : KRW Bn)
Non-Interest Income (Group)
HFG
Fee Generation
Fee Composition Breakdown
Credit Card 29%
Bene. Cert. 17%KRW.14%
Trust 8%
Other Fee Income7%
FC 7%
Brokerage 12%
Bancassurance 6%
(Unit : KRW Bn)
835

15
Fee and Commissions (Group)
2003 2004 20052003 2004 2005
Commission
2003 2004 20052003 2004 2005
Initial Premium Total
Beneficiary Certificates (Funds)
Bancassurance*
16.8 16.7114 113
10274.0
5.7
91.4
(unit : KRW Bn)Sales Commission
243197
315
11
2949
(unit : KRW Bn)
(unit : KRW Tn)
DI&S
Hana Bank
14.4
142
* Hana Bank only
(unit : KRW Bn)

16
Credit Card (Bank)
Credit Card Asset
Lump Sum
Installment
Cash Advance
Sales
Lump Sum
Installment
Cash Advance
Fee Income*
Holders (thousands)
2003 2004 2005
* Corporate purchase card included
974 9201,031
651618796
2003 2004 2005
2.42.0
2.5
2005 2004 YoY %YoY
1,031
464
332
215
8,917
5,396
1,466
2,054
246
2,536
920
365
286
233
7,747
4,168
1,213
2,365
235
2,035
111
99
46
-17
1,170
1,228
254
-311
11
501
12%
27%
16%
-7%
15%
29%
21%
-13%
5%
25%
(Unit: KRW Bn)
4.6%2.1%
1.8%
45%58% 63%
250235
246 Fee Income(KRW Bn)Members (Mn)Usage Ratio
Delinquency
Card Asset
Card Sales Asset
Credit Card Asset Trends (unit : KRW Bn)
Client Growth Trends

17
Salaries & Wages 598.7
Office Expenses 462.0
Taxes and Dues 52.9
Provisions for Severance 66.9
Depreciation 135.8
Total 1,316.3
C/I Ratio (Group)C/I Ratio (Group)
C/I Ratio (Group)
Salaries
44.0% 42.3% 42.1%
Office Expense
☞ C/I Ratio based on cost excluding amortization of Goodwill
2002 2003 2004 2005
48.4%
202
379
219
882527
Hana Bank C/I Ratio (Unit : KRW Bn)
355
457
228
1,041
327
379
219
925
306
348
228
Others
2005
(Unit: KRW Bn)
54.2%

18
Business Volume • Total Assets and Total Sales (Group)
• Loan (Bank)
• Deposit in KRW (Bank)

19
Loans 62.7
Securities 15.6
Dues From Banks 1.7
Credit Card 2.0
Stocks 2.8
Trust 10.9
Others 2.5
Non Revenue Earning 8.1
Total 106.3
(Unit: KRW Tn)
Total Assets
Total Assets & Total Sales (Group)
Total Sales
Total Sales 72.9
B / A 61.6
LCF 20.6
Others 41.0
T / A 11.3
Sales of Indirect Products 24.2
Beneficiary Cert. 23.9
Bancassurance 0.3
Total 97.2
(Unit: KRW Tn)
2005 2005

20
Loan Portfolio
Loan (Bank)
Household
Unsecured
Secured
SME
SOHO
Large Corp
TotalTotal
53.8 56.9
2003 2004 2005
21.1
18.8
Household (Unsecured) Household (Secured)SME Large Corp.
9.1
22.7
19.5
9.3
23.7
20.9
9.7
60.8
4.7 5.36.5
(Unit: KRW Tn)
2005 2004
28.0
5.3
22.7
19.5
5.9
9.39.3
56.956.9
30.2
6.5
23.8
20.9
5.7
9.79.7
60.860.8
2.2
1.1
1.0
1.4
-0.1
0.30.3
3.93.9
7.7%
21.5%
4.5%
7.2%
-2.0%
3.6%3.6%
6.9%6.9%
%YoYYoY (Unit: KRW Tn)

21
Deposit in KRW (Bank)
(Unit: KRW Bn)
Low Cost Funding 16,360 14,844 1,517 10.2%
Core Deposit 9,570 9,030 539 6.0%
Demand Deposit 2,490 2,606 -115 -4.4%
Passbook 7,080 6,425 655 10.2%
MMDA 6,791 5,813 977 16.8%
Time Deposit 28,943 31,737 -2,794 -8.8%
Installment Deposit 6,664 5,783 882 15.2%
Marketable Deposit 5,464 3,691 1,773 48.0%
TotalTotal 57,43157,431 56,05456,054 1,3771,377 2.5%2.5%
28.5%
25.9%26.5%
16.4% 16.1%16.7%
LCF / Total Core Deposit / Total
2003 2004 2005
14.816.4
13.9
8.89.6
9.0
LCF Trend (Unit : KRW Tn)2005 2004 %YoYYoY

22
Asset Quality• Asset Classification (Bank)
• Delinquency (Bank)
• Provisioning (Bank)

23
Total Credit NPL Precautionary
2005 2004 YoY %YoY
(Unit: KRW Bn)
Normal
Precautionary
Substandard
Doubtful
Estimated Loss
Total Credits
Precautionary & Below
Substandard & Below
Allowance
Cov. (Precau. & Below)
Cov. Against Sub.& Below
2002 2003 2004 2005
Asset Classification (Bank)
Precautionary & NPL
1,047
980
1,435 1,350
1,134
863636
1,060
56.357.2
60.165.0
63,258
1,060
473
83
79
64,954
2.61%
0.98%
811
47.9%
127.6%
57,861
1,350
606
133
124
60,074
3.68%
1.44%
966
43.6%
111.9%
5,397
-290
-133
-50
-45
4,879
-1.07%
- 0.46%
-155
4.2%
15.7%
9%
-22%
-22%
-37%
-36%
8%
-16.0%
(Unit: KRW Tn)

24
1.090.991.13 0.92
1.471.35
1.66
0.92
4.67
2.10 2.39 2.09
1.06
1.94
0.92
2004 3Q 4Q 2005 1Q 2Q 3Q
Total Credit CardCorporate Household
1.49
1.20 1.32
0.95 1.02
4Q
0.88
1.80
0.83
0.89
Delinquency (Bank)
Delinquency Trend (Unit : %)2005 2004 YoY %YoY
(Unit: KRW Bn)
Delinquency Ratio (%)
Delinquency Amount
Total Loans
Corporate
Large Corp.
SME
Household
Unsecured
Mortgage
Credit Card
0.89%
564.9
63,810
277.8
4.2
273.5
251.2
31.1
220.1
35.9
1.20%
708.2
58,995
391.4
1.8
389.6
276.8
30.6
246.2
40.0
-0.31%
-143.3
4,815
-113.6
2.4
-116.1
-25.3
0.5
-26.1
-4.1
-
-20.2%
8.2%
-29.0%
135.1%
-29.8%
-9.1%
1.6%
-10.5%
-10.3%

25
Provisioning (Bank)
Transfer to Reserve for PLL (Unit : KRW Bn)
829322
154
2002 2003 2004 2005
96
1.74%1.98%
1.44%
0.98%
Sub & Below
Amount
Coverage Ratio
2002 2003 2004 2005
95.1%98.3%
111.9%127.6%
46.0%43.4% 43.6%
47.9%
Sub & Below
Precau. & Below
(Unit : KRW Bn)
Quarterly YoY%
1Q 2Q 3Q 4Q
Corporate 195.3 35.3 0.5 17.8 19.9 73.5 - 62.4%
Household 78.5 24.1 -0.4 5.3 -3.4 25.5 - 67.5%
Credit Card 47.7 3.7 3.4 5.5 -16.2 -3.5 - 107.3%
Total 321.5 63.1 3.5 28.6 0.3 95.5 -70.3%
Transfer to reserve for possible loan loss
2004 2005

26
Strategy• Vision 2009
• Vision Roadmap
• Management Strategies
• Synergy Strategies

27
Vision 2009
Premier Financial Service Network
World’s Top 100Financial Group Quality Excellence
Asset Tier 1 MarketCap
EnhanceNon-Banking
Sector
EnhanceRegionalNetworkin Asia
RiskManagement by GlobalStandard
Maximize Group SynergyBanking + Non-Banking + Collaborated Product + Brand Value + Human Resources
Leading Financial Group in East Asia

28
Vision Roadmap
1991 1998 2002 2004 2005 2006 2009
Asset 1.3
4488
92130 (E)
2003
StreamlineOrganization
Build aDistinctivePlatform
LeveragePlatform for AcceleratedGrowth
PremierFinancial ServicesNetwork
•Transformed to Bank
Hana Bank• P&A with
ChungchongBank
• M&A with Boram Bank
Hana Bank
• M&A withSeoul Bank
NewHana Bank
Hana FinancialNetwork
Hana Financial
Group Inc.
Top 3 by Total Asset
In Korea
Top 1by Productivity
& Asset Quality
In Korea
World Top 100
by Tier 1 Capital & Total Asset
World Top 100by Market
Capitalization
(Unit : KRW Tn)

29
Management Strategies
Banking Sector
Achieving
Vision
• Sharing of Customer & Cross Selling
• Integrated Sales Strategy Promotion
• Collaborated Product Development
• Specialized Human Resource
• Efficiency in Cost & Management
• Expansion of Managerial Strategic Flexibility
Non-BankingSector
• Securities• Insurance• Asset Mgmt.• Credit Card• Capital
Maximizing Group Synergy2006 2009
Hana I&S
IT Support for Financial Group
Hana Institute of Finance
Think Tank of Financial GroupShared Knowledge Center
HFG
Group Planning & Strategy,Financial Management
Strategy &Shared Services

30
Synergy Strategies
• Restructure group branch strategy• Pursue BIB, BWB
• Review HWA and upgrade product portfolio• Release group package products (inc. credit cards)
• Increased customer information sharing (target marketing)• Utilize customer information at call center
• Integrated group marketing • Establish cross-selling index
• Integrated procurement system
Establish one-stop financial service station based business model
Development of competitive group products
Establish and pilot test integrated CRM
Increase cross-selling customers
Realize cost synergies
Launch integrated service channel to pursue growth through a comprehensive financial business model

31
Appendix • Major Shareholders
• HFG Domestic Operation Network
• Organizational Structure of HFG

32
Major Shareholders
Capital Structure
5,597
(499.6)
-
5,075
1,021
1st Dec. 2005 2005
211.7Retained Earnings
6,320Total ShareholdersEquity
11.3Capital Adjustment
5,075Capital Surplus
1,021Paid- In Capital
Source: Company, As the end of 2005
Temasek Templeton Allianz NationalPension
Fund
9.06%
8.13%
4.84%3.41%
9.34%
GoldmanSachs
Major Shareholders (unit : KRW Bn)
33Source: Company
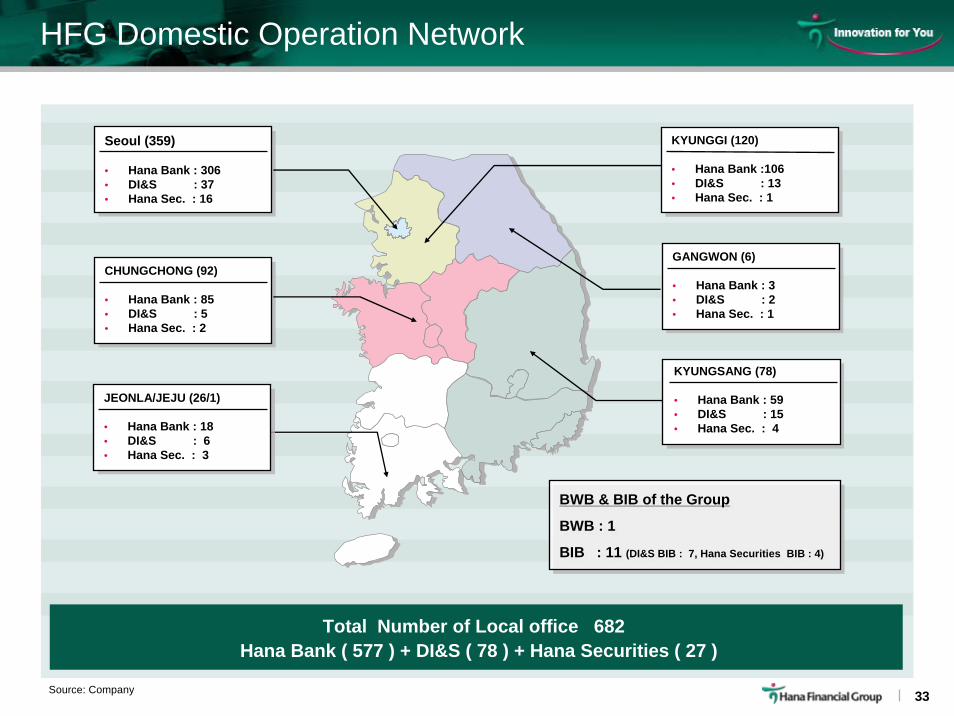
HFG Domestic Operation Network
Total Number of Local office 682 Hana Bank ( 577 ) + DI&S ( 78 ) + Hana Securities ( 27 )
CHUNGCHONG (92)
• Hana Bank : 85• DI&S : 5• Hana Sec. : 2
Seoul (359)
• Hana Bank : 306• DI&S : 37• Hana Sec. : 16
JEONLA/JEJU (26/1)
• Hana Bank : 18• DI&S : 6• Hana Sec. : 3
KYUNGGI (120)
• Hana Bank :106• DI&S : 13• Hana Sec. : 1
GANGWON (6)
• Hana Bank : 3• DI&S : 2• Hana Sec. : 1
KYUNGSANG (78)
• Hana Bank : 59• DI&S : 15• Hana Sec. : 4
BWB & BIB of the Group
BWB : 1
BIB : 11 (DI&S BIB : 7, Hana Securities BIB : 4)
BWB & BIB of the Group
BWB : 1
BIB : 11 (DI&S BIB : 7, Hana Securities BIB : 4)

34
Organizational Structure of HFG
BOD
GSM
Financial Planning Team
Chairman & CEO
CEO & President
Steering Committee for BOD
Audit Committee
Outside DirectorNomination Committee
Risk Management Committee
Management Compensation Committee
Management Strategy Committee
General Service Team Synergy Integration Team Audit & Compliance Team
Public Relations Team Risk Management TeamSubsidiary
Management TeamStrategy
Development Team
Source: Company