FY 2005 Performance and Accountability Report - NASA
259
National Aeronautics and Space Administration FY 2005 Performance and Accountability Report (Text-only Version) www.nasa.gov Cover photo caption: Discovery lingers at the foot of launch pad 39B in the evening twilight on April 6, 2005, during its first roll out. (Photo: S. Andrews/NASA)
-
Upload
khangminh22 -
Category
Documents
-
view
0 -
download
0
Transcript of FY 2005 Performance and Accountability Report - NASA

National Aeronautics and Space Administrat ion
FY 2005 Performance and Accountability Report
(Text-only Version)
www.nasa.gov
Cover photo caption: Discovery lingers at the foot of launch pad 39B in the evening twilight on April 6, 2005, during its first roll out. (Photo: S. Andrews/NASA)

INTRODUCTION TO NASA’S PERFORMANCE AND ACCOUNTABILITY REPORT This is the National Aeronautics and Space Administration’s (NASA) Fiscal Year 2005 (FY 2005) Performance and Accountability Report. It is a detailed account of NASA’s performance in achieving the Agency’s annual goals and long-term objectives for its programs, management, and budget. This report includes detailed performance information and financial statements as well as management challenges and NASA’s plans and efforts to overcome them.
NASA’s FY 2005 Performance and Accountability Report was created to meet various U.S. Government reporting requirements (including the Government Performance and Results Act, the Chief Financial Officers Act of 1990, and the Federal Financial Management Improvement Act of 1996). However, it also presents the Agency with an opportunity to tell the American people how NASA is doing. This introduction is intended to familiarize the reader with the types of information contained in this report and where that information is located.
NASA’s Performance and Accountability Report is divided into three major sections:
Par t 1—Management Discussion & Analys is. Part 1 presents a snapshot of NASA’s FY 2005 performance achievements. Part 1 also addresses financial and management activities, including NASA’s response to challenges and high-risk areas identified by NASA and outside organizations, and the Agency’s progress on implementing the six initiatives of the President’s Management Agenda.
Par t 2—Detai led Per formance Data. Part 2 provides detailed information on NASA’s progress toward achieving specific milestones and goals as defined in the Agency’s FY 2005 Performance Plan Update. Part 2 also describes the actions that NASA will take in the future to achieve goals that the Agency did not meet in FY 2005.
Par t 3—Financials. Part 3 includes NASA’s financial statements and an audit of these statements by independent auditors, in accordance with government auditing standards.
Appendices. The Appendices include a list of Office of Management and Budget Program Assessment Rating Tool (PART) Recommendations, the Office of Inspector General Summary of Serious Management Challenges and audit follow up reports required by the Inspector General Act.

FY 2005 Performance and Accountability Report i
TABLE OF CONTENTS
PART 1: MANAGEMENT DISCUSSION & ANALYSIS 1 Message from the Administrator 2
Why Explore Space? 2 Looking Forward 2 Reliability and Completeness of Performance and Financial Data and FFMIA Certification 3 Administrator’s Statement of Assurance 4
Vision, Mission, Values, and Organization 6
FY 2005 Performance Achievement Highlights 9 Returning to Flight 9 Life on Earth 11 Working in Space 16 Exploring the Universe 21 Measuring NASA’s Performance 28
Confronting the challenge of measuring performance 28 Program Assessment Rating Tool 29 The President’s Management Agenda 29
Summary of NASA’s FY 2005 Performance Ratings 30 NASA Performance Achievement Scorecard 33 NASA’s Budgeted Cost of Performance 37
FY 2005 Financial Summary 39
Legislative Requirements, OMB Guidelines, and Internal Controls 41
PART 2: DETAILED PERFORMANCE DATA 45 Introduction to NASA’s Detailed Performance Data 46
NASA’s Progress and Achievements in FY 2005 50 NASA’s Performance Improvement Plan 144
PART 3: FINANCIALS 160 Letter from the Chief Financial Officer 161
Financial Overview 163 Independent Audit Reports 207 Chief Financial Officer Response to the Independent Audit Reports 237
APPENDICES 238 Appendix 1: OMB Program Assessment Rating Tool (PART) Recommendations 239
Appendix 2: Office of Inspector General Summary of Serious Management Challenges 244 Appendix 3: Inspector General Act Amendments Reports 253

FY 2005 Performance and Accountability Report 1
Part 1: Management Discussion & Analysis Divider page photo caption: Shuttle Discovery gets a piggyback ride from NASA’s Boeing 747 from Edwards Air Force Base in California, where STS-114 landed on August 9, 2005, to Kennedy Space Center in Florida. The cross-country trip took two days and included several stops for refueling. The 747, a commercial jet modified to hold the extra weight of a Shuttle, serves as a ferry between landing sites and the launch complex at Kennedy. The Shuttle is placed atop the jet by a gantry-like structure that hoists the Shuttle off the ground high enough to drive the jet underneath. (Photo: C. Thomas/NASA)
Divider back page photo caption: NASA’s two highly-modified F-15 research jets go through their paces over NASA Dryden Flight Research Center during a mission in late July 2005 that supported the Intelligent Flight Control System project. The F-15B 837 (bottom), which was flying validation flights for the project, is refueled by a KC-135 tanker. The pilot of the F-15B 836 (top) flew safety chase for the other jet and practiced aerial refueling.
The Intelligent Flight Control System project seeks to incorporate self-learning neural network concepts into flight control software to enable a pilot to maintain control and safely land an aircraft that has suffered a major systems failure or combat damage. The adaptive neural network software “learns” the new flight characteristics, onboard and in real time, thereby helping the pilot to maintain or regain control and prevent a potentially catastrophic aircraft accident. NASA’s F-15B 837 is equipped with the test software and is modified from a standard F-15 configuration. The flight in the picture was part of a test leading to the start of Generation II flights planned for later in 2005. (Photo: C. Thomas/NASA)

FY 2005 Performance and Accountability Report 2
MESSAGE FROM THE ADMINISTRATOR Nearly two years ago, President George W. Bush committed the Nation to a new direction in space that set forth a fresh, clear mission for NASA. Throughout FY 2005, NASA enthusiastically worked to advance the Vision for Space Exploration, an ambitious plan for human and robotic space exploration that will advance America’s economic, scientific and security interests. This year, we achieved the Vision’s first goal—returning the Space Shuttle to flight. Next, we will complete the International Space Station and return humans to the Moon in preparation for subsequent voyages to Mars and beyond.
Why Explore Space? The spirit of exploration is embedded in our human DNA. Humans explore, and space exploration is the frontier of our time.
We see plainly from the evidence of history that those nations that have made a sustained commitment to exploration have prospered in the long run. In the process of exploring space, we develop new technologies and capabilities with the potential to benefit billions of people here on Earth. Spaceflight also provides unprecedented opportunities for the United States to lead peaceful and productive international relationships in the world community.
Over the past 12 months, NASA has made significant strides in advancing the Vision for Space Exploration, putting the Agency in a better position to address the challenges ahead.
Looking Forward Even as we are returning the Space Shuttle to flight, we are making plans for its retirement by 2010, because America requires a new generation of spacecraft to meet our challenging new exploration goals. We will utilize the Shuttle fleet in a disciplined, measured fashion over the next five years to complete assembly of the International Space Station. If feasible, we also will conduct a mission to service the Hubble Space Telescope.
NASA will use, to the fullest extent possible, commercially developed cargo resupply and crew rotation capabilities for the Station. This approach is a key component of the Vision: generating competition in the private sector that will result in savings that can be applied elsewhere in the program, and promoting further commercial opportunities in the aerospace industry.
After completing the Space Station, we will focus on the challenge of exploration beyond low Earth orbit. The basic element of our exploration architecture is, of course, the launch system. This new generation of spacecraft will be based on proven designs and technologies from the Apollo and Space Shuttle programs while having far greater capabilities to carry larger and heavier cargos into space for longer duration exploration missions.
Finally, but perhaps most important, we will continue NASA’s internal organizational evolution to ensure that the United States remains a “leader in aeronautical and space science and technology and in the application thereof to the conduct of peaceful activities within and outside the atmosphere,” as decreed in the National Aeronautics and Space Act of 1958, the legislation that created NASA.
It is our Nation’s privilege and obligation to lead the world to places beyond our own and to help shape the destiny of our world for centuries to come. The NASA family, supported by our partners and stakeholders, will lead this visionary program of exploration and discovery on behalf of the American people.

FY 2005 Performance and Accountability Report 3
Reliability and Completeness of Performance and Financial Data and FFMIA Certification In submitting this report of our achievements and challenges in FY 2005, NASA accepts the responsibility of reporting performance and financial data accurately and reliably with the same vigor as we conduct our scientific research. For FY 2005, I can provide reasonable assurance that the performance data in this report is complete and reliable. Performance data limitations are documented explicitly.
In accordance with the Federal Financial Management Improvement Act (FFMIA), NASA’s Integrated Financial Management System Core Financial Module (IFMSCFM) produces financial and budget reports. However, because of unresolved data conversion issues, the system is unable to provide reliable and timely information for managing current operations and safeguarding assets. Although the IFMSCFM is transactional-based, it does not record all transactions properly at the account detail level required in the U.S. Standard General Ledger. Therefore, NASA’s IFMSCFM does not comply fully with the requirements of the FFMIA, and the independent auditors were unable to render an opinion on our FY 2005 financial statements. Instead, they issued a disclaimer of opinion. Therefore, I cannot provide reasonable assurance that the financial data in this report is complete and reliable. We will continue to focus on bringing the system into compliance.
It is my pleasure and privilege to submit NASA’s FY 2005 Performance and Accountability Report.
(Original signed by Administrator Griffin)
Michael D. Griffin NASA Administrator

FY 2005 Performance and Accountability Report 4
Administrator’s Statement of Assurance NASA submits a qualified Statement of Assurance for Fiscal Year (FY) 2005 because we are reporting four material weaknesses. In response to recommendations of the NASA Operations Management Council, I have agreed to the external reporting of material weaknesses in Space Shuttle Return to Flight, Asset Management, Financial Management System, and Financial Management Data Integrity.
In FY 2005, the Space Shuttle completed STS-114, the first of a planned two-flight program to test and validate the improvements made to the Space Shuttle during Return to Flight. The second test flight, STS-121, was delayed due to the safety implications of unexpected external tank foam-loss events observed during STS-114’s ascent. The causes of these events are being resolved and, after reviewing the Space Shuttle flight schedule, STS-121 is targeted for launch in FY 2006. This material weakness will be targeted for closure in FY 2006 pending the completion of planned test and validation activity associated with STS-121.
For FY 2005, I am reporting three material weaknesses assigned primarily for correction to the NASA Chief Financial Officer (CFO): (1) Asset Management; (2) Financial Management System; and (3) Financial Management Data Integrity. The CFO will develop corrective action plans with Offices of the Integrated Enterprise Management Program, Infrastructure and Administration, the Chief Information Officer, and Procurement.
NASA’s summary of its four material weaknesses included in the FY 2005 Performance and Accountability Report is discussed below.
(Original signed by Administrator Griffin)
Michael D. Griffin Administrator
Space Shuttle Return to Flight NASA’s Return to Flight process has been guided by the 15 Return to Flight recommendations of the Columbia Accident Investigation Board and the Space Shuttle program’s internally generated “raise the bar” actions. NASA’s implementation of the Board’s Return to Flight recommendations has been independently assessed by the Return to Flight Task Group. NASA’s overall Return to Flight progress has been documented in the periodically updated Implementation Plan for Space Shuttle Return to Flight and Beyond.
On August 17, 2005, the Return to Flight Task Group released its Final Report. In it, the Task Group unanimously closed out all but three of the Board’s Return to Flight recommendations. The Task Group could not reach consensus on whether NASA’s actions fully met the intent of three of the Board’s most challenging recommendations: External Tank Thermal Protection System Modifications (3.2-1), Orbiter Hardening and Impact Tolerance (3.3-2) and Thermal Protection System On-Orbit Inspection and Repair (6.4-1). The Task Group noted NASA had made substantial progress relative to these recommendations, and emphasized that, “The inability to fully comply with all of the [Board’s] recommendations does not imply that the Space Shuttle is unsafe.” The first two Return to Flight missions, STS-114 and STS-121, will provide the data and flight experience needed to address the remaining open issues in these recommendations. This work will be documented in future updates to the Implementation Plan.
NASA made the decision to proceed with the launch of STS-114 on July 26, 2005, based on the Return to Flight Task Group’s assessment, the totality of improvements made to the Space Shuttle

FY 2005 Performance and Accountability Report 5
system during Return to Flight, and the vetting of all these improvements through a rigorous and multilayered engineering review process.
Postflight analysis of STS-114 indicated that, except for one event, the thermal protection system on the external tank performed within expected parameters. Most of the small foam shedding events that were observed with the newly upgraded imagery and sensor capabilities posed little or no threat to the orbiter. The one event of concern was the loss of an approximately one pound piece of foam from the area of the external tank’s liquid hydrogen protuberance air load (PAL) ramp. NASA commissioned two teams (one led by the Space Shuttle propulsion manager, the other an independent “Tiger Team” reporting directly to the Associate Administrator for Space Operations) to analyze these foam-loss events and recommend any forward work that would have to be done prior to the launch of the next mission, STS-121.
As of September 2005, NASA is reviewing flight opportunities for future missions, given the effects of Hurricane Katrina (which caused extensive damage to the area around the External Tank manufacturing facility near New Orleans) on ongoing foam-loss troubleshooting and normal processing activities. NASA is targeting the May 2006 launch window as the next opportunity to launch STS-121.
Asset Management The material weakness that was identified as Contractor-Held Property in last year’s Performance and Accountability Report has been renamed and redefined to more accurately describe the scope and complexity of the management challenges associated with accurately reporting the value and maintaining inventory of NASA’s property. Asset Management, the new name of the control deficiency, includes two components: (1) Contractor-Held Property and (2) NASA-Held Property. At the November 2005 Operations Management Council meeting, NASA Senior Officials acknowledge that challenges in Asset Management were multifaceted, cross-functional issues, and the Council tasked the Chief Financial Officer, the Assistant Administrator for Procurement, and the Assistant Administrator for Infrastructure and Administration to jointly develop a plan that will improve management controls over property, plant, equipment, and materials.
Financial Management System The Integrated Enterprise Management Program’s (IEMP) Core Financial system has also been identified as a material weakness due to ongoing challenges related to system configuration and financial reporting issues. In FY 2003, financial data from 10 disparate legacy financial systems that were supported by over 120 subsidiary systems, along with over a decade of historical data, was migrated to a single, integrated Core Financial System. A number of system processing and configuration management issues continue to be identified as NASA works toward stabilization of the system. The Offices of the Chief Financial Officer, the Chief Information Officer, and the Program Executive Officer for the IEMP will jointly craft a plan for correcting this deficiency.
Financial Management Data Integrity NASA is committed to making improvements in financial management that will yield accurate and timely financial information. To achieve that goal, NASA’s Financial Management, Procurement, Infrastructure and Administration, and IEMP communities must partner in developing and implementing process changes that will help ensure accurate information is accumulated and reported in the Core Financial System for all accounts, including Environmental Liabilities and reconciliation of the Agency’s Fund Balances with Treasury. The Chief Financial Officer will partner with the Offices of Infrastructure and Administration, Procurement, and the IEMP to develop a sound data integrity plan.

FY 2005 Performance and Accountability Report 6
VISION, MISSION, VALUES, AND ORGANIZATION NASA is the Nation’s leading government research and development organization in the fields of aeronautics and space. Together with the Agency’s international partners, as well as partners in other federal agencies, the private sector, and academia, NASA uses its unique skills and capabilities to continue the American tradition of exploration and pioneering and to redefine what is possible for the benefit of all humankind.
NASA’s Vision On January 14, 2004, President George W. Bush announced A Renewed Spirit of Discovery: The President’s Vision for U.S. Space Exploration, a new directive for the Nation’s space exploration program. The fundamental goal of this directive is “. . . to advance U.S. scientific, security, and economic interests through a robust space exploration program.” In issuing it, the President committed the Nation to a journey of exploring the solar system and beyond: returning to the Moon in the next decade, then venturing further into the solar system, ultimately sending humans to Mars and beyond. He challenged NASA to establish new and innovative programs to enhance understanding of the planets, to ask new questions, and to answer questions that are as old as humankind.
NASA enthusiastically embraced the President’s directive as the Agency’s Vision and published it as The Vision for Space Exploration in February 2004. That document embodies the strategy NASA will follow to extend a human presence throughout the solar system.
NASA’s Mission Congress enacted the National Aeronautics and Space Act of 1958 to provide for research into problems of flight within and outside the Earth’s atmosphere and to ensure that the United States conducts activities in space devoted to peaceful purposes for the benefit of humankind. Nearly 50 years later, NASA continues to pursue this mission and responsibly direct, as mandated by Congress, the Nation’s civil aeronautics and space activities.
In FY 2005, NASA proudly continued the traditions begun in 1958: utilizing the Agency’s unique competencies in scientific and engineering systems to carry out and achieve this mission.
NASA’s Values NASA is privileged to take on missions of extraordinary risk, complexity, and national priority. NASA employees recognize their responsibilities and are accountable for the important work entrusted to them. The Agency’s four shared core values express the ethics that guide NASA’s behavior. They are the underpinnings of NASA’s spirit and resolve.
• SSafety: NASA’s constant attention to safety is the cornerstone upon which the Agency builds mission success. NASA employees are committed, individually and as a team, to protecting the safety and health of the public, NASA team members, and the assets that the Nation entrusts to the Agency.
• TTeamwork: NASA’s most powerful tool for achieving mission success is a multi-disciplinary team of competent people. The Agency builds and values high-performing teams that are committed to continuous learning, trust, and openness to innovation and new ideas.
• IIntegri ty: NASA is committed to an environment of trust, built upon honesty, ethical behavior, respect, and candor. Building trust through ethical conduct as individuals and as an organization is a necessary component of mission success.

FY 2005 Performance and Accountability Report 7
• MMission Success: NASA’s purpose is to conduct successful space missions on behalf of the Nation. NASA undertakes these missions to explore, discover, and learn. And, every NASA employee believes that mission success is the natural consequence of an uncompromising commitment to technical excellence, safety, teamwork, and integrity.
NASA’s Strategic Management and Governance Principles In August 2005, NASA published its Strategic Management and Governance Handbook. This new document describes the process and principles of strategic management for NASA. It provides an overview of core strategic management requirements that explain how NASA is managed and what internal and external requirements drive these management strategies.
The guiding principles of NASA’s Strategic Management approach are the following:
• Lean Governance;
• Responsibility and Decision-Making;
• Sensible Competition;
• Balance of Power;
• Checks and Balances;
• Integrated Financial Management;
• Strategic Management of Capital Assets; and
• Strategic Management of Human Capital.
These Strategic Management Principles support an organization that is focused on a challenging Vision, driven by an inspiring Mission, and committed to a set of values that define NASA’s spirit.
NASA’s Organizational Evolution NASA’s organization is comprised of NASA Headquarters in Washington, D.C., nine Centers located around the country, and the Jet Propulsion Laboratory, a Federally Funded Research and Development Center operated under a contract with the California Institute of Technology. In addition, NASA has a wide variety of partnership agreements with academia, the private sector, state and local governments, other federal agencies, and a number of international organizations to create an extended NASA family of civil servants, allied partners, and stakeholders. Together, this skilled, diverse group of scientists, engineers, managers, and support personnel share the Vision, Mission, and Values that are NASA.
NASA’s organization promotes synergy across the Agency and supports the long-term Vision for Space Exploration. NASA is organized into four Mission Directorates:
• The Aeronautics Research Mission Directorate supports research and development in aeronautical technologies for safe, reliable, and efficient aviation systems;
• The Science Mission Directorate carries out the scientific exploration of the solar system and beyond, to chart the best route of discovery, and to reap the benefits of Earth and space exploration for society;
• The Exploration Systems Mission Directorate develops capabilities and supporting research and technology that enable sustained, affordable, human and robotic exploration, including the biological and physical research necessary to ensure the health and safety of crews during long-duration space flight; and

FY 2005 Performance and Accountability Report 8
• The Space Operations Mission Directorate directs space flight operations, space launches, and space communications, as well as manages the operation of integrated systems in low Earth orbit and beyond.
The Mission Support Offices and Headquarters Functional Staff Offices, as well as a number of active councils and advisory bodies, also are important members of the Agency’s senior leadership team.
NASA’s Organization (contents of organization chart) Office of the Administrator: Administrator, Deputy Administrator, and Associate Administrator
Reporting directly to the Office of the Administrator: Chief Safety and Mission Assurance Officer; Integrated Enterprise Management Program; Program Analysis and Evaluation, Chief Engineer; Chief of Staff; Inspector General (an independent office); and NASA Advisory Committees (independent committees).
Mission Directorates: Aeronautics Research; Exploration Systems; Science; and Space Operations.
Mission Support Offices: Chief Financial Officer; Chief Information Officer; General Counsel; Innovative Partnership Program; Institutions and Management, which includes NASA Shared Services, Human Capital Management, Infrastructure and Administration, Diversity and Equal Opportunity, Security and Program Protection, Procurement, Chief Health and Medical Officer, and Small and Disadvantaged Business Utilization; and Strategic Communications, which includes Education, External Relations, Legislative Affairs, and Public Affairs.
NASA Centers: Ames Research Center; Dryden Flight Research Center, Glenn Research Center, Goddard Space Flight Center, Jet Propulsion Laboratory, Johnson Space Center, Kennedy Space Center, Marshall Space Flight Center, and Stennis Space Center.
In Pursuit of One NASA The opportunities and challenges associated with achieving the Vision for Space Exploration are exciting. Success will require that all parts of the Agency act as One NASA team to make decisions for the common good, collaborate across traditional boundaries, and leverage the Agency’s many unique capabilities in support of a single focus: exploration.
To achieve the goal of One NASA, the Agency is using common business and management tools to improve the effectiveness of cross-Agency operations. NASA has implemented standard practices in human capital management that support and encourage increased teamwork and Agency-wide perspectives. The Agency is improving communication and information sharing so everyone in NASA can contribute more effectively. Finally, NASA has initiated new activities, like NASA’s Shared Services Center, a concept that will consolidate like Center services to reduce costs, leverage efficiencies, and share lessons learned across the Agency.
Efforts toward becoming One NASA continue as NASA focuses on identifying and removing impediments to mission success and encouraging increased collaboration across Center boundaries. Cross-Agency teams are targeting improvements in funds transfer between Centers by creating a set of collaborative tools to facilitate working across geographic boundaries. Also, NASA developed, implemented, and published a set of common Agency-wide guidelines on “sensible competition.”

FY 2005 Performance and Accountability Report 9
FY 2005 PERFORMANCE ACHIEVEMENT HIGHLIGHTS The Performance Achievement Highlights discussed in Part 1 of this report reflect NASA’s FY 2005 accomplishments in pursuing the Agency’s 18 long-term Objectives.
The FY 2005 Performance Achievement Highlights are organized into three focus areas—Life on Earth, Working in Space, and Exploring the Universe—that showcase many of NASA’s most significant program areas and spotlight some of the tangible benefits that NASA provides to the Nation. Following the FY 2005 Performance Achievement Highlights is a table of performance ratings that reflects NASA’s progress toward achieving the Agency’s multi-year Outcomes and a discussion of NASA’s performance system.
Returning to Flight NASA’s biggest achievement in FY 2005 was returning the Space Shuttle safely to flight. The Shuttle Discovery return to flight mission (STS-114) lifted off the launch pad at the Kennedy Space Flight Center on the morning of July 26, 2005, after being grounded for more than two years following the Columbia accident in 2003. During those two years, hard-working teams scrutinized every aspect of Shuttle design and operations and developed ways to improve the Shuttle’s safety. Fourteen days after lift off, as Discovery landed at Edwards Air Force Base in California, NASA declared the mission a success, although it was far from perfect.
NASA’s return to flight efforts did not conclude with Discovery’s landing on August 9. The next test flight to the International Space Station, mission STS-121, is scheduled for May 2006, and work continues to resolve remaining anomalies. “We are giving ourselves what we hope is plenty of time to evaluate where we are,” said Administrator Mike Griffin in mid-August. “We don’t see the tasks remaining before us being as difficult as the path behind us.”
Photo caption: In May, NASA rolled the Shuttle from the launch pad back to the Vehicle Assembly Building at Kennedy to take care of liquid hydrogen cut-off sensors that malfunctioned during a tanking test (left). Discovery was given a new external tank and a new heater to minimize potential ice and frost buildup on the main engines’ feedline bellows. (Photo: NASA)
Photo caption: STS-114 was the most watched launch in history—but not necessarily by human eyes. More than 100 cameras watched Discovery from every angle. A high-resolution camera saw a 24- to 33-inch-long piece of insulation foam come off the external tank during the launch. Engineers, damage screeners, image analysts, and thermal protection system experts scrutinized pictures of the Shuttle’s nose cap and wing leading edges for subtle signs of damage. Though the screeners flagged about 130 small scuffs, spots, and skid marks, none of them turned out to be cracks in the reinforced carbon–carbon panels. (Photo: NASA)
Photo caption: Once on orbit, the International Space Station crew gave the Shuttle a thorough going-over as Commander Eileen Collins guided it through the first-ever back flip. Again, attention to detail paid off when the Station crew spotted gap filler jutting out between the heat shield tiles. Shuttle crewmember Steve Robinson rode the Station’s robotic arm to reach Discovery’s underside, where he easily pulled out two gap fillers and completed the first-ever on-orbit Shuttle repair. With all potential problems fixed, the Shuttle crew continued their other mission tasks and safely returned home. (Photo: NASA)
Return to Flight Milestones August 2003: The Columbia Accident Investigation Board (CAIB) released its recommendations to improve Shuttle safety.
September 2003: NASA released the first draft of its Implementation Plan for Space Shuttle Return to Flight and Beyond, outlining steps the Agency would take to prepare the Shuttle for flight.

FY 2005 Performance and Accountability Report 10
March 2004: Engineers conducted non-destructive evaluations of the reinforced carbon–carbon panels on Discovery’s wing leading edges in response to CAIB’s finding that debris from the external tanks had damaged some of Columbia’s panels during launch.
November 2004: Engineers assembled the solid rocket boosters in the Vehicle Assembly Building at NASA’s Kennedy Space Flight Center, Florida.
December 2004: NASA engineers installed three main engines on Discovery (the STS-114 vehicle), the last major components added before crews rolled the Shuttle from the Orbiter Processing Facility to the Vehicle Assembly Building for final stacking.
January 2005: The redesigned, 15-story-tall external tank was delivered by barge to Kennedy.
Engineers installed the Shuttle’s new orbital boom sensor system. Attached to the manipulator arm, the system can image the entire length of the Shuttle while in space, fulfilling a CAIB recommendation.
February 2005: Crews attached new carrier panels, which fit between the reinforced carbon–carbon panels and the orbiter, to further protect wing leading edges.
March 2005: Crews mated Discovery to the external tank and solid rocket boosters and placed it on the mobile platform.
April 2005: After Discovery arrived at the launch pad, it underwent a tanking test where the external tank was filled to launch levels with propellants. Two of four hydrogen sensors inside the tank that control the main engine shutdown sequence when the Shuttle reaches space did not operate correctly. After a thorough review of the sensor system, NASA returned Discovery to the Vehicle Assembly Building, where the Shuttle received a new external tank.
June 2005: NASA constructed two new radar antenna dishes on North Merritt Island, Florida. This was the last addition to the improved tracking system recommended by CAIB. NASA also returned Discovery to the launch pad.
July 2005: NASA scrubbed the first July launch attempt after a fuel sensor inside the external tank failed a routine pre-launch check. After extensive testing, the sensor performed correctly and officials approved a late-July launch.
Return to Flight, July 26th, 2005
STS-114 launched at 10:39 am EDT. The mission included Commander Eileen Collins, Jim Kelly, Charlie Camarda, Wendy Lawrence, Steve Robinson, Andy Thomas, and Soichi Noguchi of Japan, along with new equipment and supplies for the International Space Station.
New high-resolution cameras on the launch tower spotted a piece of foam coming off Discovery’s external tank during launch. Collins took Discovery through a first-ever back flip while it orbited 600 feet outside the Station, a maneuver added to Shuttle procedures so that Station crew could search the Shuttle’s exterior for possible damage caused during launch. The Station crew spotted loose gap-filler sticking out between heat-shielding tiles on Discovery’s belly.
During three separate spacewalks, Robinson and Noguchi tested new repair techniques for the outer skin of the Shuttle’s heat shield, installed equipment outside the Station, and repaired one of the Station’s control moment gyroscopes. They also replaced another failed gyro, returning all four gyros to service. Robinson successfully removed the loose gap-filler spotted during Discovery’s back flip, marking the first time an astronaut worked on the underside of the Shuttle in space.
Discovery successfully landed at Edwards Air Force Base, California, on the morning of August 9th. NASA officials chose this alternate landing site due to weather conditions at Kennedy. A few days later, Discovery returned to Kennedy on the back of a special 747 carrier jet.

FY 2005 Performance and Accountability Report 11
Photo caption: President George Bush greets the STS-114 and Expedition 11 Station crews during a videoconference on August 8, 2005. (Photo: White House/P. Morse)
Photo caption: The sun sets behind the tail of the Shuttle Carrier Aircraft and Discovery as they enter the mate/demate device at Kennedy Space Center. The aircraft had delivered the Shuttle from Edwards Air Force Base, California, where it had landed on August 9, 2005. (Photo: NASA)
Photo caption: As Discovery approaches launch pad 39B on June 15, 2005, the canister that delivered the STS-114 payloads to the pad departs. (Photo: NASA)
Life on Earth When most people think of NASA, they picture astronauts, rovers on Mars, and the deepest reaches of the universe. As the Nation’s civil space organization, NASA focuses many of its capabilities on exploring Earth’s cosmic neighborhood. But this is only one way that NASA uses its capabilities for the benefit of the Nation.
NASA provides the “eyes in the sky” to observe natural and human-induced Earth phenomena that affect everyone’s lives, including weather, air quality, earthquakes, ocean health, and land use. NASA’s fleet of Earth-orbiting satellites and research aircraft produce the data and tools necessary to explore Earth system interactions to understand and predict the courses and consequences of change.
While some satellites focus on Earth, others turn their eyes toward the Sun. This magnetically variable star plays a central role in maintaining life on Earth. However, the space weather it creates can wreak havoc on technology on the ground and in the air. NASA studies the Earth–Sun system to help scientists better understand and predict the effects space weather has on Earth and the solar system.
NASA also is a global leader in developing aeronautics technologies. With its partners from other government agencies, industry, and academia, NASA is committed to developing tools and technologies that can help improve operations of the air transportation system, the design and manufacture of aircraft, levels of safety, and efficiency of the U.S. air transportation system. The benefits for the public are many: air travel with fewer delays; increased safety across the air transportation system; more air travel options, including more options involving small aircraft; less air pollution; quieter skies; and reduced aircraft fuel consumption, helping to conserve a valuable resource and lowering the cost of air travel.
Finally, the Agency strives to share its technologies, skills, and knowledge with the greater community through partnerships, technology transfer programs, public outreach efforts, and education activities. NASA appears in many unexpected places—consumer products, vehicles, weather reports, and the classroom—to make life on Earth better.
A Year of Hurricanes NASA lends helping “eyes”
NASA’s Earth-observing “eyes in the sky,” including Earth-orbiting satellites, aircraft, and the International Space Station, provided detailed images of the flooding and devastation in areas affected by Hurricanes Katrina and Rita. NASA, along with academic institutions and partner agencies, worked to ensure that the Department of Homeland Security and the Federal Emergency Management Agency had the best available information to aid the rescue and recovery effort. The images and associated data helped characterize the extent of the flooding, the damage to homes, businesses, and infrastructure, and the potential hazards caused by the storms and their aftermath.

FY 2005 Performance and Accountability Report 12
NASA used its Experimental Advanced Airborne Research Light Detection and Ranging system, carried aboard a Cessna 310 aircraft, to survey the Gulf of Mexico coastline. The system can “see” through vegetation, like trees and shrubs, to view the land underneath. Near the coast, it mapped the beach surface under water. This helped the U.S. Geological Survey, the Federal Emergency Management Agency, and the Army Corps of Engineers determine the state of the shoreline infrastructure, identify hazards, and study environmental loss.
Photo caption: The top photo is a mosaic of images taken of New Orleans by NASA’s Terra satellite in April and September 2000. The bottom photo, taken by the same spacecraft, shows New Orleans on September 15, 2005, with flooding caused by Hurricane Katrina. The flooded parts of the city appear dark blue, such as the golf course in the northeast corner, where there is standing water. Areas that have dried out appear light blue gray, such as the city park in the left middle. On the left side of the image, the failed 17th Street canal marks a sharp boundary between flooded city to the east, and dry land to the west. (Photos: NASA)
Watching from space as storms heat up
Throughout the hurricane season, NASA observed the upper ocean thermal conditions in the Gulf of Mexico. Research shows a link between the intensification of hurricanes in the region and oceanic heat content. In late August 2005, when Katrina passed over the Loop Current and a large warm eddies called the core ocean ring, it evolved quickly from a category 3 to category 5 hurricane in only nine hours. The warm waters of the Loop Current appear to have rapidly fueled the storm while the warm core rings seemed to have sustained the storm’s intensity.
NASA and the National Oceanic and Atmospheric Administration (NOAA) are studying this phenomenon to confirm if oceanic heat content plays a major role in hurricane intensity. Researchers use satellite altimetry data, including data from NASA’s TOPEX/Poseidon and Jason-1 missions, to calculate in near-real time the tropical cyclone heat potential, a measure of the vertical temperature of the upper ocean. Satellite altimeters also search for warm pockets of water in the ocean that could fuel a passing tropical storm or hurricane. The Loop Current has warmer waters at greater depth than the surrounding ocean, as well as different salinity. These differences create variations in the sea surface height that can be detected from space and incorporated into the study.
Image caption: This image shows near-real-time estimates, developed by NOAA using data from several NASA Earth observing satellites, of upper ocean heat content and tropical cyclone heat potential in the Gulf of Mexico on August 28, 2005. Additional research showed that Hurricane Katrina intensified as it passed over the Loop Current, visible in the center of the image. (Image: NOAA/AOML)
Studying the birth of tropical storms and hurricanes
This year NASA conducted the Tropical Cloud Systems and Processes mission, designed to study the factors that influence the genesis and rapid intensification of tropical cyclones. During the Costa Rica-based mission, scientists tracked two major Atlantic Ocean hurricanes at the height of their destructive power, witnessed the entire lifecycle of tropical storms in the Atlantic, and documented a number of unexpected surprises about the short, violent lives of these seagoing tempests.
The mission documented “cyclogenesis,” the mysterious formula of rainfall, air and sea temperature, pressure, and other factors required to spawn tropical storm systems. By studying the complex processes that form tropical storms, scientists will gain a better understanding of how hurricanes evolve, intensify, and travel—the key to developing earlier, more accurate warning systems.

FY 2005 Performance and Accountability Report 13
Partnering with NOAA and the Costa Rican Centro Nacional de Alta Tecnologia, NASA spent July conducting ground-based and airborne studies of tropical storm systems on Costa Rica’s east and west coasts. The team primarily intended to investigate the birthplace of eastern Pacific tropical cyclones, which they did in detail, but an early start to a record-breaking, busy Atlantic hurricane season added numerous other research opportunities to the mission.
The missions used NASA and NOAA aircraft, satellites, balloon-borne weather probes, and remotely operated aircraft to investigate the lifecycle of Hurricane Dennis, from genesis through post-landfall, a disturbed region of the Eastern Pacific that likely gave birth to Tropical Storm Eugene, and the complete lifecycle, from genesis to landfall, of Hurricane Gert. These data sets represent the first time that anyone has sampled the full life cycle of a single tropical cyclone. Scientists will collate and analyze the enormous amount of data for more than a year.
Taking a closer look at hurricanes
While satellites searched for warm water in the Gulf from space, NASA also took a closer look at the environment where the atmosphere meets the sea, the critical zone where the ocean’s warm water transfers energy to a growing storm. On September 16, 2005, NASA, NOAA, and Aerosonde North America launched a remote-controlled aircraft into Hurricane Ophelia as it sat off the coast of Georgia and the Carolinas.
The aircraft, known as an Aerosonde, was equipped with sophisticated instruments that recorded temperature, pressure, humidity, and wind speed in real time and relayed the information back to the researchers. The resulting data provided the first-ever detailed observations of the high-wind area where a hurricane meets the sea surface, an area often too dangerous for piloted aircraft to observe directly. NASA pioneered the use of aerosondes in other tropical convection experiments in 2001 and 2005, but this was the first time the Aerosonde flew into a hurricane.
The Aerosonde, along with piloted aircraft and Earth-observing satellites, are helping scientists and forecasters better predict hurricane intensity and behavior. Enhancing this predictive capability would save the United States billions of dollars, and—more importantly—save lives.
Photo caption: The Aerosonde remote-controlled aircraft is released from its transport truck on the runway at NASA’s Wallops Flight Facility, Wallops Island, Virginia. It was sent down the coast to fly through Hurricane Ophelia, a low-energy hurricane. (Photo: NASA)
Earth’s Changing Shape This year, NASA scientists learned more about forces that continually change Earth’s shape. Single events like the Indonesian earthquake in December 2004, and seasonal climate events like El Niño, can cause measurable changes in the Earth system.
The massive earthquake off the west coast of Indonesia on December 26, 2004, registered a magnitude of nine on the new “moment” scale (a modified Richter scale) that indicates the size of earthquakes. It was the fourth largest earthquake in one hundred years and the largest since the 1964 Prince William Sound, Alaska earthquake. In addition to the massive tsunami that washed over 10 countries in South Asia and East Africa, NASA found that the earthquake caused permanent changes to the Earth’s structure.
Using Earth observations from before and after the Indonesian earthquake, NASA scientists calculated that it slightly changed the planet’s shape; the Earth’s oblateness (flattening on the top and bulging at the equator) decreased by a small amount and the North Pole shifted by about 2.5 centimeters. The earthquake also increased the Earth’s rotation and decreased the length of day by 2.68 microseconds. Physically, this is like a spinning skater drawing their arms closer to the body resulting in a faster spin.

FY 2005 Performance and Accountability Report 14
Scientists using NASA satellite data found that Earth’s shape also appears to be influenced by climate events like the El Niño Southern Oscillation and Pacific Decadal Oscillation that affect the amount of water moving in the oceans, atmosphere, and continents. The study results showed that significant variations in Earth’s shape over the past 28 years might be linked to climate events.
Photo caption: The December 2004 Indonesian earthquake caused a massive tsunami to wash over 10 countries in South Asia and East Africa. This pair of images from NASA’s Terra satellite shows the Aceh province of northern Sumatra, Indonesia, on December 17, 2004, before the earthquake (top), and on December 29 (bottom), three days after. The earthquake also changed Earth’s shape slightly. (Photo: NASA)
Solar Flare Sparks Space Weather Mystery Space may look empty, but it is filled with dust, debris, and dynamic forces generated by the Sun, including radiation hazardous to astronauts and satellites. On January 20, 2005, the space around Earth was filled with radiation when a large solar flare blasted out the most intense burst of solar radiation in five decades.
Normally, it takes two or more hours after a flare on the Sun for the blast of solar radiation to reach maximum intensity at Earth. In January, the solar protons released by a massive flare—accelerated to nearly light speed by the explosion—reached Earth and the Moon only minutes later, beginning a days-long “proton storm” that altered existing theories about the origin of proton storms around Earth. “Since about 1990, we’ve believed that proton storms at Earth are caused by shock waves in the inner solar system as coronal mass ejections plow through interplanetary space,” said Robert Lin of the University of California at Berkeley, principal investigator for the Reuven Ramaty High Energy Solar Spectroscopic Imager (also known as RHESSI). “But the protons from this event may have come from the Sun itself.”
No one suffered from the January 20th solar event thanks to the thick atmosphere and magnetic field that protect Earth and its inhabitants from solar radiation. However, high-energy protons ionized the upper atmosphere, disrupting electrical devices and communication signals. Astronauts on the International Space Station were safe, as well, since the Station is heavily shielded and orbits inside Earth’s magnetic field. The Moon, however, is totally exposed to solar flares. It has no atmosphere or magnetic field to deflect radiation, so protons rushing at the Moon simply hit the surface. An astronaut caught on the Moon’s surface when the storm hit may have gotten sick and exhibited symptoms of radiation sickness: vomiting, fatigue, and low blood counts. Solar radiation storms hitting the Moon also would affect exploration vehicles, like robotic explorers. Therefore, to protect astronauts and space vehicles on the way to the Moon or on the surface, NASA and its partners are developing technologies that can predict solar flares, coronal mass ejections, and geospace storms, part of what is called “space weather.” The Transition Region and Coronal Explorer (TRACE), the Advanced Composition Explorer (ACE), the Solar and Heliospheric Observatory (SOHO), Wind, and the RHESSI spacecrafts are the space community’s early warning system, spotting solar activity before it reaches Earth and helping scientists to identify the causes of flares and coronal mass ejections. The result is improved forecasting, better solar flare prediction, improved planning and better shielding from bursts that could disrupt radio transmissions, cellular communications, and satellite service.
Photo caption: SOHO’s Extreme-ultraviolet Imaging Telescope captured this image of an intense solar flare on January 20, 2005. The flare—the most intense in 50 years—is visible along the center right edge of the Sun. A flare is caused when magnetic field lines stretch and twist over sunspots on the surface until they build up enough energy to snap open, forming a tongue-like shape. (Photo: ESA/NASA)

FY 2005 Performance and Accountability Report 15
A New Twist on an Old Wing Warping an aircraft’s wing to improve turning ability is a concept as old as powered flight. The Wright brothers used cables attached to the wingtips of their 1903 Flyer to twist the wing and turn the airplane. Now, NASA has put a 21st century twist on wing-warping. NASA and its partners, the U.S. Air Force Research Laboratory and Boeing, are evaluating active control of lighter-weight, more flexible wings for improved maneuverability of high-performance military aircraft through the Active Aeroelastic Wing project.
In March 2005, the project team concluded its second phase of flights in an F/A-18A aircraft. The test evaluated the ability of software installed in the F/A-18A’s flight control computer to react accurately to the flexible wings’ movements during twisting maneuvers at various speeds and altitudes. The updated flight control software, developed through extensive testing of aeroelastic wings conducted during the project’s first flight phase in late 2002 and early 2003, controls the aircraft in accordance with the wings’ movements, guiding the aircraft through turns and rolls.
The Active Aeroelastic Wing concept is intended primarily to benefit aircraft that operate at approximately 80 to 120 percent of the speed of sound (about 761 miles per hour), where traditional wing-control surfaces become progressively ineffective. The project team’s next task will be spreading the Active Aeroelastic Wing design philosophy to the aeronautics technical community. The team anticipates that the benefits realized through the Active Aeroelastic Wing project will include faster, more capable military aircraft with potentially reduced radar signatures, lighter high-altitude, long-endurance uncrewed aircraft, and more fuel-efficient and affordable commercial airliners.
Photo caption: NASA’s F/A-18A maneuvers through a test point for the Active Aeroelastic Wing project on December 15, 2004. The stock aircraft was modified with a thinner, more flexible wing skin and structure, new flight control computer software, and a number of sensors that track the wings’ flexibility and strain. (Photo: NASA/C. Thomas)
Big Help for Small Aircraft: NASA Provides Better Weather Information Large airliners fly above most weather, but for small, regional aircraft that typically fly below 25,000 feet, weather can be a major problem. With the help of airborne sensors installed on a fleet of commuter airlines, NASA is providing small aircraft pilots with better weather information.
A NASA-led team designed, built, and equipped dozens of Mesaba Airlines aircraft with the Tropospheric Airborne Meteorological Data Report (TAMDAR) instrument that allows aircraft flying below 25,000 feet to detect and report atmospheric conditions. Satellites then send the aircraft’s observations to a ground data center that processes and distributes up-to-date weather information to forecasters, pilots, and other aviation personnel.
The compact TAMDAR sensor weighs only 1.5 pounds. It measures humidity, winds, pressure, temperature, icing conditions, and turbulence with the help of location, time, and altitude data provided by a built-in Global Positioning System. The team chose Minneapolis-based Mesaba Airlines to test the sensor because it is a regional airline with a large prop-jet fleet that flies in an area with challenging weather conditions.
The team began an extensive test of the system, called the Great Lakes Fleet Experiment, in January 2005. It will run through January 2006. During this time, the team will make the TAMDAR data available to the public, and users will complete surveys to gather feedback as a way to validate the system and improve service.
In addition to helping small aircraft pilots, the TAMDAR data will improve weather forecasts and weather forecasting models by increasing the number of observations in the lower atmosphere. Currently, there are only 90 weather balloon sites nationwide that are used to collect temperature,

FY 2005 Performance and Accountability Report 16
wind, and moisture data from twice-daily atmospheric soundings. The Great Lakes Fleet Experiment will add 1,300 more atmospheric soundings per day, increasing forecast accuracy.
Photo caption: A technician installs a TAMDAR sensor in a Saab 340 commuter airliner at Mesaba Airlines. The Mesaba Airlines fleet will carry the sensors for a year as part of the Great Lakes Fleet Experiment, an operational test of the sensors’ ability to provide timely weather forecasts. (Photo: D. Jackson/Mesaba Airlines)
NASA Helps Prevent Air Traffic Bottlenecks Air traffic bottlenecks paralyze busy sections of the U.S. airspace, costing airports money and travelers precious time, and making the skies around major airports increasingly dangerous. But thanks to the Multi-center Traffic Management Advisor, a joint project of NASA, MITRE Corporation, and the Federal Aviation Administration (FAA), this scenario may become a problem of the past.
At the heart of the Multi-center Traffic Management Advisor is a powerful “trajectory synthesis” engine that converts radar data, flight plans, and weather information into highly accurate forecasts of air traffic congestion. The Multi-center Traffic Management Advisor uses these forecasts, along with input from air traffic personnel, to generate a specific advisory—usually a small take-off delay—for each aircraft predicted to meet congestion at its next destination. The result, is fewer airborne traffic jams at busy airports.
In November 2004, NASA, MITRE, and FAA successfully tested the Multi-center Traffic Management Advisor’s management of arrivals to Philadelphia International Airport. The test brought the air traffic control tool closer to full operation. NASA and its partners also conducted other tests at the Air Route Traffic Control Centers in New York, Washington, DC, Boston, and Cleveland, which validated the NASA-developed “distributed scheduling architecture,” a key to future advancements in air traffic management.
An earlier version of the system called Traffic Management Advisor develops arrival-scheduling plans for individual airports. It is used to schedule arriving traffic at Dallas–Ft. Worth, Minneapolis, Los Angeles, Denver, Houston, Miami, and Atlanta. The Traffic Management Advisor has reduced passenger delays, maximized airport capacity, and reduced airborne holding. In fact, the FAA estimates that it has saved airspace users more than $180 million and reduced delays by more than 72,000 hours from its implementation in 2002 through January 2005.
Photo caption: Traffic management advisors sit at consoles at Denver’s Terminal Radar Approach Control. Denver and several other center’s currently use an older version of the Multi-center Traffic Management Advisor to schedule arrivals and assign runways. (Photo: NASA)
Working in Space Humans have been venturing into space for more than 40 years. Despite these decades of experience, human space flight remains an enormous challenge. A great deal of effort, research, and technology development goes into every mission, and every mission yields accomplishments and lessons learned. Still, NASA continues to look toward the stars and to push the limits of human capabilities and exploration.
As NASA pursues the Vision for Space Exploration, the Agency is focusing on maintaining its current resources, like the Space Shuttle and the International Space Station, for critical space research while developing next-generation space systems and technologies that will help astronauts journey beyond Earth. The human space exploration program of tomorrow will be built on the lessons and technologies of the past 40 years and today.

FY 2005 Performance and Accountability Report 17
Keeping an Eye on the Shuttle When Discovery (STS-114) launched on July 26, 2005, it was followed by two NASA WB-57 chase jets tasked with keeping an eye on the Shuttle as it returned to flight. The jets were used originally for high-altitude global climate change studies, but NASA equipped each with an innovative on-board video and recording system called the WB-57 Ascent Video Experiment, or WAVE, to capture visible-light and infrared imagery of the Shuttle on its journey to orbit and to record details of the Shuttle’s behavior as it climbed through the atmosphere. The jets kept pace with Discovery, maintaining a safe distance of 15 miles, for just over six minutes, and recorded the details of its ascent until the Shuttle flew out of range and the solid rocket boosters dropped away.
After the launch, one jet returned to its home base at Elington Field in Houston, Texas, and the other went to Costa Rica. The plan was that the pilots would follow the Shuttle when it made its reentry and collect reentry information, helping engineers establish a benchmark for a normal reentry that could be used for future missions. Unfortunately, because the landing was moved from NASA’s Kennedy Space Center, Florida, to Edwards Air Force Base, California, both jets missed the reentry opportunity.
The goal of the WAVE project is to assure that each launch and landing goes as planned. After determining that a piece of insulating foam from the external tank damaged Shuttle Columbia’s wing just after takeoff, the Columbia Accident Investigation Board recommended that NASA improve how it images each launch. In response, NASA installed new cameras around the launch tower, added radar tracking for the Shuttle, and developed a concept for chase planes that led to the WAVE project.
“This was the very definition of a team effort,” said NASA engineer John West of the Space Optics and Manufacturing Center. “In June 2004, we were looking at nothing more than a concept on a drawing board. In nine months, we built two complete imaging systems.” NASA teamed with industry to build the high-definition imaging system, its precision-controlling software, and housing. The team’s hard work resulted in an imaging system that provides NASA with a new way to assess Shuttle performance and the public with a new way to ride along as the Shuttle reaches for the sky and beyond.
Photo caption: The WAVE project swiveling video recording system sits on the front of NASA’s two WB-57 jets like a bulbous nose. The primary optic lens, a 4,150-millimeter reflector telescope, is visible on the right of the spherical turret. NASA partnered with Southern Research Institute, who design gimbal systems for the U.S. Army, to design a large, rotating gimbal to house the cameras that was stable and would remain focused on the speeding Shuttle. (Photo: NASA)
Beyond Shuttle: NASA’s 21st-Century Spacecraft The Vision for Space Exploration will take space exploration beyond low Earth orbit and extend a human presence across the solar system in safe, affordable, and sustainable increments. During the second half of FY 2005, NASA conducted the Exploration Systems Architecture Study to determine what technologies, knowledge, and infrastructures the Agency will need to return to the Moon and continue on to Mars and beyond. And in September 2005, NASA unveiled its plan for the next-generation human space exploration spacecraft for use after the Shuttle is retired.
The new spacecraft is the centerpiece of NASA’s 21st-century exploration system. It will carry four astronauts to and from the Moon, support up to six crewmembers on future Mars missions, and deliver crew and supplies to the International Space Station. The spacecraft will be shaped like an Apollo capsule, but will be three times larger and reusable up to 10 times.
The crew vehicle will launch on a rocket comprised of a single Shuttle solid rocket booster, with a second stage powered by a Shuttle main engine. A second, heavy-lift system will use a pair of longer solid rocket boosters and five Shuttle main engines to put up to 125 metric tons in orbit—

FY 2005 Performance and Accountability Report 18
about one and half times the lift capability of the Shuttle. This versatile system will be used to carry cargo and to put the components needed to go to the Moon and Mars into orbit. It can be modified to carry crew, as well.
NASA’s new launch systems will be safer than the Shuttle thanks to an escape rocket on top of the capsule that can quickly carry the crew away if launch problems develop. And since the vehicle will sit on top of the rocket in both configurations, there is minimal chance of the vehicle being damaged by debris during launch.
While NASA and its partners build the new launch systems and vehicle, robotic missions will lay the groundwork for lunar and Mars exploration. These missions will include rovers and orbital spacecraft searching for potential landing sites and resources, such as oxygen, hydrogen, and metals.
The next planned human lunar mission, a seven-day flight, is planned for 2018. Additional short missions will give crews the opportunity to conduct research and slowly establish a lunar outpost to enable longer stays. The lunar outpost, just three days away from Earth, will enable NASA explorers to practice “living off the land” before embarking on longer treks to Mars and beyond.
Image caption: NASA’s new exploration vehicle, shown in this artist’s concept orbiting the Moon, will have solar panels to provide power. The capsule and the lunar lander will use liquid methane in their engines. NASA chose liquid methane as a fuel in anticipation of future Mars missions, where astronauts can convert Martian atmospheric resources into methane fuel. (Image: NASA/John Frassanito and Associates)
NASA’s X-43A Scramjet Speeds into the Record Books Like a meteorite blazing over the Pacific Ocean near sunny southern California, NASA’s X-43A experimental supersonic combustion ramjet, or scramjet, flew at nearly 10 times the speed of sound on November 16, 2004. The X-43A’s Mach 9.6 flight—nearly 7,000 mph—broke the world’s speed record for an air-breathing jet-engine flight set by the same scramjet earlier in the year when it flew at Mach 6.8. Before this, the world’s fastest air-breathing aircraft, the SR-71, only achieved slightly over Mach 3.
At 40,000 feet, a modified Pegasus rocket booster left NASA’s B-52B aircraft and carried the unpiloted X-43A up to 110,000 feet. At this point, the X-43A blasted off and accelerated on scramjet power for a 10-second flight at nearly Mach 10.
In the past, only rocket-powered vehicles could reach hypersonic speeds (speeds exceeding Mach 5), but those vehicles needed to carry large amounts of fuel and an oxydizer (to feed the fuel with the oxygen it needs to burn), making them large, heavy, and impractical. The X-43A, however, has an air-breathing engine that scoops oxygen molecules out of the thin upper atmosphere as air passes through it and uses these molecules to keep the fuel burning. Once accelerated to Mach 4 by a conventional jet engine or booster rocket, the X-43A scramjet can fly at hypersonic speeds without carrying heavy oxygen tanks.
Scramjets have the capability of being throttled back and flown more like airplanes, unlike rockets that usually produce full thrust all the time. The scramjet has the added benefit of being reusable like a conventional jet engine. The X-43A’s record-breaking flight is a key milestone in NASA’s effort to transform experimental scramjet technology into a reliable and affordable way to send large, critical payloads into space, while simultaneously developing hypersonic airplanes to transport people quickly and safely around the world.
Photo caption: NASA’s B-52B mothership carries the X-43A, attached to the nose of a Pegasus rocket booster, under its wing on November 16, 2004. The body of the small, slim X-43A (inset artist’s concept) forms critical elements of the vehicle’s design. The forebody acts as part of the

FY 2005 Performance and Accountability Report 19
intake for airflow and the aft section serves as the nozzle. (Photo: C. Thomas/NASA; drawing S. Lighthill)
Turning Robots and Computers into Indispensable Helpers The Vision for Space Exploration goal of sending humans to the Moon, Mars, and beyond is based on a partnership between humans and highly capable robotic assistants that can work side-by-side with astronauts or autonomously explore places where humans cannot.
Meet Clarissa
Astronauts undergo extensive training for the technical tasks they must perform on the International Space Station, but they still rely frequently on lengthy procedures manuals as they work. However, when an astronaut’s hands are occupied, or the astronaut is in a spacesuit with bulky gloves floating outside the Station, thumbing through a manual is not always practical. In the future, astronauts will rely on Clarissa, a voice-operated, interactive “virtual crew assistant” designed to help ease crewmember workload. The hands-free system, under development at NASA’s Ames Research Center, responds to voice commands, and Clarissa can read procedure steps aloud as crewmembers work, keep track of completed steps, and support flexible, voice-activated alarms and timers.
Earlier versions of the system tried to process all spoken words, including conversations between crewmembers, because NASA wanted the system to be ready to assist at any time without requiring artificial activation commands. Therefore, a simple ”Star Trek” solution—like having crewmembers address the computer by stating a specific word such as “computer” before posing a question or speaking a command to the system—wasn’t a viable solution. Instead, NASA needed to improve the system’s ability to discriminate between commands and conversation. With the help of Xerox researcher Jean-Michel Renders, NASA’s partner in the project since 2004, Clarissa now analyzes words, sentences, and context with about 95-percent accuracy. In fact, Clarissa currently supports about 75 individual commands that can be accessed using a vocabulary of about 260 words. The team plans to increase the commands and add to the vocabulary in the future.
Clarissa, which is named for its simulated female voice, was installed on the Station in January 2005. It was used for the first time by John Phillips, Expedition 11 Flight Engineer and NASA Science Officer, on June 27. During this test, Phillips completed the interactive Clarissa training procedure, which exercised all of Clarissa’s main system functions. The procedure contained 50 steps and took 25 minutes to complete. Afterward, the Clarissa research team pronounced the test a success.
Improvements that make Clarissa a better crew assistant in space are improving the way other computer systems assist people on Earth. For example, Xerox is using the same technology to improve categorization results for printed or digital documents, helping customers manage document content. NASA also is working with scientists at Geneva University to develop the technology for the medical field, helping doctors communicate with patients who do not speak their language.
Photo caption: Kim Farrell, Clarissa project manager, tests the safety of drinking water using the voice-activated system in a Station simulation at NASA’s Ames Research Center. (Photo: NASA)
A team with excellent communication skills
Continuous, fruitful communication between humans and robots was the goal of a spring 2005 field test conducted in Utah’s Southeast Desert. During the field test (part of NASA’s ongoing Mobile Agents Project), wheeled, prototype “Extravehicular Activity Robotic Assistants” followed geologists around the simulated Mars environment at the Mars Society’s Mars Desert Research Station. The project researchers encouraged the robotic assistants to work together to help

FY 2005 Performance and Accountability Report 20
spacesuited geologists conduct a series of ever-more demanding, human–robot simulated geology missions. The researchers examined how landscape, distance, work coordination, and other factors affected operations to determine how they could improve the robots, spacesuits, tools, and work methods. Future long-duration human space exploration will rely on robotic assistants to make science discoveries and construct and maintain human habitats.
The robotic assistants use sensors that are similar to, but often better than, a human’s five senses. A Global Positioning System pinpoints each robotic assistant’s location, and laser rangefinders help the robots avoid obstacles and plan routes. The robots also have six-axis accelerometers that allow them to judge the slant of the terrain to avoid tumbles. They have manipulator “hand” appendages, pan-tilt cameras, and hitches to pull trailers filled with tools, samples, and equipment, all making them very helpful assistants.
Photo caption: One of the Mobile Agents researchers, dressed in a spacesuit, looks at the computer network relay (center) and a robotic assistant called Boudreaux, which was being teleoperated by a handler. The spacesuits include a communication earpiece and microphone. (Photo: NASA/Mars Society)
A swarm of robots
In January 2005, NASA engineers watched like anxious parents as their robotic creation, looking like an animated pile of Tinker Toys, scrambled over the rock and snow at McMurdo Station in Antarctica. Their visit to the icy land was to test the tetrahedral walker (TETwalker) in a harsh environment resembling conditions on Mars. The prototype TETwalker consists of electric motors connected to struts, forming a movable pyramid with four sides. The motors lengthen or retract the struts, causing the structure to topple in a desired direction. The motors also pivot to give the robot additional flexibility.
The results of the test pointed the team toward modifications that would improve performance. For example, moving the motors to the middle of the struts, instead of at the corners, will simplify the design and increase reliability. But overall, the pyramid shape proved to be strong and stable. If current robotic rovers topple over on a distant planet, they are doomed, because there is no way to send someone to get them back on their wheels. However, the TETwalker moves by toppling over purposely, resulting in a reliable way to get around.
NASA’s goal is to create miniaturized robots that can be joined together to form “autonomous nanotechnology swarms” that alter their shape to flow over challenging terrain or to create useful structures, like communications antennae and solar sails. The swarm would be spontaneously adaptable, changing shape to tackle tough terrain and “healing itself” by reshaping around damaged sections like cells replacing damage in the human body. The team also is researching artificial intelligence systems that will allow the robots to move and work together with little input from a human controller—tiny, tumbling TETwalkers working as a unified team.
Photo caption: Engineers Ken Lee (right) and Caner Copperrider work on the TETwalker prototype in their laboratory at Goddard Space Flight Center. (Photo: NASA)
From Earth to space NASA and the National Oceanographic and Atmospheric Administration developed an autonomous fleet of aquabots that bring together many of NASA’s current robotics capabilities. The aquabots, part of NASA’s new platform system called the Ocean–Atmosphere Sensor Integration System (OASIS), are relatively inexpensive, buoy-like boats that can operate autonomously or by controller to gather near-real-time observations of various ocean phenomena. They run on solar power for up to three months and can move continuously through the water at surface speeds up to two knots.

FY 2005 Performance and Accountability Report 21
Each aquabot is equipped with NASA’s Adaptive Sensor Fleet technology, a control system that allows robotic platforms to respond to science events, such as changes in weather, and to select targets based on data analysis and modeling—all autonomously. The aquabots will be able to track hurricanes, observe ocean conditions, locate oil spills, measure algae blooms, and record other phenomena that are difficult or impossible to measure using Earth observing satellites.
The OASIS aquabots underwent several tests in FY 2005, including the first sea trials during which the research team tested the aquabots’ ability to travel independently and to map dye dropped into the ocean. While the OASIS aquabots perform valuable Earth science services, they also will be testing the Adaptive Sensor Fleet technology for use in space exploration.
Photo caption: Looking like a floating doghouse, an OASIS aquabot maneuvers around open water during a test conducted in March 2005. Trailing behind the aquabot (not visible in the picture) was an operator in a chase boat who guided the aquabot with a remote control box. After the test, the team made changes to the propulsion motor/controller, which overheated during the test, to prepare the aquabot for the next phase of testing in the summer. (Photo: NASA)
Exploring the Universe NASA explores the unknown to help humankind answer ancient and fundamental questions: How did we get here? Are we alone? How did the universe begin? How will it end? NASA’s partner in this quest is a range of robotic technologies—space telescopes, planetary rovers, and exploration spacecraft—that extend human eyes and hands to places beyond reach.
Within a few years, NASA will have crossed the entire length of Earth’s solar system. This fiscal year, the Voyager I spacecraft journeyed into the heliosheath, the point where the Sun’s influence diminishes and the solar system ends. The MESSENGER spacecraft passed around Earth to gain a gravity boost in August 2005 on the way to its first flyby of the solar system’s Sun-scorched, innermost planet, Mercury, in 2008. NASA also continued to study the solar system’s history and to search for water, resources to support future human space exploration, and possible landing sites for future robotic and human missions.
While the heliosheath is the farthest point of NASA’s physical presence, NASA and its research partners have looked much farther—to distant galaxies and back in time to the universe’s beginning. Using powerful instruments, NASA has seen nebulae giving birth to new stars while watching other stars dying and giving birth to powerful black holes. NASA also has searched for undiscovered planets orbiting distant stars, hoping to find small, terrestrial planets like Earth. Beyond simply spotting distant phenomena, NASA researchers also seek to understand the evolution and composition of the universe: How do its components (from celestial bodies to more elusive dark matter) form? How are space, time, and matter connected? How will the universe evolve in the future?
Deep Impact: An Independence Day Encounter Creates Deep-Space Fireworks On July 4, 2005, NASA scientists created their own fireworks in the sky when part of NASA’s Deep Impact spacecraft successfully crashed into a comet. The Deep Impact team members, located more than 83 million miles away at NASA’s Jet Propulsion Laboratory, steered the spacecraft, comprised of a subcompact car-sized “flyby” spacecraft and a smaller, washing machine-sized “impactor,” toward the comet, Tempel 1, for a first-of-its-kind, planned, high-speed collision with a comet.
After a voyage of 172 days and 268 million miles, Deep Impact’s collision with Tempel 1, a nomadic ball of dirty ice and rock orbiting between Mars and Jupiter, was a smashing success. The impact gave scientists a glimpse beneath the comet’s surface, where material from the solar

FY 2005 Performance and Accountability Report 22
system’s formation has sat relatively unchanged for billions of years. The 820-pound impactor collided with the comet nucleus at a speed of 23,000 miles per hour, spewing out a spray of vaporized impactor and comet material that glinted in the sunlight like a giant, distant firework—bright enough to be seen by telescopes on Earth.
The Deep Impact science team theorizes that the impactor vaporized deep below the comet’s surface when the two collided, creating a crater and revealing the untouched, primordial material beneath. By observing the impact crater and how it developed, scientists hope to learn the basic structure and density of the comet. The final image from the short-lived impactor was transmitted three seconds before it met its fiery end from a distance of about 18.6 miles from the comet’s surface, allowing scientists to resolve features on the comet’s surface that are less than four meters across.
The Deep Impact science team continues to probe the data collected during the Independence Day encounter, data that will provide new insight into comets. These beautiful, icy remnants of the ancient solar system provide clues to its formation and evolution and the role comets may have played in providing ancient Earth with water and other chemicals necessary for life.
Photo caption: Deep Impact provided step-by-step images as its probe closed in on Tempel 1 on July 4, 2005, from approximately 5 minutes away (upper left) to several seconds after impact, when sunlight glinting on ejecta created a bright flash visible to the mother spacecraft (above). (Photos: NASA/Caltech/UMD)
Spirit and Opportunity Trek On Since successfully completing their three-month primary missions in April 2004, the Mars Exploration Rovers, Spirit and Opportunity, have explored ever farther from their landing sites as they study Mars’ geology. Both rovers have worked in the harsh Martian environment much longer than anticipated and are in amazingly good shape for their age. Their unanticipated longevity has allowed both rovers to reach destinations beyond the original scope of their missions and to keep making discoveries in pursuit of NASA’s Vision for Space Exploration. NASA plans to keep both rovers exploring through September 2006, taking advantage of their excellent mechanical health.
Autonomous operation, particularly on a planetary surface, is an important capability for future robotic exploration vehicles. Opportunity gave NASA scientists a chance to hone their creative skills when it unwittingly drove itself into a sand trap. Every effort to free itself worked Opportunity deeper into the soft sand until all six wheels were mired up to their rims. For five weeks, the rover team at the Jet Propulsion Laboratory planned their long-distance “roadside assistance,” carefully devising and testing a strategy to extricate the rover from its trap. The team cheered on June 4 when Opportunity sent images indicating that it was back on firm ground—rolling free and ready to find more Martian marvels.
Photo caption: What a difference ten days make: The photo on the left shows a part of Spirit covered in a thick layer of red, Martian dust on March 5, 2005. Ten days later, dust-lifting winds had blown the part clean. The solar arrays, which also were blown clean, began collecting more power. (Photos: Cornell/NASA)
Next Stop, Mars! On the morning of August 12, 2005, an Atlas V launch vehicle roared away from Cape Canaveral Air Force Station, Florida carrying NASA’s two-ton Mars Reconnaissance Orbiter (also known as MRO) on its seven-month flight to Mars. Its ambitious mission is to collect data about the planet’s geology, mineralogy, climate, and history and distribution of water. In addition to providing insight into the red planet’s past and present, the data will improve scientists’ understanding of planetary climate change, in general.

FY 2005 Performance and Accountability Report 23
While other missions have shown that water once flowed across the surface of Mars, scientists still do not know whether water remained long enough to provide a habitat for life. MRO will zoom in for extreme close-up photography of the Martian surface, analyze minerals, and look for subsurface water. Along the way, the spacecraft will look for resources, including water, that could support future human exploration.
MRO carries six scientific instruments that will examine the surface, atmosphere, and subsurface in unprecedented detail from low orbit. The orbiter’s high-resolution camera will reveal surface features as small as a dishwasher. NASA expects that together, the instruments will obtain several times more data about Mars than all previous Martian missions combined.
Finding Other Worlds Human beings always have pondered the question, “Are we alone?” Medieval scholars speculated that other worlds must exist and that some would harbor other forms of life. In recent years, advances in science and technology have brought scientists to the threshold of finding an answer to this timeless question, and the recent discovery of numerous planets orbiting stars other than the Sun confirms that Earth’s solar system is not unique. In fact, these “extra-solar planets” appear to be more common in the galaxy than ever expected, and with each discovery, scientists get a clearer understanding of the variety of planets in the universe and how and where Earth-like planets may form.
Red giants redefine the search for extra-terrestrial life
Scientists recently discovered a new frontier in the search to find life outside the solar system: dying red giant stars may bring icy planets back from the dead. Once-frozen planets and moons may provide a breeding ground for life as their stars enter the last, and brightest, phase of their lives. Scientists hypothesize that when a Sun-like star expands into its red giant phase, it grows tremendously in size and brightness. Warm rays from the star reach out to a once-frozen and dead moon, and the solitary satellite’s icy top layer quickly melts into liquid water that creeps across the surface and fills old craters with warmer seas. This sets the stage for the birth of new life in the moon’s now-vibrant oceans. Previous ideas about the search for extra-solar life had excluded these regions, but an international team of astronomers now estimates that the emergence of new life on a planet is possible within the red giant phase.
One of the secrets of Earth’s success in producing life is its location within the sphere of the Sun’s “habitable zone.” This donut-shaped boundary outlines where water can exist as a liquid in the solar system—a necessary component for the development of life. As the Sun develops into old age, its habitable zone will expand with it, changing the locales where liquid water—previously frozen as ice—can melt and provide a place where life may one day thrive. Lying just inside the outer limit of the Sun’s habitable zone, Mars remains a frozen world because of its thin atmosphere. However, when the Sun becomes a red giant a few billion years from now, Mars may come alive. Currently, there are at least 150 red giant stars within 100 light years of Earth, and many of them may have orbiting planets capable of supporting life.
Image caption: This artist’s concept shows the relative size of a hypothetical brown dwarf-planetary system (lower right) compared to Earth’s solar system. The Spitzer Space Telescope set its infrared eyes on an extraordinarily low-mass brown dwarf called OTS 44 and found a swirling disk of planet-building dust. At only 15 times the mass of Jupiter, OTS 44 is the smallest known brown dwarf to host a planet-forming, or protoplanetary, disk. (Image: NASA/JPL–Caltech/T. Pyle, SSC)

FY 2005 Performance and Accountability Report 24
Spitzer spots mini-solar system
Moons circle planets, and planets circle stars. Now, with the help of NASA’s Spitzer Space Telescope, astronomers believe that planets also may circle celestial bodies almost as small as planets.
This year, Spitzer continued to help scientists understand the complex and unusual circumstances under which Earth-like planets arise when it set its infrared eye on an extraordinary low-mass brown dwarf called OTS 44 and spotted a dusty swirling disk of planet-building material. A brown dwarf is a cool or “failed” star that lacks the mass to ignite and shine like the Sun. At only 15 times the mass of Jupiter, OTS 44 is the smallest known brown dwarf to host a planet-forming, or protoplanetary, disk.
Scientists believe that this unusual system eventually will spawn planets. If so, they speculate that OTS 44’s disk has enough mass to make one small gas giant and a few Earth-sized rocky planets. In fact, scientists now believe that there may be a host of miniature solar systems in the universe.
Spitzer sees the light, sparks a new age of planetary science
When scientists search for planets outside the solar system, they do not try to spot the planet itself. Instead, they search for “wobble,” the slight movement detected within distant starshine that indicates that the gravitational field of a planet is tugging on its parent star. Or, they search for a sign of “transit,” the slight blip in the starshine that occurs when a planet passes in front of a star.
Thanks to the Spitzer Space Telescope, scientists have another way to spot an extrasolar planet. For the first time, Spitzer captured the light reflected off two known planets orbiting far-away stars. This marks a new age of planetary science in which extrasolar planets can be directly measured and compared.
According to two studies published in 2005, Spitzer directly observed the warm infrared glows of two previously detected “hot Jupiter” planets, designated HD 209458b and TrES-1. Hot Jupiters are distant gas giants that zip closely around their parent stars. From their orbits, they soak up enough starlight to shine in infrared wavelengths. To distinguish the planets’ glow from that of their fiery host stars, the scientists used Spitzer to collect the total infrared light from both the stars and planets. Then, when the planets dipped behind the stars as part of their orbits, researchers measured the infrared light coming from just the stars. This pinpointed exactly how much infrared light belonged to the planets.
Image caption: This artist’s concept shows what a fiery hot star and its close-knit planetary companion might look like close up if viewed in visible (left) and infrared light. In visible light, a star shines brilliantly, overwhelming the little light that is reflected by its planet. In infrared, a star is less blinding, and its planet perks up with a fiery glow. Astronomers using NASA’s Spitzer Space Telescope took advantage of this fact to directly capture the infrared light of two previously detected planets orbiting outside our solar system. Their findings revealed the temperatures and orbits of the planets. (NASA/JPL–Caltech/R. Hurt, SSC)
Adding another planet to the bunch Scientists announced on July 29, 2005, that they found another planet at the outer region of Earth’s solar system.
The research team, which included Mike Brown of the California Institute of Technology, Chad Trujillo of the Gemini Observatory at Mauna Kea, Hawaii, and David Rabinowitz of Yale University, in Connecticut, first spotted the distant object with the Samuel Oschin Telescope at Palomar Observatory in 2003. However, the object was so far away that its motion, and its true planetary nature, went unnoticed until the team reanalyzed the data in January 2005. After they realized what they had found, they restudied the planet for a better estimate of its size and motions.

FY 2005 Performance and Accountability Report 25
The planet is a typical member of the Kuiper belt, which is populated by a multitude of small, rocky bodies. But, the newly discovered planet is much larger. “Even if it reflected 100 percent of the light reaching it, it would still be as big as Pluto,” said Brown. “I’d say it’s probably one and a half times the size of Pluto, but we’re not sure yet of the final size.”
What the team does know for certain is that the planet is about 97 times farther from the Sun than Earth, making it the farthest-known object in the solar system. It also is the third brightest of the Kuiper belt objects.
The team has submitted a name for the new planet to the International Astronomical Union, which is responsible for selecting the names of planets, stars, and small bodies like comets.
Image caption: This artist’s concept shows the planet catalogued as 2003UB313 at the lonely outer fringes of Earth’s solar system. The Sun can be seen as a pale glow in the distance. The new planet, which awaits naming by the International Astronomical Union, is at least as big as Pluto and about three times farther away from the Sun than Pluto. (Image: NASA/JPL–Caltech)
Spitzer Finds Ingredients for Life in the Distant Past With the help of the Spitzer Space Telescope, scientists have detected organic molecules in galaxies dating back to a time when the universe was young. These large, complex molecules, known as polycyclic aromatic hydrocarbons, are made up of carbon and hydrogen and are considered by scientists to be among the building blocks of life. They are common on Earth and form any time carbon-based materials are not burned completely. They are found in sooty exhaust from cars and in charcoal-broiled hamburgers and burnt toast. They are pervasive in galaxies like the Milky Way, playing a significant role in star and planet building. However, Spitzer is the first telescope to see these molecules so far back in time—when the universe was one-fourth of its current age of about 14 billion years.
“This is 10 billion years further back in time than we’ve seen them before,” said Lin Yan of the Spitzer Science Center in California, lead author of a study on the subject published in the August 10, 2005, issue of Astrophysical Journal. Since Earth is only four-and-a-half billion years old, these organic molecules existed in the universe well before Earth and the solar system were formed. In fact, they may have been included in the seeds of the solar system.
Eruptions, Black Holes, and Bursts A look up at the night sky reveals an image of space that seems serene and quiet. This glimpse of the universe is deceptive. Space is filled with drama: creation, struggles, explosions, and death. As NASA’s observation spacecraft watch, the dynamic universe is brought to Earth.
The birth of a black hole marks the start of a mission
On November 15, 2004, NASA launched the Swift spacecraft to observe gamma-ray bursts, the most powerful explosions the universe has seen since the Big Bang. Less than a month later, Swift observed three bursts in one day while the research team was still calibrating the main instrument, the Burst Alert Telescope. The bursts, which lasted less than a minute, likely signaled the birth of a black hole in Cygnus X-1, a bright source that produces gamma-ray bursts in the Milky Way galaxy. The team believes that the black hole formed in orbit around a star.
Swift is the first spacecraft dedicated to studying, and discovering the source of, gamma-ray bursts. It is a multi-wavelength observatory carrying instruments that can view the universe in the X-ray, ultraviolet, and optical ranges. Its Burst Alert Telescope is the most sensitive telescope ever flown in its particular spectral band. Even with these extra capabilities, the Swift team only expected to spot a couple of bursts per week, not three in one day. Researchers agreed: this is going to be an exciting mission.

FY 2005 Performance and Accountability Report 26
Image caption: Swift’s Burst Alert Telescope captured these two gamma-ray bursts in December. This was the spacecraft’s first image, called by the science team Swift’s “first light.” The bright source at the top of the image is Cygnus X-1, thought to be a stellar-size black hole orbiting a massive star. The bright source at the bottom of the image is the lower-energy Cygnus X-3, a neutron star binary system enveloped in a cocoon of swirling dust and gas. (Image: NASA)
Cosmic explosion outshines the Moon, spurs debate
Later in December 2004, the universe put on another light show—a flash of light from across the galaxy so powerful that it bounced off the Moon and lit up Earth’s upper atmosphere. The flash, a “giant flare” from an exotic, magnetically powered neutron star called a magnetar, was more intense than anything ever detected from beyond this solar system. Lasting over a tenth of a second, the flare caught the “eye” of Swift, NASA’s RHESSI spacecraft, and many ground-based radio telescopes.
The light was the brightest in the gamma-ray energy range, far more energetic than visible light or X-rays and invisible to the human eye. Such a close and powerful eruption raised the question of whether an even larger burst of gamma rays disturbed Earth’s atmosphere, causing one of Earth’s mass extinctions hundreds of millions of years ago. Also, if giant flares can be this powerful, then some gamma-ray bursts, originally thought to come only from very distant black hole-forming star explosions, actually could be from neutron star eruptions in nearby galaxies.
A neutron star is the core that remains of a star that was once several times more massive than the Sun. When these stars use up their nuclear fuel, they explode in an event called a supernova. The remaining core is dense, like the mass of the Sun mashed down to a ball about 15 miles in diameter, fast spinning, and highly magnetic. Millions of neutron stars fill the Milky Way galaxy. Of these, scientists have discovered only about a dozen ultrahigh-magnetic magnetars. The December 2004 flare, which originated in the vicinity of the constellation Sagittarius, produced more energy than the Sun emits in 150,000 years.
Four of the identified magnetars are called soft gamma repeaters because they flare up randomly and release low-energy gamma rays. In the 1980s, a scientific debate raged over the source of gamma-ray bursts, but by the 1990s, data indicated that gamma-ray bursts originate very far away as neutron stars explode and that soft gamma repeaters form differently. The December 2004 event reopened the debate. From this event, scientists determined that short gamma-ray bursts could come from soft gamma-ray repeaters up to 100 million light years from Earth. Long gamma-ray bursts appear to be from black hole-forming star explosions billions of light years away.
Image caption: An arrow points to SGR 1806-20, a magnetar that created a flash so bright it lit up the Moon, in this radio wavelength, wide-field image taken by a radio telescope at the University of Hawaii. The magnetar itself is not visible in the image, which was taken when SGR 1806-20 was “radio quiet.” (Image: Univ. of Hawaii)
Gamma-ray-burst mystery revisited—and solved?
In May 2005, NASA scientists, for the first time, detected and pinned down the location of a short gamma-ray burst lasting only 50 milliseconds. Scientists finally may have the data they need to solve the mystery behind short gamma-ray bursts.
The burst was likely the result of a collision between two black holes or neutron stars, forming a new black hole. Despite how violent this sounds, theory predicts that such collisions produce short afterglows because they have little fuel—dust and gas—either from the colliding objects or the surrounding area to feed on. The burst appears to have originated only about 2.7 billion light years from Earth, supporting the theory that short gamma-ray bursts come from older, evolved neutron stars and black holes relatively close to home.

FY 2005 Performance and Accountability Report 27
The afterglow of a burst contains the information scientists need to figure out what caused a burst. Before Swift was launched, short bursts were too fast for detailed observation. Swift’s X-ray telescope detected a weak afterglow that faded away after about five minutes. Its ultraviolet/optical telescope saw nothing. Ground-based telescopes did not detect the afterglow. In contrast, afterglows from long bursts linger from days to weeks, providing ample opportunity to study them with a variety of telescopes.
Mystery solved? It is too soon for scientists to say, but thanks to Swift and other observing spacecraft, the answer likely will come soon.
Supermassive monster gone wild: a black hole story
While scientists puzzled over a flashy magnetar in the Milky Way galaxy, a supermassive black hole in a distant galaxy cluster called MS 0735.6+7421 asserted itself as the most powerful eruption in the universe.
On January 5, 2005, NASA’s Chandra X-ray Observatory spotted hot, X-ray-emitting gas caused by a gravitational energy release as a supermassive black hole sucked down the equivalent mass of about 300 million Suns from a surrounding galaxy cluster. Most of the matter was swallowed, but some of it was ejected before being captured by the black hole. The resulting eruption, which has lasted for more than 100 million years, has generated the energy equivalent to hundreds of millions of gamma-ray bursts.
Scientists are not sure where such large amounts of matter came from. One theory is that gas from the host galaxy cluster cooled catastrophically and was swallowed by the black hole. The energy released shows the black hole has grown dramatically during the eruption. Previous studies suggest that other black holes have grown very little in the recent past and that only smaller black holes are still growing quickly.
“This new result is as surprising as it is exciting,” said Paul Nulsen, scientist at the Harvard–Smithsonian Center for Astrophysics in Cambridge, Massachusetts, and co-author of the study about the discovery, published in the January 6, 2005, issue of Nature. “This black hole is feasting, when it should be fasting.”
Image caption: This image shows the Chandra X-ray image of the galaxy cluster MS 0735.6+7421 (left) in context with a labeled illustration of the system. The two giant cavities (dark red regions), found in the X-ray-emitting, hot gas (bright red) in the galaxy cluster, are evidence of the massive eruption. A supermassive black hole at the center of the bright X-ray emission caused the eruption. (X-ray image: NASA/CXC/Ohio U./B.McNamara et al.; Illustration: NASA/CXC/M.Weiss)
Ending the fiscal year with a really big (and far away) burst
Swift ended FY 2005 by spotting the most distant explosion yet, a gamma-ray burst from the edge of the visible universe. The September 4 burst, which likely marked the death of a massive star as it collapsed into a black hole, originated about 13 billion light years from Earth—back in an era soon after stars and galaxies first formed, about 500 million to one billion years after the Big Bang.
Scientists have spotted only one other object, a quasar, at a greater distance. However, quasars are supermassive black holes containing the mass of billions of stars, whereas a gamma-ray burst comes from a single star. Scientists now are studying how a single star could generate so much energy as to be seen from across the universe.
Swift was the first, but not the only, instrument watching this unusual burst. Swift detected the burst, called GRB 050904, and relayed its coordinates around the world within minutes. Scientists on four continents eagerly tracked the burst and its afterglow as it gradually faded over several days. The community heralded the discovery as a major breakthrough in the study of the early universe. Despite exhaustive searches, scientists have spotted relatively few quasars or other

FY 2005 Performance and Accountability Report 28
phenomena from the distant, ancient reaches of the universe. Based on Swift’s numerous discoveries since its launch in 2004, scientists hope that gamma-ray bursts, including very distant bursts, are plentiful. If so, Swift will be the premier way to study the early universe.
Image caption: In this artist’s concept, two neutron stars collide in a black-hole-forming explosion that was seen by Swift as a short gamma-ray burst. While black holes do not have a surface, they are regions in space of infinite density. The bursts marking their birth are extremely bright, but short lived, since they do not contain enough fuel to sustain a long afterglow. Swift was designed to spot these ephemeral explosions. (Image: D. Berry/NASA)
Voyager Finds Surprises in the Solar System’s Final Frontier The solar system is surrounded by a bubble-shaped area called the termination shock, where the solar wind, a thin stream of electrically charged gas blowing continuously outward from the Sun, is slowed by pressure from gas outside the solar system. Voyager 1, which started its journey more than 26 years ago by investigating Jupiter and Saturn, burst through that bubble in May 2005 and entered into the solar system’s final frontier.
Voyager is now flying through an area beyond the termination shock known as the heliosheath, a region created by the interstellar winds that blow past the protective shell of the solar system’s heliosphere. During the spacecraft’s trip through the edge of the solar system, it found some surprises that revealed new information about the Sun and its interaction with the rest of the galaxy.
Scientists expected the solar wind beyond the termination shock would slow down. But Voyager sent back data that said the speed was much slower than expected, and at times the solar wind appeared to be flowing back inward toward the Sun. Researchers believe this could be related to the highs and lows of the Sun’s 11-year cycle of sunspot activity.
Perhaps the most puzzling surprise is what Voyager did not find at the shock. Scientists predicted that interstellar ions would bounce back and forth across the termination shock, slowly gaining energy with each bounce to become high-speed cosmic rays. Because of this, scientists expected those cosmic ray ions would become most intense at the shock. However, the intensity of the cosmic rays has steadily increased as Voyager moves farther beyond the shock. This means that the source of those cosmic rays is in a region of the outer solar system yet to be discovered.
As Voyager leaves the solar system, it ventures into new territory—interstellar space—that has only been glimpsed by telescopes. The spacecraft, which could survive the dark, cold reaches of space until 2020, will continue to make amazing discoveries.
Image caption: This artist’s concept depicts the two Voyager spacecrafts approaching the edge of the solar system, called the heliopause, where the Sun’s influence ends. In spring 2005, Voyager 1 left the termination shock, where the million-mile-per-hour solar wind abruptly slows and becomes denser and hotter as it presses against interstellar gas, creating a bow shock. By the end of FY 2005, its sibling, Voyager 2, was traveling through the termination shock. (Image: NASA/Walt Feimer)
Measuring NASA’s Performance
Confronting the challenge of measuring performance NASA faces a number of unique challenges in measuring and reporting annually on Agency performance. For example, NASA’s goals are long term, and much of the Agency’s work focuses on unpredictable discovery and innovation. Many NASA activities involve work that has never been done before, technology that has not been developed yet, and programs and projects that involve

FY 2005 Performance and Accountability Report 29
complex, high-risk research and development work. These challenges make it difficult for the Agency to take a valid annual measurement of performance progress. In fact, in some years, the NASA team might take a step back only to achieve greater performance progress in succeeding years. It is a management challenge of enormous proportion.
NASA’s strategy for establishing, measuring, and achieving performance goals is simple: an integrated process that links budget planning and investment strategy with performance planning, tracking, and reporting. NASA is proud to be the first agency in the federal government that integrated strategic, budget, and performance planning processes and documents and used full-cost budgeting/accounting to identify the true costs for evaluating investment alternatives.
The current NASA Strategic Plan was updated in 2003; it is being rewritten for publication in 2006. The new Strategic Plan will reflect this integrated strategic planning and management system and it will underpin NASA’s integrated planning process. This integrated planning process will create a framework that enables the Agency to measure performance on a continual basis and make necessary adjustments to ensure that programmatic and institutional performance goals are achieved.
Program Assessment Rating Tool The Program Assessment Rating Tool (PART) is an evaluation tool developed by the Office of Management and Budget (OMB) to assess the effectiveness of federal programs. The PART assessment is rigorous and interactive. NASA submits one-third of its program portfolios to OMB each year, resulting in a complete Agency-wide assessment every three years.
An analysis of NASA’s PART assessments shows that NASA consistently scores high for program purpose and design, strategic planning, and program management. Scores vary by program for results and accountability, with the science programs demonstrating the greatest results. (For a list of OMB’s assessment of NASA’s program portfolios, see Appendix 1.)
The President’s Management Agenda NASA tracked six initiatives under the President’s Management Agenda (PMA) umbrella this fiscal year: Strategic Management of Human Capital; Competitive Sourcing; E-Government; Budget and Performance Integration; Real Property; and Financial Performance. By the end of FY 2005, NASA was on track to maintain or achieve “Green” status ratings in the first four initiatives, a “Yellow” status rating in Real Property, and a “Red” status rating in Financial Performance.
Following are NASA’s FY 2005 PMA accomplishments:
• The Office of Personnel Management included a number of NASA human capital activities in their Best Management Practices Showcase.
• Other agencies use NASA’s integrated budget and performance document, released as the annual Budget Estimates, as a benchmark for their own integrated budget and performance documents.
• The full-cost budget request for each program now includes its share of all costs, so the Agency can track the full cost of programs and manage them accordingly.
• Other agencies are benefiting from NASA’s achievements in E-Government, as the Agency actively participates in inter-agency activities and lessons-learned-sharing.
• This year, NASA also is on track to receive a “green” in Competitive Sourcing (also referred to as A-76), having completed all major goals. Most important, NASA selected a provider for NASA’s Shared Services Center initiative.

FY 2005 Performance and Accountability Report 30
• Real Property is the newest PMA initiative to be tracked, and by June 30, NASA had completed all required actions to achieve a “Yellow” status rating. In addition, NASA’s progress in upgrading its standing was rated “Green.”
NASA remains “Red” in the Financial Performance initiative. Under the watchful eye of NASA’s Inspector General, however, NASA is working with OMB and the Agency’s other stakeholders to move forward in resolving material weaknesses in this area.
Summary of NASA’s FY 2005 Performance Ratings In February 2005, NASA published The New Age of Exploration: NASA’s Direction for 2005 and Beyond. This document provided the Agency’s first strategic framework supporting the Vision for Space Exploration by identifying 18 long-term Strategic Objectives that NASA would pursue and to which all Agency program and resources would be tied.
In FY 2005, NASA directed the Agency’s efforts toward achieving 14 of these Objectives. NASA revised the FY 2005 Performance Plan to reflect these Objectives and identified or developed Annual Peformance Goals (APGs) supporting each of the 14. However, since the Agency did not pursue Objectives 1, 9, 10, and 16 in FY 2005, they are not reflected in the rating summaries that follow or in the Detailed Performance Data in Part 2. NASA’s intention is to address Objectives 1, 9, 10, and 16 in FY 2006 and beyond, although the format and wording of all 18 Objectives is subject to change, since NASA is developing a new Strategic Plan for publication in February 2006.
NASA’s Objectives for FY 2005 2. Conduct robotic exploration of Mars to search for evidence of life, to understand the history of
the solar system, and to prepare for future human exploration.
3. Conduct robotic exploration across the solar system for scientific purposes and to support human exploration. In particular, explore Jupiter’s moons, asteroids, and other bodies to search for evidence of life, to understand the history of the solar system, and to search for resources.
4. Conduct advanced telescope searches for Earth-like planets and habitable environments around the stars.
5. Explore the universe to understand its origin, structure, evolution, and destiny.
6. Return the Space Shuttle to flight and focus its use on completion of the International Space Station, complete assembly of the ISS, and retire the Space Shuttle in 2010, following completion of its role in ISS assembly. Conduct ISS activities consistent with U.S. obligations to ISS partners.
7. Develop a new crew exploration vehicle to provide crew transportation for missions beyond low Earth orbit. First test flight to be by the end of this decade, with operational capability for human exploration no later than 2014.
8. Focus research and use of the ISS on supporting space exploration goals, with emphasis on understanding how the space environment affects human health and capabilities, and developing countermeasures.
11. Develop and demonstrate power generation, propulsion, life support, and other key capabilities required to support more distant, more capable, and/or longer duration human and robotic exploration of Mars and other destinations.
12. Provide advanced aeronautical technologies to meet the challenges of next generation systems in aviation, for civilian and scientific purposes, in our atmosphere and in atmospheres of other worlds.

FY 2005 Performance and Accountability Report 31
13. Use NASA missions and other activities to inspire and motivate the Nation’s students and teachers, to engage and educate the public, and to advance the scientific and technological capabilities of the Nation.
14. Advance scientific knowledge of the Earth system through space-based observation, assimilation of new observations, and development and deployment of enabling technologies, systems, and capabilities including those with the potential to improve future operational systems.
15. Explore the Sun–Earth system to understand the Sun and its effects on Earth, the solar system, and the space environmental conditions that will be experienced by human explorers, and demonstrate technologies that can improve future operational systems.
17. Pursue commercial opportunities for providing transportation and other services supporting International Space Station and exploration missions beyond Earth orbit. Separate to the maximum extent practical crew from cargo.
18. Use U.S. commercial space capabilities and services to fulfill NASA requirements to the maximum extent practical and continue to involve, or increase the involvement of, the U.S. private sector in design and development of space systems.
APG Rating Scale Blue: Significantly exceeded the APG.
Green: Achieved the APG.
Yel low: Failed to achieve the APG, but NASA made significant progress and anticipates achieving the APG next fiscal year.
Red: Failed to achieve the APG, and NASA does not anticipate completing it within the next fiscal year.
White: This APG was postponed or canceled by management directive.
Outcome Rating Scale Green: Achieved most APGs; on track to achieve or exceed this Outcome.
Ye l low: Progress toward the Outcome was significant, however, NASA may not achieve this Outcome as stated.
Red: Failed to achieve most APGs, and NASA does not expect to achieve this Outcome as stated.
White: This Outcome was postponed or canceled by management directive or this Outcome is no longer applicable based on management changes to the APGs.
In FY 2005, NASA achieved (rated Green) or exceeded (rated Blue) 82 percent of the Agency’s 210 APGs. NASA did not achieve fully, but made significant progress toward achieving (rated Yellow), another 10 percent of the Agency’s APGs. The remaining 8 percent either were not achieved (rated Red) or were not pursued due to management decisions (rated White). See the figure below, left, for a summary of NASA’s APG ratings for FY 2005. NASA also is on track to achieve or exceed 96 percent of its 78 multi-year Outcomes. See the figure below, right, for a summary of NASA’s Outcome ratings for FY 2005.

FY 2005 Performance and Accountability Report 32
Contents of Figures
Objective 2
All eight Outcomes are Green. Fourteen APGs: one Blue, nine Green, three Yellow, and one White.
Objective 3
All 10 Outcomes are Green. Fourteen APGs: three Blue, 10 Green, and one Yellow.
Objective 4
Eight Outcomes: seven Green and one Yellow. Twelve APGs: two Blue, eight Green, one Yellow, and one Red.
Objective 5
All nine Outcomes are Green. Ten APGs: three Blue, five Green, and two Yellow.
Objective 6
Both Outcomes are Green. Seven APGs: one Blue, five Green, and one Red.
Objective 7
The one Outcome is Green. Five APGs: four Green and one White.
Objective 8
All seven Outcomes are Green. Twenty APGs: 16 Green, three Yellow, and one White.
Objective 11
Seven Outcomes: six Green and one White. Twenty-four APGs: two Blue, 16 Green, three Yellow, one Red, and two White.
Objective 12
Nine Outcomes: eight Green and one White. Twenty-six APGs: 18 Green, two Yellow, one Red, and five White.
Objective 13
All five Outcomes are Green. All 22 APGs are Green.
Objective 14
Both Outcomes are Green. Nineteen APGs: two Blue and 17 Green.
Objective 15
All eight Outcomes are Green. Twelve APGs: three Blue, seven Green, one Yellow, and one White.

FY 2005 Performance and Accountability Report 33
Objective 17
The single Outcome is Green. The single APG is Yellow.
Objective 18
The single Outcome is Green. The single APG is Green.
Eff iciency Measures
No Outcomes. Twenty-three APGs: 17 Green, four Yellow, and two Red.
Part 2 of this report includes detailed performance data supporting the Performance Achievement Highlights, including color ratings and trend information, where applicable, for each APG and Outcome. Part 2 is organized by the Agency’s Objectives and Outcomes as specified in NASA’s FY 2005 Performance Plan Update. Part 2 also includes a detailed Performance Improvement Plan that describes the corrective actions necessary for NASA to achieve fully the APGs that were not achieved as planned this fiscal year.
The performance information in this report reflects data available as of September 30, 2005, unless otherwise noted.
NASA Performance Achievement Scorecard Below is the score card rating showing NASA’s progress toward achieving its 78 multi-year Outcomes during FY 2005. For detailed information about this fiscal year’s performance, including NASA’s Performance Improvement Plan, ratings for NASA’s Annual Performance Goals, and rating trends, please see Part 2: Detailed Performance Data. (Please note that some Agency Objectives, and their associated Outcomes, are commitments for future budget years, and thus are not shown here.)
FY 2005 Outcome FY 2005 Rating
2.1: Characterize the present climate of Mars and determine how it has evolved over time. Green
2.2: Understand the history and behavior of water and other volatiles on Mars. Green
2.3: Understand the chemistry, mineralogy, and chronology of Martian materials. Green
2.4: Determine the characteristics and dynamics of the interior of Mars. Green
2.5: Understand the character and extent of prebiotic chemistry on Mars. Green
2.6: Search for chemical and biological signatures of past and present life on Mars. Green
2.7: Identify and understand the hazards that the Martian environment will present to human explorers. Green
2.8: Inventory and characterize Martian resources of potential benefit to human exploration of Mars. Green
3.1: Understand the initial stages of planet and satellite formation. Green
3.2: Understand the processes that determine the characteristics of bodies in our solar system and how these processes operate and interact. Green
3.3: Understand why the terrestrial planets are so different from one another. Green
3.4: Learn what our solar system can tell us about extra-solar planetary systems. Green

FY 2005 Performance and Accountability Report 34
FY 2005 Outcome FY 2005 Rating
3.5: Determine the nature, history, and distribution of volatile and organic compounds in the solar system. Green
3.6: Identify the habitable zones in the solar system. Green
3.7: Identify the sources of simple chemicals that contribute to pre-biotic evolution and the emergence of life.
Green
3.8: Study Earth’s geologic and biologic records to determine the historical relationship between Earth and its biosphere.
Green
3.9: By 2008, inventory at least 90 percent of asteroids and comets larger than one kilometer in diameter that could come near Earth. Green
3.10: Determine the physical characteristics of comets and asteroids relevant to any threat they may pose to Earth. Green
4.1: Learn how the cosmic web of matter organized into the first stars and galaxies and how these evolved into the stars and galaxies we see today. Green
4.2: Understand how different galactic ecosystems of stars and gas formed and which ones might support the existence of planets and life. Green
4.3: Learn how gas and dust become stars and planets. Green
4.4: Observe planetary systems around other stars and compare their architectures and evolution with our own. Green
4.5: Characterize the giant planets orbiting other stars. Green
4.6: Find out how common Earth-like planets are and see if any might be habitable. Green
4.7: Trace the chemical pathways by which simple molecules and dust evolve into the organic molecules important for life. Yellow
4.8: Develop the tools and techniques to search for life on planets beyond our solar system. Green
5.1: Search for gravitational waves from the earliest moments of the Big Bang. Green
5.2: Determine the size, shape, and matter–energy content of the universe. Green
5.3: Measure the cosmic evolution of dark energy. Green
5.4: Determine how black holes are formed, where they are, and how they evolve. Green
5.5: Test Einstein’s theory of gravity and map space–time near event horizons of black holes. Green
5.6: Observe stars and other material plunging into black holes. Green
5.7: Determine how, where, and when the chemical elements were made, and trace the flows of energy and magnetic fields that exchange them between stars, dust, and gas.
Green
5.8: Explore the behavior of matter in extreme astrophysical environments, including disks, cosmic jets, and the sources of gamma-ray bursts and cosmic rays.
Green
5.9: Discover how the interplay of baryons, dark matter, and gravity shapes galaxies and systems of galaxies. Green
6.1: Assure public, flight crew, and workforce safety for all Space Shuttle operations, and safely meet the manifest and flight rate commitment through completion of Space Station assembly. Green
6.2: Provide safe, well-managed, and 95 percent reliable space communications, rocket propulsion testing, and launch services to meet Agency requirements. Green

FY 2005 Performance and Accountability Report 35
FY 2005 Outcome FY 2005 Rating
7.1: By 2014, develop and flight-demonstrate a human exploration vehicle that supports safe, affordable, and effective transportation and life support for human crews traveling from Earth to destinations beyond LEO.
Green
8.1: By 2010, complete assembly of the ISS, including U.S. components that support U.S. space exploration goals and those provided by foreign partners. Green
8.2: Annually provide 90 percent of the optimal on-orbit resources available to support research, including power, data, crew time, logistics, and accommodations. Green
8.4: By 2006, each Research Partnership Center will establish at least one new partnership with a major NASA R&D program to conduct dual-use research that benefits NASA, industry, and academia. Green
8.5: By 2008, develop and test the following candidate countermeasures to ensure the health of humans traveling in space: bisphosphonates, potassium citrate, and mitodrine. Green
8.6: By 2008, reduce the uncertainties in estimating radiation risks by one-half. Green
8.7: By 2010, identify and test technologies to reduce total mass requirements for life support by two thirds using current ISS mass requirement baseline.
Green
8.8: By 2008, develop a predictive model and prototype systems to double improvements in radiation shielding efficiency. Green
11.3: By 2015, identify, develop, and validate human–robotic capabilities required to support human–robotic lunar missions. Green
11.4: By 2015, identify and execute a research and development program to develop technologies critical to support human–robotic lunar missions. Green
11.5: By 2016, develop and demonstrate in-space nuclear fission-based power and propulsion systems that can be integrated into future human and robotic exploration missions. White
11.6: Develop and deliver one new critical technology every two years in each of the following disciplines: in-space computing, space communications and networking, sensor technology, modular systems, robotics, power, and propulsion.
Green
11.7: Promote and develop innovative technology partnerships, involving each of NASA’s major R&D programs, among NASA, U.S. industry, and other sectors for the benefit of Mission Directorate needs. Green
11.8: Annually facilitate the award of venture capital funds or Phase III contracts to no less than two percent of NASA-sponsored Small Business Innovation Research Phase II firms to further develop or produce their technology for industry and government agencies.
Green
11.10: By 2005, demonstrate two prototype systems that prove the feasibility of resilient systems to mitigate risks in key NASA mission domains. Feasibility will be demonstrated by reconfigurability of avionics, sensors, and system performance parameters.
Green
12.1: By 2005, research, develop, and transfer technologies that would enable the reduction of the aviation fatal accident rate by 50 percent from the FY 1991–1996 average.
Green
12.2: Develop and validate technologies (by 2009) that would enable a 35 percent reduction in the vulnerabilities of the National Airspace System (as compared to the 2003 air transportation system). Green
12.3: Develop and validate technologies that would enable a 10-decibel reduction in aviation noise (from the level of 1997 subsonic aircraft) by 2009. Green
12.4: By 2010, flight demonstrate an aircraft that produces no CO2 or NOx to reduce smog and lower atmospheric ozone. White
12.5: By 2005, develop, demonstrate, and transfer key enabling capabilities for a small aircraft transportation system. Green
12.6: Develop and validate technologies (by 2009) that would enable a doubling of the capacity of the Green

FY 2005 Performance and Accountability Report 36
FY 2005 Outcome FY 2005 Rating
National Airspace Systems (from the 1997 NASA utilization).
12.9: Develop technologies that would enable solar powered vehicles to serve as “sub-orbital satellites” for science missions.
Green
12.10: By 2008, develop and demonstrate technologies required for routine Unmanned Aerial Vehicle operations in the National Airspace System above 18,000 feet for High-Altitude, Long-Endurance (HALE) UAVs.
Green
12.11: Reduce the effects of sonic boom levels to permit overland supersonic flight in normal operations. Green
13.1: Make available NASA-unique strategies, tools, content, and resources supporting the K–12 education community’s efforts to increase student interest and academic achievement in science, technology, engineering, and mathematics disciplines.
Green
13.2: Attract and prepare students for NASA-related careers, and enhance the research competitiveness of the Nation’s colleges and universities by providing opportunities for faculty and university-based research.
Green
13.3: Attract and prepare underrepresented and underserved students for NASA-related careers, and enhance competitiveness of minority-serving institutions by providing opportunities for faculty and university- and college-based research.
Green
13.4: Develop and deploy technology applications, products, services, and infrastructure that would enhance the educational process for formal and informal education. Green
13.5: Establish the forum for informal education community efforts to inspire the next generation of explorers and make available NASA-unique strategies, tools, content, and resources to enhance their capacity to engage in science, technology, engineering, and mathematics education.
Green
14.3: Develop and implement an information systems architecture that facilitates distribution and use of Earth science data. Green
14.4: Use space-based observations to improve understanding and prediction of Earth system variability and change for climate, weather, and natural hazards. Green
15.1: Develop the capability to predict solar activity and the evolution of solar disturbances as they propagate in the heliosphere and affect Earth. Green
15.2: Specify and enable prediction of changes to Earth’s radiation environment, ionosphere, and upper atmosphere. Green
15.3: Understand the role of solar variability in driving space climate and global change in Earth’s atmosphere. Green
15.4: Understand the structure and dynamics of the Sun and solar wind and the origins of magnetic variability. Green
15.5: Determine the evolution of the heliosphere and its interaction with the galaxy. Green
15.6: Understand the response of magnetospheres and atmospheres to external and internal drivers. Green
15.7: Discover how magnetic fields are created and evolve and how charged particles are accelerated. Green
15.8: Understand the coupling across multiple scale lengths and its generality in plasma systems. Green
17.1: By 2010, provide 80 percent of optimal ISS up-mass, down-mass, and crew availability using non-Shuttle crew and cargo services. Green
18.1: On an annual basis, develop an average of at least five new agreements per NASA Field Center with the Nation’s industrial and other sectors for transfer out of NASA developed technology. Green

FY 2005 Performance and Accountability Report 37
NASA’s Budgeted Cost of Performance NASA continually strives to enhance how the Agency reports on performance and the cost of that performance with the goal of being able to report costs of performance by Objective, Outcome, and APG. Due to the continuing issues with financial data previously reported, NASA cannot provide this level of cost information for FY 2005. However, as an interim measure, the FY 2005 budgeted cost of performance is included in this report for each Objective. These figures do not represent the actual cost of achieving NASA’s Objectives; they reflect NASA’s budgeted cost of performance, dollars allocated to achieving each NASA Objective. The figure below provides the budgeted cost of performance for the entire Agency. Additional detail is available, by Objective, in Part 2 of this report.
Content of Figure
Objective 2: $0.59 billion Objective 3: $1.15 billion Objective 4: $1.10 billion Objective 5: $0.38 billion Objective 6: $5.09 billion Objective 7: $0.06 billion Objective 8: $2.64 billion Objective 11: $0.96 billion Objective 12: $1.21 billion Objective 13: $0.19 billion Objective 14: $1.54 billion Objective 15: $0.75 billion Objective 17: $0.00 billion Objective 18: $0.05 billion

FY 2005 Performance and Accountability Report 38
FY 2005 FINANCIAL SUMMARY
FY 2005 Financial Statements Summary NASA is committed to ensuring that all stakeholders understand how NASA uses the Agency’s resources to support NASA’s mission effectively and efficiently. To do this, NASA relies on a single, integrated financial system to provide decision-makers with the accurate, reliable, and accessible data they need to manage their portfolio of projects and programs.
NASA’s financial statements were prepared to report the financial position and results of the Agency’s operations in accordance with generally accepted accounting principles as defined by The Chief Financial Officer’s Act of 1990. These financial statements were prepared from NASA’s Integrated Financial Management System Core Financial Module and other Treasury reports in accordance with formats prescribed by the Office of Management and Budget. They are in addition to financial reports prepared from the same books and records used to monitor and control budgetary resources. The statements should be read with the realization that NASA is a component of the U.S. Government, a sovereign entity.
Assets, Liabilities, and Cumulative Results of Operations The Consolidated Balance Sheet reflects total assets of $46.3 billion and liabilities of $3.5 billion for FY 2005. Unfunded liabilities reported in the statements cannot be liquidated without legislation that provides resources to do so. About 75 percent of the assets are property, plant, and equipment (PP&E), with a book value of $34.9 billion. PP&E is property located at NASA’s Centers, in space, and in the custody of contractors.
Cumulative Results of Operations represents the public’s investment in NASA, akin to stockholder’s equity in private industry. The public’s investment in NASA is valued at $37.5 billion. The Agency’s $42.8 net position includes $5.3 billion of unexpended appropriations (undelivered orders and unobligated amounts or funds provided, but not yet spent). Net position is presented on both the Consolidated Balance Sheet and the Consolidated Statement of Changes in Net Position.
Net Cost of Operation The Statement of Net Cost shows the net cost of NASA’s operations for FY 2005 (i.e., the amount of money NASA spent to carry out programs funded by Congressional appropriations).
Improper Payments In compliance with the Improper Payments Information Act of 2002 and specific guidance from the Office of Management and Budget, NASA developed a systematic process for reviewing all programs that are susceptible to significant improper payments. All NASA Centers were tasked to perform a statistical sampling of payments to determine the rate, volume, and amount of payments that were made improperly. Based on the review, NASA examined 883 payments representing $82,542,704. The results of the examination indicated that 18 payments were made improperly. Those payments represented an error rate of 2.1 percent and amounted to $617,442.
Since NASA’s FY 2005 performance was better than the Office of Management and Budget error rate threshold of 2.5 percent or greater and total improper payments of $10,000,000 or more, NASA is not at risk for significant improper payments. The Agency’s low rate of improper payments is due in large part to improved internal controls. In December 2004, NASA awarded a recovery audit contract to Horn and Associates, Inc., to assist in identifying and recouping erroneous payments.

FY 2005 Performance and Accountability Report 39
Management and Financial Systems, Controls, and Legal Compliance This report satisfies the legislative requirements that NASA address the systems and internal controls in place to ensure management excellence, accountability, and Agency compliance with applicable laws, statutes, and regulations. NASA identifies issues of concern through a strong network of oversight councils and internal and external auditors including NASA’s Operations Council, the Office of Inspector General, the General Accountability Office, the Office of Management and Budget, the NASA Advisory Council, and the Aerospace Safety Advisory Panel. In addition, NASA uses various systems to ensure effective management, including NASA’s Online Directives Information System (used to communicate applicable policy and procedural requirements Agency-wide), NASA’s Corrective Action Tracking System (used to track audit follow-up actions), and Erasmus (used by executive management to review program and project performance).
NASA is in compliance with all relevant laws, statutes, and legislation, unless otherwise noted and explained.
Statement of Reliability and Completeness of Financial and Performance Data: Audit Results NASA accepts the responsibility of reporting performance and financial data accurately and reliably with the same vigor as we accept and conduct our scientific research.
All performance data for this report is gathered and reported through a system of rigorous controls and quality checks. Representatives from each Mission Directorate gather year-end performance data from their respective program and project officers. The Associate Administrators of each Mission Directorate review and validate the data. Analysts in the Office of the Chief Financial Officer also review the data before it is archived with all pertinent source information. In addition, NASA uses its Erasmus management information system to track and report on performance, schedule, and financial data on a regular basis.
NASA conducted all financial operations using Integrated Financial Management System Core Financial Module at all NASA Centers. The system is certified by the Joint Financial Management Improvement Program and provides a consistent operating environment and improved internal controls.
The financial statements are prepared from the Agency’s accounting books and records, and the financial data contained in this report was subjected to a comprehensive review process to evaluate its accuracy and reliability. While the Integrated Financial Management System Core Financial Module has improved NASA’s financial management processes, NASA has a few remaining challenges related to the system start-up and data conversion issues. As with the implementation of any new system, critical transactional data must be identified, validated, documented and converted—and conversion errors are likely to occur. NASA deployed dedicated resources throughout the Agency to analyze and reconcile data differences. As the fiscal year ended, NASA made significant corrective progress, but there remain some unresolved data issues. Consequently, NASA was unsuccessful in fully resolving the data issues that resulted from the system conversion, and the independent auditors were unable to render an opinion on our FY 2005 financial statements; they issued a disclaimer of opinion.
Therefore, for FY 2005, NASA can provide reasonable assurance that the performance data in this report is complete and reliable. Performance data limitations are documented explicitly. However, the Agency cannot provide reasonable assurance that the financial data in this report is complete and reliable.

FY 2005 Performance and Accountability Report 40
LEGISLATIVE REQUIREMENTS, OMB GUIDELINES, AND INTERNAL CONTROLS NASA’s annual Performance and Accountability Report satisfies a number of executive, legislative, and regulatory reporting requirements, including those of the Government Performance and Results Act of 1993, the Chief Financial Officers Act of 1990, and the Reports Consolidation Act of 2000.
NASA is in compliance with all Performance and Accountability Report requirements. The table below lists the legislative acts and other regulations that mandate specific Performance and Accountability Report content requirements, the specific nature of those requirements, and where in this report the compliant information and statements can be found.
Statutes and Office of Management and Budget Guidelines Requirement Comments
Chief Financial Officers Act of 1990 Submit an audit report concerning financial management along with a financial statement of the preceding year.
NASA’s financial statements and the report of NASA’s Independent Auditors can be found in Part 3: Financials.
E-Government Act of 2002 Provide details on the resources utilized for information technology security at government agencies.
NASA maintains an ongoing information technology security program that meets federal requirements. The OMB 2007 Budget submission includes expenditures of approximately $90 million in FY 2007, this ongoing program includes activities related to information technology security management, operations, and maintenance.
Federal Financial Management Improvement Act (FFMIA) of 1996
Submit an annual statement concerning the implementation and compliance with accounting and financial guidelines.
The FFMIA statement is included in Part 1: Message from the Administrator.
Federal Managers Financial Integrity Act of 1982 (FMFIA)
Provide a report on the health and integrity of an agency’s financial, programmatic, and institutional activities and their ability to safeguard against waste, loss, unauthorized use, or misappropriation of funds.
The FMFIA statement is included in Part 1: Message from the Administrator.
Government Performance and Results Act of 1993
Provide information on an agency’s annual performance and progress in achieving the goals in its strategic plan and performance budget.
Parts 1 and 2 of this report meet the requirement for an annual performance report.
Inspector General Act of 1978, as amended
The Inspector General of the agency will provide a summary of serious management challenges.
Appendix 2 contains NASA’s Inspector General’s report on serious management challenges. The follow-up audit actions are included in Appendix 3.
Office of Management and Budget Circular A-136: Financial Reporting Requirements
Agencies shall prepare PARs in accordance with OMB Bulletin No. 01-09 Form and Content of Agency Financial Statements, as amended, and OMB Circular No. A-11
Part 3 of this report, containing NASA’s financial statements, is prepared in accordance with OMB guidance and regulations.

FY 2005 Performance and Accountability Report 41
Statutes and Office of Management and Budget Guidelines Requirement Comments
Preparation, Submission, and Execution of the Budget, as amended.
Agencies shall submit their PARs to OMB and the Congress no later than 45 days after the end of the fiscal year.
Because NASA’s fiscal year ends September 30, the Agency submits its Performance and Accountability Report to OMB and Congress no later than November 15.
For performance and accountability reports, agencies are encouraged to include in a single location a summary discussion of performance that meets both MD&A and GPRA performance report requirements. Agencies should include a statement by the agency head regarding the completeness and reliability of the financial and performance data.
Part 1: Message from the Administrator provides the statement of reliability and completeness. Part 3 includes an additional statement and overview from NASA’s Chief Financial Officer.
The MD&A should include comparisons of the current year to the prior year and should provide an analysis of the agency’s overall financial position and results of operations to assist users in assessing whether that financial position has improved or deteriorated as a result of the year’s activities.
Part 1: Financial Summary includes management’s discussion of NASA’s overall financial position. Part 3 provides a more detailed overview of NASA’s finances and provides a commparison of current and prior year(s) financial position where available or appropriate.
Office of Management and Budget Bulletin 01-09: Form and Content of Agency Financial Statements (OMB Circular A-136, above, supercedes this bulletin)
An agency’s financial statements should include basic statements and related notes, required supplementary stewardship information, and required supplementary information.
Part 3 of this report contains NASA’s financial statements and all related notes and information.
Provide a comparison of actual performance with planned performance as set out in the agency’s annual performance plan.
NASA provides a comparison of actual versus planned performance by Objective, Outcome, and Annual Performance Goal in Part 2: Detailed Performance Data. Part 2 also includes narrative discussion of multi-year Outcomes.
Provide an explanation, where a performance goal was not achieved, for why the goal was not met, descriptions of the plans and schedules to meet unmet goals in the future, or alternatively, actions regarding unmet goals that are deemed impractical or infeasible to achieve.
See NASA’s Performance Improvement Plan in Part 2: Detailed Performance Data.
Office of Management and Budget Circular A-11: Preparation, Submission and Execution of the Budget
Evaluate your performance budget for the current fiscal year, taking into account the actual performance achieved.
Beginning in FY 2006, NASA is evaluating and modifying its strategy and performance system to enable the Agency to better use performance data for budget planning purposes.

FY 2005 Performance and Accountability Report 42
Statutes and Office of Management and Budget Guidelines Requirement Comments
Provide actual performance information for at least four fiscal years.
Performance ratings under each Outcome in Part 2: Detailed Performance Data provide performance trend information (when applicable) for the last four fiscal years.
Provide Program Assessment Rating Tool (PART) Assessments.
Appendix 1 contains a summary of OMB’s PART recommendations for NASA programs.
Provide annual Statement of Assurance signed by the Administrator on the effectiveness of internal control.
Following Part 1: Letter from the Administrator is an insert, signed by the Administrator, entitled Management Assurances. It contains the overall Statement of Assurance on all internal control matters, followed by the Statement of Assurance for Internal Control Over Financial Reporting. The first statement fulfills the Section 2 requirement of FMFIA and the second statement addresses Section 4 of FMFIA.
Office of Management and Budget Circular A-123: Management’s Responsibility for Internal Control
A-123 includes reporting requirements for the Clinger–Cohen Act of 1996, Single Audit Act, as amended, the Improper Payments Information Act of 2002 (IPIA), and the Federal Information Security Management Act of 2002 (FISMA).
NASA’s Chief Financial Officer and Office of Inspector General agreed to implement the new requirements in the FY 2006 Performance and Accountability Report.
Combine an agency’s performance report with its accountability report.
This report represents the combination of NASA’s performance and accountability reports.
Each performance report shall contain an assessment of the completeness and reliability of the financial and performance data used in the report.
The assessment of completeness and reliability is included in Part 1: Message from the Administrator.
Reports Consolidation Act of 2000
Include Office of Inspector General serious management challenges.
Serious management challenges are referenced in Part 1: Message from the Administrator and provided in full in Appendix 2.

FY 2005 Performance and Accountability Report 43
Part 2: Detailed Performance Data Divider page image: The Spitzer Space Telescope imaged the star-forming “bubble” RCW 79, found in the constellation Centaurus, in April 2005. The bubble is 70-light years in diameter, and probably took about one million years to form from the radiation and winds of hot young stars. Stars are born when the hot bubble expands into the interstellar gas and dust around it. RCW 79 has spawned at least two groups of new stars along the edge of the large bubble. Some are visible inside the small bubble in the lower left corner. Another group of baby stars appears near the opening at the top. (NASA/JPL–Caltech/E. Churchwell, Univ. of Wisconsin, Madison)
Divider back page image: In May, Spitzer captured this false-color image (large infrared image) of the “South Pillar” in the star-forming region called the Carina Nebula. Like cracking open a watermelon and finding its seeds, the infrared telescope “busted open” this murky cloud to reveal star embryos (yellow or white) tucked inside finger-like pillars of thick dust (pink). Hot gases are green and foreground stars are blue. The inset visible-light picture shows quite a different view. The dust pillars are fewer and appear dark because the dust is soaking up visible light. (Infrared: NASA/JPL–Caltech/N. Smith, Univ. of Colorado, Boulder; Visible: NOAO/AURA/NSF)

FY 2005 Performance and Accountability Report 44
INTRODUCTION TO NASA’S DETAILED PERFORMANCE DATA To ensure that NASA pursues the Vision for Space Exploration in a systematic yet flexible manner, the Agency established 18 long-term research and development Objectives to guide NASA’s course in 2005 and beyond. The Agency’s FY 2005 Performance Plan Update is structured around these Objectives. NASA did not pursue Objectives 1, 9, 10, and 16 in FY 2005 and, therefore, they are not reflected in the Detailed Performance Data.
NASA’s Objectives for FY 2005 2. Conduct robotic exploration of Mars to search for evidence of life, to understand the history of
the solar system, and to prepare for future human exploration.
3. Conduct robotic exploration across the solar system for scientific purposes and to support human exploration. In particular, explore Jupiter’s moons, asteroids, and other bodies to search for evidence of life, to understand the history of the solar system, and to search for resources.
4. Conduct advanced telescope searches for Earth-like planets and habitable environments around the stars.
5. Explore the universe to understand its origin, structure, evolution, and destiny.
6. Return the Space Shuttle to flight and focus its use on completion of the International Space Station, complete assembly of the ISS, and retire the Space Shuttle in 2010, following completion of its role in ISS assembly. Conduct ISS activities consistent with U.S. obligations to ISS partners.
7. Develop a new crew exploration vehicle to provide crew transportation for missions beyond low Earth orbit. First test flight to be by the end of this decade, with operational capability for human exploration no later than 2014.
8. Focus research and use of the ISS on supporting space exploration goals, with emphasis on understanding how the space environment affects human health and capabilities, and developing countermeasures.
11. Develop and demonstrate power generation, propulsion, life support, and other key capabilities required to support more distant, more capable, and/or longer duration human and robotic exploration of Mars and other destinations.
12. Provide advanced aeronautical technologies to meet the challenges of next generation systems in aviation, for civilian and scientific purposes, in our atmosphere and in atmospheres of other worlds.
13. Use NASA missions and other activities to inspire and motivate the Nation’s students and teachers, to engage and educate the public, and to advance the scientific and technological capabilities of the Nation.
14. Advance scientific knowledge of the Earth system through space-based observation, assimilation of new observations, and development and deployment of enabling technologies, systems, and capabilities including those with the potential to improve future operational systems.
15. Explore the Sun–Earth system to understand the Sun and its effects on Earth, the solar system, and the space environmental conditions that will be experienced by human explorers, and demonstrate technologies that can improve future operational systems.

FY 2005 Performance and Accountability Report 45
17. Pursue commercial opportunities for providing transportation and other services supporting International Space Station and exploration missions beyond Earth orbit. Separate to the maximum extent practical crew from cargo.
18. Use U.S. commercial space capabilities and services to fulfill NASA requirements to the maximum extent practical and continue to involve, or increase the involvement of, the U.S. private sector in design and development of space systems.
In FY 2004 and FY 2005, NASA also included in the Agency’s Annual Performance Plan supporting multi-year Outcomes and Annual Performance Goals (APGs) to help the Agency address the difficult task of measuring annual performance against the 18 Objectives. The Outcomes enable NASA to focus and report on multi-year efforts more accurately, and the APGs enable the Agency to provide a clear picture of planned and actual annual performance.
Part 2 of this report, “Detailed Performance Data,” describes each of NASA’s Objectives and provides a detailed performance report and color rating for each Outcome, including available trend data. Part 2 also includes color ratings for each APG, as well as APG trend data for up to four years, where applicable. (Performance ratings for NASA’s Uniform Measures are located at the end of Part 2, preceded by a brief explanation of their purpose and organization.) Finally, Part 2 includes NASA’s Performance Improvement Plan addressing all FY 2005 Outcomes and APGs that were not achieved fully.
The APG and Outcome ratings in Part 2 reflect NASA management’s intense efforts to evaluate thoroughly and objectively the Agency’s performance based on all data available as of September 30, 2005. Internal reviewers (NASA employees and managers at many levels across the Agency) reviewed the performance results and recommended APG color ratings to NASA senior officials. In some cases, external reviewers (e.g., highly qualified individuals, advisory boards, and advisory councils outside NASA) also assisted in this evaluation process by reviewing the same performance results and independently recommending specific APG color ratings. Following careful assessment of all performance data and results, as well as the color rating recommendations of both the internal and external reviewers, NASA senior management officials assigned color ratings to each APG using the following color rating criteria:
APG Rating Scale Blue: Significantly exceeded the APG.
Green: Achieved the APG.
Yel low: Failed to achieve the APG, but NASA made significant progress and anticipates achieving the APG next fiscal year.
Red: Failed to achieve the APG, and NASA does not anticipate completing it within the next fiscal year.
White: This APG was postponed or canceled by management directive.
The figure below provides a summary of NASA’s FY 2005 APG performance by Objective.
Next, aided again in many cases by recommendations from internal and external reviewers, NASA senior management assigned color ratings to each Outcome. (Please note that Outcome ratings are not averages of APG ratings, and they are not based solely on the Agency’s performance in the current fiscal year. Outcome ratings are based on NASA’s progress toward achieving the multi-year performance goal. Therefore, it is possible to have APGs rated Yellow or Red and still be on target to achieve an Outcome, as stated.)
NASA senior management officials assigned color ratings to each Outcome using the following color rating criteria:

FY 2005 Performance and Accountability Report 46
Outcome Rating Scale Green: Achieved most APGs; on track to achieve or exceed this Outcome.
Ye l low: Progress toward the Outcome was significant, however, NASA may not achieve this Outcome as stated.
Red: Failed to achieve most APGs, and NASA does not expect to achieve this Outcome as stated.
White: This Outcome was postponed or canceled by management directive or this Outcome is no longer applicable based on management changes to the APGs.
The figure below provides a summary of NASA’s FY 2005 Outcome performance by Objective.
Contents of Both Figures
Objective 2
All eight Outcomes are Green. Fourteen APGs: one Blue, nine Green, three Yellow, and one White.
Objective 3
All 10 Outcomes are Green. Fourteen APGs: three Blue, 10 Green, and one Yellow.
Objective 4
Eight Outcomes: seven Green and one Yellow. Twelve APGs: two Blue, eight Green, one Yellow, and one Red.
Objective 5
All nine Outcomes are Green. Ten APGs: three Blue, five Green, and two Yellow.
Objective 6
Both Outcomes are Green. Seven APGs: one Blue, five Green, and one Red.
Objective 7
The one Outcome is Green. Five APGs: four Green and one White.
Objective 8
All seven Outcomes are Green. Twenty APGs: 16 Green, three Yellow, and one White.
Objective 11
Seven Outcomes: six Green and one White. Twenty-four APGs: two Blue, 16 Green, three Yellow, one Red, and two White.
Objective 12
Nine Outcomes: eight Green and one White. Twenty-six APGs: 18 Green, two Yellow, one Red, and five White.

FY 2005 Performance and Accountability Report 47
Objective 13
All five Outcomes are Green. All 22 APGs are Green.
Objective 14
Both Outcomes are Green. Nineteen APGs: two Blue and 17 Green.
Objective 15
All eight Outcomes are Green. Twelve APGs: three Blue, seven Green, one Yellow, and one White.
Objective 17
The single Outcome is Green. The single APG is Yellow.
Objective 18
The single Outcome is Green. The single APG is Green.
Eff iciency Measures
No Outcomes. Twenty-three APGs: 17 Green, four Yellow, and two Red.
NASA is including a Performance Improvement Plan in this year’s report. This Plan addresses, in detail, each APG and Outcome that was not fully achieved (rated Green) in FY 2005. For each unmet Performance Outcome or APG, the Performance Improvement Plan presents an explanation as to why the metric was not met and how NASA plans to improve performance in this metric (or why NASA will be eliminating this metric) in the future. This Plan also demonstrates how future performance improvements will enable NASA to achieve many Outcomes in spite of current year APG ratings of Yellow or Red.

FY 2005 Performance and Accountability Report 48
Objective 2: Conduct robotic exploration of Mars to search for evidence of life, to understand the history of the solar system, and to prepare for future human exploration.
WHY PURSUE OBJECTIVE 2? Since NASA’s Mariner 4 spacecraft took the first close-up picture of Mars in 1965, robotic missions to Earth’s red neighbor have revealed a planet that is strangely familiar, yet different enough to challenge perceptions of what makes a planet work. After every mission, new discoveries send scientists back to the drawing board to revise existing theories about Mars and the solar system.
Mars shares many of Earth’s features, including polar ice caps, seasonal weather patterns, clouds, volcanoes, and canyons. Recent NASA missions to Mars—the twin Mars Exploration Rovers, Mars 2001 Odyssey, and Mars Global Surveyor—found evidence of water, an essential element for life, in landscape formations and in the composition of some of its rocks. These findings indicate that rivers and lakes of liquid water once flowed across the red planet’s now-desolate surface.
This discovery sparked many questions about what caused the differences and similarities between Earth and Mars. Does Mars have reservoirs of water under its surface? Did Mars once harbor life? Could life still exist in canyons or deep under the surface? If Mars has the potential to support life, could other planets or moons in the solar system support life? What can Mars tell scientists about the history of the solar system?
The Mars Reconnaissance Orbiter, launched in August 2005, continues NASA’s efforts to answer these questions. As the spacecraft circles Mars, it will search remotely for water under the surface, analyze the planet’s geology and atmosphere, and search for resources that could help humans explore Mars and places beyond. NASA also is planning future missions, like the Mars Science Laboratory, that will examine the red planet up close and in unprecedented detail.
Photo caption: Spirit looks out across the Columbia Hills of Gusev Crater in this section of a panorama composed of pictures taken on August 24 to 26, 2005. In the center is the Inner Basin, where rover team members planned to send Spirit in the future. (Photo: NASA/JPL–Caltech/Cornell)
NASA’S PROGRESS AND ACHIEVEMENTS IN FY 2005
Outcome Ratings Under Objective 2, NASA is on track to achieve all 8 Outcomes (100% Green).
APG Ratings Under Objective 2 NASA achieved or exceeded 10 of 14 APGs: one APG is Blue (7%), nine APGs are Green (65%), three APGs are Yellow (21%), and one APG is White (7%).
Outcome 2.1: Characterize the present climate of Mars and determine how it has evolved over time. The FY 2005 rating is Green. The FY 2004 (Outcome 5.3.1) rating was Green.

FY 2005 Performance and Accountability Report 49
Mars Exploration Rovers continue to reveal Mars’ climate secrets In FY 2005, the Mars Exploration Rovers (Spirit and Opportunity) continued studying the present climate of Mars. The long life of the rovers has allowed them to monitor seasonal changes in the atmosphere. Opportunity saw frost and clouds marking the seasonal movement of water vapor from Mars’ north pole to its south pole. From its perch near the top of Husband Hill, Spirit captured images of dust devils moving across the floor of Gusev Crater. The rovers’ observations show that as the Martian summer nears and the area warms up, dust devil activity increases. The amount of dust varies with the season on Mars, and dust devils appear to play an important role in Martian weather because they inject dust into the atmosphere. NASA will use measurements from the rovers, the Mars Global Surveyor, and the Mars Odyssey to improve climate models in preparation for future robotic and human landed missions.
Opportunity glimpsed Mars’ past by examining the layers of rock in Burns Cliff in the Endurance Crater. The sequence of rocks exposed there describes Mars’ ancient changeable climate which varied repeatedly from desert conditions to wet periods with a fluctuating water table that saturated some of the rock layers.
Photo Caption: NASA’s Mars Exploration Rover Opportunity captured this view of Burns Cliff after driving to the base of this southeastern portion of the inner wall of Endurance Crater. The view combines frames taken by Opportunity’s panoramic camera from November 13 to 20, 2004. (Photo: NASA/JPL/Cornell)
Understanding the Martian atmosphere The atmosphere of Mars undergoes rapid and drastic variations in density. Understanding these variations is essential to date the surface of Mars. One way to estimate the age of a planet’s surface is by the number of impact craters created by falling meteorites. However, variations in a planet’s atmospheric density could affect this analysis. If the atmosphere is thick, it will prevent smaller meteorites from reaching the surface, because the increased friction caused by the thicker atmosphere will heat many smaller meteorites until they disintegrate. By analyzing the relationship between Mars’ atmospheric density and the rate at which craters are formed, researchers can gain a better view of the processes in the atmosphere and on the surface that shaped the Martian landscape.
FY 2005 Annual Performance Goals FY 2004 FY 2003 FY 2002
5MEP5 White
Successfully complete the Mission Concept Review and PMSR for the 2009 Mars Telesat Orbiter (NOTE: this APG supports all MEP research focus areas).
none none none
5MEP7 Green
Successfully demonstrate progress in characterizing the present climate of Mars and determine how it has evolved over time. Progress towards achieving outcomes will be validated by external review.
4MEP9 Green
none none
Performance Shortfalls APG 5MEP5: NASA did not hold the Preliminary Mission System Review for the 2009 Mars Telesat Orbiter. The Mars Telesat Orbiter was canceled as part of a reprioritization of science.
Outcome 2.2: Understand the history and behavior of water and other volatiles on Mars. The FY 2005 ratings is Green. The FY 2004 (Outcome 5.3.2) rating was Blue.

FY 2005 Performance and Accountability Report 50
Mars Exploration Rovers and the search for Mars’ water The Mars Exploration Rovers have explored the surface of Mars well past their design lifetimes, sampling regions not originally thought accessible. They continue to find evidence of past episodes of standing liquid water. These results, in part, led to the Mars rovers being declared “Breakthrough of the Year” by Science magazine in its December 17, 2004, issue.
After landing, Spirit found itself on a dry volcanic plain where the rocks had been slightly altered by small amounts of water. However, once the rover reached Columbia Hills, the rocks indicated that the ancient hills predating the lava flows were once bathed by large amounts of water. For several months, Spirit climbed a flank of Husband Hill, the tallest in the range, and examined the rocks along the way. Rocks from different layers share compositional traits, suggesting a shared origin. However, the degree to which minerals in rocks have been altered chemically by exposure to water or other processes varies greatly from outcrop to outcrop. The textures also vary greatly. The hypothesis that best fits these data postulates that the hills are a stack of volcanic ash or debris that erupted explosively from volcanoes and settled down into different environments. In some cases, additional interaction with water over time altered the rocks even more. Spirit also found that many of the rocks contained a large amount of sulfate salt, and the rover’s spectrometer identified the mineral goethite in some rocks, a mineral that only forms in the presence of water.
Martian water—boiling and freezing at the same time? Since their first discovery, orbital images of Mars suggested that the planet’s gullies are relatively young and were formed by running water. Scientists find these results to be paradoxical because liquid water is unstable on the Martian surface. The surface temperatures and pressures at many of the gullies’ locations are below the “triple point” where liquid water normally will boil or freeze spontaneously. Surprisingly, new numerical simulations indicate that these gullies formed in the low temperature and pressure conditions of present day Mars by the action of relatively pure liquid water boiling and freezing simultaneously.
Photo caption: This mosaic of 24 frames from Spirit’s microscopic imager shows the texture of a target called “Keystone” on the “Methuselah” outcrop of layered rock on Husband Hill inside Mars’ Gusev Crater. The target area shows fine layers that may have been deposited by wind or water. The images were taken on April 28, 2005. (Photo: NASA/JPL/Cornell/USGS)
FY 2005 Annual Performance Goals FY 2004 FY 2003 FY 2002
5MEP1 Green
Successfully complete assembly, test, and launch operations (ATLO) for the Mars Reconnaissance Orbiter mission.
none none none
5MEP2 Green
Successfully launch the Mars Reconnaissance Orbiter. none none none
5MEP8 Blue
Successfully demonstrate progress in investigating the history and behavior of water and other volatiles on Mars. Progress towards achieving outcomes will be validated by external review.
4MEP10 Blue
none none
Spotlight: Rover Team Tests Mars Moves on Earth For more than a year, the Mars Exploration Rover Opportunity stealthily dodged rocks and dunes as it explored Meridiani Planum, until April 26, 2005, when it became buried up to its wheel hubs in a ripple-shaped, soft-sand dune. A team of engineers at the Jet Propulsion Laboratory quickly began formulating a strategy to get Opportunity out of the trap.

FY 2005 Performance and Accountability Report 51
The team created a simulated dune in a testing laboratory, but found their test rover had no trouble escaping the dune, even when it was sunk in up to its belly. They experimented with different sand mixtures—blends containing play sand for children’s sandboxes, diatomaceous earth for swimming pool filters, and mortar clay powder—until they had more than two tons of simulated Mars sand for more realistic mobility tests. They tested every move carefully before sending directions to Opportunity.
After an intensive month of hard work, where the team directed the rover in cautious increments, Opportunity finally set its wheels on firm sand. The rover’s next task was to examine the dune to provide the team a better understanding of what made that dune different from the dozens of similar ones the rover easily crossed. This new information will help the team plan a safer route as Opportunity continues to explore Mars’ rugged terrain.
Photo caption: Rover engineers check how a test rover moves in material chosen to simulate the dune that bogged down Opportunity on April 26, 2005. They are working inside the In-Situ Instrument Laboratory at NASA’s Jet Propulsion Laboratory. The team will use the information they gained from the tests and Opportunity’s observations of the dune to better direct the rover and to develop safer routes for future rover missions. (Photo: NASA)
Outcome 2.3: Understand the chemistry, mineralogy, and chronology of Martian materials. The FY 2005 rating is Green. The FY 2004 (Outcome 5.3.3) rating was Blue.
Understanding Mars’ geology—past and present Dr. Jeff Moore of NASA’s Ames Research Center and Dr. Mark Bullock of the Southwest Research Institute have been performing experiments simulating the formation of salts on the Martian surface. They found that synthetic Mars water, produced by the interaction of pure water with Mars-like basalts (a type of volcanic rock), has elemental abundances very similar to that of the soil measured by the Viking and Mars Pathfinder landers. They also found that when the water evaporates, salts are left behind that show striking similarities to the salt beds found by the Mars rover Opportunity. The chemistry of both the globally-distributed Martian soil and the sulfate deposits at Meridiani point to large-scale chemical reactions between basalt and water at some time in the past.
Martian meteorites as a window into Mars’ past Analyses of tungsten and neodymium isotopes in the Martian meteorites revealed the chronology of crust and mantle formation on Mars. This study showed that the mantle sources of these meteorites were formed earlier than 4.525 billion years ago, possibly by solidification of an early magma ocean on Mars.
Photo caption: The European Space Agency’s Mars Express spacecraft launches aboard a Russian Soyuz/Fregat launch vehicle from Baikonur, Kazakhstanin this photo taken in summer 2003. The United States is one of 12 countries participating in the mission. (Photo: ESA/S. Corvaja, Starsem)
FY 2005 Annual Performance Goals FY 2004 FY 2003 FY 2002
5MEP9 Green
Successfully demonstrate progress in studying the chemistry, mineralogy, and chronology of Martian materials. Progress towards achieving outcomes will be validated by external review.
4MEP11 Blue
none none

FY 2005 Performance and Accountability Report 52
Outcome 2.4: Determine the characteristics and dynamics of the interior of Mars. The FY 2005 rating is Green. The FY 2004 (Outcome 5.3.4) rating was Green.
Researchers believe that Mars has a metallic core, but a lack of seismic data (due to the absence of any seismometers on Mars) has prevented them from confirming whether the core is solid or liquid. Other geophysical data, including magnetic measurements from Mars Global Surveyor (also known as MGS), suggest that early Mars possessed a magnetic field generated by a “planetary dynamo,” caused by the movement of molten fluids in the planet’s core. Measurements of tidal deformation, along with the inferred presence of a planetary dynamo, suggest that at least the outer part of the Martian core is liquid.
Understanding Martian volcanoes An analysis of a tight ring of fractures around each of three Martian volcanoes in the Tharsis Rise (an ancient volcanic province that spans a quarter of the surface of Mars) suggests that the Tharsis Rise was not much warmer than the rest of Mars when the volcanoes formed. Previous mechanical models had difficulty explaining these rings, mainly because the rings are so close to the volcanoes and do not extend far. By modifying the models to include a phenomenon analogous to one that occurs in the crust beneath some of Earth’s volcanoes, researchers are closer to understanding how the rings and Mars’ surface formed.
Image caption: This composite from the Mars Global Surveyor of images taken on July 6, 2005, shows an isolated water ice cloud extending more than 18 miles above the Martian surface. Clouds such as this are common in late spring over the terrain located southwest of the Arsia Mons volcano. Arsia Mons is the dark, oval feature near the limb, just to the left of the “T” in the “Tharsis Montes” label. The dark, nearly circular feature above the “s” in “Tharsis” is the volcano, Pavonis Mons, and the other dark circular feature, above and to the right of “s” in “Montes,” is Ascraeus Mons. (Image: NASA/JPL/Malin Space Science Systems)
FY 2005 Annual Performance Goals FY 2004 FY 2003 FY 2002
5MEP10 Green
Successfully demonstrate progress in determining the characteristics and dynamics of the interior of Mars. Progress towards achieving outcomes will be validated by external review.
4MEP12 Green
none none
Outcome 2.5: Understand the character and extent of prebiotic chemistry on Mars. The FY 2005 rating is Green. The FY 2004 (Outcome 5.4.1) rating was Green.
Looking for signs of life in Mars-like soils Researchers studied Mars-like soils in the extreme arid region of the Atacama Desert in Chile. These soils have trace levels of organic compounds and extremely low levels of culturable bacteria. Incubation experiments with the soils show that non-biological processes actively decompose organic species. These experiments support the theory that the present lack of organic material on the surface of Mars is due to the high radiation and oxidizing environment.

FY 2005 Performance and Accountability Report 53
FY 2005 Annual Performance Goals FY 2004 FY 2003 FY 2002
5MEP4 Yellow
Successfully complete the Preliminary Mission System Review (PMSR) for the 2009 Mars Science Laboratory (MSL) mission.
none none none
5MEP6 Green
Successfully complete Preliminary Design Review (PDR) for Laser Communication Demonstration (NOTE: this APG supports all Mars Exploration research focus areas).
none none none
5MEP11 Yellow
Successfully demonstrate progress in investigating the character and extent of prebiotic chemistry on Mars. Progress towards achieving outcomes will be validated by external review.
4MEP13 Green
none none
Performance Shortfalls APG 5MEP4: NASA postponed the Preliminary Mission System Review for the 2009 Mars Science Laboratory. The review is scheduled for December 2005, with no impact to the mission launch date.
APG 5MEP6: Although there was no performance shortfall for this APG, the Laser Communication Demonstration was canceled, after the Preliminary Design Review was completed, as part of the reprioritization of NASA’s science goals. NASA will complete several key technology elements, including ground system detectors and flight-like optical transmitter breadboard, due to their long-term scientific value. NASA also will catalog and archive the associated data so that the matured technologies can be applied in future development and possibly future missions.
APG 5MEP11: NASA did not make sufficient progress in investigating the character and extent of prebiotic chemistry on Mars due to a lack of currently operating flight missions designed to address this Outcome.
Outcome 2.6: Search for chemical and biological signatures of past and present life on Mars. The FY 2005 rating is Green. The FY 2004 (Outcome 5.4.2) rating was Green.
Martian methane—a sign of life? During FY 2005, several scientists, including those funded by NASA, detected very small amounts of methane in the Martian atmosphere. Some scientists also reported spatial and temporal variations in methane concentration. These observations may indicate the presence of current or extinct Martian life.
Searching for signs of life in Mars’ past—here on Earth Studies of the Martian meteorite ALH84001 suggest that magnetite crystals may be a biosignature, a chemical sign of life. On Earth, some bacteria use chains of small magnetite crystals to help them stay at an optimal depth in sediments. NASA-supported researchers are using state-of-the-art computations to understand which features of magnetite crystals are biosignatures and which are due to basic physics. These studies also are furthering the development of Ferromagnetic Resonance Spectroscopy as a tool for biosignature detection—a method that holds great promise for future missions to Mars.
Photo caption: NASA and Michigan State University scientists found methane-generating bacteria living in young volcanic deposits, both hot and cold, on the Ploskii Tolbachik volcano, shown here, on Russia’s Kamchatka Peninsula. Scientists using data from the European Space Agency’s Mars Express spacecraft reported finding small amounts of methane in Mars’ atmosphere. A potential source is volcanoes like Olympus Mons or methane-generating bacteria like those found on Earth.

FY 2005 Performance and Accountability Report 54
Scientists will continue to debate the topic and search for new and better ways to duplicate and improve measurements of methane on Mars. (Photo: NASA/MSU)
FY 2005 Annual Performance Goals FY 2004 FY 2003 FY 2002
5MEP3 Green
Complete science instrument selections for the 2009 Mars Science Laboratory (MSL).
none none none
5MEP12 Green
Successfully demonstrate progress in searching for chemical and biological signatures of past and present life on Mars. Progress towards achieving outcomes will be validated by external review.
4MEP14 Green
3S6 Green
2S6 Green
Outcome 2.7: Identify and understand the hazards that the Martian environment will present to human explorers. The FY 2005 rating is Green. The FY 2004 (Outcome 5.5.1) rating was Blue.
Working with the biomedical, advanced life support, advanced extravehicular activity, and advanced environmental monitoring and control communities, NASA began a comprehensive suite of studies to identify the potential hazards Mars poses to human explorers. These studies also will enable scientists to protect Earth from possible biological contamination from hardware and samples returned from Mars. The team published “Planetary Protection Issues in the Human Exploration of Mars” as a NASA Conference Publication. They also developed, in cooperation with the European Space Agency, requirements for life support and extravehicular activity systems to protect exploration crews—and Earth—from potential biological threats. The requirements include an overall strategy for avoiding Martian hazards (while also protecting Mars science, such as the search for biosignatures, from the influence of the human explorers) and specific requirements on crew support systems and operational practices for Mars missions.
Looking out for dust devils Dust devils are vortexes in the atmosphere that act like vacuum cleaners, lifting dust from the surface. Although scientists have been aware of dust devils on Mars for some time, they did not know the amount of dust the devils injected into the atmosphere. Recent laboratory simulations and new observations from the Mars Exploration Rovers now show that dust devils lifted 42 tons of dust a day from the nine-square-mile area observed by Spirit. This activity is a function of Martian season and time of day. Therefore, Martian dust devils may play a significant role in generating larger dust storms on Mars, and they must be factored in as potential hazards for future surface operations for robotic and human explorers.
Photo caption: Dust devils move from right to left across a plain inside Mars’ Gusev Crater in this image taken on July 13, 2005, by the Mars Exploration Rover Spirit in hills rising from the plain. The number of dust devils the rover sees increase during Mars’ spring. (Photo: NASA/JPL/Texas A&M)
FY 2005 Annual Performance Goals FY 2004 FY 2003 FY 2002
5MEP13 Green
Successfully demonstrate progress in identifying and studying the hazards that the Martian environment will present to human explorers. Progress towards achieving outcomes will be validated by external review.
4MEP15 Blue
3S8 Green
2S8 Blue

FY 2005 Performance and Accountability Report 55
Outcome 2.8: Inventory and characterize Martian resources of potential benefit to human exploration of Mars. The FY 2005 rating is Green. The FY 2004 (Outcome 5.5.2) rating was Blue.
Mars Reconnaissance Orbiter on its way to the red planet The recently launched Mars Reconnaissance Orbiter (commonly known as MRO) will be able to identify and map mineral formations at a much finer scale than previous orbiters. It also will be able to determine whether the ice found by Mars Odyssey is the top layer of a deep ice deposit or a shallow layer in equilibrium with the current atmosphere and its seasonal cycle of water vapor.
Image caption: This crescent view of Earth’s Moon in blue–green wavelengths comes from a camera test by NASA’s Mars Reconnaissance Orbiter spacecraft on its way to Mars. The mission’s High Resolution Imaging Science Experiment camera took the image on September 8, 2005, while at a distance of about 6 million miles from the Moon. The Mars Reconnaissance Orbiter, launched on August 12, 2005, should reach Mars on March 10, 2006. (NASA/JPL/Univ. of Arizona)
FY 2005 Annual Performance Goals FY 2004 FY 2003 FY 2002
5MEP14 Yellow
Successfully demonstrate progress in inventorying and characterizing Martian resources of potential benefit to human exploration of Mars. Progress towards achieving outcomes will be validated by external review.
4MEP16 Blue
3S8 Green
2S8 Blue
Performance Shortfalls APG 5MEP14: NASA did not make sufficient progress in inventorying and characterizing Martian resources of potential benefit to human exploration of Mars due to a lack of currently operating flight missions designed to address this Outcome.
Resources NASA’s FY 2005 budgeted cost of performance for Objective 2 was $0.59 billion. NASA cannot provide FY 2005 budgeted cost of performance information at the Outcome level for this Objective.

FY 2005 Performance and Accountability Report 56
Objective 3: Conduct robotic exploration across the solar system for scientific purposes and to support human exploration. In particular, explore Jupiter’s moons, asteroids, and other bodies to search for evidence of life, to understand the history of the solar system, and to search for resources.
WHY PURSUE OBJECTIVE 3? The solar system is a place of incredible variety: small, terrestrial planets, immense gas giants, rocky asteroids clustered together to form belts, and beautiful comets in eccentric orbits made of dust and ice. Each object seems enticingly unique. Yet, as scientists study the solar system, they discover astonishing similarities between Earth and its solar system neighbors, from signs of past oceans on Mars to the existence of organic compounds within the atmosphere of Saturn’s moon, Titan.
NASA conducts robotic missions of different complexities and scopes to answer fundamental questions about how the solar system formed and evolved, how Earth and this planet’s life forms were created, and whether life exists elsewhere in the solar system. These missions also provide insight into how other, distant solar systems form and whether they may have the potential for life.
In the future, astronauts will explore the solar system. Today’s robotic missions are laying the groundwork for this exploration by identifying potential targets, characterizing hazards, and searching for resources like oxygen and metals that will help astronauts safely journey farther from home.
Image caption: Titan’s atmosphere glows blue and red in this false-colored image taken by the Cassini spacecraft during its April 16, 2005, flyby of Saturn’s moon. Titan is enclosed by a thick, hazy atmosphere that is impenetrable by telescopes and cameras. The Huygens Probe, supplied by the European Space Agency and carried aboard Cassini, descended to the moon’s surface in January 2005, giving the world its first glimpse of the mysterious moon beneath the haze. (Image: NASA/JPL/Space Science Institute)
NASA’S PROGRESS AND ACHIEVEMENTS IN FY 2005
Outcome Ratings Under Objective 3, NASA is on track to achieve all 10 Outcomes (100% Green).
APG Ratings Under Objective 3, NASA achieved or exceeded 13 of 14 APGs: three Blue (21%), 10 Green (72%), and one Yellow (7%).
Outcome 3.1: Understand the initial stages of planet and satellite formation. The FY 2005 rating is Green. The FY 2004 (Outcome 5.1.1) rating was Yellow.
Meteorites and the formation of the solar system Detailed work on meteorites embedded with small, round granules of solar system materials called chondrules shows that the oldest materials preserved from the formation of the solar system are the calcium–aluminum-rich inclusions that formed a few million years before chondrules. Recently

FY 2005 Performance and Accountability Report 57
published work shows that at least some of these calcium–aluminum-rich inclusions remelted about two million years after their formation, revealing exquisite details about the processes and the timing of events during the formation of the solar system.
Understanding the formation of extra-solar systems The discovery of over a hundred extra-solar planetary systems has profound implications for how Earth’s solar system formed. The fact that Jupiter-mass planets appear to be commonplace around sun-like stars means that the formation mechanism for such gas giant planets must be fairly robust. Scientists have two competing theories explaining their formation: core accretion and disk instability. By examining disk instability models, scientists found that cooling of the dusty disk by vertical flows (similar to those in a boiling pot of water being heated at its bottom) created gravitational instability that can cause a gas giant planet to form.
Reaping the research of Genesis The Genesis science team reported that the mission achieved most of its scientific goals despite the spacecraft’s “hard landing” last year. This year, NASA made initial allocations of solar wind materials collected during the mission to science team members and announced the schedule for allocating samples to the outside science community. In addition, NASA made major progress on developing procedures for cleaning the surfaces of gross contaminants introduced by the impact of the sample return capsule with the Utah desert and of surface films from spacecraft degassing. Researchers also began measuring noble gas isotopic ratios that will provide clues to the solar system’s age and processes that formed solar system objects. Researchers will publish scientific papers containing the mission’s results in FY 2006.
Photo caption: Researchers in the Genesis Laboratory cleanroom at Johnson Space Center remove the concentrator targets and grid assembly from nitrogen storage to begin sample extraction. The Genesis mission sample return capsule crash landed in the Utah desert in September 2004 when its parachute failed to open. Despite this, its four collector arrays, vital to the scientific success of the mission, were in good shape and NASA expects to meet most of the mission’s science objectives. Concentrators inside the arrays collected solar-oxygen ions blown by solar wind, which will provide clues to how the solar system was formed. (Photo: NASA)
FY 2005 Annual Performance Goals FY 2004 FY 2003 FY 2002
5SSE2 Green
Complete integration and testing for New Horizons/Pluto. none none none
5SSE4 Green
Release a NASA Research Announcement (NRA) for in space power and propulsion technology development activities. (NOTE: this APG could potentially support multiple SSE research focus areas).
none none none
5SSE7 Green
Successfully demonstrate progress in understanding the initial stages of planet and satellite formation. Progress towards achieving outcomes will be validated by external review.
4SSE12 Yellow
none none
Outcome 3.2: Understand the processes that determine the characteristics of bodies in our solar system and how these processes operate and interact. The FY 2005 rating is Green. The FY 2004 (Outcome 5.1.2) rating was Green.

FY 2005 Performance and Accountability Report 58
Unlocking the secrets of Saturn and its moons The Cassini spacecraft (with 12 instruments) and its European-built companion, the Huygens probe (with six instruments), entered the Saturn system on July 1, 2004—almost seven years after launching from Cape Canaveral. On approach to Saturn, Cassini flew within 1,305 miles of its outermost moon, Phoebe. Analyzing Cassini’s observations of Pheobe’s surface composition and density, researchers have concluded that Phoebe is a captured object from the Kuiper Belt, the mysterious, debris-laden region beyond the orbit of Neptune.
While Cassini crossed Saturn’s ring plane, the probe’s instruments tracked lightning associated with storms, clouds, vertical wind shears, and thermal variations in the atmosphere. Observations of Saturn’s kilometric radiation suggest that Saturn’s rotation rate has slowed by about six minutes since Voyager observed it in 1981. Although more research is needed, scientists believe the slowing is due to momentum exchange between the rings, the magnetosphere, and the planet.
The Huygens probe was released from Cassini on Christmas Day 2004 and landed on Titan’s surface on January 14, 2005. The probe functioned perfectly, taking high-resolution images and other science data on its two-an-half-hour descent through Titan’s atmosphere and landing intact in a marshy area. In defiance of all expectations, the probe continued to transmit data to the orbiting Cassini spacecraft until Cassini went below the horizon. Cassini then transmitted the data back to Earth.
During FY 2005, Cassini mapped 60 percent of Titan’s surface using visible and infrared cameras. This is augmented by high-resolution, cloud-penetrating radar images of two percent of the surface. The surface appears to be relatively young and flat. It has only a few large and degraded impact craters and a striking variation in surface deposits. Together, these features indicate geological activity with active resurfacing and weathering by methane rain and perhaps snow formed from higher hydrocarbons. Cassini also found evidence for ammonia–water volcanism. Liquid methane appears to be flowing onto Titan’s surface, resulting in lakes, rivers, and shorelines. Cassini’s instruments identified more than a dozen simple hydrocarbons that are known to be necessary precursors for life.
New insight on the Moon Researchers studying a lunar meteorite discovered in Africa found it to be only 2.9 billion years old, the youngest age date known for a lunar rock. This indicates that volcanism was active on the Moon for a significantly longer period than previously thought.
Image caption: The European Space Agency’s Huygens probe took this image (left) of Titan’s surface—the first ever close-up view—on January 14, 2005. The image is colored, using data from the probe, to reflect the actual color. Telescopes and passing spacecraft are unable to view the surface because of Titan’s smoggy atmosphere, shown in this natural-color image (right) taken by Cassini on February 15. (Huygens: NASA/JPL/ESA/University of Arizona; Cassini: NASA/JPL/Space Science Institute)
FY 2005 Annual Performance Goals FY 2004 FY 2003 FY 2002
5SSE8 Blue
Successfully demonstrate progress in studying the processes that determine the characteristics of bodies in our solar system and how these processes operate and interact. Progress towards achieving outcomes will be validated by external review.
4SSE13 Green
3S3 Green
2S3 Green

FY 2005 Performance and Accountability Report 59
Outcome 3.3: Understand why the terrestrial planets are so different from one another. The FY 2005 rating is Green. The FY 2004 (Outcome 5.1.3) rating was Green.
MESSENGER continues its journey to Mercury NASA’s MESSENGER spacecraft flew by Earth on August 2, 2005, one year after its launch, to use the pull of gravity to guide it towards Mercury’s orbit (following two flybys of Venus and three of Mercury). The spacecraft will enter Mercury orbit in March 2011. MESSENGER then will conduct a one-year, in-depth investigation of the planet. The mission scientists and operations team used the Earth flyby to calibrate the remote sensing instruments. The MESSENGER project also completed the in-orbit check-out of the spacecraft and its instruments.
A closer look at the Moon Recent high-resolution Earth-based radar mapping of the Moon provided information on the properties of the lunar soil to depths of up to 164 feet. NASA mapped a large area of ancient mare basalt, extending westward from Oceanus Procellarum, that is now buried by ejecta (material ejected from an explosion like from a meteor impact or a volcanic eruption) from the Orientale basin. NASA also identified Orientale-derived impact melt deposits in many of the permanently shadowed craters near the Moon’s south pole. These results emphasize the predominance of large-scale impact processes in the development of local soil layering for airless bodies like the Moon.
Image caption: MESSENGER’s Earth flyby on August 2, 2005, adjusted the spacecraft’s path to Mercury and gave the science team an opportunity to calibrate the instruments. The composite on the left closely mimics the sensitivity of the human eye. Short wavelength light is scattered on Earth’s atmosphere, producing blue skies, but also obscuring the surface. The image on the right is taken in the infrared wavelengths. Since infrared light is not easily scattered, the image shows more detail below the atmosphere. Land appears red due to the high reflectance of vegetation in the near-infrared. (Images: JHU/NASA)
FY 2005 Annual Performance Goals FY 2004 FY 2003 FY 2002
5SSE9 Yellow
Successfully demonstrate progress in understanding why the terrestrial planets are so different from one another. Progress towards achieving outcomes will be validated by external review.
4SSE14 Green
3S5 Green
2S5 Green
Performance Shortfalls APG 5SSE9: NASA did not make sufficient progress in understanding why the terrestrial planets are so different from one another due to the lack of flight missions planned to address this Outcome in general and Venus in particular.
Spotlight: Icy Jupiter Moon Surprises Scientists In May 2005, scientists studying data from NASA’s Galileo spacecraft found that Jupiter’s moon, Amalthea, is a pile of icy rubble less dense than water—not at all what they expected. Scientists expected moons closer to the planet to be rocky. The finding shook up long-held theories of how moons form around giant planets.
Current models imply that temperatures were high at Amalthea’s current position when Jupiter’s moons formed, but this is inconsistent with Amalthea being icy. This model is based on the theory

FY 2005 Performance and Accountability Report 60
that early Jupiter, like a weaker version of the early Sun, would have emitted enough heat to prevent volatile, low-density material from condensing and being incorporated into the closer moons. Jupiter’s four largest moons fit this model, with the innermost of them, Io, made mainly of rock and iron. The new data suggest that either Amalthea was formed later than the major moons or it was formed farther from Jupiter and then was pulled in by the gas giant. Either of these explanations challenges current models of moon formation around giant planets.
Amalthea is a small, red-tinted moon that orbits about 112,468 miles from Jupiter, considerably closer than the Moon orbits Earth. Analysis of the moon’s density, volume, shape, and internal gravitational stresses led the scientists to conclude that Amalthea is not only porous with internal empty space, but also contains substantial water ice.
Image caption: Several years after the Galileo spacecraft took this image of Jupiter’s irregularly shaped moon, Amalthea, the moon threw scientists a curve ball. Recent analysis shows that Amalthea consists largely of water ice, not rock as expected. Although blurry, this image taken in 1999 is among the highest-resolution images of the unusual moon. This “stereo pair” helped scientists study the topography of Amalthea’s surface features. (Images: NASA/Cornell Univ.)
Outcome 3.4: Learn what our solar system can tell us about extra-solar planetary systems. The FY 2005 rating is Green. The FY 2004 (Outcome 5.1.4) rating was Green.
Understanding the formation of gas giant planets The orbits of the giant planets in Earth’s solar system have changed significantly, and violently, since the planets formed. This is inferred from the results of a series of numerical simulations that, for the first time, reproduce much of the observed structure of the outer solar system. This new model envisions that the four giant planets (Jupiter, Saturn, Neptune, and Uranus) formed in a very compact configuration surrounded by a disk of planetesimals. The calculations indicate that the giant planets suffered dramatic orbital changes before settling into their present state. The model also explains many of the observed characteristics of the solar system and will help scientists understand processes that may subtly or dramatically change the orbits of extrasolar giant planets in multiple-planet systems.
Looking for Oort clouds Computer simulations of synthetic planetary systems show that the number and arrangement of large outer planets can affect the size of a planetary system’s Oort cloud (an area on the outer edge of the solar system believed to be the birthplace of most comets), thereby affecting the impact rate on the inner planets. The stability of the arrangement of outer planets also is important, as well, since instability in their orbits can trigger massive comet and asteroid bombardments of the inner planets, much like the Late Heavy Bombardment endured by Earth approximately 3.8- to 4-billion years ago.
Meteorites give insight into early solar system processes Scientists believe that chondrules (small, round granules of solar system material) are the basic building blocks of planets in the inner solar system. Their rounded shapes imply that they were once flash-heated to melting temperatures, and their textures imply that they then cooled rapidly. Meteorite specialists have sought the mechanism behind this rapid heating for over 100 years. Recent calculations show that in any planet-forming disk capable of forming a Jupiter-mass planet, the spiral arms and clumps that accompany planet formation drive strong shock fronts that appear to be capable of shock-heating dust grains and turning them into chondrules. This process would

FY 2005 Performance and Accountability Report 61
have occurred early in Earth’s solar system, as well as in other planetary systems containing Jupiter-like planets.
A new planet? A new object discovered in the Kuiper Belt appears to be larger than Pluto. Using a 48-inch telescope on Mount Palomar, researchers first saw object “2003UB313” two years ago, but did not recognize it as a planet because its great distance from the Sun means that it moves slowly against the sky, making it difficult to track. Once researchers saw the motion and inferred the distance, they realized that 2003UB313—the third-brightest Kuiper Belt object—is at least as large as Pluto, depending on its intrinsic brightness. This discovery is a result of meticulous, ongoing surveys to discover Kuiper Belt objects, and 2003UB313 challenges the notion that the solar system is composed of only nine planets.
Image caption: These time-lapse images, taken 90 minutes apart, were made on Oct. 21, 2003, using the Samuel Oschin Telescope at the Palomar Observatory near San Diego, California. The object, circled in white to distinguish it from background stars, was so far away that the research team did not identify it as a new-found planet until they reanalyzed the data in 2005. The team announced that the planet, located in the Kuiper Belt, is larger than Pluto. More observations are needed to fully characterize its size and orbit. (Images: Samuel Oschin Telescope, Palomar Observatory)
FY 2005 Annual Performance Goals FY 2004 FY 2003 FY 2002
5SSE10 Blue
Successfully demonstrate progress in learning what our solar system can tell us about extra-solar planetary systems. Progress towards achieving outcomes will be validated by external review.
4SSE15 Green
none none
Outcome 3.5: Determine the nature, history, and distribution of volatile and organic compounds in the solar system. The FY 2005 rating is Green. The FY 2004 (Outcome 5.2.1) rating was Green.
Understanding GEMS in the solar system Extremely fine-grained aggregates called glass with embedded metal and sulfides, or GEMS, are an important and enigmatic component in interplanetary dust particles, commonly known as cosmic dust. GEMS are associated closely with organic carbon components in cosmic dust and probably present the best samples of pre-solar-system organic materials available. Researchers analyzed these materials with a new-generation electron microscope and found that they have spectral features that match those that have been observed by astronomers in the interstellar medium. As a result, researchers established an important link between primitive dust that can be sampled in Earth’s solar system and the material present in interstellar space that is the repository of long-dead stars, planetary systems, and the raw material for new systems.
Understanding the origin of organic compounds in Titan’s atmosphere Researchers created a consistent picture of the origin of Titan’s atmosphere using Cassini measurements of compounds present at the top of Titan’s atmosphere and Huygens probe measurements at the bottom of the atmosphere. The measurements indicated that methane may have been manufactured within Titan from carbon dioxide or other carbon-bearing compounds. These results from Cassini represent new constraints for theories regarding the origin of Titan’s atmosphere, specifying much more tightly the primordial material from which the atmosphere was derived.

FY 2005 Performance and Accountability Report 62
FY 2005 Annual Performance Goals FY 2004 FY 2003 FY 2002
5SSE3 Green
Select the next New Frontiers mission (NOTE: this APG could potentially support multiple SSE research focus areas).
none none none
5SSE11 Green
Successfully demonstrate progress in determining the nature, history, and distribution of volatile and organic compounds in the solar system. Progress towards achieving outcomes will be validated by external review.
4SSE16 Green
none none
Outcome 3.6: Identify the habitable zones in the solar system. The FY 2005 rating is Green. The FY 2004 (Outcome 5.2.2) rating was Green.
Looking for life’s hiding places on Mars Recent data from the Mars Exploration Rovers indicate that early Mars may have had highly acidic environments. Researchers began studies of similar environments on Earth to develop methods for exploring these types of environments and to define new biomarkers that can survive in this extreme environment. Research on the highly acidic Rio Tinto in Spain revealed an astounding, and previously unexpected, diversity of microbial life in the iron-rich river. In another research program, scientists began dissecting the structure and function of a microbial community living in the sulfuric acid- and metal-rich 108-degree Fahrenheit waters of an underground mine. This research used state-of-the-art genetic and chemical analysis tools to determine the genomes of the organisms inhabiting the community and the metabolic functions performed by those organisms.
Researchers interpreted two lines of evidence—remnant paleomagnetism (the magnetic field left over in rocks created by a planet’s magnetic field when the rocks were initially formed) and the orientation of valley networks—as signs that the ancient Martian poles and equator were located far from the modern poles and equator. As researchers search for ancient rocks, possibly from warmer and wetter times, they will have to take into account where the poles and equator were at that time.
Looking for life’s hiding places on Titan Scientists are considering whether Titan could support life. Data from the Cassini/Huygens mission on the composition of Titan’s atmosphere and surface, including the inventory of organic chemicals, will provide scientists with needed constraints on the possibility of life on Titan.
Image caption: From the Columbia Hills, Spirit can see the peak of Husband Hills toward the right of this image, compiled from pictures taken in July 2005. During its climb to the peak, Spirit investigated rocks that appear to have been altered by exposure to water. (Image: NASA/JPL–Caltech/Cornell)
FY 2005 Annual Performance Goals FY 2004 FY 2003 FY 2002
5SSE12 Green
Successfully demonstrate progress in identifying the habitable zones in the solar system. Progress towards achieving outcomes will be validated by external review.
4SSE17 Green
3S6 Green
2S6 Green

FY 2005 Performance and Accountability Report 63
Outcome 3.7: Identify the sources of simple chemicals that contribute to pre-biotic evolution and the emergence of life. The FY 2005 rating is Green. The FY 2004 (Outcome 5.2.3) rating was Green.
The RNA (ribonucleic acid) World Theory speculates that during the evolution of life on Earth, RNA was the building block of basic biochemical functions for early life forms. This theory suggests that RNA molecules stored information and acted as catalysts to accelerate chemical reactions. Scientists long have thought that large RNA molecules are needed to achieve efficient chemical reactions. They have expended much effort trying to synthesize long RNA chains under plausible prebiotic (pre-life) conditions. Recent experiments, however, show that long RNA chains may not be needed, and that shorter RNA molecules provide the best catalysts.
One of the stumbling blocks to proving the RNA World theory has been the instability of ribose, the key sugar composing the RNA backbone, in water. Researchers now know, however, that the presence of low concentrations of borate minerals stabilizes ribose, making the RNA more resilient.
Meteorites give clues to early life on Earth The larger portion of organic matter delivered to early Earth by meteorites was a complex macromolecule that is insoluble in water. Recent studies show that this insoluble material breaks down to produce a range of water-soluble organic compounds when exposed to conditions similar to those encountered at a hydrothermal vent (an undersea volcanic vent). These compounds include dicarboxylic acids, which researchers proposed as possible constituents of the earliest biological membranes.
Phosphorus is an element essential to life on Earth, but in the past, researchers believed that the interaction of rocks with water on early Earth did not liberate much of it. In FY 2005, research demonstrated that the amount of water-soluble phosphorus in carbonaceous meteorites, like the Murchison meteorite, may be much greater than that generated by the dissolution of common terrestrial crustal rock. This provides a new clue to the source of phosphorus on the early Earth.
FY 2005 Annual Performance Goals FY 2004 FY 2003 FY 2002
5SSE13 Green
Successfully demonstrate progress in identifying the sources of simple chemicals that contribute to prebiotic evolution and the emergence of life. Progress towards achieving outcomes will be validated by external review.
4SSE18 Green
3S6 Green
2S6 Green
Outcome 3.8: Study Earth’s geologic and biologic records to determine the historical relationship between Earth and its biosphere. The FY 2005 rating is Green. The FY 2004 (Outcome 5.2.4) rating was Green.
Understanding past mass extinctions on Earth Using a novel combination of mineral deposit data and organism-specific biomarkers, researchers found clear evidence that during one of Earth’s mass extinctions (in which up to 90 percent of marine species died), the upper regions of the ocean were not only oxygen-poor, but also full of sulfide. This suggests that sulfide toxicity helped drive the extinction and slowed the rate of recovery.

FY 2005 Performance and Accountability Report 64
Understanding Earth’s ancient atmosphere The history of oxygen in Earth’s atmosphere is crucial to understanding the evolution of life on Earth. Recent study results show that prior to 2.4 billion years ago, sulfur isotopes found in rocks were separated independently of their relative masses. This separation could only be produced in a nearly oxygen-free atmosphere. Moreover, experiments indicate that the precise details of the separation can be linked to particular microbial metabolisms, providing more clues to the early evolution of life on Earth.
Out of the sea The ancestors of Earth’s land-based life lived in the water. Recent research on the evolution of algae, the simplest green plants, uncovered genetic evidence that there may have been as many as 14 independent transitions from an aquatic lifestyle to a land-based lifestyle in the history of plants. If confirmed, this would alter researchers’ current understanding of the difficulty of life’s ancient transition from the water to the land.
FY 2005 Annual Performance Goals FY 2004 FY 2003 FY 2002
5SSE14 Green
Successfully demonstrate progress in studying Earth’s geologic and biologic records to determine the historical relationship between Earth and its biosphere. Progress towards achieving outcomes will be validated by external review.
4SSE19 Green
3S6 Green
2S6 Green
Outcome 3.9: By 2008, inventory at least 90 percent of asteroids and comets larger than one kilometer in diameter that could come near Earth. The FY 2005 rating is Green. The FY 2004 (Outcome 1.4.1) rating was Green.
In FY 2005, asteroid search teams funded by the Near Earth Object Observation Program found 57 large objects, bringing the total number known to 799 out of an estimated population of approximately 1,100. In addition, teams also found 466 smaller asteroids of less than one kilometer in diameter and three comets with orbits coming within Earth’s vicinity, bringing the total number known to 3,582. The teams predict that none of the objects are likely to hit Earth in the next century, but 724 are in orbits that could become a hazard in the more distant future and warrant monitoring, and 153 are larger than one kilometer in diameter. Of these hazards, 89 were found this year alone, 10 of which are larger than 1 kilometer in diameter.
One very significant discovery this fiscal year was an asteroid designated 2004 MN4. Researchers predict that this object will approach Earth on April 13, 2029, coming within 20,000 miles of Earth’s surface—inside the orbit of geosynchronous satellites. Using planetary radar observations, researchers eliminated any probability of impact on this pass. But future passes of the object bear watching, as it returns to Earth’s vicinity about every six to seven years.
Image caption: 2004 MN4’s orbit around the Sun is shown in blue in the above illustration. Much of the asteroid’s orbit lies within Earth’s orbit, which is the outermost white circle. The positions of the asteroid and Earth are shown for December 23, 2004, when the object was about 9 million miles from Earth. Astronomers classified it as a near-Earth asteroid in December, when they confirmed that it would pass near Earth in 2029. Although there is no risk of collision during the 2029 pass, astronomers will continue tracking 2004 MN4 to determine its orbit in the more-distant future. (Image: NASA)

FY 2005 Performance and Accountability Report 65
FY 2005 Annual Performance Goals FY 2004 FY 2003 FY 2002
5SSE5 Green
Successfully demonstrate progress in determining the inventory and dynamics of bodies that may pose an impact hazard to Earth. Progress towards achieving outcomes will be validated by external review.
4SSE10 Green
none none
Outcome 3.10: Determine the physical characteristics of comets and asteroids relevant to any threat they may pose to Earth. The FY 2005 rating is Green. The FY 2004 (Outcome 1.4.2) rating was Green.
Making a “Deep Impact” on the study of comets On July 4th, the Deep Impact mission successfully rendezvoused with comet 9P/Tempel 1 and deployed Deep Impact’s autonomous impactor. The impactor struck the comet nucleus at 1:52 AM EDT. The impact was monitored by the Deep Impact flyby spacecraft, the Hubble and Spitzer Space Telescopes, the Chandra X-ray Observatory, XMM–Newton, GALEX, FUSE, and Rosetta spacecraft, 60 ground-based observatories in 20 countries, and an international network of amateur astronomers. The results of these observations will provide the first analysis of material from the interior of a comet.
Studying asteroids to mitigate possible hazards to Earth Understanding the structure of asteroidal bodies has implications for the hazards they pose and for how to mitigate such hazards. A recent investigation of the population of impact craters on asteroid 433 Eros indicates that while the interior of Eros is dense enough to transmit seismic energy over many miles, the exterior of the asteroid must be composed of relatively non-cohesive material. Therefore, any attempt to destroy or disrupt a potentially hazardous asteroid may have to penetrate it deeply to be effective.
Photo caption: The sun rises at Cape Canaveral Air Force Station, Florida, on January 12, 2005, where the Boeing Delta II rocket carrying the Deep Impact spacecraft waits for launch. (Photo: NASA)
FY 2005 Annual Performance Goals FY 2004 FY 2003 FY 2002
5SSE1 Green
Successfully launch Deep Impact. none none none
5SSE6 Blue
Successfully demonstrate progress in determining the physical characteristics of comets and asteroids relevant to any threat they may pose to Earth. Progress towards achieving outcomes will be validated by external review.
4SSE11 Green
3S8 Green
2S8 Blue
Resources NASA’s FY 2005 budgeted cost of performance for Objective 3 was $1.15 billion. NASA cannot provide FY 2005 budgeted cost of performance information at the Outcome level for this Objective.

FY 2005 Performance and Accountability Report 66
Objective 4: Conduct advanced telescope searches for Earth-like planets and habitable environments around the stars.
Why pursue Objective 4? Far beyond Earth’s solar system, other planets have formed from the dusty debris surrounding distant stars. Thanks to NASA’s eyes in the sky, including the Spitzer and Hubble Space Telescopes, and NASA-supported ground-based telescopes, scientists have discovered more than 150 extrasolar planets, including Jupiter-sized gas giants, or so-called “Super Jupiters,” that dwarf any planet in Earth’s solar system. The greater challenge for extrasolar planet hunters is to find small planets, particularly ones containing the necessary ingredients for life.
Scientists believe that life is unlikely on gas giants that have crushing gravity levels, toxic atmospheres, and no solid surfaces. To find life, scientists must find Earth-like planets. During FY 2005, NASA made great strides toward finding such extrasolar planets by perfecting current search techniques, like identifying organic molecules within planet-forming disks, and planning the next-generation of highly sensitive telescopes.
Humans have sought answers to fundamental questions for all of time. Are we alone? Is life abundant elsewhere in the universe? Can humankind safely venture beyond the solar system? Are there other planets in the vast universe that humans one day could turn into a second home? With the help of scientists worldwide, NASA is seeking answers to these questions.
Image caption: In this artist’s impression, a hypothetical terrestrial planet and moon orbit the red dwarf star AU Microscopii. Although scientists have not spotted planets around the star, they have seen (via the Spitzer Space Telescope) a dusty disk capable of forming planets. The disk also is warped, possibly by the pull of one or more planets. The search for extrasolar planets is the search for subtle clues like this. Current telescopes are not powerful enough to see directly an extrasolar planet of any size. (Image: NASA/ESA/G. Bacon, STScI)
NASA’S PROGRESS AND ACHIEVEMENTS IN FY 2005
Outcome Ratings Under Objective 4, NASA is on track to achieve 7 of 8 Outcomes: seven Green (87%) and one Yellow (13%).
APG Ratings Under Objective 4, NASA achieved or exceeded 10 of 12 APGs: two Blue (17%), eight Green (67%), one Yellow (8%), and one Red (8%).
Outcome 4.1: Learn how the cosmic web of matter organized into the first stars and galaxies and how these evolved into the stars and galaxies we see today. The FY 2005 rating is Green. The FY 2004 (Outcome 5.8.1) rating was Blue.
Hubble sees the most distant galaxies to date Astronomers using the Hubble Space Telescope measured accurate distances for several faint, red galaxies seen in the Hubble Ultra Deep Field, confirming that three fourths of the objects in the

FY 2005 Performance and Accountability Report 67
observation are among the most distant galaxies yet studied. This is a milestone because the Hubble data provide spectra of objects 10 times fainter than have been studied with spectrometers on ground-based telescopes. The Hubble Ultra Deep Field allows researchers to probe the common galaxies in the early universe that scientists believe to be responsible for most of the energy output at that time and, perhaps, also for ionizing and heating the tenuous gas in between galaxies. Surprisingly, the distant galaxies are similar in many ways to their considerably closer descendants.
Hubble, Spitzer, and Keck work together to unveil some of the first stars to form in distant galaxies U.K. and U.S. astronomers used the Spitzer Space Telescope and the Hubble Space Telescope to detect light coming from some of the first stars to form in some of the most distant galaxies. New evidence suggests that the formation of these distant, first galaxies may have begun earlier than previously thought. The 10-meter Keck telescope in Hawaii provided confirmation of these galaxies’ extreme distance, approximately 13 billion light years from Earth. The Hubble images revealed the new-born stars, but the new infrared images taken with the Spitzer Space Telescope revealed that some of these galaxies were already 300 million years old when the universe was very young.
Chandra spots massive gas clouds A Chandra X-ray Observatory image revealed a complex of several intergalactic hot gas clouds in the process of merging. Chandra’s superb spatial resolution distinguished individual galaxies from the massive clouds of hot gas. One of the clouds that envelops hundreds of galaxies has an extraordinarily low concentration of iron atoms, indicating that it is in the very early stages of cluster evolution. This may be hot intergalactic gas in a relatively pristine state before it has been polluted by gas from galaxies. This discovery should provide valuable insight into how the most massive structures in the universe are assembled.
Image caption: This Chandra X-ray Observatory image of the galaxy cluster Abell 2125 reveals a complex of several massive gas clouds in the process of merging. Chandra, the Hubble Space Telescope, and the Very Large Array ground-based radio telescope data show that several galaxies in the Abell 2125 core cluster (the bright object in upper left) are being stripped of their gas as they fall through surrounding high-pressure hot gas. This stripping process enriched the core cluster’s gas in heavy elements such as iron. In contrast, the bright, large, and likely younger cloud on the lower right envelops hundreds of galaxies and has an extraordinarily low concentration of iron atoms. (Image: NASA/CXC/UMass/Q.D. Wang et al)
FY 2005 Annual Performance Goals FY 2004 FY 2003 FY 2002
5ASO4 Yellow
Demonstrate James Webb Space Telescope (JWST) primary mirror technology readiness by testing a prototype in a flight-like environment.
none none none
5ASO5 Green
Successfully demonstrate progress in learning how the cosmic web of matter organized into the first stars and galaxies and how these evolved into the stars and galaxies we see today. Progress towards achieving outcomes will be validated by external review.
4ASO9 Blue
3S3 Green
2S3 Green
Performance Shortfalls APG 5ASO4 is rated Yellow because NASA only partially completed testing of the James Webb Space Telescope (JWST) primary mirror technology in a flight-like environment. NASA tested the demonstrator mirror for the advanced mirror system to operating temperature, but not to flight-like mechanical loads. NASA will test the prototype and flight spare engineering development units

FY 2005 Performance and Accountability Report 68
mirror segment to all flight conditions by summer 2006, bringing it to Technology Readiness Level 6.
Outcome 4.2: Understand how different galactic ecosystems of stars and gas formed and which ones might support the existence of planets and life. The FY 2005 rating is Green. The FY 2004 (Outcome 5.8.2) rating was Green.
Spitzer sees embryonic stars NASA’s Spitzer Space Telescope uncovered a hatchery for massive stars. A new image from the infrared telescope shows a vibrant cloud called the Trifid Nebula dotted with glowing stellar “incubators.” Tucked deep inside these incubators are rapidly growing, warm embryonic stars detected for the first time by Spitzer’s powerful heat-seeking instruments. The new view offers a rare glimpse at the earliest stages of massive star formation.
Chandra catches a glimpse of super X-ray flares New results from NASA’s Chandra X-ray Observatory imply that X-ray super-flares torched the young solar system. Such flares likely affected the planet-forming disk around the early Sun and may have enhanced Earth’s chances of survival. By focusing Chandra on the Orion Nebula almost continuously for 13 days, a team of scientists obtained the deepest X-ray observation ever taken of any star cluster. These data provided an unparalleled view of 1,400 young stars, 30 of which are prototypes of the early Sun. The team discovered that these young stars erupt in enormous flares that dwarf in energy, size, and frequency anything seen from the Sun today. The difference between young, energetic stars and older, docile ones like the Sun may affect the fate of small, rocky planets like Earth. According to recent theoretical work, X-ray flares can create turbulence when they strike planet-forming disks, preventing rocky planets from rapidly migrating towards the young star and plummeting into it.
Image caption: This image composite compares visible-light and infrared views from NASA’s Spitzer Space Telescope of the glowing Trifid Nebula, a giant star-forming cloud of gas and dust located 5,400 light-years away in the constellation Sagittarius. Visible-light images taken with the Hubble Space Telescope (left, inset) and the National Optical Astronomy Observatory (left, larger image) show a murky cloud lined with dark trails of dust. Data of this same region from the Institute for Radioastronomy millimeter telescope in Spain revealed four dense knots, or cores, of dust (outlined by yellow circles) that are “incubators” for embryonic stars. Astronomers thought these cores were not yet ripe for stars until Spitzer spotted the warmth of rapidly growing massive embryos tucked inside. (Images: NASA/JPL–Caltech/J. Rho, SSC/Caltech)
FY 2005 Annual Performance Goals FY 2004 FY 2003 FY 2002
5ASO6 Green
Successfully demonstrate progress in understanding how different galactic ecosystems of stars and gas formed and which ones might support the existence of planets and life. Progress towards achieving outcomes will be validated by external review.
4ASO10 Green
none none
Outcome 4.3: Learn how gas and dust become stars and planets. The FY 2005 rating is Green. The FY 2004 (Outcome 5.8.3) rating was Green.

FY 2005 Performance and Accountability Report 69
NASA’s Spitzer Space Telescope spotted a dusty disk of planet-building material around an extremely low-mass failed star known as a brown dwarf. The brown dwarf is only 15 times the mass of Jupiter. Previously, the smallest brown dwarf known to host a planet-forming disk was 25 to 30 times more massive than Jupiter. The finding will help astronomers better understand how and where planets form.
Astronomers also determined the inner accretion disk sizes and temperatures for four solar-type stars using observations from the Keck Interferometer in Hawaii. These inner disk measurements help researchers determine the location of possible, Earth-like planet formation, as well as potential mechanisms for halting giant planet migration within a planetary system.
Image caption: This graph of data from NASA’s Spitzer Space Telescope shows that an extraordinarily low-mass brown dwarf is circled by a disk of planet-building dust. The brown dwarf is only 15 times the mass of Jupiter, making it the smallest known brown dwarf to host a planet-forming disk. Whereas a brown dwarf without a disk (red dashed line) radiates infrared light at shorter wavelengths, a brown dwarf with a disk (orange line) gives off excess infrared light at longer wavelengths. This surplus light comes from the disk itself and is represented here as a yellow dotted line. Actual data points from observations of the brown dwarf are indicated with orange dots. (Image: NASA/JPL–Caltech/Harvard–Smithsonian CfA)
FY 2005 Annual Performance Goals FY 2004 FY 2003 FY 2002
5ASO7 Green
Successfully demonstrate progress in learning how gas and dust become stars and planets. Progress towards achieving outcomes will be validated by external review.
4ASO10 Green
3S3 Green
2S3 Green
Spotlight: NASA Scientist Finds World with Triple Sunsets In FY 2005, a NASA-funded astronomer discovered a world where the sun sets over the horizon, followed by a second sun and then a third. The new planet, called HD 188753 Ab, is the first known to reside in a classic triple-star system.
“Before now, we had no clues about whether planets could form in such gravitationally complex systems,” said Maciej Konacki of the California Institute of Technology, who found the planet using the Keck I telescope atop Mauna Kea in Hawaii. The findings suggest that planets are more robust than previously believed and that they could form in unusual, multi-star systems.
The tight living quarters of the circus-like trio of stars throw theories of hot Jupiter formation into question. Astronomers had thought that hot Jupiters form far away from their parent stars before migrating inward. The discovery of a world under three closely placed suns, where there is no room in the outskirts for a planet to form, contradicts this scenario. HD 188753 would have sported a truncated disk in its youth, due to the disruptive presence of its stellar companions. That leaves no room for HD 188753’s planet to form—and raises a host of new questions.
Image caption: This artist’s concept shows the view from a hypothetical moon in orbit around the first known planet to reside in a tight-knit triple-star system. The gas giant planet zips around a single star that is orbited by a nearby pair of pirouetting stars. (Image: NASA/JPL–Caltech)
Outcome 4.4: Observe planetary systems around other stars and compare their architectures and evolution with our own. The FY 2005 rating is Green. The FY 2004 (Outcome 5.8.4) rating was Blue.

FY 2005 Performance and Accountability Report 70
Planets evolve from massive collisions between rocky bodies as big as mountain ranges. New observations from NASA’s Spitzer Space Telescope reveal surprisingly large dust clouds around several stars that likely flared up when rocky, embryonic planets smashed together. (Earth’s Moon may have formed from such a collision.) Prior to these observations, astronomers thought planets were formed under less chaotic circumstances.
Hubble looks for a hidden planet An image taken by NASA’s Hubble Space Telescope is the most detailed visible-light image ever taken of a narrow, dusty ring around the nearby star Fomalhaut. The image offers the strongest evidence yet that an unruly and unseen planet may be tugging gravitationally on the ring. Although part of the ring is outside the telescope’s view, Hubble shows that the center of the ring is 1.4 billion miles away from the star. Clearly, the geometrically striking ring, tilted obliquely toward Earth, is not being influenced by Fomalhaut’s gravity alone.
Image caption: This image taken by the Hubble Space Telescope is the first visible-light image of a dust ring around the nearby young, bright star Fomalhaut (blocked from the center of the image). Astronomers believe that an unseen planet moving in an elliptical orbit is reshaping the ring. Only Hubble has the optical resolution to “see” that the ring’s inner edge is sharper than its outer edge, a telltale sign that an object is gravitationally sweeping out material like a plow clearing away snow. (Image: M. Clampin, NASA/ESA/P. Kalas and J. Graham, Univ. California, Berkeley)
FY 2005 Annual Performance Goals FY 2004 FY 2003 FY 2002
5ASO3 Green
Demonstrate system-level instrument pointing precision consistent with SIM’s flight system basic performance requirements, as specified in program plan.
none none none
5ASO8 Green
Successfully demonstrate progress in observing planetary systems around other stars and comparing their architectures and evolution with our own. Progress towards achieving outcomes will be validated by external review.
4ASO12 Blue
3S4 Blue
2S4 Green
Outcome 4.5: Characterize the giant planets orbiting other stars. The FY 2005 rating is Green. The FY 2004 (Outcome 5.8.4) rating was Blue.
Spitzer confirms the presence of extrasolar planets NASA’s Spitzer Space Telescope captured for the first time the light from two known planets orbiting stars other than the Sun. The findings marked the beginning of a new age of planetary science in which the surface temperature of extrasolar planets can be measured and compared. Previously, all confirmed extrasolar planets were discovered indirectly by observing their “gravitational tug” on their parent star. In the new studies, Spitzer directly observed the warm infrared glows of two previously detected “hot Jupiter” planets, extrasolar gas giants that zip closely around their parent stars soaking up ample starlight to shine brightly in infrared wavelengths.
Hubble tracks down a planetary companion The Hubble Space Telescope’s near-infrared vision spotted a possible planetary companion to a relatively bright young brown dwarf located 225 light-years away in the southern constellation Hydra. Astronomers at the European Southern Observatory’s Very Large Telescope in Chile used infrared observations to detect the planet candidate, which is dimmer and cooler than a brown dwarf (a failed star), in April 2004. No planet beyond the solar system had ever been imaged

FY 2005 Performance and Accountability Report 71
directly at this point, so astronomers used Hubble’s unique capabilities to validate this remarkable observation.
Spotting a strange, new world A strange new-found planet as massive as Saturn appears to have the largest solid core known. The planet orbits a Sun-like star, taking just 2.87 days to complete its orbit. That makes it hot—about 2,000 degrees Fahrenheit on the star-facing side. Modeling shows it has a solid core approximately 70 times Earth’s mass.
Image caption: The Hubble Space Telescope captured this false-color, near-infrared-light view of a brown-dwarf star (located within the circle at center) and a giant companion (magenta spot), which may be a planet. Scientists estimate that the possible companion planet is five times the mass of Jupiter. Scientists will conduct more observations to see if the two objects are gravitationally bound. (Image: NASA/ESA/G. Schneider, Univ. Arizona)
FY 2005 Annual Performance Goals FY 2004 FY 2003 FY 2002
5ASO8 Blue
Successfully demonstrate progress in characterizing the giant planets orbiting other stars. Progress towards achieving outcomes will be validated by external review.
4ASO13 Green
3S4 Blue
2S4 Green
Outcome 4.6: Find out how common Earth-like planets are and see if any might be habitable. The FY 2005 rating is Green. The FY 2004 (Outcome 5.9.2) rating was Green.
Scientists reported the discovery of two new Uranus/Neptune-sized planets in another planetary system. More than a third of the planets discovered so far beyond the solar system are Jupiter-size giants that orbit their star closer than the planet Mercury orbits the Sun, making them hot. They can hold on to an extensive atmosphere in spite of the heat only because of their large size and strong surface gravity. These two new planets are much smaller, however, with masses only about one-tenth that of Jupiter. Although scientists know that these planets are hot, they do not know whether the planets have sufficient gravity to hold a massive atmosphere or to permit large amounts of ice in their interiors, as is the case for Neptune and Uranus.
Astronomers spot the smallest extrasolar planet to date Taking a major step forward in the search for Earth-like extrasolar planets, a team of astronomers announced the discovery of the smallest extrasolar planet yet detected. About seven-and-a-half times as massive as Earth, with about twice the radius, it may be the first rocky planet ever found orbiting a normal star similar to the Sun. Previously, all the extrasolar planets astronomers detected were larger than Uranus. The newly discovered extrasolar planet orbits its star in two days and is so close to the star’s surface that its dayside temperature probably tops 400 to 750 degrees Fahrenheit—oven-like temperatures far too hot to support life. The team estimated that the minimum mass is 5.9 Earth masses. NASA, the University of California, and the Carnegie Institute of Washington supported the team’s work, conducted at the Keck Observatory in Hawaii.
Image caption: An artist’s concept shows two possible versions of the planet found circling star Gliese 876. With a mass halfway between Earth and Uranus, the planet could be rocky (left) or composed of gas and ice (right). (Image: NSF)

FY 2005 Performance and Accountability Report 72
FY 2005 Annual Performance Goals FY 2004 FY 2003 FY 2002
5ASO2 Green
Successfully complete the Kepler mission Preliminary Design Review (PDR).
none none none
5ASO10 Blue
Successfully demonstrate progress in finding out how common Earth-like planets are and seeing if any might be habitable. Progress towards achieving outcomes will be validated by external review.
4ASO14 Green
none none
Outcome 4.7: Trace the chemical pathways by which simple molecules and dust evolve into the organic molecules important to life. The FY 2005 rating is Yellow. The FY 2004 (Outcome 5.9.3) rating was Green.
Understanding the building blocks for life in the universe Polycyclic aromatic hydrocarbons (PAHs) are a class of stable organic molecules made up of carbon and hydrogen. Experts believe that they are distributed widely throughout space in many forms. NASA researchers are interested in PAHs because these molecules could point to possible life-supporting locations in the galaxy, so scientists are using spectral analysis to understand the different types of PAHs and how they are distributed. Researchers believe that greater understanding of PAHs will reveal how likely it is that other places within the galaxy could support life.
FY 2005 Annual Performance Goals FY 2004 FY 2003 FY 2002
5ASO1 Red
Deliver the SOFIA Airborne Observatory to Ames Research Center for final testing.
none none none
5ASO11 Green
Successfully demonstrate progress in tracing the chemical pathways by which simple molecules and dust evolve into the organic molecules important for life. Progress towards achieving outcomes will be validated by external review.
4ASO15 Green
3S6 Green
2S6 Green
Performance Shortfalls Outcome 4.7 and APG 5ASO1 are rated Yellow and Red respectively because NASA has not delivered the Stratospheric Observatory for Infrared Astronomy (SOFIA) Airborne Observatory to Ames Research Center for final testing. The SOFIA mission delays over the last several years resulted from a variety of causes acknowledged and explained in prior years’ performance reports. Delivery to Ames for final testing will occur in FY 2007.
Objective 4.8: Develop the tools and techniques to search for life on planets beyond our solar system. The FY 2005 rating is Green. The FY 2004 (Outcome 5.9.4) rating was Blue.
NASA Astrobiology Institute scientists led one of two teams that announced the first measurements of light from planets around other stars. The Spitzer Space Telescope detected infrared emissions from these two planets, a new technique to detect and study extrasolar planets. Previously, extrasolar planets were detected by their gravitational pull on their parent stars and by the dimming of the stars as the planets crossed in front of them.

FY 2005 Performance and Accountability Report 73
Getting a closer look at Earth-sized extrasolar planets The principal goal of NASA’s Terrestrial Planet Finder and the European Space Agency’s Darwin mission concepts is to detect and characterize extrasolar terrestrial planets. NASA expects that these missions will provide measurements that will allow researchers to inspect a planet’s surface and, possibly, its atmosphere. Scientists used Mars to test one model.
Image caption: This graph of data from NASA’s Spitzer Space telescope shows changes in the infrared light output of two star–planet systems (one above, one below) located hundreds of light-years away. The data were taken while the planets disappeared behind their stars in what is called a “secondary eclipse.” The dip seen in the center of each graph represents the time when the planets were eclipsed, and tells astronomers exactly how much light they emit. (Images: Top: NASA/JPL–Caltech/D. Charbonneau, Harvard–Smithsonian CfA; Bottom: NASA/JPL–Caltech/D. Deming, GSFC)
FY 2005 Annual Performance Goals FY 2004 FY 2003 FY 2002
3S4 Blue
2S4 Green
5ASO12 Green
Successfully demonstrate progress in developing the tools and techniques to search for life on planets beyond our solar system. Progress towards achieving outcomes will be validated by external review.
4ASO16 Blue
3S6 Green
2S6 Green
Resources NASA’s FY 2005 budgeted cost of performance for Objective 4 was $1.10 billion. NASA cannot provide FY 2005 budgeted cost of performance information at the Outcome level for this Objective.

FY 2005 Performance and Accountability Report 74
Objective 5: Explore the universe to understand its origin, structure, evolution, and destiny.
Why pursue Objective 5? Since the Big Bang gave birth to the universe 12 to 14 billion years ago, the universe has been expanding and evolving slowly. Much of what goes on in space is invisible to the naked eye. Gravity and energy interact with surrounding matter, shaping the universe and influencing the destiny of stars, planets, solar systems, and galaxies. And, while the universe’s slow-motion evolution does not affect the daily lives of those on Earth, it is part of humankind’s story. As the late astronomer Carl Sagan said, “We are starstuff,” suggesting that the matter that makes up the stars and planets is the same matter that gave rise to life on Earth. Therefore, humans are naturally curious about the forces and processes that made this happen.
NASA’s research into the origin, structure, evolution, and destiny of the universe focuses on these powerful forces. From black holes (contorted knots with no volume, but infinite density that affect time itself) to dark matter (matter of an unknown type that does not emit light, but does exert gravitational pull on surrounding, visible objects), NASA-supported research is filling in the universe’s “gaps” and showing a web of invisible matter and energy that helped build Earth’s cosmic neighborhood.
Image caption: Researchers used the Chandra X-ray Observatory and the European Space Agency’s XMM–Newton X-ray Observatory to image this “fossil galaxy,” an ancient galaxy group in which large galaxies have merged to form one central giant galaxy. The researchers discovered a remarkable concentration of dark and normal matter in the core of such fossil galaxies as compared to the mass distribution within normal galaxy clusters. Dark matter, which makes up about 80 percent of the universe, has never been detected directly, but its presence is inferred through its gravitational influence on ordinary matter. This image was released on April 7, 2005. (Image: H. Khosroshahi)
NASA’S PROGRESS AND ACHIEVEMENTS IN FY 2005
Outcome Ratings Under Objective 5, NASA is on-track to achieve all 9 Outcomes (100% Green).
APG Ratings Under Objective 5, NASA achieved or exceeded 8 of 10 APGs: three Blue (30%), five Green (50%), and two Yellow (20%).
Outcome 5.1: Search for gravitational waves from the earliest moments of the Big Bang. The FY 2005 rating is Green. The FY 2004 (Outcome 5.10.1) rating was Green.
A team consisting of NASA, the Department of Energy, and the National Science Foundation completed a report on a technology development program that will lead to a space-based full-sky measurement of the polarization of the cosmic microwave background. This background contains the signature of primordial gravitational radiation produced during the inflationary epoch of the universe. Detection of this signature will reveal when the inflationary period of the universe began, and it should provide the best measure of early universe physics. Through the detection of this

FY 2005 Performance and Accountability Report 75
gravitational radiation, researchers will view the universe at the earliest moments of its existence, at an age of approximately 10 to 40 seconds.
FY 2005 Annual Performance Goals FY 2004 FY 2003 FY 2002
5SEU4 Green
Successfully demonstrate progress in search for gravitational waves from the earliest moments of the Big Bang. Progress towards achieving outcomes will be validated by external review.
4SEU9 Green
none none
Outcome 5.2: Determine the size, shape, and matter-energy content of the universe. The FY 2005 rating is Green. The FY 2004 (Outcome 5.10.1) rating was Green.
Scientists worldwide use data from the Wilkinson Microwave Anisotropy Probe (WMAP) for analysis of the cosmic microwave background and what it reveals about the origin, size, shape, and matter-energy content of the universe. The data obtained by WMAP was more revealing about the history of the universe than expected, enabling measurement of the universe’s beginning and events in its evolution. The primary WMAP results paper is now one of the most referenced papers in physics.
In FY 2005, hundreds of scientists worldwide used WMAP data in their independent, published papers on the cosmology of the universe. Theorists continue to use WMAP data to advance understanding of cosmology, as evidenced by the number of publications in FY 2005. Although they may be working with data obtained in earlier years, many of these theorists and data analysts are supported by funding from NASA’s data analysis programs, giving them the opportunity to analyze the data and ultimately publish new results, continuing progress toward determining the size, shape, and matter–energy content of the universe.
WMAP successfully completed its analysis of fluctuations in the cosmic microwave background, with results that inaugurated a new era of “precision cosmology.” The entire cosmology community has been waiting for WMAP’s analysis of the polarization pattern of the cosmic microwave background, however, this analysis is far more complex than anticipated, causing a delay in its release. The data being collected by WMAP in its extended mission ultimately will significantly enhance the quality of the cosmic microwave background fluctuation and polarization results and understanding the history of the universe.
Image caption: WMAP supplied the data used to compile this full-sky map of the oldest light in the universe. The microwave light captured in this picture is from 379,000 years after the Big Bang, over 13 billion years ago. Red indicates warmer spots and blue represents the colder spots. The temperatures vary only by millionths of a degree. (Image: NASA)
FY 2005 Annual Performance Goals FY 2004 FY 2003 FY 2002
5SEU5 Blue
Successfully demonstrate progress in determining the size, shape, and matter-energy content of the universe. Progress towards achieving outcomes will be validated by external review.
4SEU10 Green
3S1 Blue
2S1 Green
Outcome 5.3: Measure the cosmic evolution of dark energy. The FY 2005 rating is Green. The FY 2004 (Outcome 5.10.3) rating was Blue.
The NASA/Department of Energy Joint Dark Energy Mission Science Definition Team evaluated various methods for investigating dark energy during a space-based mission. This included the

FY 2005 Performance and Accountability Report 76
expanded search for “standard candle” supernovae (supernovae that have known luminosity due to some characteristic quality possessed by all the supernovae like it), weak lensing, X-ray clusters, and baryon oscillations. The team considered each method’s efficacy, complementarity, and likely systematic errors. The team also prepared a set of standard cosmological and dark energy parameter values that all future proposers must use in demonstrating the power of their mission implementation.
NASA also issued a call for proposals for mission concept studies. The Agency will offer one or two two-year awards for the development of competing collaborations for a future dark energy mission. This will help insure that alternative methods for investigating dark energy have a chance for selection if they can provide superior discrimination between competing models of dark energy.
The NASA/Department of Energy/National Science Foundation Dark Energy Task Force is preparing its advice for presentation in December 2005 to the participating agencies on a program structure optimizing the investigation of dark energy. The task force will tackle the question of how much ground-based observatories (and possibly balloon missions) can characterize dark energy and what the needs are for a space-based mission. The task force also will help quantify the science return for a given dark energy parameter-measurement error and will recommend minimum performance measures for both the ground-based Large Sky Telescope and Joint Dark Energy Mission.
FY 2005 Annual Performance Goals FY 2004 FY 2003 FY 2002
5SEU6 Green
Successfully demonstrate progress in measuring the cosmic evolution of the dark energy, which controls the destiny of the universe. Progress towards achieving outcomes will be validated by external review.
4SEU11 Blue
none none
Outcome 5.4: Determine how black holes are formed, where they are, and how they evolve. The FY 2005 rating is Green. The FY 2004 (Outcome 5.11.1) rating was Green.
A swarm of 10,000 or more black holes may be orbiting this galaxy’s central supermassive black hole, according to results from the Chandra X-ray Observatory. This would represent the highest concentration of black holes anywhere in the galaxy, confirming predictions of a dense stellar graveyard at the galactic center. The results will help scientists better understand how some supermassive black holes grow.
Chandra found that distant galaxies undergoing intense bursts of star formation are fertile growing fields for the largest black holes in the universe. Collisions between galaxies in the early universe may be the ultimate cause of both accelerated star formation and the growth of supermassive black holes. Combining this deepest X-ray image ever taken with ground-based observations, a consistent picture arises in which galaxy mergers drive large quantities of gas to the central region of the galaxies, dramatically enhancing star formation while simultaneously feeding the growth of their central black holes with gas and dust.
In a related survey, a deep Chandra X-ray survey found that supermassive black holes may have an upper mass limit of approximately 100 million solar masses. The long-exposure images found black holes that would otherwise have gone unnoticed, because many of the black holes with masses smaller than this are shrouded by large quantities of gas and dust. The picture that emerges is one in which black holes either can feed quickly on gas and stars until the mass limit of 100 million solar masses is reached, at which point the supply of “food” has been exhausted, or they can “graze” more slowly. The birthrate of stars also tracks the growth rate of supermassive black holes.

FY 2005 Performance and Accountability Report 77
Image caption: Chandra discovered four bright, variable X-ray sources (circles) within three light years of Sagittarius A* (the bright source just above Source C) at the center of the Milky Way galaxy. The lower panel illustrates the strong variability of Source A. This variability, which is present in all the sources, is indicative of an X-ray binary system where a black hole or neutron star is pulling matter from a nearby companion star. The observed high concentration of X-ray binaries is strong circumstantial evidence that a dense swarm of 10,000 or more stellar-mass black holes and neutron stars has formed around Sagittarius A*. (Image: NASA/CXC/UCLA/M.Muno et al.)
FY 2005 Annual Performance Goals FY 2004 FY 2003 FY 2002
5SEU7 Green
Successfully demonstrate progress in determining how black holes are formed, where they are, and how they evolved. Progress towards achieving outcomes will be validated by external review.
4SEU12 Green
none none
Outcome 5.5: Test Einstein’s theory of gravity and map space-time near event horizons of black holes. The FY 2005 rating is Green. The FY 2004 (Outcome 5.11.2) rating was Green.
Chandra sees white dwarfs dancing The Chandra X-ray Observatory found evidence that two white dwarf stars are orbiting each other in a death grip, destined to merge. Due to the close proximity of the white dwarf pair, and consequently their rapid orbits around each other, they are emitting a large amount of gravitational radiation. This added energy loss causes the spiral rate of the pair to increase. Chandra observed this increase and found it to be consistent with the rate predicted by Einstein’s General Theory of Relativity. This white dwarf pair may be the largest source of gravitational radiation in the Milky Way Galaxy, and it may be the first source detected by NASA’s Laser Interferometer Space Antenna when it launches in 2015.
NASA’s Rossi X-ray Timing Explorer catches black holes warping the fabric of space An observation of a stellar-mass black hole 4,000 light-years away by NASA’s Rossi X-ray Timing Explorer (also known as RXTE and now in its tenth year of operation) found streams of gas that appear to be surfing on a wave of space as the gas falls toward the black hole. This is compelling evidence for an exotic prediction of Einstein’s General Theory of Relativity: that a spinning black hole can drag the fabric of space around with it, creating a choppy sea of space that distorts all that passes through it on a descent into the black hole.
Gravity Probe-B successfully completes science operations The Gravity Probe B mission completed its science operations phase with the payload and spacecraft in good condition. It will take close to a year of additional data analysis for researchers to determine whether the “frame-dragging” effect, the twisting of space–time around a rotating, massive object like Earth, matches the numerical prediction of Einstein’s General Theory of Relativity.
Image caption: This artist’s concept depicts hot iron gas riding a ripple in space–time around a black hole. The observation, made with NASA’s RXTE spacecraft, confirms an important theory about how a black hole’s extreme gravity can stretch light. It also paints an intriguing image of how a spinning black hole can drag the fabric of space around with it, creating a choppy sea of space that distorts all that passes through it on a descent into the black hole. (Image: NASA)

FY 2005 Performance and Accountability Report 78
FY 2005 Annual Performance Goals FY 2004 FY 2003 FY 2002
5SEU8 Yellow
Successfully demonstrate progress in testing Einstein’s theory of gravity and mapping space–time near event horizons of black holes. Progress towards achieving outcomes will be validated by external review.
4SEU13 Green
3S2 Green
2S2 Green
Performance Shortfalls APG 5SEU8: The Japanese mission Astro-E2/Suzaku was launched successfully on July 10, 2005. The prime instrument, a new-generation X-ray spectrometer, the XRS-2 provided by NASA, initially worked well. However, it ceased functioning on August 6, 2005, when it prematurely ran out of helium for reasons not yet fully understood. The high spectral resolution of XRS-2 would have enabled it to study elemental abundances and bulk motion in both point and extended sources, but the spectrometer’s failure significantly affected NASA’s progress in testing Einstein’s Theory of Gravity and mapping space–time near event horizons of black holes.
Outcome 5.6: Observe stars and other material plunging into black holes. The FY 2005 rating is Green. The FY 2004 (Outcome 5.11.3) rating was Green.
Chandra X-ray Observatory data on peculiar outbursts of X-rays coming from a black hole called M74 provided evidence for a new class of black holes. The black hole’s quasi-periodic outbursts, recorded at approximately two-hour intervals, helped scientists determine that this black hole has a mass of about 10,000 Suns, placing it in a new class of intermediate black holes.
Chandra discovered the most powerful eruption ever seen in the universe. It was produced by a supermassive black hole in the galaxy cluster MS 0735.6+7421, which grew at a remarkable rate, consuming about 300 million solar masses of material over a period of more than 100 million years. The result of this explosion is a huge cavity of more than a million light years in size, swept clean by the enormous energy release generated by the black hole’s feeding. It substantiates the significant effect inferred by scientists of black holes on the evolution of the universe.
NASA scientists also used X-ray measurements from the European Space Agency’s XMM–Newton X-ray Observatory to observe a supermassive black hole in a galaxy, Markarian 766, more than 170 million light years away. The researchers clocked three separate clumps of hot iron gas whipping around the black hole at 20,000 miles per second, more than 10 percent of light speed. This marks the first time scientists could trace individual blobs of shredded matter on a complete journey around such a black hole.
Image caption: This composite X-ray (red) and optical (blue and white) image of spiral galaxy M74 highlights an ultraluminous X-ray source (ULX) shown in the box. ULX sources are distinctive because they radiate 10 to 1000 times more X-ray power than neutron stars and stellar-mass black holes. Chandra observations made in 2001 of this ULX provided evidence, released in a study in 2005, that its X-radiation is produced by a disk of hot gas swirling around an intermediate-size black hole, a new class of black hole. (Image: X-ray: NASA/CXC/U. of Michigan/J. Liu et al.; Optical: NOAO/AURA/NSF/T. Boroson)
FY 2005 Annual Performance Goals FY 2004 FY 2003 FY 2002
5SEU9 Blue
Successfully demonstrate progress in observing stars and other material plunging into black holes. Progress towards achieving outcomes will be validated by external review.
4SEU14 Green
none none

FY 2005 Performance and Accountability Report 79
Spotlight: Hubble Celebrates 15th Anniversary with Spectacular New Images NASA’s Hubble Space Telescope has orbited Earth for 15 years and has taken three-quarters of a million photos of the cosmos—images that have awed, astounded, and even confounded astronomers and the public alike.
On April 25, 2005, NASA celebrated Hubble’s 15th anniversary by releasing new views of two of the most well-known objects Hubble has ever observed: the Eagle Nebula and spiral galaxy M51, known as the Whirlpool Galaxy. The two images, the sharpest Hubble has ever taken, could be enlarged to billboard size and still retain all of their stunning details.
The Space Shuttle Discovery placed Hubble into Earth orbit on April 25, 1990, opening a brand new era in astronomy. The telescope’s false-colored images, in which different gases are colored to bring out shapes and details, also have changed the way the public views space. Once depicted as a black and white place of vast, empty distances, space is now—thanks to Hubble—a place of color, texture, and curious, delicate-looking objects of gas, dust, and energy. Hubble has helped confirm the existence of a strange, elusive dark energy, discovered the existence of supermassive black holes, and has imaged beautiful celestial objects such as galaxies, dying stars, and the birth of stars in giant gas clouds.
Image caption: In 1995, the Hubble Space Telescope captured its most famous and, arguably, its most beautiful image (left). The image showed the world newborn stars emerging from finger-like columns of cold gas and dust in the Eagle Nebula (also called M16). Inside the gaseous columns, the interstellar gas is dense enough to collapse under its own weight, forming bright, young stars. For Hubble’s 15th anniversary, scientists revisited the Eagle Nebula to capture this billowing tower. Looking like a winged fairy-tale creature, the tower is approximately 57 trillion miles high, about twice the distance from the Sun to the next closest star. (Images: 1995—NASA/ESA/STScI/J. Hester and P. Scowen, U. Arizona; 2005—NASA/ESA/The Hubble Heritage Team)
Outcome 5.7: Determine how, where, and when the chemical elements were made, and trace the flows of energy and magnetic fields that exchange them between stars, dust, and gas. The FY 2005 rating is Green. The FY 2004 (Outcome 5.12.1) rating was Green.
The Chandra X-ray Observatory made a spectacular new observation of the 340 year-old supernova remnant Cassiopeia A that shows the presence of two bipolar (oppositely directed) jets that extend to 10 light years from the remnant. The jets are rich in silicon, but not in iron, in contrast to the clouds of iron near the remnant produced in the central regions of the parent star. This suggests the jets were not the cause of the explosion.
Image caption: This spectacular image of the supernova remnant Cassiopeia A is the most detailed image ever made of the remains of an exploded star. The one-million-second image shows a bright outer ring (green) 10 light years in diameter that marks the location of a shock wave generated by the supernova explosion. A large jet-like structure that protrudes beyond the shock wave can be seen in the upper left and lower right. (Image: NASA/CXC/GSFC/U. Hwang et al.)

FY 2005 Performance and Accountability Report 80
FY 2005 Annual Performance Goals FY 2004 FY 2003 FY 2002
5SEU10 Green
Successfully demonstrate progress in determining how, where, and when the chemical elements were made, and tracing the flows of energy and magnetic fields that exchange them between stars, dust, and gas. Progress towards achieving outcomes will be validated by external review.
4SEU15 Green
none none
Outcome 5.8: Explore the behavior of matter in extreme astrophysical environments, including disks, cosmic jets, and the sources of gamma-ray bursts and cosmic rays. The FY 2005 rating is Green. The FY 2004 (Outcome 5.12.2) rating was Green.
Swift tracks down gamma-ray bursts NASA successfully launched the Swift satellite on November 22, 2004. Its goal is to enhance current understanding of gamma-ray bursts, explosions that signal the birth of black holes. Shortly after its launch, Swift detected its first gamma-ray burst, rotating quickly to image it within 200 seconds of its initial flare and providing the first image of a long-duration gamma-ray burst while it was still exploding.
In addition to the long-duration burst (greater than one second) detected shortly after its launch, Swift also detected and pinned down the location of a short gamma-ray burst (much less than a second) in May 2005. Scientists believe that long gamma-ray bursts are generated during the supernovae of very massive stars. Before Swift, short gamma-ray bursts were a mystery because the bursts were too fast to be measured directly. Swift’s measurement of the rapid decay of the gamma-ray burst X-ray afterglow supports the theory that the explosion is due to the merger or collision of two neutron stars or black holes.
Chandra sees a dense, young pulsar The Chandra X-ray Observatory’s long look at a young pulsar revealed unexpectedly rapid cooling that suggests it contains much denser matter than previously expected. The pulsar’s cool surface temperature, and the vast magnetic web of high-energy particles that surrounds it, have implications for the theory of nuclear matter and the origin of magnetic fields in cosmic objects.
Spitzer sees the light The Spitzer Space Telescope observed a light echo around Cassiopeia A, a quiet neutron star produced by a supernova over 300 years ago. The spherical shell of light (the echo) was produced when an expanding shock wave from the neutron star energized the medium surrounding it. The energetic event that created this halo occurred only 50 years ago, suggesting that this is a very rare type of neutron star, a magnetar, with magnetic field strengths thousands of times higher than common neutron stars. Huge energy releases occur when the neutron star’s magnetic field restructures itself to a lower energy configuration, causing a massive “neutron star quake.”
Image caption: These Spitzer Space Telescope images, taken one year apart, show the supernova remnant Cassiopeia A (yellow ball) and surrounding clouds of dust (reddish orange). The pictures illustrate that a blast of light from Cassiopeia A is spreading outward through the dusty skies, an “infrared echo” that began when the remnant erupted about 50 years ago. (Images: NASA/JPL–Caltech/O. Krause, Steward Observatory)

FY 2005 Performance and Accountability Report 81
FY 2005 Annual Performance Goals FY 2004 FY 2003 FY 2002
5SEU1 Yellow
Complete the integration and testing of the Gamma-ray Large Area Space Telescope (GLAST) spacecraft bus.
none none none
5SEU11 Blue
Successfully demonstrate progress in exploring the behavior of matter in extreme astrophysical environments, including disks, cosmic jets, and the sources of gamma-ray bursts and cosmic rays. Progress towards achieving outcomes will be validated by external review.
4SEU16 Green
3S2 Green
2S2 Green
Performance Shortfalls APG 5SEU1: The GLAST spacecraft bus integration and testing has not been completed. Delays were due to schedule problems with the primary instrument on the GLAST observatory, the Large Area Telescope (LAT). The LAT experienced both engineering design and electrical parts problems, which required a project schedule and cost re-baseline. In 2005, the spacecraft structure was completed and tested, the spacecraft harness was installed, and subsystems were being assembled and tested in progress toward completing integration and test of the bus.
Outcome 5.9: Discover how the interplay of baryons, dark matter, and gravity shapes galaxies and systems of galaxies. The FY 2005 rating is Green. The FY 2004 (Outcome 5.12.3) rating was Green.
Chandra finds missing atoms and searches for dark matter Scientists using the Chandra X-ray Observatory discovered two huge intergalactic clouds of diffuse hot gas, providing the best evidence to date that a vast cosmic web of hot gas contains the missing half of the atoms in the universe. Since all the atoms (and ions) in stars and gas inside and outside of galaxies account for only half of the known atoms present in the universe, Chandra’s observation helps confirm the presence of the other half in a universal, cosmic web.
A Chandra survey of the nearby Fornax galaxy cluster also showed that this galaxy is being pulled by an underlying super-structure of dark matter. Scientists believe that most of the matter in the universe is concentrated in long, large filaments of dark matter, with galaxy clusters forming at their intersections. The Fornax picture is one of the best matches to date with high-resolution simulations.
An observation by Chandra and the XMM–Newton X-ray Observatory of six “fossil galaxies” showed a concentration of dark matter and normal matter in the cores of these isolated systems. Fossil galaxies began as ancient galaxy groups that gradually merged to form one giant, central galaxy. The highly dense concentration of dark matter in these galaxies implies that they collapsed long before typical groups of galaxies formed.
XMM–Newton tracks the “perfect cosmic storm” Scientists using XMM–Newton observed a head-on collision of two galaxy clusters. The clusters smashed together thousands of galaxies and trillions of stars creating what NASA scientists leading the study called “the perfect cosmic storm.” It is one of the most powerful events ever witnessed because such collisions are second only to the Big Bang in total energy output. This unprecedented view of a merger in action crystallizes the theory the universe built its hierarchal structure from the ”bottom up“ through mergers of smaller galaxies and galaxy clusters into bigger ones.
Image caption: This illustration shows the absorption of X-rays from the quasar Mkn 421 by two intergalactic clouds of diffuse hot gas, and a portion of the X-ray spectrum of the quasar observed by the Chandra X-ray Observatory. The spectrum provides evidence that three separate clouds of

FY 2005 Performance and Accountability Report 82
hot gas are filtering out or absorbing X-rays from Mkn 421. Dips in the X-ray spectrum are produced when some of the X-rays are absorbed by ions of oxygen in the hot gas clouds, which are located at various distances from Earth. The clouds are likely part of a predicted diffuse, web-like system of gas clouds—the cosmic web—from which galaxies and clusters of galaxies are thought to have formed. (Image: NASA/SAO/ CXC/F.Nicastro et al.; Illustration: NASA/CXC/M.Weiss)
FY 2005 Annual Performance Goals FY 2004 FY 2003 FY 2002
5SEU12 Green
Successfully demonstrate progress in discovering how the interplay of baryons, dark matter, and gravity shapes galaxies and systems of galaxies. Progress towards achieving outcomes will be validated by external review.
4SEU17 Green
3S1 Blue
2S1 Green
Resources NASA’s FY 2005 budgeted cost of performance for Objective 5 was $0.38 billion. NASA cannot provide FY 2005 budgeted cost of performance information at the Outcome level for this Objective.

FY 2005 Performance and Accountability Report 83
Objective 6: Return the Space Shuttle to flight and focus its use on completion of the International Space Station, complete assembly of the ISS, and retire the Space Shuttle in 2010, following completion of its role in ISS assembly. Conduct ISS activities consistent with U.S. obligations to ISS partners.
Why pursue Objective 6? Two and a half years after the loss of Space Shuttle Columbia on February 1, 2003, the Space Shuttle fleet returned to flight with the launch of Space Shuttle Discovery on mission STS-114 on July 26, 2005. This safe return to flight was NASA’s most significant accomplishment in FY 2005 because it represents the first major step in executing the Vision for Space Exploration.
The Shuttle is the largest human-rated space vehicle in the world, capable of delivering over 50,000 pounds of crew and cargo to low Earth orbit. This capacity makes it critical to completing the International Space Station. While the Shuttle was grounded, our Russian partners helped us maintain a continuous presence on the Space Station by launching all crew and cargo on the Russian Soyuz and Progress vehicles. Because the Russian vehicles are smaller, however, NASA had to reduce the Station crew size and halt assembly. Still, the Station crews continuously performed research that will be critical to future human space exploration beyond Earth orbit.
Once the Shuttle returns to regular service, NASA will increase the number of crewmembers and deliver new facilities and components to enable completion of the Space Station and to meet its commitments to the Station’s international partners.
Photo caption: NASA’s crawler takes Discovery (STS-114) to the pad on June 15, 2005, as the morning sun paints the Florida sky bright orange. (Photo: NASA)
NASA’S PROGRESS AND ACHIEVEMENTS IN FY 2005
Outcome Ratings Under Objective 6, NASA is on track to achieve both Outcomes (100% Green).
APG Ratings Under Objective 6, NASA achieved or exceeded 6 of 7 APGs: one Blue (14%), five Green (72%), and one Red (14%).
Outcome 6.1: Assure public, flight crew, and workforce safety for all Space Shuttle operations, and safely meet the manifest and flight rate commitment through completion of Space Station assembly. The FY 2005 rating is Green. The FY 2004 (Outcome 8.3.1) rating was Green.
The Shuttle returns to flight The Space Shuttle fleet returned to flight with the launch of Shuttle Discovery (STS-114) on July 26, 2005. NASA completed return to flight-related modifications and engineering analyses as called

FY 2005 Performance and Accountability Report 84
for by the Columbia Accident Investigation Board (CAIB) and NASA’s self-initiated “raise the bar” requirements. The independent Return to Flight Task Group finished its final assessment of NASA’s implementation of the 15 CAIB recommendations and NASA’s Space Shuttle Program Action 3, “Shuttle Contingency Crew Support.” The Task Group deferred on fully closing out three CAIB recommendations regarding external tank thermal protection system modifications, orbiter hardening, and thermal protection system on-orbit inspection and repair, noting that these recommendations represented substantial technical challenges (more so, perhaps, than even CAIB had anticipated). The Task Group noted, too, that NASA had made significant progress in addressing these challenges and confirmed that its assessment was not a statement on the overall readiness of STS-114 for launch.
STS-114 validated nearly all return to flight-related improvements scheduled for demonstration during the mission. In particular, a new suite of cameras and sensors provided far more data on the condition of Discovery than has ever been available before on a spaceflight mission. The new imaging system and procedures spotted two gap fillers that had slipped partially out from between the silicon tiles underneath the orbiter. These gap fillers might have disrupted the aerodynamic flow during reentry, so Shuttle astronauts successfully removed the gap fillers during the mission’s third spacewalk. This was the first time such a procedure had been done on-orbit. The Shuttle astronauts also successfully completed other test objectives, including validating on-orbit tile and reinforced carbon–carbon repair techniques. STS-114 delivered approximately 15,000 pounds of logistics and hardware to the International Space Station, augmenting the Station’s supplies and restoring a number of Station systems to full operational capability.
The Shuttle program is preparing for the second return to flight mission, STS-121, and resumption of International Space Station assembly flights in FY 2006.
Photo caption: Discovery shows its belly in this photo taken by Station crew as the Shuttle backflips on July 28, 2005. The maneuver was added to Shuttle procedure so the Station crew could scan the heat shield for any damage caused during launch. The image was overexposed to bring out details of the individual black heat shield tiles, helping Station and ground crew search for anomalies. (Photo: NASA)
FY 2005 Annual Performance Goals FY 2004 FY 2003 FY 2002
5SSP1 Green
Achieve zero Type-A (damage to property at least $1M or death) or Type-B (damage to property at least $250K or permanent disability or hospitalization of three or more persons) mishaps in FY 2005.
4SSP2 Yellow
3H06 Red
2H7 Green
5SSP2 Red
Achieve an average of eight or fewer flight anomalies per Space Shuttle mission in FY 2005.
none none none
5SSP3 Green
Achieve 100 percent on-orbit mission success for all Shuttle missions launched in FY 2005. For this metric, mission success criteria are those provided to the prime contractor (SFOC) for purposes of determining successful accomplishment of the performance incentive fees in the contract.
4SSP3 White
3H08 Green
2H09 Green
Performance Shortfalls APG 5SSP2: There was one Space Shuttle mission in FY 2005—STS-114. For this mission, there were approximately 185 in-flight anomalies reported. This number is approximate since post-STS-114 hardware inspections and analyses continue; these results could generate additional in-flight anomalies as the process unfolds.

FY 2005 Performance and Accountability Report 85
Outcome 6.2: Provide safe, well-managed, and 95 percent reliable space communications, rocket propulsion testing, and launch services to meet Agency requirements. The FY 2005 rating is Green. The FY 2004 (Outcome 8.3.1) rating was Green.
In FY 2005, NASA’s Space Communications Architecture Working Group continued developing an integrated space communications and navigation architecture that will support the Agency’s exploration and science missions through 2030. The Working Group developed techniques for identifying, evaluating, and selecting architectures to recommend to management and studied lunar and near-Earth communications architectures that are scaleable, evolvable, and capable of meeting the projected changing needs of future missions. In developing the architectures, the Working Group defined criteria against which all architecture alternatives are scored. They also identified cost estimation tools to provide risk-based cost estimations for the architectures.
NASA successfully manages expendable launch vehicle launches In FY 2005, NASA’s Launch Services Program maintained a high level of mission success: 98.7 percent (75 out of 76) for NASA missions using commercial launch services. All five NASA-managed launches of primary payloads on expendable launch vehicles deployed to their required orbits.
The Mars Reconnaissance Orbiter launch was the first U.S. government launch using the new Atlas V-401 vehicle. The launch successfully completed the certification process for the Atlas V.
Cape Canaveral Launches Vandenberg Air Force Base Launches
• Swift on a Delta II, November 20, 2004 • DART on a Pegasus, April 15, 2005
• Mars Reconnaissance Orbiter on an Atlas V-401, August 15, 2005
• NOAA-N on a Delta II, May 20, 2005
• Deep Impact on a Delta II, January 12, 2005
Selecting launch vehicles for the Vision for Space Exploration NASA performed numerous studies in FY 2005 to identify requirements for crew and cargo launch vehicles needed to achieve the Vision for Space Exploration. The studies examined more than 63 launch vehicle options and assessed each architecture for characteristics like crew safety, mission success, cost, performance, schedule, and extensibility. These preliminary studies were the foundation for the Exploration Systems Architecture Study effort.
Photo caption: An Atlas V-401 launch vehicle, with the two-ton Mars Reconnaissance Orbiter on top, roars away from the pad at Cape Canaveral Air Force Station, Florida, on August 12, 2005. This was the first U.S. government launch using the new Atlas V, which was developed for the U.S. Air Force’s Evolved Expendable Launch Vehicle program. NASA conducted extensive research, including an in-depth risk analysis, before selecting the vehicle for the mission. (Photo: NASA)

FY 2005 Performance and Accountability Report 86
FY 2005 Annual Performance Goals FY 2004 FY 2003 FY 2002
5SFS8 Green
Establish the Agency-wide baseline space communications architecture, including a framework for possible deep-space and near-Earth laser communications services.
4SFS8 Green
none none
5SFS15 Green
Maintain NASA success rate at or above a running average of 95% for missions on the FY 2005 Expendable Launch Vehicle (ELV) manifest.
4SFS4 Green
3H03 Blue
2H3 Green
5SSP16 Blue
Achieve at least 95% of planned data delivery for the International Space Station, each Space Shuttle mission, and low Earth orbiting missions in FY 2005.
4SFS5 Blue
3H14 Blue
none
5SFS19 Green
Define and provide space transportation requirements for future human and robotic exploration and development of space to all NASA and other government agency programs pursuing improvements in space transportation.
none none none
Resources NASA’s FY 2005 budgeted cost of performance for Objective 6 was $5.09 billion: $4.32 billion for Outcome 6.1 and $0.77 billion for Outcome 6.2.

FY 2005 Performance and Accountability Report 87
Objective 7: Develop a new crew exploration vehicle to provide crew transportation for missions beyond low Earth orbit. First test flight to be by the end of this decade, with operational capability for human exploration no later than 2014.
Why pursue Objective 7? With the Space Shuttle’s retirement scheduled for 2010, NASA must acquire or develop next-generation space transportation for crew and cargo. In September 2005, NASA released the Agency’s planned Exploration System Architecture Study, including the concept for a crew launch and exploration system. The new system will use reliable elements from the Apollo and Shuttle systems, but it also will incorporate the latest in shielding, computer technologies, and support systems. The goal is to create an exploration infrastructure that is sustainable, affordable, reliable, and safe. NASA will use the new spacecraft to deliver crew and cargo to the International Space Station and to explore beyond low Earth orbit.
NASA’s next-generation space transportation system is crucial to achieving the Vision for Space Exploration. The new system will support increased Station crew sizes and enhanced research capacity. In addition, next-generation transportation systems will support plans to return astronauts to the Moon in preparation for travel to Mars and beyond.
Image caption: NASA’s planned crew exploration vehicle, shown approaching the International Space Station in this artist’s concept, will deliver crew and cargo to and from the Station, carry up to four astronauts to the Moon, and support up to six astronauts during a mission to Mars. (Image: John Frassanito and Associates)
NASA’S PROGRESS AND ACHIEVEMENTS IN FY 2005
Outcome Ratings Under Objective 7, NASA is on track to achieve the single Outcome (100% Green).
APG Ratings Under Objective 7, NASA achieved 4 of 5 APGs: four Green (80%) and one White (20%).
Outcome 7.1: By 2014, develop and flight-demonstrate a human exploration vehicle that supports safe, affordable and effective transportation and life support for human crews traveling from Earth to destinations beyond LEO. The FY 2005 rating is Green. The FY 2004 (Outcome 9.5.1) rating was Green.
Creating NASA’s exploration architecture In May 2005, NASA’s Administrator established an Exploration System Architecture Study team. The team developed a detailed concept for a new Crew Exploration Vehicle (CEV) as a part of NASA’s overall exploration architecture. The team reviewed and assessed past programs and technologies for best practices and incorporation into a new vehicle design. The CEV operational deadline has been changed to 2012 to minimize the gap in U.S. access to space once the Shuttle fleet is retired in 2010.

FY 2005 Performance and Accountability Report 88
The Exploration System Architecture Study team accepted the Mars Design Reference Mission 3.0 for architecture planning purposes. The architecture’s requirements will determine how NASA will develop its lunar outpost in terms of habitat, surface power, and crew rotation.
FY 2005 Annual Performance Goals FY 2004 FY 2003 FY 2002
5TS1 Green
Conduct a detailed review of previous vehicle programs to capture lessons-learned and appropriate technology maturation; incorporate results into the human exploration vehicle requirements definition process.
none none none
5TS2 Green
Develop and obtain approval for human exploration vehicle Level 1 and Level 2 Requirements and the resulting Program Plan.
none none none
5TS3 Green
Complete preliminary conceptual design(s) for the human exploration vehicle, in conjunction with definition of an integrated exploration systems architecture.
none none none
5TS4 Green
Develop launch vehicle Level 1 Requirements for human-robotic exploration within an integrated architecture, and define corresponding programs to assure the timely availability of needed capabilities, including automated rendezvous, proximity operations and docking, modular structure assembly, in-space refueling, and launch vehicle modifications and developments.
none none none
5TS5 White
Conduct a preliminary conceptual design study for a human-robotic Mars exploration vehicle, in conjunction with definition of an integrated exploration systems architecture.
none none none
Resources NASA’s FY 2005 Budgeted Cost of Performance for Objective 7 was $0.06 billion, all of which was allocated to Outcome 7.1.

FY 2005 Performance and Accountability Report 89
Objective 8: Focus research and use of the ISS on supporting space exploration goals, with emphasis on understanding how the space environment affects human health and capabilities, and developing countermeasures.
Why pursue Objective 8? The International Space Station plays a unique role in human space exploration. It is the only facility where researchers can study the effects of space travel on human health and performance in an actual space environment over long periods of time.
In July 2005, Space Shuttle Discovery (STS-114) delivered to the Station new equipment, including a second Human Research Facility that contains tools for studying human health. Over the next five years, until the Shuttle’s retirement by 2010, the Shuttle will deliver additional components and equipment to support a larger crew and more research capabilities.
Much of the research being conducted on the Space Station focuses on activities that support NASA’s exploration goals. The Agency will continue to use the Station to study the effects of living for long periods of time in space, and researchers will develop countermeasures for problems like muscle atrophy, bone loss, and changes to the cardiopulmonary and immune systems. The Station also will be a test bed for new technologies, system performance, and logistical support crucial to NASA’s plans to achieve human space travel beyond low Earth orbit.
Image caption: Leroy Chiao, Expedition 10 commander and NASA science officer, poses for a photo with Russian Orlan spacesuits during preparations for a spacewalk outside the Station on March 28, 2005. NASA will use the Station to evaluate advanced extravehicular activity systems, including suits optimized for use on lunar and planetary surfaces. (Photo: NASA)
NASA’S PROGRESS AND ACHIEVEMENTS IN FY 2005
Outcome Ratings Under Objective 8 NASA is on track to achieve all seven Outcomes (100% Green).
APG Ratings Under Objective 8 NASA achieved 16 of 20 APGs: 16 Green (80%), three Yellow (15%), and one White (5%).
Outcome 8.1: By 2010, complete assembly of the ISS, including U.S. components that support U.S. space exploration goals and those provided by foreign partners. The FY 2005 rating is Green. This Outcome began in FY 2005.
In May 2005, NASA convened the Shuttle/Station Configuration Options Team. The team evaluated options for completing International Space Station assembly within the parameters of the Vision for Space Exploration and assessed the related number of flights needed by the Shuttle before it is retired. The scope of the study spanned Station assembly, operations, and use, and it considered such factors as international partner commitments, research utilization, cost, and sustainability. The team evaluation results were integrated with a parallel Exploration Systems

FY 2005 Performance and Accountability Report 90
Architecture Study and will serve as central elements in the NASA FY 2007 budget proposal to the White House.
Photo caption: A worker at Kennedy Space Center helps load the Human Research Facility 2 into the Shuttle’s Multi-Purpose Logistics Module Raffaello on March 8, 2005, for flight on STS-114. The large research rack, a component of the U.S. Destiny research module, was too large to be launched on a Russian vehicle and had to await the Shuttle’s return to flight. The Shuttle is the only vehicle capable of delivering to orbit large Station components, including modules developed by the Agency’s international partners. (Photo: NASA)
FY 2005 Annual Performance Goals FY 2004 FY 2003 FY 2002
5ISS5 Yellow
Obtain agreement among the International Partners on the final ISS configuration.
4ISS5 Green
none none
Performance Shortfalls APG 5ISS5: The ISS International Partnership Heads of Agency met in January 2005 to endorse the Multilateral Coordination Board-approved the Station configuration. However, in May 2005, NASA’s Administrator initiated a 60-day study on options for completing International Space Station assembly within the parameters of the Vision for Space Exploration. The decision based on the study requires NASA to reopen discussions with its partners. By the end of the fiscal year, NASA had begun these discussions with the International Partners.
Outcome 8.2: Annually provide 90 percent of the optimal on-orbit resources available to support research, including power, data, crew time, logistics, and accommodations. The FY 2005 rating is Green. This Outcome began in FY 2005.
The International Space Station has been crewed continuously since November 2000. While the Space Shuttle fleet was grounded, the international partnership maintained a continuous presence of two crewmembers aboard the Station throughout FY 2005. The Station hosted three crews who performed all necessary housekeeping and maintenance activities and conducted a range of scientific investigations. The planned on-Station science was limited by the reduced crew size and the cargo delivery limitations of Progress and Soyuz spacecraft. However, NASA is maximizing the Station’s research capability through scheduling, standby launch reserve, and on-orbit reserve. During FY 2005, the crew conducted 246 hours of research onboard the Station. Overall, the Station’s performance has surpassed expectations, given the grounding of the Shuttle fleet. (Operating the Space Station with a two-person crew and a limited re-supply capability actually is helping NASA plan future missions to destinations like the Moon or Mars, for which logistic options will be limited.)
Photo caption: Left photo: On August 2, 2004, Expedition 9 crewmembers Gennady Padalka (left) and Edward (Mike) Fincke pose for a picture with the Russian Orlan spacesuits in the Station’s Pirs docking compartment. Their stay began during FY 2004 and extended into the first month of FY 2005. Center photo: On November 6, 2004, Expedition 10 crewmembers Leroy Chiao (left) and Salizhan Sharipov add their mission patch to the Unity module’s growing collection of insignias representing crews who have worked on the Station. Right photo: Expedition 11 crewmembers John Phillips (left) and Sergei Krikalev pause for a photo while working on the Treadmill Vibration Isolation System on September 7, 2005. Their expedition extended into FY 2006. (Photos: NASA)

FY 2005 Performance and Accountability Report 91
FY 2005 Annual Performance Goals FY 2004 FY 2003 FY 2002
5ISS1 Green
In concert with the ISS International Partners, extend a continuous two-person (or greater) crew presence on the ISS through the end of FY 2004.
4ISS1 Green
none none
5ISS2 Yellow
Achieve zero Type-A (damage to property at least $1M or death) or Type-B (damage to property at least $250K or permanent disability or hospitalization of 3 or more persons) mishaps in FY 2005.
4ISS2 Yellow
3H11 Green
2H10 Green
5ISS3 Green
Based on the Space Shuttle return-to-flight plan, establish a revised baseline for ISS assembly (through International Core Complete) and research support.
4ISS3 Green
3H02 Yellow
none
5ISS4 Yellow
Provide at least 80% of up-mass, volume, and crew-time for science as planned at the beginning of FY 2005.
4ISS4 Green
none none
5ISS6 Green
Continuously sustain a crew to conduct research aboard the ISS. 4ISS6 Green
none none
Performance Shortfalls APG 5ISS2: Although there were no Type-A mishaps in FY 2005, NASA failed to achieve this APG due to the occurrence of one Type-B mishap at a Station subcontractor facility. In June 2005, the pre-cooler assembly, part of the Environmental Control and Life Support System flight hardware, was damaged at the Honeywell plant. This damage rendered the pre-cooler assembly unrecoverable, and as a result, NASA will request additional unit(s) from the Station Program. NASA estimated the damage at approximately $350,000; there were no injuries. The Mishap Investigation Board is conducting an investigation.
APG 5ISS4: While NASA did not meet 80 percent as planned at the beginning of the fiscal year for these metrics, NASA did meet 97 percent of the science objectives during Increment 10 (October 2004 through March 2005) and expects a similar achievement for Increment 11 (March 2005 through October 2005).
NASA did not pursue Outcome 8.3 in FY 2005.
Outcome 8.4: By 2006, each Research Partnership Center will establish at least one new partnership with a major NASA R&D program to conduct dual-use research that benefits NASA, industry, or academia. The FY 2005 rating is Green. This Outcome began in FY 2005.
The Research Partnership Centers are on track for completing this outcome in 2006, although the number of Shuttle flights may impact the ability to put hardware to use.
In FY 2005, the Research Partnership Centers implemented a new database that includes pertinent data regarding all projects and current spaceflight hardware. The Centers made copies of the complete database available to the Department of Defense and industry.
NASA’s Space Partnership Development Program implemented a multi-faceted system for sharing flight hardware with potential users outside NASA. The program developed an exhaustive list of flight hardware that contains descriptions of over two dozen flight hardware units for performing a variety of research in space. The program also established a Web-based system listing ground and flight hardware accessible to all Research Partnership Centers and participating Space Act Agreement companies. The Spacecraft Technology Center Research Partnership Center

FY 2005 Performance and Accountability Report 92
developed a Web-based forum that includes news announcements, discussion threads, document posting, and a vendor information exchange. The system features a flight hardware database through which users can describe their flight hardware systems and components available for use and exchange available or needed parts.
Photo caption: NASA’s partnership programs help companies develop technologies for space flight and then turn those technologies into commercially available products. For example, one of the partners that collaborated on a plant growth chamber for space-based research, held by Station Expedition 5 crewmember Peggy Whitson in the left photo, turned the light-emitting diodes that provided light to the plants into several health-related products, including a device that kills anthrax spores, a probe that activates tumor-treating drugs, and a device (shown in the right photo) that provides temporary relief of minor muscle and joint pain. (left: NASA; right: Quantum Devices, Inc.)
FY 2005 Annual Performance Goals FY 2004 FY 2003 FY 2002
5RPFS4 Green
Promote availability of RPC-built spaceflight hardware throughout NASA utilizing the new database.
none none none
5RPFS5 Green
Implement hardware sharing system. 4RPFS6 Green
none none
5RPFS6 Green
Identify and develop a working relationship with at least one new non-SPD user of RPC-built spaceflight hardware.
none none none
Outcome 8.5: By 2008, develop and test the following candidate countermeasures to ensure the health of humans traveling in space: bisphosphonates, potassium citrate, and mitodrine. The FY 2005 rating is Green. This Outcome began in FY 2005.
During FY 2005, NASA-funded researchers published papers on ground-based studies of bisphosphonate, a medication used to slow bone loss. While bisphosphonate is used on Earth to combat osteoporosis, NASA has not validated fully its use as a countermeasure for spaceflight-induced bone loss. (Other papers based on flight-based studies were reviewed and accepted by journals and are awaiting publication in FY 2006.)
NASA continues space-based studies of potassium citrate, a potential countermeasure for spaceflight-induced renal stones, and midodrine, a potential countermeasure for treating spaceflight-induced low blood pressure. Although these studies were delayed by the Columbia accident and the Agency’s change in direction to pursue the Vision for Space Exploration, NASA has completed most of the planned testing.
Photo caption: Expedition 10 crewmember Leroy Chiao gives a thumbs up on his way to launch aboard a Russian Soyuz TMA-5 spacecraft on October 5, 2004. Astronauts experience dizziness when they stand up (called orthostatic intolerance) after returning to Earth due to lowered blood volume—and therefore low blood pressure—from being in space. During reentry, astronauts wear full-body pressure suits underneath their spacesuits to help move blood from the feet up to the head, but this alone is not enough to prevent orthostatic intolerance. While in space, Chiao took mitodrine, a medication that NASA is testing as a potential countermeasure. (Photo: B. Ingallls/NASA)

FY 2005 Performance and Accountability Report 93
FY 2005 Annual Performance Goals FY 2004 FY 2003 FY 2002
5BSR7 Green
Increase the use of space flight analogs on the ground to better define hypotheses for flight experiments.
none none none
5BSR8 Green
Publish final results of Bioastronautics experiments conducted during ISS Increment 8 and preliminary results from Increments 9 and 10.
4BSR9 Green
none none
5BSR9 Green
Maintain productive peer-reviewed research program in Biomedical Research and Countermeasures, including a National Space Biomedical Research Institute that will perform team-based focused countermeasure-development research.
4BSR10 Green
none none
5BSR10 White
Under the Human Research Initiative (HRI) increase the number of investigations addressing biomedical issues associated with human space exploration.
none none none
5BSR11 Green
Conduct scientific workshops to fully engage the scientific community in defining research strategies for addressing and solving NASA’s biomedical risks.
none none none
5SFS20 Green
Certify the medical fitness of all crew members before launch. 4SFS10 Green
none none
Performance Shortfalls APG 5BSR10: The number of investigations addressing biomedical issues associated with human space exploration was not increased. Anticipated Human Research Initiative funding was reduced.
Outcome 8.6: By 2008, reduce the uncertainties in estimating radiation risks by one-half. The FY 2005 rating is Green. The FY 2004 (Outcome 9.1.2) rating was Blue.
Through annual solicitations, NASA’s Space Radiation Program expands the radiation research community by funding approximately 10 to 14 new, high-quality research projects each year. Between 2003 and 2005, the program increased from 51 research projects to 76. The selections in FY 2005 included 11 new individual projects, 10 of which were from researchers not funded previously through the Space Radiation Program.
Since the NASA Space Radiation Laboratory began full operations in October 2003, the Space Radiation Program has exceeded utilization plans. Original plans included 650 hours of beam time the first year, growing to 1,200 hours by 2007. During the first two years of operations (FY 2004 to FY 2005), the laboratory provided 2,251 hours of beam time to NASA- and Department of Energy-funded investigators performing research in radiation health and shielding. The October 2005 special issue of Radiation Research will include 18 papers containing the first published results from the NASA Space Radiation Laboratory. Laboratory researchers revised the methodology for assessing radiation risks and the uncertainties in projections and will apply it to new data sets in FY 2006.
Photo caption: A member of the Space Radiation Summer Student Program, hosted by NASA’s Space Radiation Laboratory, conducts research. Since it opened in summer 2003 at Brookhaven National Laboratory, the laboratory has been an important venue for conducting radiobiology experiments for the U.S. space program. (Photo: Brookhaven National Laboratory)

FY 2005 Performance and Accountability Report 94
FY 2005 Annual Performance Goals FY 2004 FY 2003 FY 2002
5BSR12 Green
Expand the space radiation research science community to involve cutting edge researchers in related disciplines by soliciting, selecting, and funding high quality research.
4BSR11 Green
none none
5BSR13 Green
Use 1000 hours/yr of beam time at the National Space Radiation Laboratory (NSRL) at Brookhaven National Laboratory (BNL) to measure survival, genetic mutation (mutagenesis), and chromosome aberrations in cells and tissues to improve understanding of the biological effects of the space radiation environment.
none none none
5BSR14 Green
Integrate research data collected over the past two years at NSRL, with existing database to develop more accurate predictions resulting in improved biological strategies for radiation risk reduction.
none none none
Outcome 8.7: By 2010, identify and test technologies to reduce total mass requirements for life support by two thirds using current ISS mass requirement baseline. The FY 2005 rating is Green. The FY 2004 (Outcome 9.2.1) rating was Green.
Future long-duration space exploration demands systems that are smaller, lighter, and more efficient than what NASA currently uses aboard its vehicles. By 2010, NASA seeks to reduce by two thirds the total mass of the advanced life support systems currently used aboard the Station. As life support technologies improve and become more compact, NASA moves incrementally toward achieving this target. Every year, NASA assesses the available technologies and determines how small and light NASA engineers can make support technologies (mass requirement) while still providing necessary life support to the Station: NASA reduced the mass requirement by 32 percent by the end of 2003 and 51 percent by the end of 2004, as defined by the advanced life support mass metric developed by NASA engineers.
Photo caption: This photo shows the water recovery system for the International Space Station’s Environmental Control and Life Support System in 2000. NASA engineers are developing smaller, lighter, and more efficient technologies to reduce the mass of all life support systems for the Station and future space exploration spacecraft and surface habitats. (Photo: NASA)
FY 2005 Annual Performance Goals FY 2004 FY 2003 FY 2002
5BSR17 Green
Demonstrate, through vigorous research and technology development, a 55% reduction in the projected mass of a life support flight system compared to the system baselined for ISS.
4BSR17 Green
3B2 Green
2B2 Green
Outcome 8.8: By 2008, develop a predictive model and prototype systems to double improvements in radiation shielding efficiency. The FY 2005 rating is Green. The FY 2004 (Outcome 9.2.1) rating was Green.
NASA researchers are accumulating data on the radiation shielding effectiveness for a number of candidate shielding materials in anticipation of the 2008 milestone. NASA will narrow this set of candidate materials down to a select few that must meet specific requirements, including

FY 2005 Performance and Accountability Report 95
mechanical and environmental properties, before qualifying as multifunctional materials. So far, NASA has selected at least two candidate materials for further development.
FY 2005 Annual Performance Goals FY 2004 FY 2003 FY 2002
5BSR9 Green
Continue accumulating data on radiation effects on materials properties and initiate the assessment of the performance of multifunctional materials.
none none none
Resources NASA’s FY 2005 budgeted cost of performance for Objective 8 was $2.64 billion: $0.10 billion for Outcome 8.1; $1.62 billion for Outcome 8.2; $0.04 billion for Outcome 8.4; $0.01 billion for Outcome 8.5; $0.32 billion for Outcome 8.6; $0.53 billion for Outcome 8.7; and $0.02 billion for Outcome 8.8.

FY 2005 Performance and Accountability Report 96
Objective 11: Develop and demonstrate power generation, propulsion, life support, and other key capabilities required to support more distant, more capable, and/or longer duration human and robotic exploration of Mars and other destinations.
Why pursue Objective 11? To push the boundaries of robotic and human space exploration, NASA continuously must improve the systems that support this exploration. These systems cover a wide range of capabilities: batteries that work reliably in the extreme cold of deep space; propulsion systems that generate more power and speed with less fuel; dexterous robots that can explore autonomously or serve as astronaut helpers; mobility systems that astronauts can use in near-weightlessness and on planetary surfaces; modular life support and habitation systems; better scientific instruments and sensors; in-situ resource utilization technologies; improved communications and navigation systems; and advanced computing, modeling, simulation, and analysis technologies.
NASA’s goal is to develop the best possible exploration architecture—one that is flexible, affordable, reliable, and safe—to help the Agency achieve the Vision for Space Exploration. This means refining requirements, conducting rigorous cost and risk analysis, and thoroughly testing systems. These capabilities will evolve in stages as technologies reach maturity.
NASA partners with other government agencies, U.S. industry, and academia to develop capabilities for the space program. NASA also provides the capital funds and facilities to help small businesses develop and produce their space-related technologies for commercial and government use. These partnerships are beneficial to all involved and help maintain vigorous technology research, development, and manufacturing within the United States.
Photo caption: A four quadrant, 20-meter solar sail system is fully deployed during testing at NASA Glenn Research Center’s Plum Brook facility in Sandusky, Ohio. The tests were a critical step toward developing the unique propulsion technology, where sunlight pressure provides the necessary thrust to propel the spacecraft toward its destination. (Photo: NASA)
NASA’S PROGRESS AND ACHIEVEMENTS IN FY 2005
Outcome Ratings Under Objective 11, NASA is on track to achieve six of seven Outcomes: six Green (86%) and one White (14%).
APG Ratings Under Objective 11, NASA achieved 18 of 24 APGs: two Blue (8%), 16 Green (67%), three Yellow (13%), one Red (4%), and two White (8%).

FY 2005 Performance and Accountability Report 97
NASA did not pursue Outcomes 11.1 or 11.2 in FY 2005.
Outcome 11.3: By 2015, identify, develop, and validate human-robotic capabilities required to support human-robotic exploration of Mars and other destinations. The FY 2005 rating is Green. The FY 2004 (Outcome 9.4.1) rating was Green.
In FY 2005, NASA established a strategy-to-task technology research and development planning process and identified and developed programs that support technology concepts, International Space Station utilization, and analysis for human–robotic lunar missions. Using its advanced technology lifecycle analysis system tools, NASA tested and validated reference architectures, modeling capabilities, and potential future technologies. The Agency also held a series of technical interchange meetings focused on helping designers, developers, and customers quantify a variety of technologies and customer needs while helping NASA select different approaches for ongoing system and technology planning for lunar missions. NASA also tested and validated over 20 reference architectures and relevant technologies identified in the Advanced Technology Life-cycle Analysis System, a system to help NASA identify and use available space exploration technologies and systems and plan mission architectures.
FY 2005 Annual Performance Goals FY 2004 FY 2003 FY 2002
5HRT1 Green
Establish an integrated, top-down strategy-to-task technology R&D planning process to facilitate the development of human-robotic exploration systems requirements.
4HRT1 Green
none none
5HRT2 Green
Execute two systems-focused Quality Function Deployment exercises through an Operational Advisory Group (including both technologists and operators) to better define systems attributes necessary to accomplish human-robotic exploration operational objectives.
4HRT2 Green
none none
5HRT3 Green
Execute selected R&D-focused Quality Function Deployment exercises through an external/internal Technology Transition Team to review candidate human-robotic exploration systems technologies, and provide detailed updates to human-robotic technology road maps.
4HRT3 Green
none none
5HRT4 Green
Test and validate preferred engineering modeling and simulation computational approaches through which viable candidate architectures, systems designs, and technologies may be identified and characterized. Select one or more approaches for ongoing use in systems/technology road mapping and planning.
none none none
5LE1 Yellow
Identify and define preferred human-robotic exploration systems concepts and architectural approaches for validation through lunar missions.
none none none
5LE2 Red
Identify candidate architectures and systems approaches that can be developed and demonstrated through lunar missions to enable a safe, affordable, and effective campaign of human-robotic Mars exploration.
none none none
5LE6 Yellow
Identify preferred approaches for development and demonstration during lunar missions to enable transformational space operations capabilities.
none none none
5LE7 Green
Conduct reviews with international and U.S. government partners to determine common capability requirements and opportunities for collaboration.
none none none

FY 2005 Performance and Accountability Report 98
Performance Shortfalls APG 5LE1: NASA has not completed the results, only preliminary concepts, for APG 5LE1. NASA’s near-term focus is on lunar site selection and characterization, rather than human-robotic linkages. Future architecture and long-term linkages will flow from the Exploration Systems Architecture Study results announced in August 2005.
APG 5LE2: NASA shifted its near-term focus to lunar exploration and, therefore, has deferred linkages to Mars exploration to re-allocate resources for Constellation Systems development.
APG 5LE6: NASA performed limited analysis of space operations. NASA’s near-term focus for robotic exploration is on site selection and characterization. NASA will derive the linkage to transformational operations from the Exploration Systems Architecture Study results and architecture development.
Outcome 11.4: By 2015, identify and execute a research and development program to develop technologies critical to support human–robotic lunar missions. The FY 2005 rating is Green. The FY 2004 (Outcome 9.4.2) rating was Green.
NASA established a research and development program to support human–robotic lunar missions. The program includes subsystem technology development efforts and a Robotic Lunar Exploration Program that will launch its first mission, the Lunar Reconnaissance Orbiter (currently in development), in late 2008. The second mission, a lander, is in program formulation and planned for launch by 2010.
NASA also identified, analyzed, and executed viable technology candidates critical to program development in support of human–robotic lunar missions, including self-sufficient space systems, habitation and bioastronautics, and space assemblies.
Image caption: This artist’s concept shows vehicles exploring the surface of the Moon. Throughout FY 2005, NASA formed a phased capability and advanced technology architecture to meet future robotic and human lunar exploration needs. (Image: NASA)
FY 2005 Annual Performance Goals FY 2004 FY 2003 FY 2002
5HRT5 Green
Identify and analyze viable candidates and identify the preferred approach to sustained, integrated human-robotic solar system exploration involving lunar/planetary surfaces and small bodies, and supporting operations. Validate a focused technology R&D portfolio that addresses the needs of these approaches and identifies existing gaps in technological capabilities.
none none none
5HRT6 Green
Establish and obtain approval for detailed R&D requirements, road maps, and program planning in key focused technology development areas, including self-sufficient space systems; space utilities and power; habitation and bioastronautics; space assembly, maintenance, and servicing; space transportation; robotic networks; and information technology and communications.
none none none
5LE3 Green
Establish a baseline plan and Level 1 requirements to utilize the robotic lunar orbiter(s) and robotic lunar surface mission(s) to collect key engineering data and validate environmental characteristics and effects that might affect later robotics, astronauts, and supporting systems.
none none none
5LE4 Green
Identify candidate scientific research and discovery opportunities that could be pursued effectively during robotic lunar missions.
none none none

FY 2005 Performance and Accountability Report 99
FY 2005 Annual Performance Goals FY 2004 FY 2003 FY 2002
5LE5 Green
Establish a viable investment portfolio for development of human support systems, including human/machine extravehicular activity (EVA) systems, locally autonomous medical systems, and needed improvements in human performance and productivity beyond low Earth orbit (LEO).
none none none
Spotlight: NASA and Partners Test a Solar Sail System In June 2005, NASA reached a milestone in the testing of solar sails when engineers successfully deployed a 20-meter solar sail system that uses an inflatable boom deployment design. NASA and its commercial partner deployed the system at the Space Power Facility, the world’s largest space environment simulation chamber, at Glenn Research Center’s Plum Brook Station in Sandusky, Ohio. The complete test ran 30 days.
Solar sail technologies use energy from the Sun to power a spacecraft’s journey through space. Sunlight bounces off giant, reflective sails made of lightweight material 40- to 100-times thinner than a piece of writing paper. Because the Sun provides the necessary propulsive energy, solar sails require no onboard propellant, making them lighter than traditional propulsion systems and increasing their range of mobility or their ability to hover at a fixed point for longer periods of time. This new type of propulsion system could enable more ambitious missions within the inner solar system.
Photo caption: NASA engineers, visible near the bottom of the photo, look at a 20-meter solar sail and boom system after it is fully deployed during testing at NASA’s Space Power Facility. Red and blue lights help illuminate the four triangular sail quadrants as they lie outstretched. The sail material is supported by a series of inflatable booms that become rigid in the space environment. The system extends via remote control from a central stowage container about the size of a suitcase. (Photo: NASA)
Outcome 11.5: By 2016, develop and demonstrate in-space nuclear fission-based power and propulsion systems that can be integrated into future human and robotic exploration missions. The FY 2005 rating is White. The FY 2004 (Outcome 9.4.3) rating was Green.
Recently, NASA identified a logical and affordable path to realizing the Vision for Space Exploration through the recently completed Exploration Systems Architecture Study. The review did not identify a near-term need for nuclear fission systems, so Outcome 11.5 is no longer applicable. NASA, however, will focus on nuclear research and technology studies, including development of nuclear systems strategic plans and formulation of program and nuclear technology development objectives, to meet longer-term exploration and science needs.
NASA will still need a longer-term nuclear capability for extended human presence in space, whether on the Moon, Mars, or in transit. Extended human stays on the Moon, even where there is plenty of sunlight, will require power support for the 14-day-long lunar nights. A surface nuclear reactor power system would provide adequate power to support human exploration on the lunar surface or on the surface of Mars. Such a system also could provide the large amounts of power needed support in-situ resource utilization to process surface resources such as lunar soils for oxygen. For long duration stays on the surface, oxygen could be very important for sustaining

FY 2005 Performance and Accountability Report 100
human existence on the surface and also useful as a source of rocket propellant and other consumables.
FY 2005 Annual Performance Goals FY 2004 FY 2003 FY 2002
5HRT7 Green
Develop Level1/Level 2 requirements for nuclear power and propulsion systems in support of selected human and robotic exploration architectures and mission concepts.
none none none
5HRT8 White
Complete a validated road map for nuclear power and propulsion R&D, and related vehicle systems technology maturation.
none none none
5HRT9 Green
Formulate a demonstration mission plan for Jupiter Icy Moons Orbiter that will test and validate nuclear power and propulsion systems for future human-robotic exploration missions.
none none none
Outcome 11.6: Develop and deliver one new critical technology every two years in each of the following disciplines: in-space computing, space communications and networking, sensor technology, modular systems, robotics, power, and propulsion. The FY 2005 rating is Green. The FY 2004 (Outcome 9.4.4) rating was Green.
Researchers for NASA’s Advanced Space Technology Program developed two technologies that will be used for Mars missions: a 100-Watt Ka-band traveling wave tube amplifier for the 2009 Mars Telecommunication Orbiter and a micro sun sensor for the Mars Science Laboratory. The new transmitter has 10 times the output capability than existing deep space communication devices, and the new transmitter will increase significantly the rate of data return from Mars. NASA will use the micro sun sensor to navigate the Mars Science Laboratory rover across the surface of Mars by measuring the position of the Sun. The micro sun sensor weighs less than 0.35 ounces and is about 10 times smaller than conventional sun sensors.
NASA’s Centennial Challenges Program continues NASA’s Centennial Challenges Program continued to reach out to the best and brightest in the Nation through four challenges announced in FY 2005: the 2005–2006 Tether Challenge, the 2005–2006 Beam Power Challenge, the MoonROx Challenge, and the 2006 Astronaut Glove Challenge. NASA awaits Congressional authorization to announce Challenges with larger purses.
Photo caption: This photo shows a 100-Watt Ka-band traveling wave tube amplifier designed for NASA’s 2009 Mars Telecommunication Orbiter mission. (Photo: NASA)
FY 2005 Annual Performance Goals FY 2004 FY 2003 FY 2002
5HRT15 White
Complete an Advance Space Technology Program technology road map that interfaces appropriately with technology planning of NASA’s Mission Directorates.
none none none
5HRT16 Green
Deliver at least one new critical technology in each key area (including in-space computing, space communications and networking, sensor technology, modular systems, and engineering risk analysis) to NASA’s Mission Directorates for possible test and demonstration.
none none none
5HRT17 Blue
Prepare and announce the Centennial Challenge Cycle 2 major award purses, including competition rules, regulations, and judgment criteria.
none none none

FY 2005 Performance and Accountability Report 101
Outcome 11.7: Promote and develop innovative technology partnerships, involving each of NASA’s major R&D programs, among NASA, U.S. industry, and other sectors for the benefit of Mission Directorate needs. The FY 2005 rating is Green. The FY 2004 (Outcome 10.3.1) rating was Blue.
In FY 2005, NASA signed 85 technology partnerships to benefit each of NASA’s major research and development and Mission Directorate needs. However, NASA did not sign any partnerships using the Enterprise Engine concept. As of the third quarter of FY 2005, 100 percent of 185 signed innovative technology infusion partnership agreements demonstrated their value to NASA.
Photo caption: The patented, portable hyperspectral camera and its applications were developed by the Institute for Technology Development, a NASA Research Partnership Center at NASA’s Stennis Space Center. The Environmental Protection Agency teamed with NASA to use the hyperspectral imaging technology to improve crop management by helping growers easily distinguish between a traditional and a bioengineered crop. Hyperspectral imaging also can be used in treating astronaut wounds in space. The Institute for Technology Development is working on a portable, handheld camera that an astronaut could use to capture an image of a wound site. The goal of all research partnerships is to create technologies that are beneficial to NASA and the public. (Photo: NASA/SSC)
FY 2005 Annual Performance Goals FY 2004 FY 2003 FY 2002
5HRT12 Yellow
Establish three partnerships with U.S. industry and the investment community using the Enterprise Engine concept.
4HRT8 Yellow
none none
5HRT13 Green
Develop 12 industry partnerships, including three established using the Enterprise Engine, that will add value to NASA Mission Directorates.
4HRT9 Blue
none none
Performance Shortfalls APG 5HRT12: NASA did not form any partnerships with industry or the investment community using the Enterprise Engine concept in FY 2005. NASA’s Administrator canceled the program. However, the Agency did create partnerships through other means, keeping NASA on track to achieve the Outcome.
Outcome 11.8: Annually facilitate the award of venture capital funds or Phase III contracts to no less than two percent of NASA-sponsored Small Business Innovation Research Phase II firms to further develop or produce their technology for industry or government agencies. The FY 2005 rating is Green. The FY 2004 (Outcome 10.3.2) rating was Green.
NASA’s Alliance for Small Business Opportunity (NASBO) Program awarded contracts to two Small Business Innovation Research firms, WaveBand Corporation and Tao of System Integration, Inc.
WaveBand Corporation applies millimeter wave technology to autonomous landing applications. The first collaboration was a follow on flight test conducted by WaveBand/Sierra Nevada

FY 2005 Performance and Accountability Report 102
Corporation and a major airplane manufacturer, resulting in a $3 million contract to certify the technology. The end result may be the inclusion of the radar technology in commercial aircraft.
Tao of System Integration, Inc., provides software to characterize broad platform flow. Tao’s first support from NASBO was to identify and introduce a major aerospace firm interested in licensing Tao’s technology, but difficulty in coming to terms with intellectual property ownership prevented the deal from being signed. NASBO then enrolled Tao in its eight-week Sales Acceleration workshop series. Tao benefited from this hands-on approach: the company changed its business model, identified a single application of many possibilities, and is committing 60 percent of management’s resources to the applications’ launch. Currently Tao is in negotiations with Boeing for its first sale. Tao also is working actively with the Dryden Flight Research Center to infuse into its technology the recent results of an F-15 flight test.
Photo caption: NASA’s F-15B #837 (painted red, white, and blue) participates in a flight test on the Intelligent Flight Control System while its stablemate, F-15B #836, serves as a chase plane on July 22, 2005. From June through August 2005, NASA’s Dryden Flight Research Center also conducted experimental flight tests with sensors and electronics developed by Tao to determine unsteady aerodynamic characteristics of an F-15B tail instrumented with strain gages and hot-film sensors. (Photo: C. Thomas/NASA)
FY 2005 Annual Performance Goals FY 2004 FY 2003 FY 2002
5HRT14 Green
Achieve through NASBO the award of Phase III contracts or venture capital funds to no less than two SBIR firms to further develop or produce their technology through industry or government agencies.
4HRT10 Green
none none
NASA did not pursue Outcome 11.9 in FY 2005.
Outcome 11.10: By 2005, demonstrate two prototype systems that prove the feasibility of resilient systems to mitigate risks in key NASA mission domains. Feasibility will be demonstrated by reconfigurability of avionics, sensors, and system performance parameters. The FY 2005 rating is Green. The FY 2004 (Outcome 10.1.1) rating was Green.
NASA demonstrated two prototype systems tools via the development of the prototype Function-based Failure Design Tool and the Investigation Organizer. The Function-based Failure Design Tool helps engineers identify potential failures during the earliest stages of design, when solutions are incomplete and only loosely specified by functions. Xerox is commercializing the Investigation Organizer. The Investigation Organizer is an automated software tool developed by NASA ARC to collect different types of data and put this data into an organizational structure that is more easily interpreted and used. Investigation Organizer provides a central information repository that can be used by mishap investigation teams to store digital products. NASA used the tool to support the Columbia accident investigation.

FY 2005 Performance and Accountability Report 103
FY 2005 Annual Performance Goals FY 2004 FY 2003 FY 2002
5HRT10 Green
Develop prototype design and organizational risk analysis tools to do risk identifications, assessments, mitigation strategies, and key trade-off capabilities not only between risks, but between risks and other mission design criteria.
none none none
5HRT11 Blue
Develop a robust software tool for accident investigation that can help identify the causes of spacecraft, airplane, and/or other mission hardware accidents.
none none none
Resources NASA’s FY 2005 budgeted cost of performance for Objective 11 was $0.96 billion: $0.10 billion for Outcome 11.3; $0.07 billion for Outcome 11.4; $0.27 billion for Outcome 11.5; $0.25 billion for Outcome 11.6; $0.04 billion for Outcome 11.7; $0.11 billion for Outcome 11.8; and $0.11 billion for Outcome 11.10. (Note: Outcome amounts do not add to total due to rounding.)

FY 2005 Performance and Accountability Report 104
Objective 12: Provide advanced aeronautical technologies to meet the challenges of next-generation systems in aviation, for civilian and scientific purposes, in our atmosphere and in atmospheres of other worlds.
Why pursue Objective 12? NASA’s predecessor, the National Advisory Committee for Aeronautics, responded to the Nation’s urgent need to learn about the science of flight. That research contributed to the design of every American aircraft of the time, commercial and military. Today, NASA meets the Nation’s urgent need to transform its air transportation system to benefit the public by developing barrier-breaking technologies for aircraft and supporting systems that are safer, more secure, more efficient, and friendlier to the environment.
NASA’s aeronautics program has five goals: protect air travelers and the public; protect the environment from polluting emissions and excessive noise; increase the mobility of travelers and goods; partner with other government agencies, academia, and the commercial sector for national security; and explore revolutionary aeronautical concepts to develop the next generation of aircraft and support systems.
NASA also is exploring ways to apply its aeronautical technologies to the Agency’s space exploration goals. For example, NASA’s technologies to pilot remotely uncrewed aircraft may be applied to robotic planetary vehicles, and supersonic, oxygen-breathing jets like the X-43A may offer a low-cost way to deliver crews and cargo to orbit.
Photo caption: Sensitive instruments mounted on booms extending forward of the wing measure air turbulence and its effect on stability on NASA’s Pathfinder–Plus solar-electric flying wing, shown parked at Rogers Dry Lake, adjoining Dryden Flight Research Center, California. NASA and AeroVironment, Inc., teamed up in 2004 through 2005 to conduct research flights on the lightweight solar aircraft. (Photo: T. Tschida/NASA)
NASA’S PROGRESS AND ACHIEVEMENTS IN FY 2005
Outcome Ratings Under Objective 12, NASA is on track to achieve eight out of nine Outcomes: eight Green (8o%) and one White (11%).
APG Ratings Under Objective 12, NASA achieved 18 out of 26 APGs: 18 Green (69%), two Yellow (8%), one Red (4%), and five White (19%).
Outcome 12.1: By 2005, research, develop, and transfer technologies that would enable the reduction of the aviation fatal accident rate by 50 percent from the FY 1991-1996 average. The FY 2005 rating is Green. The FY 2004 (Outcome 2.1.1) rating was Green.
NASA’s research and development program to reduce the fatal aircraft accident rate focuses on preventing accidents involving hazardous weather and icing conditions, controlled flight into terrain, and mechanical or software malfunctions. NASA also seeks to decrease injuries and fatalities

FY 2005 Performance and Accountability Report 105
when accidents do occur. Flight tests in FY 2005 resulted in significant improvements in pilot situational awareness and confidence in the Weather and Synthetic Vision Systems. NASA developed and transferred to the Federal Aviation Administration information technologies needed to build a safer aviation system—supporting pilots and air traffic controllers—and information to assess situations and trends that might indicate unsafe conditions before they lead to accidents. NASA’s extensive safety and cost benefit analysis indicates that if these technologies had been applied to the 1990–1996 National Transportation Safety Board set of accident causes, they would have had either a direct or indirect impact on reducing the accident rate for over 80 percent of accident causes.
Photo caption: The Tropospheric Airborne Meteorological Data Report, or TAMDAR, instrument, shown here installed aboard a Masaba Airlines aircraft, allows aircraft flying below 25,000 feet to sense automatically and report atmospheric conditions. Observations are sent by satellite to a ground data center. The center processes and distributes up-to-date weather information to forecasters, pilots, and those who brief pilots. (Photo: Masaba Airlines)
FY 2005 Annual Performance Goals FY 2004 FY 2003 FY 2002
5AT1 Green
Evaluate and flight validate selected next generation cockpit weather information, communications, airborne weather reporting, turbulence prediction and warning technologies, Synthetic Vision System and Runway Incursion Prevention System display concepts. The flight demonstration will illustrate the increased safety of integrating selected concepts in support of fleet implementation decisions. (AvSSP)
none none none
5AT2 Green
Demonstrate through applications and simulations safety-improvement systems that will illustrate the increased safety of integrating selected concepts in support of fleet implementation decisions. (AvSSP)
none none none
Outcome 12.2: Develop and validate technologies (by 2009) that would enable a 35 percent reduction in the vulnerabilities of the National Airspace System (as compared to the 2003 air transportation system). The FY 2005 rating is Green. This Outcome began in FY 2005.
NASA continued its progress toward reducing the vulnerability of the National Airspace System through formal research agreements with the Transportation Security Administration, the Federal Air Marshall Service, and the Department of Homeland Security Science and Technology Directorate. Members of those organizations joined the Aviation Safety and Security Subcommittee within NASA’s Aeronautics Research Advisory Committee. NASA defines additional activities monthly in cooperation with the Next Generation Air Transportation System Joint Program and Development Office. During FY 2005, NASA and its partners developed a new anonymous incident reporting system, analyzed threat assessments, and developed a concept for surveillance of protected areas.
FY 2005 Annual Performance Goals FY 2004 FY 2003 FY 2002
5AT3 Green
Create and establish a prototype data collection system for confidential, non-punitive reporting on aviation security by functional personnel in the aviation system.
none none none
5AT16 Green
Develop a preliminary joint research plan with the Transportation Security Administration (TSA). (AvSSP)
none none none

FY 2005 Performance and Accountability Report 106
Outcome 12.3: Develop and validate technologies that would enable a 10-decibel reduction in aviation noise (from the level of 1997 subsonic aircraft) by 2009. The FY 2005 rating is Green. This Outcome began in FY 2005.
NASA completed testing for the following noise reduction test articles in August 2005: a jointless acoustic barrel for the inlet; an acoustically-treated inlet lip; a fan thrust reverser with chevrons; variable geometry chevrons for fan thrust reverser; primary chevron; aligned landing gear; and toboggan landing gear fairing. NASA researchers also gathered acoustic data in the cabin for cruise and take-climb-out conditions as well as community noise data for takeoff, approach, and airframe noise. NASA validated noise-reduction projections for the selected concepts. These projections, when combined with benefits anticipated from aircraft operations in an aircraft-system-level noise assessment, will reduce aircraft noise sufficiently to fully meet the 10 dB noise reduction goal.
FY 2005 Annual Performance Goals FY 2004 FY 2003 FY 2002
5AT4 Green
Using laboratory data and systems analysis, complete selection of the technologies that show the highest potential for reducing commercial air transportation noise by at least 50%. (Vehicle Systems)
none none none
Spotlight: NASA Works to Quiet the Skies A huge ball of microphones that looks like a robotic porcupine may help make airplane cabins quieter for passengers and flight crews. Technicians at NASA’s Langley Research Center installed the microphones and other sensor arrays on a B-757 “flying laboratory” to measure interior noise and assess the effectiveness of sound deadening materials.
“The goal of NASA’s Quiet Aircraft Technology project is to reduce the impact of aircraft noise on all our citizens . . . those on the ground and those in the air,” said Mike Marcolini, Quiet Aircraft Technology project manager. “We’ve already had some success reducing engine noise. We’re working on making engines even quieter and tackling the noise that airplane structures, like landing gears, make.”
Sensitive microphones were placed inside the cabin to isolate the sources of irritating cabin noise, while sensors placed on the outer skin of the B-757 measured the pressure fluctuations of the air passing closest to the fuselage, also known as the turbulent boundary layer, and transmitted that information to data systems inside the aircraft. Computers recorded data from all sensors and microphones simultaneously providing data so researchers can begin to explore best methods for pinpointing and measuring noise sources. The researchers also compared how well current insulation and wall treatments were able to reduce noise. Future research will emphasize new materials that might be used to reduce sound even further.
Photo caption: A NASA research team installs a sphere containing 50 sensitive microphones in the cabin of a 757 jet to isolate the sources of noise that are irritating to aircraft crew and passengers. This testing helps engineers develop planes that are quieter and more comfortable. (Photo: NASA)

FY 2005 Performance and Accountability Report 107
Outcome 12.4: By 2010, flight demonstrate an aircraft that produces no CO2 or NOx to reduce smog and lower atmospheric ozone. The FY 2005 rating is White. This Outcome began in FY 2005.
A reduction in FY 2005 funding severely impacted the Ultra-efficient Engine Technology program, including the Low-NOx Combustor Detailed Design Review milestone originally planned for completion in the second quarter of FY 2005.
While engine technology is the major contributor to CO2 and NOx reduction, improvements to aerodynamic performance also reduce emissions. NASA researchers achieved two significant aerodynamic performance improvements in FY 2005—completing key studies on advanced fuel cell and hybrid systems, and testing a low-drag slotted wing concept at flight-design conditions.
Photo caption: The engine shown above demonstrated a 50 percent reduction in NOx emissions during past tests conducted by NASA’s program partner, Pratt & Whitney. (Photo: NASA)
FY 2005 Annual Performance Goals FY 2004 FY 2003 FY 2002
5AT5 Red
Demonstrate 70% reduction NOx emissions in full-annular rig tests of candidate combustor configurations for large subsonic vehicle applications. (Vehicle systems)
none none none
5AT6 Green
Based on laboratory data and systems analysis, select unconventional engine or power systems for technology development that show highest potential for reducing CO2 emissions and/or enabling advanced air vehicles for new scientific missions. (Vehicle Systems)
none none none
5AT7 Green
Complete laboratory aerodynamic assessment of low-drag slotted wing concept. (Vehicle Systems)
none none none
5AT27 White
Demonstrate through sector testing a full scale CMC turbine vane that will reduce cooling flow requirements and thus fuel burn in future turbine engine system designs. (Vehicle Systems)
none none none
Performance Shortfalls Outcome 12.4: NASA discontinued the Ultra-efficient Engine Technology program in the FY 2006 Budget Request, due to a change in Agency focus, so it is unlikely that NASA will achieve this Outcome.
APG 5AT5: NASA funded three companies to demonstrate 70 percent NOx reduction. However, a reduction of FY 2005 funding severely impacted the Ultra-efficient Engine Technology project, including the Low-NOx Combustor detailed design review milestone that was planned for completion in 2005. One contractor did complete a detailed design review of their concept and is continuing with testing as remaining Ultra-efficient Engine Technology project funds run out. Final termination decisions and notices are pending.
APG 5AT27: This effort was deleted from the Ultra-efficient Engine Technology portfolio. Budget constraints during the re-planning of the Vehicle Systems Program did not allow for this effort from earlier Propulsion and Power Project efforts to be included into the Ultra-efficient Engine Technology portfolio.

FY 2005 Performance and Accountability Report 108
Outcome 12.5: By 2005, develop, demonstrate, and transfer key enabling capabilities for a small aircraft transportation system. The FY 2005 rating is Green. The FY 2004 (Outcome 2.3.2) rating was Green.
During FY 2005, NASA conducted integrated flight experiments demonstrating the technical and operational feasibility of the four Small Aircraft Transportation System project operating capabilities: higher volume operations, en-route integration, lower landing minima, and single-pilot performance.
Photo caption: Visitors pack into the main tent of the SATS 2005: A Transformation of Air Travel technology demonstration in Danville, Virginia, to catch a glimpse of the possible future of personalized air travel by small plane. In addition to technology demonstrations, the three-day event for professionals and enthusiasts featured advanced small aircraft, interactive exhibits, and flight simulators. (Photo: NASA)
FY 2005 Annual Performance Goals FY 2004 FY 2003 FY 2002
5AT10 Green
Complete experimental validation of airborne systems with concept vehicle development.
none none none
Outcome 12.6: Develop and validate technologies (by 2009) that would enable a doubling of the capacity of the National Airspace Systems (from the 1997 NASA utilization). NASA made significant progress toward doubling the capacity of the National Airspace Systems in FY 2005. As part of this effort, NASA defined three different configurations to meet requirements for the Civil Heavy Lift Vertical Takeoff and Landing mission.
FY 2005 Annual Performance Goals FY 2004 FY 2003 FY 2002
5AT8 Green
Complete development of WakeVAS concept of operations and downselect WakeVAS architecture.
none none none
5AT9 White
Complete human-in-the-loop concept and technology evaluation of shared separation. (Airspace Systems)
none none none
5AT11 Green
Complete analysis of capacity-increasing operational concepts and technology road maps with VAST models, simulations, and Common Scenario Set. (Airspace Systems)
none none none
5AT12 Green
Develop display guidelines that exploit new understanding of perceptual systems and cognitive and physiological determinants of human performance. (Airspace Systems)
none none none
5AT13 White
Establish the fluid dynamics mechanism for alleviating wake through experimental and computational fluid mechanics studies. (Airspace Systems)
none none none
5AT14 White
Complete System-Wide Evaluation and Planning Tool initial simulation and field demonstration. (Airspace Systems)
none none none
5AT15 White
Complete communications, navigation, and surveillance requirements analysis. (Airspace Systems)
none none none

FY 2005 Performance and Accountability Report 109
FY 2005 Annual Performance Goals FY 2004 FY 2003 FY 2002
5AT17 Green
Complete NASA/industry/DoD studies of heavy-lift Vertical Take Off and Landing (VTOL) configurations to provide strategic input for future decisions on commercial/military Runway Independent Vehicles. (Vehicle Systems)
none none none
5AT22 Yellow
Using laboratory data and systems analysis, complete selection of the technologies that show the highest potential for reducing takeoff/landing field length while maintaining cruise Mach, low speed controllability, and low noise. (Vehicle Systems)
none none none
Performance Shortfalls APG 5AT9: This APG was not completed in FY 2005 and was delayed to FY 2006 due to FY 2005 budget constraints. FY 2005 accomplishments include completion of initial air-ground human-in-the-loop simulation environment, concept simulation demonstration of UPS Louisville hub operations, and establishment of NASA/FAA/Boeing partnership to develop a tailored arrivals test plan.
APG 5AT13: This APG was not completed in FY 2005 and was delayed to FY 2006 due to FY 2005 budget constraints. FY 2005 accomplishments include completion of initial tests of wake vortex-alleviating configurations and presentation of research paper at “Principles in Wake Vortex Alleviation Devices” workshop in Toulouse, France.
APG 5AT14: This APG was not completed in FY 2005 and was delayed to FY 2006 due to FY 2005 budget constraints. FY 2005 accomplishments include deployment of System-Wide Evaluation and Planning Tool (SWEPT) Reroute Conformance Monitoring algorithms in FAA’s Enhanced Traffic Management System, license of Future ATM Concepts Evaluation Tool (FACET) to Flight Explorer, and reception of NASA Space Act Award for FACET development.
APG 5AT15: This APG was not completed in FY 2005 and was delayed to FY 2006 due to FY 2005 budget constraints. FY 2005 accomplishments include completion of draft mobile communications network architecture definition documents review, completion of application analysis and identification of airport surface ICNS network architecture definition, completion of FAA Radio Frequency Interference (RFI) analysis at Cleveland Hopkins Airport, and completion of C-band channel sounding and interference tests at two Cleveland, OH, airports and at two Miami, FL, airports.
APG 5AT22: This APG was not completed in FY 2005 due to FY 2005 budget constraints. NASA is conducting limited internal studies. External technology trade studies did not take place in FY 2005, but work is expected to be completed in FY 2006.
NASA did not pursue Outcomes 12.7 or 12.8 in FY 2005.
Outcome 12.9: Develop technologies that would enable solar powered vehicles to serve as “sub-orbital satellites” for science missions. The FY 2005 rating is Green. The FY 2004 (Outcome 10.5.1) rating was Green.
NASA completed a series of research flights at Dryden Flight Research Center for the Pathfinder–Plus solar-electric flying wing to investigate the effects of turbulence on lightweight, flexible wing structures. The flights marked the end of an era in solar-powered flight research for the 23-year-old craft which is due for retirement shortly.

FY 2005 Performance and Accountability Report 110
Flown by crews from AeroVironment, Inc., owner and builder of the unique experimental aircraft, the Pathfinder–Plus made two low-altitude flights over the northern portion of Rogers Dry Lake at Edwards Air Force Base in California. The first was a three-hour flight on August 31, followed by a more-than two-hour mission on September 14. Both missions flew on a combination of solar and battery power.
NASA completes requirements for remotely operated aerial vehicle In FY 2005, NASA completed and captured requirements for the Predator-B aircraft, an extended-wingspan civil variant of the turboprop-powered military QM-9 Predator B remotely operated aerial vehicle being developed by General Atomics Aeronautical Systems. The systems-level vehicle architecture will address all systems on-board: propulsion, airframe, avionics, flight controls, health management, and mission management. General Atomics will use NASA’s requirements to build the research avionics that will be installed on the Predator in FY 2006 to support major flight experiments in FY 2007. The new aircraft is designed to meet payload, duration, and altitude requirements for NASA’s Earth science missions. It also will serve as a testbed to demonstrate operational reliability and systems redundancy necessary to allow remotely operated aircraft to fly in the national airspace.
Photo caption: The long, slender wings of the General Atomics Altair Predator-B remotely operated aircraft stand out against the bright blue sky during a climatic and environmental monitoring mission conducted in spring 2005. The aircraft was developed by General Atomics under NASA’s Environmental Research Aircraft and Sensor Technology project. In addition to environmental research, NASA uses the Predator-B to validate technologies for high-altitude, long-endurance remotely operated aircraft. (Photo: T. Tschida/NASA)
FY 2005 Annual Performance Goals FY 2004 FY 2003 FY 2002
5AT20 Yellow
Complete flight demonstration of a second generation damage adaptive flight control system. (Vehicle Systems)
none none none
5AT21 Green
Define requirements for a robust, fault-tolerant avionics architecture that supports fully autonomous vehicle concepts. (Vehicle Systems)
none none none
5AT24 Green
Complete laboratory aerodynamic assessment of low-drag slotted wing concept. (Vehicle Systems)
none none none
5AT25 Green
Based on laboratory data and systems analysis, select unconventional engine or power systems for technology development that show highest potential for reducing CO2 emissions and/or enabling advanced air vehicles for new scientific missions. (Vehicle Systems)
none none none
5AT26 Green
Complete initial flight series for validation of improved HALE ROA aero-structural modeling tools used to reduce risk and increase mission success. (Vehicle Systems)
none none none
Performance Shortfalls APG 5AT20: NASA is making good progress in the technical development of second-generation adaptive flight control system software. However, a reduction of $1.25 million in funds impacted the completion of this APG. The result was that NASA delayed the schedule for software delivery and the start of the second-generation flight demonstration. NASA also will reduce the scope of the flight demonstration to limited flight envelope testing and will not demonstrate the full capability of the damage adaptive control system. However, NASA anticipates that this APG will be achieved in FY 2006.
Outcome 12.10: By 2008, develop and demonstrate

FY 2005 Performance and Accountability Report 111
technologies required for routine Unmanned Aerial Vehicle operations in the National Airspace System above 18,000 feet for High-Altitude, Long-Endurance (HALE) UAVs. The FY 2005 rating is Green. The FY 2004 (Outcome 10.5.2) rating was Green.
NASA worked toward routine unmanned vehicle operations in the National Airspace System by finalizing requirements for a cooperative collision avoidance demonstration. The Agency selected a vehicle and equipment and integrated collision avoidance systems into the vehicle.
FY 2005 Annual Performance Goals FY 2004 FY 2003 FY 2002
5AT23 Green
Demonstrate integrated technologies and policies for UAV flight operations above FL400. (Vehicle Systems)
none none none
Outcome 12.11: Reduce the effects of sonic boom levels to permit overland supersonic flight in normal operations. The FY 2005 rating is Green. This Outcome began in FY 2005.
NASA competitively selected industry teams to perform a system study to define the inlet requirements and identify key technologies for a small quiet supersonic vehicle like a supersonic business jet. The Integrated Inlet Propulsion Systems Study compared two different engine cycles: high-bypass ratio and variable cycle as part of the assessment. The key technologies identified greatly enhance the range for this vehicle class with the potential to make it economically viable. NASA also identified key technologies needed to enable a highly-integrated inlet/propulsion system and created technology development plans.
Along with the propulsion activities, NASA researchers conducted a number of flight and system demonstrations to assess methods of demonstrating low-boom–no-boom technologies. (“Boom” refers to the characteristic sound generated by an aircraft traveling in excess of the speed of sound). NASA accomplished many flights in the area of Low Boom testing. NASA also studied the feasibility of repeatedly producing sonic booms at a specific geographic location using a surrogate F-18 aircraft. During 10 flights this year using a diving technique, 45 low booms were produced, all at the testing location.
FY 2005 Annual Performance Goals FY 2004 FY 2003 FY 2002
5AT19 Green
Complete supersonic inlet design requirements study that will identify technology gaps and priorities required for design of future efficient long-range supersonic propulsion systems. (Vehicle Systems)
none none none
Resources NASA’s FY 2005 budgeted cost of performance for Objective 12 was $1.21 billion: $0.15 billion for Outcome 12.1; $0.03 billion for Outcome 12.2; $0.38 billion for Outcome 12.3; $0.13 billion for Outcome 12.4; $0.02 billion for Outcome 12.5; $0.13 billion for Outcome 12.6; $0.16 billion for Outcome 12.9; $0.08 billion for Outcome 12.10; and $0.14 billion for Outcome 12.11.

FY 2005 Performance and Accountability Report 112
Objective 13: Use NASA missions and other activities to inspire and motivate the Nation’s students and teachers, to engage and educate the public, and to advance the scientific and technological capabilities of the Nation.
Why pursue Objective 13? For nearly 50 years, NASA has opened new frontiers for the Nation and the world. The Agency’s landmark journeys in air and space, made possible by scientific excellence and technical innovation, have deepened humankind’s understanding of the universe while yielding down-to-Earth advances in air travel, health care, electronics, computing, and more.
These achievements ultimately share a single source—education. Every person who has contributed to the advancement and strength of the Nation was inspired with a passion to explore and discover. NASA uses its unique mission and vast scientific and technical experience to inspire and motivate America’s next-generation of leaders. The Agency’s education programs develop educational tools and materials around the themes of space exploration, aeronautics, health, engineering, and Earth science to encourage interest and academic achievement in science, technology, engineering, and math. NASA also helps prepare undergraduate, graduate, and post-graduate students for NASA-related careers through opportunities for hands-on experiences like internships, fellowships, and grants.
NASA’s education programs do not stop with students. NASA provides tools and training opportunities for teachers. The Agency collaborates with informal education groups like youth programs, museums, and science centers, to create stimulating programs and exhibits. Through its Web site, special events, publications, and exhibits, NASA also shares the Agency’s mission and discoveries with the public, bringing the world along for the ride as NASA returns to flight, explores distant planets, and gazes into the vast universe.
Photo caption: High-school students conduct an experiment inspired by the Gravity Recovery and Climate Experiment, a joint mission of NASA and DLR, the German Aerospace Agency. NASA develops education and outreach programs to translate its Mission and the Vision for Space Exploration into inspiring and motivational products and opportunities for students, teachers, science and technology professionals, and the general public. (Photo: Texas Space Grant Consortium)
NASA’S PROGRESS AND ACHIEVEMENTS IN FY 2005
Outcome Ratings Under Objective 13, NASA is on track to achieve all five Outcomes (100% Green).
APG Ratings Under Objective 13, NASA achieved all 22 APGs (100% Green).

FY 2005 Performance and Accountability Report 113
Outcome 13.1: Make available NASA-unique strategies, tools, content, and resources supporting the K-12 education community’s efforts to increase student interest and academic achievement in science, technology, engineering, and mathematics disciplines. The FY 2005 rating is Green. This Outcome began in FY 2005.
NASA education programs inspire future space explorers by providing unique learning experiences that encourage students to examine science, technology, engineering, and math (STEM) concepts as they apply to NASA’s diverse and complex missions. These experiences also stimulate student interest in pursuing careers in the STEM fields.
In FY 2005, NASA Explorer Schools served 150 school-based teams led by more than 750 teachers offering students engaging educational experiences and providing teachers with science curricula content for their classrooms and professional development opportunities targeted to their special needs. Explorer School teams consistently rated their Explorer School experiences highly and reported that the program rejuvenated student achievement and interest in STEM subjects.
NASA education program managers also pursue relationships with organizations and institutions that support education initiatives. By the end of FY 2005, NASA had partnerships with coalitions of educators, business leaders, and policy officials in all 50 states. Through these partnerships, NASA served more than 279,000 students and 39,000 teachers and engaged family members in more than 19,000 activities and events.
Photo caption: A NASA education specialist gives students a lesson on technology using a remote-control rover. The lesson was part of NASA’s Explorer Schools program, a unique educational program that reaches elementary to high-school pupils in all 50 states, Puerto Rico, and the District of Columbia. The program partners NASA Centers with school teams composed of students, teachers, and administrators to develop and implement strategic plans for staff and students. The plans promote and support the use of NASA content and programs to address the teams’ local needs in science, technology, engineering, and mathematics education. (Photo: NASA)
FY 2005 Annual Performance Goals FY 2004 FY 2003 FY 2002
5ED1 Green
Increase NASA student participation by 5% above baseline. none none none
5ED2 Green
Increase NASA teacher participation by 5% above baseline. none none none
5ED3 Green
Increase existing NASA-sponsored family involvement activities and existing and potential partners by 5% over baseline.
none none none
5ED4 Green
25% of NASA elementary and secondary programs are aligned with state or local STEM educational objectives.
none none none

FY 2005 Performance and Accountability Report 114
Outcome 13.2: Attract and prepare students for NASA-related careers, and enhance the research competitiveness of the Nation’s colleges and universities by providing opportunities for faculty and university-based research. The FY 2005 rating is Green. This Outcome began in FY 2005.
To prepare the future aerospace workforce, in FY 2005, NASA’s Higher Education Program provided career-enhancement and development opportunities to more than 18,000 faculty members and more than 70,000 students, of whom about 12,000 were at the graduate or post-doctoral level.
First, NASA offered 20 core-funding programs and 35 research awards through the Experimental Program to Stimulate Competitive Research (EPSCoR) Program. Each year, approximately 325 university faculty, 330 graduate students, 200 undergraduate students, and 65 post-doctoral students participate in the EPSCoR Program. Through research awards, EPSCoR provides seed grants at an average of $25,000 each.
Second, the Space Grant Fellowship Program continued to support 52 state-based consortia (one per state, plus the District of Columbia and Puerto Rico) that develop programs in education, research, and public service responsive to their state’s needs (within the guidelines and constraints of the Space Grant Program). This program includes 850 affiliated organizations, 550 colleges and universities, 80 industry affiliates, 40 government affiliates, and 180 non-profit and other educational entities. Each consortium has a mandatory fellowship/scholarship component that offers five-year awards to more than 2,000 students per year (75 percent undergraduate and 25 percent graduate).
Third, the Graduate Student Research Program stimulates research among students pursuing degrees in space and aeronautics disciplines. The program annually offers three-year, $24,000 awards to approximately 300 students representing U. S. accredited colleges and universities. NASA Center and Mission Directorate scientists and engineers select the research opportunities, which may be renewed for a maximum of three years. Of the more than 200 awards made in FY 2005, 91 percent supported doctoral programs and 9 percent supported master’s degrees.
Finally, the Undergraduate Student Research Program provided nearly 75 summer and fall merit-based internships at NASA Centers to encourage undergraduate students in their junior and senior years to pursue NASA-related careers.
Photo caption: Robert Lee Howard, Jr., has had eight different hands-on education appointments at NASA’s Johnson Space Center. The first four were as a participant in the NASA Scholars Program while working toward a bachelor’s in general science from Morehouse College and another in aerospace engineering from the Georgia Institute of Technology. He continued on to NASA’s graduate co-operative program while working on his master’s and Ph.D. NASA’s student programs provide students with valuable learning opportunities while training the Nation’s next generation of science and engineering professionals. (Photo: NASA)
Photo caption: Maricela Villa, a high-school student interested in studying physics in college, poses in front of a microscope in a materials testing laboratory at NASA’s White Sands Test Facility in Las Cruces, New Mexico. In 2005, she and other students participated in the Las Cruces Public Schools Career Education Office and NASA EXCEL Aerospace Science Program at the facility. The semester-long, two-credit program gave students the opportunity to work alongside NASA and contractor aerospace scientists, engineers, and support personnel who directly support space flight. (Photo: NASA)

FY 2005 Performance and Accountability Report 115
FY 2005 Annual Performance Goals FY 2004 FY 2003 FY 2002
5ED5 Green
Establish a NASA-wide baseline of the diversity of NASA-supported students.
4ED8 Green
none none
5ED6 Green
Use existing higher education programs to assist and encourage first time faculty proposers for NASA research and development opportunities.
none none none
5ED7 Green
Establish a baseline of institutions receiving NASA research and development grants and contracts that link their research and development to the institution’s school of education.
none none none
5ED8 Green
Establish a baseline of the number and diversity of students conducting NASA-relevant research.
none none none
Outcome 13.3: Attract and prepare underrepresented and underserved students for NASA-related careers and enhance competitiveness of minority-serving institutions by providing opportunities for faculty and university- and college-based research. The FY 2005 rating is Green. This Outcome began in FY 2005.
NASA created the Minority University Research and Education Program to increase the participation of underrepresented and underserved students in science, technology, engineering, and mathematical disciplines and NASA-related careers, and to enhance the research and academic infrastructure of minority-serving institutions. NASA collects data on the effectiveness of the program on a calendar-year (CY) basis; CY 2004 data is the most current available. In CY 2004, NASA conducted eight technical assistance workshops at minority-serving institutions to provide faculty and students with information on opportunities for grants, scholarships, and internships. More than 5,000 students and faculty attended these workshops.
In CY 2004, students and faculty supported by the Minority University Research and Education Program generated 980 professional publications, made more than 1,100 presentations at professional conferences, and were awarded 11 patents. Supported faculty also submitted 472 research proposals to funding agencies, resulting in 227 awards. In addition, through the Harriett Jenkins Pre-doctoral Fellowship Program, NASA annually awards 20 graduate fellowships. In 2004, NASA received 525 applications for this program, the highest number in the program’s history.
Photo caption: A mock rover shows off its flexibility by gently rolling over students in this photo taken on September 29, 2005. Students from local schools visited NASA’s Jet Propulsion Laboratory during this year’s La Familia Technology Space Day. The event was part of La Familia Technology Week, a National public awareness campaign that informed Hispanic students and parents about the value of science and technology and raised awareness about careers in those fields. NASA strives to ensure that underrepresented and underserved students, teachers, faculty, and researchers participate in NASA education and research opportunities. (Photo: NASA)

FY 2005 Performance and Accountability Report 116
FY 2005 Annual Performance Goals FY 2004 FY 2003 FY 2002
5ED9 Green
Increase NASA underrepresented/underserved student participation by 5% over baseline.
none none none
5ED10 Green
Increase NASA underrepresented/underserved teacher/faculty participation in NASA STEM-related learning environments by 5% over baseline.
none none none
5ED11 Green
Increase the numbers of underserved/underrepresented researchers and minority serving institutions competing for NASA research announcements by 5% above baseline.
none none none
5ED12 Green
Establish a baseline of family involvement in underrepresented/underserved NASA-sponsored student programs.
none none none
Spotlight: First NASA Education Facility Opens on Native American Reservation On June 25, 2005, NASA opened the door to a new era in education with the dedication of its first Science, Engineering, Mathematics, and Aerospace Academy program housed at a Tribal College on a Native American Reservation. John Herrington, the first Native American to walk in space, was among the dignitaries to attend the opening of the Academy at Oglala Lakota College, located on the Pine Ridge Reservation in Kyle, South Dakota.
Through this innovative program, students will have access to unique learning experiences, such as taking a trip to the International Space Station, designing an aircraft, and plotting its flight across the country, via a state-of-the-art, computerized Aerospace Education Laboratory. In addition, the program gave the new Academy a portable planetarium that can be used to teach astronomy throughout the state.
Sponsored by NASA’s Glenn Research Center, in partnership with Oglala Lakota College, the Academy offers three eight-week sessions during the academic year and four one-week sessions during the summer. The middle- and high-school students meet during school, after school, and on Saturday mornings to participate in hands-on sessions that encourage independent, inquiry-based discovery. The Aerospace Education Laboratory also is available, at no cost, to local teachers, faculty members, parents, and other community members.
Photo caption: A teacher helps a student fly high using a flight simulator at the NASA-sponsored Science, Engineering, Mathematics, and Aerospace Academy program at Oglala Lakota College, South Dakota. (Photo: SEEMA/Oglala Lakota College)
Outcome 13.4: Develop and deploy technology applications, products, services, and infrastructure that would enhance the educational process for formal and informal education. The FY 2005 rating is Green. This Outcome began in FY 2005.
NASA’s Learning Technologies Program funds the creation of innovative technologies for teaching science and math. These programs produce valuable software technologies that enhance learning experiences for both school-age children and the general public.

FY 2005 Performance and Accountability Report 117
In FY 2005, NASA Learning Technologies Program continued classroom testing of four immersive technologies: What’s the Difference?, MathTrax, Virtual Lab, and Scientific Visualization Studio/World Wind. These pilots resulted in improvements to all four applications, making them ready for transfer and commercialization in FY 2006.
NASA responded to increase citizen demand for the Agency’s learning services in other ways, too. For example, NASA Educational Technology Services attached metadata to over 200 Agency educational television program descriptions to enhance user Web capabilities and improve search results. In addition, this year NASA tested the Agency’s Digital Learning Network, and NASA’s Central Operation of Resources for Education expanded its collection of video materials for hearing and sight-impaired students.
NASA continues to seek additional project collaborations, partnerships, and funding opportunities for these educational technology initiatives. (The final reports for each project are available at http://learn.arc.nasa.ogv/app.)
Photo caption: A student participating in the Digital Learning Network gives a presentation to an instructor via video. This coordinated digital learning network allows students and educators at the pre-college and university levels across the Nation and around the world to share in the unique NASA experience without having to travel to a NASA Center. (Photo: NASA)
FY 2005 Annual Performance Goals FY 2004 FY 2003 FY 2002
5ED13 Green
Implement 1 new advanced technology application. none none none
5ED14 Green
Evaluate the 50 pilot NASA Explorer Schools, utilizing a design experiment approach.
none none none
5ED15 Green
Develop a plan for establishing a technology infrastructure. none none none
Outcome 13.5: Establish the forum for informal education community efforts to inspire the next generation of explorers and make available NASA-unique strategies, tools, content, and resources to enhance their capacity to engage in science, technology, engineering, and mathematics education. The FY 2005 rating is Green. This Outcome began in FY 2005.
In FY 2004, NASA initiated a new national project called the NASA Explorer Institutes to provide engaging experiences, opportunities, materials, and information to members of the informal education community, including science centers, museums, planetariums, parks, youth groups, and community-based organizations. In FY 2005, NASA funded six workshops and eleven focus groups, all sharing similar goals: improving the public’s understanding and appreciation of science, technology, engineering, and math (STEM) disciplines; establishing linkages that promote new relationships between providers of informal and formal education; providing opportunities to excite youth, particularly those who are underrepresented and underserved, about STEM disciplines; and, expanding STEM informal education programs and activities to communities/locations that have been underserved by such opportunities. Over 300 individuals representing more than 150 informal education organizations participated in these professional-development workshops. And, more than 400 experts from the informal education community participated in the focus groups and reviewed the Institute concept.

FY 2005 Performance and Accountability Report 118
NASA brings aviation wonders to students NASA’ s Dreams of Aviation, an eight minute video featurette, introduces audiences to the topic of aviation and the impact of breakthrough aeronautics technologies on America. To date, this featurette has earned four national awards: Gold Aurora Awards in the categories of Convention/Exhibition and Aerospace; the Silver Crystal Vision Award in the non-broadcast category of Aviation; and the Bronze Telly Award in the category of Government Relations.
In FY 2005, NASA also sponsored the Planetary Aircraft Design Competition during which students developed concepts for planetary flight vehicles serving science and exploration objectives. In the high-school division, four teams (one from Iowa, two from New Jersey, and one from Illinois) tied for first place. Six universities also participated, and NASA invited the winning University of Virginia team and the runner up University of Texas team to present their concepts to the Agency in July 2005.
Finally, NASA is developing Ultra-Efficient Engine Technology through a grant with North Carolina A&T State University. The grant will support student development and research efforts in the areas of aerodynamic simulations, fault diagnosis for propulsion systems, and computational tool development. And, for students in grades K–12, NASA hosted a day of hands-on engineering and science competitions focused on providing a sense of excitement about aeronautics and space while fostering teamwork.
Photo caption: The team shown here, representing two schools from Johannesburg, South Africa, was one of four teams that tied for second place in the high-school division in this year’s Planetary Aircraft Design Competition. (Photo: NASA)
Sharing the Vision for Space Exploration In FY 2005, NASA expanded its outreach activities to reach minority and underrepresented sectors of the public to make them aware of the Vision for Space Exploration.
• In October 2004, NASA displayed an exhibition at the American Association of Retired Persons annual convention that focused on the benefits of the space program, specifically highlighting areas that were applicable to the senior community. NASA experts spoke on topics related to the items highlighted in the exhibit to supplement the exhibition.
• In March 2005, NASA unveiled a “NASA Touches Your Life” Exhibit. The exhibit underscores the extent to which NASA-developed or NASA-sponsored technology has made its way into the lives of all Americans. The exhibit was developed to reach the general public, especially those in underserved, nontraditional communities. NASA unveiled the new exhibit at the National Space Society conference in March, displayed it at NASA Headquarters for the month of June, and used it at the Urban League Convention in July.
• In March 2005, NASA co-sponsored the National Space Society Space Product Development Conference and hosted a track highlighting the benefits of the space program. This track included a series of sessions with panelists who were involved in the development of specific technology, were end users of the technology, or were representatives from industry sectors benefiting from the technology.
• NASA also unveiled a Vision for Space Exploration traveling exhibit in July 2005. The exhibit was displayed at the Summer 2005 National Boy Scouts Jamboree (over 6,000 visitors) and at the NASCAR Brickyard 400.
Photo caption: The Vision for Space Exploration exhibit demonstrates NASA’s short- and long-term goals, covering such subjects as the Shuttle’s return to flight, the Crew Exploration Vehicle, robotic and human missions to the Moon and Mars, and further exploration of the solar system.

FY 2005 Performance and Accountability Report 119
The exhibit features two semi-circular trusses with interchangeable graphic light boxes, audio and video, and six free-standing kiosks for display of models, hardware, and artifacts. (Photo: NASA)
FY 2005 Annual Performance Goals FY 2004 FY 2003 FY 2002
5ED16 Green
Implement Phase 1 of a plan to increase appreciation of the relevance and role of NASA science and technology.
none none none
5ED17 Green
Develop a plan to assess and prioritize high-leverage and critical informal education programs and educational involvement activities.
none none none
5ED18 Green
Develop a plan to assess current NASA professional development programs for relevance to the targeted informal learning environments.
none none none
5AT18 Green
Partner with museums and other cultural organizations and institutions to engage non-traditional audiences in NASA missions.
none none none
5ESA11 Green
Provide in public venues at least 50 stories on the scientific discoveries, the practical benefits, or new technologies sponsored by the Earth Science programs.
4ESA6 Green
none none
5ESS10 Green
Post the most exciting imagery and explanations about Earth Science on the Earth observations/Science Mission Directorate website.
4ESS13 Green
3Y25 Green
2Y24 Green
5RPFS9 Green
Expand outreach activities that reach minority and under-represented sectors of the public, through increased participation in conferences and community events that reflect cultural awareness and outreach. Each fiscal year, increase the previous year baseline by supporting at least one new venue that focuses on these public sectors.
4RPFS10 Green
none none
Spotlight: Smart Skies In the minds of many students, mathematics is usually associated with addition, subtraction, geometry, algebra, and formulas. However, for some students in the San Francisco Bay area, mathematics now conjures up images of airplanes, runways, pilots, and air traffic control towers. These students have experienced “Smart Skies,” one of NASA’s newest math-related educational products.
International mathematics testing shows that U.S. students perform poorly relative to students in other countries on standardized mathematics tests related to solving reality-based problems. To help remedy this, NASA developed Smart Skies, a series of hands-on educational activities related to solving interesting and challenging real-world problems in air traffic control.
The Smart Skies project encourages students to explore and understand mathematics and its applications in daily life using a variety of instructional materials, including instructor-guided paper-and-pencil activities, Web-based simulations, and hands-on simulations. NASA released the paper-and-pencil activities in April on the NASA education portal. Early in 2005, NASA gave students in grades five through nine the opportunity to participate in evaluating the web-based and hands-on simulation activities. Using the Web-based simulator in their classrooms or computer labs, the students learned how to apply their math to solve realistic air traffic problems.
For the hands-on component of the Smart Skies evaluation, students traveled to NASA’s Ames Research Center and assumed the roles of air traffic controllers, and pilots, to solve simulated air traffic problems related to distance, rate of speed, and time. The student pilots moved electronically instrumented model aircraft along a designated route of flight laid out on the floor. Student controllers watched the aircraft movement on a computer screen that displayed speed

FY 2005 Performance and Accountability Report 120
and distance information broadcast from the model aircraft. Students then used the mathematics knowledge learned from the print-based and web-based instructional materials, to determine if and when the airplanes would fly too close to each another. If problems arose, they radioed the student pilots to adjust their speed or route. Both retired and active Federal Aviation Administration air traffic controllers from the Oakland Center volunteered as docents and gave guidance and support to the students.
Photo caption: Students at Crittenden Middle School in Mountain View, California, exercise their math and problem-solving skills during a Smart Skies project, where they become pilots, air-traffic controllers, and NASA scientists in simulated air traffic scenarios. Smart Skies also teaches about the National Airspace System and those involved who make air travel efficient and safe. (Photo: NASA)
Resources NASA’s FY 2005 budgeted cost of performance for Objective 13 was $0.19 billion: $0.02 billion for Outcome 13.1; $0.06 billion for Outcome 13.2; $0.07 billion for Outcome 13.3; $0.01 billion for Outcome 13.4; and $0.02 billion for Outcome 13.5. (Note: Outcome amounts do not add to total due to rounding.)

FY 2005 Performance and Accountability Report 121
Objective 14: Advance scientific knowledge of the Earth system through space-based observation, assimilation of new observations, and development and deployment of enabling technologies, systems, and capabilities, including those with the potential to improve future operational systems.
Why pursue Objective 14? NASA’s space capabilities provide a unique opportunity to observe Earth from above the atmosphere. From this vantage point, satellites can gather data on changes, developments, and processes that cannot be observed fully on the ground. NASA uses satellites in low, medium, and high Earth orbits to help researchers better understand and predict climate change, weather, and natural hazards. Closer to Earth, NASA uses aircraft, including advanced aircraft developed by NASA’s aeronautics programs, to conduct research and monitor natural hazards like wildfires.
NASA partners with the National Oceanic and Atmospheric Administration, the Federal Emergency Management Agency, the Environmental Protection Agency, the U.S. Geological Survey, the U.S. Department of Agriculture, and other government agencies to provide essential services to the Nation: improved weather prediction; disaster preparedness and recovery; environmental protection; resource monitoring and management; Earth science education; and homeland security. Through collaborations and agreements, NASA also shares its Earth system data and observation capabilities with other agencies, universities, and international organizations.
To enable its Earth observation efforts, NASA develops advanced sensors, instruments, and telescopes for use on the Agency’s satellites and aircraft. NASA uses some of these Earth observation technologies to study the atmospheres and topography of other planets, too. The Agency also develops and implements information systems to organize, analyze, and distribute Earth science images and data and to create improved models of different Earth system processes. The goal is to ensure that Earth observation information is thorough, reliable, and accessible to diverse providers and users.
Image caption: In September 2005, the Arctic sea ice coverage shrank to 2.05 million square miles (shown in this artist’s concept), the smallest coverage since satellites began monitoring sea ice in 1978. Arctic sea ice typically reaches its minimum in September, at the end of the summer melt season. During the last four Septembers (2002–2005), sea ice extents have been 20 percent below the mean September sea ice extent for previous years. NASA scientists are studying arctic sea ice to determine if the decreased coverage is due to naturally occurring climate variability or human-influenced climate changes. The scientists used data from NASA’s Nimbus-7 satellite and the Defense Meteorological Satellite Program Special Sensor/Microwave Imager. (Image: NASA)
NASA’S PROGRESS AND ACHIEVEMENTS IN FY 2005
Outcome Ratings Under Objective 14, NASA is on track to achieve both Outcomes (100% Green).
APG Ratings Under Objective 14, NASA achieved or exceeded all 19 APGs: two Blue (11%) and 17 Green (89%).

FY 2005 Performance and Accountability Report 122
NASA did not pursue Outcomes 14.1 or 14.2 in FY 2005.
Outcome 14.3: Develop and implement an information systems architecture that facilitates distribution and use of Earth science data. The FY 2005 rating is Green. This Outcome began in FY 2005.
In the course of advancing knowledge of the Earth–Sun system, NASA uses an information systems architecture that serves the scientific community and helps NASA assess the potential of research results to improve future operational systems. NASA assesses and develops both observational data (primarily from spacecraft) and predictive capability data from models, in cooperation and consultation with Earth science experts. NASA provides full access to these data to help researchers understand and predict climate change, weather, and natural hazards. NASA also benchmarks the use of these data to expand and accelerate economic and social benefits of Earth–Sun system scientific research.
The Earth Observation System Data and Information System (EOSDIS) is a major contribution to accomplishing NASA’s Earth information systems architecture, and a large community now uses data and information products from EOSDIS. The data holdings of EOSDIS are growing at a rate of over 3.5 terabytes per day. (One terabyte equals 1,024 gigabytes or 1 trillion bytes.). At the end of FY 2005, the archives of EOSDIS held over 4 petabytes of data. (One petabyte equals 1,024 terabytes or 1 quadrillion bytes.) To date, users have accessed EOSDIS data over 2.4 million times, and according to a federal survey conducted in 2005, users are satisfied with EOSDIS.
Using data from EOSDIS’s archive at the University of Colorado’s National Snow and Ice Data Center, scientists confirmed that the floating cap of sea ice on the Arctic Ocean shrank in the summer of 2005 to what is probably its smallest size in at least a century of record keeping, continuing a trend toward less summer ice.
The Near Real Time Image Distribution Server (NEREIDS) at the Jet Propulsion Laboratory’s Physical Oceanography Distributed Active Archive Center provides satellite images for sea surface temperature, ocean topography, ocean wind, and land and sea ice. This system provides information that helps fishermen range as much as 2000 miles while making fishing safer and more cost effective.
In FY 2005, NASA began to evolve its distributed Earth System Science data and information system (including EOSDIS) with new information technologies and approaches while engaging the science user community to provide the observational information strategy for Earth information systems of the future. A study team examined several ideas for evolving EOSDIS elements and is preparing an implementation plan for FY 2006. Observational collections are moving “from missions to measurements” as an organizational focus to improve the study of Earth system processes over seasons, years, and decades.
Image caption: NASA has adopted a science-driven and results-oriented planning and information framework, illustrated above, that supports a continuum from science to applications for the public good. (Image: NASA)

FY 2005 Performance and Accountability Report 123
FY 2005 Annual Performance Goals FY 2004 FY 2003 FY 2002
5ESA1 Green
Crosscutting Solutions: Work within the Joint Agency Committee on Imagery Evaluation and the Commercial Remote Sensing Policy Working Group through partnerships with NIMA, USGS, NOAA, and USDA to verify/validate at least two commercial remote sensing sources/products for Earth science research, specifically with respect to land use/land cover observations for carbon cycle and water cycle research.
none none none
5ESA2 Green
National Apps: Benchmark measureable enhancements to at least 2 national decision support systems using NASA results, specifically in the Disaster Management and Air Quality communities. These projects will benchmark the use of observations from 5 sensors from NASA research satellites.
none none none
5ESA3 Green
Crosscutting Solution: Expand DEVELOP (Digital Earth Virtual Environment and Learning Outreach Project) human capital development program to increase the capacity for the Earth science community at a level of 100 program graduates per year and perform significant student-led activities using NASA research results for decision support with representation in 30 states during the fiscal year.
none none none
5ESA4 Green
Crosscutting Solutions: Benchmark solutions from at least 5 projects that were selected in FY03 REASoN program to serve national applications through projects that support decision support in areas such as agriculture, public health, and water quality. These projects will benchmark use of observations from at least 5 sensors from NASA research satellites.
none none none
5ESA5 Green
The DEVELOP (Digital Earth Virtual Environment and Learning Outreach Project) program will advance the capacity of our future workforce with students from at least 20 states working to develop and deliver benchmark results of at least 4 rapid prototype projects using NASA Earth science research results in decision support tools for state, local, and tribal government applications.
none none none
5ESA6 Green
Crosscutting Solutions: Benchmark solutions associated with at least 5 decision support systems that assimilate predictions from Earth system science models (e.g., GISS, GFDL, NCEP, SpoRT, and the Earth Science laboratories).
none none none
5ESA7 Green
National applications: Benchmark enhancements to at least 2 national decision support systems using NASA results, specifically in the Disaster Management, Public Health, and Air Quality communities. These projects will benchmark the use of observations from 5 sensors from NASA research satellites.
none none none
5ESA8 Green
Crosscutting Solutions: Verify and validate solutions for at least 5 decision support systems in areas of national priority associated with the FY03 selected REASoN projects.
none none none
5ESA9 Green
Benchmark the use of predictions from 2 NASA Earth system science models (including the GISS 1200 and NCEP weather prediction) for use in national priorities, such as support for the Climate Change Science Program (CCSP) and Climate Change Technology Program (CCTP) and the NOAA National Weather Service.
none none none
5SEA10 Green
Benchmark the use of observations and predictions of Earth science research results in 2 scenarios assessment tools, such as tools used by the Environmental Protection Agency (specifically in the Community Multi-scale and Air Quality (CMAQ) Improvement Program tools) and the Department of Energy.
none none none

FY 2005 Performance and Accountability Report 124
Outcome 14.4: Use space-based observations to improve understanding and prediction of Earth system variability and change for climate, weather, and natural hazards. The FY 2005 rating is Green. This Outcome began in FY 2005.
NASA’s space-based capabilities and sponsored research contributed to many substantial advances in Earth science over the last year, which will lead to improved predictions of the Earth’s environment.
Weather prediction NASA scientists worked with experimental data from the Atmospheric Infrared Sounder (AIRS) instrument on NASA’s Aqua satellite in collaboration with National Oceanic and Atmospheric Administration (NOAA) scientists at the Joint Center for Satellite Data Assimilation. The AIRS instrument takes three-dimensional infrared pictures of atmospheric temperatures, water vapor, and trace gases. Researchers found that incorporating the instrument’s data into numerical weather prediction models improves the accuracy range of experimental six-day Northern Hemisphere weather forecasts by up to six hours, a four-percent increase. According to the National Weather Service, the AIRS instrument has provided the most significant increase in forecast improvement in this time range of any single instrument since a four-percent increase in forecast accuracy at five or six days normally takes several years to achieve. NOAA has incorporated the instrument data into its National Weather Service operational weather forecasts.
Sea Level Change Earth’s oceans have risen and fallen, and its land ice has shrunk and grown, as Earth has warmed and cooled over time. Sea level changes also are affected by the amount of water stored in lakes and reservoirs and the rising (uplift) and falling (subsidence) of land in coastal regions. Today, as in the past, global sea level has been rising at a rate of nearly two millimeters per year while regional subsidence and uplift continue. What is different today, however, is that tens—perhaps hundreds—of millions of people live in coastal areas that are vulnerable to changes in sea level. It is estimated that a one-meter increase in sea level potentially will impact over 100 million lives and cost hundreds of billions of dollars in the United States alone. NASA and its research partners have been using the TOPEX/Poseidon and Jason satellites to monitor the global sea surface height, as well as measurements from ICESat, that help explain the causes of sea level changes over the past decade.
Recent peer-reviewed research indicates that the greatest contributors to change are the Earth’s glaciers and ice sheets. Three-fourths of the planet’s freshwater, or about 220 feet of sea level, is stored in glaciers and ice sheets. NASA-funded research published in an October 2004 article in Science offers further evidence that ice cover is shrinking much faster than thought, with over half of the recent sea level rise due to the melting of ice from Greenland, West Antarctica’s Amundsen Sea, and mountain glaciers.
Observing the Earth’s Mass Distribution Changes from Space (GRACE) NASA’s Gravity Recovery and Climate Experiment (also known as GRACE) successfully operated for three years and now researchers are beginning to report scientific breakthroughs resulting from the multi-disciplinary nature of GRACE observations.
GRACE is a two-spacecraft joint partnership of NASA and the German Aerospace Center, and the GRACE observations are 100 times better than previous measurements, the first-ever accurate enough to allow for measuring the time variability of the Earth’s gravity. GRACE data reflected mass changes as water redistributed in oceans, atmosphere, and in soil, and NASA-funded

FY 2005 Performance and Accountability Report 125
research found that the shape of the Earth appears to be influenced by significant climate events that cause changes in the mass of water stored in oceans, continents, and atmosphere. Results published in the journal Science show that monthly changes in the distribution of water and ice masses could be estimated by measuring changes in Earth’s gravity field. The GRACE data measured the weight of up to 10 centimeters (four inches) of groundwater accumulations from heavy tropical rains, particularly in the Amazon basin and Southeast Asia. Smaller signals caused by changes in ocean circulation were also visible.
A study led by the mission principal investigator at the University of Texas at Austin showed significant variations in the shape of the Earth, reflected by changes in Earth’s gravity field during the past 28 years, might be linked in part to climate events. The study, published in 2005 in the Journal of Geophysical Research, examined Earth’s oblateness, how much its rounded shape flattens at the poles and widens at the equator, and found that over the past 28 years, two large variations in Earth’s oblateness were connected to strong El Niño Southern Oscillation events. Variations in mass distribution, which caused the change in the gravity field, were predominantly over the continents, with a smaller contribution due to changes over the ocean. The principal discovery, however, is that Earth’s large scale transport of mass is related to long-term global climate changes.
Tracking Arctic ozone Researchers are using validated data from NASA’s Aura satellite to unravel the complex interactions between variability and trends in Arctic stratospheric weather and the high chemical propensity for severe ozone depletion in the Arctic region. Aura’s Microwave Limb Sounder found that by the beginning of March 2005, the ozone depletion had reached 50 percent at some altitudes, the second highest depletion level ever seen in the north polar stratosphere. Aura’s Ozone Monitoring Instrument showed that by mid-March, however, the polar wind patterns shifted, dispersing the ozone-depleted air throughout the Northern hemisphere. Aura data from winter 2004–2005 points to a continuing potential for significant Arctic ozone depletion.
The effects of aerosols on climate change—from modeling to reality The effects of aerosols on climate are not well quantified. However, after modeling the estimates of aerosol distributions and their effect on climate, NASA demonstrated that it is feasible to shift from largely model-based research to increasingly measurement-based research. NASA satellite and ground-based measurements, supplemented by model simulations of global chemical transport, improved scientists’ ability to assess the climate effects of human-made aerosols.
Measuring pollutants around the world In FY 2005, NASA researchers began releasing data from the Aura satellite’s instruments via the Aura Validation Program. Data from the Tropospheric Emission Spectrometer, the Microwave Limb Sounder, and the Ozone Monitoring Instrument are providing new measurements of pollutants and greenhouse gases that will allow scientists to estimate the impact of regional pollution events on global air quality and climate. The Tropospheric Emission Spectrometer is providing the first-ever global measurements of the vertical distribution of pollutants, including ozone, in the lowest part of the atmosphere, the troposphere.
Image caption: These data maps from Aura’s Microwave Limb Sounder depict levels of hydrogen chloride (top), chlorine monoxide (center), and ozone (bottom) at an altitude of approximately 490,000 feet on selected days during the 2004–2005 Arctic winter. The white lines demark the boundary of the winter polar vortex, a wintertime feature of the stratosphere where winds spin counterclockwise above the pole. The maps from December 23, 2004, show conditions shortly before significant chemical ozone destruction began. Based on various analyses of Aura data, NASA researchers participating in the Polar Aura Validation Experiment estimate that there was a maximum local ozone loss of approximately 2 parts per million by volume (approximately 60

FY 2005 Performance and Accountability Report 126
percent) during the period from January 23, 2005, to March 10, 2005, with an average loss of approximately 1.5 parts per million by volume. (Image: NASA)
FY 2005 Annual Performance Goals FY 2004 FY 2003 FY 2002
5ESS1 Blue
Integrate satellite, suborbital, ground-based observations, coupled with laboratory studies and model calculations to assess potential for future ozone depletion in the Arctic. Characterize properties and distributions of clouds and aerosols as they relate to the extinction of solar radiation in the atmosphere. Specific output: first release of validated Aura data. Progress toward achieving outcomes will be validated by external review.
none none none
5ESS2 Green
Improve predictive capabilities of regional models using satellite-derived localized temperature and moisture profiles and ensemble modeling. Progress toward achieving outcomes will be validated by external review.
none none none
5ESS3 Green
Reduce land cover errors in ecosystem and carbon cycle models, and quantify global terrestrial and marine primary productivity and its interannual variability. Specific output: Produce a multi-year global inventory of fire occurrence and extent. Progress toward achieving outcomes will be validated by external review.
4ESS9 Green
3Y23 Green
none
5ESS4 Blue
Reduce land cover errors in ecosystem and carbon cycle models, and quantify global terrestrial and marine primary productivity and its interannual variability. Specific output: Release first synthesis of results from research on the effects of deforestation and agricultural land use in Amazonia. Progress toward achieving outcomes will be validated by external review.
4ESS9 Green
3Y23 Green
none
5ESS5 Green
Reduce land cover errors in ecosystem and carbon cycle models, and quantify global terrestrial and marine primary productivity and its interannual variability. Specific output: Improve knowledge of processes affecting carbon flux within the coastal zone, as well as sources and sinks of aquatic carbon, to reduce uncertainty in North American carbon models. Progress toward achieving outcomes will be validated by external review.
none none none
5ESS6 Green
Enhance land surface modeling efforts, which will lead to improved estimates of soil moisture and run-off. Specific output: launch Cloudsat. Progress toward achieving outcomes will be validated by external review.
4ESS9 Green
3Y23 Green
none
5ESS7 Green
Assimilate satellite/in-situ observations into variety of ocean, atmosphere, and ice models for purposes of state estimation; provide experimental predictions on variety of climatological timescales; determine plausibility of these predictions using validation strategies. Specific output: documented assessment of relative impact of different climate forcings on long-term climate change and climate sensitivities to those various forcings.
4ESS11 Green
3Y18 3Y5 3Y14 Green
2Y18 2Y5 2Y14 Green
5ESS8 Green
Assimilate satellite/in-situ observations into variety of ocean, atmosphere, and ice models for purposes of state estimation; provide experimental predictions on variety of climatological timescales; determine plausibility of these predictions using validation strategies. Specific output: An assimilated product of ocean state on a quarter degree grid.
4ESS11 Green
3Y18 3Y5 3Y14 Green
2Y18 2Y5 2Y14 Green
5ESS9 Green
Advance understanding of surface change through improved geodetic reference frame, estimates of mass flux from satellite observations of Earth’s gravitational and magnetic fields, and airborne and spaceborne observations of surface height and deformation. Progress toward achieving outcomes will be validated by external review.
4ESS11 Green
3Y18 3Y5 3Y14 Green
2Y18 2Y5 2Y14 Green

FY 2005 Performance and Accountability Report 127
Spotlight: NASA Goes “Down Under” for Shuttle Mapping Mission Finale Culminating more than four years of data processing, NASA and the National Geospatial-Intelligence Agency completed in 2005 Earth’s most extensive global topographic map. Researchers began compiling the data, which is extensive enough to fill the U.S. Library of Congress, during the Shuttle Radar Topography Mission in February 2000.
The digital elevation maps encompass 80 percent of Earth’s landmass. They reveal for the first time large, detailed swaths of Earth’s topography previously obscured by persistent cloudiness. The final maps completed for the mission covered Australia and New Zealand in unprecedented uniform detail. They also covered more than 1,000 islands comprising much of Polynesia and Melanesia in the South Pacific, as well as islands in the South Indian and Atlantic oceans. This was the first time many of the islands had their topography mapped.
The mission data benefits scientists, engineers, government agencies, and the public. Its uses are ever growing, ranging from land use planning to “virtual” Earth exploration. The data also will serve as a baseline for monitoring future global change.
Image caption: The Gulf Coast from the Mississippi Delta through the Texas coast is shown in this satellite image from NASA’s Moderate Resolution Imaging Spectroradiometer overlain with data from the Shuttle Radar Topography Mission and the predicted storm track for Hurricane Rita. The prediction from the National Weather Service was published on September 22, 2005, as the hurricane approached shore. At-risk, low-lying terrain along the coast is highlighted using the mission elevation data, with areas within 15 feet of sea level shown in red and within 30 feet in yellow. The image illustrates one of the many ways Shuttle Radar Topography Mission data is used. (Image: NASA/JPL/NGA)
Resources NASA’s FY 2005 budgeted cost of performance for Objective 14 was $1.54 billion. NASA cannot provide FY 2005 budgeted cost of performance information at the Outcome level for this Objective.

FY 2005 Performance and Accountability Report 128
Objective 15: Explore the Earth–Sun system to understand the Sun and its effects on Earth, the solar system, and the space environmental conditions that will be experienced by human explorers, and demonstrate technologies that can improve future operational systems.
Why pursue Objective 15? In ancient times, many cultures worshipped the Sun. They honored it as a source of life and feared the wrath of its scorching heat. Today, scientists know that the Sun is critical to life on Earth, a giant ball of gas that radiates energy and anchors the solar system. Like the Sun worshippers of the past, modern scientists also know that the Sun’s effects are not always kind. Powerful solar flares and coronal mass ejections can disrupt communications and navigation systems, damage satellites, and disable electric power grids. More important, solar disturbances can bombard humans who travel beyond Earth’s protective ionosphere with health-damaging radiation.
In an effort to protect humans and technology from the Sun’s damaging effects, as well as those induced within Earth’s near-space environment, NASA studies the interconnected Earth–Sun system that includes interacting magnetic fields, solar wind, energetic particles, and radiation. NASA’s current and planned missions will provide a holistic view of space weather, from its starting point deep within the Sun step by step to Earth’s surface, as scientists seek answers to fundamental questions: How and why does the Sun vary? How does the Earth system respond? What are the impacts on life and society?
NASA’s space-based missions also provide an early warning system for space weather events. The Advanced Composition Explorer (ACE) and the Solar and Heliospheric Observatory (SOHO) missions offer real-time, uninterrupted views of the Sun from their orbit at the L1 Lagrangian point, a location that is never blocked by Earth or the Moon. These spacecraft spot solar disturbances long before their effects reach Earth, giving civil and military organizations time to enact mitigation plans.
Image caption: NASA’s fleet of Earth–Sun system missions form an integrated observation network of sensors deployed in vantage points from Earth’s ionosphere to deep space. The Solar and Heliospheric Observatory (SOHO), which took this image of the Sun in spring 2005, uses telescopes, spectrometers, and coronagraphs to observe the Sun’s hot atmosphere and its inner and outer coronas, measure changes along its surface and in its interior, and study the energetic particles it emits. (Image: SOHO/ESA/NASA)
NASA’S PROGRESS AND ACHIEVEMENTS IN FY 2005
Outcome Ratings Under Objective 15, NASA is on track to achieve all eight Outcomes (100% Green).
APG Ratings Under Objective 15, NASA achieved 10 of 12 APGs: three Blue (25%), seven Green (59%), one Yellow (8%), and one White (8%).

FY 2005 Performance and Accountability Report 129
Outcome 15.1: Develop the capability to predict solar activity and the evolutiion of solar disturbances as they propagate in the helioisphere and affect Earth. The FY 2005 rating is Green. The FY 2004 (Outcome 1.3.1) rating was Green.
On January 20, 2005, a large solar flare generated the most intense burst of solar radiation in five decades. The flare tripped radiation monitors all over Earth and scrambled detectors on spacecraft only 15 minutes after the first sign of the flare. Researchers now know that such flares are preceded by a rotation of nearby sunspots. This rotation appears to build up magnetic stress that becomes the main source of the energy in the flares. Researchers demonstrated this new finding using data from the Transition Region and Coronal Explorer (or TRACE) and the Solar and Heliospheric Observatory (also known as SOHO), and it represents a major step toward predicting large solar flares.
Understanding solar particles Solar energetic particles are associated with solar flares. Combined observations from the Advanced Composition Explorer (also known as ACE) and SOHO spacecraft are helping scientists understand why high-energy particles coming from the Sun are missing more electrons during solar flares than at other times. NASA researchers found that these high-energy particles do not come from a region of higher temperature within the Sun. Instead, they are accelerated low in the Sun’s atmosphere and then stripped of more electrons through collisions with other particles as they stream outward toward space. By studying the composition and charge of these particles, researchers will understand better the mechanisms that produce solar flares and how to predict them.
SOHO gives insight into coronal mass ejections Coronal mass ejections are explosions in the Sun’s atmosphere, or corona, that emit large quantities of solar particles. This year, NASA researchers made progress in understanding the structure and origin of coronal mass ejections by studying data from the Solar and Heliospheric Observatory (commonly known as SOHO). The researchers used brightness measurements of the solar corona to infer the three-dimensional structure and direction of coronal mass ejections to show that they are dominated by expanding arcades of magnetic loops.
Image caption: Sunspot groups, like this one visible near the right edge of the Sun, are the source of the solar flare eruptions like the one on January 20, 2005. (Image: NASA/ESA/SOHO)
FY 2005 Annual Performance Goals FY 2004 FY 2003 FY 2002
5SEC2 Green
Successfully complete Solar Dynamics Observatory (SDO) Critical Design Review (CDR).
none none none
5SEC3 Green
Successfully complete THEMIS Critical Design Review (CDR). none none none
5SEC6 Green
Successfully demonstrate progress in developing the capability to predict solar activity and the evolution of solar disturbances as they propagate in the heliosphere and affect Earth. Progress towards achieving outcomes will be validated by external review.
4SEC8 Green
3S7 Green
2S7 Green

FY 2005 Performance and Accountability Report 130
Outcome 15.2: Specify and enable prediction of changes to Earth’s radiation environment, ionosphere, and upper atmosphere. The FY 2005 rating is Green. The FY 2004 (Outcome 1.3.2) rating was Green.
Satellite operators consider the “slot” region between Earth’s two major radiation belts to be a safe zone for satellites since the region is swept clean of radiation regularly by lightning-induced wave action. However, new data from the Imager for Magnetopause-to-Aurora Global Exploration (also known as IMAGE), Solar, Anomalous, and Magnetospheric Particle Explorer (also known as SAMPEX), and Polar missions revealed that the slot region often becomes filled with intense radiation during solar storms. The radiation forms in this slot region when the outer boundary of Earth’s plasmasphere (a donut-shaped region near the top of Earth’s atmosphere) is eroded severely by nearby magnetic storms, and lightning-induced wave action is no longer present to scatter the radiation out of the trapping region.
New source for the aurora discovered NASA also discovered a new method by which aurora are formed. Typically, energetic electrons from the Earth’s magnetosphere stream into the atmosphere to form Earth’s aurora, also known as the northern and southern lights. The TIMED and IMAGE missions recently demonstrated a direct connection between aurorae occurring at mid-latitudes and atoms raining down from Earth’s ring current during magnetic storms. This is a new source for aurorae, in addition to the traditional electron precipitation source.
Understanding mysterious flashes in Earth’s atmosphere Terrestrial gamma-ray flashes are short-lived blasts of gamma rays emitted into space from the top of Earth’s atmosphere. In FY 2005, NASA’s Reuven Ramaty High-Energy Solar Spectroscopic Imager (RHESSI) detected some of these mysterious bursts and discovered that they are much more powerful and prevalent than previously thought. A many as 50 flashes occur each day around the world. The gamma rays emitted by these flashes rival those seen from neutron stars and black holes. The mechanism that generates these flashes is still unknown, but researchers theorize that the energy to power the flashes comes from a build-up of electric charges from lightning storms.
Image caption: This illustration shows the donut-shaped Van Allen Radiation Belt around Earth. NASA research shows that a “safe zone” near the center of the Belt, near where the purple, ear-like shapes transition to white regularly fills with intense radiation. The red line extending toward the bottom of the illustration shows the orbit of the Imager for Magnetopause-to-Aurora Global Exploration (commonly known as IMAGE) spacecraft, which was used to confirm the theory about the safe zone. (Image: NASA/T. Bridgman)
FY 2005 Annual Performance Goals FY 2004 FY 2003 FY 2002
5SEC4 White
Complete Announcement of Opportunity (AO) selection for Geospace Missions far ultraviolet Imager.
none none none
5SEC7 Green
Successfully demonstrate progress in specifying and enabling prediction of changes to Earth’s radiation environment, ionosphere, and upper atmosphere. Progress towards achieving outcomes will be validated by external review.
4SEC9 Green
3S8 Green
2S8 Green

FY 2005 Performance and Accountability Report 131
Performance Shortfalls APG 5SEC4: The Announcement of Opportunity selection for the first Geospace mission did not occur. A delay in releasing the Announcement of Opportunity resulted from a decision to reverse the order of Geospace missions. The Radiation Belt Mapper mission will be launched first, due to the particular relevance radiation physics has to the Vision for Space Exploration. NASA released the Announcement of Opportunity on August 23, 2005, with selection scheduled for mid-FY 2006.
Outcome 15.3: Understand the role of solar variability in driving space climate and global change in Earth’s atmosphere. The FY 2005 rating is Green. The FY 2004 (Outcome 1.3.2) rating was Green.
Understanding clouds Polar mesospheric clouds are the highest clouds on Earth. They usually form over the polar caps at altitudes greater than 50 miles when temperatures fall below minus 350 degrees Fahrenheit. Over the past 40 years, polar mesospheric clouds have gotten brighter—a likely indicator of long-term global climate change. In FY 2005, NASA researchers developed a comprehensive model that predicts the global variability of polar mesospheric clouds. The model accurately predicts, as confirmed by observations, more clouds in the Northern Hemisphere than in the Southern Hemisphere and more clouds during solar minimum compared with solar maximum. NASA also discovered that large rockets and the Space Shuttle contribute considerable quantities of water to the upper mesosphere through their exhaust plumes. These plumes leave long-lasting clouds in the lower thermosphere that are transported from their launch sites across the equator to the Antarctic where they become an additional source of polar mesospheric clouds. Therefore, the increasing brightness of polar mesospheric clouds could be due, at least in part, to discharge from rocket launches. Researchers will use these results to predict longer-term changes that might arise from natural and human-induced changes.
NASA measures the Sun’s effects on Earth’s ozone NASA researchers using the Upper Atmosphere Research Satellite (UARS) found evidence of a process that links precipitation of solar protons (from solar events like solar flares) deep into the polar cap with polar stratospheric ozone depletion during solar proton storms. The satellite found that the solar protons caused ozone depletions of up to 5 to 8 percent in the southern polar upper stratosphere lasting for days after the storm period.
A NASA first in weather observation Researchers have assumed that vertical winds would move upwards over stable auroral arcs (phenomena seen in conjunction with auroral displays like the Aurora Borealis) due to heating. However, new measurements reveal downward-moving winds instead. A NASA sounding rocket, guided in a largely horizontal trajectory through a region generally inaccessible to weather balloons or satellites, revealed this surprise finding.
FY 2005 Annual Performance Goals FY 2004 FY 2003 FY 2002
5SEC8 Green
Successfully demonstrate progress in understanding the role of solar variability in driving space climate and global change in Earth’s atmosphere. Progress towards achieving outcomes will be validated by external review.
4SEC10 Blue
none none

FY 2005 Performance and Accountability Report 132
Outcome 15.4: Understand the structure and dynamics of the Sun and solar wind and the origins of magnetic variability. The FY 2005 rating is Green. The FY 2004 (Outcome 5.6.1) rating was Green.
Understanding solar flares Gamma- and X-ray observations of solar flares from NASA’s Reuven Ramaty High-Energy Solar Spectroscopic Imager (RHESSI) revealed significant differences in the acceleration of electrons, protons, and heavier ions as they leave the Sun. Surprisingly, two of the largest flares revealed that electrons and ions release their energies in different locations separated by about 12,500 miles on the Sun’s surface. These discoveries will help researchers understand where and how these different particle species are accelerated in solar flares.
Understanding the solar wind NASA researchers found that solar magnetic and atmospheric structures associated with fast solar wind speeds extend well below the solar corona (the Sun’s atmosphere), at least as far down as the chromosphere, the layer just above the “surface” of the Sun. They reached this conclusion by studying the time that sound waves take to travel between two layers of the lower solar atmosphere as seen by the Transition Region and Coronal Explorer (commonly known as TRACE) and the Advanced Composition Explorer (commonly known as ACE).
Researchers used data from the Ulysses mission to resolve the structure of the transition between fast and slow solar wind. Fast solar wind emanates from solar coronal holes and travels steadily at speeds between 600 and 800 kilometers per second. Solar wind is slower, denser, and more variable, exhibiting speeds between 200 and 600 kilometers per second with daily fluctuations. The slow solar wind’s location of origin on the Sun is less well known. Scientists have discovered a fairly wide four-degree transition between these two types of solar wind, now referred to as the coronal hole boundary layer. Not understanding the structure of this coronal hole boundary had been a critical impediment to understanding the physical origins of fast and slow solar wind. The Ulysses mission also discovered that the continuous motion of magnetic fields associated with these coronal hole boundaries deforms the general structure of the interplanetary magnetic field. Because of these discoveries, researchers are revising their fundamental understanding of the magnetic field that extends from the Sun and permeates the solar system.
Measurements from the Advanced Composition Explorer (commonly known as ACE) also provided the first direct evidence that magnetic reconnection, a phenomena in which magnetic fields break apart and then reconnect to release enormous amounts of energy and radiation, can occur in the solar wind itself. Observations revealed the physical nature of the plasma jets produced by the reconnection process and demonstrated that reconnection occurs frequently in the solar wind.
Image caption: Researchers measured areas of the Sun’s upper atmosphere (shown approximately by the white outlines on the full Sun images) using observations by the TRACE satellite of a region with strong, closed magnetic field on July 7, 2003 (top), and another region with weaker, open magnetic field on September 18, 2003 (bottom). The areas in red in the top “time difference” image show a shallow, dense chromosphere beneath an area with slow, dense solar wind outflow. The areas in blue in the bottom image show a deep, less dense chromosphere below a “coronal hole” with fast, tenuous solar wind outflow. From such information on the chromosphere’s structure, the researchers have been deriving an understanding of a continuous range of solar wind speeds. (Full Sun images: SOHO, ESA/NASA; images on the right: The Astrophysical Journal, Univ. of Chicago Press)

FY 2005 Performance and Accountability Report 133
FY 2005 Annual Performance Goals FY 2004 FY 2003 FY 2002
5SEC1 Yellow
Complete Solar Terrestrial Relations Observatory (STEREO) instrument integration.
none none none
5SEC9 Blue
Successfully demonstrate progress in understanding the structure and dynamics of the Sun and solar wind and the origins of magnetic variability. Progress towards achieving outcomes will be validated by external review.
4SEC11 Green
3S7 Green
2S7 Green
Performance Shortfalls APG 5SEC1: Instrument integration for the Solar Terrestrial Relations Observatory (also known as STEREO) was not completed. All U.S. instruments have been integrated on both spacecraft. The two Heliospheric Imager (HI) instruments being provided by an international partner remain to be integrated. The HI-A instrument was integrated in early October 2005. HI-B delivery is planned for November 2005.
Outcome 15.5: Determine the evolution of the heliosphere and its interaction with the galaxy. The FY 2005 rating is Green. The FY 2004 (Outcome 5.6.2) rating was Blue.
NASA is investigating the nature of the solar system’s interaction with its immediate interstellar neighborhood through observations of the flow of interstellar hydrogen and helium through the solar system. Researchers used data from the Advanced Composition Explorer (ACE), the Extreme Ultraviolet Explorer, the Solar and Heliospheric Observatory (SOHO), and Ulysses to show how interstellar helium penetrates close to the Sun and how this gas scatters solar ultraviolet light, produces ions, and joins with the solar wind. The Cassini spacecraft provided the first in situ observations to confirm the “interstellar hydrogen shadow” where hydrogen atoms streaming from the local interstellar medium are depleted in the region creating a shadow behind the Sun relative to the local interstellar flow. In addition, by looking at the difference between the directions of interstellar hydrogen and helium flowing into the solar system, researchers now have a clear indication of the nature of the magnetic field in interstellar space.
Voyager at the edge of the solar system In FY 2005, NASA’s Voyager 1 spacecraft entered the solar system’s final frontier and became the farthest-traveled man-made object at nearly four billion miles beyond Pluto’s orbit. On December 16, 2004, Voyager 1 entered the heliosheath, a region between the edge of the solar system and interstellar space. Voyager 1 continues to gather data and now is recording events unlike any encountered before in the mission’s 26-year history.
Image caption: The Voyager 1 spacecraft, shown here in an artist’s concept (inset), has entered the heliosheath, the turbulent edge of the solar system near where the Sun’s influence ends. As the heliosphere plows through interstellar space, a bow shock forms, much as forms in front of a boulder in a stream. The larger image, taken by the Hubble Space Telescope in February 1995, shows an arcing, graceful bow shock about half a light-year across created by wind from the star L.L. Orion’s colliding with the Orion Nebula flow. Voyager’s are the first in situ measurements of a stellar bow shock. (Image: STScI/AURA; Inset: NASA)
FY 2005 Annual Performance Goals FY 2004 FY 2003 FY 2002
5SEC10 Blue
Successfully demonstrate progress in determining the evolution of the heliosphere and its interaction with the galaxy. Progress towards achieving outcomes will be validated by external review.
4SEC12 Blue
none none

FY 2005 Performance and Accountability Report 134
Outcome 15.6: Understand the response of magnetospheres and atmospheres to external and internal drivers. The FY 2005 rating is Green. The FY 2004 (Outcome 5.6.2) rating was Green.
NASA satellites give insight into water loss from Earth’s atmosphere In FY 2005, researchers observed oxygen flowing from Earth’s atmosphere and gained new insight into the processes responsible for water loss from Earth’s atmosphere using data gathered by the Fast Auroral Snapshot Explorer (commonly called FAST), IMAGE, and Polar missions. The observations revealed a number of phenomena connected to water loss from Earth’s atmosphere: the outflows of water operate differently during the day and night; large geomagnetic storms influence these outflows; and they are enhanced when the interplanetary magnetic field points southward.
Cracking of Earth’s protective shell The four Cluster spacecraft provided clear evidence for the presence of fully-developed vortices that can transport solar wind plasma into the magnetosphere. This confirms theoretical predictions that solar wind plasma flowing along the flanks of the magnetosphere might be capable of exciting Kelvin–Helmholtz plasma instabilities, a special type of plasma mode capable of allowing plasma from the solar wind to penetrate the magnetosphere, Earth’s protective layer.
Auroral radios go quiet Researchers from the Geotail mission, a joint endeavor of NASA and Japan’s Institute of Space and Astronautical Science, found that the intense radio emissions caused by aurora disappear during magnetic storms. This surprising disappearance occurs when unusually large plasma sheet densities within the Earth’s magnetosphere are present. Plasma is the fourth state of matter, where electrons are no longer trapped in orbit around an atom’s nucleus. Earth’s plasma sheet extends down the magnetotail, part of Earth’s protective magnetic field, dividing the two lobes of Earth’s magnetic field. Researchers theorize that unusual densities in Earth’s plasma sheet disrupt the process that normally generates the intense radio emissions.
FY 2005 Annual Performance Goals FY 2004 FY 2003 FY 2002
5SEC11 Green
Successfully demonstrate progress in understanding the response of magnetospheres and atmospheres to external and internal drivers. Progress towards achieving outcomes will be validated by external review.
4SEC13 Green
none none
Spotlight: NASA Discovers the Consequences of Earth’s Non-symmetric Aurora Thanks to observations from the ground and satellites in space, scientists know that the North and South Poles light up at night with aurora because of magnetic storms induced by the solar wind, electrified gas continually flowing outward from the Sun at high speed. Aurora are created when charged particles become energized by storms within Earth’s magnetosphere, and crash into the upper atmosphere, setting off a beautiful light display over the poles. NASA and university scientists studying Earth’s northern and southern auroras were pleasantly surprised to discover the extent to which they do not mirror each other.
According to scientists, some of the new differences appear to be what occurs between the solar wind and Earth’s protective magnetic field. From spacecraft observations made in October 2002,

FY 2005 Performance and Accountability Report 135
scientists noticed that these circular bands of aurora shift in opposite directions to each other depending on the orientation of the Sun’s magnetic field, called the interplanetary magnetic field, which travels toward Earth with the solar wind flow. They also noted that the aurora shift in opposite directions to each other depending on how far Earth’s northern magnetic pole is leaning toward the Sun.
Following a change in the orientation of the interplanetary magnetic field, the researchers noticed that the southern aurora shifted toward the Sun while the northern aurora remained in about the same location. They believe the southern aurora moved because the solar wind was able to penetrate into the magnetosphere in the southern hemisphere, but not in the northern hemisphere. What was most surprising was that both the northern and southern auroral ovals were leaning toward the dawn (morning) side of Earth for this event. The scientists suspect the leaning may be related to “imperfections” of Earth’s magnetic field.
Image caption: This series of near-simultaneous auroras were observed on October 23, 2002. Observations were made of the northern (left) and southern (right) hemispheres by the IMAGE and Polar satellites, respectively. White dots indicate the geographic poles. Scientists analyzing the spacecraft images found that the auroras shift depending on the “tilt” of Earth’s magnetic field toward the Sun and conditions in the solar wind. (Image: NASA)
Outcome 15.7: Discover how magnetic fields are created and evolve and how charged particles are accelerated. The FY 2005 rating is Green. The FY 2004 (Outcome 5.7.1) rating was Green.
Understanding the release of energy within our solar system Plasmas throughout the universe release enormous amounts of energy through the conversion of energy stored in magnetic fields into heated and flowing plasmas and energetic particles. NASA made significant progress in understanding these processes, enabling new simulations of the Sun–Earth system. The RHESSI spacecraft obtained X-ray evidence that reconnection of magnetic fields in the solar corona is the primary initiating mechanism by which particles are heated to high temperatures during solar flares. And, observations from the Cluster mission, together with simulations, showed that the particles in reconnection sites form electron “holes” containing strong electric fields, energetic electron beams, and large waves capable of accelerating plasma to high energies.
NASA satellites catch a glimpse of a record stellar flare Instruments onboard NASA’s RHESSI and Wind spacecraft caught a glimpse of a giant stellar flare more luminous than any previously observed. Originating in the constellation Sagittarius, the flare released as much energy in its first 0.02 seconds as the Sun radiates in a quarter of a million years. The event unveiled the source of such short-duration hard x-ray radiation bursts to be extragalactic magnetars, a special kind of neutron star. The magnetic fields of these special neutron stars rotate quickly, twist, then break and reconnect in a process that sends trapped particles flying out from the star, annihilating each other in an explosion of gamma rays.
Image caption: An artist conception of the SGR 1806-20, a magnetar that produced a flare brighter than anything detected beyond the solar system. The bright lines depict magnetic field lines rotating out and reconnecting, spinning out trapped positrons and electrons. The positrons and electrons destroy each other, producing hard gamma rays that can be detected by spacecraft like RHESSI. (Image: NASA)

FY 2005 Performance and Accountability Report 136
FY 2005 Annual Performance Goals FY 2004 FY 2003 FY 2002
5SEC12 Blue
Successfully demonstrate progress in discovering how magnetic fields are created and evolve and how charged particles are accelerated. Progress towards achieving outcomes will be validated by external review.
4SEC14 Green
none none
Outcome 15.8: Understand coupling across multiple scale lengths and its generality in plasma systems. The FY 2005 rating is Green. The FY 2004 (Outcome 5.7.2) rating was Green.
Wave processes are important across all plasma systems NASA made significant progress in understanding the space plasma waves that are the principals in many important space processes like particle acceleration and the scattering of particles into new regions. NASA’s IMAGE spacecraft provided direct verification that wave-particle interactions in Earth’s inner magnetosphere play a central role in the longevity of the near-Earth space radiation environment. The Cluster mission showed that some types of disruptive turbulence in the solar wind are kinetic Alfvén mode waves, a special type of plasma mode that can be damped out quickly by colliding solar wind electrons. And, contrary to earlier beliefs, researchers demonstrated that ultra low frequency wave turbulence that can affect over-the-horizon radar communication, can be stimulated solely within Earth’s ionosphere without the need for special conditions to exist deeper in space.
Rare encounters The Ulysses spacecraft made an unplanned crossing through the distant tail of a large comet and detected particles from the comet that were embedded in a fast moving coronal mass ejection from the Sun. The event is both rare and valuable for cometary studies and for understanding how particles can be transported through interplanetary space. Also, for the first time since space observations were possible, the planet Venus passed between Earth and the Sun. This once-in-122-year opportunity allowed NASA’s TRACE, SOHO, SORCE, and other NASA spacecraft to study Venus’ atmosphere, aiding the development of new techniques for the detection of extrasolar planets while supplying real-time viewing for the public.
FY 2005 Annual Performance Goals FY 2004 FY 2003 FY 2002
5SEC13 Green
Successfully demonstrate progress in understanding coupling across multiple scale lengths and its generality in plasma systems. Progress towards achieving outcomes will be validated by external review.
4SEC15 Green
none none
Resources NASA’s FY 2005 budgeted cost of performance for Objective 15 was $0.75 billion. NASA cannot provide FY 2005 budgeted cost of performance information at the Outcome level for this Objective.

FY 2005 Performance and Accountability Report 137
Objective 17: Pursue commercial opportunities for providing transportation and other services supporting International Space Station and exploration missions beyond Earth orbit. Separate to the maximum extent practical crew from cargo.
Why pursue Objective 17? Since the beginning of the U.S. space program, NASA has partnered with industry to develop, build, and operate space transportation vehicles. NASA will continue this partnership to transport crew and cargo to and from the International Space Station and to develop and fly the vehicles that will take astronauts to the Moon, Mars, and beyond.
The benefit of partnerships is that NASA gets access to a wider variety of technologies than the Agency could develop in-house. NASA also can select the specific technologies and services that best fit the Agency’s goals, schedules, and budget constraints.
In addition to partnerships, NASA may purchase from commercial providers launches to the Station that will meet or accelerate the Station completion schedule. In return, commercial providers have the opportunity to further develop technologies and services, like launch services for the satellite communications industry, which they could not afford without government support or would not pursue without the incentive of industry competition. This helps stimulate the commercial space industry while helping NASA achieve the Vision for Space Exploration.
Image caption: In September 2005, NASA announced its plans for a next-generation space transportation system, shown here in an artist’s concept. Lockheed Martin Corporation and the team of Northrop Grumman Corporation and the Boeing Company will compete to build the Crew Exploration Vehicle, which would sit atop the Shuttle-derived, heavy-lift Crew Launch Vehicle. (Image: John Frassanito and Associates)
NASA’S PROGRESS AND ACHIEVEMENTS IN FY 2005
Outcome Ratings NASA is on track to achieve the Outcome under Objective 17 (100% Green).
APG Ratings NASA made significant progress toward achieving the APG under Objective 17 (100% Yellow).
Outcome 17.1: By 2010, provide 80 percent of optimal ISS up-mass, down-mass, and crew availability using non-Shuttle crew and cargo services. The FY 2005 rating is Green. This Outcome began in FY 2005.
This year, NASA issued a Call for Improvement to the Crew Exploration Vehicle contractors that included requirements for cargo delivery services to the International Space Station. The Agency is developing a set of requirements for unpressurized cargo to support Station logistics and re-supply, while seeking strategies using commercial capabilities to meet Station requirements. These capabilities must be available to meet Station supply needs after the Shuttle’s retirement.
Image caption: During 2005, NASA announced its plan to develop a heavy-lift launch vehicle, shown here in an artist’s concept. This vehicle would deliver cargo and crew, with modifications,

FY 2005 Performance and Accountability Report 138
to Earth orbit. NASA also is developing a smaller, crew-rated launch vehicle. Both would provide the up-mass NASA needs to pursue the Vision for Space Exploration after the Shuttle is retired in 2010. (Image: John Frassanito and Associates)
FY 2005 Annual Performance Goals FY 2004 FY 2003 FY 2002
5ISS7 Yellow
Baseline a strategy and initiate procurement of cargo delivery service to the ISS.
none none none
Resources NASA’s 2005 budgeted cost of performance for Objective 17 is $0.00 billion.

FY 2005 Performance and Accountability Report 139
Objective 18: Use U.S. commercial space capabilities and services to fulfill NASA requirements to the maximum extent practical and continue to involve, or increase the involvement of, the U.S. private sector in design and development of space systems.
Why pursue Objective 18? As missions move further into the solar system, NASA will rely more heavily on the private sector to provide supporting technologies and services. Through joint agreements, collaborations, and Centennial Challenge prizes for specific accomplishments that advance robotic and human exploration goals, NASA will expand its pool of creative thinkers and acquire the latest technologies at a competitive price.
To stimulate private sector participation, NASA has innovative partnership and commercialization programs that encourage companies to develop technologies and capabilities both for NASA and for commercial users. These programs also help companies transform unique NASA capabilities into products to benefit the public. The programs and initiatives are beneficial for all involved: NASA acquires valuable capabilities; the private sector is invigorated by increased competitiveness; small businesses gain visibility by partnering with the world’s largest civil space organization; and the public benefits from the transfer of advanced NASA-derived technologies.
Photo caption: In the early 1990s, Quantum Devices, Inc., began developing high-intensity, solid-state, light-emitting-diode lighting systems for NASA Space Shuttle plant growth experiments. In the late 1990s, NASA awarded the same company several Small Business Innovative Research contracts to investigate the effectiveness of the broad-spectrum diodes in medical applications. Since then, Quantum Devices, Inc., and the Medical College of Wisconsin have transitioned this space technology into an FDA-approved, non-invasive medical device, shown in the picture, that provides temporary relief from minor muscle and joint pain. (Image: QDI)
NASA’S PROGRESS AND ACHIEVEMENTS IN FY 2005
Outcome Ratings NASA is on track to achieve the Outcome under Objective 18 (100% Green).
APG Ratings NASA achieved the APG under Objective 18 (100% Green).
Outcome 18.1: On an annual basis, develop an average of at least five new agreements per NASA Field Center with the Nation’s industrial and other sectors for transfer out of NASA developed technology. The FY 2005 rating is Green. This Outcome began in FY 2005.
Data available as of October 21, 2005, shows that NASA Field Centers signed 61 partnership agreements with industrial and other sectors for dual use development transfer-in of technology to NASA. NASA Centers also signed 37 license agreements for transfer-out of NASA technology, for a total of at least 98 technology transfer agreements for FY 2005.

FY 2005 Performance and Accountability Report 140
FY 2005 Annual Performance Goals FY 2004 FY 2003 FY 2002
5HRT18 Green
Complete 50 technology transfer agreements with the U.S. private sector for the transfer of NASA technologies, through hardware licenses, software usage agreements, facility usage agreements, or Space Act Agreements.
4HRT6 Green
none none
Spotlight: GlobalFlyer makes history with help from NASA Steve Fossett and the experimental aircraft, Virgin Atlantic GlobalFlyer, made history in 2005 by safely completing the first solo, non-stop, non-refueled around-the-world airplane trip—with help from some NASA technology.
The flight tested NASA’s advanced, experimental Tracking and Data Relay Satellite System transceiver, called the Low Power Transceiver, developed by NASA as a flexible, lower-cost way to relay information to and from spacecraft. NASA’s transceiver allowed GlobalFlyer’s mission control to communicate with Fossett for almost three days of flight through a live video connection.
NASA also loaned GlobalFlyer a Personal Cabin Pressure Monitor, a device invented by a NASA engineer that alerts pilots to reduced cabin pressure and oxygen deprivation. During those conditions, pilots can feel like they are functioning normally, while actually their mental capacity quickly diminishes. This is quickly followed by unconsciousness. Because Fossett’s cockpit was too loud for an alarm, NASA engineers modified the device to vibrate to signal a problem.
Photo caption: On March 3, 2005, the Virgin Atlantic GlobalFlyer experimental aircraft completed the first solo, non-stop, non-refueled airplane flight around the world. On that historic day, Fred Gregory, acting NASA Administrator (center), and Vic Labacqz, NASA’s Associate Administrator for Aeronautics (left), received a tour of the aircraft from GlobalFlyer Crew Chief Philip Grassa. (Photo: K. Peppard/FAA)
Resources NASA’s FY 2005 budgeted cost of performance for Objective 18 was $0.05 billion, all of which was allocated to Outcome 18.1.

FY 2005 Performance and Accountability Report 141
Efficiency Measures In addition to tracking and reporting performance on NASA’s 18 long-term Objectives, NASA also monitors and reports on the Agency’s performance in a number of management goals called Efficiency Measures. These measures are not unique to NASA. They are organizational efficiency measures similar in purpose to the sound planning and management principles, practices, and strategies of all well-run organizations, and they are critical to NASA’s achievement of the Agency’s Objectives, Outcomes, and APGs.
NASA’s Efficiency Measure APGs are organized according to the Agency’s 12 Budget Themes (e.g., Solar System Exploration, Education Programs, Space Shuttle, etc.) to emphasize individual program area accountability.
In Efficiency Measures, NASA achieved 17 out of 23 APGs: 17 Green (74%), four Yellow (17%), and two Red (9%).
NASA’s Progress and Achievements in FY 2005 NASA’s progress in the Agency’s Efficiency Measures is documented in the following tables. The NASA Performance Improvement Plan includes explanations for FY 2005 Efficiency Measure APGs that were rated Yellow, Red, or White.
FY 2005 Performance Measure FY 2004 FY 2003 FY 2002
Solar System Exploration
5SSE15 Yellow
Complete all development projects within 110% of the cost and schedule baseline.
4SSE1 Yellow
none none
5SSE16 Green
Deliver at least 90% of scheduled operating hours for all operations and research facilities.
none none none
5SSE17 Green
At least 80%, by budget, of research projects will be peer-reviewed and competitively awarded.
4SSE2 Green
none none
5LE8 Green
The Robotic Lunar Exploration Program will distribute at least 80% of its allocated procurement funding to competitively awarded contracts.
none none none
The Universe
5ASO13 Green
Complete all development projects within 110% of the cost and schedule baseline.
4ASO1 White
none none
5ASO14 Yellow
Deliver at least 90% of scheduled operating hours for all operations and research facilities.
none none none
5ASO15 Green
At least 80%, by budget, of research projects will be peer-reviewed and competitively awarded.
4SEU2 4ASO2 Green
none none

FY 2005 Performance and Accountability Report 142
FY 2005 Performance Measure FY 2004 FY 2003 FY 2002
Earth-Sun System
5SEC14 Red
Complete all development projects within 110% of the cost and schedule baseline.
4ESS1 Green
none none
5SEC15 Yellow
Deliver at least 90% of scheduled operating hours for all operations and research facilities.
none none none
5SEC16 Green
At least 80%, by budget, of research projects will be peer-reviewed and competitively awarded.
4ESA8 Green
none none
Constellation Systems
5TS6 Green
Distribute at least 80% of allocated procurement funding to competitively awarded contracts, including continuing and new contract activities.
4TS5 Green
none none
Exploration Systems Research and Technology
5HRT15 Green
Distribute at least 80% of allocated procurement funding to competitively awarded contracts, including continuing and new contract activities.
4HRT13 Green
none none
Human Systems Research and Technology
5BSR18 Green
Complete all development projects within 110% of the cost and schedule baseline.
4BSR18 Green
none none
5BSR19 Green
Deliver at least 90% of scheduled operating hours for all operations and research facilities.
4RPFS11 Green
none none
5BSR20 Green
At least 80%, by budget, of research projects will be peer-reviewed and competitively awarded.
4BSR19 4PSR11 Green
none none
Aeronautics Technology
5AT28 Red
This Theme will complete 90% of the major milestones planned for FY 2005.
4AT3 Green
none none
Education Programs
5ED19 Green
At least 80%, by budget, of research projects will be peer-reviewed and competitively awarded.
4ED24 Green
none none
International Space Station
5ISS8 Green
Complete all development projects within 110% of the cost and schedule baseline.
4ISS7 Green
none none
5ISS9 Green
Deliver at least 90% of scheduled operating hours for all operations and research facilities.
none none none

FY 2005 Performance and Accountability Report 143
FY 2005 Performance Measure FY 2004 FY 2003 FY 2002
Space Shuttle
5SSP4 Yellow
Complete all development projects within 110% of the cost and schedule baseline.
4SSP5 Green
none none
5SSP5 Green
Deliver at least 90% of scheduled operating hours for all operations and research facilities.
none none none
Space and Flight Support
5SFS21 Green
Complete all development projects within 110% of the cost and schedule baseline.
4SFS14 Green
none none
5SFS22 Green
Deliver at least 90% of scheduled operating hours for all operations and research facilities.
4RPFS11 Green
none none

FY 2
005
Per
form
ance
and
Acc
ount
abilit
y R
epor
t 14
4
NA
SA
’s P
erfo
rman
ce Im
pro
vem
ent
Pla
n Th
e fo
llow
ing
tab
le r
epor
ts o
n A
PG
s th
at N
AS
A w
as u
nab
le t
o ac
hiev
e fu
lly in
FY
200
5 an
d O
utco
mes
tha
t NA
SA
may
not
or
will
not
achi
eve
by t
he
Out
com
e’s
targ
eted
com
ple
tion
dat
e. T
he t
able
is o
rgan
ized
by
Str
ateg
ic O
bje
ctiv
e. F
or e
ach
per
form
ance
sho
rtfa
ll, t
he t
able
incl
udes
an
exp
lana
tion
of t
he s
pec
ific
per
form
ance
pro
ble
m, t
he r
easo
n(s)
for
less
tha
n fu
lly s
ucce
ssfu
l per
form
ance
, and
NA
SA
’s p
lan
and
sche
dul
e to
ach
ieve
or
dis
cont
inue
the
Out
com
e or
AP
G.
Ob
ject
ive
Per
form
-anc
e M
easu
re
Des
crip
tion
Rat
ing
Exp
lana
tion
/ d
escr
iptio
n of
whe
re a
p
erfo
rman
ce g
oal
was
no
t m
et
Why
the
goa
l was
no
t m
et
Pla
ns a
nd s
ched
ules
fo
r ac
hiev
ing
the
goa
l
If th
e g
oal i
s im
pra
ctic
al o
r in
feas
ible
, why
tha
t is
th
e ca
se a
nd w
hat
actio
n is
rec
om
men
ded
2 A
PG
5M
EP
5 S
ucce
ssfu
lly c
ompl
ete
the
Mis
sion
Con
cept
Rev
iew
an
d P
MS
R fo
r th
e 20
09
Mar
s Te
lesa
t O
rbite
r.
Whi
te
NA
SA
did
not
hol
d th
e P
relim
inar
y M
issi
on S
yste
m
Rev
iew
(PM
SR
) for
the
2009
M
ars
Tele
sat
Orb
iter.
The
Mar
s Te
lesa
t O
rbite
r ha
s be
en c
ance
lled
as p
art o
f a
repr
iorit
izat
ion
of s
cien
ce.
Not
app
licab
le.
Not
app
licab
le.
2 A
PG
5M
EP
4 S
ucce
ssfu
lly c
ompl
ete
the
Pre
limin
ary
Mis
sion
Sys
tem
R
evie
w (P
MS
R) f
or th
e 20
09 M
ars
Sci
ence
La
bora
tory
(MS
L) M
issi
on.
Yel
low
NA
SA
pos
tpon
ed th
e P
relim
inar
y M
issi
on S
yste
m
Rev
iew
(PM
SR
) for
the
2009
M
ars
Sci
ence
Lab
orat
ory.
NA
SA
dec
ided
to d
elay
in
orde
r to
com
plet
e in
depe
nden
t co
st e
stim
ates
pr
ior
to th
e re
view
. Th
e m
issi
on s
ched
ule
allo
wed
for
this
del
ay w
ith n
o im
pac
t.
The
PM
SR
cur
rent
ly is
sc
hedu
led
for
Dec
embe
r 20
05, w
ith
no im
pac
t to
the
mis
sion
la
unch
dat
e.
Not
app
licab
le.
2 A
PG
5M
EP
11
Suc
cess
fully
dem
onst
rate
pr
ogre
ss in
inve
stig
atin
g th
e ch
arac
ter
and
exte
nt o
f pr
ebio
tic c
hem
istr
y on
M
ars.
Pro
gres
s to
war
ds
achi
evin
g ou
tcom
es w
ill b
e va
lidat
ed b
y ex
tern
al r
evie
w.
Yel
low
The
exte
rnal
exp
ert r
evie
w
dete
rmin
ed th
at N
AS
A d
id
not d
emon
stra
te s
uffic
ient
pr
ogre
ss in
inve
stig
atin
g th
e ch
arac
ter
and
exte
nt o
f pr
ebio
tic c
hem
istr
y on
Mar
s.
The
exte
rnal
exp
ert r
evie
w
dete
rmin
ed th
at N
AS
A d
id
not d
emon
stra
te s
uffic
ient
pr
ogre
ss d
ue to
a la
ck o
f cu
rren
tly o
pera
ting
fligh
t m
issi
ons
des
igne
d to
ad
dres
s th
is O
utco
me.
As
note
d b
y th
e ex
tern
al
revi
ew, t
he M
ars
Sci
ence
Lab
orat
ory,
sc
hedu
led
for l
aunc
h in
20
09, w
ill ad
dres
s th
is
Out
com
e.
Not
app
licab
le.
2 A
PG
5M
EP
14
Suc
cess
fully
dem
onst
rate
pr
ogre
ss in
inve
ntor
ying
an
d c
hara
cter
izin
g M
artia
n re
sour
ces
of p
oten
tial
bene
fit to
hum
an
expl
orat
ion
of M
ars.
P
rogr
ess
tow
ards
ach
ievi
ng
outc
omes
will
be
valid
ated
by
ext
erna
l rev
iew
.
Yel
low
Th
e ex
tern
al e
xper
t rev
iew
de
term
ined
that
NA
SA
did
no
t dem
onst
rate
suf
ficie
nt
prog
ress
tow
ard
ach
ievi
ng
this
AP
G.
The
exte
rnal
exp
ert r
evie
w
dete
rmin
ed th
at N
AS
A d
id
not m
ake
suffi
cien
t pr
ogre
ss
due
to a
lack
of c
urre
ntly
op
erat
ing
flig
ht m
issi
ons
desi
gned
to a
ddre
ss th
is
Out
com
e.
As
note
d b
y th
e ex
tern
al
revi
ew, t
he M
ars
Rec
onna
issa
nce
Orb
iter,
la
unch
ed in
Aug
ust
2005
, will
addr
ess
this
O
utco
me.
Not
app
licab
le.

FY 2
005
Per
form
ance
and
Acc
ount
abilit
y R
epor
t 14
5
Ob
ject
ive
Per
form
-anc
e M
easu
re
Des
crip
tion
Rat
ing
Exp
lana
tion
/ d
escr
iptio
n of
whe
re a
p
erfo
rman
ce g
oal
was
no
t m
et
Why
the
goa
l was
no
t m
et
Pla
ns a
nd s
ched
ules
fo
r ac
hiev
ing
the
goa
l
If th
e g
oal i
s im
pra
ctic
al o
r in
feas
ible
, why
tha
t is
th
e ca
se a
nd w
hat
actio
n is
rec
om
men
ded
3 A
PG
5S
SE
9 S
ucce
ssfu
lly d
emon
-str
ate
prog
ress
in u
nder
stan
ding
w
hy th
e te
rres
tria
l pla
nets
ar
e so
diff
eren
t fr
om o
ne
anot
her.
Pro
gres
s to
war
ds
achi
evin
g ou
tcom
es w
ill b
e va
lidat
ed b
y ex
tern
al r
evie
w.
Yel
low
Th
e ex
tern
al e
xper
t rev
iew
de
term
ined
that
NA
SA
did
no
t mak
e su
ffici
ent
prog
ress
to
war
d ac
hiev
ing
this
AP
G.
The
exte
rnal
exp
ert r
evie
w
dete
rmin
ed th
at N
AS
A d
id
not m
ake
suffi
cien
t pr
ogre
ss
due
to th
e la
ck o
f flig
ht
mis
sion
s pl
anne
d to
add
ress
th
is O
utco
me
in g
ener
al a
nd
Ven
us in
par
ticul
ar.
NA
SA
has
incl
uded
V
enus
inve
stig
atio
ns a
s an
exp
licit
targ
et in
the
New
Fro
ntie
rs P
rogr
am.
Not
app
licab
le.
4 A
PG
5A
SO
4 D
emon
stra
te J
ames
Web
b S
pac
e Te
lesc
ope
(JW
ST)
pr
imar
y m
irror
tech
nolo
gy
read
ines
s by
test
ing
a
prot
otyp
e in
a fl
ight
-like
en
viro
nmen
t.
Yel
low
N
AS
A h
as c
ompl
eted
onl
y pa
rtia
l tes
ting
of J
WS
T pr
imar
y m
irror
tech
nolo
gy in
a
fligh
t-lik
e en
viro
nmen
t.
NA
SA
test
ed th
e ad
vanc
ed
mirr
or s
yste
m d
emon
stra
tor
(AS
MD
) mirr
or to
op
erat
ing
tem
per
atur
e, b
ut n
ot to
fli
ght-
like
mec
hani
cal l
oads
.
NA
SA
will
test
the
prot
otyp
e an
d fl
ight
sp
are
engi
neer
ing
deve
lopm
ent
units
m
irror
seg
men
t to
all
fligh
t con
ditio
ns b
y su
mm
er 2
006,
brin
ging
it
to T
echn
olog
y R
eadi
ness
Lev
el 6
.
Not
app
licab
le.
4 O
utco
me
4.7
Trac
e th
e ch
emic
al
path
way
s by
whi
ch s
impl
e m
olec
ules
and
dus
t ev
olve
in
to th
e or
gani
c m
olec
ules
im
port
ant
for l
ife.
Yel
low
S
ee 5
AS
O1
belo
w.
See
5A
SO
1 be
low
. S
ee 5
AS
O1
belo
w.
Not
app
licab
le.
4 A
PG
5A
SO
1 D
eliv
er th
e S
OFI
A A
irbor
ne
Obs
erva
tory
to A
mes
R
esea
rch
Cen
ter
for
final
te
stin
g.
Red
S
OFI
A A
irbor
ne O
bser
vato
ry
has
not
bee
n d
eliv
ered
to
Am
es fo
r fin
al t
estin
g.
The
SO
FIA
mis
sion
has
ex
perie
nced
sig
nific
ant
dela
ys o
ver
the
last
sev
eral
ye
ars
from
a v
arie
ty o
f ca
uses
; the
del
ay to
co
mpl
etin
g th
e FY
200
5 A
PG
re
pres
ents
the
effe
ct o
f de
lays
in p
rior
year
s,
ackn
owle
dged
and
exp
lain
ed
in p
rior
year
s’ r
epor
ts.
Del
iver
y w
ill o
ccur
in F
Y
2007
. N
ot a
pplic
able
.

FY 2
005
Per
form
ance
and
Acc
ount
abilit
y R
epor
t 14
6
Ob
ject
ive
Per
form
-anc
e M
easu
re
Des
crip
tion
Rat
ing
Exp
lana
tion
/ d
escr
iptio
n of
whe
re a
p
erfo
rman
ce g
oal
was
no
t m
et
Why
the
goa
l was
no
t m
et
Pla
ns a
nd s
ched
ules
fo
r ac
hiev
ing
the
goa
l
If th
e g
oal i
s im
pra
ctic
al o
r in
feas
ible
, why
tha
t is
th
e ca
se a
nd w
hat
actio
n is
rec
om
men
ded
5 A
PG
5S
EU
8 S
ucce
ssfu
lly d
emon
stra
te
prog
ress
in t
estin
g E
inst
ein’
s th
eory
of g
ravi
ty
and
map
ping
sp
ace–
time
near
eve
nt h
oriz
ons
of b
lack
ho
les.
Pro
gres
s to
war
ds
achi
evin
g ou
tcom
es w
ill b
e va
lidat
ed b
y ex
tern
al r
evie
w.
Yel
low
Th
e ex
tern
al e
xper
t rev
iew
de
term
ined
that
pro
gres
s to
war
d ac
hiev
ing
this
AP
G
was
sig
nific
antly
affe
cted
by
the
loss
of t
he X
RS
-2
inst
rum
ent o
n th
e A
stro
-E
2/S
uzak
u m
issi
on.
Pro
gres
s to
war
d a
chie
ving
th
is A
PG
was
affe
cted
by
the
loss
of t
he X
RS
-2 in
stru
men
t on
the
Ast
ro-E
2/S
uzak
u m
issi
on.
A M
isha
p In
vest
igat
ion
Boa
rd is
ass
essi
ng th
e ca
uses
of t
he fa
ilure
. N
AS
A m
ay tr
y to
obt
ain
the
XRS
sci
ence
in th
e fu
ture
, but
NA
SA
mus
t ev
alua
te th
is e
ffort
as
part
of t
he n
orm
al
budg
et p
riorit
izat
ion
proc
ess.
Not
app
licab
le.
5 A
PG
5S
EU
1 C
ompl
ete
the
inte
grat
ion
and
test
ing
of t
he G
amm
a-ra
y La
rge
Are
a S
pac
e Te
lesc
ope
(GLA
ST)
sp
acec
raft
bus
.
Yel
low
N
AS
A d
id n
ot c
ompl
ete
inte
grat
ing
and
test
ing
the
GLA
ST
spac
ecra
ft bu
s.
Del
ays
wer
e du
e to
sch
edul
e pr
oble
ms
with
GLA
ST
’s
prim
ary
inst
rum
ent,
the
Larg
e A
rea
Tele
scop
e (L
AT)
. Th
e LA
T ex
perie
nced
bot
h en
gine
erin
g d
esig
n an
d el
ectr
ical
par
ts p
robl
ems,
w
hich
req
uire
d a
proj
ect
sche
dule
and
cos
t re
base
line.
NA
SA
will
inte
grat
e an
d te
st th
e sp
acec
raft
bus
in F
Y 2
006.
The
re
base
line
resu
lted
in a
de
lay
to th
e la
unch
dat
e,
from
May
200
7 to
S
epte
mbe
r 20
07.
Not
app
licab
le.

FY 2
005
Per
form
ance
and
Acc
ount
abilit
y R
epor
t 14
7
Ob
ject
ive
Per
form
-anc
e M
easu
re
Des
crip
tion
Rat
ing
Exp
lana
tion
/ d
escr
iptio
n of
whe
re a
p
erfo
rman
ce g
oal
was
no
t m
et
Why
the
goa
l was
no
t m
et
Pla
ns a
nd s
ched
ules
fo
r ac
hiev
ing
the
goa
l
If th
e g
oal i
s im
pra
ctic
al o
r in
feas
ible
, why
tha
t is
th
e ca
se a
nd w
hat
actio
n is
rec
om
men
ded
6 A
PG
5S
SP
2 A
chie
ve a
n av
erag
e of
eig
ht
or fe
wer
flig
ht a
nom
alie
s p
er
Sp
ace
Shu
ttle
mis
sion
in F
Y
2005
.
Red
Th
ere
was
one
Spa
ce
Shu
ttle
mis
sion
in F
Y 2
005:
S
TS-1
14. F
or th
is m
issi
on,
ther
e w
ere
appr
oxim
atel
y 18
5 In
-Flig
ht A
nom
alie
s (IF
As)
rep
orte
d.
This
num
ber
is a
ppr
oxim
ate
sinc
e po
st-
STS
-114
har
dw
are
insp
ectio
ns a
nd a
naly
ses
cont
inue
; the
se r
esul
ts c
ould
ge
nera
te a
ddi
tiona
l IFA
s as
th
e pr
oces
s un
fold
s.
A k
ey c
ontr
ibut
or to
the
unus
ually
larg
e nu
mbe
r of
IF
As
for
STS
-114
was
a
chan
ge in
the
def
initi
on o
f an
IFA
mad
e du
ring
the
Ret
urn
to F
light
effo
rt.
The
chan
ge
is d
ocum
ente
d in
NS
TS
08
126,
Pro
blem
Rep
ortin
g an
d C
orre
ctiv
e A
ctio
n (P
RA
CA
) Sys
tem
R
equi
rem
ents
, whi
ch
beca
me
effe
ctiv
e on
Aug
ust
27, 2
004.
Prio
r to
this
ch
ange
in d
efin
ition
, IFA
s w
ere
a sm
all s
ubse
t of
pr
oble
ms
repo
rted
in th
e P
RA
CA
sys
tem
; w
ith th
is
chan
ge, a
ny P
RA
CA
-re
port
able
item
dur
ing
the
laun
ch p
repa
ratio
n an
d
exec
utio
n tim
e-fr
ame
auto
mat
ical
ly b
ecom
es a
n IF
A.
This
cha
nge
was
mad
e as
par
t of t
he o
vera
ll im
prov
emen
t to
the
Sp
ace
Shu
ttle
Pro
gram
’s p
robl
em
trac
king
, IFA
dis
posi
tion
and
w
as d
ocu
men
ted
in N
AS
A’s
Im
plem
enta
tion
Pla
n fo
r S
pac
e S
hutt
le R
etur
n to
Fl
ight
and
Bey
ond
. T
he
Col
umbi
a A
ccid
ent
Inve
stig
atio
n B
oard
re
com
men
ded
ano
mal
y re
solu
tion
proc
esse
s.
This
per
form
ance
goa
l ha
s be
en e
limin
ated
for
FY 2
006.
The
Spa
ce S
hutt
le
prog
ram
ano
mal
y id
entif
icat
ion
and
re
solu
tion
proc
ess
depe
nds
upon
act
ivel
y en
cour
agin
g an
omal
y re
port
ing.
Set
ting
arbi
trar
y m
etric
s fo
r th
e nu
mbe
r of
IFA
s pe
r fli
ght
(as
AP
G 5
SS
P2
does
) ca
n po
tent
ially
inte
rfer
e w
ith t
his
proc
ess
by
impl
ying
tha
t em
ploy
ees
and
con
trac
tors
who
re
port
IFA
s m
ay b
e pe
naliz
ed fo
r th
eir
findi
ngs.
Alth
ough
this
pe
rfor
man
ce g
oal i
s no
lo
nger
bei
ng tr
acke
d in
th
e P
erfo
rman
ce a
nd
Acc
ount
abilit
y R
epor
t,
the
Sp
ace
Shu
ttle
pr
ogra
m w
ill co
ntin
ue to
re
view
its
IFA
id
entif
icat
ion
and
di
spos
ition
pro
cess
es to
en
sure
tha
t pr
oble
ms
repo
rted
dur
ing
the
laun
ch p
repa
ratio
n an
d
exec
utio
n tim
e-fr
ame
are
iden
tifie
d an
d
disp
ositi
oned
ap
prop
riate
ly.
7 A
PG
5T
S5
Con
duct
a p
relim
inar
y co
ncep
tual
des
ign
stud
y fo
r a
hum
an–r
obot
ic M
ars
expl
orat
ion
vehi
cle,
in
conj
unct
ion
with
def
initi
on
of a
n in
tegr
ated
exp
lora
tion
syst
ems
arch
itect
ure.
Whi
te
This
AP
G w
as c
ance
led
by
man
agem
ent d
irect
ive.
The
tim
elin
e an
d ap
proa
ch fo
r ho
w N
AS
A is
goi
ng to
def
ine
and
dev
elo
p a
new
ar
chite
ctur
e ch
ange
d.
Not
app
licab
le.
Not
app
licab
le.
Not
app
licab
le.

FY 2
005
Per
form
ance
and
Acc
ount
abilit
y R
epor
t 14
8
Ob
ject
ive
Per
form
-anc
e M
easu
re
Des
crip
tion
Rat
ing
Exp
lana
tion
/ d
escr
iptio
n of
whe
re a
p
erfo
rman
ce g
oal
was
no
t m
et
Why
the
goa
l was
no
t m
et
Pla
ns a
nd s
ched
ules
fo
r ac
hiev
ing
the
goa
l
If th
e g
oal i
s im
pra
ctic
al o
r in
feas
ible
, why
tha
t is
th
e ca
se a
nd w
hat
actio
n is
rec
om
men
ded
8 A
PG
5I
SS
5 O
btai
n ag
reem
ent
amon
g
the
Inte
rnat
iona
l Par
tner
s on
the
final
ISS
co
nfig
urat
ion.
Yel
low
Th
e IS
S In
tern
atio
nal
Par
tner
ship
Hea
ds o
f Ag
ency
di
d m
eet i
n Ja
nuar
y 20
05 to
en
dors
e th
e M
ultil
ater
al
Coo
rdin
atio
n B
oar
d-ap
prov
ed IS
S c
onfig
urat
ion.
H
owev
er, i
n M
ay 2
005,
A
dmin
istr
ator
Grif
fin in
itiat
ed
a 60
-day
stu
dy o
n o
ptio
ns
for
com
plet
ing
ISS
ass
embl
y w
ithin
the
par
amet
ers
of t
he
Vis
ion
for
Sp
ace
Exp
lora
tion.
Th
e d
ecis
ion
bas
ed o
n th
e st
udy
requ
ires
NA
SA
to
reop
en d
iscu
ssio
ns w
ith it
s pa
rtne
rs. B
y th
e en
d o
f the
fis
cal y
ear,
NA
SA
beg
an
disc
ussi
ons
with
the
Inte
rnat
iona
l Par
tner
s on
the
w
ay fo
rwar
d.
In M
ay 2
005,
NA
SA
initi
ated
th
e S
hutt
le/S
tatio
n C
onfig
urat
ion
Opt
ions
Tea
m
stud
y. T
his
team
con
duc
ted
a
60-d
ay s
tudy
of t
he
conf
igur
atio
n op
tions
for
the
ISS
and
ass
esse
d th
e re
late
d nu
mbe
r of
flig
hts
need
ed b
y th
e S
pac
e S
hutt
le b
efor
e it
retir
es, n
o la
ter
than
the
yea
r 20
10. T
he s
cope
of t
he te
am
stud
y sp
ans
ISS
ass
embl
y,
oper
atio
ns, a
nd u
se a
nd
cons
ider
s su
ch fa
ctor
s as
in
tern
atio
nal p
artn
er
com
mitm
ents
, res
earc
h ut
ilizat
ion,
cos
t, a
nd IS
S
sust
aina
bilit
y. D
ecis
ions
ba
sed
on th
e st
udy
have
re
quire
d th
at N
AS
A r
eope
n di
scus
sion
s w
ith it
s In
tern
atio
nal P
artn
ers.
NA
SA
pro
pose
d th
at th
e IS
S M
ultil
ater
al
Coo
rdin
atio
n B
oar
d co
nven
e in
late
Oct
obe
r 20
05 to
dis
cuss
the
prop
osed
con
figur
atio
n an
d a
ssem
bly
sequ
ence
an
d th
at th
e bo
ard,
in
turn
, tas
k an
d o
vers
ee
the
wor
k of
the
Spa
ce
Sta
tion
Con
trol
Boa
rd to
as
sess
the
tech
nica
l as
pect
s of
thi
s ne
w
appr
oach
. Fo
llow
ing
thes
e d
etai
led
disc
ussi
ons,
the
part
ners
hip
will
mee
t at
the
Hea
ds o
f Age
ncy
leve
l.
Not
app
licab
le.
8 A
PG
5I
SS
2 A
chie
ve z
ero
Typ
e-A
(d
amag
e to
pro
pert
y at
le
ast $
1 M
or
deat
h) o
r Ty
pe-B
(dam
age
to
prop
erty
at
leas
t $25
0 K
or
perm
anen
t di
sabi
lity
or
hosp
italiz
atio
n of
3 o
r m
ore
pers
ons)
mis
haps
in F
Y
2005
.
Yel
low
A
lthou
gh th
ere
wer
e no
Ty
pe-A
mis
haps
in F
Y 2
005,
N
AS
A fa
iled
to a
chie
ve th
is
AP
G d
ue to
the
occ
urre
nce
of o
ne T
ype-
B m
isha
p.
The
Pre
cool
er A
ssem
bly,
pa
rt o
f the
Env
ironm
enta
l C
ontr
ol a
nd L
ife S
uppo
rt
Sys
tem
(EC
LSS
) flig
ht
hard
war
e, w
as d
amag
ed
durin
g th
e tin
pla
ting
proc
ess,
dam
agin
g th
e pr
otec
tive
braz
e la
yer.
Thi
s br
each
ren
der
ed th
e as
sem
bly
unre
cove
rabl
e an
d w
ill re
sult
in N
AS
A r
eque
stin
g ad
ditio
nal u
nit(s
) fro
m th
e IS
S
Pro
gram
. Th
e va
lue
of th
e lo
ss is
app
roxi
mat
ely
$350
K
. A
Mis
hap
Inve
stig
atio
n B
oard
is in
vest
igat
ing
the
mis
hap
.
NA
SA
will
revi
ew th
e E
CLS
S m
isha
p in
vest
igat
ion
repo
rt fo
r ap
plic
able
less
ons
lear
ned.
Not
app
licab
le.

FY 2
005
Per
form
ance
and
Acc
ount
abilit
y R
epor
t 14
9
Ob
ject
ive
Per
form
-anc
e M
easu
re
Des
crip
tion
Rat
ing
Exp
lana
tion
/ d
escr
iptio
n of
whe
re a
p
erfo
rman
ce g
oal
was
no
t m
et
Why
the
goa
l was
no
t m
et
Pla
ns a
nd s
ched
ules
fo
r ac
hiev
ing
the
goa
l
If th
e g
oal i
s im
pra
ctic
al o
r in
feas
ible
, why
tha
t is
th
e ca
se a
nd w
hat
actio
n is
rec
om
men
ded
8 A
PG
5I
SS
4 P
rovi
de
at le
ast 8
0% o
f up
mas
s, v
olum
e, a
nd c
rew
tim
e fo
r sc
ienc
e as
pla
nned
at
the
begi
nnin
g of
FY
20
05.
Yel
low
W
hile
NA
SA
did
not
mee
t the
80
% g
oal a
s pl
anne
d at
the
be
ginn
ing
of t
he fi
scal
yea
r on
thes
e m
etric
s. N
AS
A d
id
mee
t 97
% o
f the
sci
ence
ob
ject
ives
dur
ing
Incr
emen
t 10
(Oct
obe
r 20
04–M
arch
20
05) a
nd e
xpec
t a
sim
ilar
achi
evem
ent
for
Incr
emen
t 11
(Mar
ch–O
cto
ber
2005
).
In a
dditi
on, S
TS 1
14
deliv
ered
add
ition
al s
cien
ce
cap
acity
to th
e S
tatio
n,
brin
ging
up
the
Hum
an
Res
earc
h Fa
cilit
y-2
rack
for
the
U.S
. Des
tiny
lab,
de
ploy
ing
anot
her
set i
n an
on
-goi
ng m
ater
ial
expe
rimen
t, a
nd fl
ying
thre
e ad
ditio
nal s
ortie
exp
erim
ents
.
Due
to th
e de
lay
of S
hutt
le
fligh
t mis
sion
UF1
from
M
arch
to J
uly,
the
incr
ease
to
thre
e cr
ewm
embe
rs w
as
dela
yed
from
the
sche
dule
d da
te o
f May
200
5 to
a d
ate
to b
e d
eter
min
ed in
200
6,
prev
entin
g ac
hiev
emen
t of
th
e pl
anne
d c
rew
tim
e an
d up
-mas
s fo
r sc
ienc
e go
al.
A s
econ
d s
ucce
ssfu
l te
st fl
ight
of t
he S
pac
e S
hutt
le w
ill en
able
NA
SA
to
mee
t the
pla
nned
sc
ienc
e up
-mas
s an
d
volu
me
goal
s, a
s w
ell a
s an
incr
ease
to th
ree
crew
mem
bers
.
Not
app
licab
le.
8 A
PG
5B
SR
10
Und
er th
e H
uman
Res
earc
h In
itiat
ive
(HR
I), in
crea
se th
e nu
mbe
r of
inve
stig
atio
ns
addr
essi
ng b
iom
edic
al
issu
es a
ssoc
iate
d w
ith
hum
an s
pac
e ex
plor
atio
n.
Whi
te
NA
SA
has
not
incr
ease
d th
e nu
mbe
r of
inve
stig
atio
ns
addr
essi
ng b
iom
edic
al
issu
es a
ssoc
iate
d w
ith
hum
an s
pac
e ex
plor
atio
n.
Ant
icip
ated
HR
I fun
ding
was
re
duce
d.
NA
SA
hop
es to
re-
enga
ge th
e re
sear
ch
com
mun
ity in
ro
bust
ly
addr
essi
ng b
iom
edic
al
issu
es a
ssoc
iate
d w
ith
hum
an s
pac
e ex
plor
atio
n w
ithin
5 to
7
year
s.
Bio
med
ical
res
earc
h w
ill be
rep
hase
d in
ord
er to
m
eet
expl
orat
ion
mis
sion
re
quire
men
ts.
11
AP
G
5LE
1 Id
entif
y an
d de
fine
pref
erre
d hu
man
–rob
otic
exp
lora
tion
syst
ems
conc
epts
and
ar
chite
ctur
al a
ppro
ache
s fo
r va
lidat
ion
thro
ugh
luna
r m
issi
ons.
Yel
low
N
AS
A d
oes
not
hav
e co
mpl
ete
resu
lts, o
nly
prel
imin
ary
conc
epts
.
NA
SA
’s n
ear-
term
focu
s is
on
luna
r si
te s
elec
tion
and
ch
arac
teriz
atio
n, r
athe
r th
an
hum
an–r
obot
ic li
nkag
es.
The
arch
itect
ure
and
long
-te
rm li
nkag
es m
ust
flow
from
th
e E
xplo
ratio
n S
yste
ms
Arc
hite
ctur
e S
tud
y re
sults
, w
hich
was
com
plet
ed in
A
ugus
t 200
5.
NA
SA
inte
nds
to
com
plet
e th
is A
PG
in
the
third
qua
rter
of F
Y
2006
.
Not
app
licab
le.

FY 2
005
Per
form
ance
and
Acc
ount
abilit
y R
epor
t 15
0
Ob
ject
ive
Per
form
-anc
e M
easu
re
Des
crip
tion
Rat
ing
Exp
lana
tion
/ d
escr
iptio
n of
whe
re a
p
erfo
rman
ce g
oal
was
no
t m
et
Why
the
goa
l was
no
t m
et
Pla
ns a
nd s
ched
ules
fo
r ac
hiev
ing
the
goa
l
If th
e g
oal i
s im
pra
ctic
al o
r in
feas
ible
, why
tha
t is
th
e ca
se a
nd w
hat
actio
n is
rec
om
men
ded
11
AP
G
5LE
2 Id
entif
y ca
ndid
ate
arch
itect
ures
and
sys
tem
s ap
proa
ches
that
can
be
deve
lop
ed a
nd
dem
onst
rate
d th
roug
h lu
nar
mis
sion
s to
ena
ble
a sa
fe,
affo
rdab
le, a
nd e
ffect
ive
cam
paig
n of
hum
an–r
obot
ic
Mar
s ex
plor
atio
n.
Red
N
AS
A’s
nea
r-te
rm fo
cus
has
been
luna
r ex
plor
atio
n;
exte
nsib
ility
to M
ars
need
s fu
rthe
r w
ork.
NA
SA
def
erre
d li
nkag
e to
M
ars
in o
rder
to r
e-al
loca
te
reso
urce
s fo
r C
onst
ella
tion
Sys
tem
s de
velo
pm
ent.
Alth
ough
the
sche
dule
is
uncl
ear,
NA
SA
do
es n
ot
antic
ipat
e co
mpl
etin
g th
is A
PG
bef
ore
FY
2007
.
This
AP
G s
houl
d b
e de
ferr
ed u
ntil
NA
SA
can
re
visi
t the
tec
hnol
ogy
inve
stm
ent s
trat
egy
for
Mar
s ex
plor
atio
n.
11
AP
G
5LE
6 Id
entif
y pr
efer
red
appr
oach
es fo
r de
velo
pmen
t an
d de
mon
stra
tion
durin
g lu
nar
mis
sion
s to
ena
ble
tran
sfor
mat
iona
l spa
ce
oper
atio
ns c
apab
ilitie
s.
Yel
low
N
AS
A h
as c
ondu
cted
lim
ited
anal
ysis
of s
pac
e op
erat
ions
. N
AS
A’s
nea
r-te
rm fo
cus
for
robo
tic e
xplo
ratio
n is
on
site
se
lect
ion
and
char
acte
rizat
ion.
NA
SA
will
deriv
e lin
kage
to
tran
sfor
mat
iona
l ope
ratio
ns
from
the
Exp
lora
tion
Sys
tem
s A
rchi
tect
ure
Stu
dy
resu
lts a
nd a
rchi
tect
ure
deve
lopm
ent.
NA
SA
inte
nds
to
com
plet
e th
is A
PG
in
the
third
qua
rter
of F
Y
2006
.
Not
app
licab
le.
11
Out
com
e 11
.5
By
2016
, dev
elop
and
de
mon
stra
te in
-sp
ace
nucl
ear
fissi
on-b
ased
po
wer
and
pro
puls
ion
syst
ems
that
can
be
inte
grat
ed in
to fu
ture
hu
man
and
rob
otic
ex
plor
atio
n m
issi
ons.
Whi
te
Alth
ough
sev
eral
AP
Gs
wer
e m
et, t
his
Out
com
e is
no
long
er a
ppl
icab
le d
ue to
A
genc
y re
stru
ctur
ing
and
prog
ram
red
efin
ition
.
With
NA
SA
’s r
estr
uctu
ring
and
red
efin
ition
of i
ts n
ucle
ar
syst
ems
prog
ram
, sur
face
fis
sion
nuc
lear
po
wer
for u
se
on th
e M
oon
and
Mar
s is
no
w th
e pr
imar
y go
al fo
r N
AS
A’s
nuc
lear
fiss
ion
syst
em d
evel
opm
ent,
whi
le
in-s
pace
nuc
lear
fiss
ion-
base
d po
wer
and
pro
pul
sion
de
velo
pmen
t ha
s be
en
chan
ged
to a
sec
ond
ary
goal
.
At t
his
time,
NA
SA
doe
s no
t hav
e pl
ans
to m
eet
this
goa
l. M
issi
ons
requ
iring
in-s
pace
nu
clea
r fis
sion
-bas
ed
pow
er a
nd p
ropu
lsio
n sy
stem
s ha
ve m
oved
be
yond
the
plan
ning
ho
rizon
. N
AS
A is
re
focu
sing
nuc
lear
re
sear
ch a
nd
tech
nolo
gy s
tudi
es to
m
eet
long
er-t
erm
ex
plor
atio
n an
d sc
ienc
e ne
eds.
This
Out
com
e is
not
pr
actic
al s
ince
it is
no
long
er a
hig
h-pr
iorit
y,
near
-ter
m e
xplo
ratio
n ne
ed d
ue to
Age
ncy
rest
ruct
urin
g an
d
rede
finiti
on o
f the
nuc
lear
sy
stem
s pr
ogra
m.
The
resp
onsi
ble
prog
ram
re
com
men
ds th
is
Out
com
e be
elim
inat
ed in
FY
200
6.

FY 2
005
Per
form
ance
and
Acc
ount
abilit
y R
epor
t 15
1
Ob
ject
ive
Per
form
-anc
e M
easu
re
Des
crip
tion
Rat
ing
Exp
lana
tion
/ d
escr
iptio
n of
whe
re a
p
erfo
rman
ce g
oal
was
no
t m
et
Why
the
goa
l was
no
t m
et
Pla
ns a
nd s
ched
ules
fo
r ac
hiev
ing
the
goa
l
If th
e g
oal i
s im
pra
ctic
al o
r in
feas
ible
, why
tha
t is
th
e ca
se a
nd w
hat
actio
n is
rec
om
men
ded
11
AP
G
5HR
T8
Com
plet
e a
valid
ated
ro
ad
map
for
nucl
ear
pow
er a
nd
prop
ulsi
on R
&D
, and
re
late
d ve
hicl
e sy
stem
s te
chno
logy
mat
urat
ion.
Whi
te
NA
SA
had
not
met
this
AP
G
in M
ay 2
005
whe
n th
e ac
tivity
was
can
cele
d.
The
activ
ity w
as c
ance
led
befo
re th
e st
rate
gic
road
map
w
as c
ompl
ete.
Pro
met
heus
will
gene
rate
pro
gram
pla
ns
to m
eet e
xplo
ratio
n go
als
for
luna
r su
rfac
e po
wer
pen
ding
ac
cept
ance
of t
he
Exp
lora
tion
Sys
tem
s A
rchi
tect
ure
Stu
dy
arch
itect
ure.
Not
app
licab
le.
11
AP
G
5HR
T15
Com
plet
e an
Adv
ance
d S
pac
e Te
chno
logy
Pro
gram
te
chno
logy
roa
dmap
that
in
terf
aces
app
ropr
iate
ly w
ith
the
tech
nolo
gy p
lann
ing
of
NA
SA
’s M
issi
on
Dire
ctor
ates
.
Whi
te
NA
SA
form
ed a
n E
xplo
ratio
n S
yste
ms
Res
earc
h an
d Te
chno
logy
Coo
rdin
atio
n G
roup
for
this
effo
rt, b
ut th
e gr
oup
was
pla
ced
on h
old
and
eve
ntua
lly in
tegr
ated
into
th
e E
xplo
ratio
n S
yste
ms
Arc
hite
ctur
e S
tud
y.
This
effo
rt w
as in
tegr
ated
in
to th
e E
xplo
ratio
n S
yste
ms
Arc
hite
ctur
e S
tud
y.
NA
SA
will
dev
elo
p ro
adm
ap(s
), as
ne
cess
ary,
bas
ed o
n th
e re
sults
of t
he
Exp
lora
tion
Sys
tem
s A
rchi
tect
ure
Stu
dy.
Not
app
licab
le.
11
AP
G
5HR
T12
Est
ablis
h th
ree
part
ners
hips
w
ith U
.S. i
ndus
try
and
the
inve
stm
ent
com
mun
ity
usin
g th
e E
nter
pris
e E
ngin
e co
ncep
t.
Yel
low
N
AS
A d
id n
ot fo
rm a
ny
part
ners
hips
with
indu
stry
or
the
inve
stm
ent
com
mun
ity
usin
g th
e E
nter
pris
e E
ngin
e co
ncep
t in
FY 2
005.
Not
app
licab
le.
The
prog
ram
was
re
stru
ctur
ed a
nd is
in
plac
e fo
r
FY 2
006.
Not
app
licab
le.

FY 2
005
Per
form
ance
and
Acc
ount
abilit
y R
epor
t 15
2
Ob
ject
ive
Per
form
-anc
e M
easu
re
Des
crip
tion
Rat
ing
Exp
lana
tion
/ d
escr
iptio
n of
whe
re a
p
erfo
rman
ce g
oal
was
no
t m
et
Why
the
goa
l was
no
t m
et
Pla
ns a
nd s
ched
ules
fo
r ac
hiev
ing
the
goa
l
If th
e g
oal i
s im
pra
ctic
al o
r in
feas
ible
, why
tha
t is
th
e ca
se a
nd w
hat
actio
n is
rec
om
men
ded
12
Out
com
e 12
.4
By
2010
, flig
ht d
emon
stra
te
an a
ircra
ft th
at p
rodu
ces
no
CO
2 or
NO
x to
red
uce
smog
and
low
er
atm
osph
eric
ozo
ne.
Whi
te
NA
SA
reb
asel
ined
the
com
bust
or d
etai
led
desi
gn
revi
ew (D
DR
) to
the
seco
nd
quar
ter
of 2
005.
Thi
s ba
selin
e, in
tur
n, m
oved
the
com
plet
ion
of th
e an
nula
r rig
te
st to
the
four
th q
uart
er o
f 20
06.
The
curt
ailm
ent o
f FY
200
5 fu
ndin
g an
d th
e ea
rmar
ks
seve
rely
impa
cted
the
Ultr
a-E
ffici
ent E
ngin
e T
echn
olog
y (U
EE
T) P
roje
ct, i
nclu
ding
the
Low
-NO
x C
ombu
stor
DD
R
mile
ston
e th
at w
as p
lann
ed
for
com
plet
ion
durin
g th
e se
cond
qua
rter
of 2
005.
One
con
trac
tor
(P&
W)
did
com
plet
e D
DR
of
thei
r co
ncep
t in
Febr
uary
200
5 an
d is
co
ntin
uing
with
tes
ting
as r
emai
ning
UE
ET
fu
nds
run
out.
Follo
win
g N
AS
A’s
de
cisi
on to
levy
P
ropu
lsio
n 21
ear
mar
k en
tirel
y ag
ains
t the
UE
ET
P
roje
ct, s
top-
wor
k or
der
s w
ere
issu
ed t
o R
RN
A/A
AD
C.
GE
will
co
ntin
ue lo
w-N
Ox
com
bust
ion
wor
k un
der
th
e P
ropu
lsio
n 21
fu
ndin
g, b
ut t
heir
sche
dule
for
DD
R w
ill sl
ip
into
FY
200
6. T
he P
&W
fu
ndin
g si
tuat
ion
will
be
mon
itore
d. F
inal
te
rmin
atio
n d
ecis
ions
and
no
tices
are
pen
ding
of
ficia
l res
olut
ion
of
NA
SA
’s F
Y 2
005
Op
erat
ing
Pla
n, b
ut it
is
not e
xpec
ted
that
the
RR
NA
/AA
DC
effo
rt w
ill co
ntin
ue.

FY 2
005
Per
form
ance
and
Acc
ount
abilit
y R
epor
t 15
3
Ob
ject
ive
Per
form
-anc
e M
easu
re
Des
crip
tion
Rat
ing
Exp
lana
tion
/ d
escr
iptio
n of
whe
re a
p
erfo
rman
ce g
oal
was
no
t m
et
Why
the
goa
l was
no
t m
et
Pla
ns a
nd s
ched
ules
fo
r ac
hiev
ing
the
goa
l
If th
e g
oal i
s im
pra
ctic
al o
r in
feas
ible
, why
tha
t is
th
e ca
se a
nd w
hat
actio
n is
rec
om
men
ded
12
AP
G
5AT5
D
emon
stra
te 7
0%
redu
ctio
n N
Ox
emis
sion
s in
fu
ll-an
nula
r rig
tes
ts o
f ca
ndid
ate
com
bust
or
conf
igur
atio
ns fo
r la
rge
subs
onic
veh
icle
ap
plic
atio
ns.
(Veh
icle
S
yste
ms)
Red
N
AS
A o
rigin
ally
fund
ed th
ree
com
pan
ies
to d
emon
stra
te
70%
NO
x re
duct
ion,
but
onl
y on
e su
cces
sful
ann
ular
rig
te
st is
nee
ded
to
mee
t th
is
AP
G’s
min
imum
suc
cess
exi
t cr
iteria
. The
cur
tailm
ent
of
FY05
fund
ing
and
the
earm
arks
hav
e se
vere
ly
impa
cted
the
UE
ET
Pro
ject
, in
clud
ing
the
Low
-NO
x C
ombu
stor
DD
R m
ilest
one
that
was
pla
nned
for
com
plet
ion
dur
ing
the
seco
nd q
uart
er o
f 200
5.
One
con
trac
tor
(P&
W) d
id
com
plet
e D
DR
of t
heir
conc
ept i
n Fe
brua
ry 2
005
and
is c
ontin
uing
with
tes
ting
as r
emai
ning
UE
ET
fund
s ru
n ou
t.
Bec
ause
of N
AS
A’s
dec
isio
n to
levy
Pro
puls
ion
21
earm
ark
entir
ely
agai
nst t
he
UE
ET
Pro
ject
, sto
p-w
ork
orde
rs w
ere
issu
ed.
GE
will
cont
inue
low
-N
Ox
com
bust
ion
wor
k un
der
the
Pro
pul
sion
21
fund
ing,
but
the
ir sc
hedu
le fo
r D
DR
will
slip
into
FY
200
6. T
he
P&
W fu
ndin
g si
tuat
ion
will
be m
onito
red
. Fi
nal
term
inat
ion
dec
isio
ns
and
not
ices
are
pe
ndin
g.
Fina
l ter
min
atio
n de
cisi
ons
and
notic
es a
re
pend
ing
offic
ial r
esol
utio
n of
NA
SA
’s F
Y 2
005
Op
erat
ing
Pla
n, b
ut it
is
not e
xpec
ted
that
the
RR
NA
/AA
DC
effo
rt w
ill co
ntin
ue.
12
AP
G
5AT2
7 D
emon
stra
te th
roug
h se
ctor
tes
ting
a fu
ll sc
ale
CM
C t
urbi
ne v
ane
that
will
redu
ce c
oolin
g flo
w
requ
irem
ents
and
thus
fuel
bu
rn in
futu
re t
urbi
ne e
ngin
e sy
stem
des
igns
. (V
ehic
le
Sys
tem
s)
Whi
te
This
effo
rt w
as d
elet
ed fr
om
the
UE
ET
por
tfolio
. B
udge
t co
nstr
aint
s d
urin
g th
e re
plan
ning
of t
he V
ehic
le
Sys
tem
s P
rogr
am d
id n
ot
allo
w fo
r th
is e
ffort
from
P
ropu
lsio
n an
d P
ow
er to
be
incl
uded
into
UE
ET.
Not
app
licab
le.
Not
app
licab
le.

FY 2
005
Per
form
ance
and
Acc
ount
abilit
y R
epor
t 15
4
Ob
ject
ive
Per
form
-anc
e M
easu
re
Des
crip
tion
Rat
ing
Exp
lana
tion
/ d
escr
iptio
n of
whe
re a
p
erfo
rman
ce g
oal
was
no
t m
et
Why
the
goa
l was
no
t m
et
Pla
ns a
nd s
ched
ules
fo
r ac
hiev
ing
the
goa
l
If th
e g
oal i
s im
pra
ctic
al o
r in
feas
ible
, why
tha
t is
th
e ca
se a
nd w
hat
actio
n is
rec
om
men
ded
12
AP
G
5AT9
C
ompl
ete
hum
an-in
-the
-lo
op c
once
pt a
nd
tech
nolo
gy e
valu
atio
n of
sh
ared
sep
arat
ion.
(A
irspa
ce S
yste
ms)
Whi
te
This
AP
G w
as d
elay
ed to
th
ird q
uart
er o
f FY
200
6 d
ue
to F
Y 2
005
Con
gres
sion
al
earm
ark
imp
acts
. Th
e fir
st in
a
serie
s of
pla
nned
FY
200
5 si
mul
atio
ns le
adin
g to
a m
ore
mat
ure
conc
ept
dem
onst
ratio
n ha
d to
be
post
pone
d un
til th
e se
cond
qu
arte
r of
FY
200
6 b
ecau
se
of in
suffi
cien
t fun
ds.
How
ever
, NA
SA
com
plet
ed
impo
rtan
t su
ppo
rtin
g ac
tiviti
es in
FY
200
5.
This
goa
l was
not
met
due
bu
dget
impa
cts
caus
ed b
y FY
200
5 C
ongr
essi
onal
ea
rmar
ks.
Pla
ns r
egar
ding
this
go
al
are
pend
ing
deta
ils o
f re
-alig
nmen
t of
Airs
pace
S
yste
ms
Pro
gram
re
sear
ch e
ffort
s to
N
GA
TS J
PD
O
cap
abilit
ies
requ
irem
ents
in F
Y
2006
.
Pla
ns r
egar
ding
this
go
al
are
pend
ing
deta
ils o
f re-
alig
nmen
t of
Airs
pace
S
yste
ms
Pro
gram
re
sear
ch e
ffort
s to
N
GA
TS J
PD
O
cap
abilit
ies
requ
irem
ents
in
FY
200
6.
12
AP
G
5AT1
3 E
stab
lish
the
fluid
dyn
amic
s m
echa
nism
for
alle
viat
ing
wak
e th
roug
h ex
per
imen
tal
and
com
puta
tiona
l flu
id
mec
hani
cs s
tudi
es.
(Airs
pace
Sys
tem
s)
Whi
te
This
AP
G w
as d
elay
ed to
the
third
qua
rter
of F
Y 2
006
due
to
FY
200
5 C
ongr
essi
onal
ea
rmar
k im
pac
ts.
Lack
of
timel
y an
d su
ffici
ent f
undi
ng
in F
Y 2
005
caus
ed th
e de
lay
in c
ompl
etin
g th
e te
stin
g o
f m
ore
prac
tical
wak
e-al
levi
atin
g co
nfig
urat
ions
and
gr
ound
and
flig
ht t
estin
g of
va
rious
con
cept
s. H
owev
er,
NA
SA
com
plet
ed im
port
ant
supp
ortin
g ac
tiviti
es in
FY
20
05.
This
goa
l was
not
met
due
bu
dget
impa
cts
caus
ed b
y FY
200
5 C
ongr
essi
onal
ea
rmar
ks.
Pla
ns r
egar
ding
this
go
al
are
pend
ing
deta
ils o
f re
-alig
nmen
t of
Airs
pace
S
yste
ms
Pro
gram
re
sear
ch e
ffort
s to
N
GA
TS J
PD
O
cap
abilit
ies
requ
irem
ents
in F
Y
2006
.
Pla
ns r
egar
ding
this
go
al
are
pend
ing
deta
ils o
f re-
alig
nmen
t of
Airs
pace
S
yste
ms
Pro
gram
re
sear
ch e
ffort
s to
N
GA
TS J
PD
O
cap
abilit
ies
requ
ire-m
ents
in
FY
200
6.

FY 2
005
Per
form
ance
and
Acc
ount
abilit
y R
epor
t 15
5
Ob
ject
ive
Per
form
-anc
e M
easu
re
Des
crip
tion
Rat
ing
Exp
lana
tion
/ d
escr
iptio
n of
whe
re a
p
erfo
rman
ce g
oal
was
no
t m
et
Why
the
goa
l was
no
t m
et
Pla
ns a
nd s
ched
ules
fo
r ac
hiev
ing
the
goa
l
If th
e g
oal i
s im
pra
ctic
al o
r in
feas
ible
, why
tha
t is
th
e ca
se a
nd w
hat
actio
n is
rec
om
men
ded
12
AP
G
5AT1
4 C
ompl
ete
Sys
tem
-Wid
e E
valu
atio
n an
d P
lann
ing
Tool
initi
al s
imul
atio
n an
d fie
ld d
emon
stra
tion.
(A
irspa
ce S
yste
ms)
Whi
te
This
AP
G w
as d
elay
ed to
the
third
qua
rter
of F
Y 2
006
due
to
FY
200
5 C
ongr
essi
onal
ea
rmar
k im
pac
ts.
Dur
ing
the
sche
dule
re-
plan
ning
pr
oces
s, b
ased
on
cust
omer
(e
.g.,
FAA
, airl
ines
) nee
ds,
NA
SA
rev
ised
the
sco
pe a
nd
focu
s of
the
Pro
ject
’s
SW
EP
T e
ffort
s. A
s a
resu
lt,
initi
al s
imul
atio
n an
d fi
eld
de
mon
stra
tion
activ
ity w
as
re-s
ched
uled
to F
Y 2
006.
H
owev
er, N
AS
A c
ompl
eted
im
port
ant
sup
port
ing
activ
ities
in F
Y 2
005.
This
goa
l was
not
met
due
bu
dget
impa
cts
caus
ed b
y FY
200
5 C
ongr
essi
onal
ea
rmar
ks.
Pla
ns r
egar
ding
this
go
al
are
pend
ing
deta
ils o
f re
-alig
nmen
t of
Airs
pace
S
yste
ms
Pro
gram
re
sear
ch e
ffort
s to
N
GA
TS J
PD
O
cap
abilit
ies
requ
irem
ents
in F
Y
2006
.
Pla
ns r
egar
ding
this
go
al
are
pend
ing
deta
ils o
f re-
alig
nmen
t of
Airs
pace
S
yste
ms
Pro
gram
re
sear
ch e
ffort
s to
N
GA
TS J
PD
O
cap
abilit
ies
requ
ire-m
ents
in
FY
200
6.
12
AP
G
5AT1
5 C
ompl
ete
com
mun
icat
ions
, na
viga
tion,
and
sur
veill
ance
re
quire
men
ts a
naly
sis.
(A
irspa
ce S
yste
ms)
Whi
te
This
AP
G w
as d
elay
ed to
the
seco
nd q
uart
er o
f FY
200
6 du
e to
FY
200
5 C
ongr
essi
onal
ear
mar
k im
pact
s. T
his
resu
lted
in a
de
lay
of t
wo
criti
cal e
xter
nal
requ
irem
ents
ana
lyse
s fo
r ai
rpor
t sur
face
and
oce
anic
re
quire
men
ts n
eces
sary
to
com
plet
e th
e re
late
d
mile
ston
e. H
owev
er, N
AS
A
com
plet
ed im
port
ant
supp
ortin
g ac
tiviti
es in
FY
20
05.
This
goa
l was
not
met
due
to
budg
et im
pact
s ca
used
by
FY
200
5 C
ongr
essi
onal
ea
rmar
ks.
Pla
ns r
egar
ding
this
go
al
are
pend
ing
deta
ils o
f re
-alig
nmen
t of
Airs
pace
S
yste
ms
Pro
gram
re
sear
ch e
ffort
s to
N
GA
TS J
PD
O
cap
abilit
ies
requ
irem
ents
in
FY 2
006.
Pla
ns r
egar
ding
this
go
al
are
pend
ing
deta
ils o
f re-
alig
nmen
t of
Airs
pace
S
yste
ms
Pro
gram
re
sear
ch e
ffort
s to
N
GA
TS J
PD
O
cap
abilit
ies
requ
ire-m
ents
in
FY
200
6.
12
AP
G
5AT2
2 U
sing
labo
rato
ry d
ata
and
syst
ems
anal
ysis
, com
plet
e se
lect
ion
of th
e te
chno
logi
es th
at s
how
the
high
est
pote
ntia
l for
re
duci
ng ta
keof
f/la
ndin
g
field
leng
th w
hile
m
aint
aini
ng c
ruis
e M
ach,
lo
w s
peed
con
trol
labi
lity,
an
d lo
w n
oise
.
Yel
low
Th
is A
PG
was
not
co
mpl
eted
in
FY
200
5 du
e to
su
bsta
ntia
lly li
mite
d FY
200
5 di
scre
tiona
ry p
rocu
re-m
ent
budg
et th
at w
as c
ause
d by
th
e re
quire
men
t to
fund
C
ongr
essi
onal
Sp
ecia
l In
tere
st it
ems.
The
wor
k is
ex
pect
ed t
o b
e co
mpl
eted
in
FY 2
006.
Lim
ited
inte
rnal
st
udie
s ar
e on
-goi
ng.
NA
SA
did
not
fund
any
ex
tern
al tr
ade
stud
ies
in F
Y
2005
.
Pro
gres
s to
war
d
achi
evin
g th
is d
etai
l is
pend
ing
chan
ges
of
Dem
onst
ratio
n fo
cus
with
the
Veh
icle
S
yste
ms
Pro
gram
in F
Y
2006
.
Not
app
licab
le.

FY 2
005
Per
form
ance
and
Acc
ount
abilit
y R
epor
t 15
6
Ob
ject
ive
Per
form
-anc
e M
easu
re
Des
crip
tion
Rat
ing
Exp
lana
tion
/ d
escr
iptio
n of
whe
re a
p
erfo
rman
ce g
oal
was
no
t m
et
Why
the
goa
l was
no
t m
et
Pla
ns a
nd s
ched
ules
fo
r ac
hiev
ing
the
goa
l
If th
e g
oal i
s im
pra
ctic
al o
r in
feas
ible
, why
tha
t is
th
e ca
se a
nd w
hat
actio
n is
rec
om
men
ded
12
AP
G
5AT2
0 C
ompl
ete
fligh
t de
mon
stra
tion
of a
sec
ond
ge
nera
tion
dam
age
adap
tive
fligh
t co
ntro
l sy
stem
. (V
ehic
le S
yste
ms)
Yel
low
A
lthou
gh N
AS
A is
mak
ing
good
pro
gres
s to
war
d de
velo
ping
sec
ond-
gene
ratio
n fli
ght s
oftw
are,
a
redu
ctio
n of
$1.
25 M
in
proc
urem
ent f
unds
, for
C
ongr
essi
onal
Sp
ecia
l In
tere
st it
ems,
will
imp
act
com
plet
ion
of th
e A
PG
. Th
e re
sult
is a
del
ayed
sof
twar
e de
liver
y sc
hedu
le a
nd t
he
dela
yed
star
t of t
he s
econ
d-ge
nera
tion
fligh
t de
mon
stra
tion.
This
AP
G w
as n
ot m
et d
ue
to a
$1.
25 M
red
uctio
n in
av
aila
ble
pro
cure
men
t fun
ds.
NA
SA
will
red
uce
the
scop
e of
the
fligh
t de
mon
stra
tion
to li
mite
d fli
ght e
nvel
ope
test
ing
. N
AS
A w
ill n
ot
dem
onst
rate
the
full
cap
abilit
y of
the
dam
age
adap
tive
cont
rol s
yste
m.
How
ever
, NA
SA
mad
e si
gnfic
ant
prog
ress
and
pl
ans
to a
chie
ve th
e A
PG
, bas
ed o
n th
e ne
w
scop
e, w
ithin
the
first
qu
arte
r of
FY
200
6.
Not
app
licab
le.
15
AP
G
5SE
C4
Com
plet
e A
nnou
ncem
ent
of O
ppo
rtun
ity (A
O)
sele
ctio
n fo
r G
eosp
ace
Mis
sion
s fa
r ultr
avio
let
Imag
er.
Whi
te
NA
SA
did
not
rel
ease
the
Ann
ounc
emen
t of
Op
port
unity
for
the
first
G
eosp
ace
mis
sion
.
A d
elay
in r
elea
sing
the
Ann
ounc
emen
t of
Op
port
unity
res
ulte
d fr
om a
de
cisi
on to
rev
erse
the
ord
er
of G
eosp
ace
Mis
sion
s. T
he
Rad
iatio
n B
elt
Map
per
(RB
M)
mis
sion
will
be
laun
ched
firs
t, du
e to
the
part
icul
ar
rele
vanc
e ra
diat
ion
phys
ics
has
to t
he V
isio
n fo
r S
pace
E
xplo
ratio
n.
The
Ann
ounc
emen
t of
Op
port
unity
for
the
Rad
iatio
n B
elt
Map
per
(R
BM
) was
rel
ease
d on
A
ugus
t 23,
200
5, w
ith
sele
ctio
n sc
hed
uled
for
mid
-FY
200
6.
Not
app
licab
le.
15
AP
G
5SE
C1
Com
plet
e S
olar
Ter
rest
rial
Rel
atio
ns O
bser
vato
ry
(STE
RE
O) i
nstr
umen
t in
tegr
atio
n.
Yel
low
N
AS
A c
ompl
eted
ove
r 90
%
of In
stru
men
t in
tegr
atio
n fo
r S
TER
EO
. A
ll U
.S.
inst
rum
ents
hav
e be
en
inte
grat
ed o
n bo
th
spac
ecra
ft. T
wo
Hel
iosp
heric
Im
ager
(HI)
inst
rum
ents
bei
ng
prov
ided
by
an in
tern
atio
nal
part
ner
mus
t b
e in
tegr
ated
. Th
e H
I-A
inst
rum
ent h
as
been
del
iver
ed to
the
spac
ecra
ft, b
ut t
echn
ical
pr
oble
ms
have
del
ayed
in
tegr
atio
n un
til e
arly
Oct
ober
20
05.
HI-
B d
eliv
ery
is
plan
ned
for
Nov
emb
er 2
005.
The
inte
rnat
iona
l par
tner
en
coun
tere
d nu
mer
ous
tech
nica
l pro
blem
s as
soci
ated
with
the
Hel
iosp
heric
Imag
er
inst
rum
ents
, res
ultin
g in
si
gnifi
cant
sch
edul
e sl
ips.
The
mis
sion
tea
m is
us
ing
sche
dule
wor
k-ar
ound
s, w
eeke
nd
wor
k, a
nd d
oubl
e sh
ifts
to m
inim
ize
sche
dule
de
lays
. A
n H
I mas
s m
odel
is b
eing
use
d o
n th
e “B
” sp
acec
raft
so
that
obs
erva
tory
tes
ting
can
proc
eed.
The
S
TER
EO
laun
ch
read
ines
s da
te o
f Apr
il 20
05 is
unl
ikel
y du
e to
th
ese
HI i
nstr
umen
t de
lays
.
Not
app
licab
le.

FY 2
005
Per
form
ance
and
Acc
ount
abilit
y R
epor
t 15
7
Ob
ject
ive
Per
form
-anc
e M
easu
re
Des
crip
tion
Rat
ing
Exp
lana
tion
/ d
escr
iptio
n of
whe
re a
p
erfo
rman
ce g
oal
was
no
t m
et
Why
the
goa
l was
no
t m
et
Pla
ns a
nd s
ched
ules
fo
r ac
hiev
ing
the
goa
l
If th
e g
oal i
s im
pra
ctic
al o
r in
feas
ible
, why
tha
t is
th
e ca
se a
nd w
hat
actio
n is
rec
om
men
ded
17
AP
G
5IS
S7
Bas
elin
e a
stra
tegy
and
in
itiat
e pr
ocur
emen
t of
ca
rgo
del
iver
y se
rvic
e to
the
IS
S.
Yel
low
N
AS
A c
ompl
eted
the
stra
tegy
, but
has
not
inita
ted
pr
ocur
emen
t.
NA
SA
is s
till a
wai
ting
de
taile
d r
equi
rem
ents
from
th
e E
xplo
ratio
n R
equi
rem
ents
Tra
nsiti
on
Team
(exp
ecte
d in
D
ecem
ber)
.
NA
SA
pla
ns to
initi
ate
proc
urem
ent
by th
e se
cond
qua
rter
of F
Y
2006
.
Not
app
licab
le.
Effi
cien
cy
Mea
sure
A
PG
5S
SP
4 C
ompl
ete
all d
evel
opm
ent
proj
ects
with
in 1
10%
of t
he
cost
and
sch
edul
e b
asel
ine.
Yel
low
D
eplo
ymen
t of t
he S
pac
e S
hutt
le m
ain
engi
ne
Ad
vanc
ed H
ealth
Mon
itorin
g S
yste
m (A
HM
S) s
lippe
d 21
m
onth
s. D
eplo
ymen
t to
the
fleet
is n
ow s
ched
uled
for
July
200
6. T
he p
roje
ct
rem
ains
with
in o
vera
ll bu
dget
.
Wor
k on
AH
MS
was
in
terr
upte
d to
sup
port
tes
ting
and
pro
cess
ing
of S
hutt
le
mai
n en
gine
s fo
r re
turn
to
fligh
t. T
he J
uly
2006
dat
e co
uld
also
be
dela
yed
due
to
the
effe
cts
of H
urric
ane
Kat
rina
on m
ain
engi
ne
test
ing
faci
litie
s an
d d
elay
s in
liq
uid
hydr
ogen
pro
duct
ion
and
shi
pmen
ts to
the
Ste
nnis
S
pac
e C
ente
r in
Mis
siss
ippi
.
Pro
cess
ing
of t
he m
ain
engi
nes
for
retu
rn to
fli
ght i
s co
mpl
ete,
and
te
stin
g fa
cilit
ies
at t
he
Ste
nnis
Spa
ce C
ente
r ar
e co
min
g ba
ck o
nlin
e af
ter
Hur
rican
e K
atrin
a.
NA
SA
is w
orki
ng w
ith
loca
l and
nat
iona
l di
strib
utor
s to
sec
ure
ship
men
ts o
f liq
uid
hydr
ogen
fuel
to
com
plet
e A
HM
S
cert
ifica
tion
test
ing.
Not
app
licab
le.
Effi
cien
cy
Mea
sure
A
PG
5A
T28
This
The
me
will
com
plet
e 90
% o
f the
maj
or
mile
ston
es p
lann
ed fo
r FY
20
05.
Red
Th
e A
viat
ion
Saf
ety
and
Sec
urity
Pro
gram
was
abl
e to
mee
t all
its F
Y 2
005
obje
ctiv
es b
y d
efer
ring
the
star
t of t
he a
viat
ion
secu
rity
tech
nolo
gy d
evel
opm
ents
th
at w
ould
sup
port
out
-yea
r go
als.
Ho
wev
er, t
he
mag
nitu
de
of th
e ch
ange
w
as s
igni
fican
tly h
ighe
r fo
r bo
th th
e A
viat
ion
Sys
tem
s an
d V
ehic
le S
yste
ms
Pro
gram
s. A
s a
resu
lt of
ca
ncel
ed p
rocu
rem
ents
, N
AS
A o
nly
acco
mpl
ishe
d
abou
t 60
% o
f the
orig
inal
ly
plan
ned
mile
ston
es in
thes
e tw
o pr
ogra
ms.
The
fund
ing
of C
ongr
essi
onal
S
pec
ial I
nter
est
item
s re
quire
d ap
prox
imat
ely
1/3
of
the
fund
ing
plan
ned
for
acq
uisi
tions
ass
oci
ated
with
th
e ac
com
plis
hmen
t of
prog
ram
/pro
ject
mile
ston
es.
As
a re
sult,
NA
SA
did
not
ac
com
plis
h th
e pl
anne
d ac
tiviti
es.
Not
app
licab
le.
Not
app
licab
le.

FY 2
005
Per
form
ance
and
Acc
ount
abilit
y R
epor
t 15
8
Ob
ject
ive
Per
form
-anc
e M
easu
re
Des
crip
tion
Rat
ing
Exp
lana
tion
/ d
escr
iptio
n of
whe
re a
p
erfo
rman
ce g
oal
was
no
t m
et
Why
the
goa
l was
no
t m
et
Pla
ns a
nd s
ched
ules
fo
r ac
hiev
ing
the
goa
l
If th
e g
oal i
s im
pra
ctic
al o
r in
feas
ible
, why
tha
t is
th
e ca
se a
nd w
hat
actio
n is
rec
om
men
ded
Effi
cien
cy
Mea
sure
A
PG
5S
SE
15
Com
plet
e al
l dev
elop
men
t pr
ojec
ts w
ithin
110
% o
f the
co
st a
nd s
ched
ule
bas
elin
e.
Yel
low
Th
e D
eep
Imp
act
mis
sion
w
as n
ot la
unch
ed w
ithin
11
0% o
f its
sch
edul
e ba
selin
e.
Dee
p Im
pact
did
not
mee
t its
or
igin
al la
unch
rea
dine
ss
date
of J
anua
ry 2
004,
and
ex
ceed
ed th
e co
st b
asel
ine
by 2
6%.
Per
form
ance
pr
oble
ms
with
the
new
, st
ate-
of-t
he-a
rt s
pac
ecra
ft
com
pute
rs d
elay
ed th
eir
deliv
ery
for
inte
grat
ion
and
te
st, w
hich
dro
ve fu
rthe
r de
lays
to th
e sp
acec
raft
in
tegr
atio
n an
d te
st
sche
dule
, slip
ping
the
spac
ecra
ft d
eliv
ery
beyo
nd
the
orig
inal
laun
ch d
ate.
Dee
p Im
pact
was
la
unch
ed s
ucce
ssfu
lly in
Ja
nuar
y 20
05.
Not
app
licab
le.
Effi
cien
cy
Mea
sure
A
PG
5A
SO
14
Del
iver
at l
east
90%
of
sche
dule
d op
erat
ing
hou
rs
for
all o
pera
tions
and
re
sear
ch fa
cilit
ies.
Yel
low
Th
e FU
SE
mis
sion
did
not
m
eet
the
90%
thre
shol
d fo
r op
erat
ing
hou
rs.
(All
othe
r Th
eme
mis
sion
s m
et t
he
thre
shol
d.)
On
Dec
emb
er 2
6, 2
004,
the
z-ax
is r
eact
ion
whe
el
asse
mbl
y fa
iled
. Th
is w
as
the
third
of f
our
asse
mbl
ies
to fa
il on
the
mis
sion
.
The
proj
ect s
tart
ed a
re
cove
ry e
ffort
im
med
iate
ly to
rec
over
co
ntro
l of t
he
spac
ecra
ft. B
ecau
se
the
spac
ecra
ft w
as
desi
gned
to u
se a
m
inim
um o
f 2 re
actio
n w
heel
ass
embl
ies,
an
entir
e m
otio
n co
ntro
l so
ftwar
e ha
d to
be
deve
lop
ed a
nd t
este
d,
with
fina
l on-
orbi
t te
sts
in la
te J
une
2005
. S
cien
ce o
bser
vatio
ns
resu
med
on
July
10,
20
05.
Not
app
licab
le.

FY 2
005
Per
form
ance
and
Acc
ount
abilit
y R
epor
t 15
9
Ob
ject
ive
Per
form
-anc
e M
easu
re
Des
crip
tion
Rat
ing
Exp
lana
tion
/ d
escr
iptio
n of
whe
re a
p
erfo
rman
ce g
oal
was
no
t m
et
Why
the
goa
l was
no
t m
et
Pla
ns a
nd s
ched
ules
fo
r ac
hiev
ing
the
goa
l
If th
e g
oal i
s im
pra
ctic
al o
r in
feas
ible
, why
tha
t is
th
e ca
se a
nd w
hat
actio
n is
rec
om
men
ded
Effi
cien
cy
Mea
sure
A
PG
5S
EC
14
Com
plet
e al
l dev
elop
men
t pr
ojec
ts w
ithin
110
% o
f the
co
st a
nd s
ched
ule
bas
elin
e.
Red
Th
e C
loud
sat
and
CA
LIP
SO
m
issi
ons
wer
e no
t co
mpl
eted
with
in 1
10%
of
thei
r co
st a
nd s
ched
ule
base
lines
.
The
CA
LIP
SO
and
Clo
udS
at
mis
sion
s ar
e cu
rren
tly
estim
ated
to e
xcee
d b
asel
ine
cost
by
mor
e th
an 3
0% a
nd
sche
dule
bas
elin
es b
y ap
prox
imat
ely
50%
. T
he
dela
ys a
nd a
sso
ciat
ed c
osts
re
sulte
d fr
om a
num
ber
of
fact
ors,
incl
udin
g in
stru
men
t pr
oble
ms
on b
oth
mis
sion
s.
Del
ays
have
als
o re
sulte
d
from
ext
erna
l fac
tors
, suc
h as
co-
man
ifest
com
plex
ities
, in
tern
atio
nal p
artn
er
deliv
erie
s, a
nd s
igni
fican
t la
unch
veh
icle
-driv
en d
elay
s.
Clo
udsa
t an
d C
ALI
PS
O
are
sche
dule
d fo
r la
unch
in
ear
ly F
Y 2
006.
Not
app
licab
le.
Effi
cien
cy
Mea
sure
A
PG
5S
EC
15
Del
iver
at l
east
90%
of
sche
dule
d op
erat
ing
hou
rs
for
all o
pera
tions
and
re
sear
ch fa
cilit
ies.
Yel
low
Th
e TO
PE
X/P
osei
don
mis
sion
did
not
mee
t the
90
% th
resh
old
for
oper
atin
g ho
urs.
(Th
e ot
her
Ear
th–S
un
mis
sion
s m
et th
e th
resh
old,
w
ith t
he m
ajor
ity
expe
rienc
ing
no
loss
at
all.)
TOP
EX
does
not
hav
e a
wor
king
tape
rec
ord
er,
crea
ting
a li
miti
ng fa
ctor
for
TOP
EX
scie
nce.
NA
SA
ex
pect
ed t
he th
ree
reco
rder
s to
fail
afte
r a
dec
ade
of
serv
ice
on o
rbit.
D
espi
te
this
, TO
PE
X co
ntin
ues
to
prov
ide
vita
l sci
ence
eve
n th
ough
som
e su
bsys
tem
s no
lo
nger
are
ava
ilabl
e.
The
mos
t im
port
ant
aspe
ct o
f sci
ence
co
llect
ions
has
to d
o w
ith m
easu
rem
ent o
f lo
ng-t
erm
var
iatio
ns o
f oc
ean
surf
ace
topo
logy
. In
term
itten
t in
terr
uptio
ns,
whi
le
unde
sira
ble,
do
not
impa
ct m
ajor
sci
ence
go
als.
NA
SA
is
com
pen
satin
g th
roug
h re
al-t
ime
dow
nlin
king
via
th
e T
DR
SS
co
mm
unic
atio
n sa
tellit
e,
whe
re p
ossi
ble.
Not
app
licab
le.

FY 2005 Performance and Accountability Report 160
Part 3: Financials Divider page photo caption: NASA’s ER-2 takes off from the airport in San Jose, Costa Rica, on July 6, 2005, on its way to fly over hurricane Dennis to collect data for the Tropical Cloud Systems and Processes mission. The 28-day mission studied how tropical storms form and change intensity and the role upper tropospheric/lower stratospheric processes play in the creation and behavior of these storms. (Photo: NASA)
Divider back page photo caption: On August 14, 2005, the Moderate Resolution Imaging Spectroradiometer instrument on NASA’s Terra satellite captured this stunning image of forest fires raging across Alaska. Smoke from more than 100 fires (marked in red) filled the state’s broad central valley and poured out to sea. Hemmed in by mountains to the north and the south, the smoke spread westward and spilled out over the Bering and Chukchi Seas. NASA’s “eyes in the sky” helped the Alaska Department of Environmental Conservation’s Division of Air Quality track the movement of smoke, which caused “very unhealthy” and “hazardous” air conditions across the state. (Photo: NASA)

FY 2005 Performance and Accountability Report 161
LETTER FROM THE CHIEF FINANCIAL OFFICER Message from the AdministratorFY 2005 has been an exciting and challenging year for NASA. The first full year of implementation of the President’s Vision for Space Exploration has resulted in the reprioritization and restructuring of a significant number of NASA’s programs and Centers, significantly impacting budgets and spending across the Agency.
The financial community’s ability to respond to those programmatic changes with appropriate financial structure changes, budgetary realignments and process improvements have helped to ensure that NASA’s program community continues to execute the NASA mission. We in the financial community have the ultimate responsibility for providing timely and reliable financial information to decision-makers throughout the Agency, and I am determined that we will live up to that responsibility regardless of the challenges we face.
A significant accomplishment in 2005 was the alignment of our financial account structure with the programmatic community’s technical work breakdown structure. Not only will this change improve the quality of information provided to decision makers, but it will also significantly improve NASA’s ability to track budget to performance for every NASA program and project. With this improvement, NASA continues to retain and enhance its “Green” position on the President’s Management Agenda scorecard for Budget and Performance Integration.
Equally important are the significant accomplishments and broad progress that NASA has made in improving its financial management practices. While our auditor’s disclaimer of opinion for our FY 2005 financial statements illustrates that we still have room for improvement, the progress we have made has been considerable. For the first time, NASA’s FY 2005 financial statements were produced directly from the Agency’s single, integrated financial management system—with the shortest preparation time and fewest non-standard adjustments in the Agency’s history. Notable in those statements is a 97 percent reduction to our FY 2003 Fund Balance with Treasury imbalance, achieved through an extensive reconciliation and correction process of financial information dating back over 10 years. The implementation of standard monthly reconciliation and monitoring tools will serve to prevent a recurrence of this out of balance condition.
These reconciliation tools are one element of NASA’s on-going implementation of the OMB Circular A-123 on Internal Controls. We are educating both our financial community and our program and project managers about the new circular and what it means to be compliant with the tenets of financial internal controls. We have already completed our own risk assessment and are integrating the results into our aggressive plans for addressing NASA’s financial management challenges.
NASA has also enhanced its financial management policies, processes, and procedures through the introduction of 13 chapters of our Financial Management Requirements. This effort represents a complete update of the Agency’s financial policies. This year, the Agency completed chapters related to internal controls, advances, travel, cash management, and special accounts and funds. FY 2006 enhancements will include budget policies reflecting the bold changes NASA is implementing in its budget formulation process.
NASA has come a long way since the implementation of our Core Financial system three years ago. We are continuing to strive for excellence in financial management and appreciate the efforts of the dedicated men and women in the financial core who are making it happen every day for the people at NASA.
We will continue to execute the initiatives laid out in our Financial Leadership Plan until I am satisfied that we are fully meeting our fiduciary and operating responsibilities to NASA and the American people. I am fully committed to improving the Agency’s financial management, and appreciate the employees, contractors, the Office of Inspector General and its external auditors

FY 2005 Performance and Accountability Report 162
who are providing their efforts and insight as NASA continues on this journey towards financial excellence.
(Original signed by Chief Financial Officer Sykes)
Gwendolyn Sykes Chief Financial Officer

FY 2005 Performance and Accountability Report 163
Financial Overview
Summary of Financial Results, Position, and Condition NASA’s financial statements were prepared to report the financial position and results of operations of the Agency. The principal financial statements include: 1) the Consolidated Balance Sheet, 2) the Consolidated Statement of Net Cost, 3) the Consolidated Statement of Changes in Net Position, 4) the Combined Statement of Budgetary Resources, and 5) the Consolidated Statement of Financing. Additional financial information is also presented in the notes and required supplementary schedules.
The Chief Financial Officers Act of 1990 requires that agencies prepare financial statements to be audited in accordance with Government Auditing Standards. The financial statements were prepared from the NASA Integrated Financial Management system in accordance with Generally Accepted Accounting Principles and accounting policies and practices. The statements should be read with the realization that NASA is a component of the U.S. Government, a sovereign entity. The following paragraphs briefly describe the nature of each required financial statement and its relevance. Significant account balances and financial trends are discussed to help clarify their impact upon operations.
Consolidated Balance Sheet The Consolidated Balance Sheet on page 148 is presented in a comparative format providing financial information for fiscal years 2005 and 2004. It presents assets owned by NASA, amounts owed (liabilities), and amounts that constitute NASA’s equity (net position). Net position is presented on both the Consolidated Balance Sheet and the Consolidated Statement of Changes in Net Position.
Consolidated Statement of Net Cost The Consolidated Statement of Net Cost on page 149 presents the “income statement” (the annual cost of programs) and along with note 12 displays fiscal year expenses by appropriation symbol. The Net Cost of Operations is reported on the Consolidated Statement of Net Cost, the Consolidated Statement of Changes in Net Position, and also on the Combined Statement of Financing.
Consolidated Statement of Changes in Net Position The Consolidated Statement of Changes in Net Position displayed on page 150 identifies appropriated funds used as a financing source for goods, services, or capital acquisitions. This Statement presents the accounting events that caused changes in the net position section of the Consolidated Balance Sheet from the beginning to the end of the reporting period. Cumulative Results of Operations represents the public’s investment in NASA, akin to stockholder’s equity in private industry.
Combined Statement of Budgetary Resources The Combined Statement of Budgetary Resources on page 151 highlights budget authority for the Agency and provides information on budgetary resources available to NASA for the year and the status of those resources at the end of the year.
Funding was received and allocated through the following appropriations:
• Exploration Capabilities—This appropriation provided for the International Space Station and Space Shuttle programs, including the development of research facilities for the ISS; continuing safe, reliable access to space through augmented investments to improve Space Shuttle safety; support of payload and expendable launch vehicle (ELV) operations; and other

FY 2005 Performance and Accountability Report 164
investments including innovative technology development, commercialization, research technology development for future exploration, and initial studies for a future crew exploration vehicle.
• Science, Aeronautics, and Exploration—This appropriation provided for NASA’s research and development activities, including all science activities, global change research, aeronautics, technology investments, education programs, space operations, and direct program support.
• Inspector General—This appropriation provided for the workforce and support required to perform audits, evaluations, and investigations of programs and operations.
Consolidated Statement of Financing The Consolidated Statement of Financing on page 153 provides the reconciliation between the obligations incurred to finance operations and the net costs of operating programs.

FY 2005 Performance and Accountability Report 165
National Aeronautics and Space Admin istration Consol idated Balance Sheet As o f September 30, 2005, and September 30, 2004
(In Thousands of Dollars)
2005 2004
Assets
Intragovernmental
Fund balance with Treasury (Note 2) $ 8,145,941 $ 7,629,298
Investments (Note 3) 17,262 17,077
Accounts Receivable, Net (Note 4) 135,863 116,365
Total Intragovernmental $ 8,299,066 $ 7,762,740
Accounts Receivable, Net (Note 4) $ 59,783 $ 49,793
Materials and Supplies (Note 5) 3,019,292 2,952,031
Property, Plant, and Equipment, Net (Note 6) 34,925,646 34,609,217
Advances and Prepaid Expenses 183 97
Total Assets (Note 9) $ 46,303,970 $ 45,373,878
Liabi l i t ies
Intragovernmental
Accounts Payable $ 55,804 $ 73,972
Other (Notes 7 and 8) 124,691 110,872
Total Intragovernmental $ 180,495 $ 184,844
Accounts Payable $ 2,075,700 $ 2,029,570
Federal Employee and Veterans’ Benefits (Note 7) 62,430 68,876
Environmental Cleanup (Note 14) 824,861 986,891
Other (Notes 7 and 8) 339,862 397,834
Total Liabi l i t ies $ 3,483,348 $ 3,668,015
Net Position
Unexpended Appropriations $ 5,317,741 $ 4,771,482
Cumulative Results of Operations 37,502,881 36,934,381
Total Net Posit ion $ 42,820,622 $ 41,705,863
Total Liabi l i t ies and Net Posit ion $ 46,303,970 $ 45,373,878
The accompanying notes are an integral part of this statement.

FY 2005 Performance and Accountability Report 166
National Aeronautics and Space Admin istration Consol idated Statement o f Net Cost For the Fiscal Years Ended September 30, 2005, and September 30, 2004
(In Thousands of Dollars)
2005 2004
Intragovernmental Gross Costs $ 1,157,927 $ 1,056,475
Less: Intragovernmental Earned Revenue 790,707 616,985
Intragovernmental Net Costs $ 367,220 $ 439,490
Gross Costs With the Public 14,927,031 16,051,593
Less: Earned Revenues From the Public 88,054 61,531
Net Costs With the Public $ 14,838,977 $ 15,990,062
Total Net Cost (Note 12) $ 15,206,197 $ 16,429,552
The accompanying notes are an integral part of this statement.

FY 2005 Performance and Accountability Report 167
National Aeronautics and Space Admin istration Consol idated Statement o f Changes in Net Posit ion For the Fiscal Years Ended September 30, 2005, and September 30, 2004
(In Thousands of Dollars)
2005 Cumulati ve Results of Operations
2005
Unexpended Appropriat ions
2004 Cumulati ve Results of Operations
2004
Unexpended Appropriat ions
Beginning Balances $ 36,934,381 $ 4,771,482 $ 38,730,277 $ 4,291,001
Budgetary F inancing Sources
Appropriations Received — 16,324,048 — 15,380,228
Appropriations Used 15,587,650 (15,587,650) 14,815,775 (14,815,775)
Unexpended Appropriations—Adjustments — (190,139) — (83,972)
Nonexchange Revenue 35,257 — 15,619 —
Donations — — 1 —
Other Financing Sources
Transfers In/(Out) Without Reimbursement 867 — (347,480) —
Imputed Financing 150,923 — 149,741 —
Total Financing Sources $ 15,774,697 $ 546,259 $ 14,633,656 $ 480,481
Net Cost of Operations (15,206,197)
— (16,429,552)
—
Net Change 568,500 546,259 (1,795,896) 480,481
Ending Balances $ 37,502,881 $ 5,317,741 $ 36,934,381 $ 4,771,482
The accompanying notes are an integral part of this statement.

FY 2005 Performance and Accountability Report 168
National Aeronautics and Space Admin istration Combined Statement o f Budgetary Resources For the Fiscal Years Ended September 30, 2005, and September 30, 2004
(In Thousands of Dollars)
2005 2004
Budgetary Resources
Budgetary Author ity
Appropriation Received $ 16,314,970 $ 15,457,160
Opening Balance Adjustment (Note 15) — 13,141
Total Adjusted Appropriat ions Received 16,314,970 15,470,301
Unobl igated Balance
Beginning of Period (Note 15) 3,102,158 1,763,930
Spending from Offsett ing Col lections
Earned
Collected 851,308 632,069
Receivable From Federal Sources 21,256 57,700
Change in Unfilled Orders
Advance Received 10,009 (18,904)
Without Advance From Federal Sources 117,356 124,582
Recover ies of Pr ior Year Obl igations, Actual 9,721 1,332,239
Temporar i ly Not Avai lable
Permanently Not Ava i lable
Cancellations of Expired/No-Year Accounts (60,966) (83,963)
Authority Unavailable Pursuant to Public Law (129,600) (91,269)
Total Budgetary Resources $ 20,236,212 $ 19,186,685
Opening Balance Adjustment (Note 15) — 43,184
Total Adjusted Budgetary Resources $ 20,236,212 $ 19,229,869

FY 2005 Performance and Accountability Report 169
National Aeronautics and Space Admin istration Combined Statement o f Budgetary Resources, Continued For the Fiscal Years Ended September 30, 2005, and September 30, 2004
(In Thousands of Dollars)
2005 2004
Status of Budgetary Resources
Obligat ions Incurred (Note 13)
Direct $ 16,979,027 $ 15,313,397
Reimbursable 1,018,592 679,067
Total Obligat ions Incurred $ 17,997,619 $ 15,992,464
Unobl igated Balance
Apportioned, Currently Available $ 2,073,775 $ 2,353,659
Trust Funds 3,523 3,590
Not Available, Other 161,295 822,691
Total Unobl igated Balances (Note 15) $ 2,238,593 $ 3,179,940
Status Budgetary Resources $ 20,236,212 $ 19,172,404
Opening Balance Adjustment (Note 15) — 57,465
Total Adjusted Status Budgetary Resources $ 20,236,212 $ 19,229,869
Obligated Balance, Net as of Octobe r 1 (Note 15) $ 4,559,222 $ 5,798,062
Obligated Balance, End of Period
Accounts Receivable (140,089) (118,833)
Unfilled Customer Orders (411,458) (294,103)
Undelivered Orders 4,364,114 2,757,050
Accounts Payable 2,123,963 2,124,642
Out lays
Disbursements 16,471,978 15,807,247
Collections (861,317) (613,164)
Subtotal $ 15,610,661 $ 15,194,083
Less: Offsetting Receipts — 1
Net Outlays $ 15,610,661 $ 15,194,082
Opening Balance Adjustment (Note 15) — (8,011)
Total Adjusted Net Out lays $ 15,610,661 $ 15,186,071
The accompanying notes are an integral part of this statement.

FY 2005 Performance and Accountability Report 170
National Aeronautics and Space Admin istration Consol idated Statement o f Financing For the Fiscal Years Ended September 30, 2005, and September 30, 2004
(In Thousands of Dollars)
2005 2004
Resources Used to Finance Activit ies
Budgetary Resources Obligated
Obligations Incurred $ 17,997,619 $ 15,992,464
Less: Spending Authority From Offsetting Collections and Recoveries 1,009,650 2,127,686
Obligations Net of Offsetting Collections and Recoveries 16,987,969 13,864,778
Less: Offsetting Receipts — 1
Net Obl igations 16,987,969 13,864,777
Other Resources
Donations of Property — —
Transfers In/Out Without Reimbursements 867 (347,480)
Imputed Financing from Costs Absorbed by Others 150,923 149,741
Net Other Resources Used to Finance Activi t ies 151,790 (197,739)
Total Resources Used to Finance Activit ies 17,139,759 13,667,038
Resources Used to Finance Items Not Part of the Net Cost of Operations
Change in Budgetary Resources Obligated for Goods, Services,
and Benefits Ordered But Not Yet Provided (1,389,324) (955,583)
Resources That Fund Expenses Recognized in Prior Periods (193,667) (293,686)
Budgetary Offsetting Collections and Receipts That Do Not Affect
the Net Costs of Operations—Other (35,257) (13,623)
Opening Balance Adjustment — 91,933
Resources That Finance the Acquisition of Assets (4,793,850) (1,741,671)
Other Resources or Adjustments to Net Obligated Resources That Do Not
Affect Net Cost of Operation (867) (347,480)
Total Resources Used to Finance Items Not Part of the Net Cost of Operations
(6,412,965) (3,260,110)
Total Resources Used to Finance the Net Cost of Operations 10,726,794 10,406,928

FY 2005 Performance and Accountability Report 171
National Aeronautics and Space Admin istration Consol idated Statement o f Financing, Continued For the Fiscal Years Ended September 30, 2005, and September 30, 2004
(In Thousands of Dollars)
2005 2004
Components of Net Cost That Wil l Not Require or Generate Resources in the Current Per iod
Components Requir ing or Generating Resources in Future Per iods
Increases in Annual Leave Liability (4,184) 7,821
Increases in Exchange Revenue Receivable from the Public 27,997 (100,653)
Other 44,764 106,424
Total Components of Net Cost That Wil l Require or Generate Resources in Future Per iods
68,577
13,592
Components Not Requir ing or Generating Resources
Depreciation 4,417,150 5,814,834
Revaluation of Assets or Liabilities (99) (14,663)
Other (6,225) 208,861
Total Components of Net Cost of Operations That Wil l Not Require or Generate Resources 4,410,826 6,009,032
Total Components of Net Cost of Operations That Wil l Not Require or Generate Resources in the Current Per iod
4,479,403
6,022,624
Net Cost of Operations $ 15,206,197 $ 16,429,552
The accompanying notes are an integral part of this statement.

FY 2005 Performance and Accountability Report 172
National Aeronautics and Space Admin istration Notes to F inancia l Statements
Note 1. Summary of Account ing Pol icies and Operations
Reporting Ent ity
The National Aeronautics and Space Administration (NASA) is an independent Agency that was established by Congress on October 1, 1958 by the National Aeronautics and Space Act of 1958. NASA was incorporated from the Agency’s predecessor organization, the National Advisory Committee for Aeronautics, which provided technical advice to the United States aviation industry and performed aeronautics research. Today, NASA serves as the fulcrum for initiatives by the U.S. in civil space and aviation.
As of August 2004, NASA is organized into four Mission Directorates which focus on the following objectives:
• Exploration Systems: creating new capabilities for affordable, sustainable human and robotic exploration;
• Space Operations: providing critical enabling technologies for much of the rest of NASA through the Space Shuttle, the International Space Station, and flight support;
• Science: exploring the Earth, moon, Mars, and beyond; charting the best route of discovery, and reaping the benefits of Earth and space exploration for society; and
• Aeronautics Research: pioneering and proving new flight technologies that improve the ability to explore and which have practical applications on Earth.
In addition, NASA has eight Mission Support Offices, including the Office of Education and the Office of Safety and Mission Assurance. The Agency’s transformed structure includes a Strategic Planning Council and a supporting Office of Advanced Planning and Integration to enable better long-range planning, an Operations Council to integrate NASA’s tactical and operational decisions, and a number of new or reconstituted committees that support NASA’s focus and direction. The transformed organizational structure is designed to streamline the Agency and position it to better implement the Vision for Space Exploration.
The nine NASA Centers, NASA Headquarters, and the Jet Propulsion Laboratory carry out the activities of the Mission Directorates. The Jet Propulsion Laboratory is a federally funded Research and Development Center owned by NASA but managed by an independent contractor.
Basis of Account ing and Presentation
These consolidated financial statements have been prepared to report the financial position, net cost of operations, changes in net position, budgetary resources, and financing of NASA, as required by the Chief Financial Officers Act of 1990 and the Government Management Reform Act of 1994. The financial statements were prepared from the books and records of the Agency, in accordance with accounting principles generally accepted (GAAP) in the United States of America and Office of Management and Budget (OMB) Bulletin 01-09, Form and Content of Agency Financial Statements and Circular A-136, Financial Reporting Requirements. GAAP for federal entities are the standards prescribed by the Federal Accounting Standards Advisory Board (FASAB), which is the official standard setting body for the federal government.
The financial statements should be read with the realization they are a component of the U.S. government, a sovereign entity. One implication of this is that liabilities cannot be liquidated without legislation providing resources and legal authority to do so. The accounting structure of federal agencies is designed to reflect both accrual and budgetary accounting transactions. Under the accrual method of accounting, revenues are recognized when earned and expenses are recognized when a liability is incurred, without regard to receipt or payment of cash. Budgetary accounting facilitates compliance with legal constraints and controls over the use of federal funds.

FY 2005 Performance and Accountability Report 173
National Aeronautics and Space Admin istration Notes to F inancia l Statements
Note 1. Summary of Account ing Pol icies and Operations, Cont inued
Budgets and Budgetary Accounting
NASA is funded by three appropriations: Science, Aeronautics and Exploration; Exploration Capabilities; and Office of Inspector General.
The Science, Aeronautics, and Exploration appropriation supports the following programs: Science Mission Directorate; Exploration Systems Mission Directorate; and Aeronautics Research Mission Directorate. The Exploration Capabilities appropriation supports the following programs: Space Operations Mission Directorate, which includes Space Station, Space Shuttle, and Space and Flight Support. The Office of Inspector General appropriation funds the audit and investigation activities of the Agency.
Reimbursements to NASA appropriations are used to fund agreements between the Agency and other Federal entities or the public. As part of its reimbursable program, NASA launches devices into space and provides tracking and data relay services for the U.S. Department of Defense, the National Oceanic and Atmosphere Administration, and the National Weather Service.
Use o f Estimates
The preparation of financial statements requires management to make estimates and assumptions that affect the reported amounts of assets and liabilities as of the date of the financial statements and the reported amounts of revenues and expenses during the reporting period. Actual results could differ from these estimates.
Fund Balance with Treasury
Treasury processes cash receipts and disbursements for NASA. Fund Balance with Treasury includes appropriated funds, trust funds, deposit funds, and budget clearing accounts.
Investments in U.S. Government Secur it ies
Intragovernmental non-marketable securities includes the following investments:
• National Aeronautics and Space Administration Endeavor Teacher Fellowship Trust Fund established from public donations in tribute to the crew of the Space Shuttle Challenger.
• Science Space and Technology Education Trust Fund established for programs to improve science and technology education.
Accounts Receivable
Most receivables are for reimbursement of research and development costs related to satellites and launch services. The allowance for uncollectible accounts is based upon evaluation of public accounts receivable, considering the probability of failure to collect based upon current status, financial and other relevant characteristics of debtors, and the relationship with the debtor. Under a cross-servicing agreement with the Department of Treasury, public accounts receivable over 180 days delinquent are turned over to Treasury for collection. The receivable remains on NASA’s books until Treasury determines the receivable is uncollectible or the receivable is internally written off and closed out.
Prepaid Expenses
Payments in advance of receipt of goods or services are recorded as prepaid expenses at the time of payment and recognized as expenses when related goods or services are received.
FY 2005 Performance and Accountability Report 174
National Aeronautics and Space Admin istration Notes to F inancia l Statements
Note 1. Summary of Account ing Pol icies and Operations, Cont inued
Materials and Supp lies
Materials held by Centers and contractors that are repetitively procured, stored and issued on the basis of demand are considered materials and supplies. Certain NASA contractors’ inventory management systems do not distinguish between items that should be classified as materials and those that should be classified as depreciable property. NASA reclassifies as property, all materials valued at $100,000 or greater, in support of large-scale assets such as the Space Shuttle and the International Space Station.
Property, P lant, and Equipment
The Agency and its contractors and grantees hold NASA-owned property, plant, and equipment. Property with a unit cost of $100,000 or more and a useful life of 2 years or more is capitalized; all other property is expensed when purchased. Capitalized costs include all costs incurred by NASA to bring the property to a form and location suitable for its intended use. Under provisions of the Federal Acquisition Regulation (FAR), contractors are responsible for control over accountability for Government-owned property in their possession. NASA’s contractors and grantees report on NASA property in their custody annually and its top contractors report monthly.
Capitalized costs for internally developed software include the full costs (direct and indirect) incurred during the software development stage only. For purchased software, capitalized costs include amounts paid to vendors for the software and material internal costs incurred by the Agency to implement and make the software ready for use through acceptance testing. When NASA purchases software as part of a package of products and services (for example: training, maintenance, data conversion, reengineering, site licenses, and rights to future upgrades and enhancements), capitalized and non-capitalized costs of the package are allocated among individual elements on the basis of a reasonable estimate of their relative fair market values. Costs that are not susceptible to allocation between maintenance and relatively minor enhancements are expensed. NASA capitalizes costs for internal use software when the total projected cost is $1,000,000 or more and the expected useful life of the software is 2 years or more. These Financial Statements report depreciation expense using the straight-line method.
International Space Stat ion
NASA began depreciating the Station in FY 2001 when manned by the first permanent crew. Only the Station’s major elements in space are depreciated; any on-ground elements are reported as Assets Under Construction (AUC) until launched and incorporated into the existing Station structure.
Advances from Others
Advances from Others represent amounts advanced by other Federal and non-federal entities for goods or services to be provided and are included in other liabilities in the Financial Statements.
Liab i l i t ies Covered by Budgetary Resources
Liabilities covered by budgetary resources are liabilities that are covered by realized budgetary resources as of the balance sheet date. Realized budgetary resources include new budget authority, unobligated balances of budgetary resources at the beginning of the year, and spending authority from offsetting collections. Examples include accounts payable and salaries. Accounts payable includes amounts recorded for the receipt of goods or services furnished.

FY 2005 Performance and Accountability Report 175
National Aeronautics and Space Admin istration Notes to F inancia l Statements
Note 1. Summary of Account ing Pol icies and Operations, Cont inued
Liab i l i t ies and Contingencies Not Covered by Budgetary Resources
Generally liabilities not covered by budgetary resources are liabilities for which Congressional action is needed before budgetary resources can be provided. Examples include the Federal Employees’ Compensation Act (FECA) actuarial liability and contingencies.
Liabilities not covered by budgetary resources include certain environmental matters, legal claims, pensions and other retirement benefits (ORB), workers’ compensation, annual leave, and closed appropriations.
Annual, Sick, and Other Leave
Annual leave is accrued as it is earned; the accrual is reduced as leave is taken. Each year, the balance in the accrued annual leave account is adjusted to reflect current pay rates. To the extent current or prior year appropriations are not available to fund annual leave earned but not taken, funding will be obtained from future financing sources. Sick leave and other types of non-vested leave are expensed as taken.
Federal Employee and Veterans’ Benefits
Agency employees participate in the Civil Service Retirement System (CSRS), a defined benefit plan, or the Federal Employees Retirement System (FERS), a defined benefit and contribution plan. For CSRS employees, NASA makes contributions of 8.51 percent of pay. For FERS employees, NASA makes contributions of 10.7 percent to the defined benefit plan, contributes 1 percent of pay to a retirement saving plan (contribution plan), and matches employee contributions up to an additional 4 percent of pay. For FERS employees, NASA also contributes to employer’s matching share for Social Security.
Statement of Federal Financial Accounting Standards No. 5, “Accounting for Liabilities of the Federal Government,” require government agencies to report the full cost of employee benefits (FEHB), and the Federal Employees Group Life Insurance (FEGLI) Programs. NASA used the applicable cost factors and imputed financing sources from the Office of Personnel and Management Letter For Chief Financial Officers, dated August 16, 2004, in these Financial Statements.

FY 2005 Performance and Accountability Report 176
National Aeronautics and Space Admin istration Notes to F inancia l Statements
Note 2. Fund Balance With Treasury (In Thousands of Dollars)
The Fund Balances below represent the total of all undisbursed account balances with the U.S. Treasury summarized by fund type.
Fund Type Treasury Appropriat ions Fund Symbol
Trust Funds 8550, 8977, 8978, 8980
Appropriated Funds 0105, 0107, 0108, 0109, 0110, 0111, 0112, 0113, 0114, 0115
Other Funds 1099, 1435, 3200, 3220, 3880, 3875, 3885, 4546, 6050, 6275, 6276
Trust Funds include balances in Endeavor Teacher Fellowship Trust Fund, National Space Grant Program, Science, Space and Technology Education Trust Fund, and Gifts and Donations.
Appropriated Funds include balances in Space Flight Capabilities, Science, Aeronautics, and Exploration, Mission Support, Human Space Flight, Science, Aeronautics, and Technology, and Office of the Inspector General.
Other Fund types include Fines, Penalties, and Forfeitures, General Fund Proprietary Interest, Working Capital Fund, Collections of Receivables from Canceled Appropriations, General Fund Proprietary Receipts, Budget Clearing and Suspense, Unavailable Check Cancellation, Undistributed Intergovernmental Payment, State and Local Taxes, Other Payroll, and US Employee Allotment Account, Savings Bond.
Fund Balances
2005 2004
Trust Funds $ 3,595 $ 3,592
Appropriated Funds 8,169,040 7,645,106
Other Fund Types (26,694) (19,400)
Total $ 8,145,941 $ 7,629,298
The status of Fund Balance with Treasury represents the total fund balance as reflected in the general ledger for unobligated and obligated balances. Unobligated Balances—Available represent the amount remaining in appropriation accounts that are available for obligation in future fiscal years. Unobligated Balances—Unavailable represent the amount remaining in appropriation accounts that can only be used for adjustments to previously recorded obligations. Obligated Balances—Not Yet Disbursed represent the cumulative amount of obligations incurred, including accounts payable and advances from reimbursable customers, for which outlays have not been made.
Status o f Fund Balance With Treasury
2005
Unobligated Balance
Available $ 2,077,298
Unavailable 161,295
Obligated Balance Not Yet Disbursed 5,936,531
Clearing and Deposit Accounts (29,183)
Total $ 8,145,941

FY 2005 Performance and Accountability Report 177
National Aeronautics and Space Admin istration Notes to F inancia l Statements
Note 3. Investments (In Thousands of Dollars)
Intragovernmental Securities are marketable federal securities bought and sold on the open market. The Bureau of the Public Debt issues non-marketable par value Treasury securities. The trust fund and cash balances are invested in Treasury securities, which are purchased and redeemed at par exclusively through Treasury’s Federal Investment Branch. The effective-interest method was utilized to amortize discounts and premiums.
Amounts for 2005 Balance Sheet Reporting
Cost
Amorti zat ion
Method
Unamorti zed (Premium) Discount
Investments,
Net
Other
Adjustments
Market Value
Disclosure
Intragovernmenta l Securit ies
Non-marketable
Par Value
$ 14,215
Effective-interest 0.0298–8.875%
$ 2,897
$ 17,112
—
$ 17,112
Subtotal $ 2 ,897 $ 17,112 — $ 17,112
Accrued Interest 150 150
Total $ 14,365 $ 17,262
Amounts for 2004 Balance Sheet Reporting
Cost
Amorti zat ion
Method
Unamorti zed (Premium) Discount
Investments,
Net
Other
Adjustments
Market Value
Disclosure
Intragovernmenta l Securit ies
Non-marketable
Par Value
$ 14,067
Effective-interest 0.0846–6.6%
$ 2,862
$ 16,929
—
$ 16,929
Subtotal $ 2 ,862 $ 16,929 — $ 16,929
Accrued Interest 148 148
Total $ 14,215 $ 17,077

FY 2005 Performance and Accountability Report 178
National Aeronautics and Space Admin istration Notes to F inancia l Statements
Note 4. Accounts Receivable, Net (In Thousands of Dollars)
The Accounts Receivable balance includes receivables for reimbursement of research and development costs related to satellites and launch services. The allowance for uncollectible accounts is based upon evaluation of public accounts receivables, considering the probability of failure to collect based upon current status, financial and other relevant characteristics of debtors, and the relationship with the debtor. The allowance for uncollectible accounts was not established for intragovernmental accounts receivables for FY 2005.
September 30, 2005
Accounts
Receivable
Al lowance for Uncol lectible
Accounts
Net Real i zable
Value
Intragovernmental $ 135,863 $ — $ 135,863
Public 60,709 (926) 59,783
Total $ 196,572 $ (926) $ 195,646
September 30, 2004
Accounts
Receivable
Al lowance for Uncol lectible
Accounts
Net Real i zable
Value
Intragovernmental $ 116,365 $ — $ 116,365
Public 50,591 (798) 49,793
Total $ 166,956 $ (798) $ 166,158
Note 5. Inventory and Related Property, Net (In Thousands of Dollars)
Operating Materials and Supplies, Held for Use are tangible personal property held by NASA and its contractors to be used for fabricating and maintaining NASA assets. The property will be consumed in normal operations. Operating Materials and Supplies, Held in Reserve for Future Use are tangible personal property held by NASA for emergencies for which there is no normal recurring demand, but that must be immediately available to preclude delay that might result in loss, damage, or destruction of government property, danger to life or welfare of personnel, or substantial financial loss to the government due to an interruption of operations. All materials are valued using historical costs, or other valuation methods that approximate historical cost. NASA Centers and contractors are responsible for continually reviewing materials and supplies to identify items no longer needed for operational purposes or that need to be replaced. Excess operating materials and supplies are materials that exceed the demand expected in the normal course of operations, and do not meet management’s criteria to be held in reserve for future use. Obsolete operating material and supplies are materials no longer needed due to changes in technology, laws, customs, or operations. Unserviceable operating materials and supplies are materials damaged beyond economic repair. The Operating Materials and Supplies balance reported in the FY 2004 Financial Statements was net of the excess, obsolete, and unserviceable data.
2005 2004
Operating Mater ials and Suppl ies
Held for Use $ 3,401,708 $ 2,948,792
Held in Reserve for Future Use 2,899 3,239
Excess, Obsolete, and Unserviceable (385,315) —
Total $ 3,019,292 $ 2,952,031

FY 2005 Performance and Accountability Report 179
Nat iona l Aeronaut ics and Space Administ rat ion Notes to Financial Statements
Note 6. General Property, P lant, and Equipment, Net (In Thousands of Dollars)
Theme Assets consist of property, plant and equipment specifically designed for use in a NASA program. “Equipment” includes special tooling, special test equipment, and Agency-peculiar property, such as the Space Shuttle and other configurations of spacecraft: engines, unlaunched satellites, rockets, and other scientific components unique to NASA space programs. “Structures, Facilities, and Leasehold Improvements” includes buildings with collateral equipment, and capital improvements, such as airfields, power distribution systems, flood control, utility systems, roads, and bridges. NASA also has use of certain properties at no cost. These properties include land at the Kennedy Space Center withdrawn from the public domain, land, and facilities at the Marshall Space Flight Center under a no cost, 99-year lease with the U.S. Department of the Army. Work-in-Process is the cost incurred for property, plant, and equipment items not yet completed. Work-in-Process includes equipment and facilities that are being constructed. WIP includes the fabrication of assets that may or may not be capitalized once completed and operational. Assets Under Construction represents the costs of fabricating a Theme Asset. These costs are capitalized in their year of operation. If it is determined to not meet capitalization criteria (i.e., less than two years useful life), the project will be expensed to the Statement of Net Cost.
NASA has Station bartering agreements with international agencies including the European Space Agency and the National Space Agency of Japan. NASA barters with these other space agencies to obtain Station hardware elements in exchange for providing goods and services such as Space Shuttle transportation and a share of NASA’s Station utilization rights. The intergovernmental agreements state that the parties will seek to minimize the exchange of funds in the cooperative program, including the use of barters to provide goods and services. As of September 30, 2005, NASA has received some assets from these parties in exchange for future services. However, due to the fact that the fair value is indeterminable, no value was ascribed to these transactions in accordance with APB No. 29. Under all agreements to date, NASA’s Station Program’s International Partners Office expects that NASA will eventually receive future NASA-required elements as well with no exchange of funds.
NASA reports the physical existence (in terms of physical units) of heritage assets as part of the required supplemental stewardship information.
On January 14, 2004, President Bush announced a new vision for the Nation’s space exploration program. Implementation of this initiative has required NASA to prioritize and restructure existing programs and missions, and to phase out sooner than originally planned, or eliminate all together over the next several years, some programs and missions. These programs and missions include the Shuttle, which was originally planned to continue to the year 2020 but now will retire as soon as assembly of the International Space Station is completed (planned for the end of this decade), and the possible cancellation of planned servicing missions to the Hubble Space Telescope.
September 30, 2005 Deprecia tion
Method Useful
L ife
Cost Accumu lated Deprecia tion
Book Va lue
Government-owned/Government-held
Land — — $ 114,136 $ — $ 114,136
Structures, Facilities, and Leasehold Improvements Straight-line 15–40 years
5,566,852 (4,008,284) 1,558,568
Theme Assets Straight-line 2–20 years
42,120,987 (25,699,312) 16,421,675
Equipment Straight-line 5–25 years
2,108,986 (1,483,309) 625,677
Capitalized Leases (Note 10) Straight-line 5–25 years
1,705 (609) 1,096
Internal Use Software and Development Straight-line 5 years 88,476 (25,902) 62,574
Work-in-Process (WIP)
Work-in-Process 199,439 — 199,439
Work-in-Process Equipment 26,039 — 26,039
Assets Under Construction 6,952,974 — 6,952,974
Total $ 57,179,594 $$ (31,217,416) $ 25,962,178

FY 2005 Performance and Accountability Report 180
Nat iona l Aeronaut ics and Space Administ rat ion Notes to Financial Statements
Note 6. General Property, P lant, and Equipment, Net, Cont inued (In Thousands of Dollars)
September 30, 2005, Cont inued
Depreciat ion Method
Useful Li fe
Cost
Accumulated Depreciat ion
Book Value
Government-owned/Contractor-held
Land — — $ 8,076 $ — $ 8,076
Structures, Facilities, and Leasehold Improvements
Straight-line 15–40 years
830,893 (628,063) 202,830
Equipment Straight-line 5–25 years
10,921,290 (8,422,060) 2,499,230
Work-in-Process 6,253,332 — 6,253,332
Total $ 18,013,591 $$ (9,050,123) $$ 8,963,468
Total Property, Plant, and Equipment $ 75,193,187 $$ (40,267,539) $$ 34,925,646
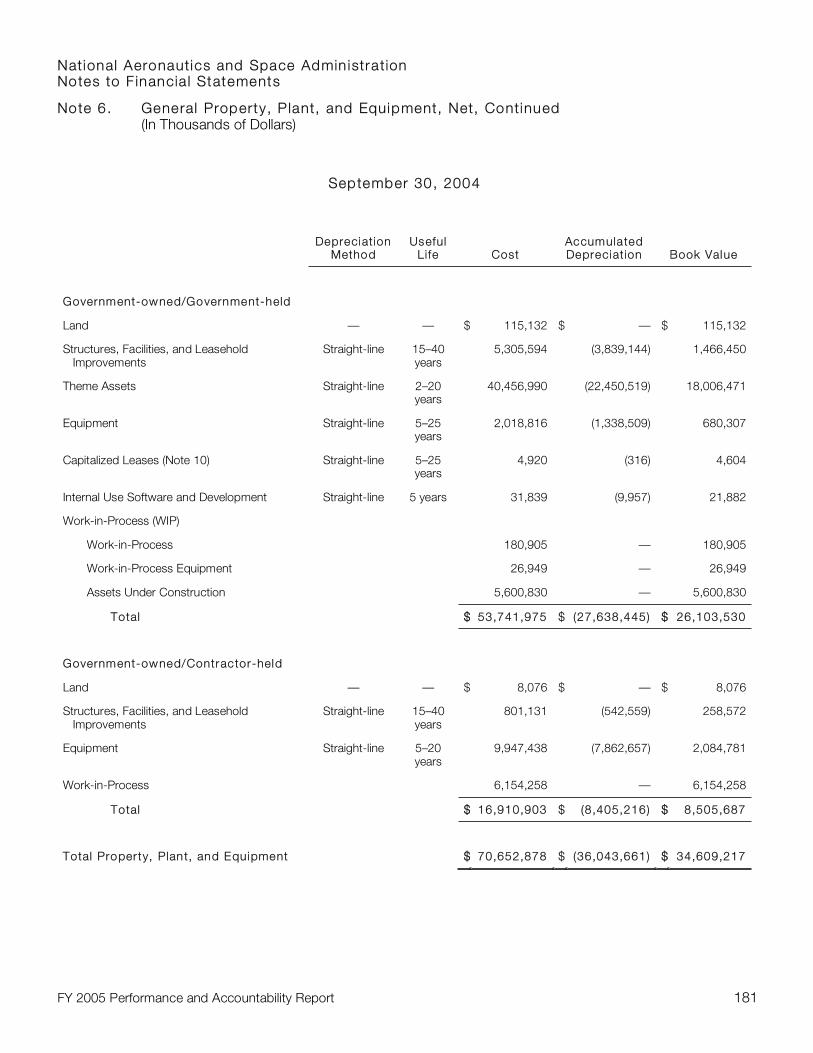
FY 2005 Performance and Accountability Report 181
National Aeronautics and Space Admin istration Notes to F inancia l Statements
Note 6. General Property, P lant, and Equipment, Net, Continued (In Thousands of Dollars)
September 30, 2004
Depreciat ion Method
Useful Li fe
Cost
Accumulated Depreciat ion
Book Value
Government-owned/Government-held
Land — — $ 115,132 $ — $ 115,132
Structures, Facilities, and Leasehold Improvements
Straight-line 15–40 years
5,305,594 (3,839,144) 1,466,450
Theme Assets Straight-line 2–20 years
40,456,990 (22,450,519) 18,006,471
Equipment Straight-line 5–25 years
2,018,816 (1,338,509) 680,307
Capitalized Leases (Note 10) Straight-line 5–25 years
4,920
(316) 4,604
Internal Use Software and Development Straight-line 5 years 31,839 (9,957) 21,882
Work-in-Process (WIP)
Work-in-Process 180,905 — 180,905
Work-in-Process Equipment 26,949 — 26,949
Assets Under Construction 5,600,830 — 5,600,830
Total $$ 53,741,975 $ (27,638,445) $$ 26,103,530
Government-owned/Contractor-held
Land — — $ 8,076 $ — $ 8,076
Structures, Facilities, and Leasehold Improvements
Straight-line 15–40 years
801,131 (542,559) 258,572
Equipment Straight-line 5–20 years
9,947,438 (7,862,657) 2,084,781
Work-in-Process 6,154,258 — 6,154,258
Total $$ 16,910,903 $ (8,405,216) $$ 8,505,687
Total Property, Plant, and Equipment $$ 70,652,878 $ (36,043,661) $$ 34,609,217

FY 2005 Performance and Accountability Report 182
Nat iona l Aeronaut ics and Space Administ rat ion Notes to Financial Statements
Note 7. Liab i l i t ies Not Covered by Budgetary Resources (In Thousands of Dollars)
Liabilities not covered by budgetary resources are liabilities for which Congressional action is needed before budgetary resources can be provided. They include certain environmental matters (Note 14), legal claims, pensions and other retirement benefits, workers’ compensation, annual leave, and closed appropriations. Only a portion of these liabilities will require or generate resources in future periods.
No balances have been recorded in the financial statements for contingencies related to proceedings, actions, and claims where management and legal counsel believes that it is possible but not probable that some costs will be incurred. These contingencies range from zero to $142 million and from zero to $127 million, as of September 30, 2005 and September 30, 2004, respectively.
NASA is a party in various administrative proceedings, court actions (including tort suits), and claims brought by or against it. In the opinion of management and legal counsel, the ultimate resolution of these proceedings, actions and claims will not materially affect the financial position, net cost, changes in net position, budgetary resources, or financing of NASA. Liabilities have been recorded for $5 million and $36 million for these matters as of September 30, 2005 and September 30, 2004, respectively.
A liability was recorded for workers’ compensation claims related to the Federal Employees’ Compensation Act (FECA), administered by U.S. Department of Labor. The FECA provides income and medical cost protection to covered Federal civilian employees injured on the job, employees who have incurred a work-related occupational disease, and beneficiaries of employees whose death is attributable to a job-related injury or occupational disease. The FECA Program initially pays valid claims and subsequently seeks reimbursement from the federal agencies employing the claimants.
The FECA liability includes the actuarial liability for estimated future costs of death benefits, workers’ compensation, and medical and miscellaneous costs for approved compensation cases. The present value of these estimates at the end of fiscal year was calculated by the Department of Labor using a discount rate. This liability does not include the estimated future costs for claims incurred but not reported or approved as of September 30, 2005.
Fiscal Year Discount Rate
2005 4.528%
2004 4.883%
NASA has recorded Accounts Payable related to closed appropriations for which there are contractual commitments to pay. These payables will be funded from appropriations available for obligation at the time a bill is processed, in accordance with Public Law 101-510.
2005 2004
Intragovernmental
Worker’s Compensation $ 15,211 $ 15,787
Accounts Payable for Closed Appropriations 2,097 3,989
Total Intragovernmental $ 17,308 $ 19,776
From the Public
Environmental Cleanup Costs $ 824,861 $ 986,891
Unfunded Annual Leave 170,631 166,448
Actuarial FECA Liability 62,430 68,876
Contingent Liabilities 5,328 36,205
Subtotal $ 1,063,250 $ 1,258,420
Accounts Payable for Closed Appropriations $ 116,593 $ 79,306
Total From the Public $ 1,179,843 $ 1,337,726
Total Liabilities Not Covered by Budgetary Resources $ 1,197,151 $ 1,357,502
Total Liabilities Covered by Budgetary Resources 2,286,197 2,310,513
Total Liab il it ies $ 3,483,348 $ 3,668,015

FY 2005 Performance and Accountability Report 183
National Aeronautics and Space Admin istration Notes to F inancia l Statements
Note 8. Other L iab i l i t ies (In Thousands of Dollars)
September 30, 2005
Current Non-current
Total
Intragovernmenta l Liabi l i t i es
Advances From Others $ 99,321 $ — $ 99,321
Workers’ Compensation (576) 15,787 15,211
Employer Contributions and Payroll Taxes 10,482 — 10,482
Liability for Deposit and Clearing Funds (385) — (385)
Custodial Liability 5,459 — 5,459
Other Liabilities (5,397) — (5,397)
Subtotal 108, 904 15,787 124,691
Accounts Payable for Closed Appropriations 313 1,784 2,097
Total Intragovernmental $ 109,217 $ 17,571 $ 126,788
Liab i l i t ies From the Publ ic
Unfunded Annual Leave $ — $ 170,631 $ 170,631
Employer Contributions and Payroll Taxes 6,355 — 6,355
Accrued Funded Payroll 70,769 — 70,769
Advances From Others 61,704 — 61,704
Contract Holdbacks 1,452 — 1,452
Custodial Liability 10,825 — 10,825
Other Accrued Liabilities 27,481 — 27,481
Contingent Liabilities — 5,327 5,327
Lease Liabilities 160 — 160
Liability for Deposit and Clearing Funds (20,691) — (20,691)
Other Liabilities 5,849 — 5,849
Subtotal 163,904 175,958 339,862
Accounts Payable for Closed Appropriations 39,398 77,195 116,593
Actuarial FECA Liability — 62,430 62,430
Total Liabi l i t i es From the Publ ic $ 203,302 $ 315,583 $ 518,885
Total Other Liabi l i t ies $ 312,519 $ 333,154 $ 645,673

FY 2005 Performance and Accountability Report 184
National Aeronautics and Space Admin istration Notes to F inancia l Statements
Note 8. Other L iab i l i t ies, Cont inued (In Thousands of Dollars)
September 30, 2004
Current Non-current
Total
Intragovernmenta l Liabi l i t i es
Advances From Others $ 90,568 $ — $ 90,568
Workers’ Compensation 6,854 8,933 15,787
Employer Contributions and Payroll Taxes 440 — 440
Liability for Deposit and Clearing Funds 781 — 781
Custodial Liability 2,082 — 2,082
Other Liabilities 1,214 — 1,214
Subtotal 101,939 8,933 110,872
Accounts Payable for Closed Appropriations 947 3,042 3,989
Total Intragovernmental $ 102,886 $ 11,975 $ 114,861
Liab i l i t ies From the Publ ic
Unfunded Annual Leave $ — $ 166,448 $ 166,448
Employer Contributions and Payroll Taxes 14,324 — 14,324
Accrued Funded Payroll 59,037 — 59,037
Advances From Others 82,838 — 82,838
Contract Holdbacks 2,509 — 2,509
Custodial Liability (2,082) — (2,082)
Other Accrued Liabilities 21,438 — 21,438
Contingent Liabilities — 36,205 36,205
Lease Liabilities 2,255 — 2,255
Liability for Deposit and Clearing Funds 9,189 — 9,189
Other Liabilities 5,673 — 5,673
Subtotal 195,181 202,653 397,834
Accounts Payable for Closed Appropriations 34,746 44,560 79,306
Actuarial FECA Liability — 68,876 68,876
Total Liabi l i t i es From the Publ ic $ 229,927 $ 316,089 $ 546,016
Total Other Liabi l i t ies $ 332,813 $ 328,064 $ 660,877

FY 2005 Performance and Accountability Report 185
National Aeronautics and Space Admin istration Notes to F inancia l Statements
Note 9. Non-Ent ity Assets (In Thousands of Dollars)
Non-Entity Assets are those assets that are held by NASA, but are not available for use by NASA. NASA’s non-entity assets include accounts receivable related to closed appropriations, which will be deposited in miscellaneous receipts.
2005 2004
Intragovernmenta l
Accounts Receivable $ 5,458 $ 2,082
Total Intragovernmental $ 5,458 $ 2,082
Due From the Publ ic
Accounts Receivable 10,825 (2,082)
Total Non-Entity Assets $ 16,283 $ —
Total Entity Assets $ 46,287,687 $ 45,373,878
Total Assets $ 46,303,970 $ 45,373,878

FY 2005 Performance and Accountability Report 186
National Aeronautics and Space Admin istration Notes to F inancia l Statements
Note 10. Leases (In Thousands of Dollars)
As of September 30
Entity as Lessee—Capital Leases 2005 2004
Summary of Assets Under Capi tal Lease
Equipment $ 1,705 $ 4,920
Accumulated Amortization of Liability (1,545) (2,665)
Total $ 160 $ 2,255
Capital Leases consist of assorted types of machinery with non-cancelable terms longer than one year, a fair market value of $100,000 or more, a useful life of two years or more, and agreement terms equivalent to an installment purchase.
Future Minimum Lease Payments Fiscal Year Equipment
2006 $ 161
2007 —
2008 —
2009 and After —
Total Future Lease Payments $ 161
Less: Imputed Interest (1)
Net Capital Lease Liabi l i ty $ 160
Lease Liabilities Covered by Budgetary Resources $ 160
Lease Liabilities Not Covered by Budgetary Resources —
Total Lease Liabi l i t ies $ 160

FY 2005 Performance and Accountability Report 187
National Aeronautics and Space Admin istration Notes to F inancia l Statements
Note 10. Leases, Continued (In Thousands of Dollars)
Operating Leases
Operating Leases includes those leases that are not Capital Leases and are for a non-cancelable period in excess of one year. NASA’s FY 2005 Operating Leases include tower rental, a communications Earth station, warehouse storage, copiers, office trailers, and land.
Future Payments Due
Fiscal Year
Land and Bui ld ings
Equipment
Total
2006 $ 14 $ 11,755 $ 11,769
2007 14 8,530 8,544
2008 14 — 14
2009 14 — 14
2010 and After 14 — 14
Total Future Lease Payments $ 70 $ 20,285 $ 20,355
Entity as Lessor : Operat ing Leases
NASA leases and allows use of its land and facilities by the public and other government agencies for a fee.
Future Projected Receipts
Fiscal Year
Land and Bui ld ings
2006 $ 399
2007 379
2008 376
2009 72
2010 and After 770
Total Future Operat ing Lease Receivables $ 1,996

FY 2005 Performance and Accountability Report 188
National Aeronautics and Space Admin istration Notes to F inancia l Statements
Note 11. Gross Cost and Earned Revenue by Budget Functiona l Classi f ication
The breakdown of Gross Cost and Earned Revenue by Budget Functional Classification code was not available for fiscal years 2004 or 2005, as it was configured in SAP at the beginning of the fiscal year to capture the code on the transactions as they occurred.
NASA defined the mapping structure and configured the structure within SAP before FY 2006 opened. Accordingly, NASA will have the means to prepare the breakdown of Gross Cost and Earned Revenue by Budget Functional Classification code for FY 2006.
Note 12. Net Cost by Major Program (In Thousands of Dollars)
2005
Science, Aeronautics, and Exploration $ 7,518,532
Exploration Capabilities 7,946,173
Cross-Agency Support Programs (258,508)
Net Cost of Operations $ 15,206,197
2004
Science, Aeronautics, and Exploration $ 8,558,763
Space Flight Capabilities 6,395,861
Cross-Agency Support Programs 1,474,928
Net Cost of Operations $ 16,429,552
Cross-Agency Support Programs includes the costs of purchasing, disposing, and operating property, plant, and equipment, as well as those for the Office of Inspector General, reimbursable revenue, and other miscellaneous expenses.

FY 2005 Performance and Accountability Report 189
National Aeronautics and Space Admin istration Notes to F inancia l Statements
Note 13. Apportionment Categories of Obligat ions Incurred (In Thousands of Dollars)
2005 2004
Direct Obl igations
Category A $ 1,000 $ 1,000
Category B 16,978,027 15,312,397
Reimbursable Obl igations
Category B 1,018,592 679,067
Total Obl igations Incurred $ 17,997,619 $ 15,992,464
NASA compared the amounts reported on the Statement of Budgetary Resources and the actual amounts reported in the Budget of the United States Government as required by SFFAS No. 7 for FY 2004 and identified no material differences.
The Budget of the United States Government with actual amounts from FY 2005 was not published as of November 15, 2005. The comparison for FY 2005 will be performed when the Budget of the United States Government is published.
Category A consists of amounts requested to be apportioned for each calendar quarter in the fiscal year. Category B consists of amounts requested to be apportioned on a basis other than calendar quarters, such as time periods other than quarters, activities, projects, objects, or a combination thereof.

FY 2005 Performance and Accountability Report 190
National Aeronautics and Space Admin istration Notes to F inancia l Statements
Note 14. Env ironmental and D isposal L iab i l i t ies (In Thousand of Dollars)
Environmental and Disposal Liabilities represent cleanup costs from NASA operations that resulted in contamination from waste disposal methods, leaks, spills, and other past activity that created a public health or environmental risk. Federal, state, and local statutes and regulations require environmental cleanup costs. Some of these statutes are the Comprehensive Environmental Response, Compensation, and Liability Act; the Resource Conservation and Recovery Act; the Nuclear Waste Policy Act of 1982; and State and local laws.
Where up-to-date, site-specific engineering estimates for cleanup are not available, NASA employs commercially available parametric modeling software to estimate the total cost of cleaning up known contamination at these sites over future years.
NASA recorded an unfunded liability in its financial statements to reflect the estimated total cost of environmental cleanup. This estimate could change in the future due to identification of additional contamination, inflation, deflation, and a change in technology or applicable laws and regulations as well as through ordinary liquidation of these liabilities as the cleanup program continues into the future. The estimate represents an amount that NASA expects to spend to remediate currently known contamination, subject to the availability of appropriated funds. Other responsible parties that may be required to contribute to the remediation funding could share this liability.
2005 2004
Environmental Liabilities $ 824,861 $ 986,891
Total Environmenta l and Disposal Liabi l i t ies $ 824,861 $ 986,891

FY 2005 Performance and Accountability Report 191
National Aeronautics and Space Admin istration Notes to F inancia l Statements
Note 15. General In formation
During fiscal year 2003, NASA replaced ten disparate accounting systems and over 120 ancillary subsystems that had been in operation at our Centers for the past two decades, with a commercial off-the-shelf, Agency-wide, Integrated Financial Management system (SAP Core Financials application module). We anticipated the challenges of implementing an organization-wide integrated financial management system and adopting full cost business practices at the Agency, and developed an ambitious but doable plan that spans multiple years to resolve system conversion data problems, and system configuration and functionality limitations.
NASA closed fiscal year 2003 and 2004 with a number of known reconciling items, most of which were resolved during fiscal year 2005. Some resolutions required processing corrective transactions in the financial management system that impact line items on the financial statements.
NASA management decided to process all corrections in the current fiscal year based on the number of transactions for correction, the time frame for processing corrections, and the complexity and functionality of the financial management system. The correction methodology classified some transactions that would potentially have been a prior period adjustment as a current year transaction, possibly overstating current year nominal accounts.
In addition, the reconciling items from fiscal year 2003 and 2004 resulted in the opening balances in some real accounts being misstated or misclassified by Treasury data attribute when fiscal year 2005 opened. The resolution of the reconciling items during fiscal year 2005 provided NASA with solid base to open fiscal year 2006.
NASA used the NASA Audit Tracking Systems (NATS) as the internal control process to track, monitor, and review all corrections processed in the financial management system, as the financial management system did not lend itself to providing detailed tracking of all corrections.
NASA has one key finding from the prior fiscal years that was not resolved during fiscal year 2005. The financial management system has limited functionality that could not be configured to capture the Recovery of Prior Year Obligations (upward and downward obligation adjustments) at the obligation level.
Management is exploring whether a significant portion of PP&E costs are research and development and therefore should be expensed. NASA intends to resolve the accounting policy aspects of its theme asset accounting in FY 2006.

FY 2005 Performance and Accountability Report 192
National Aeronautics and Space Admin istration Required Supplementary Stewardship In formation Stewardship Property , Plant , and Equipment: Heri tage Assets For the Fiscal Year Ended September 30, 2005
Federal agencies are required to classify and report Heritage Assets, in accordance with the requirements of SFFAS No. 8, Supplementary Stewardship Reporting.
Heritage Assets are property, plant, and equipment that possess one or more of the following characteristics: historical or natural significance; cultural, educational, or aesthetic value; or significant architectural characteristics.
Since the cost of Heritage Assets is usually not determinable, NASA does not value them or establish minimum value thresholds for designation of property, plant, or equipment as Heritage Assets. Additionally, the useful lives of Heritage Assets are not reasonably estimable for depreciation purposes. Since the most relevant information about Heritage Assets is their existence, they are qualified in terms of physical units, as follows:
2004 Addit ions Withdrawals 2005
Buildings and Structures 36 1 0 37
Air and Space Museum Displays and Artifacts 496 4 8 492
Art and Miscellaneous Items 1,016 5 0 1,021
Total Her i tage Assets 1,548 10 8 1,550
Heritage Assets were generally acquired through construction by NASA or its contractors, and are expected to remain in this cate-gory, except where there is legal authority for transfer or sale. Heritage Assets are generally in fair condition, suitable only for display.
Many of the buildings and structures are designated as National Historic Landmarks. Numerous aircraft, spacecraft, and related components are on display at various locations to enhance public understanding of NASA programs. NASA eliminated their cost from its property records when they were designated as Heritage Assets. A portion of the amount reported for deferred maintenance is for Heritage Assets.
For more than 30 years, the NASA Art Program has documented America’s major accomplishments in aeronautics and space. During that time, artists generously have contributed their time and talent to record their impressions of the U.S. Aerospace Program in paintings, drawings, and other media. Not only do these art works provide a historic record of NASA projects, they give the public a new and fuller understanding of advancements in aerospace. Artists give a special view of NASA through the “back door.” Some have witnessed astronauts in training or scientists at work. The art collection, as a whole, depicts a wide range of subjects, from Space Shuttle launches to aeronautics research, Hubble Space Telescope, and even virtual reality.
Artists commissioned by NASA receive a small honorarium in exchange for donating a minimum of one piece to the NASA archive. In addition, more works have been donated to the National Air and Space Museum.
In accordance with SFFAS No. 8, Heritage Assets that are used in day-to-day government operations are considered “multi-use” Heritage Assets that are not used for heritage purposes. Such assets are accounted for as general property, plant, and equipment and are capitalized and depreciated in the same manner as other general property, plant, and equipment. NASA has 45 buildings and structures considered to be multi-use Heritage Assets. The values of these assets are included in the property, plant, and equipment values shown in the Financial Statements.

FY 2005 Performance and Accountability Report 193
National Aeronautics and Space Admin istration Required Supplementary Stewardship In formation Stewardship Investments: Research and Development For the Fiscal Year Ended September 30, 2005 (In Thousands of Dollars)
Research and Development Expenses by Enterprise by Programs/Appl ications
In August 2004, NASA restructured from six strategic Enterprises—Human Exploration and Development of Space, Space Science, Earth Science, Biological and Physical Research, Aerospace Technology, and Education Programs—to four Mission Directorates: Exploration Systems, Space Operations, Science, and Aeronautics Research.
The organizational transformation of the six strategic Enterprises to the four Mission Directorates occurred too late in FY 2004 to capture costs, most of which were already incurred, by Mission Directorate and did not provide sufficient lead time to develop the reporting structure in the financial management system for FY 2005.
During FY 2005, NASA developed an organization structure that will allow reporting by mission directorate. The new structure will be implemented in the financial management system with the open of FY 2006. Accordingly, NASA will have the means to prepare the stewardship investments for research and development schedule for FY 2006.

FY 2005 Performance and Accountability Report 194
National Aeronautics and Space Admin istration Required Supplementary Stewardship In formation Stewardship Investments: Research and Development, Cont inued For the Fiscal Years Ended September 30 (In Thousands of Dollars)
Research and Development Expenses by Enterprise by Programs/Appl ications
2003 2002 2001
Human Exploration and Development of Space (HEDS)
Space Operations
Basic Research $ 69,342 $ 369,737 $ 147,869
Applied Research — — 92,419
Development — — 129,386
Subtotal $ 69,342 $ 369,737 $ 369,674
Investment and Support (a)
Basic Research $ — $ — $ —
Applied Research — 27,453 164,241
Development — — —
Subtotal $ — $ 27,453 $ 164,241
Payload Uti l izat ion and Operat ions
Basic Research $ — $ — $ —
Applied Research 217,999 180,888 153,324
Development — — —
Subtotal $ 217,999 180,888 153,324
HEDS Total $ 287,341 $ 578,078 $ 687,239
Space Science (SSE)
Space Science
Basic Research $ 995,286 $ 988,677 $ 581,163
Applied Research — — —
Development 1,761,738 1,836,115 1,179,937
Subtotal $ 2,757,024 $ 2,824,792 $ 1,761,100
Planetary Exploration
Basic Research $ — $ — $ —
Applied Research — — —
Development — — —
Subtotal — — —
SSE Total $ 2,757,024 $ 2,824,792 $ 1,761,100

FY 2005 Performance and Accountability Report 195
National Aeronautics and Space Administration Required Supplementary Stewardship Information Stewardship Investments: Research and Development, Continued For the Fiscal Years Ended September 30 (In Thousands of Dollars)
Research and Development Expenses by Enterprise by Programs/Appl ications 2003 2002 2001
Earth Science (ESE)
Basic Research $ 629,343 $ 544,676 $ 255,678
Applied Research 71,055 105,661 55,161
Development 568,439 837,850 434,577
ESE Total $ 1,268,837 $ 1,488,187 $ 745,416
Biological and Physical Research (BPR) (b )
Basic Research $ 396,351 $ 209,573 $ 69,603
Applied Research 804,673 415,546 112,221
Development 129,013 95,064 32,338
BPR Total $ 1,330,037 $ 720,183 $ 214,162
Aerospace Technology (AT)
Aerospace Technology
Basic Research $ — $ — $ —
Applied Research 1,083,956 2,398,468 1,039,635
Development — — —
Subtotal $ 1,083,956 $ 2,398,468 $ 1,039,635
Advanced Space Transportat ion
Basic Research $ — $ — $ —
Applied Research 5,533 16,049 83,971
Development — — —
Subtotal $ 5,533 $ 16,049 $ 83,971
Commercia l Technology
Basic Research $ 3,776 $ — $ —
Applied Research 104,105 342,302 127,697
Development — 12,415 —
Subtotal $ 107,881 $ 354,717 $ 127,697
AT Total $ 1,197,370 $ 2,769,234 $ 1,251,303
Educat ion (Former ly Academic Programs)
Basic Research $ 121,649 $ 81,271 $ 97,112
Applied Research 47,307 33,844 42,017
Development — — —
Educat ion Total $ 168,956 $ 115,115 $ 139,129
Total Research and Development Expenses by Program $ 7,009,565 $ 8,495,589 $ 4,798,349

FY 2005 Performance and Accountability Report 196
National Aeronautics and Space Admin istration Required Supplementary Stewardship In formation Stewardship Investments: Research and Development, Cont inued For the Fiscal Years Ended September 30 (In Thousands of Dollars)
Non-research and Development Expenses by Enterpr ise by Programs/App lications
2003 2002 2001
Human Exploration and Development of Space (HEDS)
Space Shuttle $ 3,008,610 $ 3,232,011 $ 2,100,835
Space Station 1,510,049 1,727,749 (1,253,026)
Investment and Support 145,031 438,428 —
Space Communication Services 295,008 (18,363) 25,776
Safety, Reliability, and Quality Assurance — 69,868 40,037
Mission Communication Services (46,608) 253,654 32,199
U.S. Russian Cooperative 52 (2) 208
HEDS Total $ 4,912,142 $ 5,703,345 $ 946,029
Space Science (SSE)
Planetary Exploration — (232) 787
SSE Total $ — $ (232) $ 787
Other Programs $ 53,940 $ 138,969 $ 131,737
Reimbursable Expenses $ — $ — $ —
Total Non-research and Development Expenses by Program
$
4,966,082
$
5,842,082
$
1,078,553
Total Program Expenses $ 11,975,647 $ 14,337,671 $ 5,876,902
NASA makes substantial research and development investments for the benefit of the United States. These amounts are expensed as incurred in determining the net cost of operations.
NASA’s research and development programs include activities to extend our knowledge of Earth, its space environment, and the universe, and to invest in new aeronautics and advanced space transportation technologies that support the development and application of technologies critical to the economic, scientific, and technical competitiveness of the United States.
Investment in research and development refers to those expenses incurred to support the search for new or refined knowledge and ideas and for the application or use of such knowledge and ideas for the development of new or improved products and processes, with the expectation of maintaining or increasing national economic productive capacity or yielding other future benefits. Research and development is composed of the following:

FY 2005 Performance and Accountability Report 197
National Aeronautics and Space Admin istration Required Supplementary Stewardship In formation Stewardship Investments: Research and Development, Cont inued For the Fiscal Years Ended September 30
Basic research: Systematic study to gain knowledge or understanding of the fundamental aspects of phenomena and of observable facts without specific applications toward processes or products in mind;
Applied research: Systematic study to gain knowledge or understanding necessary for determining the means by which a recognized and specific need may be met; and
Development: Systematic use of the knowledge and understanding gained from research for the production of useful materials, devices, systems, or methods, including the design and development of prototypes and processes.
The strategies and resources that NASA uses to achieve its performance objectives are highlighted in the Management’s Discussion & Analysis (MD&A) section of this Performance and Accountability Report. The MD&A also provides information regarding the relationship between performance outcomes and outputs to the stewardship investments outlined above. See the MD&A section entitled “FY 2005 Performance Achievement Highlights,” for further details.
(a) In FY 2002, NASA’s appropriation structure was realigned to incorporate the functions of the former Mission Support appropriation to Science, Aeronautics, and Technology and Human Space Flight. This realignment changed the functionality from a Research and Development Program to both Research and Development and Non-Research and Development, as indicated on the schedule above.
(b) In FY 2001, NASA established a new Enterprise, Biological and Physical Research. This initiative transferred Life and Microgravity Science Applications to Biological and Physical Research.
Enterprise/Program/Application Descrip tions
Human Exploration and Development o f Space seeks to expand the frontiers of space and knowledge by exploring, using, and enabling the development of space.
Space Station, or International Space Station is a complex of research laboratories in low Earth orbit in which American, Russian, Canadian, European, and Japanese astronauts are conducting unique scientific and technological investigations in a microgravity environment.
Pay load Uti l i zat ion and Operat ions Program is the “one-stop shopping provider” for all customer carrier needs and requirements for safe and cost effective access to space via the Space Shuttle.
Investment and Support—The Rocket Propulsion Test Support activity will continue to ensure NASA’s rocket propulsion test capabilities are properly managed and maintained in world class condition.
Space Science seeks to chart the evolution of the universe, from origins to destiny, and to understand its galaxies, stars, planetary bodies, and life.
Biologica l and Physical Research affirms NASA’s commitment to the essential role biology will play in the 21st century, and supports the high-priority biological and physical sciences research needed to achieve Agency strategic objectives.
Earth Science develops a scientific understanding of the Earth system and its response to natural and human-induced changes to enable improved prediction of climate, weather, and natural hazards for present and future generations.
Aerospace Technology works to advance U.S. preeminence in aerospace research and technology and to radically improve air travel, making it safer, faster, and quieter, as well as more affordable, accessible, and environmentally sound.
Advanced Space Transportation will create a safe, affordable highway through the air and into space by improving safety, reliability, and operability, while significantly reducing the cost of space transportation systems.

FY 2005 Performance and Accountability Report 198
National Aeronautics and Space Admin istration Required Supplementary Stewardship In formation Stewardship Investments: Research and Development, Cont inued For the Fiscal Years Ended September 30
Education ( fo rmer ly Academic Programs) consists of two components, the Educational Program and the Minority University Program. Together, these components of the Academic Programs provide guidance for the Agency’s interaction with both the formal and informal education community.
Space Shutt le is a partially reusable space vehicle that provides several unique capabilities to the U.S. space program. These include retrieving payloads from orbit for reuse; servicing and repairing satellites in space; safely transporting humans to and from space; launching Station components and providing an assembly platform in space; and operation and returning space laboratories.
Space Communications and Data Services supports NASA’s Enterprises and external customers with Space Communications and Data System services that are responsive to customer needs.
Space Operations’ goal is to provide highly reliable and cost-effective space operations services in support of NASA’s science and aeronautics programs.
Commercial Technology Program facilitates the transfer of NASA inventions, innovations, discoveries, or improvements developed by NASA personnel or in partnership with industry/universities to the private sector.
U.S./Russian Cooperative Program includes all flight activities in support of the joint space missions involving the Space Shuttle and the Russian Mir Space Station.
Enterprise/Program/Application Descrip tions, Continued
Safety, Rel iabi l i ty , and Quali ty Assurance invests in the safety and success of NASA missions by assuring that sound and robust policies, processes, and tools for safety, reliability, quality assurance, and engineering disciplines are in place and applied throughout NASA.
The MMission Communication Services Program, one part of NASA’s Space Communications Program, provides support to the breadth of NASA missions, including planetary and interplanetary missions; Human Space Flight missions; near-Earth-orbiting and spacecraft missions; and suborbital and aeronautical test flight systems.
The PPlanetary Exploration Program encompasses the scientific exploration of the solar system including the planets and their satellites, comets, and asteroids.
Other Programs includes the mission of the Office of Inspector General and programs not directly supportive of a single Enterprise.

FY 2005 Performance and Accountability Report 199
National Aeronautics and Space Admin istration Required Supplementary Information Combined Statement o f Budgetary Resources For Fiscal Year Ended September 30, 2005 (In Thousands of Dollars)
Exploration, Science, and Aeronaut ics
Exploration Capabi l i t i es
Off ice of Inspector General
Other
Total
Budgetary Resources
Budgetary Author ity
Appropriation Received $ 7,742,550 $ 8,551,850 $ 31,600 $ (11,030) $ 16,314,970
Net Transfers, Current Year Authority
196,574 (196,574) — — —
Total Adjusted Appropriat ions Received
$ 7,939,124 $$ 8,355,276 $$ 31,600 $$ (11,030) $$ 16,314,970
Unobl igated Balance
Beginning of Period Anticipated Transfer Balances
$ 1,202,964 $ 560,912 $ 2,601 $ 1,335,681 $ 3,102,158
Spending From Offsett ing Col lections
Earned
Collected $ 475,567 $ 337,668 $ — $ 38,073 $ 851,308
Receivable From Federal Sources
24,768 7,852 50 (11,414) 21,256
Change in Unfilled Orders
Advance Received 907 14,527 — (5,425) 10,009
Without Advance From Federal Sources
26,029 107,481 — (16,154) 117,356
Recover ies of Pr ior Year Obl igations, Actual
$ — $ — $ — $ 9,721 $ 9,721
Permanently Not Ava i lable
Cancellations of Expired/ No-Year Accounts
$ — $ — $ (764) $ (60,202) $ (60,966)
Authority Unavailable Pursuant to Public Law
(61,940) (67,407) (253) — (129,600)
Total Budgetary Resources $ 9,607,419 $$ 9,316,309 $$ 33,234 $$ 1,279,250 $$ 20,236,212

FY 2005 Performance and Accountability Report 200
National Aeronautics and Space Admin istration Required Supplementary Information Combined Statement o f Budgetary Resources, Continued For Fiscal Year Ended September 30, 2005 (In Thousands of Dollars)
Exploration, Science, and Aeronaut ics
Exploration Capabi l i t i es
Off ice of Inspector General
Other
Total
Status of Budgetary Resources
Obl igations Incurred (Note 13)
Direct $ 7,816,840 $ 8,087,848 $ 29,234 $ 1,045,105 $ 16,979,027
Reimbursable 545,699 388,525 50 84,318 1,018,592
Total Obl igations Incurred $ 8,362,539 $$ 8,476,373 $$ 29,284 $$ 1,129,423 $$ 17,997,619
Unobl igated Balance
Apportioned, Currently Available $ 1,270,021 $ 770,818 $ 1,786 $ 31,150 $ 2,073,775
Trust Funds — — — 3,523 3,523
Not Available, Other (25,141) 69,118 2,164 115,154 161,295
Total Unobl igated Balances $ 1,244,880 $$ 839,936 $$ 3,950 $$ 149,827 $$ 2,238,593
Status Budgetary Resources $ 9,607,419 $$ 9,316,309 $$ 33,234 $$ 1,279,250 $$ 20,236,212
Obl igated Balance, Net as of October 1
$ 2,566,808 $ 1,687,471 $ 4,255 $ 300,688 $ 4,559,222
Obl igated Balance, End of Per iod
Accounts Receivable $ (67,424) $ (48,088) $ (50) $ (24,527) $ (140,089)
Unfilled Customer Orders (281,400) (143,315) — 13,257 (411,458)
Undelivered Orders 2,862,029 1,181,620 3,931 316,534 4,364,114
Accounts Payable 932,328 963,022 1,732 226,881 2,123,963
Outlays
Disbursements $ 7,433,017 $ 8,095,272 $ 27,876 $ 915,813 $ 16,471,978
Collections (476,475) (352,194) — (32,648) (861,317)
Subtotal $ 6,956,542 $$ 7,743,078 $$ 27,876 $$ 883,165 $$ 15,610,661
Less: Offsetting Receipts — — — — —
Net Outlays $ 6,956,542 $$ 7,743,078 $$ 27,876 $$ 883,165 $$ 15,610,661

FY 2005 Performance and Accountability Report 201
National Aeronautics and Space Admin istration Required Supplementary Information Combined Schedules of Budgetary Resources For Fiscal Year Ended September 30, 2004 (In Thousands of Dollars)
Current year activity (opening balances) is required to prepare the required supplementary information for the combined statement of budgetary resources and this information was not available in FY 2004.

FY 2005 Performance and Accountability Report 202
National Aeronautics and Space Admin istration Required Supplementary Information Intragovernmenta l Transactions For the Fiscal Year Ended September 30, 2005 (In Thousands of Dollars)
Intragovernmenta l Assets
Agency
Fund Balance With Treasury
Investments
Accounts Receivable
Advances and Prepaid Expenses
Treasury $ 8,145,941 $ 17,262 $ 74 $ —
Air Force — — 60,616 —
Army — — 11,596 —
Commerce — — 39,458 —
Navy — — 10,336 —
National Science Foundation — — 85 —
Secretary of Defense — — 4,532 —
Transportation — — 5,329 —
Other — — 3,837 —
Total $ 8,145,941 $ 17,262 $ 135,863 $ —
Intragovernmenta l Liabi l i t ies
Agency
Accounts Payable
Closed Accounts Payable
Workers’ Compensation
Liabi l i ty for Deposit and Clear ing Funds
Air Force $ 20,235 $ 882 $ — $ 320
Army 954 50 — —
Commerce (4,830) 390 — (33)
Energy 11,571 76 — (369)
Labor 46 — 15,211 —
Navy 2,067 53 — (1,805)
Interior (2,244) 23 — —
National Science Foundation 629 1 — —
Secretary of Defense 7,637 — — (7,985)
Treasury 79 — — —
Transportation 218 — — (586)
Other 17,345 622 — 10,073
Total $ 53,707 $ 2,097 $ 15,211 $ (385)

FY 2005 Performance and Accountability Report 203
National Aeronautics and Space Admin istration Required Supplementary Information Intragovernmenta l Transactions, Continued For the Fiscal Year Ended September 30, 2005 (In Thousands of Dollars)
Intragovernmenta l Liabi l i t ies, Continued
Agency
Advances From
Others
Other
Liab il i t ies
Employer Contr ibut ions and
Payrol l Taxes
Custod ial L iab il i ty
Air Force $ 49,666 $ — $ — $ 107
Army 21,601 — — —
Commerce 8,852 — — —
Energy 214 — — —
Office of Personnel Management — — 10,482 —
Interior 20 — — —
National Science Foundation 36 — — 6
Navy 2,185 — — 18
Secretary of Defense 7,536 — — —
Transportation 2,701 — — 41
Treasury 56 — — —
Veterans Affairs 3,182 — — —
Other 3,272 (5,397) — 5,287
Total $ 99,321 $ (5,397) $ 10,482 $ 5,459
Agency
Intragovernmental Revenue
Intragovernmental Expense
Air Force $ 361,841 $ 138,771
Army 34,392 66,142
Commerce 286,472 21,104
Energy 2,261 136,116
Environmental Protection Agency 2,105 155
National Science Foundation 1,008 12,330
Navy 42,484 55,188
Secretary of Defense 28,998 98,753
Transportation 15,976 21,123
Treasury 257 1,563
Interior 2,649 19,379
Agriculture 4,816 3,266
Veterans Affairs 1,266 601
Other 6,182 583,436
Total $ 790,707 $ 1,157,927

FY 2005 Performance and Accountability Report 204
National Aeronautics and Space Admin istration Required Supplementary Information Intragovernmenta l Transactions, Continued For the Fiscal Year Ended September 30, 2004 (In Thousands of Dollars)
Intragovernmenta l Assets
Agency
Fund Balance With Treasury
Investments
Accounts Receivable
Advances and Prepaid Expenses
Treasury $ 7,629,298 $ 17,077 $ 69 $ —
Air Force — — 53,431 —
Army — — 9,046 —
Commerce — — 25,569 —
Navy — — 9,868 —
National Science Foundation — — 177 —
Secretary of Defense — — 5,521 —
Transportation — — 5,264 —
Other — — 7,420 —
Total $ 7,629,298 $ 17,077 $ 116,365 $ —
Intragovernmenta l Liabi l i t ies
Agency
Accounts Payable
Closed Accounts Payable
Workers’ Compensation
Liabi l i ty for Deposit and Clear ing Funds
Air Force $ 23,117 $ 75 $ — $ —
Army 489 (477) — —
Commerce 258 242 — —
Energy 13,550 (12) — —
Labor 32 — 15,787 —
Navy 3,876 (1) — —
Interior — — — —
National Science Foundation 2,488 — — —
Secretary of Defense 6,571 10 — —
Treasury 525 — — —
Transportation (1,111) — — —
Other 20,188 4,152 — 781
Total $ 69,983 $ 3,989 $ 15,787 $ 781

FY 2005 Performance and Accountability Report 205
National Aeronautics and Space Admin istration Required Supplementary Information Intragovernmenta l Transactions, Continued For the Fiscal Year Ended September 30, 2004 (In Thousands of Dollars)
Intragovernmenta l Liabi l i t ies, Continued
Agency
Advances From
Others
Other
Liabi l i t ies
Employer Contribut ions and
Payrol l Taxes
Custodial Liabi l i ty
Air Force $ 45,703 $ — $ — $ —
Army 17,004 — — —
Commerce 8,246 — — —
Energy 192 — — —
Office of Personnel Management — — 440 —
Interior — — — —
National Science Foundation 3 — — —
Navy 1,563 — — —
Secretary of Defense 6,178 — — —
Transportation 5,021 — — —
Treasury 9 — — —
Veterans Affairs 4,737 — — —
Other 1,912 1,214 — 2,082
Total $ 90,568 $ 1,214 $ 440 $ 2,082
Agency
Intragovernmental Revenue
Intragovernmental Expense
Air Force $ 248,641 $ 133,668
Army 45,515 41,111
Commerce 209,911 16,540
Energy 2,415 125,409
Environmental Protection Agency 1,552 262
National Science Foundation 1,031 12,515
Navy 51,570 35,633
Secretary of Defense 45,304 88,567
Transportation 17,874 17,649
Treasury 221 2,765
Interior 2,906 21,329
Agriculture 4,879 3,756
Veterans Affairs 932 282
Other (15,766) 556,989
Total $ 616,985 $ 1,056,475

FY 2005 Performance and Accountability Report 206
National Aeronautics and Space Admin istration Required Supplementary Information Defer red Maintenance For the Fiscal Year Ended September 30, 2005
NASA has deferred maintenance only on its facilities, including structures. There is no significant deferred maintenance on other physical property, such as land, equipment, assets in space, leasehold improvements, or assets under capital lease. Contractor-held property is subject to the same considerations.
NASA developed a Deferred Maintenance parametric estimating method (DM method) in order to conduct a consistent condition assessment of its facilities. This method was developed to measure NASA’s current real property asset condition and to document real property deterioration. The DM method produces both a parametric cost estimate of deferred maintenance, and a Facility Condition Index. Both measures are indicators of the overall condition of NASA’s facility assets. The DM method is designed for application to a large population of facilities; results are not necessarily applicable for individual facilities or small populations of facilities. Under this methodology, NASA defines acceptable operating condition in accordance with standards comparable to those used in private industry, including the aerospace industry.
While there have been no significant changes in our deferred maintenance parametric estimating method this year, an increase in repairs/renewal of funds associated with the Return to Flight program and hurricane damage repairs to the Vehicle Assembly Building at Kennedy Space Center had a significant impact on the FY 2005 deferred maintenance and facility condition assessment.
Deferred maintenance related to heritage assets is included in the deferred maintenance for general facilities. Maintenance is not deferred on active assets that require immediate repair to restore them to safe working condition and have an Office of Safety and Mission Assurance Risk Assessment Classification Code 1 (see NASA STD 8719.7 in the NASA Facility Systems Safety Guide Book).
2005 2004
Deferred Maintenance Method
Facility Condition Index (FCI) 3.7 3.7
Target Facility Condition Index 4.3 4.3
Backing of Maintenance/Repair Est. Active and Inactive Facilities (in billions) $ 2.3 $ 1.67

FY 2005 Performance and Accountability Report 207
[Original letter on NASA Office of Inspector General letterhead]
November 14, 2005
TO : Administrator Chief Financial Officer
FROM: Inspector General
SUBJECT: Audit of the National Aeronautics and Space Administration’s Fiscal Year 2005 Financial Statements
Under the Chief Financial Officers Act of 1990, NASA’s financial statements are to be audited in accordance with generally accepted government auditing standards. The Office of Inspector General selected the independent certified public accounting firm Ernst & Young LLP (E&Y) to audit NASA’s financial statements in accordance with Government Auditing Standards and Office of Management and Budget (OMB) Bulletin No. 01-02, Audit Requirements for Federal Financial Statements, as amended.
In the enclosed Report of Independent Auditors, E&Y disclaimed an opinion on NASA’s financial statements for the fiscal year ended September 30, 2005. The disclaimer resulted from NASA's inability to provide E&Y auditable financial statements and sufficient evidence to support the financial statements throughout the fiscal year and at year-end.
The E&Y Report on Internal Control includes four reportable conditions of which three are considered to be material weaknesses. Material weaknesses were found in NASA’s controls for: (1) financial systems, analyses and oversight used to prepare the financial statements, (2) reconciling differences in the Fund Balance with Treasury, and (3) assuring that property, plant, and equipment and materials are presented fairly in the financial statements. The final reportable condition concerns weaknesses in NASA’s controls for estimating environmental liability.
The E&Y Report on Compliance with Laws and Regulations identifies several instances in which NASA’s financial management systems did not substantially comply with Federal Financial Management Improvement Act of 1996 (FFMIA) requirements. For example, the report notes that certain subsidiary systems, including property, are not integrated with the Core Financial module. E&Y is also reporting that, based on a referral from the OMB, my office is currently evaluating whether NASA has violated certain provisions of the Anti-Deficiency Act. This referral principally relates to whether obligations exceeded funds as apportioned by OMB.
NASA made significant progress in FY 2005 correcting control weaknesses related to securing the computing environment that supports the Integrated Enterprise Management Program. However, NASA's continued problems in resolving its other internal control weaknesses have contributed to its inability to produce complete and accurate financial statements. Many of NASA’s internal control deficiencies are material weaknesses that have been reported for several years. The Agency has not been able to articulate with clarity comprehensive action plans for how it will address these internal control weaknesses.
To address the weaknesses that E&Y reported, NASA should develop corrective action plans that are fully coordinated with NASA program and institutional leadership and within parameters set by financial management and accounting laws and regulations. The plans must be detailed enough to ensure successful implementation with desired results. In addition, NASA must continue to:
• Ensure that the Chief Financial Officer’s Office is staffed to address the Agency’s financial management and accountability challenges.
• Ensure that accounting practices are consistent with applicable standards and are consistently applied.
• Establish internal controls that provide reasonable assurance that the financial statements are supported, complete, and accurate.
• Identify and correct data conversion and integrity problems in tie Core Financial module.
• Implement recommendations made in E&Y’s Report on Internal Control, and those made by our office and the Government Accountability Office.

FY 2005 Performance and Accountability Report 208
2
E&Y is responsible for each of the enclosed reports and the conclusions expressed therein. Accordingly, we do not express an opinion on NASA's financial statements, internal controls over financial reporting, or compliance with certain laws and regulations including, but not limited to, FFMIA.
In fulfilling our responsibilities under the Chief Financial Officers Act of 1990, we provided oversight and technical support. We monitored the progress of the audit, reviewed reports submitted by E&Y, and ensured that they met contractual requirements.
(Original signed by Inspector General Cobb)
Robert W. Cobb
3 Enclosures

FY 2005 Performance and Accountability Report 209
[Original letter on Ernst & Young letterhead]
Report of Independent Aud itors
To the Administrator and the Office of Inspector General of the National Aeronautics and Space Administration
We were engaged to audit the accompanying consolidated balance sheets of the National Aeronautics and Space Administration (NASA) as of September 30, 2005 and 2004, and the related consolidated statements of net cost, changes in net position and financing and combined statements of budgetary resources for the fiscal years then ended. These financial statements are the responsibility of NASA’s management.
During fiscal year (FY) 2003, NASA implemented an Integrated Financial Management Program (IFMP) system (now referred to as the Integrated Enterprise Management Program (IEMP) system), specifically the Core Financial Module. NASA’s management identified significant errors beginning with its September 30, 2003 financial statements resulting from the implementation of IEMP. During FY 2004 and FY 2005, NASA’s management continued to identify and resolve significant system conversion and data integrity issues, implement internal control, and develop policies and procedures. Additionally, NASA’s management indicated that throughout much of the period, the Core Financial Module could not link manual adjustments/corrections to the original transaction. Further, in FY 2004 and FY 2005 NASA was unable to provide a subsidiary listing of outstanding balances to support certain financial statement balances, including accounts payable and undelivered orders, and NASA’s management was unable to represent that its financial statements were fairly stated. Late in FY 2005, internal control and financial reporting processes using the Core Financial Module were continuing to evolve, including development of routine account analysis and reconciliation processes and analysis of the basis of accounting for property, plant, and equipment. As a result of these limitations, we were unable to obtain sufficient evidential support for the amounts presented in the consolidated balance sheets as of September 30, 2005 and 2004, and the related consolidated statements of net costs, changes in net position and financing and combined statements of budgetary resources for the fiscal years then ended.
Because of the matters discussed in the preceding paragraph, the scope of our work was not sufficient to enable us to express, and we do not express, an opinion on the consolidated balance sheets as of September 30, 2005 and 2004, and the related consolidated statements of net cost, statements of changes in net position and financing, and combined statements of budgetary resources for the fiscal years then ended.

FY 2005 Performance and Accountability Report 210
[Original letter on Ernst & Young letterhead]
Report of Independent Auditors Page 2 of 2
In its preparation and analysis of its September 30, 2005 and 2004 financial statements, NASA’s management identified certain configuration and data integrity issues and significant errors in balances reported on its financial statements. The footnotes to the financial statements describe certain departures or potential departures from accounting principles generally accepted in the United States of America in NASA’s FY 2005 and FY 2004 financial statements and a potential adjustment for certain mission-related assets (theme assets) that, if recorded, could have a significant impact on the financial statements.
The information presented in the Management's Discussion and Analysis (MD&A), Required Supplementary Stewardship Information, and the Required Supplementary Information is not a required part of the NASA’s financial statements but is considered supplementary information required by Office of Management and Budget (OMB) Circular A-136, Financial Reporting Requirements. Such information has not been subjected to auditing procedures, and accordingly, we express no opinion on it. We were unable to apply to the information certain procedures prescribed by professional standards within the time frames established by OMB because of the limitations on the scope of our audit of the financial statements discussed above. Additionally, we were unable to assess control risk relevant to NASA’s intra-governmental transactions and balances, as required by OMB Bulletin No . 01-02, Audit Requirements for Federal Financial Statements, because reconciliations were not performed with certain federal trading partners as required by OMB Circular A-136. Finally, programs identified in the financial statements do not directly align with the major goals and outputs described in the MD&A.
In accordance with Government Auditing Standards, we have also issued our reports dated November 4, 2005, on our consideration of NASA's internal control over financial reporting and on our tests of its compliance with certain provisions of laws, regulations, and other matters. The purpose of those reports is to describe the scope of our testing of internal control over financial reporting and compliance and the results of that testing and not to provide an opinion on the internal control over financial reporting or on compliance. Those reports are an integral part of an audit performed in accordance with Government Auditing Standards and should be considered in assessing the results of our work.
(Original signed Ernst & Young LLP)
November 4, 2005 Washington, D.C.

FY 2005 Performance and Accountability Report 211
[Original letter on Ernst & Young letterhead]
Report on Interna l Control
To the Administrator and the Office of Inspector General of the National Aeronautics and Space Administration
We were engaged to audit the financial statements of the National Aeronautics and Space Administration (NASA) as of and for the year ended September 30, 2005, and have issued our report thereon dated November 4, 2005. The report states that because of the matters discussed therein, the scope of our work was not sufficient to enable us to express, and we do not express, an opinion on the consolidated balance sheet as of September 30, 2005, and the related consolidated statements of net cost, changes in net position and financing and combined statement of budgetary resources for the fiscal year then ended.
In planning and performing our work, we considered NASA's internal control over financial reporting in order to determine our procedures for the purpose of expressing an opinion on the financial statements, which we were ultimately not able to do, and not to provide an opinion on the internal control over financial reporting. We limited our internal control testing to those controls necessary to achieve the objectives described in OMB Bulletin No. 01-02 Audit Requirements for Federal Financial Statements. We did not test all internal controls relevant to operating objectives as broadly defined by the Federal Managers’ Financial Integrity Act of 1982 (FMFIA), such as those controls relevant to ensuring efficient operations. However, we noted certain matters involving the internal control over financial reporting and its operation that we consider to be reportable conditions. Reportable conditions involve matters coming to our attention relating to significant deficiencies in the design or operation of the internal control over financial reporting that, in our judgment, could adversely affect NASA’s ability to initiate, record, process, and report financial data consistent with the assertions of management in the financial statements. The reportable conditions we noted are described below.
A material weakness is a reportable condition in which the design or operation of one or more of the internal control components does not reduce to a relatively low level the risk that misstatements caused by error or fraud in amounts that would be material in relation to the financial statements being audited may occur and not be detected within a timely period by employees in the normal course of performing their assigned functions. Our consideration of the internal control over financial reporting would not necessarily disclose all matters in the internal control that might be reportable conditions and, accordingly, would not necessarily disclose all reportable conditions that are also considered to be material weaknesses. However, of the reportable conditions described above, we consider the first three matters noted—Financial Systems, Analyses, and Oversight; Further Research Required to Resolve Fund Balance with Treasury Differences; and Enhancements Needed for Controls Over Property, Plant, and Equipment and Materials—to be material weaknesses.

FY 2005 Performance and Accountability Report 212
[Original letter on Ernst & Young letterhead]
Report on Internal Control Page 2 of 23
MATERIAL WEAKNESSES
Financial Systems, Analyses, and Overs ight (Modi fied Repeat Cond it ion)
Overview
OMB Circular A-127 requires that financial statements be the culmination of a systematic accounting process. The statements are to result from an accounting system that is an integral part of a total financial management system containing sufficient structure, effective internal control, and reliable data. In fiscal year (FY) 2002, NASA initiated a seven-year agency-wide effort to provide a single, integrated suite of financial, project, contract, and human capital tools to help manage NASA's programs and prepare financial information on a timely basis consistent with evolving OMB guidance. During FY 2003, NASA implemented an Integrated Financial Management Program (IFMP) system (now referred to as the Integrated Enterprise Management Program (IEMP) system), specifically the Core Financial Module. The Core Financial Module replaced ten disparate center-level accounting systems and the NASA headquarters accounting system, along with approximately 120 ancillary subsystems in operations for the past two decades. This conversion effort necessitated complex, extensive data cleanup, which was not always successfully completed.
NASA has positioned itself for further improvement by eliminating the disparate systems at the centers and moving to a single platform . NASA is also processing transactions in the system with a frequent theme of IEMP supporters being that contractors and employees are being paid, and the business of NASA is being conducted. Pending further improvements, NASA's inability to demonstrate sound financial management, inadequate internal controls, and failure to support periodic financial reporting of reliable data severely impacts the credibility of the agency’s reports to oversight entities and the support provided its managers and employees in executing their responsibilities.
NASA’s management identified significant errors beginning with its September 30, 2003 financial statements resulting from the implementation of the IEMP system. During FY 2004 and FY 2005, NASA's management continued to identify and resolve significant system conversion and data integrity issues, implement internal control, and develop policies and procedures. In its preparation and analysis of its quarterly financial statements throughout the year, including the September 30, 2005 financial statements, NASA’s management continued to identify and resolve system configuration and data integrity issues and errors in balances reported on its financial statements. In its explanations to adjustments to NASA’s financial statements for the first three quarters, NASA’s Office of the Chief Financial Officer (OCFO) disclosed among other items:
• The financial management system is not currently designed to distinguish between current transactions and corrections to prior year transactions posted in the current year.
FY 2005 Performance and Accountability Report 213
[Original letter on Ernst & Young letterhead]
Report on Internal Control Page 3 of 23
• Functionality and configuration problems in IEMP created inappropriate transactional postings, which resulted in abnormal balances and misstatement of unobligated and other balances.
• The financial system as currently configured is unable to properly record recovery of prior year obligations.
• The configuration and data integrity issues from FY 2003 and FY 2004 continue to cause misstatements in accounts that contain trading partner data. This has limited NASA’s ability to reconcile and resolve differences with trading partners and to eliminate intraentity transactions.
• Data anomalies and abnormalities caused misstatements in many budgetary and proprietary accounts, potentially causing FY 2005 financial statement data to be inaccurate or incomplete.
An indeterminable amount of activity to adjust prior year errors are reflected in the NASA financial statements as current year activity. NASA’s management indicated that the Core Financial Module could not provide an audit trail for certain transactions and that processes to develop appropriate reports, including subsidiary ledgers, were ongoing.
NASA continues to work toward resolving issues noted in the FY 2004 financial statement audit report related to the lack of an integrated financial management system and inadequate financial accounting and supervisory review processes . For example, certain actions we noted include:
• Financial Statement Preparation. We noted improvement in the financial statement preparation process, including the implementation of detailed analysis and quality control functions. The process was an area of emphasis, with incremental improvements noted each quarter, culminating in statements prepared from the Core Financial Module at year-end, with many adjustments made inside the system prior to preparation of the financial statements. In addition, the financial statement preparation process was also improved through the publication of financial management procedures.
• Policies and Procedures. At the end of FY 2004, NASA published eight volumes of the new NASA Financial Management Requirements (FMR), and during FY 2005, NASA published five additional volumes. These volumes include: Internal Management Controls, Travel, and Special Accounts, issued in April 2005; Periodic Monitoring Control Activities, issued in August 2005; and Cash Management, issued in September 2005. In addition, in May 2005, NASA issued Fund Balance with Treasury Reconciliation procedures, which is referred to in the volume on Periodic Monitoring [continued on next page]

FY 2005 Performance and Accountability Report 214
[Original letter on Ernst & Young letterhead]
Report on Internal Control Page 4 of 23
Controls, but not yet issued as a separate FMR volume. Although we noted progress in the development of the FMRs, due to the limited extent of our testing, we were unable to conclude on the quality, completeness, and accuracy of the FMRs.
• Data Integrity and Monitoring Efforts. In the last half of FY 2005, NASA began a process to develop a monitoring function and to augment center personnel data integrity efforts with supplemental staffing and focused visits from headquarters and contractor personnel.
• Property. We noted progress in the development of the FMRs and the promulgation of standardized policies and procedures surrounding property, plant, and equipment; however, our internal control testing over certain property areas illustrated inconsistencies in the execution of those polices by the centers . For example, we found a lack of supporting evidential documentation and written authorization for certain FY 2005 transactions, which are fundamental control policies noted in the FMR. In addition to publishing property, plant, and equipment policy in the NASA FMR document in September 2004, NASA informed us that major contracts were amended to require monthly reporting of property values into a Web-enabled database. Process improvements in valuation practices, information systems to align the technical and financial work breakdown structures into a single data-management structure to promote consistency, and increased oversight by NASA and outside reviewers are included in ongoing efforts to improve reporting by contractors.
• Fund Balance with Treasury. NASA continues to make progress in resolving its fund balance with Treasury imbalance. While not completely reconciled, major differences identified in the FY 2004 financial statement audit have been researched, and we were informed that many have been corrected. Corrective actions will continue into FY 2006 to demonstrate how prior reconciling items have been cleared and to resolve the current unreconciled balance. One of these actions included recent implementation of policies and procedures for consistent reconciliation processes at the centers.
Although progress was made, significant financial management issues continue to impair NASA’s ability to accumulate, analyze, and distribute reliable financial information. Our review of the internal control continued to disclose numerous weaknesses in NASA’s ability to report accurate financial information on a timely basis. We continue to note that NASA’s Core Financial Module lacks integration with certain subsidiary systems and contains insufficient internal control to detect and support the correction of invalid entries in a timely fashion. Additionally, NASA personnel were not consistently utilizing uniform accounting processes that record, classify, and summarize information for the preparation of financial statements. An integrated financial system, a sufficient number of properly trained personnel, and a strong oversight function are needed to ensure that periodic analyses and reconciliations are completed to detect and resolve errors and irregularities in a timely manner . These processes were being (continued on next page)

FY 2005 Performance and Accountability Report 215
[Original letter on Ernst & Young letterhead]
Report on Internal Control Page 5 of 23
developed in FY 2005, with multiple teams assigned to reviewing output from the Core Financial Module and performing edit and reasonableness checks and other analysis in the last half of the year.
Lack o f an Integrated Financial Management System
The NASA financial management systems are not compliant with the Federal Financial Management Improvement Act of 1996 (FFMIA). FFMIA requires agencies to implement and maintain financial management systems that comply with federal financial management systems requirements as defined by the former Joint Financial Management Improvement Program (JFMIP). More specifically, FFMIA requires federal agencies to have an integrated financial management system that provides effective and efficient interrelationships between software, hardware, personnel, procedures, controls, and data contained within the systems. The lack of an integrated financial management system continues to impair NASA’s and the centers’ abilities to adequately support and analyze account balances reported.
Although NASA implemented a commercial off-the-shelf financial module approved by the former JFMIP, certain aspects of the NASA accounting system lack integration and do not conform to the requirements. NASA’s management continues to identify data integrity and configuration issues in the Core Financial Module that result in inappropriate transactional postings. Additionally, NASA remains unable to design reports from the Core Financial Module that comprise detailed listings of balances to support NASA's September 30, 2005 reported balances. Finally, certain subsidiary systems, including systems used to account for property, plant, and equipment, the largest NASA asset, are not integrated with the Core Financial Module. Specific weaknesses noted include the following:
• During our FY 2004 audit, we were unable to obtain a listing of balances from the Core Financial Module for specific balance sheet accounts, or for cash receipts and cash disbursements to support budgetary outlays during the fiscal year. During FY 2005, the OCFO worked with the Competency Center to design subsidiary reports that should not only be used for audit purposes, but by the OCFO as a routine management tool to ensure analysis, research, and resolution occurs for various account activities and balances. Although the subsidiary reports we received as of June 30, 2005 agreed to general ledger amounts, we noted during our testing that items in the subsidiary reports for balance sheet accounts were transactional-based instead of balance-based. As a result, we had to redesign our testing procedures to recreate account balances. In addition, although the downloads we received for FY 2005 cash receipts and cash disbursements agreed to current Treasury reports, we noted during our testing that many of the items selected represented prior year transactions or adjustments. Because such items are not uniquely identified in the Core Financial Module, we were unable to readily access a population of FY 2005 activity.

FY 2005 Performance and Accountability Report 216
[Original letter on Ernst & Young letterhead]
Report on Internal Control Page 6 of 23
Currently, the centers are able to provide certain subsidiary listings ; however, the listings are frequently being generated from non-routine processes, not directly from the Core Financial Module. However, although the centers use these reports for management oversight purposes, such as aging analyses and collection initiatives, we noted during our testing that several of our sample items for accounts receivable were related to balances that were greater than one year old.
• As noted earlier, the Core Financial Module does not provide for tracking manual non-routine or correction entries with linkage back to the original transaction or the capability to isolate manual adjustments. As a result, adjustments and corrections cannot be readily identified. During FY 2005, NASA began using a separate package, NASA Audit Tracking System (NATS), to track certain NASA-wide adjustments and related support–for management oversight as well as for audit purposes. Although this is a step in the right direction, it is not the solution. Not all adjustments are posted in NATS, and once ultimately posted in IEMP, corrections and adjustments are still not readily identified, and there is not a process to ensure the adjustments are entered into the system correctly.
• Certain subsidiary systems, including all property systems (i.e., NEMS, NRPDB, and CHATS), are not integrated with the Core Financial Module.
• NASA’s management continued to identify certain transactions that are being posted incorrectly due to improper configuration within the Core Financial Module. For example, in its year-end fluctuation analysis provided with the September 30, 200 5 financial statements, NASA indicated that the difference between FY 2004 and FY 2005 amounts for other liabilities was due to incorrect configuration for closing rules for a specific general ledger account, which had been corrected by various NASA centers. NASA further indicated that mispostings caused out-of-balance conditions in payables and budgetary to proprietary reconciliations.
• Due to systematic limitations, NASA centers continue to use alternative approaches to ensure data and financial management information is readily available to make critical decisions. These alternative approaches are inconsistent between centers and may cause varied results in the accuracy of reporting from the centers to headquarters. For example, during our center visits, we noted that some centers use manually created spreadsheets to track invoice due dates to ensure compliance with Prompt Payment Act requirements. However, we noted that other centers rely on IEMP to track the payment due dates for compliance.
Further, several access and segregation of duties issues were noted within the IEMP environment. The level of risk associated with these information technology issues depends in part upon the extent to which financial-related compensating controls (such as reconciliations and robust reviews of output) are in place and operating effectively during the audit period.

FY 2005 Performance and Accountability Report 217
[Original letter on Ernst & Young letterhead]
Report on Internal Control Page 7 of 23
Certain of these controls designed to detect errors or inappropriate processing may also not be executed in a manner which can be expected to identify errors, which, while perhaps not material to the financial statements as a whole, may subject NASA to risks regarding safeguarding of assets. Within the context of the overall weaknesses identified in the control environment referenced in the accompanying comments, although NASA has made progress in addressing and resolving prior year information technology findings, these information technology-related issues merit continued management focus.
Financial Statement Preparat ion and Analys is
During our FY 2004 audit, we noted that because of system conversion issues and the pervasiveness of errors identified in the Core Financial Module, financial statement amounts were found to be unreliable and not complete . For purposes of preparing the first three quarter financial statements during FY 2005, NASA made the decision to utilize estimates or adjustments to IEMP data in preparing its financial reporting to OMB and Treasury because financial statements generated from the Core Financial Module were deemed unreliable. The estimates were based on Treasury reports, FY 2004 balances, and/or budgetary or planned outcomes. Our review of the June 30, 2005 interim financial statements generated by the Core Financial Module identified the following:
• Although the amount is not material, the third quarter balance sheet generated from the Core Financial Module did not balance, meaning that assets did not agree to liabilities plus net position. Adjustments were made outside the system to correct this prior to submission of the quarterly statements to OMB.
• IEMP functionality created inappropriate transaction postings in some account balances. For example, NASA noted in its third quarter explanation for adjustments that some invalid accounts payable balances were noted in some canceled appropriations.
• Unexpended appropriations were decreased by $1.157 billion. In its adjustment explanation, NASA noted that the adjustment was required to align the FY 2005 opening balance in IEMP to the amount reported on the financial statements as an ending balance in FY 2004. NASA also stated in its explanation that the financial management system is not currently designed to distinguish between current transactions and corrections to prior year transactions posted in the current year. NASA is exploring alternatives to develop a process and system design which would allow for distinguishing between current transactions and corrections to prior year transactions posted in the current year. In addition, NASA indicated that it is reconciling and verifying legacy closing balances to the opening balances in IEMP, and that the effort will assist in resolving the FY 2005 opening balance differences. NASA further explained in this adjustment that the opening balances in IEMP are also impacted by the special-purpose ledger repost activities which are used to resolve incorrect configuration postings. As the adjustment is posted, the (continued on next page)

FY 2005 Performance and Accountability Report 218
[Original letter on Ernst & Young letterhead]
Report on Internal Control Page 8 of 23
original transaction is reversed and, when executed, causes beginning balances in some accounts to change as the adjustment is posted to adjust the original transaction in the original period.
The pervasiveness of these and other errors made it impractical for us to perform significant substantive audit procedures on NASA’s June 30, 2005, financial statements.
Although NASA generated its financial statements from the Core Financial Module at September 30, 2005, NASA’s management continued to identify similar issues during FY 2005. Additionally, the data integrity issues identified during FY 2003 continued to impair FY 2005 balances. Finally, NASA continued to identify functionality and configuration issues that impaired its ability to prepare accurate and complete financial statements. For example, in our review of the September 30, 2005 financial statements, we continued to note the following concerns:
• During our testing, we continued to identify situations where costs are not recorded properly. NASA designed its new Core Financial Module to include a system edit whereby, if costs (and the corresponding liabilities) are greater than the associated obligations, the difference would not be recorded in NASA’s general ledger but rather maintained outside of the general ledger system. Instead, the differences were adjusted at the contract/project level by posting a liability to match the excess costs. Statement of Federal Financial Accounting Standards (SFFAS) No. 1, Accounting for Selected Assets and Liabilities, SFFAS No. 4, Managerial Cost Accounting Concepts & Standards, and NASA’s FMRs require costs to be accrued in the period in which they are incurred and any corresponding liability to be recorded as an account payable, regardless of the associated amounts obligated.
• The Core Financial Module was still unable to provide a breakdown of costs by the four mission directorates which NASA has identified as significant segments. This is not consistent with the requirements of SFFAS No. 4, which calls for presentation of costs by responsibility segment.
• Although the first three quarters did not directly crosswalk to the final adjusted financial statements that were ultimately submitted to OMB, the year-end statements were generated directly from the Core Financial Module. However, we noted that many adjustments were posted in the system to arrive at the final balances that crosswalked to the financial statements .

FY 2005 Performance and Accountability Report 219
[Original letter on Ernst & Young letterhead]
Report on Internal Control Page 9 of 23
Addi t ional Controls Need to be Strengthened
The U.S. Government Accountability Office’s (GAO) Standards for Internal Control in the Federal Government states that internal control activities help ensure that management’s directives are carried out. The control activities should be effective and efficient in accomplishing the organization's control objectives. Examples of control activities include toplevel reviews, reviews by management at the functional or activity level, segregation of duties, proper execution of transactions and events, accurate and timely recording of transactions and events, and appropriate documentation of transactions and internal control.
Because significant weaknesses exist in the Core Financial Module, management must compensate for the weaknesses by implementing and strengthening additional controls that will ensure errors and irregularities are detected in a timely manner. The weaknesses identified impact NASA's ability to report accurate financial information. During FY 2005, we found that certain processes were not adequately performed to ensure differences were properly identified, researched, and resolved in a timely manner and that account balances were complete and accurate. The following represents specific areas that need enhanced periodic reconciliation and analysis procedures:
• Manual or Non-Routine Transactions. The Core Financial Module does not provide for tracking of non-routine or correction entries with linkage back to the original transaction. Non-routine transactions are high risk and should be closely monitored. We noted that there was no unique identifier in the system to easily access these transactions. As noted earlier, NASA tracks some, but not all adjustments in NATS. Once posted in IEMP, adjustments or non-routine entries are not always readily identifiable. For example, during our review of adjustment support of the FY 2005 third quarter balance sheet, we noted that the fund balance with Treasury line item was adjusted because the appropriation received amount in TEMP did not agree to the appropriation/Public Law amount. Support for this adjustment was posted in NATS. The posting in IEMP is not readily identified as an adjustment, but would only show at a high level the amount, fund, and general ledger account impacted . Drilling down to the detail in IEMP shows a document reference number which is the support posted in NATS.
• Documentation. We noted that adequate documentation to support certain transactions was not readily available. Our testing of transactions identified several items where we did not receive sufficient information to determine if the transaction was valid. For example, as noted in our FY 2004 audit, NASA could not provide documentation to support whether a grant accrual was required to be reported as part of its financial statements as of September 30, 2005. NASA OCFO personnel indicated that the agency is currently working on policies and procedures to establish and maintain an accrual and expects to have this system in place at the end of FY 2006. In addition, NASA could not provide written evidential documentation authorizing the construction and subsequent (continued on next page)

FY 2005 Performance and Accountability Report 220
[Original letter on Ernst & Young letterhead]
Report on Internal Control Page 10 of 23
transfer of certain real properties to another entity. Similarly, the Office of Inspector General (OIG) of NASA has been working with OCFO to review documentation related to clearance of a portion of the fund balance with Treasury reconciling items from FY 2003 and has stated that the documentation provided is insufficient.
• Periodic Report Preparation and Reviews. NASA remains unable to design and customize reports from the Core Financial Module that comprise detailed listings of balances. Prior to our testing of contracts and grants, we requested separate listings of grants and contracts that were open in FY 2005. After multiple iterations, we received separate listings for grants and contracts that were certified by the centers as being complete. During our testing however, we noted that our sample selections for both grants and contracts contained many items that had previously been closed. In addition, during our visit to one center, we noted a significant backlog of grants where closeout and de-obligations of remaining amounts were pending. For example, we noted during our visit that approximately 3,300 grants from FY 1998 to FY 2005 were awaiting closeout and de-obligations for a total of approximately $49.3 million. Further, we noted several grant and contract sample items where requested supporting documentation was not in the files .
The GAO’s Standards for Internal Control in the Federal Government indicates that internal control monitoring should assess the quality of performance over time and ensure that findings of audits and other reviews are promptly resolved . Without appropriate monitoring and oversight of contractor operations, deficiencies in internal control may allow material misstatements to occur without being identified in a timely manner.
Given the severity of these issues, including system and process limitations and expertise needed in the new and future financial reporting requirements, it will take a sustained commitment and a qualified support team to resolve these issues in preparation for FY 2006 and future years.
Recommendation
We recommend that NASA continue to develop and refine its financial management systems and processes to improve its accounting, analysis, and oversight of financial management activity. Specifically, we recommend that NASA:
• Continue to improve its financial reporting and internal quality review procedures to reasonably assure that information presented in the Performance and Accountability Report is accurate and is consistent with the requirements of OMB Circular A-136, Financial Reporting Requirements.

FY 2005 Performance and Accountability Report 221
[Original letter on Ernst & Young letterhead]
Report on Internal Control Page 11 of 23
• Configure the Core Financial Module to provide a breakdown of net costs consistent with programs identified in NASA's strategic plan and in the Management’s Discussion and Analysis (MD&A) section of the financial statements.
• Ensure that systems used to prepare the financial statements are complete and have been sufficiently tested prior to interim and year-end reporting dates. NASA should continue to validate its data within the Core Financial Module to resolve issues with data integrity that date back to the system conversion in FY 2003 to ensure that data is accurate and complete. In addition, NASA should continue to develop a long-term solution within TEMP to identify, support, and track adjustments made to general ledger accounts.
• Continue to devise short-term and long-term resolutions to IEMP systematic and integration issues and the lack of internal controls surrounding costs in excess of obligations and downward adjustments.
• Formally document roles and responsibilities of its headquarters, IEMP Competency Center, and center financial management personnel across all levels to ensure that appropriate responsibilities are aligned with job functions and that accountability is achieved at each level. Additionally, we recognize that resource limitations may constrain NASA's ability to execute its mission. Management should continue to focus on filling key vacancies within the financial management organization.
• Provide additional "hands–on" training for financial personnel – at headquarter and center levels – to ensure that they understand their roles in processing transactions, performing account analyses and reconciliations, maintaining supporting documentation, and updating their knowledge of financial reporting requirements.
• Develop reports from the Core Financial Module to facilitate reviews and ensure that agings of transactions and open items, unliquidated obligations, grants, and other key areas are periodically assessed, researched, and resolved.
Further Research Required to Reso lve Fund Balance with Treasury Di fferences (Modi fied Repeat Condi t ion)
An agency’s fund balance with Treasury represents monies an agency can spend for authorized transactions, which are based on budget spending authorizations and are made available through Treasury warrants. Amounts available are increased or decreased as monies are collected and disbursed. Although Treasury serves as the central processing facility for federal entities, Treasury does not maintain independent accounting records of each agency’s fund balance with Treasury but relies instead on monthly data reported by each agency for its record of agency collections, disbursements, and fund balance with Treasury.

FY 2005 Performance and Accountability Report 222
[Original letter on Ernst & Young letterhead]
Report on Internal Control Page 12 of 23
Throughout FY 2003, NASA implemented, in phases, a commercial off-the-shelf, agency-wide, integrated financial management system that replaced ten separate accounting systems in operation at NASA centers. This effort, which involved converting accounting data in the "legacy" accounting systems to a new accounting system, created complex accounting issues for FY 2003. Consequently, as noted in the FY 2003 audit report, as well as in our FY 2004 audit report, NASA posted year-end adjustments outside its Core Financial Module, which indicated that the difference between its fund balance with Treasury balance and Treasury’s balance was significantly greater than had been presented in its year-end reconciliation. In addition, these adjustments did not provide sufficient documentary evidence to explain the linkage between the adjustments and the unreconciled differences identified on headquarters’ fund balance with Treasury reconciliations as of September 30, 2003.
During FY 2004 and FY 2005, the NASA headquarters and its centers expended much effort analyzing the FY 2003 year-end adjustments to the fund balance with Treasury account and the impact to other related accounts. As a result, NASA classified the transactions into four major categories: document conversion, canceled appropriations, trust fund transfer, and other reconciling items. The correcting adjustments involved analysis of thousands of transactions that were not processed through the new financial system, not coded correctly, or were included erroneously in the new system during the conversion. The work to validate the correction process is ongoing. The OIG has been working with OCFO to review documentation related to clearance of a portion of the cash reconciling items from FY 2003 and has stated that the documentation provided is insufficient.
Although we were informed that many errors from FY 2003 were resolved, significant errors within the accounting system were still being identified by NASA in FY 2005. Fund balance with Treasury reconciliation processes were ineffective in FY 2004 and much of FY 2005, through the date of our visits to centers, but it is our understanding that steps taken by NASA in the last quarter of the year are believed by NASA management to have substantially improved the effectiveness of such reconciliations. Through our discussions with OCFO personnel, they appear to have analyzed the differences by center to determine what differences can be explained and resolved as of September 30, 2005. However, because we had not yet received the subsequent month's reconciliations prior to the end of our fieldwork, we were unable to determine if these have been resolved.
OCFO identified a net value difference of $58.9 million between the Core Financial Module and the Treasury balance, where the Core Financial Module balance was greater than the Treasury balance; and an absolute value difference of $80 million when differences are summarized at the Application of Funds (AOF) level (Treasury symbol). Such differences increase to an absolute value of $1.1 billion when differences are summarized at the detail level, by center and AOF. In addition, the total amount reported in NASA’s Budget Clearing Account (a suspense account used to temporarily record transactions requiring further research) as of September 30, 2005, was (continued on next page)

FY 2005 Performance and Accountability Report 223
[Original letter on Ernst & Young letterhead]
Report on Internal Control Page 13 of 23
$5.8 million, with an absolute value of $86.1 million. These amounts may include the data conversion adjustments identified during FY 2003, as well as additional differences that have occurred throughout FY 2004 and FY 2005. These balances will require further research to determine the respective amounts and causes of the timing differences, errors, and resulting resolutions.
One of NASA headquarters’ reconciliation steps to understanding these differences includes identifying differences between amounts in the Central Resources Control System (CRCS) and the Core Financial Module, by AOF and center. CRCS is the database used by OCFO for budget control by establishing resource plans for all levels. Each month, Resources Authority Warrants (NF 506) are issued from headquarters to centers and monthly activities are posted to CRCS. NASA personnel indicated differences between CRCS and the Core Financial Module occur because of timing differences on entering funding data and fund allocations in CRCS and the Core Financial Module between headquarters and the centers. NASA uses the Core Financial Module to CRCS difference to account for some of the overall Treasury to the Core Financial Module differences. In FY 2005, however, this difference only accounted for a net $4.1 million of the $58 .9 million difference.
In May 2005, NASA OCFO issued final policies to the centers for reconciling fund balance with Treasury. The purpose of the procedures is to provide consistent guidance NASA-wide that outlines the requirements for reconciling fund balance with Treasury. It is applicable to each NASA center by Business Area and AOF. During our limited review of procedures in place to comply with the new policy, we noted some progress. In addition, we were also informed that during the last quarter of FY 2005, headquarters OCFO’s Office of Quality Assurance conducted on-site quality assistance reviews, including reviews of fund balance with Treasury reconciliations, at all centers. However, we noted that the unreconciled difference shown on the headquarters prepared fund balance with Treasury reconciliation does not agree to the detail shown on the centers’ reconciliation. OCFO personnel attributed this difference to receipt type AOFs being shown on the headquarters reconciliation but were not included in the centers’ reconciliations. According to OCFO, these receipt type AOFs will be included in the center reconciliations beginning in October 2005. Further, we noted for the NASA agency-wide account (Business Area code 01), NASA headquarters currently does not conduct the same review that the centers perform for the unreconciled fund balance with Treasury differences. OCFO personnel indicated that they are developing a process to enhance the analysis of the data for business area code 01.
Treasury regulations require that each federal entity ensure that it reconciles on a monthly basis its financial records with Treasury's records and that it promptly resolves differences. If this reconciliation is not adequately performed, loss, fraud, and irregularities could occur and not be promptly detected, and/or financial reports that are inaccurate may be prepared and used in decision-making.

FY 2005 Performance and Accountability Report 224
[Original letter on Ernst & Young letterhead]
Report on Internal Control Page 14 of 23
Recommendation
We recommend that NASA continue to improve its current procedures to ensure that all reconciling items are thoroughly researched, timely resolved, and reviewed by appropriate center and headquarters OCFO personnel . In addition, NASA should retain all reports and documentation used in performing its fund balance with Treasury reconciliations to ensure that detailed, documented explanations and resolution actions are maintained for a sufficient audit trail.
Enhancements Needed for Controls Over Property, P lant , and Equipment and Materials (Modi fied Repeat Condit ion)
Consistent with prior year audit reports, our review of property, plant, and equipment (PP&E), totaling approximately $35.0 billion, identified serious weaknesses in internal control that, if not corrected, could prevent material misstatements from being detected and corrected in a timely manner. As stated in the prior year audit report, NASA’s current approach to recognizing and accounting for fixed assets relies on reviews of disbursements after they have been made to determine amounts which should be capitalized and is heavily dependent on activities at its contractors to recognize any assets created at its contractors. Currently, NASA expenses all costs and then performs a review of the transactions to determine which costs should be capitalized. The subsequent review and dependence on contractor reporting increases the risk that costs will not be properly capitalized. Until NASA successfully implements a single integrated system for reporting PP&E, and develops a methodology to identify costs that need to be capitalized as the transaction is processed, NASA will continue to experience difficulties in recording property-related balances and transactions. We were informed that certain overarching changes in NASA's processes for accounting for property were under development, including incorporation of new requirements to track government-furnished property and realignment of NASA coding structures in a manner that may facilitate developing estimates of planned acquisition activity, tracking such activity through the procurement cycle and recording property acquisition as the disbursements are made. Pending implementation of such overarching solutions, further emphasis on internal and external processes at headquarters, the centers, and the contractor locations is needed to ensure that amounts reported in its financial statements are reliable.
During our FY 2005 testing, we continued to note evidence of significant weaknesses in the property area. The weaknesses we noted during FY 2005, most of which are consistent with last year’s audit report, fundamentally flow from not determining at the point of budget formulation, obligation recognition, contract development, accounts payable recognition, or disbursement the amounts of property NASA expects to buy, has contracted for, or has purchased. Rather, NASA waits until the entire transaction cycle is complete to obtain disbursement data for capitalization or, in the case of contractors, expects their contractors to do so. Insufficient internal controls (continued on next page)

FY 2005 Performance and Accountability Report 225
[Original letter on Ernst & Young letterhead]
Report on Internal Control Page 15 of 23
surrounding contractor-held PP&E, materials, and NASA-held theme assets, NASA-held work in progress (WIP), and NASA-held real and personal property are addressed below:
Contractor-Held Property :
The reliance upon NASA’s contractors to report property values at periodic intervals during the year without robust agency-wide controls to ensure the reliability and validity of those property values may increase the probability of errors and deficiencies not being detected by NASA or reported by contractors . As noted in the prior year report and found during our FY 2005 audit work, the OCFO's utilization of the Defense Contract Audit Agency (DCAA) as its primary quality assurance mechanism over NASA's contractors has in fact uncovered errors in contractor amounts reported, which in turn provided management visibility to evaluate and assess the impact on the 2005 year-end financial statements. However, DCAA's role and the procedures that it performs cannot be relied upon by NASA management alone to ensure the reliability and validity of contractor-held property values. For instance, as noted in one FY 2005 DCAA Agreed Upon Procedures (AUP) Report, a $553 million overstatement of WIP was discovered by the contractor in January 2004 (FY 2004), but was not reported by the contractor as an "adjustment" in its subsequent quarterly reports. Because DCAA uses these quarterly reports as a basis for its procedures, it was not discovered in the prior year AUP. Accordingly, DCAA only became aware of it during its FY 2005 procedures . Furthermore, the adjustment was reported by the contractor in its annual Form 1018 ("Property in the Custody of Contractors") filing, but not in time for recording into the FY 2004 financial statements.
Management has made progress during FY 2005 in this regard as noted below, but until management develops a robust framework of internal controls within NASA, these initiatives will not fully address the weaknesses related to contractor-held property:
• In FY 2005, the coverage period for the DCAA procedures was expanded to the performance of procedures on the June 30, 2005 property values. However, there were no other procedures performed during the last quarter to test for any significant or unusual activity. It is therefore, recommended that management consider incorporating analytical and inquiry procedures for the fourth quarter for DCAA to perform while conducting its more extensive agreed upon procedures on the June 30, 2005 balances.
• Certain major contractors are required to report and "certify" their property values on a monthly basis via the Web-enabled Contractor-Held Asset Tracking System (CHATS). Currently, each contractor has one assigned person to report and certify the accuracy of the reported balances in CHATS . We recommend that management consider further emphasis on the contractor's ability to detect and correct errors by creating a second-level certification requirement in CHATS for each contractor. Furthermore, several contractors are reliant upon their subcontractors to provide the property values to the contractor for inclusion in the contractor's report as part of the monthly reporting process. It would be incumbent upon the (continued on next page)

FY 2005 Performance and Accountability Report 226
[Original letter on Ernst & Young letterhead]
Report on Internal Control Page 16 of 23
contractors to require a similar certification from their subcontractors or perhaps upon NASA to consider requiring specific contractor certification of subcontractor balances in the requirements . One alternative might also be for specific subcontractors to also utilize CHATS and self certify.
• Management issued Procurement Information Circular 05-07 effective October 1, 2005 to address certain documentation requirements for government-furnished (GF) property matters, such as the transfer of GF property to contractors and between contractors, which were discussed in the FY 2004 audit report. Specifically, it requires Contracting Officers to continually update and track all GF property and acquisition values maintained by a contractor throughout the life of the contract. This would require modification to the list to include any property furnished after the award of the contract.
NASA-Held Theme Assets Operational and WIP:
Beginning in FY 2004 and continuing throughout FY 2005, NASA has undertaken a project to review its policies (both accounting and procedural) with respect to theme assets (previously referred to as assets in space) to identify the specific types of costs that should be capitalized and those that should be expensed. These policies incorporated financial and engineering authoritative guidance as well as NASA program/project management policy to ensure consistent application and documentation. As one aspect of addressing the accounting issue over which costs are expensed versus capitalized for theme assets in progress and those yet to be undertaken, management during FY 2005 revised the engineering authoritative guidance contained in NASA Procedural Requirement 7120 .5C, NASA Program and Project Management Processes and Requirements. This requirement defines the four management requirements for formulating, approving, implementing, and evaluating NASA programs and projects.
We were informed that effective October 1, 2005, the Project Management Information Improvement (PMII) initiative was implemented within the Core Financial Module in an attempt to provide better project management information to aid in decision-making. PMII implemented an aligned budget structure and technical work breakdown structure (WBS) in the Core Financial Module to support the agency's Earned Value Management initiative.
The PMII initiative will implement the FY 2006 budget structure and provide a technical WBS in the Core Financial Module which NASA has stated is the first step toward improving project management information.
NASA has stated that some key benefits of PMII are that it:
• Improves NASA's accountability and enables full cost management.
• Aligns the agency's technical WBS with the finance coding structure.
FY 2005 Performance and Accountability Report 227
[Original letter on Ernst & Young letterhead]
Report on Internal Control Page 17 of 23
• Ensures data standardization and configuration management.
• Provide a consistent and standardized tool for project management reporting.
• Provides timely, consistent, and reliable information for management decisions.
• Allows program and project managers to view detailed costs and obligations associated with a project.
NASA capitalizes costs for theme assets based on subsequent reviews of expenses, which, as discussed earlier, creates weaknesses in NASA's ability to accurately capture and report such costs. NASA management has informed us that they believe PMII will aid in creating sufficient specificity in NASA purchasing activity to facilitate tracking and reporting of all types of property acquisition activity, including the subset of such activity related to theme assets as projects are initiated and disbursements are made.
In FY 2005, NASA revisited its process to account for theme assets and developed a number of approaches, most recently positing that it is possible that much theme asset activity is fundamentally research and development and that such costs should be expensed. This contrasts with earlier views that none or a small part of such activity constituted research and development, and is a significant potential change from prior approaches which led NASA to capitalize billions of dollars in such items. NASA management is currently exploring these issues, and hopes to resolve the accounting policy-related aspects of its theme asset accounting independent of potentially longer-term needs to develop appropriate systems to capture such costs (however ultimately categorized).
These initiatives seem to be moving NASA in the right direction for identification of the component parts of theme assets throughout its life cycle. However, it is unclear as of yet how the alignment and the specificity of the preestablished WBS elements will correlate to the accounting for these costs under authoritative literature.
NASA-Held Real and Personal Property :
During our FY 2005 testing, we noted transactions that were not recorded at the appropriate value based upon the final amount paid (i.e., "three-way match" was not performed), not recorded in the correct fiscal year, lacked evidence of written authorization, or lacked required supporting evidence (NASA forms) and adherence to internal control polices and procedures, such as timely reconciliations to the subsidiary ledgers at centers were not being consistently followed. NASA management is reliant upon a monthly evaluation to determine which assets should be capitalized to record these transactions and maintains separate subsidiary ledgers which are not interfaced directly with the Core Financial Module. Accordingly, management needs to place additional emphasis to strengthen and enforce these center-specific manual (continued on next page)

FY 2005 Performance and Accountability Report 228
[Original letter on Ernst & Young letterhead]
Report on Internal Control Page 18 of 23
prevent and detect controls as these are the baseline controls upon which NASA is reliant until the end-to-end process is put into place as previously mentioned.
Recommendation
We recommend that NASA continue to focus on resolving prior year issues and completing its implementation of suggested recommendations and developing detailed corrective action plans. In addition, we once again place further emphasis on recommending that NASA fundamentally revisit its approach to capitalizing property by documenting, analyzing, and implementing robust control changes from end to end to all categories of PP&E. We also recommend that all NASA obligation documents and expenditures be coded to identify whether they relate to a property acquisition to create a control for comparison to recorded property transactions and subsidiary ledgers, be they NASA activities or contractors.
REPORTABLE CONDITION
Internal Controls in Estimat ing NASA's Env i ronmental Liabi l i ty Require Enhancement
During our review of NASA's environmental liability estimates totaling $825 million as of September 30, 2005, and related disclosures to the financial statements, we continued to note weaknesses in NASA's ability to generate an auditable estimate of its unfunded environmental liabilities (UEL) and to identify related potential financial statement disclosure items because of a lack of sufficient, auditable evidence.
In response to the issues first identified in our FY 2004 Report on Internal Control, NASA has developed a workplan to correct the weaknesses noted. However, while some limited progress has been made, we noted during the FY 2005 audit that NASA has not made sufficient progress in resolving the issues. For example:
• During our FY 2004 audit, we noted that the roles and responsibilities for the estimation of the UEL among NASA's Accounting, Environmental and Legal functional group were not sufficiently defined and implemented to ensure appropriate integration and input into the process. We also noted that NASA's accounting function deferred to the environmental functional group in preparation of the estimates, resulting in environmental professionals interpreting accounting requirements. During the FY 2005 audit, we noted that there was limited evidence of sufficient involvement from the OCFO in preparing the UEL estimate.
• During our FY 2004 audit, we noted that NASA personnel and its contractors had not received sufficient policies, procedures, and training in the process for estimating (continued on next page)

FY 2005 Performance and Accountability Report 229
[Original letter on Ernst & Young letterhead]
Report on Internal Control Page 19 of 23
environmental liabilities. In June 2005, NASA conducted a training session for all center and facility personnel involved in the UEL estimation process. Based on our fieldwork conducted after this training, NASA personnel require additional guidance and training in the estimation of the UEL.
• Consistent with our FY 2004 findings, NASA did not have adequate, auditable documentation to support its FY 2005 UEL estimates.
• Consistent with our FY 2004 findings, we noted during our audit that NASA continues to lack documented quality control or quality assurance procedures to ensure the accuracy of the UEL estimates . However, NASA has made progress in this area by implementing a new advocacy process at headquarters to assist the centers and facilities in the review of the UEL. The OCFO's participation in quality control of the UEL estimates will be necessary to resolve this issue.
Roles and Responsibi l i t ies Need Further Refinement
During our testing of the UEL estimates in FY 2004, we were informed that NASA's environmental professionals prepared the estimates without direction or oversight from the OCFO. Specifically, we were advised that the OCFO deferred to NASA's Environmental Management Division (EMD) as experts in the preparation of the estimates. As a result of this division of responsibility, NASA's EMD made interpretations of Federal accounting requirements in isolation without input and oversight from the OCFO.
During our testing of the UEL estimates in FY 2005, we still noted limited involvement from the OCFO. As indicated earlier, the OCFO codeveloped, in conjunction with EMD, a workplan to address resolution of prior year findings . This workplan contains an action item to conduct more detailed accounting training. As of the end of our fieldwork, the accounting training had not yet been completed. The limited accounting training that was conducted for the centers and facilities prior to the start of the FY 2005 UEL estimation process was presented by NASA's EMD.
In addition, a representative from the OCFO attended our review of the estimates at the centers and facilities we visited during our audit . However, there was no evidence that the OCFO or center accounting staff provided input or guidance into the preparation of the UEL estimates prior to our visit and review.
Further, NASA indicated in its workplan to address FY 2004 UEL audit observations, the OCFO and NASA legal representatives intend to meet with Department of Justice personnel on the third-party claims. The objective of the meeting, which is still pending as of the end of fieldwork, is to discuss a basis that would allow recognition of these liabilities in a time frame consistent with financial reporting requirements.

FY 2005 Performance and Accountability Report 230
[Original letter on Ernst & Young letterhead]
Report on Internal Control Page 20 of 23
Increased Guidance and Tra ining Required
The preparation of NASA's UEL estimates requires an understanding of environmental cost estimating and related accounting guidance. During the FY 2004 audit, NASA indicated that its remedial project managers lacked sufficient environmental cost estimating experience to adequately prepare the estimates . To mitigate this deficiency, NASA began implementing the use of the Integrated Data Evaluation and Analysis Library (IDEAL) cost estimating software in FY 2004. IDEAL generates estimates through the use of parametric cost models. In FY 2005, NASA personnel received training on the use of the IDEAL model, which was used to prepare the FY 2005 estimates at all centers and facilities we visited. However, based on our review, the users still did not have a sufficient understanding of how the IDEAL system worked. This was evidenced by their questions about the software.
The limited accounting training that NASA's environmental personnel received during 2005 was provided by the EMD staff This included estimating liabilities in accordance with the accounting guidance on "probable" and "reasonably estimable." However, the EMD training provided on estimating liabilities associated with the closure of hazardous waste storage tanks may be inconsistent with SFFAS No . 6, Accounting for Property, Plant, and Equipment, which requires the recognition of probable and measurable liabilities when the asset is placed in service. NASA EMD is developing the accounting treatment of storage tank closure but indicated it has decided to recognize the liability for the closure of tanks only when it becomes known that NASA intends to take a tank out of service.
Limited guidance was provided on the quantification, categorization, and tracking of changes in the UEL from year to year. As such, several NASA UEL estimators directly responsible for creating and updating the center/facility UEL estimates could not explain all differences for changes in their own center/facility UEL estimates from FY 2004 to FY 2005. NASA has indicated it will address this issue going forward by requiring UEL estimators to capture and document the reason for all UEL changes greater than $200,000.
NASA communicated to us its awareness of the need to quantify and disclose "possible" UELs for financial statement purposes and its intention to develop and deliver procedures or guidelines to identify and evaluate possible liabilities for FY 2006 forward.
Documentation to Support Liabi l i ty Need Improvements—Auditable Est imates
Consistent with FY 2004, the UEL estimate presented at the time of the audit was a draft estimate. No finalized UEL estimate was available for the FY 2005 audit. NASA is aware of the need to generate a finalized UEL estimate for the audit and has changed its timeline going forward so that an estimate will be generated in March, with adjustments being made in September. This timeline change is scheduled for FY 2006.

FY 2005 Performance and Accountability Report 231
[Original letter on Ernst & Young letterhead]
Report on Internal Control Page 21 of 23
Insuf ficient Qual i ty Control over Center Estimates
During the FY 2004 audit, we could not find evidence that NASA performed an independent quality review of the UEL estimates prepared by the centers and facilities . During FY 2005, we noted that "advocates" had been named and were responsible for performing quality control over the estimates. However, because the estimates were still in draft form during our visits, it was not evident what level of review had been performed . For example, at our Jet Propulsion Lab (JPL) visit, we noted that estimates that were initially represented as final were reclassified as draft when errors were detected during our review. In addition, as previously noted, while a representative from the OCFO observed our reviews of the center UELs, it was not evident that anyone from the OCFO had performed any sort of independent review prior to our audit.
As we identified in the FY 2004 audit, we believe it is important that the IDEAL model be periodically reconciled with actual spending to validate the model. Currently, IDEAL has not been validated and accredited for estimating NASA remediation scenarios in accordance with OMB and NASA guidelines . NASA indicated that some models within IDEAL were evaluated under a Department of Defense (DOD) contract. However, a review by the DOD's OIG indicated similar concerns regarding validation of the model. NASA has, however, requested that the Office of Quality Assurance validate the IDEAL model.
NASA continues to exclude the internal labor costs for personnel who are wholly dedicated to the extinguishment of environmental remediation liabilities from the UEL. We believe this exclusion of labor costs is inconsistent with the full cost accounting principles adopted by NASA.
Recommendation
We recommend that NASA expedite the progress on the action plan it developed in response to our FY 2004 audit. In addition, we recommend that NASA include in the action plan the center and facility specific findings that were identified during the FY 2004 audit as opposed to the current workplan steps which address only those FY 2004 observations that were thought to be common across all centers or apply to headquarters . We also recommend that NASA's OCFO perform a self-assessment of the UEL estimation and aggregation process. This assessment should focus on identifying additional weaknesses in NASA's UEL system that went undetected because no final estimates were available for our review at the time of our audit.
NASA should also continue to validate the tools (including IDEAL) and methodology used at the center and facility level to prepare the UEL estimates.

FY 2005 Performance and Accountability Report 232
[Original letter on Ernst & Young letterhead]
Report on Internal Control Page 22 of 23
OTHER MATTERS
Summary of FY 2004 Material Weaknesses and Reportable Conditions
Issue Area Summary Control Issue FY 2005 Status Material Weaknesses
Financial Systems, Analyses, and Oversight
Documentation regarding significant accounting events, recording of nonroutine transactions, and postclosing adjustments, as well as corrections and other adjustments made in connection with data conversion issues, must be strengthened. Processes to prepare financial statements need improvement.
Modified Repeat Condition
Further Research Required to Resolve Fund Balance with Treasury Differences
Supporting documentation to support application of rigorous reconciliation processes was not available. Unreconciled differences were identified in the FY 2003 yearend reconciliations.
Modified Repeat Condition
Enhancements Needed for Controls over Property, Plant, and Equipment and Materials
Controls relating principally to contractor-held PP&E and materials and NASA-held assets in space and WIP need improvement; headquarters oversight needs improvement.
Modified Repeat Condition
Improvements in the IFMP Control Environment are Needed
IFMP security design and Implementation needs improvement; IFMP security and general IT controls need to be strengthened; oversight function supporting IFMP security program needs improvement; segregation of duties issues.
Substantially completed; segments related to segregation of duties and other access issues, combined with Financial Systems, Analyses, and Oversight weakness
Reportable Condition: Internal Controls in Estimating NASA's UEL Require Enhancement
Weaknesses noted in NASA's ability to generate auditable UEL estimates and to identify disclosure items; training of personnel; defined roles and responsibilities of OCFO and EMD staff.
Modified Repeat Condition
* * * * * * * * *

FY 2005 Performance and Accountability Report 233
[Original letter on Ernst & Young letterhead]
Report on Internal Control Page 23 of 23
In addition, with respect to NASA's internal control over Required Supplementary Stewardship Information and performance measures reported in the Management's Discussion and Analysis, we were unable to apply certain procedures prescribed by OMB Bulletin No. 01-02, because of the limitations on the scope of the audit of the financial statements, as discussed in our Report of Independent Auditors, dated November 4, 2005. Further, we did not audit and do not express an opinion on such controls.
We also noted certain other matters involving internal control that we will report to NASA management in a separate letter dated November 4, 2005.
This report is intended solely for the information and use of the management and the OIG of NASA, OMB, and Congress and is not intended to be and should not be used by anyone other than these specified parties.
(Original signed Ernst & Young LLP)
November 4, 2005 Washington, D.C.

FY 2005 Performance and Accountability Report 234
[Original letter on Ernst & Young letterhead]
Report on Compl iance wi th Laws and Regulations
To the Administrator and the Office of Inspector General of the National Aeronautics and Space Administration
We were engaged to audit the financial statements of the National Aeronautics and Space Administration (NASA) as of and for the year ended September 30, 2005, and have issued our report thereon dated November 4, 2005. The report states that because of the matters discussed therein, the scope of our work was not sufficient to enable us to express, and we do not express, an opinion on the consolidated balance sheet as of September 30, 2005, and the related consolidated statements of net cost, changes in net position and financing and combined statement of budgetary resources for the fiscal year then ended.
The management of NASA is responsible for complying with laws and regulations applicable to NASA. We performed tests of its compliance with certain provisions of laws and regulations, noncompliance with which could have a direct and material effect on the determination of financial statement amounts, and certain other laws and regulations specified in Office of Management and Budget (OMB) Bulletin No . 01-02, Audit Requirements for Federal Financial Statements, including the requirements referred to in the Federal Financial Management Improvement Act of 1996 (FFMIA). We limited our tests of compliance to these provisions, and we did not test compliance with all laws and regulations applicable to NASA.
The results of our tests disclosed one instance of potential noncompliance with the laws and regulations discussed in the preceding paragraph, exclusive of FFMIA, that is required to be reported under Government Auditing Standards or OMB Bulletin No. 01-02. Based on a referral from OMB, NASA's management and the Office of Inspector General of NASA are currently evaluating whether NASA has violated certain provisions of the Anti-Deficiency Act (P .L . 101 - 508 and OMB Circular A-11). We have been advised that the review, which is in its initial stages, relates principally to whether obligations have been incurred in excess of apportioned funds for certain funds appropriated in prior years which, if properly and timely apportioned, are available for execution in subsequent years.
Under FFMIA, we are required to report whether NASA's financial management systems substantially comply with federal financial management systems requirements, applicable federal accounting standards, and the United States Standard General Ledger (SGL) at the transaction level. To meet this requirement, we performed tests of compliance with FFMIA Section 803(a) requirements. However, as noted above, we were unable to complete our audit . Based upon the results of the tests we were able to complete, we noted certain instances, described below, in which NASA's financial management systems did not substantially comply with certain requirements: (continued on next page)

FY 2005 Performance and Accountability Report 235
[Original letter on Ernst & Young letterhead]
Report on Compliance with Laws and Regulations Page 2 of 3
• The NASA accounting system lacks integration and does not conform to the requirements currently specified by the former Joint Financial Management Improvement Program. NASA's management continues to identify data integrity and configuration issues in the Core Financial Module, which results in inappropriate transactional postings. Additionally, NASA has been unable to provide detailed listings of balances from the Core Financial Module to support NASA's September 30, 2005 reported balances for accounts receivable, accounts payable, and undelivered orders. Finally, certain subsidiary systems, including property, are not integrated with the Core Financial Module.
• Issues with the Core Financial Module continue to hinder NASA's ability to identify and resolve certain issues with its fund balance with Treasury amounts.
• Data within NASA's financial system have not been validated as reliable and may not be reliable to support NASA's financial statements.
• Statement of Federal Financial Accounting Standards (SFFAS) No. 1, Accounting for Selected Assets and Liabilities, SFFAS No. 4, Managerial Cost Accounting Concepts & Standards, and NASA's Financial Management Requirements require costs to be accrued in the period in which they are incurred and any corresponding liability to be recorded as an account payable, regardless of the associated amounts obligated. However, NASA has designed its new Core Financial Module to include a system edit whereby if costs (and the corresponding liabilities) are greater than the associated obligations, the difference is not recorded in NASA's general ledger until further research is performed. Instead, these differences are stored outside of its general ledger until additional funds are obligated and the excess costs (and the corresponding liabilities) can be recorded. Similarly, the Core Financial Module will not allow negative costs or downward adjustments to be recorded in the general ledger. We believe that NASA's accounting treatment of costs in excess of obligations and downward adjustments during fiscal year 2005 represents noncompliance with the federal accounting standards requirements and SGL requirements under FFMIA.
The Report on Internal Control and management letter include information related to the financial management systems that were found not to comply with the requirements, relevant facts pertaining to the noncompliance, and our recommendations related to the specific issues presented. It is our understanding that NASA's management agrees with the facts as presented and that relevant comments from NASA's management responsible for addressing the noncompliance are provided as an attachment to this report.
Because we could not complete our audit, we were unable to determine whether there were other instances of noncompliance with laws and regulations that are required to be reported.
FY 2005 Performance and Accountability Report 236
[Original letter on Ernst & Young letterhead]
Report on Compliance with Laws and Regulations Page 3 of 3
Providing an opinion on compliance with certain provisions of laws and regulations was not an objective of our audit, and accordingly, we do not express such an opinion.
This report is intended solely for the information and use of management and the Office of Inspector General of NASA, OMB, and Congress, and is not intended to be and should not be used by anyone other than these specified parties.
(Original signed Ernst & Young LLP)
November 4, 2005 Washington, D.C.

FY 2005 Performance and Accountability Report 237
[Original letter on NASA Headquarters letterhead]
November 14, 2005
Reply to Attn of: The Office of the Chief Financial Officer
TO: Inspector General
FROM: Chief Financial Officer
SUBJECT: Management Response to Audit Report of Independent Auditors
We appreciate the efforts of the Office of Inspector General working with their contractor, Ernst & Young, LLP, to audit NASA's FY 2005 and 2004 financial statements. We understand that due to internal control challenges and residual system conversion matters, you were not able to express an opinion on the FY 2005 and 2004 consolidated balance sheet, and the related consolidated statements of net costs, changes in net position and financing, and combined statements of budgetary resources.
Your audit report identified three material weaknesses—Financial Systems, Analyses, and Oversight; Fund Balance with Treasury; and, Property, Plant, and Equipment. The material weaknesses are the result of inadequate internal controls and the remnants of NASA's conversion to a single Agencywide core financial management system. Our efforts to migrate to a new core financial system were designed to streamline NASA's financial management operations and management systems. The audit has exposed some unrealized process inefficiencies and shortcomings in the previous NASA Center based systems that continue to impact our current financial management improvements. Overcoming these issues is taking time, but we have a plan to remedy these issues.
Moving forward, the Office of the Chief Financial Officer is committed to making significant improvements in NASA's overall financial management. My staff and I look forward to working with you, your staff and Ernst & Young during the year to significantly improve our FY 2006 financial statement audit results.
Again, I appreciate your support.
Best,
(Original signed by Chief Financial Officer Sykes)
Gwendolyn Sykes

FY 2005 Performance and Accountability Report 238
Appendices Divider page photo caption: An overhead crane lowers onto the encapsulated Mars Reconnaissance Orbiter on July 28, 2005. The crane lifted it up to the Vertical Integration Facility on Launch Complex 41 at Cape Canaveral Air Force Station to the Atlas V rocket already there. NASA coordinates the launch of all its missions, acquiring appropriate commercial launch vehicles and determining the best launch location. The Mars Reconnaissance Orbiter left the launch pad on August 12 on its way to Mars to conduct detailed observations of the Martian surface, subsurface, and atmosphere, and to collect data on the history and distribution of water. (Photo: NASA)
Divider back page photo caption: At a radar site on North Merritt Island, Florida, in June 2005, a 50-foot C-band radar antenna dish is picked off the ground so that it can be lowered onto a nearby support structure. The completed radar tracked Discovery during STS-114 to watch for possible debris coming off the Shuttle. STS-114 was the first time NASA used the radar. NASA also added new cameras on and around the launch tower to closely observe the launch. (Photo: NASA)

FY 2005 Performance and Accountability Report 239
APPENDIX 1: OMB PROGRAM ASSESSMENT RATING TOOL (PART) RECOMMENDATIONS Management and Budget (OMB) to assess the effectiveness of federal programs. PART provides a rigorous and interactive methodology to assess program planning, management, and performance toward quantitative, outcome-oriented goals. For more detailed information on the PART assessment process and ratings, please refer to http://www.whitehouse.gov/OMB/part/fy2005/2005_guidance.doc. NASA submits one-third of its program portfolios (known as Themes) to OMB each year, resulting in a complete Agency assessment every three years.
To date, NASA and OMB have conducted 17 PART reviews of NASA’s programs. Accounting for shifts in the NASA portfolio as a result of the Vision for Space Exploration, these reviews encompass about 80 percent of the Agency’s current programs. The remaining 20 percent will be reviewed in the next calendar year. In 2005, OMB reviewed one new Theme, re-assessed the Earth–Sun System content formerly assessed as two different Themes, and re-assessed the Space Shuttle Theme. These assessments will receive final scores later this year and will be included in the FY 2007 President’s Budget.
NASA factors the PART findings into decisions surrounding future program structure and plans. These findings, summarized in the table below, are tracked as actions moving into NASA’s next strategy, budget, and performance planning cycle.
NASA and OMB continue to work together to ensure that performance measures reflected in PART are consistent with the performance measures included in the Agency’s annual performance plan and annual Performance and Accountability Report.
Strategic Objective 2
Program (Theme) Mars Exploration
Calendar Year Reviewed
2003
Rating Effective
Recommendations • Assess the technical feasibility, potential schedule, and estimated costs of mission options for the next decade of Mars exploration. (FY05) • Improve the independence of external performance reviews by ceasing the practice of pre-formulating ratings for evaluators to either accept or modify. (FY05) • Make research grant annual reports and/or a list of current research grant recipients, grant levels, and project titles available on NASA’s Web site. (FY05)
Strategic Objective 3
Program (Theme) Solar System Exploration
Calendar Year Reviewed
2003
Rating Effective
Recommendations • Improve the independence of external performance reviews by ceasing the practice of pre-formulating ratings for evaluators to either accept or modify. (FY05) • Make research grant annual reports and/or a list of current research grant recipients, grant levels, and project titles available on NASA’s Web site. FY05) • Monitor the programmatic impacts of: (a) the recent changes that have been made in the management of the Discovery missions and (b) the management methods that will be used for New Frontiers missions. (FY05)

FY 2005 Performance and Accountability Report 240
Strategic Objectives 4 and 5
Program (Theme) Structure and Evolution of the Universe (SEU)
Calendar Year Reviewed
2004
Rating Effective
Recommendations • Promote cost and schedule compliance by reporting, for each major SEU mission: the estimated life cycle cost before entering development; the anticipated cost and schedule associated with each mission phase; the mission’s cost and schedule progress achieved in each phase before entering the next; and any plans to re-baseline life cycle cost and/or schedule.
Strategic Objective 6
Program (Theme) Space Shuttle
Calendar Year Reviewed
2003
Rating Results not demonstrated
Recommendations • Plan to retire the Shuttle by the end of the decade, when its role in assembling the International Space Station is complete. (FY05) • Return the Shuttle safely to flight and continue using it to support the Space Station. (FY05) • Develop outcome-oriented short and long-term measures for the Space Shuttle Program. (FY05) • Provide OMB with a revised set of PART performance measures and targets for the Space Shuttle Program.
Strategic Objective 6
Program (Theme) Space Shuttle
Calendar Year Reviewed
2005 (Reassessment)
Rating Final results pending. To be provided by OMB later this year.
Recommendations Final results pending. To be provided by OMB later this year.

FY 2005 Performance and Accountability Report 241
Strategic Objectives 6 and 17
Program (Theme) Space and Flight Support
Calendar Year Reviewed
2004
Rating Adequate
Recommendations • Continue to fund the program at an essentially flat level, but strive to improve the program’s results by increasing efficiency. • Develop a plan to independently review all of the major program elements to support improvements and evaluate effectiveness and relevance. • Develop by better measures that will help to drive program improvement. • Remove Environmental Remediation from the Space and Flight Support portfolio and make it a part of NASA’s corporate general and administrative costs. • Provide OMB with a revised set of PART performance measures and targets for Space and Flight Support.
Strategic Objective 8
Program (Theme) Biological Sciences Research
Calendar Year Reviewed
2003
Rating Results not demonstrated
Recommendations • Develop efficiency measures that can be used to demonstrate improvement in the research process. (FY05) • Develop methods of evaluating research processes and productivity against National Institutes of Health and National Science Foundation where applicable. (FY05) • Develop outcome-oriented performance measures, particularly in terms of achieving the goals established in the “Critical Path Roadmap” (NASA’s plan for certifying humans for long-duration space travel). (FY05)
Strategic Objective 8
Program (Theme) Human Systems Research and Technology
Calendar Year Reviewed
2005
Rating Final results pending. To be provided by OMB later this year.
Recommendations Final results pending. To be provided by OMB later this year.
Strategic Objective 8
Program (Theme) Space Station
Calendar Year Reviewed
2004
Rating Moderately effective
Recommendations No actions.

FY 2005 Performance and Accountability Report 242
Strategic Objective 11
Program (Theme) Mission and Science Measurement Technology
Calendar Year Reviewed
2003
Rating Moderately effective
Recommendations • Strengthen areas identified as priorities by the NASA Enterprises and the National Research Council. (FY05) • Develop overall efficiency metrics and attempt to achieve improved efficiencies or cost effectiveness in achieving program goals. (FY05)
Strategic Objective 12
Program (Theme) Aeronautics Technology
Calendar Year Reviewed
2004
Rating Moderately effective
Recommendations • Continue performing regular program reviews to ensure funding of projects that are relevant and effective. • Strengthen priority research areas identified by NASA, the National Research Council, and external partners. • Develop efficiency metrics and demonstrate improved efficiencies (e.g., cost) for achieving program goals. • Restructure the program to better focus on projects that have a federal role.
Strategic Objective 13
Program (Theme) Education
Calendar Year Reviewed
2004
Rating Adequate
Recommendations • Continue to perform regular program reviews to ensure that only effective, relevant programs are funded. • Require all Education programs to report annually on accomplishments and make these data available to the public.
Strategic Objective 14
Program (Theme) Earth Science Applications
Calendar Year Reviewed
2003
Rating Results not demonstrated
Recommendations • Finalize roadmaps for each of the twelve priority areas that specify how and where NASA content can be best utilized. (FY05) • Continue to improve performance measures to reflect the value added of incorporating NASA data into existing systems (i.e., measure the quality of products versus the quantity). (FY05) • Improve the collection of grantee performance data and make these data available and accessible. (FY05)

FY 2005 Performance and Accountability Report 243
Strategic Objective 14
Program (Theme) Earth System Science
Calendar Year Reviewed
2004
Rating Moderately effective
Recommendations • Ensure that NASA’s new structure capitalizes on assessment results and adequately supports interagency goals and activities. Ensure that NASA’s new structure capitalizes on assessment results and adequately supports interagency goals and activities. • Assess the impediments to improving the “hand-off” of NASA’s research and development and implement necessary organizational and system fixes to ensure results. • Improve the collection of grantee performance data and make these data available and accessible to ensure wide distribution of NASA research results.
Strategic Objective 14
Program (Theme) Earth–Sun Systems (formerly assessed as Earth System Science, Sun–Earth Connection, and Earth Science Application Themes)
Calendar Year Reviewed
2005
Rating Final results pending. To be provided by OMB later this year.
Recommendations Final results pending. To be provided by OMB later this year.
Strategic Objective 15
Program (Theme) Sun–Earth Connection
Calendar Year Reviewed
2004
Rating Effective
Recommendations • Promote cost and schedule compliance by reporting, for each major SEU mission: the estimate life-cycle cost before entering development; the anticipated cost and schedule associated with each mission phase; the mission’s cost and schedule progress achieved in each phase before entering the next; and any plans to re-baseline life-cycle cost and/or schedule.

FY 2005 Performance and Accountability Report 244
APPENDIX 2: OFFICE OF INSPECTOR GENERAL SUMMARY OF SERIOUS MANAGEMENT CHALLENGES
[Original on NASA Office of Inspector General letterhead]
TO: Administrator
FROM: Inspector General
SUBJECT: NASA’s Most Serious Management and Performance Challenges
As required by the Reports Consolidation Act of 2000, these are our views of the most serious management and performance challenges facing NASA. NASA is working to address these challenges and improve Agency programs and operations through various initiatives and by implementing recommendations made by my office and other evaluative bodies, such as the Columbia Accident Investigation Board and the Government Accountability Office. The four challenges are listed below and summarized in the enclosure.
• Continuing to correct the serious organizational and technical deficiencies that contributed to the Columbia accident in 2003.
• Completing the International Space Station.
• Transitioning from the Space Shuttle vehicle to the next-generation crew exploration vehicle (CEV).
• Ensuring that the integrated financial management system improves NASA’s ability to accurately allocate costs to programs, efficiently provides reliable information to management, and supports compliance with the Chief Financial Officers Act.
Transitioning from the Space Shuttle vehicle to the next-generation CEV was added as a most serious challenge this year. The Agency will be focused for the foreseeable future on implementing the President’s Vision for Space Exploration by transitioning from the Space Shuttle Program to the CEV and other vehicles that will carry crew and hardware to complete the assembly of the International Space Station, then on to the Moon and Mars. This transition presents a multitude of challenges. Transitioning existing workforce and facilities toward new vehicle production and, at the same time, flying the Space Shuttle as safely as reasonably possible until 2010 is a tremendous challenge, unique in scope and complexity. The accelerated schedule for implementation and budget constraints contribute to the difficulty of meeting this challenge. My office plans to dedicate considerable audit resources to reviewing these efforts, to include a review of the transition process and the development of the CEV.
Information technology (IT) security, included as a most serious challenge last year, is not included this year because of actions taken by the Agency to improve its IT security.

FY 2005 Performance and Accountability Report 245
[Page 2 of letter]
The Chief Information Officer has been very responsive to our recommendations and has implemented policies and procedures that strengthen the Agency’s IT security and internal controls over sensitive information. My office will continue to monitor activities associated with IT security, as it remains an important issue for the Agency.
If you have any questions, or need additional information, please call me at 202-358-1220.
(Original signed by Inspector General Cobb)
Robert W. Cobb
Enclosure

FY 2005 Performance and Accountability Report 246
NASA’s Most Serious Management and Performance Challenges
Continu ing to correct the serious organizat iona l and technical deficienc ies that contr ibuted to the Columbia accident in 2003.
Although the first of two return-to-flight (RTF) missions was completed successfully, NASA is still working to correct the serious organizational and technical deficiencies that contributed to the Columbia accident in 2003. After the Columbia accident, the Administrator established the Columbia Accident Investigation Board (CAIB) to identify the cause of the accident and to make recommendations for resolving known problems in order to safely return the Space Shuttle to flight. The CAIB’s August 2003 report contained 29 recommendations related to the physical and organizational, including cultural, causes of the accident. Of the 29 recommendations, 15 related primarily to the physical causes of the accident, and the CAIB stated that these must be addressed before the Space Shuttle’s RTF.
The Administrator formed the RTF Task Group to report on NASA’s progress in implementing the CAIB’s RTF recommendations. The Task Group issued its final report on August 17, 2005, stating that NASA had met the intent of 12 of the 15 recommendations but that the remaining 3 recommendations, which concerned debris shedding, orbiter hardening, and on-orbit inspection and repair, were so challenging that NASA could not yet comply with the CAIB recommendations. The report noted that NASA had made substantive progress in making the Space Shuttle safer through study, analysis, and hardware modification.
The July 26, 2005, launch of Discovery was the first of two RTF missions to test modifications made since the Columbia accident. However, because pieces of insulating foam broke off from the external tank during Discovery’s launch, as had happened during Columbia’s flight, the Shuttle fleet was again grounded. With the reoccurrence of debris shedding, the orbiter’s thermal protection system remains vulnerable to impact, and although tested during the Discovery flight, a viable on-orbit repair capability continues to be a challenge. NASA has since established a Tiger Team and other technical boards to study and report on the root causes for the continued problem of debris shedding.
The Office of Inspector General (OIG) reviewed NASA’s progress in preparing the Space Shuttle for its RTF. In May 2005, we issued a report that summarized the results of our reviews.1 In that report, we noted that some of the documents we reviewed were simply plans to address CAIB recommendations, rather than the actual implementation of those plans. The OIG also assessed actions taken by NASA to address specific CAIB recommendations in separate reports, including management challenges on quality assurance at Kennedy Space (continued on next page)
1 “Summary of the Office of Inspector General’s Reviews on Aspects of NASA’s Response to the Columbia Accident Investigation Board Report” (IG-05-015, May 13, 2005).
Enclosure Page 1 of 7

FY 2005 Performance and Accountability Report 247
Center (KSC),2 orbiter wiring inspection,3 and NASA’s plan for independent technical authority (ITA) and safety and mission assurance (SMA).4
QQuali ty Assurance. In our review of the quality assurance process and procedures, we noted that KSC improperly used outdated and obsolete position descriptions to hire and evaluate quality assurance personnel. KSC has since initiated action to promote quality assurance specialists and raised the journeyman level of a quality assurance specialist, which should serve to improve KSC’s ability to recruit and retain skilled quality assurance specialists.
OOrbi ter Wir ing. Our report on orbiter wiring disclosed that NASA had not formally assessed the risk of aging and damaged wiring in accordance with NASA guidance, nor had it developed a risk mitigation plan based on such an assessment. Without such assessments and plans, the Space Shuttle Program cannot ensure that it has effectively managed the risks that aging and damaged wiring could pose to flight safety. In addition, next-generation space vehicles could face similar wiring challenges. As a result of our recommendations, NASA has taken or is taking action to assess the wiring risk, develop a risk mitigation plan, and share lessons learned concerning new technology for wiring inspection.
IITA and SMA. In our review of NASA’s plan for ITA and SMA, we noted that the organizational structure NASA had planned for the technical authority posed some risks to independence. However, NASA’s technical authority concept was being modified at the time of our review (August 2005) and, therefore, we did not issue any recommendations. We plan to monitor the implementation of the revised technical authority, which will not be implemented until it is reviewed by NASA’s new Chief Engineer (appointed October 30, 2005). To the extent the ITA as reconfigured will rely on Center directors as being the source of organizational independence, the ITA may not be organized as the CAIB envisioned. The CAIB found that the Space Shuttle Program does not consistently demonstrate the characteristics of organizations that effectively manage high risk. The CAIB’s finding reflects the Agency’s challenge of ensuring engineering integrity in the context of constant cost and schedule pressures inherent in executing space flight programs. The new ITA organization will require strict adherence by the space flight Center directors to their institutional (as opposed to programmatic) responsibilities, as directed by the Administrator, and avoidance of the informal chains of command that were evident in the events leading to the Columbia disaster. Additionally, particular sensitivity to independence of engineering authority is required during this period of transition to the new ITA organization.
We also reported that NASA diverged from the explicit intent of the CAIB recommendation by not implementing direct-line funding or reporting for Shuttle Program SMA personnel. We recommended that in lieu of implementing the CAIB recommendation, the Chief SMA Officer should demonstrate that there is a healthy, sustainable, independent oversight
2 “Final Memorandum on NASA’s Plans and Actions to Improve Kennedy Space Center Quality Assurance” (IG-05-018, May 13, 2005).
3 “Space Shuttle Orbiter Wiring Inspection” (IG-05-023, July 14, 2005).
4 “Risks Associated with NASA’s Plan for Technical Authority and Safety and Mission Assurance” (IG-05-024, August 19, 2005).
Enclosure Page 2 of 7

FY 2005 Performance and Accountability Report 248
function. Management concurred and is taking action to ensure that program oversight is independent and thorough and stated that the scope of the Office of SMA’s audits will be expanded to include a review of the safety reporting process.
Completing the International Space Station. Completing the International Space Station (ISS) and managing the ISS Program schedule and costs is contingent on returning the Space Shuttle to flight on a dependable and consistent basis. NASA’s concerns about limitations imposed by the Iran Nonproliferation Act of 2000 have been alleviated with Congress’s passage of S. 1713, “Iran Nonproliferation Amendments Act of 2005.” However, concerns about debris shedding, and a shrinking timeline to Shuttle retirement, continue to impact the future of Space Shuttle operations.
Following the Space Shuttle Columbia’s accident, the Shuttle fleet was grounded. That limited the number of crew that could be transported and supported aboard the ISS, halted ISS assembly, and significantly reduced available “up and down mass” (transport of crew and equipment) for ISS operations and utilization. ISS assembly was to resume after the successful completion of two RTF missions. The first was completed July 26–August 9, 2005, with the launch and landing of the Space Shuttle Discovery. During the mission, the Discovery crew successfully replenished the food and oxygen supply aboard the ISS and repaired the two damaged control gyroscopes. However, because of debris shedding during Discovery’s launch, the Shuttle fleet was again grounded. Consequently, NASA’s timeline for completing the second RTF mission has been extended to at least May 2006, extending the timeline for ISS assembly as well.
The impending retirement of the Space Shuttle fleet also presents an additional obstacle to ISS completion. Shuttle retirement threatens the U.S. segment of the ISS Program’s projected budget. NASA has identified various viable configuration options for the ISS in the context of potential future Shuttle flight rates. Those configuration options have been identified in the context of international partner commitments, research utilization, cost, and ISS sustainability while operating under the constraint to cease Shuttle flights no later than FY 2010 and maintaining safety as NASA’s highest priority. In November 2005, NASA intends to decide which option provides the optimum ISS configuration considering budgetary, performance, and schedule constraints.
Transitioning from the Space Shuttle vehicle to the next-generation crew exploration vehicle (CEV). On January 14, 2004, President Bush announced A Renewed Spirit of Discovery: The President’s Vision for U.S. Space Exploration, a new directive for the Nation’s space exploration program. The fundamental goal of the new directive is to advance U.S. scientific, security, and economic interests through a robust space exploration program. Specific objectives of the Vision are to (1) implement a sustained and affordable human and robotic program to explore the solar system and beyond; (2) extend human presence across the solar (continued on next page)
Enclosure Page 3 of 7

FY 2005 Performance and Accountability Report 249
system, starting with a human return to the Moon; (3) develop innovative technologies, knowledge, and infrastructures to explore and support decisions for human exploration; and (4) promote international and commercial participation in exploration. Initial cost estimates for implementing the Vision are approximately $100 billion for the next 20 years.
As part of the President’s Vision, NASA was directed to return the Space Shuttle to flight as soon as possible, focus the use of the Space Shuttle on completion of the ISS, and retire the Space Shuttle around the end of the decade (2010). With respect to the broader space mission, NASA was directed to pursue lunar exploration activities with the goal of a human expedition no later than 2020; conduct robotic exploration and develop key capabilities (e.g., propulsion and life support) to explore Mars and other destinations; develop a new CEV to provide crew transportation for missions beyond low Earth orbit; and pursue opportunities for international and commercial partnerships.
Transitioning existing workforce and facilities toward new vehicle production and, at the same time, flying the Space Shuttle as safely as reasonably possible until 2010 is a tremendous challenge, unique in scope and complexity. The accelerated schedule for implementation and budget constraints contribute to the difficulty of meeting this challenge.
One of the keys to controlling CEV costs is maximizing the use of existing Space Shuttle technology in the new vehicle. NASA has concluded that the safest, most reliable, and most affordable means of CEV development is to use existing Shuttle systems, such as the solid rocket boosters and the liquid propulsion system. However, use of those systems on the CEV will require significant re-engineering and facilities reconfiguration. The re-engineering and reconfiguration will need to occur concurrently with the last Space Shuttle flights. The redirection of engineering talent and attention to the new program poses possible increased risks for Shuttle operations.
The NASA Administrator testified on November 3, 2005, before the House Science Committee concerning a $3 billion to $5 billion shortfall in funding the Shuttle through 2010. Such a shortfall could also impact NASA’s ability to meet its accelerated timeframe for the CEV and to meet ISS requirements. These budgetary pressures may not only impact the ability to execute programs within desired timeframes, but may also impact the Agency’s ability to retain the technically competent workforce necessary for efficient transition to the new generation of vehicles.
Ensuring that the integrated financial management system improves NASA’s ability to accurately allocate costs to programs, efficiently provides reliable information to management, and supports compliance with the Chief Financial Officers Act. NASA received a disclaimer of opinion on its financial statements as a result of the Independent Public Accountant (IPA) audits in FY 2003 by PricewaterhouseCoopers and in FY 2004 and FY 2005 by Ernst & Young LLP (E&Y) because NASA has been unable to (continued on next page)
Enclosure Page 4 of 7

FY 2005 Performance and Accountability Report 250
provide auditable financial statements and sufficient evidence to support statements throughout the fiscal year. The reports that the IPAs have submitted identify instances of noncompliance with generally accepted accounting principles, reportable conditions (with most being material weaknesses) in internal controls, and noncompliance with the Federal Financial Management Improvement Act and the Improper Payments Information Act of 2002. Many of the weaknesses the audits disclosed resulted from a lack of effective internal control procedures and continued data integrity issues, as well as problems related to NASA’s conversion in FY 2003 from 10 separate systems to a new single Integrated Enterprise Management Program (IEMP).
The backbone of IEMP is the Core Financial module, which NASA implemented in FY 2003. However, despite substantial investment, in both time and money, into the development and implementation of the Core Financial module, NASA still cannot produce auditable financial statements—a key goal of the module.
NASA’s continued problems in resolving its internal control weaknesses have contributed to its inability to produce complete and accurate financial statements. Many of NASA’s internal control deficiencies are material weaknesses that have been reported for several years, as shown in the following table. Two of the most significant material weaknesses are property, plant, and equipment and materials (PP&E) and Fund Balance with Treasury (FBWT).
Enclosure Page 5 of 7

FY 2005 Performance and Accountability Report 251
Internal Control Def iciencies
Fiscal Year 2005 2004 2003 2002 2001
Independent Public Accountant E&Y E&Y PwC1 PwC PwC
Audit Opinion Disclaimer Disclaimer Disclaimer Unqualified Disclaimer
General Controls Environment2 — material
weakness reportable condition
reportable condition —
Property, Plant, and Equipment and Materials
material weakness
material weakness
material weakness
material weakness
material weakness
Financial Statement Preparation Process and Oversight
material weakness
material weakness
material weakness
material weakness —
Fund Balance with Treasury material weakness
material weakness
material weakness — —
Audit Trail and Documentation to
Support Financial Statements3
— — material weakness — —
Environmental Liability Estimation reportable condition
reportable condition — — reportable
condition Inte
rnal
Con
trol
Def
icie
ncie
s
Information Systems Controls4 — — — — reportable
condition 1 PricewaterhouseCoopers. 2 General Controls Environment weaknesses have been mostly resolved for FY 2005. The segregation of duties component of this weakness was included in the Financial Statement Preparation Process and Oversight weakness in FY 2005. 3 The weakness on Audit Trail cited in FY 2003 continued to exist in FY 2004 and FY 2005; however, the auditor included it in the overall Financial Statement Preparation Process and Oversight weakness for those years. 4 This area includes disaster recovery tests, systems constraints, logical access controls, and access controls to mainframe, and included four individual reportable conditions cited in FY 2001 that continued to exist in FY 2002; however, the auditor included them in the General Controls Environment weakness in FY 2002. NASA has demonstrated some limited progress in addressing three of its four reported material weaknesses and one reportable condition from the FY 2004 audit. NASA has made significant progress in correcting the fourth material weakness reported by E&Y in FY 2004, “Improvements in the IFMP Control Environment” (included as part of the General Controls Environment shown in the table).
NASA also achieved some limited success in producing interim financial statements from its Core Financial module, although many manual adjustments were still necessary. NASA generated its year-end financial statements directly from the Core Financial module. It accomplished this by posting adjustments in the module, rather than manually adjusting the financial statements. Other areas of progress include the implementation of reconciliation procedures for selected general ledger accounts and preparing checklists for Centers to complete and sign to certify the transactions. We also note that the Office of the Chief Financial Officer has added additional personnel, filled key leadership positions, and established a Quality Assurance office. The Quality Assurance office has the responsibility of providing oversight and quality control reviews of financial management and assisting the
Enclosure Page 6 of 7

FY 2005 Performance and Accountability Report 252
Centers with compliance issues. In addition, the Center Chief Financial Officers now report to the NASA Chief Financial Officer instead of the Center directors.
NASA also made some progress on the material weakness in “Property, Plant, and Equipment and Materials” by developing an Internet-based Contractor Held Asset Tracking System (CHATS) for contractors to report information on their contractor-held, NASA-owned property.
To meet financial management expectations and requirements, NASA must have viable corrective action plans to address the repeat internal control weaknesses it faces. Plans developed to date have lacked clear strategies for resolving the weaknesses and have not been finalized. NASA must immediately develop and implement corrective action plans that fulfill comprehensive financial management objectives within parameters set by financial management and accounting laws and regulations. Such plans can only be developed as a collaborative product of NASA program and institutional leadership. While incremental progress can be made by focusing on separate pieces of financial management challenges, NASA will not likely correct its material weaknesses without a comprehensive approach that contemplates the framework in which the Agency accounts for the expenditure of taxpayer dollars.
Enclosure Page 7 of 7
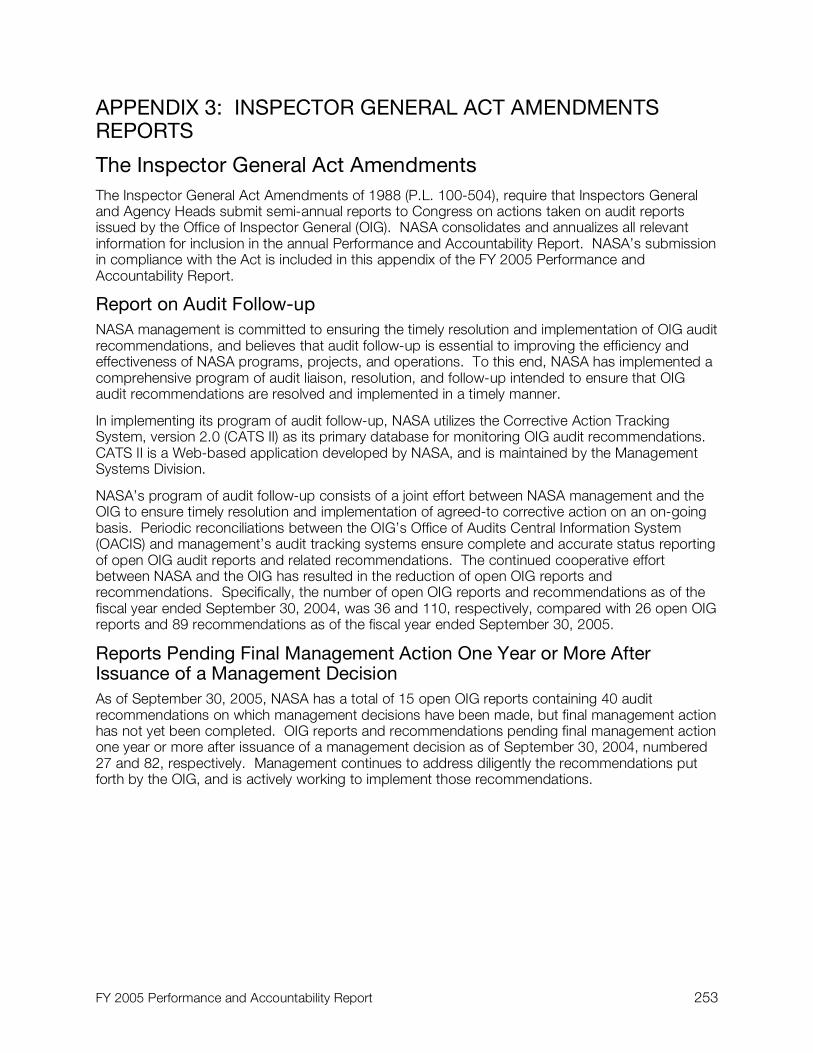
FY 2005 Performance and Accountability Report 253
APPENDIX 3: INSPECTOR GENERAL ACT AMENDMENTS REPORTS
The Inspector General Act Amendments The Inspector General Act Amendments of 1988 (P.L. 100-504), require that Inspectors General and Agency Heads submit semi-annual reports to Congress on actions taken on audit reports issued by the Office of Inspector General (OIG). NASA consolidates and annualizes all relevant information for inclusion in the annual Performance and Accountability Report. NASA’s submission in compliance with the Act is included in this appendix of the FY 2005 Performance and Accountability Report.
Report on Audit Follow-up NASA management is committed to ensuring the timely resolution and implementation of OIG audit recommendations, and believes that audit follow-up is essential to improving the efficiency and effectiveness of NASA programs, projects, and operations. To this end, NASA has implemented a comprehensive program of audit liaison, resolution, and follow-up intended to ensure that OIG audit recommendations are resolved and implemented in a timely manner.
In implementing its program of audit follow-up, NASA utilizes the Corrective Action Tracking System, version 2.0 (CATS II) as its primary database for monitoring OIG audit recommendations. CATS II is a Web-based application developed by NASA, and is maintained by the Management Systems Division.
NASA’s program of audit follow-up consists of a joint effort between NASA management and the OIG to ensure timely resolution and implementation of agreed-to corrective action on an on-going basis. Periodic reconciliations between the OIG’s Office of Audits Central Information System (OACIS) and management’s audit tracking systems ensure complete and accurate status reporting of open OIG audit reports and related recommendations. The continued cooperative effort between NASA and the OIG has resulted in the reduction of open OIG reports and recommendations. Specifically, the number of open OIG reports and recommendations as of the fiscal year ended September 30, 2004, was 36 and 110, respectively, compared with 26 open OIG reports and 89 recommendations as of the fiscal year ended September 30, 2005.
Reports Pending Final Management Action One Year or More After Issuance of a Management Decision As of September 30, 2005, NASA has a total of 15 open OIG reports containing 40 audit recommendations on which management decisions have been made, but final management action has not yet been completed. OIG reports and recommendations pending final management action one year or more after issuance of a management decision as of September 30, 2004, numbered 27 and 82, respectively. Management continues to address diligently the recommendations put forth by the OIG, and is actively working to implement those recommendations.

FY 2005 Performance and Accountability Report 254
OIG Audit and Inspection Reports Pending Final Management Action One Year or More After Issuance of a Management Decision (As of September 30, 2005)
Report Number Report Title
Report Date
IG-04-024 Final Memorandum on Government Mandatory Inspections for Solid Rocket Booster Bolt Catchers
09/28/2004
IG-04-025 NASA’s Implementation of the Mission Critical Space System Personnel Reliability Program
09/27/2004
IG-04-018 Audit of Windows NT Operating System Security and Integrity of the Master Domain at Johnson Space Center
04/15/2004
IG-FS-01 Audit of NASA’s Fiscal Year 2003 Financial Statements 01/28/2004
IG-FS-02 Fiscal Year 2003 Management Letter Comments (Information Technology) 01/28/2004
IG-FS-03 Fiscal Year 2003 Management Letter Comments (Financial) 01/18/2004
IG-04-004 Audit of Information Category Designations for NASA Systems 12/12/2003
IG-00-036 Disaster Recovery Management Letter 08/04/2003
IG-03-017 Evaluation of NASA Incident Response Capability 06/09/2003
IG-03-009 Performance Management Related to Agency-wide Fiscal Year 2002 Information Technology Security Program Goals
03/27/2003
IG-MEMO-23 Audit of NASA’s Fiscal Year 2002 Financial Statements 01/23/2003
IG-FS-04 Fiscal Year 2002 Management Letter Comments (Financial) 01/23/2003
IG-02-010 NASA’s Telecommunications Management 03/26/2002
G-00-07 Internet-Based Spacecraft Commanding 10/22/2001
IG-00-055 System Information Technology Planning 09/28/2000

FY 2005 Performance and Accountability Report 255
Statistical Table on Audit Reports with Disallowed Costs (October 1, 2004 through September 30, 2005)
Number of Audit
Reports Dol lar Value
A Audit reports with management decisions on which final action had not yet been taken at the beginning of the reporting period
0 $0
B Audit reports on which management decisions were made during the reporting period
0 $0
C Total audit reports pending final action during the reporting period (total of A + B)
0 $0
D Audit reports on which final action was taken during the reporting period 0 $0
1. Value of disallowed costs collected by management 0 $0
2. Value of costs disallowed by management 0 $0
3. Total (lines D1 + D2) 0 $0
E Audit reports pending final action at the end of the reporting period (C – D3) 0 $0
Statistical Table on Audit Reports with Recommendations that Funds Be Put to Better Use (October 1, 2004 through September 30, 2005)
Number of
Audit Reports Dol lar Value
A Audit reports with management decisions on which final action had not yet been taken at the beginning of the reporting period
0 $0
B Audit reports on which management decisions were made during the reporting period
0 $0
C Total audit reports pending final action during the reporting period (total of A + B)
0 $0
D Audit reports on which final action was taken during the reporting period 0 $0
1. Value of disallowed costs collected by management 0 $0
2. Value of costs disallowed by management 0 $0
3. Total (lines D1 + D2) 0 $0
E Audit reports pending final action at the end of the reporting period (C – D3)
0 $0

FY 2005 Performance and Accountability Report 256
NASA CONTACT INFORMATION NASA Headquarte rs (HQ) Washington, DC 20546-0001 (202) 358-0000 Hours: 7:30-4:30 EST http://www.nasa.gov/centers/hq/home/index.html
NASA Ames Research Center (ARC) Moffett Field, CA 94035-1000 (650) 604-5000 Hours: 7:30-4:30 PST http://www.nasa.gov/centers/ames/home/index.html
NASA Dryden Fl ight Research Center (DFRC) P.O. Box 273 Edwards, CA 93523-0273 Hours: 7:30-4:00 PST http://www.nasa.gov/centers/dryden/home/index. html
NASA John H. Glenn Research Center at Lewis Fie ld (GRC) 21000 Brookpark Road Cleveland, OH 44135-3191 (216) 433-4000 Hours: 7:30-4:30 EST http://www.nasa.gov/centers/glenn/home/index. html
NASA Goddard Space Fl ight Center (GSFC) 8800 Greenbelt Road Greenbelt, MD 20771-0001 (301) 286-2000 Hours: 7-7:00 EST http://www.nasa.gov/centers/goddard/home/index. html
NASA Jet Propulsion Laboratory (JPL) 4800 Oak Grove Drive Pasadena, CA 91109-8099 (818) 354-4321 Hours: 7:30-5:00 PST http://www.nasa.gov/centers/jpl/home/index.html
NASA Lyndon B. Johnson Space Center (JSC) Houston, TX 77058-3696 (281) 483-0123 Hours: 6:00-6:00 CST http://www.nasa.gov/centers/johnson/home/index. html
NASA John F. Kennedy Space Center (KSC) Mail Code XA/Public Inquiries Kennedy Space Center, FL 32899-0001 (321) 867-5000 Hours: 6:00-6:00 EST http://www.nasa.gov/centers/kennedy/home/index. html
NASA Langley Research Center (LaRC) 100 NASA Road Hampton, VA 23681-2199 (757) 864-1000 Hours: 7:00-5:00 EST http://www.nasa.gov/centers/langley/home/index. html
NASA George C. Marsha l l Space Fl ight Center (MSFC) Marshall Space Flight Center, AL 35812-0001 (256) 544-2121 Hours: available 24 hours http://www.nasa.gov/centers/marshall/home/index. html
NASA John C. Stennis Space Center (SSC) Stennis Space Center, MS 39529-6000 (228) 688-2211 Hours: 6:00-6:00 CST http://www.nasa.gov/centers/stennis/home/index. html
NASA Wal lops Fl ight Faci l i t y (WFF) Goddard Space Flight Center Wallops Island, VA 23337-5099 (757) 824-1000 Hours: 7:00-7:00 EST http://www.wff.nasa.gov
Produced by NASA Headquarters and The Tauri Group, LLC.
Back cover photo caption: The STS-114 crew heads for the bus that will transport them to Discovery on July 26, 2005. From left, in front are Mission Specialists Andrew Thomas, Charles Camarda, and Wendy Lawrence, with Pilot James Kelly leading. In back are Mission Specialists Stephen Robinson and Soichi Noguchi (representing the Japan Aerospace Exploration Agency), led by Mission Commander Eileen Collins. (Photo: NASA)