Proactive Approach for the Prevention of DDoS Attacks in ...

PRBS/EWMA Based Model with BinomialDistribution for Predicting Cyber-Attacks (Brute
Froce, DoS, DDoS) in Computer NetworksAnderson Silva∗¶‖, Elvis Pontes∗‡¶, Fen Zhou‡, Adilson Guelfi†‖ and Sergio T. Kofuji∗
∗ LSI-POLI, Universidade de Sao Paulo, Brasil, email see http://pad.lsi.usp.br‡CERI-LIA, University of Avignon, Agroparc BP 1228, Avignon, France, [email protected]†FIPP, Universidade do Oeste Paulista, Presidente Prudente, Sao Paulo, Brasil, [email protected]
¶ Unip, Universidade Paulista, Sao Paulo, Brasil, [email protected]‖ IPT, Institute of Technological Research, Sao Paulo, Brasil
Abstract—Burst attacks (e.g. Brute Force, DoS, DDoS, etc)have become a great concern for the today’s computer networks,causing millions of losses to the society. Even though the detectionof burst attacks is widely investigated, there is a gap in theacademic literature regarding the predicting models for antici-pating such security issue. As the frequency of bursts dependson the behavior of the attackers, it is hard to determine theexact moment when a burst starts. In this paper we proposea new model for aggregating peaks of a burst - specificallyfor the brute force attack - at a single point called One PointAnalysis (OPA). We applied the OPA technique in a prototype,so the beginning of each burst was predicted by the use of (a)Pseudo-Random Binary Sequences (PRBS), and (b) ExponentialWeighted Moving Averages (EWMA). For evaluating the results,the OPA was compared to other techniques by two indicators,and it was possible coming to a conclusion regarding the OPAeffectiveness.
Index Terms—brute force attack, burst attacks, cyber-attackforecasting, EWMA, prediction model
I. INTRODUCTION
In contrast to reactive methods, forecasting methodologycan anticipate corrective security actions to be adopted oncomputer systems in a proactive manner [1, 2]. Consideringthat it is usual to employ a defense perimeter with layersapplied to computer networks [3], the system that anticipatesattacks by predicting events can be considered as an additionaldefense layer.
In this reasoning line, Exponentially Weighted MovingAverages (EWMA) can be employed for analyzing time seriesof cyber-attacks in order to identify future trends [4]. Theresults of such analysis can serve, for example, to predictcyber-attacks in computer networks [5]. However, besides theEWMA, other models for prediction and detection can be usedin computer systems - for instance, stochastic processes (e.g.Markov Chains), genetic programming, trend analysis basedon Fibonacci Sequence, neural networks, etc, can be employedby Intrusion Detection Systems (IDSs) and Intrusion Preven-tion System (IPSs) to monitoring events within a computernetwork. Such tools - IDS and IPS - can detect cyber-attacksin two manners: (1)comparing events with known signatures
of attacks (misbehaving mode); or (2) analyzing deviationsoccurring from a default behavior (anomaly mode) [6].
Nevertheless, there are specific features present in certaintypes of attacks that require additional settings in the con-figuration of prediction methods. Due to the irregular flowof traffic that typify some types of attacks (such as LowRate Denial of Service (LDoS), DoS, DDoS, or brute forceattacks) [1], sometimes conventional methods and techniquesare not adequate to forecast security events. Though bruteforce attacks, LDoS, DoS and DoS have similarities, this paperfocuses specifically the brute force attacks, which are (a) usedprimarily to discover the passwords that allow unauthorizedaccess to systems, and (b) are characterized by an intermittentflow of access attempts coming from the same source [7].The flows of the brute force attacks occur in bursts, extendinguntil the attacker succeeds or declares the attempt a failure.Due to the characteristic of abrupt starts and stops of the attackflows, brute force attacks will be hereafter classified as burstattacks. Eventually a burst from a specific origin happens at thesame time as another, but it is more common to observe gapsbetween them. These intervals indicate periods of inactivitybetween bursts.
The detection of ongoing brute force attacks is usually notcomplex, mainly owing to the amount of traffic generatedby the regular repetition of access attempts that are likelyto be recorded in logs (or, time series) [8]. Nonetheless, thesimplicity in detecting brute force attacks does not simplifythe forecasting process. As the frequency of bursts is based onthe behavior of the attackers, it is hard to determine the exactmoment when a burst starts. In other words, the prediction ofbrute force is directly tied to the precise determination of thebeginning of each burst of attacks.
Therefore the aim of this work is to predict the onset ofeach burst of brute force attacks with the EWMA method.We propose a new technique, called One Point Analysis(OPA), to aggregate the peaks of a burst at a single point.With the OPA technique, the beginning of each burst can bepredicted by the EWMA method. The results were assessedby observing a honey-net vulnerable to brute force attacks

2
with a Security Shell (SSH). Two indicators were created tomeasure the effectiveness of forecasts: (a) the Rate of EffectiveForecasting (REF) and (b) the Rate of Attacks EffectivelyPredicted (RAEP).
The effectiveness of the predictions by EWMA is evaluatedby comparing the results of the REF and RAEP indicators on:(1) individual bursts; and (2) the results of the OPA technique.In addition to the analysis of effectiveness, the REF and RAEPindicators allow comparisons between different parameters ofthe EWMA method (e.g., moving averages (MA) and delaythreshold analysis).
The remainder of this paper is as follows: Sections IIand III present an overview about cyber-attacks, bringing outrelated works and forecasts models by the use of EWMAs.The proposal for approaching forecasting effectiveness - theindividual burst attacks and the One Point Analysis (OPA)- is presented in section IV. Experiments are described insection V. Results are analyzed in section VI and section VIIsummarizes conclusions and suggestions for new studies
II. RELATED WORK - CYBER-ATTACKS AND THEPREDICTING MODELS
This section describes fundamental concepts regardingcyber-attacks and prediction models applied to deal with them.
A. Overview about Cyber-attacks
Cyber-attacks can be classified as a set of actions intendingto compromise the integrity, confidentiality or availability ofcomputer systems. Cyber-attacks can be caused by users ormalicious software, which try either to obtain access, to usesystems in an unauthorized way, or to enumerate privileges[9].
Reference [10] published a study in the United Statesabout losses in 2013 concerning cyber-attacks: the adjusteddollar loss of for electronic frauds was U$781, 481 million, in262, 813 organizations, a 48.8% increase over the financial lossof the previous year. The outlook of losses with cyber-attacksis worse for the emergent countries - e.g. for just the first halfof 2011, the Brazilian Federation of Banks (FEBRABAN) hasregistered R$685 million in losses due to fraud with cyber-attacks, representing an increase of 36% over the same periodof 2010, in which the amount of losses was about R$504million [11].
According to (Anstee et al, 2012) [12], the following keyfindings could characterize the panorama of the cyber-attacksduring the year of 2011:
• Cyber-attacks represent advanced persistent threats andare a top concern for service providers and enterprises -the survey of [12] has shown the increase of compromisedhosts by cyber-attacks within the companies. It is givento the number and complexity of existing malwares,their rate of evolution and the consequent inability ofIDS, Anti-Virus systems, and other security devices tofully protect the companies. Some other concerns oncyber-attack include industrial espionage, data theft andmalicious insiders;
• DoS (Denial of Service) and DDoS (Distributed Denial ofService) are continuously evolving results of the surveyconfirm that application layer and multi-vector attacksare continuing to evolve while volumetric attacks arestarting to plateau in terms of size. Attackers have nowturned to sophisticated, long-lived, multi-vector attacks(combinations of attack vectors designed to cut throughthe defenses an organization has in place) to achieve theirgoals;
• Data Centers and Cloud Services are Increasingly Vic-timized, as more companies move their services to thecloud;
• The top three most commonly perceived motivations forDDoS attacks are political/ideological, online gaming andvandalism/nihilism;
• There has been limited improvement in visibility andinvestment in detection/mitigation solutions specific tothe mobile network since the last survey. The economicsof consumer subscriber networks do not incent providersto implement security until a problem occurs;
• Much of the Internet’s DNS infrastructure remains openand unprotected;
• IPv6 Deployments are Quickly Becoming Pervasive -eighty percent of respondents have partial or full IPv6deployments already in place with most using dual-stackas a migration mechanism. This opens new opportunitiesfor attackers to bypass network controls by switchingbetween IPv4 and IPv6 networks.
As it can be noticed, most of the findings in [12] points outthat cyber-attacks explore technical vulnerabilities in the basicInternet technology (e.g., the protocol stack) and the currentsecurity devices are not able to mitigate those cyber-threats.One way to address this scenario is to consider several securitylayers in the perimeter protection of computer systems [9].In this line of thinking, cyber-security would become moredependent on the accuracy of the devices distributed in thosesecurity layers. Another important consideration is that theprediction of cyber-attacks could play a significant role in theoverall security strategy for each of the layers, allowing theadoption of proactive countermeasures to anticipate any typeof problems. So, for the forecasting, different models could beconsidered to be implemented in the diverse layers - Markovchains, stochastic processes, auto-regressive models, movingaverages, etc.
B. Systems for Dealing with Cyber-Attacks
Taking into account that IDPS (Intrusion Detection and Pre-vention System) is one of the most important tools for copingwith cyber-attacks, in [13] it is presented a detailed surveyabout various techniques for intrusion detection, focusing onthe advantages and disadvantages of each one. Additionally,reference [13] discusses methods that encompasses specificfeatures of complementary tools, namely Systems for Analyz-ing Security Events (SASE). The SASE’s features approachedby [13] are the ones for further analysis regarding the attacks,

3
in which graphs, figures and statistics are presented to thesystems’ administrator.
Differently of the IDPS, input data for SASE considersnot exclusively events or data from security systems, but anydevice (hardware or software) can provide data on events thatare occurring in the monitored system [14, 15]. Actually, theuse of various sources of information is useful, as it allows thecorrelation of different events, from different sources, bringingout information that went previously unnoticed [16]. So itbecomes possible to crossing data, from assorted sources,e.g. by by multi-correlation [15, 17, 18]. Basically, the multi-correlation searches for common aspects of data from differentsources, from different events that have some sort of connec-tion, like the event’s timestamp. Multi-correlation is addressedin one of our previous work [6], considering alerts yielded byIDSs and logs brought forth by the operating system. One ofthe goals of [6] was to trace connections between differentevents and find out whether or not the connections are part oflarger attack strategies. With this approach, the FP alerts weresuccessfully filtered [6], but the predicting of burst attacks wasnot addressed;
Furthermore, although the advances of SASE in the recentyears - by adopting visual graph aspects [6], mathematicalmodels [19] and statistical models [20] -, SASE does notconsider approaches for dealing with the prediction of ma-licious events. One could advocate that, instead of focusingon proactive approaches, computer security focuses on reac-tive postures (blocking and/or reporting ongoing attacks orattacks that have already inflicted damage) [21]. Yet predictiontechniques may be adopted in the security strategies andpolicies, rarely forecasting necessarily is part of SASE, andconsequently the prediction of burst attacks is not studied [16].
In fact, it is hard to have 100% of accuracy rate forpredicting the exact time an attack is about to happen in thefuture, since the prediction is based on specificities of theanalyzed system. Reference [13] points to examples of thesespecific issues: (1) some attack strategies are planned to hit thecomputer systems in the period the strike can pass unnoticed(e.g. probing attacks that occur during dawn); (2) other cyberattacks happen intentionally during the period the computersystems are heavily accessed by regular users, as the goal ofthe attack is to cause disruption (e.g. DoS and DDoS attacks).For these cases, instead of predicting the exact time an attackis about to happen in the future, forecasting may approach thetrends of cyber-attacks in order to anticipate intrusions. As aresult, forecasts indicate the increasing or decreasing trendsof cyber-attacks for both, (a) periods that computer systemsare less monitored; and (b) period that computer systems areheavily accessed.
Indeed, a number of papers argues that predictions, forecast-ing and trend analysis usually lie on stochastic and data miningmethodologies, applied on historic series of computer systems[1, 22]. So, though the SASE’s input data source involves justevents that have already occurred in the historic series, it doesnot have negative influence in the prediction models. In someother of our earlier works, we employed the EWMA along
with prediction techniques based on the Fibonacci Sequence[16]. In [16] the EWMA considered the last 5, 13 and 34hours, making it possible to trace the trend lines of cyberattacks. In [16]the prototype regarded simulation of normalcomputer network activity, and malicious traffic as well. Bothkinds of traffic, normal and malicious, were applied in threesites geographically divided. Nevertheless, the prediction ofburst attacks was not considered again in the mentioned works.
By the use of the forecasting methods employed in [16](EWMA along with Fibonacci Sequence) it was possible tovisualize graphs with the crossing of the moving averages,also called as thresholds, as they indicate reversal of attacktrends. In [16] it is advocated that the prediction based onEWMA along with the Fibonacci sequence is better than thesingle use of the Fibonacci sequence as the unique predictionmethod. This is mainly due to the dependence between the twomethodologies. However, the referred works did not approachBrute Force attacks or OPA.
Similarly to the multi-correlation [16], according to [4]the combined application of various forecasting techniquesis recommended. Reference [5] applies several probabilis-tic techniques (decision tree, hotelling’s T2 test, Chisquaremultivariable Markov chains and EWMA) to examine threeproperties of the ITU:
• Frequency - with frequency analysis it is possible toobtain important details about the detection and networktraffic;
• Ordering - the order of events is essential for audit to beconducted;
• Duration - the time it takes each event can also beimportant information for the understanding of an attackor even of its prediction.
So, reference [23] uses the EWMA with adaptive thresholdsto analyze the normal behavior of network traffic; reference[3] studied the behavior of system, by the use of probabilitiesin the Markov chains; reference [21] used Hidden MarkovChains (HMM) to explain the transition of states that is basedon a set of probabilities. Some other approaches include theuse of sensors and agents along the network. Sensors andagents are able to interact with each other and making use ofassorted forecasting techniques, as proposed by [4]. Moreover,the exchange of information between sensors and agents helpin anticipation of action against malicious traffic and cyber-attacks.
In this line of thought, reference [24] proposed a collabora-tive architecture for agents and sensors, in order to provide tothe forecasters some more relevant data to be applied in theprediction methodologies - see (Figure 1). This architecturesis called DIFSA, which provides four levels of communicationwhere the sensors will be located:
1) IFS Level 1 (Host Level: Independent Security Devices);2) IFS Level 2 (Host Level: Integrated Security Devices);3) IFS - Level 3 (Network Level);4) IFS - Level 4 (Backbone Level).Through communication between levels and through corre-

4
WAN
Network Flow
databaseBorder Gateway
Router 1
...
Collector and
Analyzer of
Network Flow
Firewall
Antivirus Antispam IDPS
Forecast Forecast Forecast Forecast
Host
Security
device n
Network Flow
database
Forecasting
Query and feedback
LAN
Forecasts
level 1 x level 2
Forecasts
level 2 x level 3
Forecasts
level 3 x level 4
Collector and
Analyzer of
Network Flow
Collector and
Analyzer of
Network Flow
Collector and
Analyzer of
Network Flow
Legend
Forecasts - level 1
Forecasts - level 2
Forecasts - level 3
Forecasts - level 4
...
Forecast
IFS Level 1
Forecasting
Forecasting
IFS
Level 2
IFS
Level 3
IFS
Level 4
LANLAN
Network flow
database
Network Flow
database
Network Flow
database
Router 2 Router n
Fig. 1: Structure of the DIFSA [16]
lation among the various techniques used for forecasting, pre-dictions made at a network level can be transferred and used atother levels, ensuring the anticipation of the countermeasuresin any level. Notwithstanding, once again, the prediction ofburst attacks are not approached on those works.
III. LITERATURE REVIEW
This section presents fundamental concepts regarding (a)prediction models based on Exponential Weighted Moving Av-erages (EWMAs); and (b) Pseudo-Random Binary Sequence(PRBS) for defining the α value for the EWMA.
A. Exponential Weighted Moving Averages (EWMA)
Moving averages (including simple, weighted, EWMA, orcentral) are regularly used to smooth out fluctuations in timeseries and to highlight trends [1, 25, 26]. EWMA may beapplied to auto-correlated and uncorrelated data for detect-ing cyber-attacks that manifest themselves through signif-icant changes in the event occurrence rate. Both EWMAfor auto-correlated and for uncorrelated have demonstratedgood efficiency for detecting attacks [25]. EWMA appliesweighting factors that decrease over time, giving much moreimportance to recent observations while still not discardingolder observations entirely. The statistic that is calculated is[27]:
EWMAt = αYt+(1−α)EWMA(t−1), t = 1, 2, . . . , n (1)
Where EWMA is the mean of the historical data; Yt is theobservation at time t; n is the number of observations to bemonitored including EWMA; and 0 < α < 1 is a constant thatdetermines the depth of memory of the EWMA. The parameterα determines the weight of older data in the calculation of theEWMA statistic. Thus, a large value of α gives more weight torecent data and less weight to older data, while a small valueof α gives a higher proportion of weight to older data. An
overview of adopting EWMA with adaptive thresholds basedon a normal profile of network traffic can be found in [23].The analysis of thresholds with EWMA may summarize ahuge amount of data in network traffic [16, 28].
A simple moving average (SMA) is the non-weighted meanof the previous n data. For example, a 10-hour SMA of theintrusive event X (e.g., DoS) is the mean of the previous 10hours of event X. If those events are eM , e(M−1), . . . , e(M−9),then the formula is [25]:
SMA =(eM + e(M−1) + . . .+ e(M−9)
10(2)
When calculating successive values, a new value comes intothe sum, and an old value drops out, meaning a full summationeach time is unnecessary [25]–[27].
SMA(currenthour) = SMA(lasthour)−(eM − n)
n+eMn
(3)
In fact, it is hard to achieve a 100% accuracy rate for predictingthe exact time an attack will happen in the future since theprediction is based on specificities of the analyzed system.(Axelsson, 2000) points to examples of these specific issues[29]:
• planned attack strategies which hit the computer systemsduring a period when the strike can pass unnoticed (e.g.,probing attacks that occur at dawn);
• some cyber-attacks happen intentionally during the periodwhen the computer systems are heavily accessed by reg-ular users, as the goal of the attack is to cause disruption(e.g., DoS attacks [29]).
For these cases, instead of predicting the exact time anattack is about to happen in the future, forecasting may usethe trends of cyber-attacks to anticipate intrusions. As a result,forecasts indicate the increasing or decreasing trends of cyber-attacks for when computer systems are less monitored andwhen computer systems are heavily accessed.
Indeed, a number of papers argue that predictions, fore-casting and trend analysis usually rely on stochastic and datamining methodologies, applied on time series of computersystems [1, 2]. Similarly to the computer systems, (Yamamoto,2012) performed studies using the standard moving average(MA) in the financial markets that shows a buy (or sell) signalwhen the price deviates from the MA lines in the EWMAgraph over a period (e.g., penetrates downward) [30]. Afterthat signal, traders hold a long (or short) position until thenext sell (or buy) signal. (Yamamoto, 2012) creates somevariations on common rules, like comparing the MA withlong periods of average-crossing downward MAs with shortperiods of average, setting a fixed value to validate thresholds,defining fixed periods for traders to take an action and takinginto consideration the delay in the actions of traders. This lastfact closely link to the results obtained in this work.
Early empirical studies and statistical inferences of (Lakon-ishok and LeBaron, 1992) concerning two simple technicaltrading rules (moving average trading rules (MA) and tradingrange breakout rules (TRB)) have indeed shown that the model
5
predicts a volatile period, as well as the return in the financialstrategies considered [31]. In this line of thought, (Pontesand Guelfi, 2009) and (Pontes and Zucchi, 2010) employedthe EWMA along with prediction techniques based on theFibonacci sequence [16]. The EWMA considered the last 5,13 and 34 hours, making it possible to trace the trend linesof cyber-attacks. The prototype simulated normal computernetwork activity and malicious traffic as well. Both typesof traffic, normal and malicious, were applied in three sitesdivided geographically. It was possible to visualize graphs withthe thresholds indicating a reversal of the attack trends.
However, it is important to emphasize that the referredstudies did not discuss the burst attacks, brute force attacksor OPA.
B. Pseudo-Random Binary Sequence (PRBS)
A sequence a0, . . . , aN−1 of N bits is considered as aBinary Sequence [3], as indicated by Equation (4):
aj ∈ {0, 1}, forj = 0, 1, . . . , N − 1 (4)
A BS consists of m =∑aj ones and N − m zeros. For a
BS to become a pseudo-random binary sequence (PRBS), itsautocorrelation function should be:
C(v) =
N−1∑j=0
ajaj+v (5)
Having only two values:
C(v) =
{m, if v ≡ 0 (modN)
mc, otherwise(6)
With Equation (7) called as the duty cycle of the PRBS, similarto the duty cycle of a continuous time signal [3, 32].
c =m− 1
N − 1(7)
Although a PRBS is in fact deterministic, it is so called’pseudorandom’ because it seems to be random since the valueof an aj element is independent of the values of any of theother elements, similar to real random sequences.
In our model, a burst is represented as a PRBS, since thepeaks of the bursts act as the bit "1" and the time betweenthose peaks bits are "0". Thus, that behavior resembling a di-chotomy with stable conditions coul be classified as a binomialdistribution [3, 32], and its probability may be calculated by:
P (X = k) = (nk )pk(1− p)n−k, k = 0, 1, . . . , n (8)
Where X = a random variable; k =the occurrence of X; p =the probability of the occurrence of ’A’ event: when ’A’ event= 1 (probability of no occurrence of ’A’ event = 1− p); n =the number of repetitions of experiment ε.
Therefore, due to the characteristics of the burst-attackswhich allow its representation as a PRBS, in our model thePRBS was employed during the training phase for determiningthe best value of α in the EWMAs.
IV. EWMA FORECASTING MODEL APPLIED ON BRUTEFORCE ATTACKS
A. The Approach Based on Individual Bursts)
A remarkable behavior in a brute force attack is its pace(see Figure 1):
• Many of the attack attempts come from the same source;• The attacks happen repeatedly, in bursts, with a high rate
of occurrence;• Usually one attacker does not take too long with the same
attack;• After some time, the sequence of attacks stops, followed
by periods of inactivity;• After the inactivity, the attempts may be resumed by
another attacker.Figure 1(a) shows the action of three attackers over time,
where each peak represents an attempt. Notice that attacker 3makes more attempts than the other ones. It is also possibleto observe intervals between each set of attacks.
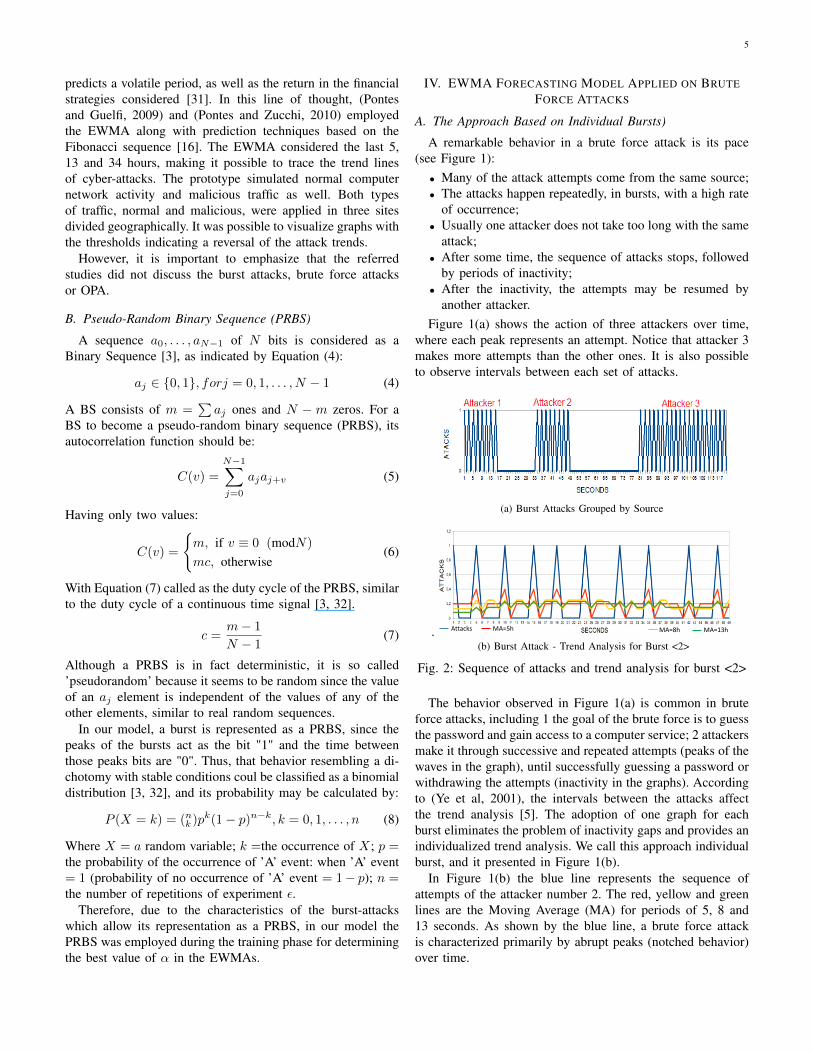
(a) Burst Attacks Grouped by Source
.
MA=8h MA=13h Attacks MA=5h
(b) Burst Attack - Trend Analysis for Burst <2>
Fig. 2: Sequence of attacks and trend analysis for burst <2>
The behavior observed in Figure 1(a) is common in bruteforce attacks, including 1 the goal of the brute force is to guessthe password and gain access to a computer service; 2 attackersmake it through successive and repeated attempts (peaks of thewaves in the graph), until successfully guessing a password orwithdrawing the attempts (inactivity in the graphs). Accordingto (Ye et al, 2001), the intervals between the attacks affectthe trend analysis [5]. The adoption of one graph for eachburst eliminates the problem of inactivity gaps and provides anindividualized trend analysis. We call this approach individualburst, and it presented in Figure 1(b).
In Figure 1(b) the blue line represents the sequence ofattempts of the attacker number 2. The red, yellow and greenlines are the Moving Average (MA) for periods of 5, 8 and13 seconds. As shown by the blue line, a brute force attackis characterized primarily by abrupt peaks (notched behavior)over time.

6
According to (Ye, Chen, Borror, 2004), when a processshows abrupt changes in its values, like a brute force attack,forecasting by EWMA is not recommended because it is basedon the averages of a time series [8, 25, 33]. EWMA analysisindicates that the time between each peak of an attack is akey element in the assessments of individual bursts. In thecase of brute force attacks with a high rate of occurrence,the accuracy of a trend analysis may be impaired. However,studying this type of behavior is important to understandingalternative ways of predicting brute force attacks [3]. TheEWMA forecasting method is based on the intersection ofMA lines, which establishes thresholds and indicates theforecasts concerning increase or decrease phases of attacks.Upon examining thresholds, delays can be considered or not.A delay indicates that a threshold can be confirmed a few stepsforward, but not necessarily at the next event (attack) [16].
Figure 2 illustrates an example of the impact of delay onEWMA analysis.
Fig. 3: Notional example in which the delay is not consideredin the analysis
In the graph of Figure 2, the blue line represents the attacks;the yellow and red ones represent the MA with periods of5 and 13 seconds, respectively. Point 1 refers to a thresholdlocated between the second and the third periods of analysis.Point 1 indicates that the number of attacks will increase, an-ticipating in three seconds the next peak of attacks, representedby point 2. Similarly, point 3 is a threshold located betweenthe sixth and the seventh periods of analysis, and indicatesthat the number of attacks will increase again, anticipating inthree seconds the following peak of attack activity, as shownby point 4. Although some studies report delays on EWMAanalysis [1, 16] it is important to reinforce that the behavior ofbrute force is continuous, so delays are not supported by theanalysis of individual bursts. This way, for correctly assessingthe prediction rates, two indicators were created: 1 the Rateof Effective Forecasting (REF) and 2 the Rate of AttacksEffectively Predicted (RAEP), both as percentages. In Figure2, the points A, B and C depict the peaks of the number ofattacks, while the points D, E and F illustrate the periods ofattack inactivity - henceforth defined as valleys. Both the peaksand the valleys will be used for assessing the RAEP, as it isdescribed below:
• REF takes into account each crossing of the MA lines(threshold), checking that the point immediately afterthe crossing of lines shows the trend predicted by thethreshold. The REF indicator is therefore related to theeffectiveness of the predictions brought forth by the
thresholds of the MA, indicating the percentage in whichthese forecasts are confirmed. The REF indicator ispresented in (4):
REF =(numberofeffectivethresholds)
(numberofthresholds)(9)
• RAEP takes into account the samples of peaks and val-leys, as shown in Figure 2. The RAEP indicator indicateswhether the number of peaks and valleys were predictedby the preceding threshold (crossing of MA lines). TheRAEP indicator is presented in the formula (5).
RAEP =(numberofthresholds)
(numberofsamplesofpeaksandvalleys)(10)
Thus, by the models shown in (4) and (5), the RAEP andREF indicators are notably not complementary. A conjuredexample of how the calculations of RAEP and REF are madeis illustrated in Figure 3
Fig. 4: Example of an EWMA graph with the REF and RAEP(data are empiric)
Figure 3 illustrates the results of calculations of the RAEPand REF indicators. The blue line represents the line ofattacks with peaks at: 2, 5, 7, 9, 13 and 15. The red andgreen lines are the MAs with periods of 5 and 8 seconds,respectively. Crossing between the MAs (thresholds) and theirrespective predictions are represented by arrows as follows:(A) reduction, (B) increase, (C) decrease, and (D) increase.Tables 1 and 2 detail the crossing points.
Table 1 shows results of the REF for the thresholds indicatedin Figure 3. The number of effective thresholds = 2; theamount of thresholds = 4; therefore, REF = 2/4 = 0.5 %.Table 2 shows the results for the RAEP and the reversals ofdirection in Figure 3. The number of increasing (or decreasing)attack trends confirmed by a previous threshold of MA lines= 2 (points 4 → 5 and 12 → 13 of Table 2); the amount ofreversal of direction (up and down) in Figure 3 is 12; therefore,the RAEP = 2/12 = 0.16%
TABLE I: REF assessment of the four crossing point
Arrow Indicated Next point of Trend observed ResultsForecast attack line in the attack line
(A) Decrease 2 Increase Wrong(B) Increase 6 Increase OK(C) Decrease 11 No changes Wrong(D) Increase 13 Increase OK

7
Therefore, when dealing with individual bursts, two featuresshould be remembered: 1 as it is an individual analysis, thetime among different bursts is not assessed and 2 the delaysare not taken into account in the EWMA analysis.
TABLE II: Assessing the RAEP using 12 points of reversal ofdirection
Points Reversal Threshold preceding Trend Resultsindicated the MA crosses observed
1⇒ 2 Increase (A) Decrease Wrong2⇒ 3 Decrease - - Wrong4⇒ 5 Increase (B) Increase OK5⇒ 6 Decrease - - Wrong6⇒ 7 Increase - - Wrong7⇒ 8 Decrease - - Wrong8⇒ 9 Increase - - Wrong9⇒ 10 Decrease - - Wrong12⇒ 13 Increase (D) Increase OK13⇒ 14 Decrease - - Wrong14⇒ 15 Increase - - Wrong15⇒ 16 Decrease - - Wrong
B. The Approach Based on One Point Analysis (OPA)
Due to the nature of brute force attacks, it is vital toidentify the attack the moment which bursts start. However,it is very hard to know the exact moment that they will start.Paradoxically, when a burst attack starts its detection may berelatively simple since the sequence of attacks comes from asingle source and is usually uninterrupted with high rate ofoccurrence. Thus, for the brute-force attacks, predicting themoment that a burst will be initiated is far more importantthan predicting whether the attack is already underway.
To cover this gap, in this work it is proposed that eachburst is considered as a single peak on the EWMA graphs,regardless of the duration of the attack and the number ofattempts that the burst contains. This technique is called OnePoint Analysis (OPA) and is shown in Figures 5(a) and (b).
Figure 5(a) illustrates the action of four attackers whoperform brute force attacks. Figure 5(b) illustrates these sameattacks as an OPA arrangement. In Figure 5(a), there is anoverlap of the bursts from attackers 2 and 3. The overlap isrepresented in Figure 6 with a single peak considering bursts2 and 3.
The conversion of a burst of peaks into a single point is oneof the advantages of the transition shown from Figures 5(a) and(b). The mentioned transition is performed by adopting OPA,making it possible to simplify the representation of the burstattacks, and improving the forecast. The spectrum behavior inFigure (b) becomes a smaller set of random points representingthe same bursts. This way, the high rate of variation noted inFigure 5(a) can be simplified as observed in Figure 5(b), inwhich the line represents a clustering of bursts. In this manner,with a small set of random points, it becomes more suitableto use predictions by EWMA to identify the beginning of anew set of burst attacks.
Furthermore, the simplification introduced by the OPAtechnique does not invalidate calculations of the REF and theRAEP on EWMA graphs. However, the assessment of those
(a) Individual Bursts
.
(b) OPA Approach
Fig. 5: Set of attempts into OPA
indicators using OPA is different from the previous analysisof individual bursts (without using OPA). Delays and timebetween bursts are not taken into account when performing theanalysis of brute force attacks by individual bursts on EWMAgraphs. Instead, in the OPA technique, both delay and timebetween bursts are considered on EWMA graphs.
Although more flexibility for analyzing the graphs with OPAand delays, there is a limitation in the process: the maximumvalue of delay is based on the MA lines adopted and it isunchangeable. To determine the delay, the following settingswere used:
delay = SUP(MA2 −MA1)
2(11)
Where MA2 is the larger adopted MA; and MA1 is thesmaller adopted MA. To ensure the integrity of obtainedvalues, we have assured that the same delay value could not beused more than one time. The following values were adoptedas maximum delays for each pair of MAs: (1) MA of 5s and8s have 2 as delay; (2) MA of 5s and 13s have 4 as delay;(3) MA of 8s and 13s have 3 as delay. The OPA techniqueacts as an aggregation method, clustering peaks of bursts fromdifferent attackers. Therefore, when the OPA technique is used,the time between bursts is also important in the EWMA graphanalysis. This feature is analyzed in our experiment in section5.
V. PROTOTYPE
The experiment and details of its implementation are de-scribed in this section. The prototype was designed over ahoney-net, as described in Figure 6:
The honey-net illustrated in Figure 6 consists of a serverworking with Linux as the operational system. The server actsas a gateway between the internal network and a DemilitarizedZone (DMZ). This server maintains an open source version(OpenSSH) of a Secure Shell (SSH). The network monitoring

8
is performed by Snort, an IDS. A SSH service has been chosenfor two main reasons: 1 it is a well-known service that doesnot require another feature to identify strategies of preparatoryattacks or filter to eliminate FPs; and 2 it is exposed to attemptsof password guessing (brute force attacks) [4].
Fig. 6: Settings of honey-net)
Table 3 shows the amount of data captured by the prototypesystem and the number of brute force attacks recorded intwo months of monitoring. The second column comprises atotal of 51851 attacks during the first and second months. Thethird column presents how long the prototype was working(in seconds), and the fourth column indicates the number ofdifferent attackers (identified by source IP address).
TABLE III: Attacks Registered in the Prototype
Period Amount realeased time Amount ofof Attacks in seconds attackers
First month 18060 2678400 42Second month 33791 2678400 64
Total 51851 5356800 106
VI. DISCUSSION
In this section, we present a discussion about the achievedresults. Two subsections are introduced: one about individualbursts, and another for the OPA analysis.
A. REF and RAEP Results in Individual Bursts
As aforementioned, EWMA method is not adequate forapproaching the individual bursts due to large variation ofpeaks. A burst can be represented as a Pseudo Random BinarySequence (PRBS), where the peaks represent the bit "1" andthe time between these peaks bits are "0".
B. REF and RAEP Results with the One Point Analysis
It is important to reinforce that the intervals between burstsand delays are important to the analysis in the OPA approach.Therefore, six different time periods were adopted for employ-ing the OPA technique: hourly, every two hours, every threehours, every four hours, every five hours and every six hours(see Figure 7(a) to Figure 7(d)).
Analyzing the results of this approach with different timeperiods is advantageous as it allows performing predictionswith one to six hours before the occurrence of events. In eachone of the six periods, three options of MA are used: 5-8hours, 5-13 hours and 8-13 hours. A comparison among theREF and RAEP indicators resulting from the MA adopted areshown in Figure 7(a).
1 hour 2 hours 3 hours 4 hours 5 hours 6 hours0
10
20
30
40
50
60
70
80
90
OPA Graph - Comparasion among MA - RAEP and REF indicators with delay
RAEP 5-8
Delay = 2 h
RAEP 5-13
Delay = 4 h
RAEP 8-13
Delay = 3 h
REF 5-8
Delay = 2 h
REF 5-13
Delay = 4 h
REF 8-13
Delay = 3 h
Sets of time
RA
EP
and
RE
F v
alu
es (
%)
(a) OPA Comparison among MA - RAEP and REF with delay
.
1 hour 2 hours 3 hours 4 hours 5 hours 6 hours0
10
20
30
40
50
60
OPA Graph - 2 hours delay versus no delay - MA 5 and 8 hours
RAEP 5-8
Delay = 2 h
RAEP 5-8 No delay REF 5-8
Delay = 2 h
REF 5-8 No delay
Sets of time
RA
EP
and
RE
F v
alu
es (
%)
(b) OPA - 2 hours delay versus no delay - MA 5 and 8 hours
.
1 hour 2 hours 3 hours 4 hours 5 hours 6 hours0
10
20
30
40
50
60
70
80
OPA Graph - 3 hours delay versus no delay - MA 8 and 13 hours
RAEP 8-13
Delay = 3 h
RAEP 8-13 no delay REF 8-13
Delay = 3 h
REF 8-13 No delay
Sets of timeR
AE
P a
nd
RE
F v
alu
es (
%)
(c) OPA - 3 hours delay versus no delay - MA 8 and 13 hours
.
1 hour 2 hours 3 hours 4 hours 5 hours 6 hours0
20
40
60
80
100
OPA Graph - 4 hours delay versus no delay - MA 5 and 13 hours
RAEP 5-13
Delay = 4 h
RAEP 5-13 No delay REF 5-13
Delay = 4 h
REF 5-13 No delay
Sets of time
RA
EP
and
RE
F v
alu
es (
%)
(d) OPA - 4 hours delay versus no delay - MA 5 and 13 hours
Fig. 7: REF and RAEP Comparissons in the OPA
The best results for the RAEP were found with the MA of5-13 hours, precisely the pair with the largest amplitude. Forthe time periods from 1 to 4 hours, the REF with the MA of5-13 achieved a better result. However, in the last period (6hours), the REF with the MA of 8-13 hours achieved a superiorresult compared with the REF with the MA of 5-13 hours. Thispaper did not evaluate time periods larger than 6 hours, so itis not possible to conclude whether this behavior will happenwith larger time periods. That result indicates one limitationof the OPA: another technique should be used in the definitionof the appropriate value of maximum delay. The delays shownin the Figure 7(a) are estimated according to formula (6).
During OPA analysis, a rule was considered: a peak ofattack was never used more than once to confirm a threshold.Another limitation in our prototype is that the values of delaysare invariable according to the adopted MA, thus adaptivedelays were not employed. Taking into account the adoptedMAs, the value of the delay could vary to produce a betterrelationship between thresholds versus peaks of attacks, and

9
could lead to a better result for the predictions.The influence of delay on the REF and RAEP indicators
can be shown by the comparative OPA graphs as depicted byFigure 7(b) (MA=5-8 hours; 2 hours delay versus no delay),Figure 7(c) (MA=8-13 hours; 3 hours delay versus no delay),and Figure 7(d) (MA=5-13 hours; 4 hours delay versus nodelay).
Comparing the RAEP indicator with and without delays,better results were achieved as delays were adopted (see Figure7(b), 7(c), and 7(d)). Analogously, the REF indicator had betterresults with the adoption of delays, as Figure 7(c) and 7(d)illustrate. However, the same results were achieved for the REFindicator considering the MA of 5-8 hours with and withoutdelay, as in Figure 7(b). The low value of delay could be onehypothesis for explaining the behavior of the REF indicator.The best results of the REF indicator are concentrated on theMA that has the higher delay (5-13 hours), and in other handthe worst results are concentrated on the MA that has the lowerdelay (5-8 hours). Table 4 summarizes the reached results byhours.
TABLE IV: Comparative table of results (D=delay / ND=nodelay)
Aver.% 1hour 2hours 3hours 4hoursD ND D ND D ND D ND
RAEP 50,9 27,6 52,1 31,7 57,0 33,9 59,1 34,7REF 24,3 15,4 25,1 14,9 20,7 13,00 21,1 12,3
-Aver.% 5hours 6hours Average
D ND D ND D NDRAEP 69,1 36,1 58,8 33,1 57,8 32,8REF 18,0 10,6 17,9 38,2 24,6 17,4
The major gap of the OPA analysis in the forecasts usingEWMA is the difficulty of determining the optimum valueof delay that enables more accurate results for the predictionanalysis. However, one advantage of the OPA analysis isthat it identifies in advance when new bursts of attacks willoccur since the OPA analysis was defined in this work as anaggregation technique. Regardless of the use of OPA analysis,it would be infeasible to identify in advance when new burstsof attack will occur. For that reason, the prediction results aremuch more accurate when the OPA technique is applied toindividual bursts.
In Table 4 the values of REF represent the performanceof the EWMA method for each period of time: an averageof 24.6% with delay and 17.4% without delay. RAEP valuesindicate the performance of the EWMA method in the of dataanalyzed: an average of 57.8% with delay and 32.8% withoutdelay.
Comparing our approach to other studies, it is importantto mention that (Haslum, Abraham, and Knapskog, 2008)have applied Fuzzy Logic and Hidden Markov Chains topredict cyber-attacks, however the burst attacks were notaddressed [21] . Nevertheless, for the sake of comparison,the work of (Haslum, Abraham, and Knapskog, 2008) theaverage risk percentage was around 41% while our approachcould have the effectiveness fully quantified for each one of
the adopted settings in the MA. (Ramasubramanian, Kannan,2004) modeled predict features by the use of quickpropagationneural networks, making it possible the predictions 255 stepsahead, however they did not approach burst attacks, or thetimeline of the predictions [34]. (Pontes et al 2011) havedeveloped diverse forecasting models, but have not approachedthe bust attacks either [14].
Even though positive results were achieved, two lines ofcriticism are:
• The way the delay is defined in the OPA analysis - thedelay was defined as half of the difference between themoving averages. This may cause distortions in the eval-uations, as the delay changes depending on the amplitudebetween the pair of the adopted moving averages. Infuture work, the delay value could be allowed to varyover time (i.e., adaptive delay).
• There is a need for further research focused on new fore-cast methods and in the analysis of time and frequencyvariations between burst attacks.
One of the possible areas of future research is the creation oflinear models in which the attacks are considered inputs (m)and the RAEP and REF indexes are considered as outputs (y).In future studies, the use of nonlinear models can be studied aswell. The goal would be to better interpret the changes usinglinear and stochastic models.
VII. CONCLUSION
This paper explores the use of the EWMA method topredict trends of cyber-attacks in computer systems. Theforecasting method has an advantage over other detectionmethods: it can anticipate countermeasures against intrusionattempts. However, some cyber-attacks have specific featuresthat require changes in forecast techniques. One of thoseattacks with specific features is the brute force attack, whichwas investigated in this paper, and which has the followingcharacteristics:
1) generally performed to gain unauthorized access to sys-tems through password guessing;
2) Performed through successive and repeated attempts(peaks of the waves in the graph), until the attacker suc-cessfully guesses a password or withdraws the attempt;
3) after many unsuccessful attempts, there are periods ofinactivity that give the EWMA graphs a serrated appear-ance.
This type of behavior is very difficult to predict with theEWMA approach. Although it is difficult to predict, it isrelatively simple to detect a brute force attack because of theincrease in network traffic from the same source. Nevertheless,knowing the exact moment when a burst will start makesit possible to apply countermeasures in a proactive mannerbefore the attacks succeed. By the use of PRBS it was possibleto determine the α value of the EWMA based prediction modelof our paper.
In this paper, two indicators were created to rate forecastresults from EWMA graphs: (1) REF: index related to the

10
effectiveness of the predictions generated by thresholds, indi-cating the rate of confirmed predictions; and (2) RAEP: indexrelated to the reversals of the attack behavior, which werecorrectly predicted by a previous threshold. In this paper, anew technique of aggregation is proposed as well, the OnePoint Analysis (OPA). The objective of OPA is to addressthe problem of forecasting the starting point of burst attacks.The OPA technique focuses on aggregate peaks of a burst ata unique point and applies an EWMA method for predictingthe starting point of each burst.
To evaluate the proposed techniques, a honey-net wasimplemented with an SSH service vulnerable to brute forceattacks. Two approaches were employed to analyze the resultsof REF and RAEP: (1) OPA; and (2) individual bursts (i.e.,the adoption of just one graph for each burst). It is importantto notice that the analysis of the individual bursts relies on thepeaks of the attacks in the time series.
Delays were not considered during the analysis of individualbursts. Results brought out large variations in the RAEP andREF indicators for each burst, according to the chosen MA.This behavior is due primarily to the constant reversals ofdirection of the peaks of attacks, as illustrated in the graphs.
However, as the OPA is a complementary technique to theindividual burst analysis, the OPA’s results cannot be compareddirectly with the individual bursts results. In OPA analysis,delays were supported and results of the RAEP and REFindicators achieved expressive values.
The contributions of this paper include: (1) forecastingof some types of cyber-attacks require different types ofanalysis and treatment due to their peculiarities (e.g., bruteforce attacks); (2) summarizing several peaks (attacks) in asingle point of analysis (OPA) is a novel way to study antime series. The main concern of OPA is allowing predictionsfor the starting point of following bursts. In a network withsensors and agents arranged in several layers (e.g., DistributedIntrusion Forecasting System Architecture), this approach maycontribute by making it possible to implement proactive coun-termeasures in case of prominent incidents caused by cyber-attacks; (3) The creation of two indicators for the forecastingby EWMA - the REF and RAEP - which allow comparisonsbetween different approaches to predictions.
REFERENCES
[1] N. Ye, Q. Chen, and C. M. Borror, “Ewma forecast of normal systemactivity for computer intrusion detection,” IEEE Transactions on Relia-bility, vol. 53, no. 4, pp. 557–566, 2004.
[2] B.-C. Cheng, G.-T. Liao, C.-C. Huang, and M.-T. Yu, “A novel prob-abilistic matching algorithm for multi-stage attack forecasts,” IEEEJournal on Sel. Areas in Comm, vol. 29, no. 7, pp. 1438–1448, 2011.
[3] Q. Yin, L. Shen, R. Zhang, and X. Li, “A new intrusion detection methodbased on behavioral model,” in WCICA. IEEE, 2004, pp. 4370–4374.
[4] J. S. Armstrong, Principles of forecasting: a handbook for researchersand practitioners. Springer, 2001, vol. 30.
[5] N. Ye, X. Li, Q. Chen, S. M. Emran, and M. Xu, “Probabilistictechniques for intrusion detection based on computer audit data,” IEEETrans on Sys, Man and Cybernetics, vol. 31, no. 4, pp. 266–274, 2001.
[6] E. Pontes, A. A. Silva, A. E. Guelfi, and S. T. Kofuji, “Security incloud manufacturing: Forecasting and multi-correlation techniques fordealing with cyber attacks,” Journal of Inf Sec Research, vol. 2, no. 3,pp. 266–274, 2011.
[7] W. Stallings, Cryptography and network security, principles and prac-tices. Practice Hall, 2005.
[8] J.-S. Cho, S.-S. Yeo, and S. K. Kim, “Securing against brute-force attack:A hash-based rfid mutual authentication protocol using a secret value,”Computer Communications, vol. 34, no. 3, pp. 391–397, 2011.
[9] K. Scarfone and P. Mell, “Guide to intrusion detection and preventionsystems (idps),” NIST special publication, vol. 800, no. 2007, p. 94,2007.
[10] IC3, “2013 internet crime report,” Internet Crime Complaint Center,Tech. Rep., 2014. [Online]. Available: http://www.ic3.gov/media/annualreport/2013_ic3report.pdf
[11] FEBRABAN, “Perdas com fraudes eletronicas no brasil aumentam36% no primeiro semestre de 2011,” FEBRABAN, Tech. Rep., 2011.[Online]. Available: http://www.febraban.org.br/Noticias1.asp?id_texto=1321
[12] D. Anstee, D. Bussiere, G. Sockrider, and C. Morales, “Worldwideinfrastructure security report,” Infrastructure Security Report, Tech.Rep., 2012. [Online]. Available: http://pages.arbornetworks.com/rs/arbor/images/WISR2014.pdf
[13] S.-h. Qing, J.-c. Jiang, H.-t. Ma, W.-p. Wen, and X.-f. Liu, “Researchon intrusion detection techniques: a survey,” JOURNAL-CHINA INSTI-TUTE OF COMMUNICATIONS, vol. 25, no. 7, pp. 19–29, 2004.
[14] E. Pontes, A. E. Guelfi, S. T. Kofuji, and A. A. Silva, “Applying multi-correlation for improving forecasting in cyber security,” in Proc ofICDIM. IEEE, 2011, pp. 179–186.
[15] C. Abad, J. Taylor, C. Sengul, W. Yurcik, Y. Zhou, and K. E. Rowe,“Log correlation for intrusion detection: A proof of concept.” in ACSAC,2003, pp. 255–264.
[16] E. Pontes and W. L. Zucchi, “Fibonacci sequence and ewma for intrusionforecasting system,” in Proc of ICDIM. IEEE, 2010, pp. 404–411.
[17] F. Autrel, “Using an intrusion detection alert similarity operator toaggregate and fuse alerts,” 2005.
[18] B. Morin and H. Debar, “Correlation of intrusion symptoms: Anapplication of chronicles.” in RAID, 2003, pp. 94–112.
[19] S. Axelsson, “Combining a bayesian classifier with visualisation: under-standing the ids.” in VizSEC, 2004, pp. 99–108.
[20] C. Manikopoulos and S. Papavassiliou, “Network intrusion and faultdetection: a statistical anomaly approach,” Communications Magazine,IEEE, vol. 40, no. 10, pp. 76–82, 2002.
[21] K. Haslum, A. Abraham, and S. Knapskog, “Fuzzy online risk assess-ment for distributed intrusion prediction and prevention systems,” inIEEE UKSIM. IEEE, 2008, pp. 216–223.
[22] D. S. Fava, S. R. Byers, and S. J. Yang, “Projecting cyberattacks throughvariable-length markov models.” 2008, pp. 359–369.
[23] P. Cisar and S. Maravic Cisar, “Ewma statistic in adaptive thresholdalgorithm,” in IEEE INES. IEEE, 2007, pp. 51–54.
[24] E. Pontes and A. E. Guelfi, “Ifs intrusion forecasting system based oncollaborative architecture,” in Proc of ICDIM. IEEE, 2009, pp. 1–6.
[25] N. Ye, S. Vilbert, and Q. Chen, “Computer intrusion detection throughewma for autocorrelated and uncorrelated data,” IEEE Trans on Relia-bility, vol. 52, no. 1, pp. 75–82, 2003.
[26] C. Croarkin and P. Tobias, “Nist/sematech e-handbook of statisticalmethods,” NIST/SEMATECH, July. Available online: http://www. itl. nist.gov/div898/handbook, 2006.
[27] S. Roberts, “Control chart tests based on geometric moving averages,”Technometrics, vol. 1, no. 3, pp. 239–250, 1959.
[28] J. Viinikka, H. Debar, L. Mé, and R. Séguier, “Time series modeling forids alert management,” in Proc of ACM ASIACCS, 2006, pp. 102–113.
[29] S. Axelsson, “Intrusion detection systems: A survey and taxonomy,”Chalmers Uni of Technology Goteborg, Sweden, Tech. Rep., 2000.
[30] R. Yamamoto, “Intraday technical analysis of individual stocks on thetokyo stock exchange,” Journal of Banking & Finance, vol. 36, no. 11,pp. 3033–3047, 2012.
[31] W. Brock, J. Lakonishok, and B. LeBaron, “Simple technical tradingrules and the stochastic properties of stock returns,” The Journal ofFinance, vol. 47, no. 5, pp. 1731–1764, 1992.
[32] P. L. Meyer, “Probabilidade: aplicações à estatística,” in Probabilidade:aplicações à estatística. Livro Técnico, 1970.
[33] D. He and H. Leung, “Network intrusion detection using cfar abrupt-change detectors,” IEEE Transactions on Instrumentation and Measure-ment, vol. 57, no. 3, pp. 490–497, 2008.
[34] P. Ramasubramanian and A. Kannan, “Quickprop neural network ensem-ble forecasting framework for a database intrusion prediction system,”Neural Inf Processing-Letters and Reviews, vol. 5, no. 1, pp. 9–18, 2004.
Copyright © 2022 FDOKUMEN