The cantharidin-induced oxidative burst in tobacco BY2 cell suspension cultures
10
Protoplasma (1998) 205: 83-92 PFIOTOPLASI~ Springer-Verlag 1998 Printed in Austria The cantharidin-induced oxidative burst in tobacco BY-2 cell suspension cultures P. Van Gestelen*, P. Ledeganck, I. Wynant, R. J. Caubergs, and H. Asard Department of Biology, University of Antwerp, Antwerp Received June 19, 1998 Accepted September 10, 1998 Summary. The in vivo induction of H202 production was tested on tobacco cell suspension cultures (Nicotiana tabacum cv. Bright Yel- low-2). The measurement of H202 was based on the oxidation of 3,5- dichloro-2-hydroxybenzensulfonic acid by endogenous peroxidases and spectrophotometric detection after reaction with 4-aminoanti- pyrine. The phosphatase inhibitor cantharidin induced a transient increase in H202 synthesis. The timing of the H202 production, the level of induction by cantharidin and the background H202 produc- tion were dependent on the tobacco cell concentration used. A con- centration curve of cantharidin revealed saturating kinetics for the H202 detection (Es0 = 46 to 70 gM, Emax= 101 to 128/,tmol/h - g fresh weight). An inhibitor study with the tobacco BY-2 cells showed high inhibitions of the H202 induction with the flavin ana- logues diphenylene iodonium (I50 = 1.26 gM) and acridine orange and with membrane-permeative thiol reagents (N-ethyl maleimide, N-pyrene maleimide, iodoacetate); whereas the nonpermeative thiol reagent p-chloromercuribenzoic acid was ineffective. Therefore, the induction of H202 production with phosphatase inhibitors (can- tharidin) showed comparable properties to the elicitor-induced oxidative-burst response in other plant cells. Keywords: Active-oxygen species; Tobacco Bright Yellow-2 cells; Defence; Nicotiana tabacum; Phosphatase; Protein phosphorylation. Abbreviations: AcOr acridine orange; AOS active-oxygen species; BY-2 Bright Yellow-2, pCMBS p-chloromercuribenzoic acid; DHBS 3,5-dichloro-2-hydroxybenzenesulfonic acid; DMSO di- methylsulfoxide; DPI dipbenylene iodonium; EtOH ethanol; H202 hydrogen peroxide; HRP horseradish peroxidase; MS Murashige and Skoog; NEM N-ethyl maleimide; NPM N-pyrene maleimide; 02- superoxide; SOD superoxide dismutase. Introduction Challenging of plants with pathogens may lead to the development of disease symptoms (compatible inter- *Correspondence and reprints: Department of Biology, University of Antwerp, Groenenborgerlaan 17l, B-2020 Antwerp, Belgium. action) or, alternatively, a resistance response may be induced (incompatible reaction). During the resis- tance response, a range of defence reactions is observed in the plant, eventually leading to the degra- dation of the invading pathogen (Dixon et al. 1994). The defence reaction is initiated after the recognition of the pathogen by the plant. While the pathogen invades the plant, elicitor molecules are produced, that may be derived from the plant cell wall or from the pathogen itself (Ebel and Cosio 1994). After bind- ing to specific receptors, some of which are known to be located at the plasma membrane, these elicitors initiate the plant defence response (Ntirnberger et al. 1994, Hahn 1996, Cervone et al. 1997). Addition of incompatible pathogens or elicitors has been demon- strated to rapidly induce the synthesis of active-oxy- gen species (AOS). These AOS apparently play a cen- tral and regulating role in the induction of certain plant resistance reactions (Sutherland 1991, Baker and Orlandi 1995, Hammond-Kosack and Jones 1996, Low and Merida 1996, Mehdy et al. 1996, Lamb and Dixon 1997, Wojtaszek 1997). The AOS produced during pathogen interaction include O2-, H202, and, possibly, other radicals derived from these (hydroxyl radical, peroxyl radicals). The enzymes responsible for the AOS production during plant-pathogen inter- actions are subject of intensive research and currently several hypotheses are formulated. Several lines of evidence indicate the possible presence of a plasma- membrane-localised NADPH oxidase, producing 02-, comparable to the animal neutrophil respiratory-burst oxidase (Low and Merida 1996, Mehdy et al. 1996, Lamb and Dixon 1997). Although, the evidences for
-
Upload
independent -
Category
Documents
-
view
5 -
download
0
Transcript of The cantharidin-induced oxidative burst in tobacco BY2 cell suspension cultures
Protoplasma (1998) 205: 83-92 PFIOTOPLASI~ �9 Springer-Verlag 1998 Printed in Austria
The cantharidin-induced oxidative burst in tobacco BY-2 cell suspension cultures
P. Van Gestelen*, P. Ledeganck, I. Wynant, R. J. Caubergs, and H. Asard
Department of Biology, University of Antwerp, Antwerp
Received June 19, 1998 Accepted September 10, 1998
Summary. The in vivo induction of H202 production was tested on tobacco cell suspension cultures (Nicotiana tabacum cv. Bright Yel- low-2). The measurement of H202 was based on the oxidation of 3,5- dichloro-2-hydroxybenzensulfonic acid by endogenous peroxidases and spectrophotometric detection after reaction with 4-aminoanti- pyrine. The phosphatase inhibitor cantharidin induced a transient increase in H202 synthesis. The timing of the H202 production, the level of induction by cantharidin and the background H202 produc- tion were dependent on the tobacco cell concentration used. A con- centration curve of cantharidin revealed saturating kinetics for the H202 detection (Es0 = 46 to 70 gM, Emax = 101 to 128/,tmol/h - g fresh weight). An inhibitor study with the tobacco BY-2 cells showed high inhibitions of the H202 induction with the flavin ana- logues diphenylene iodonium (I50 = 1.26 gM) and acridine orange and with membrane-permeative thiol reagents (N-ethyl maleimide, N-pyrene maleimide, iodoacetate); whereas the nonpermeative thiol reagent p-chloromercuribenzoic acid was ineffective. Therefore, the induction of H202 production with phosphatase inhibitors (can- tharidin) showed comparable properties to the elicitor-induced oxidative-burst response in other plant cells.
Keywords: Active-oxygen species; Tobacco Bright Yellow-2 cells; Defence; Nicotiana tabacum; Phosphatase; Protein phosphorylation.
Abbreviations: AcOr acridine orange; AOS active-oxygen species; BY-2 Bright Yellow-2, pCMBS p-chloromercuribenzoic acid; DHBS 3,5-dichloro-2-hydroxybenzenesulfonic acid; DMSO di- methylsulfoxide; DPI dipbenylene iodonium; EtOH ethanol; H202 hydrogen peroxide; HRP horseradish peroxidase; MS Murashige and Skoog; NEM N-ethyl maleimide; NPM N-pyrene maleimide; 02- superoxide; SOD superoxide dismutase.
Introduction
Challenging of plants with pathogens may lead to the development of disease symptoms (compatible inter-
*Correspondence and reprints: Department of Biology, University of Antwerp, Groenenborgerlaan 17l, B-2020 Antwerp, Belgium.
action) or, alternatively, a resistance response may be induced (incompatible reaction). During the resis- tance response, a range of defence reactions is observed in the plant, eventually leading to the degra- dation of the invading pathogen (Dixon et al. 1994). The defence reaction is initiated after the recognition of the pathogen by the plant. While the pathogen invades the plant, elicitor molecules are produced, that may be derived from the plant cell wall or from the pathogen itself (Ebel and Cosio 1994). After bind- ing to specific receptors, some of which are known to be located at the plasma membrane, these elicitors initiate the plant defence response (Ntirnberger et al. 1994, Hahn 1996, Cervone et al. 1997). Addition of incompatible pathogens or elicitors has been demon- strated to rapidly induce the synthesis of active-oxy- gen species (AOS). These AOS apparently play a cen- tral and regulating role in the induction of certain plant resistance reactions (Sutherland 1991, Baker and Orlandi 1995, Hammond-Kosack and Jones 1996, Low and Merida 1996, Mehdy et al. 1996, Lamb and Dixon 1997, Wojtaszek 1997). The AOS produced during pathogen interaction include O2-, H202, and, possibly, other radicals derived from these (hydroxyl radical, peroxyl radicals). The enzymes responsible for the AOS production during plant-pathogen inter- actions are subject of intensive research and currently several hypotheses are formulated. Several lines of evidence indicate the possible presence of a plasma- membrane-localised NADPH oxidase, producing 02-, comparable to the animal neutrophil respiratory-burst oxidase (Low and Merida 1996, Mehdy et al. 1996, Lamb and Dixon 1997). Although, the evidences for
84 P. Van Gestelen et al.: Oxidative burst in BY-2 cells
the existence of this neutrophil-like oxidase in plants
are still indirect. Recently some of these evidences, concerning the cross-reactivity towards antibodies
that recognise regulatory components of the animal oxidative burst, have been questioned (Tenhaken and
Riibet 1997). By screening an expression cDNA- library of soybean with the antibodies, these authors found that the recognised antigenic proteins in plants did have an enzymatic function that was totally differ-
ent from that of the antigenic proteins in neutrophils. However, evidence is accumulating suggesting that alternative AOS-producing enzymes may be also involved; such as apoplastic peroxidases (Bolwell et al. 1995). In addition, other reports indicate the existence of plasma membrane oxidases producing AOS. Their contribution to the pathogen-induced oxidative burst has still to be demonstrated (Pinton et al. 1994, Murphy and Auh 1996, Van Gestelen
e ta l . 1997, Xing e ta l . 1997). Apart f rom these enzymes, in plant cells, the involvement of other
types of oxidases that are capable of producing AOS, including xanthine oxidase, cytochrome P-450 reduc-
tase, amine oxidase, also needs to be considered as potential source for the AOS production (Alan and Fluhr 1997, Bolwell and Wojtaszek 1997, Murphy et al. 1998). The signal transduction cascade between the patho- gen recognition and the AOS production has been mainly studied on plant cell cultures and was recently reviewed (Low and Merida 1996, Mehdy et al. 1996, Hammond-Kosack and Jones 1996). Early changes in ion fluxes (Ca 2+ and H + influx, K + and CI- efflux),
changes in the activity of G-proteins and phospho- lipases, changes in the phosphorylat ion status of pro- teins, and the production of second messengers (DAG, IP3, Ca 2+) have all been reported to proceed and regulate the AOS production. The contribution of protein phosphorylation as an important regulatory step in the production of AOS is observed in different plant-el ici tor interactions (Felix et al. 1994, Chandra and Low 1995, Mathieu et al. 1996). After elicitor treatment several changes in protein phosphorylat ion have been shown. These induced changes were inhib- ited by protein kinase inhibitors, which were also effective inhibitors of the production of AOS by the same elicitors. Moreover, the inhibition of protein dephosphorylat ion with inhibitors of protein phos- phatases type 1 and 2A (okadaic acid, cantharidin, and calyculin A) resulted in a hyperactivation of pro- tein phosphorylation and AOS production in the pres- ence of elicitors (Felix et al. 1994). In the absence of
elicitors these phosphatase inhibitors induced a tran-
sient increase in AOS production (Chandra and Low 1995, Mathieu et al. 1996, Van Gestelen et al. 1998). From these studies it was clear that the AOS elicita- tion is mediated by kinase-dependent protein phos- phorytations and that the dephosphorylation events are contributing in the downregulation of the induced AOS-producing enzyme machinery.
In the current paper, the production of AOS in tobac- co Bright Yellow-2 (BY-2) cell suspension cultures
was detected after treatment with the phosphatase inhibitor cantharidin. Time dependencies, celt con- centration effects, cantharidin concentration depen- dency, and inhibitor effects were studied on this tobacco cell line. The properties of the phosphatase- inhibitor-induced AOS production in the tobacco cells were very similar to the elicitor-induced oxidative burst.
Materials and methods
Plant material
The tobacco (Nicotiana tabacum cv. Bright Yellow-2) cell suspen- sion culture described by Nagata et al. (1992) was used. The BY-2 cells were grown in full-strength MS medium (Murashige and Skoog 1962; MS macro- and microelements; Duchefa Biochemie BV, Haarlem, The Netherlands), supplemented with 0.2 g of KI-I2PO4 and 30 g of sucrose per liter, The growth medium was set at pH 5.8 and autoclaved for 20 rain. After cooling to room temperature it was sup- plemented with 0.2 mg of 2,4-dichlorophenoxyacetic acid (2,4-D) per liter as an auxin (stock 1000-fold in sterile 0.1 N KOH and filter sterilised) and 1 mg of thiamine-HC1 plus 100 mg myo-inositol (stock 500-fold in sterile MilliQ water and filter sterilised) per liter. The cell culture is transferred weekly by diluting 1.4 ml of the 7-day- old cells in the stationary-growth phase in 100 ml of fresh MS medi- um. The cells were grown in 500 mt Erlenmeyer flasks on a rotary shaker (Innova 4230; New Brunswick Scientific Co., Inc., Edison, N.J.) at 130 rpm in the dark and 27 ~ For the HzO2 measurements, 5- to 6-day-old celts after transfer were used. The cells were collect- ed by centrifugation at 3000 rpm (1500 g) for 30 s. The pellet of cells was washed once with fresh MS medium, repelleted by centrifuga- tion and diluted to a stock concentration of 0.25 to 0.5 g (fresh weight, FW) per ml of MS medium. The cells were counted in a cell- counting chamber by light microscopy, resulting in an amount of 8.2 _+ 0.5 • 10 ~ cell per gram (FW) (13 independent values of 4 replicate co,ms each).
Detection of H202
H202 production was measured as the peroxidase-dependent oxida- tion of 3,5-dichloro-2-hydroxybenzenesulfonic acid (DHBS) to its quinone form, which specifically reacts with 4-aminoantipyrine to generate a molecular complex absorbing at 510 nm. With the tobac- co cells the H2Oz production was measured by including 1 mM DHBS and 0.1 mM 4-aminoantipyrine in the MS growth medium. The cell concentration was varied between 0 and 0.05 g (FW) per ml of MS medium and other constituents were as indicated in the text. The test was done in a total volume of 3 mI (Figs. 1-3) in a plastic
P. Van Gestelen et al.: Oxidative burst in BY-2 cells 85
spectrophotometer cuvette with a total volume of 3.5 ml. For the inhibitor studies (Fig. 4 and Table 1) the concentrations of DHBS and 4-aminoantipyrine were 10-fold higher and the final incubation volume was 2 ml instead. This 10-fold higher concentration of the substrates did not elevate the H2Oz detection capacity' compared to the lower concentration. The higher substrate concentration was used to certainly saturate the detection of H20> The cuvettes were closed with Pmafilm foil and incubated by rotating head over tail at 60 rpm. At the time points indicated the cuvettes were briefly centrifuged at 3000 rpm (1500 g) for 30 s to pellet the cells and the absorbance at 510 nm was measured in the supernatant medium. The H202 concen- tration was estimated by a calibration curve of H202 (0 to 2.3 raM) and horseradish peroxidase (1 U/ml; EC 1.11.1.7; Serva, Heidelberg, Federal Republic of Germany) in MS medium. The absorbance of the calibration curve was measured 75 rain after the start of the reac- tion by HRP addition, when a stable coloration was achieved. The calculated calibration curve (second-order polynomial), obtained as an avelage of 4 independent curves, was: ODsm = [-0.0898 (raM H202) 2 + 0.9815 (mM H2Oz) + 0.0038], R z = 99.96%. This polyno- mial distribution gave a better curve fitting compared to a linear regression analysis. The curve was made for a H202 concentration range between 0.1 and 2.3 mM, corresponding to an absorbance val- ue between 0.1 and 1.80.D.
Results
Time course of the cantharidin-induced AOS production in tobacco BY-2 cells
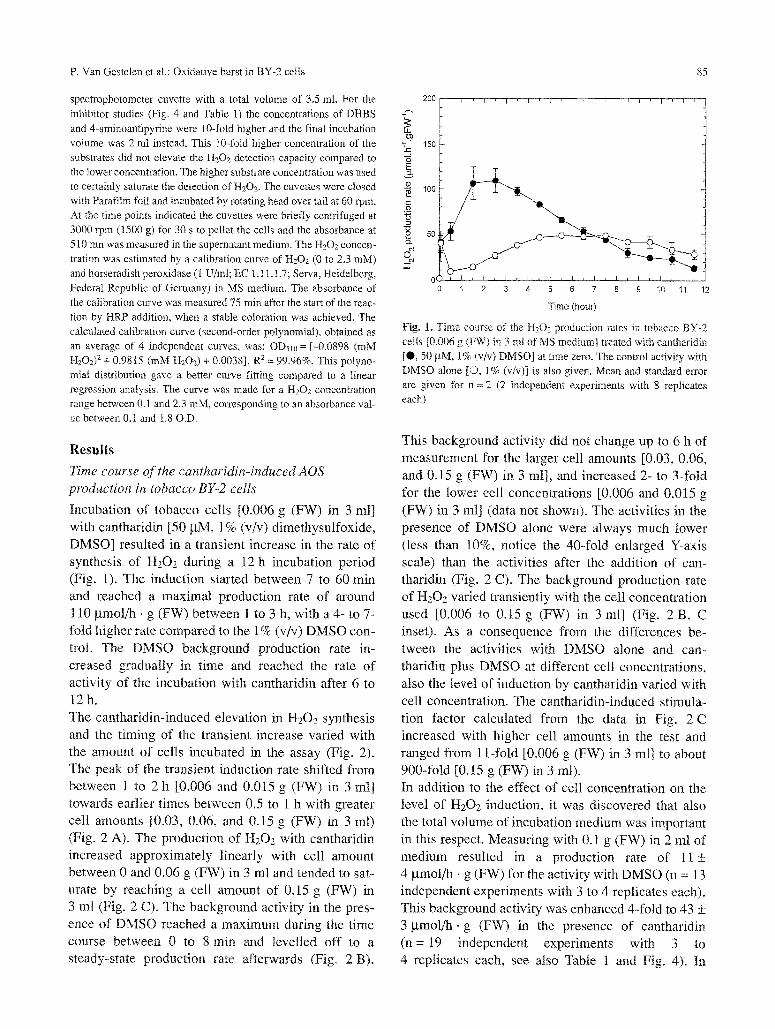
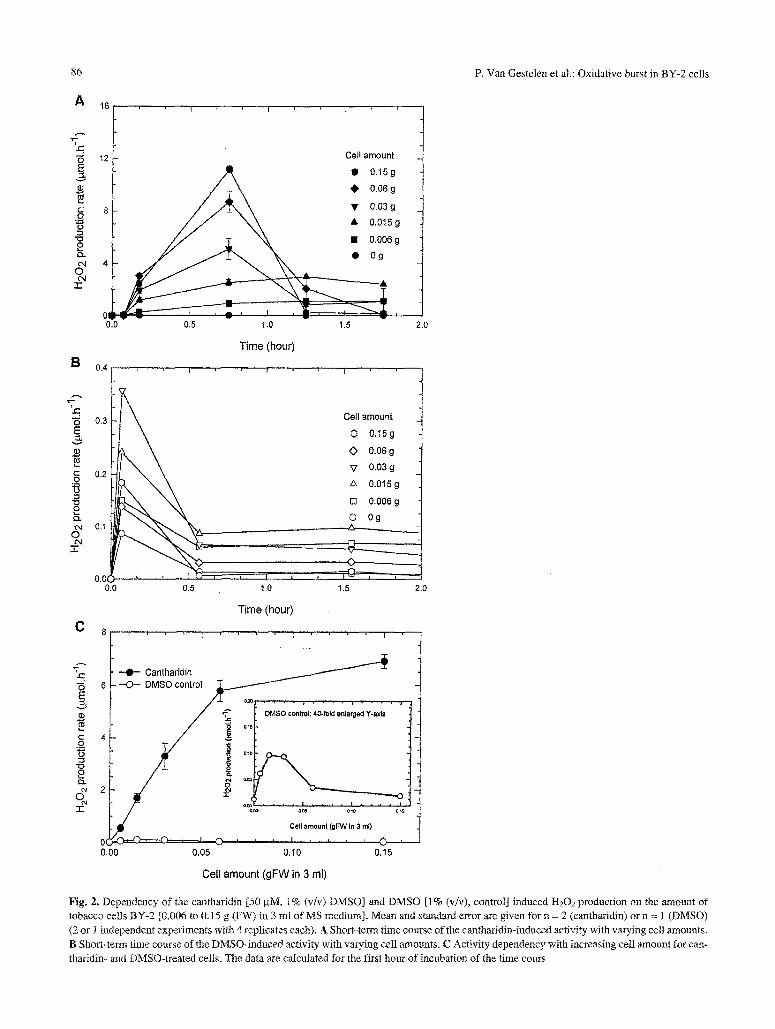
Incubation of tobacco cells [0.006 g (FW) in 3 ml] with cantharidin [50 btM, 1% (v/v) dimethysulfoxide, DMSO] resulted in a transient increase in the rate of synthesis of H202 during a 12 h incubation period (Fig. 1). The induction started between 7 to 60 rain and reached a maximal production rate of around 110 gmol/h, g (FW) between 1 to 3 h, with a 4- to 7- fold higher rate compared to the 1% (v/v) DMSO con- trol. The DMSO background production rate in- creased gradually in time and reached the rate of activity of the incubation with cantharidin after 6 to 12h. The cantharidin-induced elevation in H202 synthesis and the timing of the transient increase varied with the amount of cells incubated in the assay (Fig. 2). The peak of the transient induction rate shifted from betvveen 1 to 2 h [0.006 and 0.015 g (FW) in 3 mt] towards earlier times between 0,5 to 1 h with greater cell amounts [0.03, 0.06, and 0.15 g (FW) in 3 ml) (Fig. 2 A). The production of H 2 0 2 with cantharidin increased approximately linearly with cell amount between 0 and 0.06 g (FW) in 3 ml and tended to sat- urate by reaching a cell anaount of 0.15 g (FW) in 3 ml (Fig. 2 C). The background activity in the pres- ence of DMSO reached a maximum during the time course between 0 to 8 min and levelled off to a steady-state production rate afterwards (Fig. 2 By.
LI.
'7,
"6 E
o ~
200 , i , l , l " r ' 7 ~ l , l l l , l l l , l - - j l ' ~ .........
150
lOO
50!
i ~ . . . . . i i i i
1 2 3 4 5 6 7 8 9 10 11 12
Time (hour)
Fig. 1. Time comse of the H202 production rates in tobacco BY-2 cells [0.006 g (FW) in 3 ml of MS medium] treated with cantbaridin [0 , 50 ~tM, 1% (v/v) DMSO] at time zero. The control activity with DMSO alone [O, 1% (v/v)] is also given. Mean and standard error are given for n = 2 (2 independent experiments with 8 replicates each)
This background activity did not change up to 6 h of measurement for the larger cell amounts [0.03, 0.06, mad 0.15 g (FW) in 3 ml], and increased 2- to 3-fold for the lower cell concentrations [0.006 and 0.015 g (FW) in 3 ml] (data not shown). The activities in the presence of DMSO alone were always much lower (less than 10%, notice the 40-fold enlarged Y-axis scale) than the activities after the addition of can- tharidin (Fig. 2 C). The background production rate of H202 varied transiently with the cell concentration used [0.006 to 0.15 g (FW) in 3 ml] (Fig. 2 B, C inset). As a consequence from the differences be- tween the activities with DMSO alone and can- tharidin plus DMSO at different cell concentrations, also the level of induction by cantharidin varied with cell concentration. The cantharidin-induced stimula- tion factor calculated from the data in Fig.. 2 C increased with higher cell amounts in the test and ranged from 11-fold [0.006 g (FW) in 3 ml] to about 900-fold [0.15 g (FW) in 3 mI). In addition to the effect of cell concentration on the level of H202 induction, it was discovered that also the total volume of incubation medium was important in this respect. Measuring with 0.1 g (FW) in 2 ml of medium resulted in a production rate of 11 _+ 4 btmol/h �9 g (FW) for the activity with DMSO (n = 13 independent experiments with 3 to 4 replicates each). This background activity was enhanced 4-fold to 43 +_ 3 gmol /h .g (FW) in the presence of cantharidin (n= 19 independent experiments with 3 to 4 replicates each, see also Table 1 and Fig. 4). In
A
v
C: O
O
"El
r'.,,
O (',I
:E
B 0.4
E
C: O
"(3
e c',
O,l O C',I
"-r
C
16
0.3
12
8
4
0~,, 0.0
0.2
0.1
0.0{ 0.0 0.5 1.0
-q "6 6 E
e- 4 O ~J
er 2 o 32
i ..... I ' . . . . . . I
Cell amount
I ~ ~ 0.15 g
�9 0.06 g
Y O.03 g
A 0.015 g
�9 0,006 g
-, , =,t_ 0.5 1.0 1.5 2.0
Time (hour)
t I " ' ....... ~ . . . . . t
86 P, Van Gestelen et al.: Oxidative burst in BY-2 cells
Cell amount
O 0.15g
O o.o6 g
V 0.03 g
A 0.015 g
[] O.OO6 g
0 0 g , ,
1.5 2.0
Time (hour)
0 (
0.00
Cantharidin �9 -O- - DMSO control
~ -o, o
/ a~a
O
. / o o; , : . . . . o,,
0.05 0.10 0.15
Cell amount (gFW in 3 ml)
Fig. 2. Dependency of the cantharidin [50/aM, 1% (v/v) DMSO] and DMSO [1% (v/v), control] induced H202 production on the amount of tobacco cells BY-2 [0.006 to 0,15 g (FW) in 3 ml of MS medium]. Mean and standard error are given for n = 2 (cant_haridin) or n = 1 (DMSO) (2 or 1 independent experiments with 4 replicates each). A Short-term time course of tile cantharidin-induced activity with varying cell amounts.
B Short-term time course of the DMSO-induced activity with varying cell amounts. C Activity dependency with increasing celt amount for can- tharidin- and DMSO-treated cells. The data are caicutated for the first hour of incubation of the time cours
P. Van Gestelen et al.: Oxidative burst in BY-2 cells 87
contrast, a cell amount of 0.06 and 0.I5 g (FW) in a 3 ml volume revealed an induction factor of 260- and 900-fold (Fig. 2 C). Nevertheless, the absolute H202 synthesis rates in the presence of cantharidin were very comparable for these cell amounts being 96 gmol/h �9 g (FW) [0.06 g (FW) in 3 ml], 43 btmol/ h . g (FW) [0.1 g (FW) in 2 ml] and 45.9 gmot/h �9 g (FW) [0. t5g (FW) in 3ml] respectively. These results clearly indicated that also the total test volume in the cuvette (3.5 ml cuvette volume) is an important factor affecting this background activity. Lower incu- bation volumes tend to result in higher production rates of H20~ in the background activity in the test conditions used.
Dependency of the HzOz el• on the cantharidin concentration
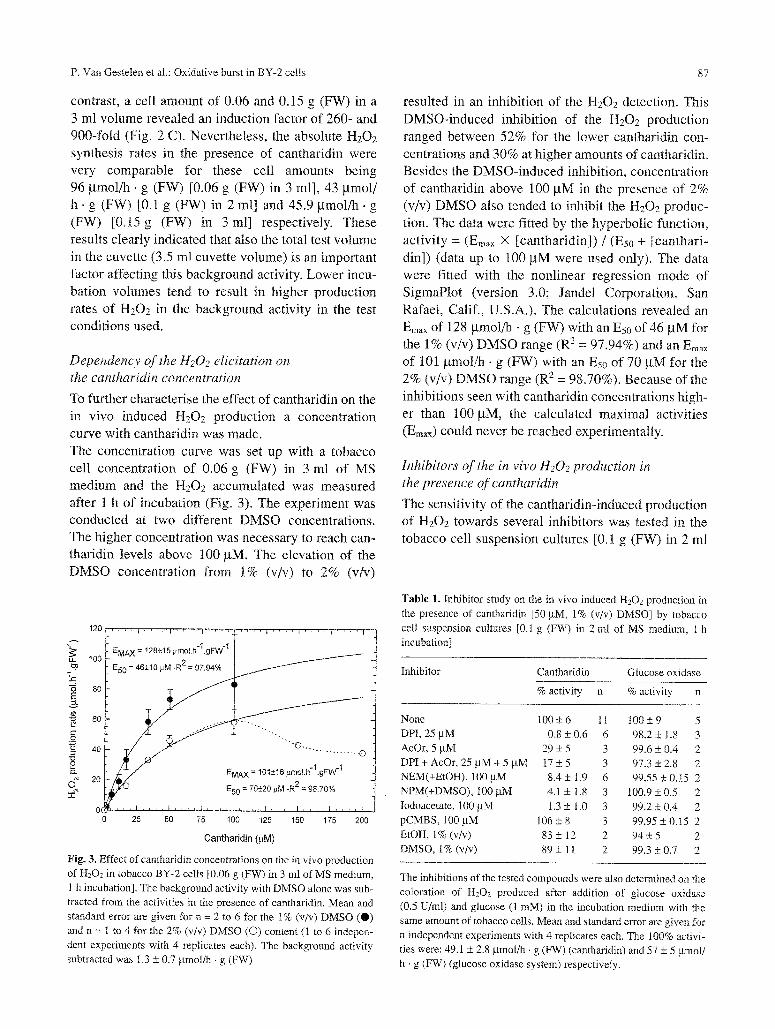
To further characterise the effect of cantharidin on the in vivo induced H202 production a concentration curve with cantharidin was made. The concentration curve was set up with a tobacco cell concentration of 0.06 g (FW) in 3 ml of MS medium and the H202 accumulated was measured after t h of incubation (Fig. 3). The experiment was conducted at two different DMSO concentrations. The higher concentration was necessary to reach can- tharidin levels above 100 gM, The elevation of the DMSO concentration from t% (v/v) to 2% (v/v)
resulted in an inhibition of the H202 detection. This DMSO-induced inhibition of the H202 production ranged between 52% for the lower cantharidin con- centrations and 30% at higher amounts of cantharidin. Besides the DMSO-induced inhibition, concentration of cantharidin above 100 gM in the presence of 2% (v/v) DMSO also tended to inhibit the H202 produc- tion. The data were fitted by the hyperbolic function, activity = (Emax X [cantharidin]) / (Es0 + [canthari- din]) (data up to 100 gM were used only). The data were fitted with the nonlinear regression mode of SigmaPlot (version 3.0; Jandel Corporation, San Rafael, Calif., U.S.A.). The calculations revealed an Emax of 128 gmol/h �9 g (FW) with an Es0 of 46 pM for the 1% (v/v) DMSO range (R 2 = 97.94%) and an Emax of 101 gmol/h �9 g (FW) with an Eso of 70 gM for the 2% (v/v) DMSO range (R 2 = 98.70%). Because of the inhibitions seen with cantharidin concentrations high- er than 100 pM, the calculated maximal activities (Em~• could never be reached experimentally.
Inhibitors of the in vivo tt202 production in the presence of cantharidin
The sensitivity of the cantharidin-induced production of H202 towards several inhibitors was tested in the tobacco cell suspension cultures [0.1 g (FW) in 2 ml
120 . . . . ~ . . . . . i , - . ~ , ,~ . . . . + . . . . t- . . . . ~ . . . . ~ . . . . j
E M A x = 1 2 8 • , u m o t . h ' 1 . g F W - I | t
,,~ I 0 0 . Eso = 46+_10 ~tM .R2 = 97.94 %
2::
_ _ v
'~ Y / ~ ""0 . . . . . . . . . . . . . . . . .
2o~~ ~ ....... 40 �9
E M A X = 1 0 1 _ + 1 6 , u m o l . h ' l . g F W "1
O~ E50 = 70• tam = 98 ,70% ~R 2
0Q~ , , , [ . . . . [ t t t t } ' , ~ t [ t I I . . , . I , , , i [ i i i t t i t , , }
0 25 50 75 100 125 150 175 200
Cantharidin (~,M) Fig..3. Effect ofcantharidin concentrations on the in vivo production of H202 in tobacco BY-2 cells [0.06 g (FW) in 3 ml of MS medium, 1 h incubation]. The background activity with DMSO alone was sub- tracted from the activities in the presence of cantharidin. Mean and standard error are given for n = 2 to 6 for the 1% (v/v) DMSO (0) and n = I to 4 for the 2% (v/v) DMSO (�9 content (1 to 6 indepen- dent experiments with 4 replicates each). The background activity subtracted was 1.3 _+ 0.7 gmol/h - g (FW)
Table 1. Inhibitor study on the in vivo induced H202 production in the presence of cantharidin [50 gM, 1% (v/v) DMSO] by tobacco cell suspension cultures [0.1 g (FW) in 2 ml of MS medium, 1 h incubation]
Inhibitor Cantharidin Glucose oxidase
% activity n % activity n
None 100+6 11 100+_9 5 DPI, 25 gM 0.8 + 0,6 6 98.2 _+ 1.8 3 AcOr, 5 gM 29 -+ 5 3 99.6 -+ 0.4 2 DPI + AcOr, 25 gM + 5 gM 17 -+ 5 3 97.3 + 2.8 2 NEM(+EtOH), 100pM 8.4_+ 1.9 6 99.55• 2 NPM(+DMSO), I00 gM 4.1 _+ 1.8 3 100.9 _+ 05 2 Iodoacetate, 100 gM 1.3 + 1.0 3 99.2 +_ 0.4 2 pCMBS, 100gM 106+8 3 99.95_+0.15 2 EtOH, 1% (v/v) 83 _+ 12 2 94 _+ 5 2 DMSO, 1% (v/v) 89 _+ 11 2 99.3 +_ 0.7 2
The inhibitions of the tested compounds were also determined on the coloration of H202 produced after addition of glucose oxidase (0.5 U/ml) and glucose (1 raM) in the incubation medium with the same amount of tobacco cells. Mean and standard error are given for n independent experiments with 4 replicates each. The 100% activi- ties were: 49.1 • 2.8 gmol/b �9 g (FW) (cantharidin) and 57 • 5 gmol/ h . g (FW) (glucose oxidase system) respectively.
88 P. Van Gestelen et al.: Oxidative burst in BY-2 cells
lOO~
80
60 ._> "5 <
40
20
. . . . I . . . . I . . . . I . . . . I . . . . I
e•'k, \ IMAX = 101.8+2,3 %
150 = 1.26+0.14 FM
�9 R 2 = 99.38 %
, ~ . . . . , . . . . i . . . .
5 10 15 20 25
DPI (#M)
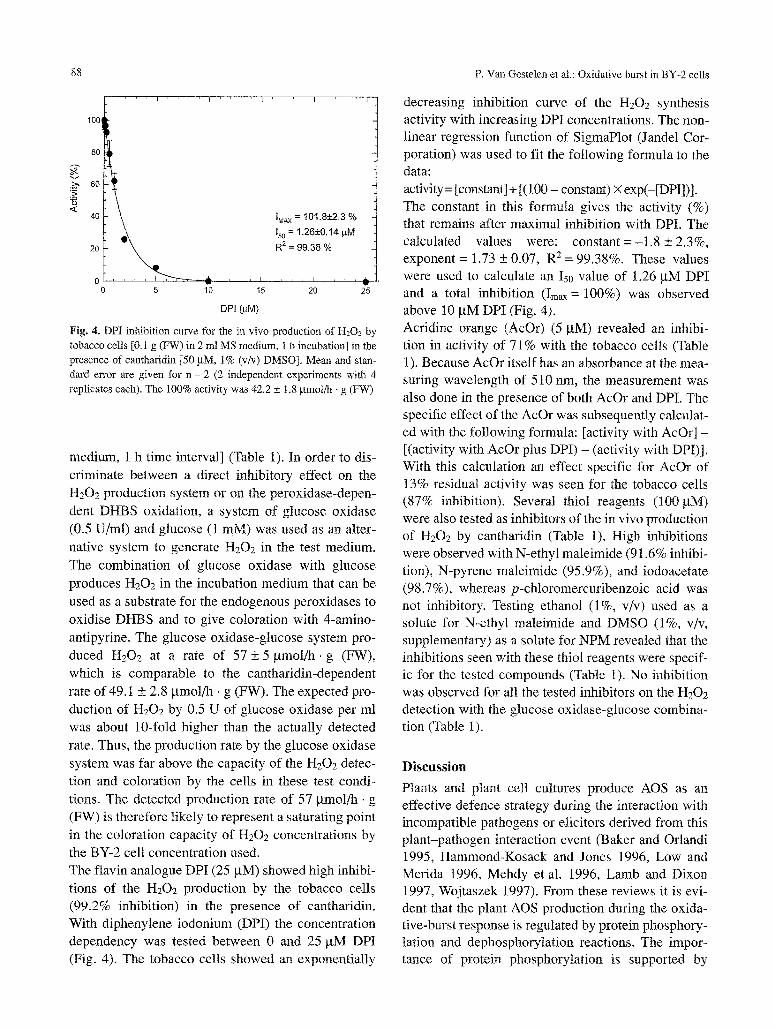
Fig. 4. DPI inhibition curve for the in vivo production of H202 by tobacco cells [0.t g (FW) in 2 ml MS medium, 1 b incubation] in the presence of cantharidin [50/aM, 1% (v/v) DMSO]. Mean and stan- dm-d error are given for n = 2 (2 independent experiments with 4 replicates each). The 100% activity was 42.2 + 1.8 gmol/h �9 g (FW)
medium, 1 h time interval] (Table 1). In order to dis- criminate between a direct inhibitory effect on the H202 production system or on the peroxidase-depen- dent DHBS oxidation, a system of glucose oxidase (0.5 U/ml) and glucose (1 mM) was used as an alter- native system to generate H202 in the test medium. The combination of glucose oxidase with glucose produces H202 in the incubation medium that can be used as a substrate for the endogenous peroxidases to oxidise DHBS and to give coloration with 4-amino- antipyrine. The glucose oxidase-glucose system pro- duced I-I202 at a rate of 57 + 5 gmol~- g (FW), which is comparable to the cantharidin-dependent rate of 49.1 _+ 2.8 gmol/h, g (FW). The expected pro- duction of H202 by 0.5 U of glucose oxidase per ml was about 10-fold higher than the actually detected rate. Thus, the production rate by the glucose oxidase system was far above the capacity of the H202 detec- tion and coloration by the cells in these test condi- tions. The detected production rate of 57 ~tmol/h �9 g (FW) is therefore likely to represent a saturating point in the coloration capacity of H202 concentrations by the BY-2 cell concentration used. The flavin analogue DPI (25 gM) showed high inhibi- tions of the H202 production by the tobacco cells (99.2% inhibition) in the presence of cantharidin. With diphenylene iodonium (DPI) the concentration dependency was tested between 0 and 25 gM DPI (Fig. 4). The tobacco cells showed an exponentially
decreasing inhibition curve of the [-{202 synthesis activity with increasing DPI concentrations. The non- linear regression function of SigmaPlot (Jandel Cor- poration) was used to fit the following formula to the data: activity = [constant] + [(100 - constant) X exp(-[DPI])]. The constant in this formula gives the activity (%) that remains after maximal inhibition with DPI. The calculated values were: constant =-1.8 _+ 2.3%, exponent = 1.73 + 0.07, R 2 = 99.38%. These values were used to calculate an Is0 value of 1.26 gM DPI and a total inhibition (Imax = 100%) was observed above 10 gM DPI (Fig. 4). Acridine orange (AcOr) (5 pM) revealed an inhibi- tion in activity of 71% with the tobacco cells (Table 1). Because AcOr itself has an absorbance at the mea- suring wavelength of 510 nm, the measurement was also done in the presence of both AcOr and DPI. The specific effect of the AcOr was subsequently calculat- ed with the following formula: [activity with AcOr] - [(activity with AcOr plus DPI) - (activity with DPI)]. With this calculation an effect specific for AcOr of 13% residual activity' was seen for the tobacco cells (87% inhibition). Several thiol reagents (100 gM) were also tested as inhibitors of the in vivo production of H202 by cantharidin (Table 1). High inhibitions were observed with N-ethyl maleimide (91.6% inhibi- tion), N-pyrene maleimide (95.9%), and iodoacetate (98.7%), whereas p-chloromercuribenzoic acid was not inhibitory. Testing ethanol (1%, v/v) used as a solute for N-ethyl maleimide and DMSO (1%, v/v, supplementary) as a solute for NPM revealed that the inhibitions seen with these thiol reagents were specif- ic for the tested compounds (Table 1). No inhibition was observed for all the tested inhibitors on the H202 detection with the glucose oxidase-glucose combina- tion (Table 1).
Discussion
Plants and plant cell cultures produce AOS as an effective defence strategy during the interaction with incompatible pathogens or elicitors derived from this plant-pathogen interaction event (Baker and Orlandi 1995, Hammond-Kosack and Jones 1996, Low and Merida 1996, Mehdy et al. 1996, Lamb and Dixon 1997, Wojtaszek 1997). From these reviews it is evi- dent that the plant AOS production during the oxida- tive-burst response is regulated by protein phosphory- tation and dephosphorytation reactions. The impor- tance of protein phosphorylation is supported by
P. Van Gestelen et al.: Oxidative burst in BY-2 cells 89
changes seen in phosphorylated proteins and on inhibitor studies with protein kinase and protein phos- phatase inhibitors. The use of the phosphatase inhibitor cantharidin in the current study also pointed to the contribution of protein phosphatase enzymes in the production of AOS in vivo. Treatment of tobacco BY-2 cell-suspen- sion cultures resulted in a transient elevation of the production of H~O2 compared to control levels (Fig. 1 and 2). The timing of the AOS production observed with cantharidin in this study was in the same time range as the elicitor-induced oxidative-burst respons- es seen with other plant cell cultures (Low and Meri- da 1996, Wojtaszek 1997) and they were faster than those observed with plant tissues and whole plants (Svalheim and Robertson 1993, Van Gestelen et al. 1998). However, it is probably too early to speculate whether similarities in time kinetics also indicate the same molecular origin of the AOS production. In order to draw any conclusion at this level it is neces- sary to know the timing that is needed to reach the site of action of the inducing compounds that are intro- duced after the addition of the pathogen, elicitors, or phosphatase inhibitors. The hyperactivation of the AOS production with phosphatase inhibitors has also been reported on oth- er cell cultures (Felix et al. 1994, Chandra and Low 1995, Mathieu et al. 1996) and also on whole plants (Van Gestelen et al. 1998). The effects with the phos- phatase inhibitors were interpreted as indications for a role of phosphatases (type 1 or type 2A) in the downregulation of the induced AOS production seen after interaction with pathogen or elicitor. The alter- native explanation in which elicitors may act by directly inhibiting phosphatase enzymes was weak- ened by the observations of AOS induction with pro- tein kinase activators and by inhibitions seen with kinase inhibitors during the elicitor-induced AOS elicitation (Chandra and Low 1995, Mathieu et at. 1996). Some of the protein kinase experiments may point to the contribution of kinase activation, rather than to a phosphatase inhibition, during the patho- gen(elicitor)-induced phosphorylations and activation of the AOS burst. The induction with cantharidin on the tobacco cell suspension cultures was highly dependent on the amount of cells used in the test. The differences in the level of induction by cantharidin were due to the large variation in the background activity with DMSO alone (Fig. 2). The background activity without can- tharidin was also dependent on the cell concentration
used and tended to be higher with smaller cell amounts (Fig. 2). This background activity was also higher when the cells were incubated in a total vol- ume of 2 ml, compared to 3 ml, in a 3.5 ml cuvette. With the smaller volume (2 ml) the cells are more tur- bidly mixed, possibly resulting in a higher mechani- cal stress. The production of H202 by induction of mechanical stress (e.g., by dilution and physical pres- sure) has been observed in other plant celt cultures as well (Yahraus et al. 1995). The total activity in the presence of cantharidin increased linearly with increasing cell amounts between 0.006 and 0.06 g (FW) of cells (Fig. 2). With larger cell amounts of up to 0.15 g (FW) of cells there was a decrease in activi- ty on a per gram (FW) basis. This inhibition could be due to a limiting cantharidin concentration of 50 ~tM, because this cantharidin concentration was found to be not yet saturating with a cell amount of 0.06 g (FW) (Fig. 3). Alternatively, a limitation of the poten- tial of coloration by the endogenous peroxidases is also a possible explanation. This can be concluded from the experiments using an excess of the H20~- producing glucose oxidase-glucose system, which reached only a slightly higher detection of H202 com- pared to the cantharidin-induced activity (Table 1). Testing an external AOS-generating system, such as glucose oxidase and glucose, in the incubation medi- um with cells is very useful to check the maximal capacity of the endogenous peroxidase-dependent coloration capacity. The maximal measured produc- tion rate of H202 in the presence of cantharidin by the tobacco BY-2 cells calculated per cell amount was around 110 ~tmol/h �9 g (FW), which corresponded to 13,4 pmol/cell �9 h or 22 • 10 -14 mol/cell �9 min. This cantharidin-induced production rate of H202 is in the same order of magnitude as the elicitor-induced H202 synthesis seen in soybean cell cuttures with oli- gogalacturonide elicitor, reported as 3 • t0 -14 mol/ cell �9 min (Legendre et ai. 1993). A concentration curve of cantharidin showed satura- tion kinetics for the tobacco cell cultures, with a cal- culated Es0 value of 46 to 70 gM dependent on the DMSO solute concentration used. No real saturation could be measured experimentally-, because can- tharidin concentrations above 100 gM became inhibitory for a cell concentration of 0.06 g (FW) in 3 mt of MS medium. This inhibitory effect could at the moment not be explained, but may be related to the disturbance of the cell metabolism by the inhibi- tion of phosphatases by cantharidin. Nevertheless, by inhibiting plant phosphatases with cantharidin the

90 P. Van Gestelen et al.: Oxidative burst in BY-2 cells
AOS production tended to saturate. This saturation is also observed with elicitor-induced oxidative burst in other plant cell cultures (Legendre et al. 1993, Auh and Murphy 1995). The cantharidin-dependent AOS production by BY-2 cells was tested for inhibitions with different com- pounds. The flavin analogue DPI was a very potent inhibitor of the H202 synthesis, showing a full inhibi- tion above 10 ~tM with an I50 value of 1.26 gM (Fig. 4). The sensitivity towards concentrations of DPI in the gM range has also been reported in elicitor- induced AOS production in several plants (Levine et al. 1994, Auh and Murphy 1995). A sensitivity for DPI in the gM range points to the contribution of a flavin-containing oxidase to the AOS production, rather than a peroxidase-dependent production (Bol- well and Wojtaszek 1997). Nevertheless, it is by no means a proof for the existence of a particular type of flavoprotein. The inhibitor DPI is not selective towards certain flavoproteins and has been shown to inhibit flavin-containing oxidases as different as xan- thin oxidase, the animal neutrophil respiratory-burst oxidase, cytochrome P-450 reductase, and nitric oxide synthase (Doussiere and Vignais 1992, O'Don- nell etal. 1994, Bolwell and Wojtaszek 1997). Although DPI is a very powerful inhibitor in certain elicitor- and cantharidin-induced AOS productions, other plant-elicitor combinations have been shown to be insensitive or less sensitive to DPI (Allan and Fluhr 1997, Bolwell et al. 1998). These differences in DPI sensitivity point to the existence of different ori- gins in the plant AOS burst seen with plant-pathogen (elicitor) combinations (Allan and Fluhr 1997, Bol- well and Wojtaszek 1997, Bolwell et al. 1998, Mur- phy et al. 1998). Besides DPI, another flavin structure analogue, acridine orange, also showed high inhibi- tions (87% inhibition at 5 gM) on the cantharidin- induced H202 production. Also the membrane-perme- ative thiol reagents N-ethyl maleimide, N-pyrene maleimide, and iodoacetate were highly inhibitory (90-99% inhibition) on the AOS production. Because the nonpermeative thiol modificator pCMBS was not inhibitory at all, it is concluded that the contribution of intracellular thiol groups is essential for the pro- duction of the AOS after elicitation with cantharidin. The several inhibitors tested did not show any inhibi- tion with the H202-generating system of glucose oxi- dase and glucose added to the BY-2 cells. This lack of inhibition proves that the inhibitors used are effective on the H202-producing enzyme or its activation path- way during the cantharidin incubations and that they
do not inhibit the peroxidase-dependent coloration reaction. This glucose oxidase-glucose system is very useful to test the specificity of inhibitors and activa- tors of the plant AOS burst, to study the saturation of the coloring capacity of the endogenous peroxidases, and to induce an artificial oxidative stress in plants or plant cell cultures. Although the sensitivity towards the inhibitor DPI in this study was largely comparable with other systems reported in literature, this comparison of inhibitor sensitivities should be interpreted with care. Other parameters besides the activity of the inhibited oxi- dase may affect these values greatly. Factors that could change the apparent I50 values include (i) differ- ences in diffusion rates of inhibitors, H202, and probes (such as DHBS and 4-aminoantipyrine, and others) used for the AOS induction and detection reaction in different cell types, (ii) differences in the c010r yield due to differences in peroxidase concen- trations or types of the endogenous peroxidases, and (iii) different molar amounts of the contributing enzymes (phosphatases, AOS-producing oxidases, and endogenous peroxidases) that are involved in the AOS induction and coloration reactions. For similar reasons the measured H2Oz synthesis values are only estimates for the real in vivo AOS production rates. Therefore, for a final and convincing comparison of the similarities of the elicitor- and phosphatase- inhibitor-induced oxidative-burst responses in plants or plant cell cultures, these distinct induction com- pounds should be tested with the same experimental setup. The AOS detection with DHBS and 4-aminoan- tipyrine is a very convenient and sensitive system for testing the production of AOS in both whole plants and cell cultures (this work, Van Gestelen et al. 1998). The detection can be calibrated to the same order of magnitude by varying the amount of cells or plants and by changing the concentration of the AOS-induc- ing compound (e.g., cantharidin or elicitors). The qualitative effect of different compounds could then be easily compared in these two in vivo test systems. This procedure should therefore be particularly inter- esting to compare the regulatory mechanisms known from plant cell culture studies on the more physiolog- ically relevant situation of whole plants or intact tis- sues. From this study on tobacco BY-2 cells it is obvious that the phosphatase-inhibitor-induced oxidative burst in plants is comparable to the elicitor-induced AOS production in certain plant-pathogen (elicitor) inter-
P. Van Gestelen et al.: Oxidative burst in BY-2 cells 91
actions. This similarity is based on the common prop- erties of the elicitor-induced and the cantharidin- dependent reaction, e.g., in similar saturation kinet- ics, in the timing of the induced H202 synthesis, in the AOS production rates, and in the sensitivity towards inhibitors like DPI. These common properties point indirectly to the existence of a plant oxidase that is activated by elicitors, acting to the contribution of protein kinases, and downregulated by protein phos- phatases. The detection of H202 in the BY-2 cells is the first report on the elicitation of AOS in this partic- ular tobacco cultivar. This observation is very inter- esting and useful, because this tobacco BY-2 cell line has been used to study the regulation of cell cycle by changes in the cell oxidative status. Moreover, this cultivar was also recently studied for the induction of genes implicated in the defence of plant cells against oxidative-stress and biotic- and abiotic-stress condi- tions (Chammongpol etal. 1998, Willekens etal. 1997).
Acknowledgements The authors thank the Flemish Fund for Scientific Research (FWO) in Belgium for financial support. H. A. is a research associate at the FWO.
R e f e r e n c e s
Alan AC, Fluhr R (1997) Two distinct sources of elicited reactive oxygen species in tobacco epidermal ceils. Plant Cell 9: 1559-1572
Auh C-K, Murphy TM (1995) Plasma membrane redox enzyme is involved in the synthesis of 02- and H202 by Phytophthora elic- itor-stimulated rose cells. Plant PhysioI 107:1241-t247
Baker CJ, Orlandi EW (1995) Active oxygen in plant pathogenesis. Annu Rev Phytopathol 33:299-321
BoIwell GP, Wojtaszek P (1997) Mechanisms for the generation of reactive oxygen species in plant defence: a broad perspective. Physiol Mol Plant Pathol 51:347--366
- Butt VS, Davies DR, Zimmerlin A (1995) The origin of the oxidative burst in plants. Free Radic Res Commun 23:517-532
- Davies DR, Gerrish C, Auh C-K, Murphy TM (1998) Compara- five biochemistry of the oxidative burst produced by rose and French bean cells reveals two distinct mechanisms. Plant Physi- ol 116:1379-1385
Cervone F, Castoria R, Leckie F, De Lorenze G (1997) Perception of fungal elicitors and signal transduction. In: Aducci P (ed) Signal transduction in plants. Birkh~iuser, Basel, pp 153-177
Chamnongpol S, Willekens H, Moeder W, Langebartels C, Sander- mann H, Van Montagu M, Inz6 D, Van Camp W (1998) Defense activation and enhanced pathogen tolerance induced by H202 in transgenic tobacco. Proc Nati Acad Sci USA 95:5818-5823
Chandra S, Low PS (1995) Role of phosphorylation in elicitation of the oxidative burst in cultured soybeml cells. Proc Natl Acad Sci USA 92:41204123
Dixon RA, Harlison M J, Lamb CJ (1994) Early events in the activa-
tion of plant defense responses. Annu Rev Phytopathol 32: 479-501
Doussiere J, Vignais PV (1992) Diphenylene iodonium as an inhibitor of the NADPH oxidase complex of bovine neutmphits: factors controlling the inhibitory potency of diphenylene iodo- nium in a cell-free system of oxidase activation. Eur J Biochem 208:6t -71
Ebel J, Cosio EG (1994) Elicitors of plant defense responses. Int Rev Cytol 148:1-36
Felix G, Regenass M, Spanu P, Boller T (1994) The protein phos- phatase inhibitor calyculin A mimics elicitor action in plant cells and induces rapid hyperphosphorylation of specific proteins as revealed by pulse labelling with [32p] phosphate. Proc Natl Acad Sci USA 91:952-956
Hahn MG (1996) Microbial elicitors and their receptors in plants. Annu Rev Phytopathol 34:387-412
Hammond-Kosack KE, Jones JDG (1996) Resistance gene depen- dent plant defense responses. Plant Cell 8: 1773-179I
Lamb C, Dixon RA (1997) The oxidative burst in plant disease resis- tance. Annu Rev Plant Physiol Plant Mol Bio148:251-275
Legendre L, Rueter S, Heinstein PF, Low PS (1993) Characterization of the oligogalacturonide-induced oxidative burst in cultured soybean (Glycine max) cells. Plant Physiol 102:233-240
Levine A, Tenhaken R, Dixon R, Lamb C (1994) H202 from the oxidative burst orchestrates the plant hypersensitive disease resistance response. Cell 79:583-593
Low PS, Merida JR (1996) The oxidative burst in plant defense: function and signal transduction. Physiol Plant 96:533-542
Mathieu Y, Sanchez FJ, Droitlard MJ, Lapous D, Laurri~re C, Guem J (1996) Involvement of protein phosphorylation in the early steps of transduction of the oligogalacturonide signal in tobacco cells. Plant Physiol Biochem 34:399-408
Mehdy MC, Sharma YK, Sathasivan K, Bays NW (1996) The role of activated oxygen species in plant disease resistance. Physiot Plant 98:365-374
Murashige T, Skoog F (1962) A revised medium for rapid growth and bioassays with tobacco tissue cultures. Physiol Plant I5: 473-497
Murphy TM, Auh C-K (1996) The superoxide synthases of plasma membrane preparations from cultured rose cells. Plant Physiol 110:621-629
- Asard H, Cross AR (t998) Possible sources of reactive oxygen during the oxidative burst in plants. In: Asard H, B6rczi A, Caubergs R (eds) Plasma membrane redox systems and their role in biological stress and disease. Kluwer, Dordrecht (in press)
Nagata T, Nemoto Y, Hasezawa S (1992) Tobacco BY-2 cell line as the "HeLa" cell in the cell biology of higher plants. Int Rev CytoI 132:1-30
Niirnberger T, Nermstiel D, Jabs T, Sacks WR, Hahlbrock K, Scheel D (t994) High affinity binding of a fungal oligopeptide elicitor to parsley plasma membranes trigger multiple defense respons- es. Cell 7 8 : 4 4 9 4 6 0
O'Donnell VB, Smith GC,/ones OT (t994) Involvement of phenyl radicals in iodonium inhibition of flavoenzymes. Mol Pharmacol 46:778-785
Pinton R, Cakmak I, Marschner H (1994) Zinc deficiency enhanced NAD(P)H-dependent supea'oxide radical production in plasma membrane vesicles isolated fiom roots of bean plants. J Exp Bot 45:45-50
Sutherland MW (199 t) The generation of oxygen radicals during the
92 P. Van Gestelen et al.: Oxidative burst in BY-2 cells
plant responses to infection. Physiol Mol Plant Pathol 39:79 ..... 83
Svalheim O, Robertson B (1993) Elicitation of H202 production in cucumber hypocotyl segments by oligo-t,4-c~-D-galacturonides and oligo-13-glucan preparations from cell walls of Phytophthora megasperma f. sp. gIycinea. PhysioI Plant 88:675-681
Tenhaken R, Rt|bet C (1997) Cloning of soybean NADPH-oxidase subunits by expression screening. In: Abstract book of the Inter- national Conference on Plasma Membrane Redox Systems, Antwerp, April 1998, p 57
Van Gestelen P, Asard H, Caubergs RJ (1997) Solubilization and separation of a plant plasma membrane NADPH-O2 synthase from other NAD(P)H oxidoreductases. Plant Physiol 115: 543-550
- - Horemans N, Caubergs RJ (1998) Superoxide producing
NAD(P)H-oxidases in plasma membrane vesicles from elicitor responsive bean plants. Physiol Plant (in press)
Willekens H, Chamnongpol S, Davey M, Schraudner M, Langebar- tels C, Van Montagu M, Inz6 D, Van Camp W (1997) Catalase is a sink for ti202 and is indispensable for stress defense in C3 plants. EMBO J 16:4806-4816
Wojtaszek P (1997) Oxidative burst: an early plant response to pathogen infection. Biochem J 322:681-692
Xing T, Higgins VJ, Blumwald E (1997) Race-specific elicitors of Cladosporiumfulvum promote translocation of cytosolic compo- nents of NADPH oxidase to the plasma membrane of tomato cells. Plant Cell 9:249-259
Yahraus T, Chandra S, Legendre L, Low PS (1995) Evidence for a mechanically induced oxidative burst. Plant Physiol 109: 1259-1266