Evolutionary dynamics of two related malignant plasma cell lines
6
Cell Cycle 9:18, 3792-3797; September 15, 2010; © 2010 Landes Bioscience REPORT 3792 Cell Cycle Volume 9 Issue 18 *Correspondence to: David Dingli; Email: [email protected] Submitted: 06/10/10; Accepted: 07/15/10 Previously published online: www.landesbioscience.com/journals/cc/article/13047 DOI: 10.4161/cc.9.18.13047 Introduction Evolution is the natural outcome whenever reproduction, muta- tion and selection interact. 1 Without reproduction, no popula- tion can grow and mutation is a consequence of: (1) the imperfect DNA replication machinery 2 and (2) the interaction of genomes with genotoxic agents present in the environment. 3,4 A mutation can alter the relative reproductive capacity of cells, a concept known as ‘fitness’ and, depending on the particular environment, mutations may be advantageous, neutral or disadvantageous. Neutral mutations are perhaps the most common 5 and do not alter the reproductive capacity of cells and are often considered ‘passenger mutations’. Deleterious mutations are normally elimi- nated since such a population would be out-competed by clones with a higher reproductive fitness. Other mutations may result in a reproductive advantage (higher fitness) to a clone (“driver mutations”), enabling that population to out-compete other cell clones that are sharing the same environment. Reproductive fit- ness can only be defined in the context of an environment that selects for or against a specific mutation. 6,7 Tumor formation is believed to result from the serial accu- mulation of mutations that collectively lead to loss of normal regulatory controls and ultimately, the invasion of tissues/ organs by abnormal cells. 8,9 The tumor cell population is con- tinuously acquiring mutations that enable it to explore phe- notypic space with selection for or against novel mutations by Cancer is the consequence of sequential acquisition of mutations within somatic cells. Mutations alter the relative reproductive fitness of cells, enabling the population to evolve in time as a consequence of selection. Cancer therapy itself can select for or against specific subclones. Given the large population of tumor cells, subclones inevitably emerge and their fate will depend on the evolutionary dynamics that define the interactions between such clones. Using a combination of in vitro studies and mathematical modeling, we describe the dynamic behavior of two cell lines isolated from the same patient at different time points of disease progression and show how the two clones relate to one another. We provide evidence that the two clones coexisted at the time of initial presentation. The dominant clone presented with biopsy-proven cardiac AL amyloidosis. Initial therapy selected for the second clone that expanded leading to a change in the diagnosis to multiple myeloma. The evolutionary dynamics relating the two cell lines are discussed and a hypothesis is generated in regard to the mechanism of one of the phenotypic characteristics that is shared by these two cell lines. Evolutionary dynamics of two related malignant plasma cell lines David Dingli, 1,2, * Bonnie K. Arendt, 3 Željko Bajzer 4 and Diane F. Jelinek 3 1 Division of Hematology; Department of Internal Medicine; 2 Department of Molecular Medicine; 3 Department of Immunology; 4 Department of Biochemistry and Molecular Biology; Mayo Clinic; Rochester, MN USA Key words: multiple myeloma, amyloidosis, chemotherapy, clonal evolution, selection the environment. Thus, tumor development should be viewed as an evolutionary process within the host, 10 and out of neces- sity takes a long time, usually many years. 11,12 The presence of genomic instability 13 can accelerate the dynamics due to the more frequent generation of mutations, allowing the clone to explore different genotypes in the context of its environment (phenotype). However, genomic instability per se is not essen- tial for the development of cancer. 6,7 It is well known that sev- eral classes of chemotherapeutics including alkylating agents, anthracyclines and epipodophyllotoxins are mutagenic and patients treated with these agents are at risk of second malig- nancies, especially myelodysplastic syndromes. However, clonal evolution can occur in the absence of a mutagen or any cancer therapy, 14,15 and such mutations can alter the natural history of disease in patients. Recently, we described two malignant plasma cell lines (ALMC-1 and ALMC-2) that were isolated from the same patient at different time points. 16 The two lines are clon- ally related since they have identical immunoglobulin heavy and light chain variable region sequences. In this study, we analyze the evolutionary dynamics of these cell lines and: (1) provide evidence that therapy of the patient selected for one clone by favoring its expansion in vivo thereby leading to an alteration of the life history of the patient—indeed a change in diagnosis with prognostic implications and (2) show how mathematical modeling of in vitro cell behavior provides a dynamic under- standing of the in vivo relationship between the two clones and
-
Upload
independent -
Category
Documents
-
view
4 -
download
0
Transcript of Evolutionary dynamics of two related malignant plasma cell lines

Cell Cycle 9:18, 3792-3797; September 15, 2010; © 2010 Landes Bioscience
REPORT
3792 Cell Cycle Volume 9 Issue 18
*Correspondence to: David Dingli; Email: [email protected]: 06/10/10; Accepted: 07/15/10Previously published online: www.landesbioscience.com/journals/cc/article/13047DOI: 10.4161/cc.9.18.13047
Introduction
Evolution is the natural outcome whenever reproduction, muta-tion and selection interact.1 Without reproduction, no popula-tion can grow and mutation is a consequence of: (1) the imperfect DNA replication machinery2 and (2) the interaction of genomes with genotoxic agents present in the environment.3,4 A mutation can alter the relative reproductive capacity of cells, a concept known as ‘fitness’ and, depending on the particular environment, mutations may be advantageous, neutral or disadvantageous. Neutral mutations are perhaps the most common5 and do not alter the reproductive capacity of cells and are often considered ‘passenger mutations’. Deleterious mutations are normally elimi-nated since such a population would be out-competed by clones with a higher reproductive fitness. Other mutations may result in a reproductive advantage (higher fitness) to a clone (“driver mutations”), enabling that population to out-compete other cell clones that are sharing the same environment. Reproductive fit-ness can only be defined in the context of an environment that selects for or against a specific mutation.6,7
Tumor formation is believed to result from the serial accu-mulation of mutations that collectively lead to loss of normal regulatory controls and ultimately, the invasion of tissues/organs by abnormal cells.8,9 The tumor cell population is con-tinuously acquiring mutations that enable it to explore phe-notypic space with selection for or against novel mutations by
Cancer is the consequence of sequential acquisition of mutations within somatic cells. Mutations alter the relative reproductive fitness of cells, enabling the population to evolve in time as a consequence of selection. Cancer therapy itself can select for or against specific subclones. Given the large population of tumor cells, subclones inevitably emerge and their fate will depend on the evolutionary dynamics that define the interactions between such clones. Using a combination of in vitro studies and mathematical modeling, we describe the dynamic behavior of two cell lines isolated from the same patient at different time points of disease progression and show how the two clones relate to one another. We provide evidence that the two clones coexisted at the time of initial presentation. The dominant clone presented with biopsy-proven cardiac AL amyloidosis. Initial therapy selected for the second clone that expanded leading to a change in the diagnosis to multiple myeloma. The evolutionary dynamics relating the two cell lines are discussed and a hypothesis is generated in regard to the mechanism of one of the phenotypic characteristics that is shared by these two cell lines.
Evolutionary dynamics of two related malignant plasma cell lines
David Dingli,1,2,* Bonnie K. Arendt,3 Željko Bajzer4 and Diane F. Jelinek3
1Division of Hematology; Department of Internal Medicine; 2Department of Molecular Medicine; 3Department of Immunology; 4Department of Biochemistry and Molecular Biology; Mayo Clinic; Rochester, MN USA
Key words: multiple myeloma, amyloidosis, chemotherapy, clonal evolution, selection
the environment. Thus, tumor development should be viewed as an evolutionary process within the host,10 and out of neces-sity takes a long time, usually many years.11,12 The presence of genomic instability13 can accelerate the dynamics due to the more frequent generation of mutations, allowing the clone to explore different genotypes in the context of its environment (phenotype). However, genomic instability per se is not essen-tial for the development of cancer.6,7 It is well known that sev-eral classes of chemotherapeutics including alkylating agents, anthracyclines and epipodophyllotoxins are mutagenic and patients treated with these agents are at risk of second malig-nancies, especially myelodysplastic syndromes. However, clonal evolution can occur in the absence of a mutagen or any cancer therapy,14,15 and such mutations can alter the natural history of disease in patients. Recently, we described two malignant plasma cell lines (ALMC-1 and ALMC-2) that were isolated from the same patient at different time points.16 The two lines are clon-ally related since they have identical immunoglobulin heavy and light chain variable region sequences. In this study, we analyze the evolutionary dynamics of these cell lines and: (1) provide evidence that therapy of the patient selected for one clone by favoring its expansion in vivo thereby leading to an alteration of the life history of the patient—indeed a change in diagnosis with prognostic implications and (2) show how mathematical modeling of in vitro cell behavior provides a dynamic under-standing of the in vivo relationship between the two clones and

www.landesbioscience.com Cell Cycle 3793
REPORT REPORT
erratic, prohibiting an estimate of the population doubling time (DT), it is clear that the growth rate of ALMC-1 under the same conditions is faster (fig. 2a). The addition of IL-6 and IGF-1 to the growth media slows down growth of ALMC-1 (DT: 1.8 days → 2.3 days) but accelerates the growth of ALMC-2 (DT: 1.6 days). As shown in figure 2b, ALMC-1 cells cultured without cytokines in FCS supplemented media reproduce at a somewhat faster rate compared to ALMC-2 cells under similar conditions (DT of 2.5 days vs. 2.7 days, respectively). However, addition of IL-6 and IGF-1 again accelerates the growth of ALMC-2 relative to ALMC-1 (DT of 1.7 versus 2.3 days respectively, fig. 2b). Therefore, the two lines respond in opposite ways to these growth factors.
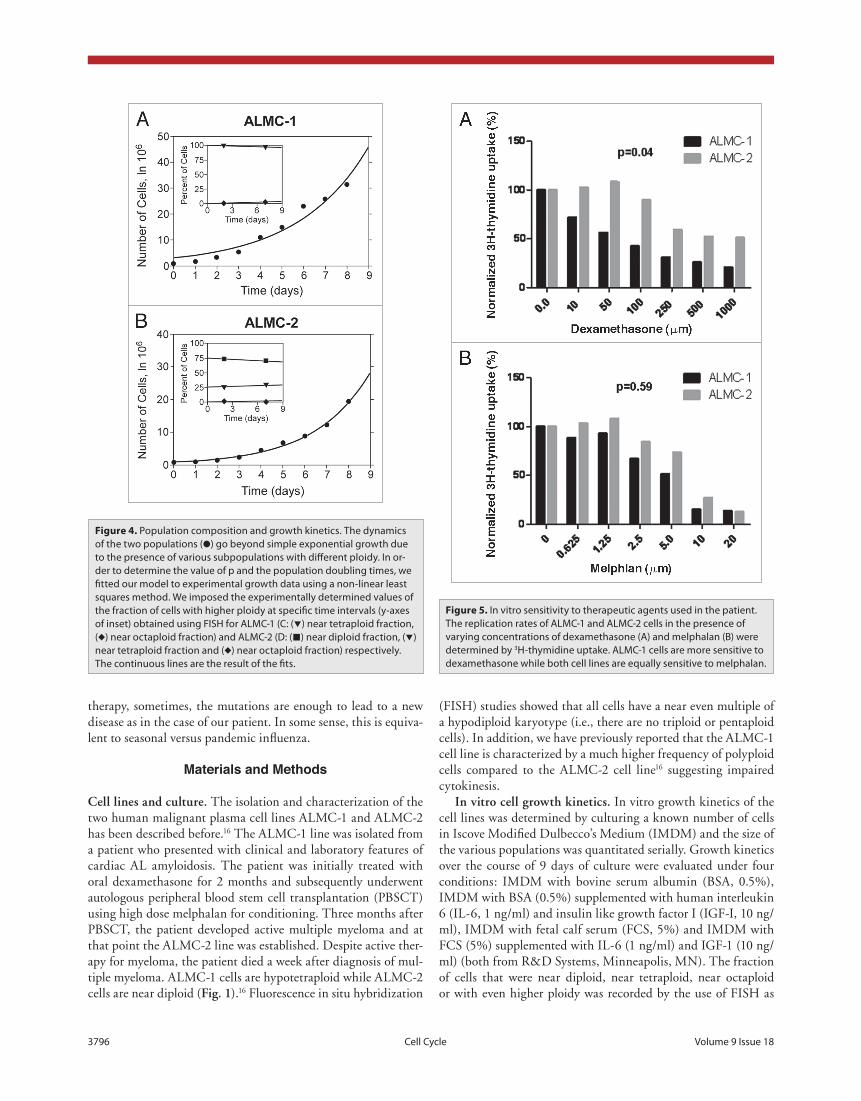
The karyotype in any given cell isolated from either cell line is either near diploid (ALMC-2) or near-tetraploid (ALMC-1) or with a higher ploidy (e.g., near octaploid). We did not observe any cell with a triploid or pentaploid karyotype. In order to explain this observation, we postulated that the two cell lines must have a defect that leads to loss of synchronization between chromosome duplication and nuclear/cytoplasmic division (fig. 3) where chromosome duplication occurs but this may or may not be followed by proper cell division. This suggests that with each replication there is a probability that cytokinesis fails giving rise to a cell with doubling of its ploidy. We determined this probability for both cell lines by simultaneously fitting our mathematical model to in vitro growth data for both cell lines and imposing the known fraction of cells that have a specific ploidy under the same growth conditions in at least 2 times points as determined by FISH (inset) (see Materials and Methods). As seen from figure 4, the proposed model fits well the experimental
their phenotypic features. Lastly, we test the predictions of the model with relevant in vitro experiments.
Results
The time frame for the isolation of the two cell lines is presented in figure 1. Cytogenetic studies of the two cell lines show several interesting features. While ALMC-1 cells are in general hypotet-raploid, ALMC-2 cells are hypodiploid and similar to the cytoge-netic results obtained from the patient’s bone marrow at the time of diagnosis of multiple myeloma (fig. 1, middle column). The two cell lines share several cytogenetic abnormalities including der(2)t(1;2)(p13;q33) and deletion of both copies of chromo-some 14. However, the two cell lines also have unique cytoge-netic abnormalities such as der(3)t(1;3)(q21;q27) in ALMC-1 and add(3)(q27) in ALMC-2. These abnormalities suggest that both cell lines arose from a common progenitor cell and then continued to acquire additional, independent cytogenetic abnor-malities. Interestingly, some of the defects shared by the two cell lines are duplicated in ALMC-1 (add(10)(p13) x 2 and add(11)(q21) x 2) due to the near tetraploid character of the cells. In addition, ALMC-2 cells also exhibit unique chromosomal abnor-malities similar to the bone marrow karyotype performed on day 100 after the stem cell transplant that lead to the diagnosis of multiple myeloma [e.g., add(3)(q27) (fig. 1)].
in vitro population dynamics under different conditions. In order to understand the evolutionary relationships between the two cell lines, we determined the growth characteristics of both lines under a number of conditions (see Materials and Methods). Although in the absence of FCS, the growth of ALMC-2 is
Figure 1. Schematic representation of the isolation and genetic characteristics of two plasma cell lines isolated from the same patient. The ALMC-1 cell line was established at the time of initial presentation with cardiac AL amyloidosis. After two months of therapy with dexamethasone, the patient underwent peripheral blood stem cell transplantation (PBSCT) with melphalan conditioning. Three months later, the patient was diagnosed with mul-tiple myeloma and the ALMC-2 cell line established. Characteristic cytogenetic abnormalities of both cell lines are represented including shared and unique cytogenetic abnormalities. The karyotype obtained from the bone marrow biopsy three months after the stem cell transplant is also included (middle part). The primary MM cells at this time point were near diploid.

3794 Cell Cycle Volume 9 Issue 18
supplementary growth factors, and perhaps more in keeping with their natural environment in vivo, ALMC-1 cells grow faster than ALMC-2. Therefore, ALMC-1 was the dominant clone at the time when the patient presented with AL amyloidosis, pro-viding an explanation why ALMC-1 cells were isolated initially
data. If we denote the respective parameters by subscript 1 and 2 for ALMC-1 and ALMC-2 respectively, data fitting suggests that, in the presence of IL-6 and IGF-1, p
1 = 0.986 with r
1
= 0.308 while p2 = 0.976 and r
2 = 0.404. The
population doubling times under the same con-ditions are 2.28 and 1.75 days for ALMC-1 and ALMC-2 respectively. Interestingly, although the total cell population for each line increases almost exponentially during the experiment, the fractional composition with respect to ploidy does not change significantly. Extended simu-lations show that in the case of ALMC-2, the population will never have more than 40% of the cells that are near tetraploid or with higher ploidy (compatible with what we observed).
sensitivity to chemotherapeutic agents. We hypothesized that the two cell lines will have dif-ferent sensitivities to pharmacologic agents used to treat the patient and perhaps that ALMC-1 would be more sensitive to the dexamethasone, enabling the expansion of the ALMC-2 line. To test this hypothesis, we determined the sensitiv-ity of both cell lines to dexamethasone (which was used initially to treat the patient) and mel-phalan used as conditioning for PBSCT. As can be seen from figure 5, ALMC-1 cells are sig-nificantly more sensitive to dexamethasone (p = 0.041) compared to ALMC-2 while the two cell lines do not differ in their sensitivity to melpha-lan (p = 0.59).
Discussion
The emergence of malignant clones resistant to therapy is common in cancer and a leading cause of therapeutic failure. If the population of cancer cells is large enough, cells that are resis-tant to specific agents exist even before exposure to the drug, as the recent studies with imatinib in chronic myeloid leukemia illustrate.14,15,17,18 Therapy simply selects for the resistant cells that expand due to their relative fitness advantage in the presence of the drug. Genomic instabil-ity of tumor cells13 together with the mutagenic tendency of many chemotherapeutic agents may further increase the risk that a resistant clone emerges. However, the risk of clonal expansion is probably reduced if patients are treated with a combination of non-cross-resistant agents.
Here, we illustrate the evolutionary relation-ships of two cell lines isolated from the same patient in an interval of 5 months.16 The two cell lines have a common origin and share several cytogenetic abnormalities. However, there are also dis-tinct cytogenetic differences between the two lines, showing that both diverged from a common ancestor (fig. 1). In the absence of
Figure 2. Population kinetics under cytokine stimulation. The population size of both ALMC-1 (top part) and ALMC-2 cells (bottom part) growing in the presence or absence of growth factor stimulation were determined daily. In (A) we compare growth of the two populations in the presence of bovine serum albumin (BSA) or BSA supplemented with IL-6 and IGF-1 (denoted by ++). In (B) we compare population growth in the presence of fetal calf serum (FCS) with or without IL-6 and IGF-1 (denoted by ++). Addition of both cytokines enhanced growth of ALMC-2 while slowing growth of ALMC-1.

www.landesbioscience.com Cell Cycle 3795
from the patient. However ALMC-1 cells are more sensitive to dexamethasone, and therefore the initial therapy selected against this clone, and in favor of ALMC-2 which is intrinsically more resistant to the drug. The reader may wonder whether a two-fold relative difference in dexamethasone sensitivity is enough to explain selection against the ALMC-1 clone in the presence of therapy. This is indeed quite possible since a strong reproductive or selective advantage (or disadvantage) is not required for clonal dominance to emerge.1,7 Our results suggest that the PBSCT did not select for either clone since the two lines do not differ in their sensitivity to melphalan which was used for conditioning prior to the transplant. We propose that the dexamethasone therapy used initially, selected for the ALMC-2 clone that expanded to become the dominant population, enabling it to recover faster after PBSCT and lead to the diagnosis of multiple myeloma.
Another interesting feature of these two related cell lines is their propensity to give rise to progeny cells with a higher ploidy. In fact, both cell lines exist as mixed populations with near dip-loid cells and other cells with higher ploidy. This suggests an acquired mutation leading to an error after chromosome replica-tion, resulting either in non-dysjunction or failure of cytokinesis. Our estimate for the probability that such an error during cyto-kinesis does not occur is essentially identical for the two cell lines (p
1 = 0.986 and p
2 = 0.976). Perhaps this result is unexpected
given the larger fraction of cells with higher ploidy in ALMC-1 compared to ALMC-2. However, this result can be explained from probabilistic and evolutionary principles. It is likely that the mutation leading to this mitotic error occurred in a founder cell and was inherited by all its progeny cells. The probability that
Figure 3. Mathematical model of cell dynamics for both cell lines. Whenever a cell divides, with probability p, chromosome segregation and cytokinesis occur normally, while with probability 1 - p, chromosome duplication is not followed by cytoplasmic division giving rise to a cell with doubling of ploidy.
a second mutation could either repair this defect or compensate for it or make it even more severe is remote,19 hence the probability of non-dysjunction or failure of cytokinesis is similar in both cell lines and supports the common origin of both clones in this patient.
The two lines also respond differently to cyto-kine stimulation: the replication rate of ALMC-2 increases in response to IL-6 and IGF-1, while ALMC-1 cells replicate at a slower rate in the pres-ence of these cytokines. The biological basis of such a differential response to these two important myeloma cell growth and survival factors20-22 is at present unclear. It is known that myeloma cells can produce IL-6 in an autocrine fashion23 and it is likely that as the IL-6 production increased, this further enhanced the proliferative advantage of ALMC-2 cells over ALMC-1. It is also relevant to point out that when the patient was diagnosed with multiple myeloma, the serum calcium was highly elevated and strongly suggests osteoclast activation and bone destruction. Myeloma cells activate osteoclasts to resorb bone but the latter cells can produce signifi-cant amounts of both IL-6 and IGF-1 that could enhance growth of the ALMC-2 cells compared to ALMC-1 (fig. 2).24 One can consider the interac-tions between such populations as an evolutionary
game, with IL-6 and IGF-1 enhancing the fitness of one clone compared to the other due to the increasing production of these cytokines by the bone marrow microenvironment that favors one clone versus the other.25-27 It is highly likely that the two cell lines co-existed at the time of initial diagnosis, as overlapping popula-tions11 since they share common cytogenetic abnormalities but ALMC-1 cells has lost chromosomal material (-21) that is still present in the ALMC-2 line. In the absence of cell-cell fusion, there is no mechanism to explain how material lost in ALMC-1 could be regained by ALMC-2. Therefore, the most likely sce-nario is that both cell lines coexisted at the time of the initial diagnosis and share a common progenitor. Given the higher pro-liferative rate of ALMC-1 under low IL-6 and IGF-1 levels, the clone had a fitness advantage and initially dominated the tumor population and led to the diagnosis of AL amyloidosis. As the tumor populations increased, IL-6 or IGF-1 production would enhance the fitness of ALMC-2 compared to ALMC-1. Therapy with dexamethasone further selected against the ALMC-1 cells, enabling ALMC-2 to expand and lead to multiple myeloma. It is also possible that additional mutations enabled the expansion of the ALMC-2 subclone and/or resulted in biological changes that now caused symptomatic multiple myeloma.
It is likely that similar inter-clone dynamics occur quite com-monly in cancer. The evolutionary dynamics that lead to the appearance of the tumor clone also enable it to respond to our therapeutic interventions. Similar to viruses, tumor cells exist as a quasispecies and evolve both randomly and as a consequence of therapy. Although most of the time tumor cells undergo gradual mutations leading to relapse of the disease that is resistant to
3796 Cell Cycle Volume 9 Issue 18
(FISH) studies showed that all cells have a near even multiple of a hypodiploid karyotype (i.e., there are no triploid or pentaploid cells). In addition, we have previously reported that the ALMC-1 cell line is characterized by a much higher frequency of polyploid cells compared to the ALMC-2 cell line16 suggesting impaired cytokinesis.
in vitro cell growth kinetics. In vitro growth kinetics of the cell lines was determined by culturing a known number of cells in Iscove Modified Dulbecco’s Medium (IMDM) and the size of the various populations was quantitated serially. Growth kinetics over the course of 9 days of culture were evaluated under four conditions: IMDM with bovine serum albumin (BSA, 0.5%), IMDM with BSA (0.5%) supplemented with human interleukin 6 (IL-6, 1 ng/ml) and insulin like growth factor I (IGF-I, 10 ng/ml), IMDM with fetal calf serum (FCS, 5%) and IMDM with FCS (5%) supplemented with IL-6 (1 ng/ml) and IGF-1 (10 ng/ml) (both from R&D Systems, Minneapolis, MN). The fraction of cells that were near diploid, near tetraploid, near octaploid or with even higher ploidy was recorded by the use of FISH as
therapy, sometimes, the mutations are enough to lead to a new disease as in the case of our patient. In some sense, this is equiva-lent to seasonal versus pandemic influenza.
Materials and Methods
cell lines and culture. The isolation and characterization of the two human malignant plasma cell lines ALMC-1 and ALMC-2 has been described before.16 The ALMC-1 line was isolated from a patient who presented with clinical and laboratory features of cardiac AL amyloidosis. The patient was initially treated with oral dexamethasone for 2 months and subsequently underwent autologous peripheral blood stem cell transplantation (PBSCT) using high dose melphalan for conditioning. Three months after PBSCT, the patient developed active multiple myeloma and at that point the ALMC-2 line was established. Despite active ther-apy for myeloma, the patient died a week after diagnosis of mul-tiple myeloma. ALMC-1 cells are hypotetraploid while ALMC-2 cells are near diploid (fig. 1).16 Fluorescence in situ hybridization
Figure 5. In vitro sensitivity to therapeutic agents used in the patient. The replication rates of ALMC-1 and ALMC-2 cells in the presence of varying concentrations of dexamethasone (A) and melphalan (B) were determined by 3H-thymidine uptake. ALMC-1 cells are more sensitive to dexamethasone while both cell lines are equally sensitive to melphalan.
Figure 4. Population composition and growth kinetics. The dynamics of the two populations (●) go beyond simple exponential growth due to the presence of various subpopulations with different ploidy. In or-der to determine the value of p and the population doubling times, we fitted our model to experimental growth data using a non-linear least squares method. We imposed the experimentally determined values of the fraction of cells with higher ploidy at specific time intervals (y-axes of inset) obtained using FISH for ALMC-1 (C: (▼) near tetraploid fraction, (◆) near octaploid fraction) and ALMC-2 (D: (■) near diploid fraction, (▼) near tetraploid fraction and (◆) near octaploid fraction) respectively. The continuous lines are the result of the fits.

www.landesbioscience.com Cell Cycle 3797
b = r(1 - p) and can be solved analytically (e.g., by the Laplace transform method) to yield the following solutions: u(t) = u
0eat,
x(t) = (x0 + u
0bt)eat and y(t) = (y
0 + x
0bt + u
0b2t2/2)eat. Parameters
r, p and the initial conditions were determined by globally fitting the above model to serial experimental data for the total popula-tion and for the various fractions when known using a non-lin-ear least squares method with a custom built simplex induction hybrid minimizer.28 The total population doubling time (DT) under various growth conditions was estimated numeri-cally by the following procedure: three subsequent doubling times T
1, T
2 and T
3 were determined by solving three nonlinear
equations:
2(u0 + x
0 + y
0) = u(T
1) + x(T
1) + y(T
1);
2[u(Ti) + x(T
i) + y(T
i)] = u(T
i + 1) + x(T
i + 1) + y(T
i + 1), i = 1, 2.
They yielded nearly equal values (up to three significant digits), which implies that the total population grows nearly exponentially.
statistics. All comparisons between groups were performed with the non-parametric Mann Whitney test using GraphPad Prism 5. A p < 0.05 was required for meaningful statistical differ-ences between groups.
financial support
Mayo Clinic (D.D.), Minnesota Partnership for Biotechnology and Medical Genomics (D.D. and Z.B.) and NIH grant CA062242 (D.F.J.).
described previously.16 Cell viability was determined by trypan blue exclusion.
drug sensitivity assays. In vitro sensitivity to dexamethasone and melphalan was performed using 3H-thymidine incorporation as described previously.23
modeling population dynamics. We developed a math-ematical model to understand the dynamics of these two cell lines. Based on experimental evidence (see above), we consider that whenever a polyploid cell divides, it cannot give rise to two near diploid cells while a near diploid cell can give rise to two cells of the same ploidy with probability p or one cell with the next higher ploidy with probability 1 - p during each repli-cation. Thus, we assume that hyperdiploidy is due to an error after DNA replication where either chromosome separation or cytokinesis do not occur properly (fig. 3). The near diploid cells are designated u(t), near tetraploid cells represented by x(t) and cells with higher ploidy by y(t). We consider that for each line, the net replication rate of the cells is constant, r. The dynam-ics can be represented by the following set of linear differential equations.
du/dt = rpu - r(1 - p)u
dx/dt = r (1 - p)u + rpx - r(1 - p)x
dy/dt = r (1 - p)x + rpy - r(1 - p)y
Initial conditions are given by u(0) = u0, x(0) = x
0, y(0) = y
0
The equations can be simplified if we define a = 2rp - r and
references1. Nowak MA. Evolutionary dynamics. Cambridge:
Belknap/Harvard 2006.2. Kunkel TA, Bebenek K. DNA replication fidelity. Ann
Rev Biochem 2000; 69:497-529.3. Ramel C. Pollution, carcinogenesis and cancer preven-
tion. Acta Oncol 1991; 30:27-33.4. Hennings H, Glick AB, Greenhalgh DA, Morgan DL,
Strickland JE, Tennenbaum T, et al. Critical aspects of initiation, promotion and progression in multistage epidermal carcinogenesis. Proc Soc Exp Biol Med 1993; 202:1-8.
5. Kimura M. Preponderance of synonymous changes as evidence for the neutral theory of molecular evolution. Nature 1977; 267:275-6.
6. Bodmer W, Bielas JH, Beckman RA. Genetic instability is not a requirement for tumor development. Cancer Res 2008; 68:3558-60.
7. Tomlinson I, Bodmer W. Selection, the mutation rate and cancer: ensuring that the tail does not wag the dog. Nat Med 1999; 5:11-2.
8. Hanahan D, Weinberg RA. The hallmarks of cancer. Cell 2000; 100:57-70.
9. Vogelstein B, Kinzler KW. Cancer genes and the path-ways they control. Nat Med 2004; 10:789-99.
10. Cairns J. Mutation selection and the natural history of cancer. Nature 1975; 255:197-200.
11. Beerenwinkel N, Antal T, Dingli D, Traulsen A, Kinzler KW, Velculescu VE, et al. Genetic progression and the waiting time to cancer. PLoS Comput Biol 2007; 3:225.
12. Hobbs JR. Growth rates and responses to treatment in human myelomatosis. Br J Haematol 1969; 16:607-17.
13. Bielas JH, Loeb KR, Rubin BP, True LD, Loeb LA. Human cancers express a mutator phenotype. Proc Natl Acad Sci USA 2006; 103:18238-42.
14. Luzzatto L, Frassoni F, Melo JV. Imatinib: can one out-wit chronic myeloid leukemia? Haematologica 2002; 87:898-901.
15. Luzzatto L, Melo JV. Acquired resistance to imatinib mesylate: selection for pre-existing mutant cells. Blood 2002; 100:1105.
16. Arendt BK, Ramirez-Alvarado M, Sikkink LA, Keats JJ, Ahmann GJ, Dispenzieri A, et al. Biologic and genetic characterization of the novel amyloidogenic lambda light chain-secreting human cell lines, ALMC-1 and ALMC-2. Blood 2008; 112:1931-41.
17. Blagosklonny MV. STI-571 must select for drug-resistant cells but ‘no cell breathes fire out of its nostrils like a dragon’. Leukemia 2002; 16:570-2.
18. Roche-Lestienne C, Soenen-Cornu V, Grardel-Duflos N, Lai JL, Philippe N, Facon T, et al. Several types of mutations of the Abl gene can be found in chronic myeloid leukemia patients resistant to STI571 and they can pre-exist to the onset of treatment. Blood 2002; 100:1014-8.
19. Dingli D, Pacheco JM, Traulsen A. Multiple mutant clones in blood rarely coexist. Phys Rev 2008; 77:021915.
20. French JD, Tschumper RC, Jelinek DF. Analysis of IL-6-mediated growth control of myeloma cells using a gp130 chimeric receptor approach. Leukemia 2002; 16:1189-96.
21. Jelinek DF, Witzig TE, Arendt BK. A role for insulin-like growth factor in the regulation of IL-6-responsive human myeloma cell line growth. J Immunol 1997; 159:487-96.
22. Jelinek DF. Mechanisms of myeloma cell growth con-trol. Hematol Oncol Clin North Am 1999; 13:1145-57.
23. Westendorf JJ, Ahmann GJ, Greipp PR, Witzig TE, Lust JA, Jelinek DF. Establishment and characterization of three myeloma cell lines that demonstrate variable cytokine responses and abilities to produce autocrine interleukin-6. Leukemia 1996; 10:866-76.
24. Klein B, Tarte K, Jourdan M, Mathouk K, Moreaux J, Jourdan E, et al. Survival and proliferation factors of normal and malignant plasma cells. Int J Hematol 2003; 78:106-13.
25. Tomlinson IP, Bodmer WF. Modelling the consequenc-es of interactions between tumour cells. British journal of cancer 1997; 75:157-60.
26. Tomlinson IP. Game-theory models of interactions between tumour cells. Eur J Cancer 1997; 33:1495-500.
27. Dingli D, Chalub FA, Santos FC, Van Segbroeck S, Pacheco JM. Cancer phenotype as the outcome of an evolutionary game between normal and malignant cells. Br J Cancer 2009; 101:1130-6.
28. Offord C, Bajzer Z. A hybrid global optimization algo-rithm involving simplex and inductive search. Lecture Notes Comput Sci 2006; 2074:680-8.