Progress in Thermomechanical Analysis of Friction Stir Welding
Upload
independentCategory
view
0download
0
www.elsevier.com/locate/actamat
Acta Materialia 55 (2007) 4789–4798
Evolution of microstructure and thermomechanical properties duringsuperelastic compression cycling in Cu–Al–Ni single crystals
A. Ibarra a, J. San Juan b,c, E.H. Bocanegra a, M.L. No a,*
a Departamento de Fısica Aplicada II, Facultad de Ciencia y Tecnologıa, Universidad del Pais Vasco, Apdo. 644, 48080 Bilbao, Spainb Departamento de Fısica de la Materia Condensada, Facultad de Ciencia y Tecnologıa, Universidad del Pais Vasco, Apdo. 644, 48080 Bilbao, Spain
c DMSE, Massachusetts Institute of Technology, 77 Massachusetts Avenue, Room 8-402, Cambridge, MA 02139, USA
Received 30 November 2006; received in revised form 2 May 2007; accepted 2 May 2007Available online 3 July 2007
Abstract
The aim of this work is to relate the macroscopic evolution of the compression superelastic effect in Cu–Al–Ni shape memory alloysingle crystals with the evolution of the microstructure during cycling. The analysis has been carried out as a function of the number ofcycles, the maximum reached deformation and the kind of induced martensite. Moreover, the new microstructure after mechanicalcycling and the evolution of the thermal transformation have been also studied. The presence of two new families of dislocations createdby different mechanisms has been observed and the influence of each one on the stress-induced and thermal transformations has beenanalyzed. In the samples where both kinds of dislocations are present at the same time, the observed behaviour is a combination of theireffects in proportion to their density.� 2007 Acta Materialia Inc. Published by Elsevier Ltd. All rights reserved.
Keywords: Shape memory alloys; Martensitic phase transformation; Superelastic cycling; Dislocation structure; Transmission electron microscopy (TEM)
1. Introduction
Martensitic transformation is responsible for interestingthermomechanical properties such as the superelastic effect(stress-induced b-martensite transformation), pseudoelas-ticity, or the one- and two-way shape memory effectobserved in different alloys such as Cu–Al–Ni, Cu–Zn–Alor Ti–Ni [1,2]. These thermomechanical properties repre-sent the basis of important industrial and technologicalapplications [3–5]. However, although the thermoelasticmartensitic transformation is a diffusionless reversible pro-cess [6], the thermomechanical properties of these materialsevolve during their working life, determining their reliabil-ity for industrial applications and their service life. Severalauthors have studied the evolution of the stress–strain (S–S) curves during stress-induced martensitic transformationin single crystals [7,8] and polycrystals [9], analyzing the
1359-6454/$30.00 � 2007 Acta Materialia Inc. Published by Elsevier Ltd. All
doi:10.1016/j.actamat.2007.05.012
* Corresponding author. Tel.: +34 946012477; fax: +34 946013500.E-mail address: [email protected] (M.L. No).
evolution of the S–S curves together with observation ofthe sample surface, at a macroscopic scale by opticalmicroscopy. Traditionally, the type of induced martensiteis determined by the morphology of the plates and thegrowth rate [10].
From a microscopic point of view, Pope et al. [9,11]performed a first analysis in 1979 in Cu–Al–Ni, combiningoptical observation with transmission electron microscopy(TEM). They did not perform any quantitative measure-ment, but the presence of new dislocations after mechan-ical cycling was reported. Rios-Jara et al. [12,13] analyzedthese new dislocations in Cu–Zn–Al alloys, determiningthe Burgers vector by simulation. They proposed twomodels in order to explain the origin of these new defects[14,15]. Nakata et al. [16] observed the presence of newdislocations after thermal cycling, but no clear conclusionwas obtained in this work (see Ref. [2] for discussion).Lovey et al. performed a detailed analysis of the newdefects in Cu–Zn–Al alloys after mechanical [17,18] andthermal cycling [19], analyzing the influence of these
rights reserved.

4790 A. Ibarra et al. / Acta Materialia 55 (2007) 4789–4798
defects on the martensitic transformation [20,21] and pro-posed a model for the interaction of martensitic transfor-mation with these dislocations [22]. Recently, Gastienet al. [23,24] analyzed the evolution of the S–S curvesand the microstructure during the superelastic effect inCu–Al–Ni alloys. All of these works were carried outfor tensile mechanical cycles. However, different authorshave emphasized the high asymmetry of the stress-inducedmartensitic transformation depending of the sense of thisstress (tensile or compression) [25–27], highlighting themore important macroscopic effects in compression teststhan in tensile ones [25]. In previous research, analysisof the evolution of thermomechanical properties as afunction of different parameters, such as dislocationmicrostructure, the type of induced martensite, or the per-centage of deformation, has not been performed for com-pression tests.
So, in this work, we report a detailed investigation ofcompression superelastic cycling in Cu–Al–Ni shape mem-ory alloy single crystals as a function of various parame-ters: the number of cycles, the maximum reacheddeformation and the kind of induced martensite. Thesestudies have been carried out in relation to the microstruc-ture evolution of the alloys and, in parallel, we have ana-lyzed the influence of cycling during stress-inducedtransformation on the evolution of a further thermaltransformation.
Compression superelastic cycles were performed in twosamples with different compositions, which transform ther-mally to different kinds of martensite. A calorimetric studyand a TEM analysis were systematically carried out onthese superelastic cycled samples in order to determinethe evolution of thermal transformation and the micro-structure of the alloy.
2. Experimental
Two [001] oriented single crystals with composition(wt.%) Cu–14.3Al–3.97Ni (sample I) and Cu–13.96Al–
Table 1Evolution of transformation temperature and thermal hysteresis with cycling
Ms (K) Mf (K) As (K)
Sample Ia, Cu–14.33Al–3.97Ni (wt.%)0 cycles 231 230 27050 cycles 233 225 256155 cycles 231 220 252305 cycles 221 212 244
Sample Ib, Cu–14.33Al–3.97Ni (wt.%)0 cycles 228 227 259500 cycles 239 238 270
Sample II, Cu–13.96Al–5.03Ni (wt.%)0 cycles 302 285 293151 cycles 289 279 287
Sample Ia before any superelastic cycle and after 50, 155 and 305 cycles strainedafter 500 mechanical cycles deformed just to 1.5%; sample II, with differentmartensite, before cycling, is also indicated.
5.03Ni (sample II) were used in the present work (see Table1). From these two single crystals, compression specimenswere cut using a low-speed diamond saw: 5 · 4 · 9 mm3
(length · width · height) for sample I and 9.5 · 5 · 9 mm3
for sample II, taking especial care of the parallelism ofthe (001) faces, since this plane is normal to the compres-sion axis. Then the surfaces of samples were carefully pol-ished. Both samples were annealed for 1800 s at 1173 Kand quenched in ice water, obtaining transformation tem-peratures below room temperature, measured by differen-tial scanning calorimetry (DSC; Ms = 227 K, Mf = 218K, As = 238 K and Af = 255 K) for sample I and aroundroom temperature (Ms = 302 K, Mf = 285 K, As = 293 Kand Af = 307 K) for sample II. After that, sample I wasaged for 14,400 s at 453 K. This treatment increases theatomic order degree, shifting up the martensitic transfor-mation temperatures [28,29] close to room temperature(see Table 1), while avoiding the precipitation process,according Recarte et al. [30,31]. All DSC measurementswere carried out with a temperature rate of 10 K min�1
in a Perkin–Elmer DSC7. The transformation tempera-tures were measured at 5% and 95% of the transformedvolume fraction x(T), calculated from the normalized inte-gral of the entropy change associated with the martensitictransformation [32], obtained from the DSC curves bymeans of the treatment explained in Ref. [33]. For sampleI, the transformation temperatures remain below roomtemperature after ageing (see Table 1), so superelastic testscan be carried out at room temperature. Sample II was notaged because the transformation temperatures of the as-quenched sample are above room temperature (see Table1), so superelastic tests were performed at 363 K. In bothcases the test temperature was higher but close to Af, there-fore, both samples were in the austenite (b)3 phase with anL21 structure and lattice parameter a = 5.82 nm [34].
The thermomechanical compression tests were per-formed at a constant displacement rate of 3.6 · 10�6
m s�1, in a universal Instron-4467 test-machine, togetherwith an Instron-3139-006 temperature chamber for the
for the different samples used in this work
Af (K) Thermal hysteresis (K) Thermal martensite
272 40 c0
268 33267 33262 32
266 37 c0
273 34
307 6 b0
296 6
up to 3–4%; sample Ib with the same composition as sample Ia, before andcomposition, before and after 151 cycles up to 4.5% strain. The thermal

Fig. 1. Stress–strain curves measured during superelastic compressioncycles at room temperature in sample I, with a constant cross-head rate of3.6 · 10�6 m s�1. Only cycles 10, 50, 155 and 305 are shown. The arrowspoint to the position of the maximum stress, rmax, reached during stress-induced martensitic transformation. The final relaxed stress, rf, is alsoindicated. The experimental error bar is smaller than the plotted dots.
A. Ibarra et al. / Acta Materialia 55 (2007) 4789–4798 4791
superelastic cycles performed in sample II at high temper-ature. The sample strain was measured by an Instron exten-someter (1 lm resolution), placed on the surfaces of thetwo compression plates.
Every 50 mechanical cycles a 1 mm thick slice, normalto the [001] compression axis, was cut by a low-speed dia-mond saw from the same specimen and then testing wasresumed. This slice was used to carry out a characteriza-tion of the thermal martensitic transformation by DSCand the analysis of the microstructure evolution byTEM. The foil samples for TEM and DSC were obtainedby mechanically polishing both faces of the 1 mm thickslice, until a thickness of between 200 and 50 lm wasreached. Then, 3 mm diameter discs for TEM were cutby punching. Previous results showed that there is nomicrostructural difference between 200 lm thick discsobtained by punching or by electrolytic cut. Finally, thediscs were electro-polished in a Struers Tenupol-5 machine,using a mixture of 33% NHO3 in methanol at 263 K and10 V. The TEM analysis was performed in a PhilipsCM200 with a Gatan double-tilt and double-tilt heatingholder.
The type of thermal induced transformation can bededuced from the value of the thermal hysteresis: 40 Kcorresponds to the b3 () c03 transformation, while�6 K corresponds to the b3 () b03 transformation,[33,35]. From the shapes of the S–S curves, the type ofstress-induced martensite can be deduced, according toOtsuka et al. [10], Sato et al. [36] and Ibarra [37]. Forthe b3 () c03 transition, a peak can be observed at thebeginning of the transformation and the value of the areaenclosed by the S–S curve is rather high. In contrast, forthe b3 () b03 transformation no peak is observed and thearea enclosed by the S–S curve, hereafter termed‘‘mechanical hysteresis’’, is lower than in the previouscase.
3. Results
3.1. Sample I
As was stated in Section 1, the stress-induced martensitictransformation evolves during mechanical cycling. In orderto analyze this evolution, compression superelastic cycleswere performed up to deformation values of between 3%and 4% in sample Ia Fig. 1 shows the S–S curves of cycles10, 50, 155 and 305, measured during this series. In all thesecurves, the critical stress necessary to induce the martensitictransformation, rc (value of the stress at which the S–Scurve moves away from the elastic modulus line), is�160 MPa; however, the stress goes on increasing until acritical value, hereafter termed the ‘‘maximum stress’’, rmax,is reached; this is indicated with arrows in Fig. 1. Just afterthis point, the stress decreases, evolving towards a relaxedvalue, called rf, characteristic of each curve. It can benoticed that the maximum stress reached during the firststage of the transformation increases with the number of
cycles. When unloading is started, the stress falls very fastbut the strain recovery is delayed (noted as a in Fig. 1). Ina second step, marked as b in Fig. 1, the rate of the strainrecovery increases when the stress decreases, but later onit become faster than the cross-head displacement, givingrise to an increase in the stress (c), until the straight modulusline is reached at �100 MPa.
In a previous work by Ibarra [37], a detailed study of theinitial microstructure was carried out before thermome-chanical testing. Fig. 2 shows a representative area of sam-ple I. It is possible to observe the presence of straight edgedislocations with Burgers vector b = 1/2 Æ001æ and line vec-tors [010] and [10 0], marked as a and b, respectively, aswell as prismatic loops in the foil plane with b = 1/2[001], marked as c. Some mixed dislocations, marked asd in the figure, with line vector Æ111æ and b = 1/4 Æ111æcan also be observed [39,40], although at a very lowdensity. In order to determine the creation and evolutionof the dislocations during cycling, a similar TEM study ofthe microstructure was carried out at different stages ofthe cycling process.
Fig. 3a shows the microstructure of the sample after 50mechanical cycles. The dislocation density has increasedand new dislocations – always appearing in pairs, markedas A in Fig. 3a and b – with line vector Æ111æ are observed.The high anisotropy of the Cu–Al–Ni alloys (A = 13) [41]does not allow us to determine the burgers vector of thesedislocations by the traditional g Æ b extinction rule. More-over, the short distance between these two dislocations pre-vents this determination by simulation or large angle

Fig. 2. Representative area of the microstructure of sample I before anysuperelastic cycle: a and b correspond to edge dislocations with u = [010]and u = [100], respectively, and b = (1/2) [001]; c corresponds toprismatic loops parallel to the foil surface with b = (1/2) [001]; d
corresponds to mixed dislocations with u = Æ111æ and b = (1/4) Æ111æ.TEM, 200 kV; g ¼ 220.
4792 A. Ibarra et al. / Acta Materialia 55 (2007) 4789–4798
convergent beam electron diffraction (LACBED) tech-niques [42]. In addition, new single dislocations wereobserved, marked as B in Fig. 3a. Usually, they presented
Fig. 3. Representative area of the microstructure of sample I. (a) After 50 supsingle dislocations are marked as B. Segments with modified character, from thtangles are marked as D. TEM, 200 kV; g ¼ �2�20. (b) Detailed view of familcompression cycles. New dislocation pairs with u = Æ111æ are marked as A1 a
a complex line and no extinction conditions were foundthat would have enabled determination of the Burgers vec-tor. Moreover, some edge dislocations present in the sam-ple before mechanical testing, with u = Æ100æ and b = 1/2Æ00 1æ, indicated by a and b in Fig. 2, were slightly modi-fied, partially changing their line and showing new seg-ments with u = Æ110æ, marked as C in Fig. 3a. Tangles ofdislocations were also observed in the cycled samples: seeD in Fig. 3a. Very small plates of martensite were foundinside these tangles. The micro-diffraction patterns, takeninside the locally strongly deformed area of dislocation tan-gles, show in fact two superimposed diffraction patterns,one of them corresponding to the L21 phase, while theother can be indexed as c03 martensite.
A much higher density of dislocations appears in Fig. 3cfor the sample cycled 155 times between 3% and 4% defor-mation. Both single dislocations with no straight lines (B)and pairs of dislocations with vector line [111] or ½�1�11�called A1 and ½�111� or ½1�1 1� called A2, can be observedin this cycled sample in a higher density than in Fig. 3a.
From the presented results, it can be noticed that duringsuperelastic cycling the behaviour of the stress-inducedmartensitic transformation evolves (Fig. 1), as a conse-quence of the microstructure evolution. In particular, the
erelastic compression cycles. New dislocation pairs are marked as A. Newe previous dislocations in Fig. 2, are marked as C. The formed dislocationy A dislocation pairs. TEM, 200 kV, g ¼ 220. (c) After 150 superelasticnd A2. New single dislocations are marked as B. TEM, 200 kV; g ¼ �220.
A. Ibarra et al. / Acta Materialia 55 (2007) 4789–4798 4793
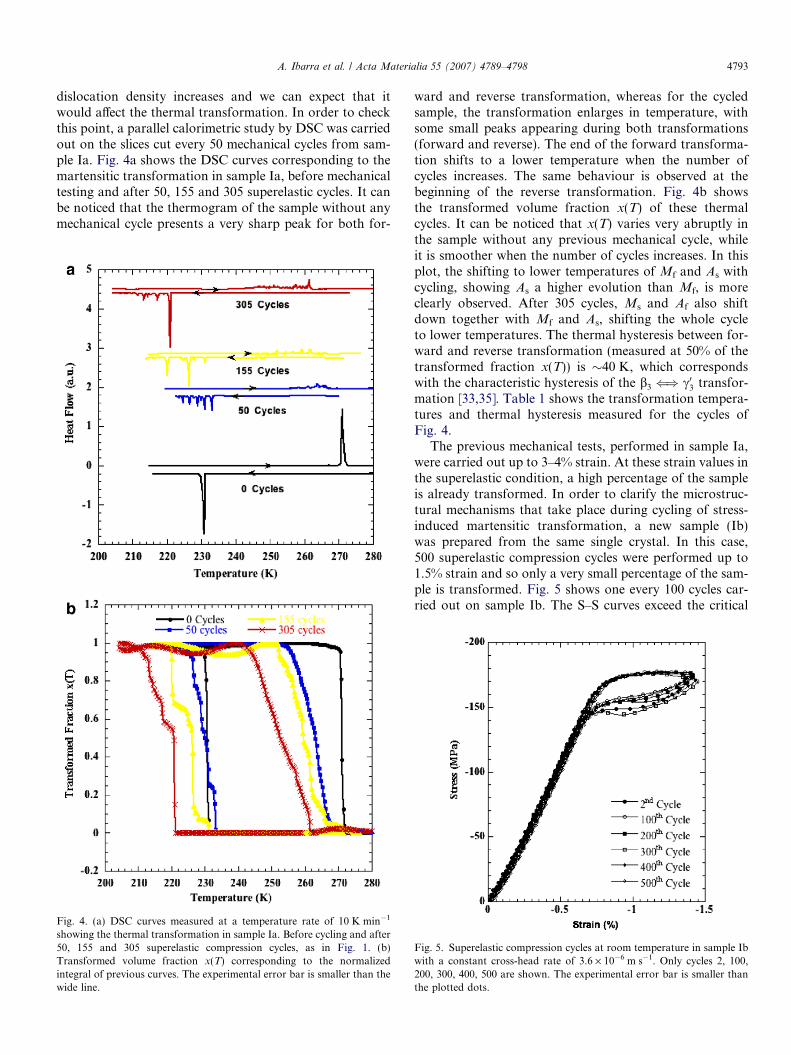
dislocation density increases and we can expect that itwould affect the thermal transformation. In order to checkthis point, a parallel calorimetric study by DSC was carriedout on the slices cut every 50 mechanical cycles from sam-ple Ia. Fig. 4a shows the DSC curves corresponding to themartensitic transformation in sample Ia, before mechanicaltesting and after 50, 155 and 305 superelastic cycles. It canbe noticed that the thermogram of the sample without anymechanical cycle presents a very sharp peak for both for-
Fig. 4. (a) DSC curves measured at a temperature rate of 10 K min�1
showing the thermal transformation in sample Ia. Before cycling and after50, 155 and 305 superelastic compression cycles, as in Fig. 1. (b)Transformed volume fraction x(T) corresponding to the normalizedintegral of previous curves. The experimental error bar is smaller than thewide line.
ward and reverse transformation, whereas for the cycledsample, the transformation enlarges in temperature, withsome small peaks appearing during both transformations(forward and reverse). The end of the forward transforma-tion shifts to a lower temperature when the number ofcycles increases. The same behaviour is observed at thebeginning of the reverse transformation. Fig. 4b showsthe transformed volume fraction x(T) of these thermalcycles. It can be noticed that x(T) varies very abruptly inthe sample without any previous mechanical cycle, whileit is smoother when the number of cycles increases. In thisplot, the shifting to lower temperatures of Mf and As withcycling, showing As a higher evolution than Mf, is moreclearly observed. After 305 cycles, Ms and Af also shiftdown together with Mf and As, shifting the whole cycleto lower temperatures. The thermal hysteresis between for-ward and reverse transformation (measured at 50% of thetransformed fraction x(T)) is �40 K, which correspondswith the characteristic hysteresis of the b3 () c03 transfor-mation [33,35]. Table 1 shows the transformation tempera-tures and thermal hysteresis measured for the cycles ofFig. 4.
The previous mechanical tests, performed in sample Ia,were carried out up to 3–4% strain. At these strain values inthe superelastic condition, a high percentage of the sampleis already transformed. In order to clarify the microstruc-tural mechanisms that take place during cycling of stress-induced martensitic transformation, a new sample (Ib)was prepared from the same single crystal. In this case,500 superelastic compression cycles were performed up to1.5% strain and so only a very small percentage of the sam-ple is transformed. Fig. 5 shows one every 100 cycles car-ried out on sample Ib. The S–S curves exceed the critical
Fig. 5. Superelastic compression cycles at room temperature in sample Ibwith a constant cross-head rate of 3.6 · 10�6 m s�1. Only cycles 2, 100,200, 300, 400, 500 are shown. The experimental error bar is smaller thanthe plotted dots.
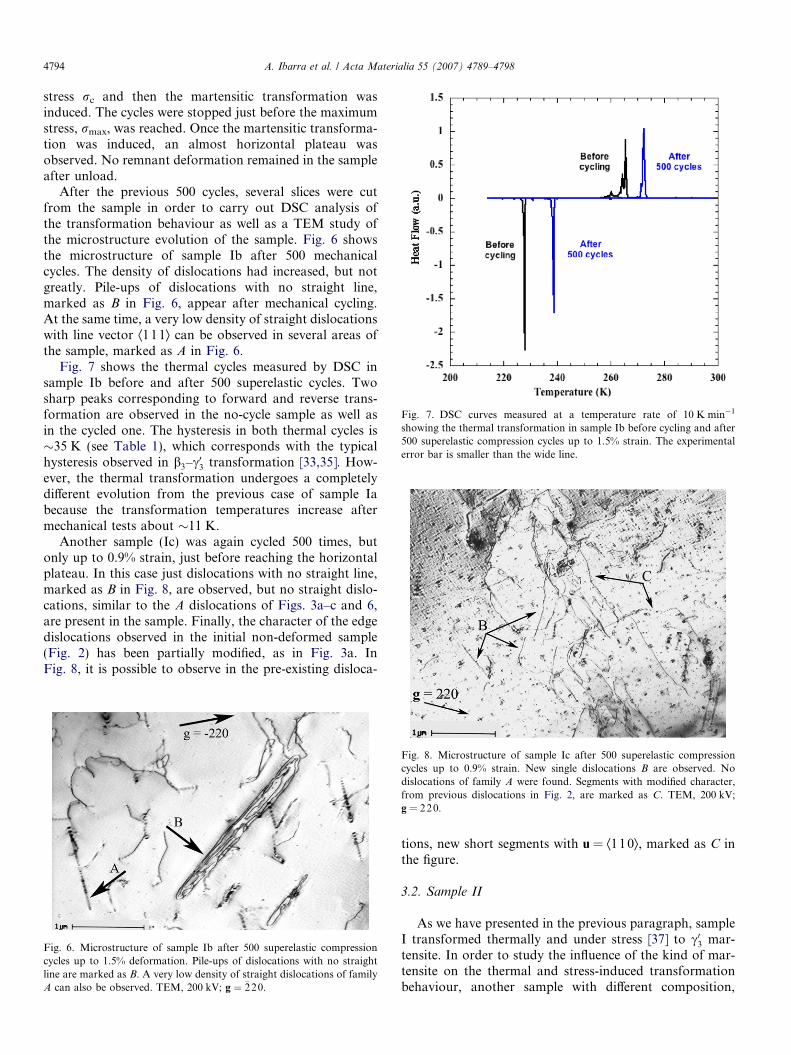
Fig. 7. DSC curves measured at a temperature rate of 10 K min�1
showing the thermal transformation in sample Ib before cycling and after500 superelastic compression cycles up to 1.5% strain. The experimentalerror bar is smaller than the wide line.
4794 A. Ibarra et al. / Acta Materialia 55 (2007) 4789–4798
stress rc and then the martensitic transformation wasinduced. The cycles were stopped just before the maximumstress, rmax, was reached. Once the martensitic transforma-tion was induced, an almost horizontal plateau wasobserved. No remnant deformation remained in the sampleafter unload.
After the previous 500 cycles, several slices were cutfrom the sample in order to carry out DSC analysis ofthe transformation behaviour as well as a TEM study ofthe microstructure evolution of the sample. Fig. 6 showsthe microstructure of sample Ib after 500 mechanicalcycles. The density of dislocations had increased, but notgreatly. Pile-ups of dislocations with no straight line,marked as B in Fig. 6, appear after mechanical cycling.At the same time, a very low density of straight dislocationswith line vector Æ111æ can be observed in several areas ofthe sample, marked as A in Fig. 6.
Fig. 7 shows the thermal cycles measured by DSC insample Ib before and after 500 superelastic cycles. Twosharp peaks corresponding to forward and reverse trans-formation are observed in the no-cycle sample as well asin the cycled one. The hysteresis in both thermal cycles is�35 K (see Table 1), which corresponds with the typicalhysteresis observed in b3–c03 transformation [33,35]. How-ever, the thermal transformation undergoes a completelydifferent evolution from the previous case of sample Iabecause the transformation temperatures increase aftermechanical tests about �11 K.
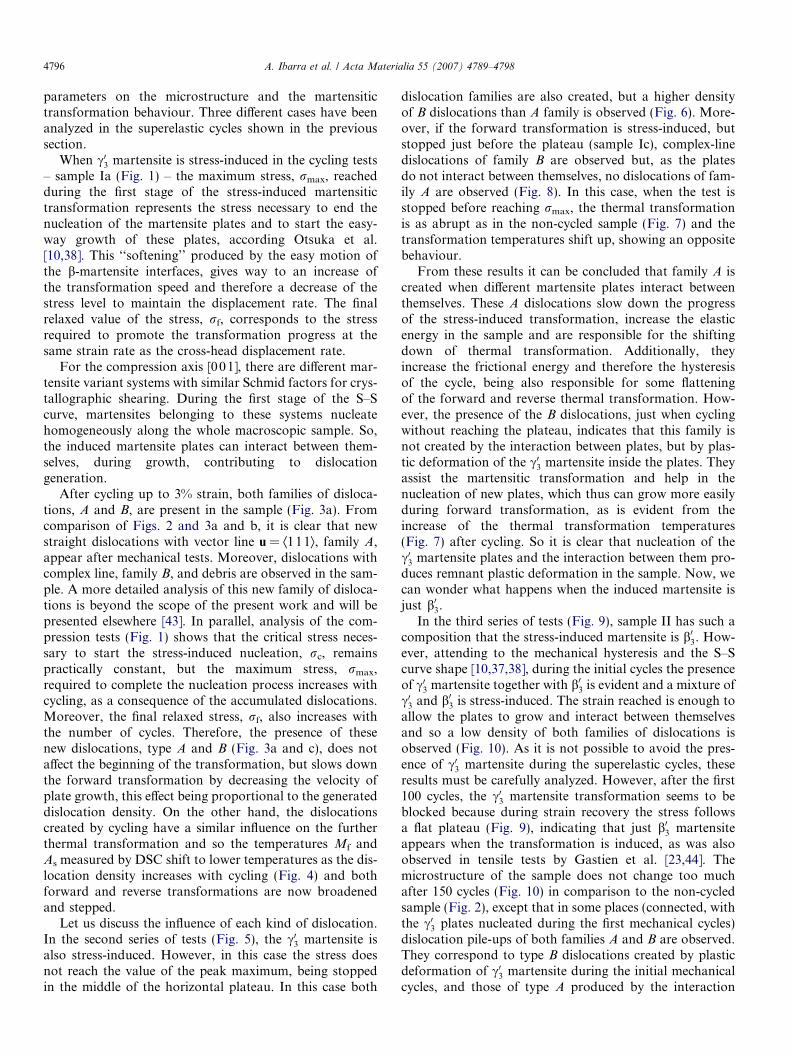
Another sample (Ic) was again cycled 500 times, butonly up to 0.9% strain, just before reaching the horizontalplateau. In this case just dislocations with no straight line,marked as B in Fig. 8, are observed, but no straight dislo-cations, similar to the A dislocations of Figs. 3a–c and 6,are present in the sample. Finally, the character of the edgedislocations observed in the initial non-deformed sample(Fig. 2) has been partially modified, as in Fig. 3a. InFig. 8, it is possible to observe in the pre-existing disloca-
Fig. 6. Microstructure of sample Ib after 500 superelastic compressioncycles up to 1.5% deformation. Pile-ups of dislocations with no straightline are marked as B. A very low density of straight dislocations of familyA can also be observed. TEM, 200 kV; g ¼ �220.
Fig. 8. Microstructure of sample Ic after 500 superelastic compressioncycles up to 0.9% strain. New single dislocations B are observed. Nodislocations of family A were found. Segments with modified character,from previous dislocations in Fig. 2, are marked as C. TEM, 200 kV;g = 220.
tions, new short segments with u = Æ110æ, marked as C inthe figure.
3.2. Sample II
As we have presented in the previous paragraph, sampleI transformed thermally and under stress [37] to c03 mar-tensite. In order to study the influence of the kind of mar-tensite on the thermal and stress-induced transformationbehaviour, another sample with different composition,
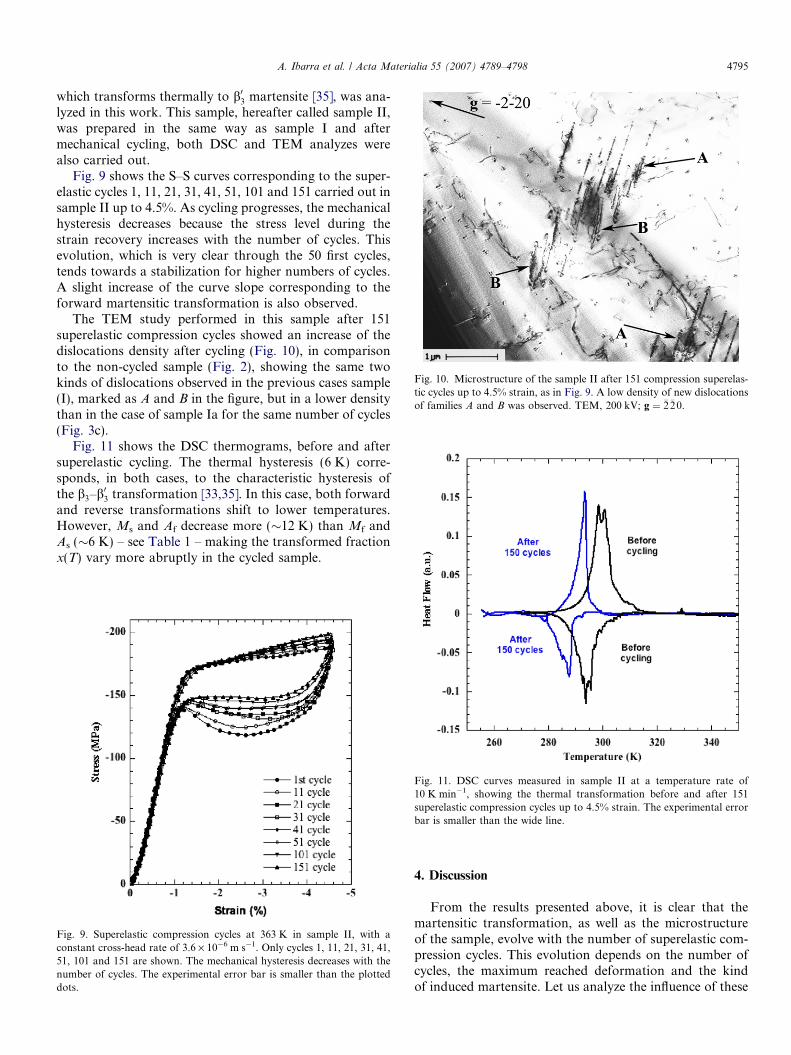
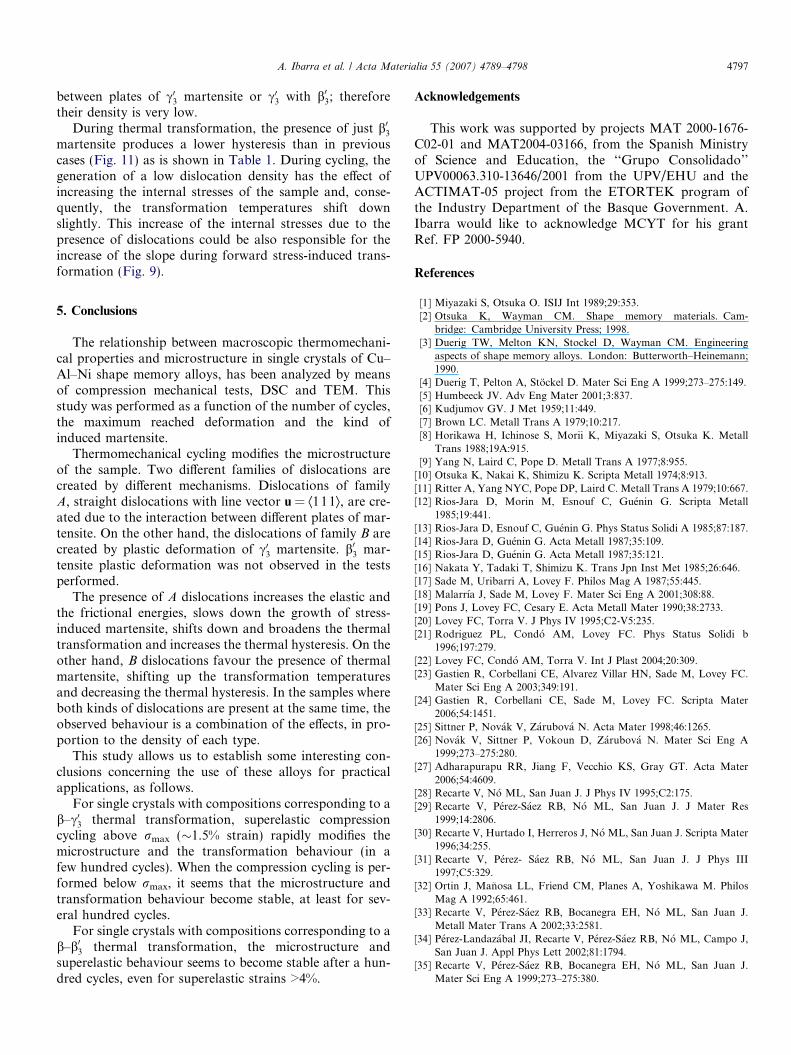
Fig. 10. Microstructure of the sample II after 151 compression superelas-tic cycles up to 4.5% strain, as in Fig. 9. A low density of new dislocationsof families A and B was observed. TEM, 200 kV; g ¼ �2�20.
A. Ibarra et al. / Acta Materialia 55 (2007) 4789–4798 4795
which transforms thermally to b03 martensite [35], was ana-lyzed in this work. This sample, hereafter called sample II,was prepared in the same way as sample I and aftermechanical cycling, both DSC and TEM analyzes werealso carried out.
Fig. 9 shows the S–S curves corresponding to the super-elastic cycles 1, 11, 21, 31, 41, 51, 101 and 151 carried out insample II up to 4.5%. As cycling progresses, the mechanicalhysteresis decreases because the stress level during thestrain recovery increases with the number of cycles. Thisevolution, which is very clear through the 50 first cycles,tends towards a stabilization for higher numbers of cycles.A slight increase of the curve slope corresponding to theforward martensitic transformation is also observed.
The TEM study performed in this sample after 151superelastic compression cycles showed an increase of thedislocations density after cycling (Fig. 10), in comparisonto the non-cycled sample (Fig. 2), showing the same twokinds of dislocations observed in the previous cases sample(I), marked as A and B in the figure, but in a lower densitythan in the case of sample Ia for the same number of cycles(Fig. 3c).
Fig. 11 shows the DSC thermograms, before and aftersuperelastic cycling. The thermal hysteresis (6 K) corre-sponds, in both cases, to the characteristic hysteresis ofthe b3–b03 transformation [33,35]. In this case, both forwardand reverse transformations shift to lower temperatures.However, Ms and Af decrease more (�12 K) than Mf andAs (�6 K) – see Table 1 – making the transformed fractionx(T) vary more abruptly in the cycled sample.
Fig. 11. DSC curves measured in sample II at a temperature rate of10 K min�1, showing the thermal transformation before and after 151superelastic compression cycles up to 4.5% strain. The experimental errorbar is smaller than the wide line.
Fig. 9. Superelastic compression cycles at 363 K in sample II, with aconstant cross-head rate of 3.6 · 10�6 m s�1. Only cycles 1, 11, 21, 31, 41,51, 101 and 151 are shown. The mechanical hysteresis decreases with thenumber of cycles. The experimental error bar is smaller than the plotteddots.
4. Discussion
From the results presented above, it is clear that themartensitic transformation, as well as the microstructureof the sample, evolve with the number of superelastic com-pression cycles. This evolution depends on the number ofcycles, the maximum reached deformation and the kindof induced martensite. Let us analyze the influence of these
4796 A. Ibarra et al. / Acta Materialia 55 (2007) 4789–4798
parameters on the microstructure and the martensitictransformation behaviour. Three different cases have beenanalyzed in the superelastic cycles shown in the previoussection.
When c03 martensite is stress-induced in the cycling tests– sample Ia (Fig. 1) – the maximum stress, rmax, reachedduring the first stage of the stress-induced martensitictransformation represents the stress necessary to end thenucleation of the martensite plates and to start the easy-way growth of these plates, according Otsuka et al.[10,38]. This ‘‘softening’’ produced by the easy motion ofthe b-martensite interfaces, gives way to an increase ofthe transformation speed and therefore a decrease of thestress level to maintain the displacement rate. The finalrelaxed value of the stress, rf, corresponds to the stressrequired to promote the transformation progress at thesame strain rate as the cross-head displacement rate.
For the compression axis [001], there are different mar-tensite variant systems with similar Schmid factors for crys-tallographic shearing. During the first stage of the S–Scurve, martensites belonging to these systems nucleatehomogeneously along the whole macroscopic sample. So,the induced martensite plates can interact between them-selves, during growth, contributing to dislocationgeneration.
After cycling up to 3% strain, both families of disloca-tions, A and B, are present in the sample (Fig. 3a). Fromcomparison of Figs. 2 and 3a and b, it is clear that newstraight dislocations with vector line u = Æ1 11æ, family A,appear after mechanical tests. Moreover, dislocations withcomplex line, family B, and debris are observed in the sam-ple. A more detailed analysis of this new family of disloca-tions is beyond the scope of the present work and will bepresented elsewhere [43]. In parallel, analysis of the com-pression tests (Fig. 1) shows that the critical stress neces-sary to start the stress-induced nucleation, rc, remainspractically constant, but the maximum stress, rmax,required to complete the nucleation process increases withcycling, as a consequence of the accumulated dislocations.Moreover, the final relaxed stress, rf, also increases withthe number of cycles. Therefore, the presence of thesenew dislocations, type A and B (Fig. 3a and c), does notaffect the beginning of the transformation, but slows downthe forward transformation by decreasing the velocity ofplate growth, this effect being proportional to the generateddislocation density. On the other hand, the dislocationscreated by cycling have a similar influence on the furtherthermal transformation and so the temperatures Mf andAs measured by DSC shift to lower temperatures as the dis-location density increases with cycling (Fig. 4) and bothforward and reverse transformations are now broadenedand stepped.
Let us discuss the influence of each kind of dislocation.In the second series of tests (Fig. 5), the c03 martensite isalso stress-induced. However, in this case the stress doesnot reach the value of the peak maximum, being stoppedin the middle of the horizontal plateau. In this case both
dislocation families are also created, but a higher densityof B dislocations than A family is observed (Fig. 6). More-over, if the forward transformation is stress-induced, butstopped just before the plateau (sample Ic), complex-linedislocations of family B are observed but, as the platesdo not interact between themselves, no dislocations of fam-ily A are observed (Fig. 8). In this case, when the test isstopped before reaching rmax, the thermal transformationis as abrupt as in the non-cycled sample (Fig. 7) and thetransformation temperatures shift up, showing an oppositebehaviour.
From these results it can be concluded that family A iscreated when different martensite plates interact betweenthemselves. These A dislocations slow down the progressof the stress-induced transformation, increase the elasticenergy in the sample and are responsible for the shiftingdown of thermal transformation. Additionally, theyincrease the frictional energy and therefore the hysteresisof the cycle, being also responsible for some flatteningof the forward and reverse thermal transformation. How-ever, the presence of the B dislocations, just when cyclingwithout reaching the plateau, indicates that this family isnot created by the interaction between plates, but by plas-tic deformation of the c03 martensite inside the plates. Theyassist the martensitic transformation and help in thenucleation of new plates, which thus can grow more easilyduring forward transformation, as is evident from theincrease of the thermal transformation temperatures(Fig. 7) after cycling. So it is clear that nucleation of thec03 martensite plates and the interaction between them pro-duces remnant plastic deformation in the sample. Now, wecan wonder what happens when the induced martensite isjust b03.
In the third series of tests (Fig. 9), sample II has such acomposition that the stress-induced martensite is b03. How-ever, attending to the mechanical hysteresis and the S–Scurve shape [10,37,38], during the initial cycles the presenceof c03 martensite together with b03 is evident and a mixture ofc03 and b03 is stress-induced. The strain reached is enough toallow the plates to grow and interact between themselvesand so a low density of both families of dislocations isobserved (Fig. 10). As it is not possible to avoid the pres-ence of c03 martensite during the superelastic cycles, theseresults must be carefully analyzed. However, after the first100 cycles, the c03 martensite transformation seems to beblocked because during strain recovery the stress followsa flat plateau (Fig. 9), indicating that just b03 martensiteappears when the transformation is induced, as was alsoobserved in tensile tests by Gastien et al. [23,44]. Themicrostructure of the sample does not change too muchafter 150 cycles (Fig. 10) in comparison to the non-cycledsample (Fig. 2), except that in some places (connected, withthe c03 plates nucleated during the first mechanical cycles)dislocation pile-ups of both families A and B are observed.They correspond to type B dislocations created by plasticdeformation of c03 martensite during the initial mechanicalcycles, and those of type A produced by the interaction
A. Ibarra et al. / Acta Materialia 55 (2007) 4789–4798 4797
between plates of c03 martensite or c03 with b03; thereforetheir density is very low.
During thermal transformation, the presence of just b03martensite produces a lower hysteresis than in previouscases (Fig. 11) as is shown in Table 1. During cycling, thegeneration of a low dislocation density has the effect ofincreasing the internal stresses of the sample and, conse-quently, the transformation temperatures shift downslightly. This increase of the internal stresses due to thepresence of dislocations could be also responsible for theincrease of the slope during forward stress-induced trans-formation (Fig. 9).
5. Conclusions
The relationship between macroscopic thermomechani-cal properties and microstructure in single crystals of Cu–Al–Ni shape memory alloys, has been analyzed by meansof compression mechanical tests, DSC and TEM. Thisstudy was performed as a function of the number of cycles,the maximum reached deformation and the kind ofinduced martensite.
Thermomechanical cycling modifies the microstructureof the sample. Two different families of dislocations arecreated by different mechanisms. Dislocations of familyA, straight dislocations with line vector u = Æ111æ, are cre-ated due to the interaction between different plates of mar-tensite. On the other hand, the dislocations of family B arecreated by plastic deformation of c03 martensite. b03 mar-tensite plastic deformation was not observed in the testsperformed.
The presence of A dislocations increases the elastic andthe frictional energies, slows down the growth of stress-induced martensite, shifts down and broadens the thermaltransformation and increases the thermal hysteresis. On theother hand, B dislocations favour the presence of thermalmartensite, shifting up the transformation temperaturesand decreasing the thermal hysteresis. In the samples whereboth kinds of dislocations are present at the same time, theobserved behaviour is a combination of the effects, in pro-portion to the density of each type.
This study allows us to establish some interesting con-clusions concerning the use of these alloys for practicalapplications, as follows.
For single crystals with compositions corresponding to ab–c03 thermal transformation, superelastic compressioncycling above rmax (�1.5% strain) rapidly modifies themicrostructure and the transformation behaviour (in afew hundred cycles). When the compression cycling is per-formed below rmax, it seems that the microstructure andtransformation behaviour become stable, at least for sev-eral hundred cycles.
For single crystals with compositions corresponding to ab–b03 thermal transformation, the microstructure andsuperelastic behaviour seems to become stable after a hun-dred cycles, even for superelastic strains >4%.
Acknowledgements
This work was supported by projects MAT 2000-1676-C02-01 and MAT2004-03166, from the Spanish Ministryof Science and Education, the ‘‘Grupo Consolidado’’UPV00063.310-13646/2001 from the UPV/EHU and theACTIMAT-05 project from the ETORTEK program ofthe Industry Department of the Basque Government. A.Ibarra would like to acknowledge MCYT for his grantRef. FP 2000-5940.
References
[1] Miyazaki S, Otsuka O. ISIJ Int 1989;29:353.[2] Otsuka K, Wayman CM. Shape memory materials. Cam-
bridge: Cambridge University Press; 1998.[3] Duerig TW, Melton KN, Stockel D, Wayman CM. Engineering
aspects of shape memory alloys. London: Butterworth–Heinemann;1990.
[4] Duerig T, Pelton A, Stockel D. Mater Sci Eng A 1999;273–275:149.[5] Humbeeck JV. Adv Eng Mater 2001;3:837.[6] Kudjumov GV. J Met 1959;11:449.[7] Brown LC. Metall Trans A 1979;10:217.[8] Horikawa H, Ichinose S, Morii K, Miyazaki S, Otsuka K. Metall
Trans 1988;19A:915.[9] Yang N, Laird C, Pope D. Metall Trans A 1977;8:955.
[10] Otsuka K, Nakai K, Shimizu K. Scripta Metall 1974;8:913.[11] Ritter A, Yang NYC, Pope DP, Laird C. Metall Trans A 1979;10:667.[12] Rios-Jara D, Morin M, Esnouf C, Guenin G. Scripta Metall
1985;19:441.[13] Rios-Jara D, Esnouf C, Guenin G. Phys Status Solidi A 1985;87:187.[14] Rios-Jara D, Guenin G. Acta Metall 1987;35:109.[15] Rios-Jara D, Guenin G. Acta Metall 1987;35:121.[16] Nakata Y, Tadaki T, Shimizu K. Trans Jpn Inst Met 1985;26:646.[17] Sade M, Uribarri A, Lovey F. Philos Mag A 1987;55:445.[18] Malarrıa J, Sade M, Lovey F. Mater Sci Eng A 2001;308:88.[19] Pons J, Lovey FC, Cesary E. Acta Metall Mater 1990;38:2733.[20] Lovey FC, Torra V. J Phys IV 1995;C2-V5:235.[21] Rodriguez PL, Condo AM, Lovey FC. Phys Status Solidi b
1996;197:279.[22] Lovey FC, Condo AM, Torra V. Int J Plast 2004;20:309.[23] Gastien R, Corbellani CE, Alvarez Villar HN, Sade M, Lovey FC.
Mater Sci Eng A 2003;349:191.[24] Gastien R, Corbellani CE, Sade M, Lovey FC. Scripta Mater
2006;54:1451.[25] Sittner P, Novak V, Zarubova N. Acta Mater 1998;46:1265.[26] Novak V, Sittner P, Vokoun D, Zarubova N. Mater Sci Eng A
1999;273–275:280.[27] Adharapurapu RR, Jiang F, Vecchio KS, Gray GT. Acta Mater
2006;54:4609.[28] Recarte V, No ML, San Juan J. J Phys IV 1995;C2:175.[29] Recarte V, Perez-Saez RB, No ML, San Juan J. J Mater Res
1999;14:2806.[30] Recarte V, Hurtado I, Herreros J, No ML, San Juan J. Scripta Mater
1996;34:255.[31] Recarte V, Perez- Saez RB, No ML, San Juan J. J Phys III
1997;C5:329.[32] Ortin J, Manosa LL, Friend CM, Planes A, Yoshikawa M. Philos
Mag A 1992;65:461.[33] Recarte V, Perez-Saez RB, Bocanegra EH, No ML, San Juan J.
Metall Mater Trans A 2002;33:2581.[34] Perez-Landazabal JI, Recarte V, Perez-Saez RB, No ML, Campo J,
San Juan J. Appl Phys Lett 2002;81:1794.[35] Recarte V, Perez-Saez RB, Bocanegra EH, No ML, San Juan J.
Mater Sci Eng A 1999;273–275:380.

4798 A. Ibarra et al. / Acta Materialia 55 (2007) 4789–4798
[36] Sato H, Takezawa K, Shin’ichi S. Trans Jpn Inst Met 1984;25:332.[37] Ibarra I. PhD thesis, Basque Country University, Bilbao, Spain; 2006.[38] Otsuka K, Wayman CM, Nakai K, Sakamoto H, Shimizu K. Acta
Metall 1976;24:207.[39] Rodrıguez PP, San Juan J, Morniroli JP, No ML. In: Proceedings
ICEM-15; 2002. p. 647.[40] Rodriguez P. PhD thesis, Basque Country University, Bilbao, Spain;
2002.
[41] Recarte V, Perez-Landazabal JI, No ML, San Juan J. Mater Sci EngA 2004;370:488.
[42] Morniroli JP. Large angle convergent beam electron diffraction(LACBED) – applications to crystalline defects. Paris: SFl;1998.
[43] Ibarra A, Caillard D, San Juan J, No ML. To be published.[44] Gastien R, Corbellani CE, Sade M, Lovey FC. Acta Mater
2005;53:1685.
Copyright © 2022 FDOKUMEN