Evidence of the effect of summertime midlatitude convection on the subtropical lower stratosphere...
13
Evidence of the effect of summertime midlatitude convection on the subtropical lower stratosphere from CRYSTAL-FACE tracer measurements Eric A. Ray, 1,2 Karen H. Rosenlof, 1 Erik C. Richard, 1,2 P. K. Hudson, 1,2 D. J. Cziczo, 1,2 M. Loewenstein, 3 H.-J. Jost, 3 J. Lopez, 3 B. Ridley, 4 A. Weinheimer, 4 D. Montzka, 4 D. Knapp, 4 S. C. Wofsy, 5 B. C. Daube, 5 C. Gerbig, 5 I. Xueref, 5 and R. L. Herman 6 Received 16 February 2004; revised 21 May 2004; accepted 18 June 2004; published 18 September 2004. [1] Trace gas and particle measurements taken during the CRYSTAL-FACE mission are used to examine mixing in the summer subtropical lower stratosphere. Vigorous convection in the central and eastern United States injected a significant amount of tropospheric air into the lower stratosphere, which was subsequently advected over the region sampled during the CRYSTAL-FACE mission. Aerosols produced by biomass burning were observed over Florida during a time period with a large number of forest fires in the western United States and eastern Canada, providing evidence of convective injection of tropospheric air into the lower stratosphere. The circumstances of the large-scale flow pattern in the upper troposphere and lower stratosphere, vigorous summertime convection, abundant forest fires, and the downstream sampling allow a unique view of mixing in the lower stratosphere. We calculate the fractions of midlatitude tropospheric air in the sampled lower stratosphere and mixing rates on the basis of consistency between a number of tracer-tracer correlations. The tropospheric endpoints to the mixing estimates give an indication of midlatitude continental convective input into the lower stratosphere. We also discuss the possible impact of summertime midlatitude convection on the composition of the stratosphere as a whole. INDEX TERMS: 0341 Atmospheric Composition and Structure: Middle atmosphere—constituent transport and chemistry (3334); 0368 Atmospheric Composition and Structure: Troposphere—constituent transport and chemistry; 3314 Meteorology and Atmospheric Dynamics: Convective processes; 3334 Meteorology and Atmospheric Dynamics: Middle atmosphere dynamics (0341, 0342); 3362 Meteorology and Atmospheric Dynamics: Stratosphere/troposphere interactions; KEYWORDS: convection, mixing, stratosphere Citation: Ray, E. A., et al. (2004), Evidence of the effect of summertime midlatitude convection on the subtropical lower stratosphere from CRYSTAL-FACE tracer measurements, J. Geophys. Res., 109, D18304, doi:10.1029/2004JD004655. 1. Introduction [2] The mixing of air in the lowermost stratosphere has important implications for a variety of processes in the UT/LS. The different pathways by which air enters the lowermost stratosphere create an environment of distinct air masses that mix together on a range of spatial and temporal scales. In particular, exchange between the very different air masses of the stratosphere and troposphere leads to large gradients in chemical species. The chemical and radiative balance of the UT/LS is greatly impacted by this exchange and mixing [e.g., Esler et al., 2001]. Since the range of spatial scales on which mixing occurs is quite large, it is difficult to measure or model this region with enough resolution or spatial sampling to completely describe the mixing processes. [3] The injection of tropospheric air into the lower strato- sphere by subtropical or midlatitude convection is a process whose effects on the stratosphere are not well known. This is primarily due to the short time and small spatial scales on which convection occurs and the small percentage of con- vective events vigorous enough to penetrate into the strato- sphere. These characteristics make convective influence on the stratosphere difficult to directly measure or model. Basic questions on the role of deep convection in the dehydration of the stratosphere are still not fully understood. The effects of convection are of fundamental importance in the tropics, where air is lifted into the upwelling region of the strato- sphere. However, it is less clear what impact vigorous convection in the subtropics and midlatitudes, associated with monsoon circulations for instance, has on the compo- sition of the stratosphere as a whole. JOURNAL OF GEOPHYSICAL RESEARCH, VOL. 109, D18304, doi:10.1029/2004JD004655, 2004 1 NOAA Aeronomy Laboratory, Boulder, Colorado, USA. 2 Also at Cooperative Institute for Research in Environmental Sciences, University of Colorado, Boulder, Colorado, USA. 3 NASA Ames Research Center, Moffett Field, California, USA. 4 National Center for Atmospheric Research, Boulder, Colorado, USA. 5 Department of Atmospheric Sciences, Harvard University, Cambridge, Massachusetts, USA. 6 Jet Propulsion Laboratory, Pasadena, California, USA. Copyright 2004 by the American Geophysical Union. 0148-0227/04/2004JD004655$09.00 D18304 1 of 13
Transcript of Evidence of the effect of summertime midlatitude convection on the subtropical lower stratosphere...

Evidence of the effect of summertime midlatitude convection
on the subtropical lower stratosphere from
CRYSTAL-FACE tracer measurements
Eric A. Ray,1,2 Karen H. Rosenlof,1 Erik C. Richard,1,2 P. K. Hudson,1,2 D. J. Cziczo,1,2
M. Loewenstein,3 H.-J. Jost,3 J. Lopez,3 B. Ridley,4 A. Weinheimer,4 D. Montzka,4
D. Knapp,4 S. C. Wofsy,5 B. C. Daube,5 C. Gerbig,5 I. Xueref,5 and R. L. Herman6
Received 16 February 2004; revised 21 May 2004; accepted 18 June 2004; published 18 September 2004.
[1] Trace gas and particle measurements taken during the CRYSTAL-FACE mission areused to examine mixing in the summer subtropical lower stratosphere. Vigorousconvection in the central and eastern United States injected a significant amount oftropospheric air into the lower stratosphere, which was subsequently advected over theregion sampled during the CRYSTAL-FACE mission. Aerosols produced by biomassburning were observed over Florida during a time period with a large number of forestfires in the western United States and eastern Canada, providing evidence of convectiveinjection of tropospheric air into the lower stratosphere. The circumstances of thelarge-scale flow pattern in the upper troposphere and lower stratosphere, vigoroussummertime convection, abundant forest fires, and the downstream sampling allow aunique view of mixing in the lower stratosphere. We calculate the fractions of midlatitudetropospheric air in the sampled lower stratosphere and mixing rates on the basis ofconsistency between a number of tracer-tracer correlations. The tropospheric endpoints tothe mixing estimates give an indication of midlatitude continental convective input intothe lower stratosphere. We also discuss the possible impact of summertime midlatitudeconvection on the composition of the stratosphere as a whole. INDEX TERMS: 0341
Atmospheric Composition and Structure: Middle atmosphere—constituent transport and chemistry (3334);
0368 Atmospheric Composition and Structure: Troposphere—constituent transport and chemistry; 3314
Meteorology and Atmospheric Dynamics: Convective processes; 3334 Meteorology and Atmospheric
Dynamics: Middle atmosphere dynamics (0341, 0342); 3362 Meteorology and Atmospheric Dynamics:
Stratosphere/troposphere interactions; KEYWORDS: convection, mixing, stratosphere
Citation: Ray, E. A., et al. (2004), Evidence of the effect of summertime midlatitude convection on the subtropical lower
stratosphere from CRYSTAL-FACE tracer measurements, J. Geophys. Res., 109, D18304, doi:10.1029/2004JD004655.
1. Introduction
[2] The mixing of air in the lowermost stratosphere hasimportant implications for a variety of processes in theUT/LS. The different pathways by which air enters thelowermost stratosphere create an environment of distinctair masses that mix together on a range of spatial andtemporal scales. In particular, exchange between the verydifferent air masses of the stratosphere and troposphereleads to large gradients in chemical species. The chemicaland radiative balance of the UT/LS is greatly impacted by
this exchange and mixing [e.g., Esler et al., 2001]. Sincethe range of spatial scales on which mixing occurs is quitelarge, it is difficult to measure or model this region withenough resolution or spatial sampling to completelydescribe the mixing processes.[3] The injection of tropospheric air into the lower strato-
sphere by subtropical or midlatitude convection is a processwhose effects on the stratosphere are not well known. This isprimarily due to the short time and small spatial scales onwhich convection occurs and the small percentage of con-vective events vigorous enough to penetrate into the strato-sphere. These characteristics make convective influence onthe stratosphere difficult to directly measure or model. Basicquestions on the role of deep convection in the dehydrationof the stratosphere are still not fully understood. The effectsof convection are of fundamental importance in the tropics,where air is lifted into the upwelling region of the strato-sphere. However, it is less clear what impact vigorousconvection in the subtropics and midlatitudes, associatedwith monsoon circulations for instance, has on the compo-sition of the stratosphere as a whole.
JOURNAL OF GEOPHYSICAL RESEARCH, VOL. 109, D18304, doi:10.1029/2004JD004655, 2004
1NOAA Aeronomy Laboratory, Boulder, Colorado, USA.2Also at Cooperative Institute for Research in Environmental Sciences,
University of Colorado, Boulder, Colorado, USA.3NASA Ames Research Center, Moffett Field, California, USA.4National Center for Atmospheric Research, Boulder, Colorado, USA.5Department of Atmospheric Sciences, Harvard University, Cambridge,
Massachusetts, USA.6Jet Propulsion Laboratory, Pasadena, California, USA.
Copyright 2004 by the American Geophysical Union.0148-0227/04/2004JD004655$09.00
D18304 1 of 13
[4] To describe the extratropical convective influence onthe stratosphere, it is necessary to know both how much airis input by convection into the stratosphere as well as thefate of the injected air. The first of these processes is quitedifficult to determine since there are multiple pathways bywhich air enters the extratropical lower stratosphere. It hasbeen known, but perhaps not fully appreciated, for manyyears that midlatitude convection can penetrate well into thelower stratosphere [Roach, 1967]. Chemical signatures oftropospheric air have often been measured in the subtropicaland midlatitude lower stratosphere [Hoor et al., 2002; Rayet al., 1999; Hintsa et al., 1998], but convection was notthought to be the process that caused many of theseobserved stratospheric perturbations. Observational studiesthat have inferred convective injection of tropospheric airinto the lower stratosphere made use of specific short-livedin situ trace gas measurements [e.g., Jost et al., 2004;Fischer et al., 2003; Tuck et al., 1997] or satellite aerosolmeasurements [Fromm and Servranckx, 2003; Fromm et al.,2000]. Recently, there also have been high-resolution mod-eling studies that have begun to resolve detailed convectivetransport in the UT/LS [e.g., Wang, 2003].[5] The impact and fate of the convectively injected air in
the extratropical lower stratosphere are affected by thebackground flow, radiative heating rates and the rate ofmixing with background stratospheric air. The climatolog-ical stratospheric flow during the monsoon season can resultin extensive southward advection of mid and high latitudestratospheric air into the subtropics [Dunkerton, 1995].Radiative heating rates equatorward of roughly 30� latitudeabove 360 K are positive [Rosenlof, 1995]. This suggeststhat air injected into the stratosphere above the 360 K leveleither at latitudes less than 30�, or at latitudes higher than30� and subsequently advected to lower latitudes, will riseand spread throughout the stratosphere. The rate with whichthe tropospheric air is mixed with the surrounding strato-sphere can also have a chemical and radiative impact on theextratropical lower stratosphere [e.g., Esler et al., 2001].
[6] The purpose of this paper is to estimate the amount ofmixing of convectively injected tropospheric air with thesurrounding lower stratosphere based on measurementstaken during the CRYSTAL-FACE mission in July 2002.Two flights in particular, 7 and 9 July, passed through layersof air in the lower stratosphere which contained highlyperturbed chemical and particle compositions compared tothe surrounding stratosphere. Highly elevated CO, CO2 andNOy along with particle signatures typical of biomassburning suggest a recent injection of tropospheric air intothe lower stratosphere. Trajectories indicate that equator-ward large-scale flow in the lower stratosphere transportedair from the vigorous convective region of the central andeastern United States and Canada, where forest fires werepresent, to the sampled region. We will calculate mixingfractions, mixing rates and estimate the boundary conditionsfor tropospheric air convectively injected into the strato-sphere based on the flights of 7 and 9 July. These quantitiesare of interest since there have been very few in situmeasurements in the stratosphere that can help describemixing of such distinct air masses from known sources overa timescale of 5–10 days.
2. Measurements
[7] The NASA CRYSTAL-FACE mission took placefrom 29 June to 31 July 2002 based out of Key West,Florida. The main purpose of the mission was to character-ize cirrus clouds in the vicinity of tropical convection. Themeasurements used in this paper were taken on the WB-57Faircraft, which can fly in the upper troposphere and lowerstratosphere up to roughly 20 km. Measurements of O3
[Proffitt and McLaughlin, 1983], NOy [Ridley et al., 1994],CO [Loewenstein et al., 2002], CO2 [Daube et al., 2002],particles from the PALMS instrument [Murphy et al., 1998]and pressure and temperature [Thompson and Rosenlof,2003] are used. All of these measurements were taken byfast response, typically 1 Hz, high precision instruments.[8] The flights discussed in this paper took place on 7 and
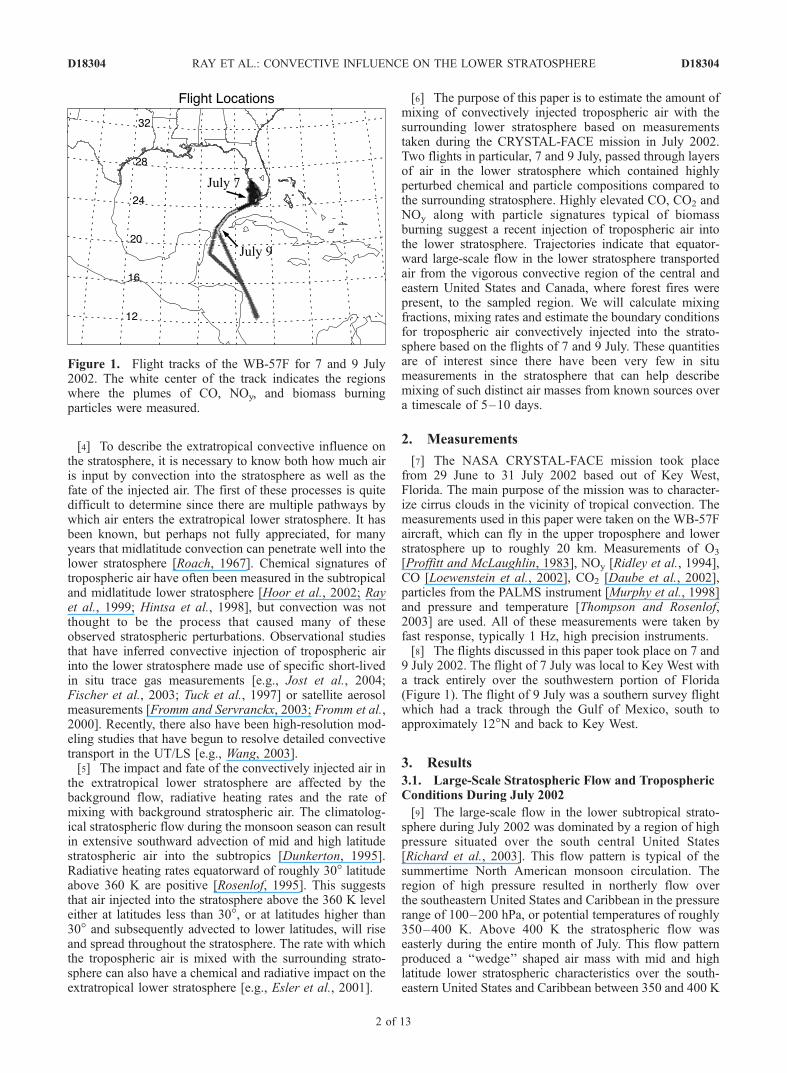
9 July 2002. The flight of 7 July was local to Key West witha track entirely over the southwestern portion of Florida(Figure 1). The flight of 9 July was a southern survey flightwhich had a track through the Gulf of Mexico, south toapproximately 12�N and back to Key West.
3. Results
3.1. Large-Scale Stratospheric Flow and TroposphericConditions During July 2002
[9] The large-scale flow in the lower subtropical strato-sphere during July 2002 was dominated by a region of highpressure situated over the south central United States[Richard et al., 2003]. This flow pattern is typical of thesummertime North American monsoon circulation. Theregion of high pressure resulted in northerly flow overthe southeastern United States and Caribbean in the pressurerange of 100–200 hPa, or potential temperatures of roughly350–400 K. Above 400 K the stratospheric flow waseasterly during the entire month of July. This flow patternproduced a ‘‘wedge’’ shaped air mass with mid and highlatitude lower stratospheric characteristics over the south-eastern United States and Caribbean between 350 and 400 K
Figure 1. Flight tracks of the WB-57F for 7 and 9 July2002. The white center of the track indicates the regionswhere the plumes of CO, NOy, and biomass burningparticles were measured.
D18304 RAY ET AL.: CONVECTIVE INFLUENCE ON THE LOWER STRATOSPHERE
2 of 13
D18304

with a sharp transition above 400 K to tropical lowerstratospheric conditions. The ‘‘wedge’’ shape was due tothe erosion of the northerly flow at lower latitudes, mostlyfrom the easterly flow above, so that the air mass thinnedtoward lower latitudes. One of the effects of this large-scaleflow pattern was to transport lower stratospheric air fromthe midlatitude United States and Canada to the subtropicallatitudes sampled during CRYSTAL-FACE.[10] The forest fire season in the western United States
and Canada during 2002 happened to be one of the mostactive in the last 50 years. Major fires occurred in June inColorado, Arizona and Saskatchewan and in early July inQuebec. These fires spread an extensive pall of smoke overlarge regions of the central and eastern United States andCanada from late June to early July. Thus a strong convec-tive event in this region that penetrated the lower strato-sphere would be expected to significantly perturb thestratosphere downstream of the fires with a chemical andparticulate signature of biomass burning.[11] Signatures of biomass burning in the lower strato-
sphere have been seen previously in satellite aerosolmeasurements [Fromm and Servranckx, 2003; Fromm etal., 2000] and from in situ measurements [Waibel et al.,1999; Lelieveld et al., 1997]. The flights of 7 and 9 July2002 during CRYSTAL-FACE exhibit regions of significantchemical and particle perturbations in the lower stratosphereconsistent with the effects of biomass burning [Jost et al.,2004]. These perturbations include elevated CO and othertrace gases as well as particle measurements sampled byPALMS that are similar in composition to those sampledpreviously in smoke plumes [Hudson et al., 2004]. Figure 1indicates the parts of the flight track where biomass burningparticles were sampled as well as very high CO and NOy
mixing ratios, hereafter referred to as the ‘‘plume’’ air mass.
[12] So how did this plume air mass get transported intothe stratosphere? The two most common methods of trans-port from the troposphere to the stratosphere in the extra-tropics are quasi-isentropic exchange and convectiveovershooting. There is compelling evidence to suggest thatthe sampled plume was injected by a convective event orevents downstream of fires in Canada or the western UnitedStates. Figure 2 shows 14 day back trajectories initializedon the 9 July flight track at locations where the plume wassampled. These trajectories pass over and near severalregions of significant biomass burning as indicated by theellipses in Figure 2. Jost et al. [2004] have also examinedthe source of the plume using in situ measurements, modelback trajectories and satellite aerosol data. They found that astrong convective event in Saskatchewan was most likely tohave injected air into the stratosphere near the region offorest fires. The trajectories calculated in the work of Jost etal. [2004] agree very closely to those shown here but we arenot sufficiently confident in the trajectories to identify aparticular convective event responsible for the plume.[13] The strongest evidence for convective injection of
tropospheric air comes from the PALMS particle data. Over95% of the particles in the plume were classified as ofbiomass origin. This large fraction of biomass burningparticles measured in the plume suggests a relatively un-mixed, and thus recent injection of tropospheric air into thestratosphere. The absence of tropospheric material such asmineral dust, sulfates, etc. other than biomass in the plumealso indicates the air mass was injected into the stratospherevery close to the source fires. A much smaller fraction, 45–50%, of particles outside of the plume are classified ashaving biomass origin. This fraction of particles outside ofthe plume in the lower stratosphere is still quite high, whichsuggests that there was a significant amount of transport oftropospheric air into the extratropical lower stratosphereduring this time period. As mentioned above, quasi-isentro-pic mixing also likely transported air with biomass burningcharacteristics into the lower stratosphere since the firesspread smoke into the middle and upper troposphere over alarge region. However, dispersion and mixing in the tropo-sphere is much more efficient than in the stratosphere so thehigh fraction of biomass burning particles and the overallnumber of particles measured in the plume indicate that itexperienced little mixing in the troposphere prior to theexchange into the stratosphere.[14] The strong evidence for recent (on the order of
10 days prior to the sampling) convective injection of theplume is important since it allows us to perform a mixingcalculation assuming the endpoints are the backgroundstratosphere and the convectively injected plume. It is rareto be able to identify an air mass in the lower stratospherewith a distinct origin such as from a convective event. Bydoing so, we can examine the rate of mixing of the plumewith the background stratosphere as well as the compositionof the convectively injected air mass. Exactly where thesampled biomass burning particles and associated tropo-spheric air originated and which convective system(s)injected this air into the stratosphere cannot be definitivelydetermined here. However, the mixing calculations per-formed here are not dependent on knowledge of theorigination fires. The important point is that the biomassburning particle and anomalous chemical measurements
Figure 2. A map of 14 day back trajectories calculated byFLEXTRA using NCEP AVN assimilated model output.The trajectories were initialized at roughly 30 s intervalsalong the portions of the 9 July flight track where the‘‘plume’’ was located. Asterisks denote the trajectorypositions after 10 days. The ellipses encompass regions ofsignificant fire activity during late June and early July 2002as determined by MODIS (modis-fire.gsfc.nasa.gov/).
D18304 RAY ET AL.: CONVECTIVE INFLUENCE ON THE LOWER STRATOSPHERE
3 of 13
D18304

reveal that there was recent injection of tropospheric air intothe lower stratosphere from at least one midlatitude con-vective event.[15] An interesting feature of the measurements in the
lower stratosphere is the high potential temperatures wherebiomass burning particles and anomalous trace gas mixingratios were observed. Figure 3 shows CO measurementsfrom the 9 July flight as a function of potential temperaturewith the plume region highlighted. The majority of thepoints in the plume are between 375 and 390 K. Radiativeheating rates are small in this part of the stratosphere sodiabatic motion over the course of one week would only beon the order of several degrees. This implies that theconvection, and associated gravity wave activity, was vig-orous enough to inject air up to potential temperatures ofgreater than 380 K. The local tropopause over the easternUnited States was 350–360 K so the convection penetratedwell above the local tropopause. The study by Roach [1967]using observations from the ER-2 discussed cloud tops overthe midwestern United States that reached up to 6 km abovethe local tropopause. Recent modeling work by Wang[2003] suggests that midlatitude convection can penetratewell above the tropopause and deposit a plume of tropo-spheric air into the lower stratosphere aided by the presenceof gravity wave breaking. The level to which midlatitudeconvection can penetrate the lower stratosphere may haveimportant implications for the impact on the stratosphere asa whole. This topic will be discussed further below.
3.2. Lower Stratospheric Isentropic Mixing
[16] The transport and mixing processes assumed to haveoccurred prior to the sampling of the lower stratosphere on 7and 9 July 2002 are summarized in the schematic shown inFigure 4. Tropospheric air with particles from biomassburning, high CO and NOy and low O3 mixing ratios wasinjected by a vigorous midlatitude convective event orperhaps more than one event into the lower stratosphere.
This tropospheric air is then assumed to have mixed isen-tropically with the surrounding stratosphere at some rate thatwas dependent on the shear of the flow as it was advectedsouthward into the sampled region in the subtropics. In thissection we will focus on the isentropic mixing that occurredin the lower stratosphere following the convection.[17] To quantitatively examine the mixing between the
plume and the lower stratosphere we use correlationsbetween several long-lived trace gases. The only processesthat can cause a change in the correlation between two tracegases are local chemistry and mixing between air masseswith very distinct chemical compositions [Plumb and Ko,1992]. Local chemical lifetimes of O3, NOy, CO and CO2 inthe extratropical lower stratosphere are long compared tothe transport timescale in this region, which is on the orderof weeks [Brasseur and Solomon, 1986]. However, it islikely that the perturbed chemical environment of the plumeresulted in anomalous photochemistry in the lower strato-sphere. Studies of photochemistry within biomass burningplumes suggest that above 12 km the lifetime of CO is 1–2 months [Mauzerall et al., 1998]. Many studies have alsocalculated enhancements of a variety of trace gases relativeto CO and CO2 within biomass plumes [e.g., Ryerson et al.,2001; Andreae et al., 2001; Mauzerall et al., 1998]. Pho-tochemical modeling work of conditions in the lowerstratosphere similar to those in the plume indicate that O3
production could have occurred at a much higher rate thanin typical lower stratospheric conditions, but that CO, CO2
and NOy were essentially inert (K. Drdla, personal commu-nication, 2004). We use the biomass plume enhancementratio of O3 relative to CO calculated in previous studies toestimate the O3 production within the plume based on themeasured CO enhancement. We account for a range of O3
production within the plume in the mixing calculation butassume that the other tracers remained inert throughout the7–12 day transport timescale in the lower stratosphere.
Figure 3. Profile of CO versus potential temperature forthe 9 July 2002 WB-57F flight. Light shaded points indicatedata from the entire flight and dark shaded points are in the‘‘plume’’ portion of the flight as discussed in the text.
Figure 4. Schematic of the transport of tropospheric airinto the sampled region of the lower stratosphere. Thelatitude-pressure cross section of potential temperature andtropopause height are from NCEP analysis on 7 July 2002,06Z at a longitude of 78�E. The convection is assumed tohave occurred in the midlatitudes over the continentalUnited States several days before the WB-57F sampled thelower stratosphere over Key West, Florida.
D18304 RAY ET AL.: CONVECTIVE INFLUENCE ON THE LOWER STRATOSPHERE
4 of 13
D18304

[18] Correlations between O3, CO, CO2 and NOy for the9 July 2002 flight are shown in Figure 5. The measurementsare color coded by potential temperature to help differenti-ate the distinct stratospheric regions that were sampledduring this flight. The green shaded points (q > 400 K)have relatively low CO and NOy mixing ratios and rela-tively high CO2 mixing ratios, which is consistent with amostly subtropical stratospheric air mass. The points with ared shading (390 K > q > 350 K) have relatively high COand NOy mixing ratios and relatively low CO2 mixing ratiosconsistent with the mid to high latitude lower stratosphericwedge air mass. The black points highlight the plume
region, which has a significantly different correlation slopein each plot of Figure 5 compared to either the subtropicalor mid to high latitude lower stratosphere. The highlyelevated CO and NOy mixing ratios are consistent withthe effects of biomass burning as discussed earlier. Thelinear shape of the plume correlation in each plot issuggestive of a mixing line between a convectively injectedair mass from the troposphere and a background strato-spheric air mass. The solid lines on each plot represent anestimate of the typical midlatitude lower stratosphere corre-lations based primarily on previous aircraft measurements[Fahey et al., 1996; Hoor et al., 2002].
Figure 5. Correlation plots of all the long-lived tracers for the 9 July 2003 flight. The light shadedpoints are all the measurements taken above potential temperatures of 350 K and ozone mixing ratios of150 ppbv. The black points are in the smoke plume and are used in the mixing calculation described inthe text. The solid black line is an estimate of the typical midlatitude correlation in the lower stratosphereand is used as an end point in the mixing calculation.
D18304 RAY ET AL.: CONVECTIVE INFLUENCE ON THE LOWER STRATOSPHERE
5 of 13
D18304

[19] The long-lived tracer correlations from the flight of7 July (Figure 6) are similar to those of 9 July. The WB-57Fonly sampled potential temperatures up to about 390 K sothe subtropical correlations seen on 9 July are not present on7 July. In the wedge region of the lower stratosphere and inthe plume the correlations are similar between the twoflights, although the plume correlation is much less pro-nounced in the O3-NOy correlation on the 7 July flight.Measurements of CO2 were not taken on this flight so onlycorrelations between O3, CO and NOy are shown and usedin the mixing calculation. An interesting question is howmuch, if any, of the plume sampled on 7 July is the sameplume as that sampled on 9 July. The very similar correla-tions in the plume, particularly between O3 and CO, and thesimilar potential temperature range suggests that at least partof the plume sampled on 7 July was the same air mass asthat sampled on 9 July. Trajectories initialized on the 7 Julyflight track (not shown) indicate that the air in the 375–390 K range moved to the southwest over the region of the9 July flight track where the plume was sampled. The partof the plume sampled between 365 and 375 K on 7 July waslikely advected to the south and southeast due to verticalshear in the wind direction. Support for the trajectoryanalysis comes from the lack of measurements sampledbelow 375 K on 9 July that show significant deviations fromthe correlations in the wedge region. This lack of plumemeasurements at lower potential temperatures on 9 July isnot due to a lack of sampling since at locations north of20�N most measurements were taken in the 360–380 Krange. Thus if the plume did extend below 375 K it wouldhave been sampled. This indicates that the plume had asharp lower boundary due to the shear of the backgroundflow. Thus the same plume air mass was likely sampledduring both flights in the 375–390 K potential temperaturerange, but the plume below 375 K was advected in adifferent direction following the 7 July flight. The similarspatial proximity of the plume sampled above and below375 K on 7 July is suggestive that all of the plume air massis a result of the same convective event.[20] The goal of the first part of the mixing calculation is
to determine the fraction of tropospheric air in the plume airmass. To calculate the fraction of tropospheric air we use theplume tracer correlations shown in Figures 5 and 6, andassume these correlations resulted from mixing between thebackground stratospheric correlations and the convectively
input tropospheric correlations. The use of tracer correlationsto quantify mixing has been used in previous studies [e.g.,Plumb et al., 2002; Ray et al., 2002], but in this calculationwe include photochemical production of O3 as well asmixing. Figure 7 shows a schematic example of the mixingcalculation for O3 versus CO and how the O3 production
Figure 6. Correlation plots of the long-lived tracers for the 7 July 2002 flight. Color shading is the sameas in Figure 5.
Figure 7. A schematic of the mixing lines for the case ofthe O3 versus CO correlation. The mixing is assumed tohave occurred between the convectively injected tropo-spheric air, represented by the gray box, and the backgroundmidlatitude stratospheric air, represented by the solid blackline. In the mixing calculation performed here, the mixinglines were allowed to pivot around the plume correlation,adjusted for photochemical O3 production, in order to matchthe mixing fraction for all tracer pairs. Thus the convectiveboundary conditions and midlatitude stratospheric mixingratios were allowed to vary within certain observationalconstraints described in the text. The data labeled ‘‘plumew/o ozone production’’ are not actual measurements butrather are plume measurements adjusted for the amount ofO3 production assumed to have occurred in the stratosphere.The O3 production shown here represent the highest valuesassumed in the calculation.
D18304 RAY ET AL.: CONVECTIVE INFLUENCE ON THE LOWER STRATOSPHERE
6 of 13
D18304
impacts the calculation. The endpoints of the mixing calcu-lation are the convective input, which is the origination ofthe plume air mass, and the midlatitude stratosphere. Overtime the plume mixes with the surrounding stratosphere,which moves the plume correlations toward the midlatitudestratosphere correlations, and O3 is produced, which movesthe correlations only toward higher O3 mixing ratios. Theresult is a curving path on the correlation plot, movingtoward lower CO and higher O3 mixing ratios. Each mea-surement in the plume had a unique mixing and O3 produc-tion path that occurred over the previous 7–12 days andended at the measurement location on the correlation plot atthe time of observation. The effect of the O3 production is toelevate the O3 mixing ratios in the plume. Without O3
production the plume correlations would have looked some-thing like the light gray points in Figure 7. For the mixingcalculation we account for the O3 production by reducing theO3 in the plume and then assume a linear mixing linebetween the reduced O3 plume and the mixing endpointsas denoted by the dashed line in Figure 7. The O3 productionis scaled by the measured CO enhancement above thebackground UT/LS mixing ratios. The correlations withthe highest CO mixing ratios are thus assumed to have spentthe most time in the chemically perturbed biomass burningconditions where O3 is more efficiently produced. The effectof removing the O3 production in this way is to rotate theplume correlations such that the correlations with lower COmixing ratios change their O3 mixing ratios less than thecorrelations with higher CO mixing ratios. This changes theslope of the plume correlations as shown in Figure 7.[21] The fraction of tropospheric air in the stratosphere is
calculated for each tracer correlation from the followingequation:
Ftrop ið Þ ¼
ffiffiffiffiffiffiffiffiffiffiffiffiffiffiffiffiffiffiffiffiffiffiffiffiffiffiffiffiffiffiffiffiffiffiffiffiffiffiffiffiffiffiffiffiffiffiffiffiffiffiffiffiffiffiffiffiffiffiffiffiffiffiffiffiffiffiffiffiffiffiffiffiffiffiffiffiffiffiffiffiffic1 ið Þ � c1strat ið Þð Þ2þ c2 ið Þ � c2strat ið Þð Þ2
qffiffiffiffiffiffiffiffiffiffiffiffiffiffiffiffiffiffiffiffiffiffiffiffiffiffiffiffiffiffiffiffiffiffiffiffiffiffiffiffiffiffiffiffiffiffiffiffiffiffiffiffiffiffiffiffiffiffiffiffiffiffiffiffiffiffiffiffiffiffiffiffiffiffiffiffiffiffiffiffiffiffiffiffiffiffiffiffiffiffiffiffiffiffiffic1strop ið Þ � c1strat ið Þ� �2þ c2strop ið Þ � c2strat ið Þ
� �2q ;
ð1Þ
where c1(i) and c2(i) are plume mixing ratios, adjusted forO3 production, at a particular point i, c1trop(i) and c2trop(i)are the convective boundary conditions and c1strat(i) andc2strat(i) are the midlatitude stratospheric boundary condi-tions. We assume the convective boundary condition for O3
is fixed and that initially the midlatitude stratospheric O3
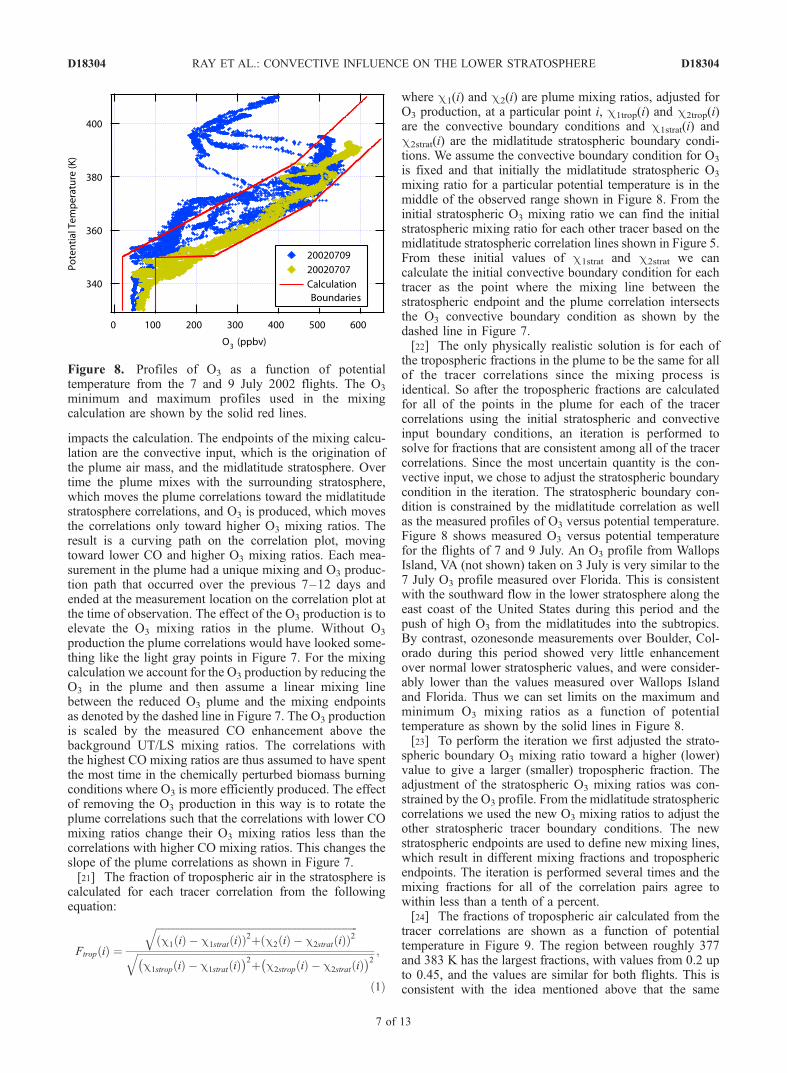
mixing ratio for a particular potential temperature is in themiddle of the observed range shown in Figure 8. From theinitial stratospheric O3 mixing ratio we can find the initialstratospheric mixing ratio for each other tracer based on themidlatitude stratospheric correlation lines shown in Figure 5.From these initial values of c1strat and c2strat we cancalculate the initial convective boundary condition for eachtracer as the point where the mixing line between thestratospheric endpoint and the plume correlation intersectsthe O3 convective boundary condition as shown by thedashed line in Figure 7.[22] The only physically realistic solution is for each of
the tropospheric fractions in the plume to be the same for allof the tracer correlations since the mixing process isidentical. So after the tropospheric fractions are calculatedfor all of the points in the plume for each of the tracercorrelations using the initial stratospheric and convectiveinput boundary conditions, an iteration is performed tosolve for fractions that are consistent among all of the tracercorrelations. Since the most uncertain quantity is the con-vective input, we chose to adjust the stratospheric boundarycondition in the iteration. The stratospheric boundary con-dition is constrained by the midlatitude correlation as wellas the measured profiles of O3 versus potential temperature.Figure 8 shows measured O3 versus potential temperaturefor the flights of 7 and 9 July. An O3 profile from WallopsIsland, VA (not shown) taken on 3 July is very similar to the7 July O3 profile measured over Florida. This is consistentwith the southward flow in the lower stratosphere along theeast coast of the United States during this period and thepush of high O3 from the midlatitudes into the subtropics.By contrast, ozonesonde measurements over Boulder, Col-orado during this period showed very little enhancementover normal lower stratospheric values, and were consider-ably lower than the values measured over Wallops Islandand Florida. Thus we can set limits on the maximum andminimum O3 mixing ratios as a function of potentialtemperature as shown by the solid lines in Figure 8.[23] To perform the iteration we first adjusted the strato-
spheric boundary O3 mixing ratio toward a higher (lower)value to give a larger (smaller) tropospheric fraction. Theadjustment of the stratospheric O3 mixing ratios was con-strained by the O3 profile. From the midlatitude stratosphericcorrelations we used the new O3 mixing ratios to adjust theother stratospheric tracer boundary conditions. The newstratospheric endpoints are used to define new mixing lines,which result in different mixing fractions and troposphericendpoints. The iteration is performed several times and themixing fractions for all of the correlation pairs agree towithin less than a tenth of a percent.[24] The fractions of tropospheric air calculated from the
tracer correlations are shown as a function of potentialtemperature in Figure 9. The region between roughly 377and 383 K has the largest fractions, with values from 0.2 upto 0.45, and the values are similar for both flights. This isconsistent with the idea mentioned above that the same
Figure 8. Profiles of O3 as a function of potentialtemperature from the 7 and 9 July 2002 flights. The O3
minimum and maximum profiles used in the mixingcalculation are shown by the solid red lines.
D18304 RAY ET AL.: CONVECTIVE INFLUENCE ON THE LOWER STRATOSPHERE
7 of 13
D18304

plume air mass was sampled during both flights. Above383 K and below 377 K the fractions are between 0.1 and0.3 and are again similar for both flights. So the mixingcalculation indicates that a layer of the plume maintained asignificant tropospheric characteristic even after a week ormore in the stratosphere. The plume above and below thislayer mixed more efficiently with the surrounding strato-sphere. Vertical inhomogeneities in the turbulent mixingduring convection or wind shear variability during thesubsequent advection in the lower stratosphere may havecontributed to the vertical gradient in the calculated mixingfractions.[25] The calculated fractions of tropospheric air in the
stratosphere reveal some information about the timescale ofmixing in the lower stratosphere. We can quantify a mixingrate by simply dividing the fraction of stratospheric air inthe plume, which is 1-F, by an estimate of the time betweenthe convective event and the sampling. As an example, ifwe assume the plume was injected into the stratospherewithin the last 7–12 days, for F = 0.25 the mixing rate has arange of 6–10%/day. There are, of course, some largeuncertainties in the mixing process, primarily in the initialconditions during the convective events. We included arange of timescales from 7–12 days since we do not knowwhen the convective event or events occurred. It is possiblethat the convective injection occurred prior to 12 daysbefore the plume was sampled. However, based on trajec-tory calculations, it is highly unlikely that the plume wasinjected more than 14 days prior to sampling since air in thelower stratosphere was advected across North Americawithin that time frame. Since the only highly concentratedsources of biomass burning particles were in the UnitedStates and Canada, the transit timescale across the continentacts as a constraint on the mixing timescale.[26] Error bars on the calculated fractions are estimated
from several sources of uncertainty added in quadrature.
The primary sources of errors result from uncertainties inthe O3 production rate, the midlatitude stratospheric corre-lation and the tropospheric O3 mixing ratio. The troposphericO3 mixing ratio for the base calculation was chosen to be75 ppbv and for the error calculation an uncertainty range of50–100 ppbv was used. The midlatitude stratosphericcorrelation was changed by a few percent around thecorrelations shown in Figure 5 to represent uncertainty inthe correlation. This resulted in the smallest uncertainty inthe mixing calculation. The O3 production rate was esti-mated by using the DO3/DCO enhancement ratio calculatedin previous studies of biomass burning plumes as mentionedearlier. For the base case we assumed DO3/DCO = 0.7, with0.3 and 1.1 used for the lower and higher estimates of ozoneproduction. These values represent some of the uncertaintyquoted in previous studies as well as the lack of previousstudies of biomass burning plume characteristics in thestratosphere.[27] Another uncertainty that was not quantified in the
mixing calculation is the amount of mixing that took placeas the convection penetrated the stratosphere. It is likely thatduring the convective penetration of air into the lowerstratosphere there was some amount of mixing on a shorttimescale. This would result in an air mass that, on thetimescale of hours, contained some amount of troposphericair mixed with the surrounding stratospheric air. The mixingassociated with the turbulence of convection is differentfrom the diffusive and shear induced mixing that occurreddownstream of the convection in the lower stratosphere. Thenotion that a significant amount of mixing occurred in ashort period of time during the convection is supported bythe similarity in the calculated fractions above 380 Kbetween the two flights (Figure 9). These flights wereseparated by two days and, as mentioned previously, weassume that the same plume air mass above 380 K wassampled on both flights. Since the fractions are approxi-mately the same on 7 July as those two days later thissuggests only a small amount of mixing occurred in thistime period. A caveat is that a much smaller portion of theplume was sampled on 7 July compared to 9 July. Unfor-tunately we have no way of estimating the amount ofturbulent mixing in the lower stratosphere associated withthe convection, and modeling studies are only beginning toresolve this process [e.g., Lane et al., 2003]. Thus themixing rate is likely to be considerably smaller than thatcalculated above. We could convert the mixing rate into adiffusion coefficient using an estimate of the plume size butthe number would be highly uncertain and likely anoverestimate since it would include turbulent as well asdiffusive mixing.
3.3. Composition and Mass of Air Injected byConvection Into the Lower Stratosphere
[28] In the calculation of the tropospheric mixing fractiondescribed above, the convective boundary condition wasessentially allowed to freely vary in order to iterate to afraction of tropospheric air that was consistent among all thetracer correlations. The physical interpretation of the con-vective boundary condition in the mixing calculation is themixing ratio of a tracer in an air mass injected by convectioninto the lower stratosphere. This convectively injected airmass is the starting point of the mixing calculation. As a
Figure 9. Fraction of tropospheric air in the ‘‘plume’’ airmasses sampled in the lower stratosphere. The fractionswere calculated using the tracer correlations as described inthe text. Error bars were calculated from uncertainties in theozone versus potential temperature profile (Figure 8),stratospheric boundary condition correlations, and tropo-spheric ozone mixing ratios.
D18304 RAY ET AL.: CONVECTIVE INFLUENCE ON THE LOWER STRATOSPHERE
8 of 13
D18304

convective cloud rises through the troposphere, air isentrained at various levels, although mostly in the boundarylayer, and mixes with the air in the cloud. Thus theconvective boundary condition described here is roughlyrepresentative of the average composition over the depth ofthe convective entrainment level.[29] Since the measurements included in the mixing
calculation have elevated mixing ratios of tracers whichare combustion products of biomass burning, the convectiveboundary conditions will be unusually high for thosetracers. One tracer that is not significantly influenced bythe biomass burning origin of the tropospheric air is watervapor. This is due to the fact that the mixing ratio of watervapor in the lower stratosphere is primarily determined byprocesses that occur near the tropopause. The processes thatcontribute to dehydration near the tropopause have beenstudied extensively, particularly in the tropics [Jensen andPfister, 2004; Gettelman et al., 2002], but it is still not clearwhat controls the amount of water vapor that enters thestratosphere. Subtropical and midlatitude convection is oneof the processes that is thought to impact the humidity levelsof air in the stratosphere, but has an uncertain role.[30] Figure 10 shows correlations of water vapor versus
ozone for the flights of 7 and 9 July. The plume correlationsare much different from the typical lower stratosphericcorrelations as was seen for all the other tracers. The watervapor mixing ratios are much higher than the typicalsubtropical or midlatitude stratospheric value for a givenO3 mixing ratio, which suggests hydration of the lowerstratosphere by the midlatitude convection. It is clear fromFigure 10 that there are many other measured correlationsbesides those in the plume with relatively high water vapormixing ratios for both of the flights. These correlations aremore common in the high latitude lowermost stratospheredue to stratosphere-troposphere exchange, such as near thepolar front jet, where relatively warm tropopause temper-atures allow more water vapor to enter the stratosphere.Thus, in an air mass advected from high latitudes, correla-tions with high water vapor mixing ratios are not exclu-sively due to recent convection. We have used the othertracer correlations to identify the plume measurements thatwere most recently influenced by convection. The convec-tive boundary condition for water vapor can be calculated in
a similar manner as described in the previous section for theother tracers. This water vapor convective boundary condi-tion is presumably representative of vigorous midlatitudeconvection that penetrates the lower stratosphere.[31] Normalized distributions of the convective boundary
conditions for CO, CO2, NOy and water vapor for the 7 and9 July flights are shown in Figure 11. The CO distributionfor both flights peaks between 200 and 300 ppbv, which ismuch higher than normal tropospheric mixing ratios, butwell within the range of measurements taken in the tropo-sphere downstream of forest fires [e.g., Andreae et al.,2001]. NOy and CO2 also peak at significantly highermixing ratios than normal tropospheric values in the North-ern Hemisphere summer, consistent with the effects ofbiomass burning. Enhancements of trace gases in biomassburning plumes are commonly calculated by means of aratio versus CO or CO2 [e.g., Mauzerall et al., 1998;Andreae et al., 2001]. Since we assume the convectionresponsible for the plume injected a relatively fresh biomassburning air mass we can compare the enhancement ratioscalculated from the convective boundary conditions tovalues from previous studies. The enhancement ratios aredefined as DX/DY, where DX represents the mixing ratioenhancement above a background level. Table 1 lists thebasic PDF characteristics of the enhancement ratios calcu-lated for both the 7 and 9 July flights. The enhancementratio distributions generally fall within the range of valuescalculated from previous studies. This agreement withprevious studies gives added confidence to the convectiveboundary condition calculation and further evidence forthe rapid injection of a biomass burning plume into thestratosphere.[32] The water vapor convective boundary condition
distributions have interesting differences between the twoflights. The 9 July distribution has peaks at 20 and40 ppmv with no mixing ratios larger than 60 ppmv.The distribution from the 7 July flight is shifted some-what toward higher water vapor mixing ratios with amain peak at 50 ppmv and some mixing ratios exceeding80 ppmv. It is interesting to note that the small second-ary peak at 15 ppmv in the 7 July distribution is entirelydue to the plume measurements above 375 K on thisdate. Also, the 9 July peak at 40 ppmv is entirely due to
Figure 10. Correlations of ozone and water vapor for the flights of (left) 7 July and (right) 9 July 2002.Shading is the same as in Figure 5.
D18304 RAY ET AL.: CONVECTIVE INFLUENCE ON THE LOWER STRATOSPHERE
9 of 13
D18304

the plume measurements below 380 K on this date. Thusthe convective boundary conditions for the two flightsgive a consistent picture of lower water vapor in airparcels lofted deeper into the stratosphere. All of theconvectively injected water vapor mixing ratios for bothflights are much larger than the background stratosphericvalues of 5–8 ppmv, which suggests substantial hydrat-ing of the lower stratosphere by vigorous midlatitudeconvection.[33] Since, as discussed in the previous section, we
assume the plume from both flights was created from thesame convective event then the different convective bound-ary conditions suggest that there was an inhomogeneousvertical distribution of tracers injected into the lower strato-sphere. The difference in the water vapor distributionsrepresents a vertical gradient in the amount of dehydrationthat occurred within the convective region. The high poten-tial temperatures at which the plume was sampled on 9 July,and above 375 K on 7 July suggest this air was transportedinto the stratosphere by a very vigorous convective event orevents. Since the local tropopause over the central UnitedStates was between 350 and 360 K, the convection andassociated wave breaking and mixing above the convectionpenetrated well into the lower stratosphere. Convective
plumes that penetrate well into the midlatitude stratospherehave been photographed by the ER-2 [Roach, 1967],inferred from satellite measurements [e.g., Levizzani andSetvak, 1996] and modeled [Wang, 2003]. However, in situevidence of convective influence on the lower stratosphereup to 400 K has been limited to the tropics [Danielsen,1993; Kelly et al., 1993]. Thus, although there is plenty ofevidence for the existence of vigorous midlatitude convec-tion that penetrates deep into the lower stratosphere, the lack
Figure 11. Normalized distributions of trace gas mixing ratios at the time the ‘‘plume’’ air mass wasconvectively injected into the lower stratosphere. The distributions are calculated from the measuredmixing ratios in the lower stratospheric plume and the tropospheric fraction at the time of measurementdetermined from the mixing calculations as described in the text. Separate distribution for the flights of 7and 9 July 2002 are shown for (a) CO, (b) NOy, (c) water vapor, and (d) CO2.
Table 1. Plume Enhancement Ratios Calculated From the
Convective Boundary Conditionsa
PDF Peak7 July
80% Spread7 July
PDF Peak9 July
80% Spread9 July
PreviousStudiesb
DNOy/DCO 13 11–19 19 13–25 11–15DNOy/DCO2 450 350–700 N/A N/A 300–700DCO/DCO2 30 20–60 N/A N/A 40–80
aThe PDF peak represent the most probable value of the enhancementratio and the 80% spread encompasses 80% of the values closest to the PDFpeak. Units of NOy are pptv, CO ppbv and CO2 ppmv. Background mixingratios used: NOy = 750 pptv, CO = 100 ppbv, CO2 = 371 ppmv (NOyestimated from tropospheric measurements during CRYSTAL-FACE andCO and CO2 from CMDL flask measurements; see http://www.cmdl.noaa.gov/ccgg). N/A, not available.
bData from Mauzerall et al. [1998] and Andreae et al. [2001].
D18304 RAY ET AL.: CONVECTIVE INFLUENCE ON THE LOWER STRATOSPHERE
10 of 13
D18304

of in situ measurements makes it difficult to determine theimpact of this convection on the stratosphere. For instance,the modeling study of Wang [2003] showed that theconvective plumes moistened the stratosphere but it is notknown to what extent and whether the strength of theconvection affects the amount of moistening. It is certainlynot possible to make general conclusions based on twosampled events but the suggestion from the calculationperformed here is that the convection was more effectiveat moistening the stratosphere just above the tropopausecompared to the higher levels. However, in considering theimpact of the convective moistening on the stratosphere as awhole, it is important to note that the vigorous convectionmoistened a large depth of the stratosphere, which subse-quently was transported equatorward. The moistened airabove 375 K is much more likely to rise into the tropicalstratosphere and thus be circulated into the stratosphere as awhole by means of the Brewer-Dobson circulation, provid-ing a potential influence on the middle and upperstratosphere.[34] The estimates of the composition of air injected by
convection into the stratosphere described above are likelyto be somewhat unique due to the large amount of biomassburning material present. However, the mass of air injectedinto the stratosphere by convection may be more generallycomparable to other convective events over the summertimecontinental United States. The convective mass flux likelyplays a significant role in the budgets of water vapor andother trace gases in the extratropical lower stratosphere. Yetthis quantity is very difficult to estimate through observa-tions and is thus not well constrained. High-resolutionmodels are beginning to resolve cloud processes with moreaccuracy [e.g., Wang, 2003], which makes observationalestimates of convective mass flux quite important to con-strain the models.[35] We can estimate the mass of air injected into the
stratosphere by the convective event responsible for theplume sampled on 9 July based on the plume size andthe mixing fractions. This convective mass flux can becalculated by the equation M = V � r � F, where V is thevolume of the plume at the time of sampling on 9 July, r isthe average density of air in the plume and F is the averagefraction of tropospheric air in the plume. To estimate thevolume of the plume (V ) we use the spatial informationwhere the plume was sampled. Figure 12a shows a timeseries of CO and potential temperature and Figure 12bshows a portion of the flight track from the 9 July flight.The spikes in the CO time series signify where the plumeabove 375 K was intersected, as denoted by the symbols onthe potential temperature curve. The sloping lines are drawnto roughly indicate the top and bottom vertical levels of theplume based on the multiple intersections. We would expectthe plume to be sloping in the vertical due to the shear of thewind in the lower stratosphere. The northerly winds werestronger below 380 K compared to above 380 K based onNCEP wind fields (not shown). This would cause the lowerlevels of the plume to be advected further south than theupper levels, resulting in a sloping sheet. The observedtransect through the plume is consistent with the wind shearcharacteristics since the higher levels of the plume wereobserved at later times, which are more northern locationson the return flight leg.
[36] Since the WB-57F was traveling nearly in a straightline toward the northeast on the portion of the flight trackconsidered here (Figure 12b), we can convert the plumeintersections seen in the time series into a spatial scale. Wecan constrain the size of the plume based on an assumedpotential temperature range of 375–395 K and the slope ofthe lines shown in Figure 12a. The lower boundary of 375 Kis based on the fact that the outgoing leg of the 9 July flightfollowed the exact same track as the return leg over theregion where the plume was sampled. Over this region onthe outgoing leg, the WB-57F sampled up to 371 K withoutmeasuring any of the aerosol or trace gas plume character-istics described above. Figure 12b shows an ellipticalapproximation of the horizontal plume size based on theflight track intercepts. The plume is assumed to be ellipticalin shape with a depth of 6 K potential temperature(Figure 12a), which corresponds to roughly 200m in altitude.We take the average tropospheric fraction in the plume to be0.25 based on the calculated values shown in Figure 9. Note
Figure 12. (a) Time series of potential temperature andCO from the 9 July 2002 flight. Points that are considered tobe within the plume are overlaid on the potentialtemperature time series. The solid lines represent thesloping sheet of the plume. (b) Flight track of the 9 Julyflight with plume intercept points overlaid. The ellipserepresents the assumed size of the plume based on the flighttrack and the wind shear.
D18304 RAY ET AL.: CONVECTIVE INFLUENCE ON THE LOWER STRATOSPHERE
11 of 13
D18304

that we are only making this calculation for the upper level ofthe plume sampled on both 7 and 9 July above 375K so this isan underestimate. These plume characteristics result in aconvective mass injection of 5.6 � 1011 kg of air.[37] We can compare this mass flux estimate to that
calculated by Wang [2003] for a single thunderstorm overthe midwestern United States. We use the water vapor fluxestimate quoted in the paper, along with the lifetime and thewater vapor mixing ratio of the modeled convective event tocome up with an air mass flux of 1.3 � 1012 kg. Thismodeled mass flux is roughly two times larger than ourestimate based on the sampled plume in the stratosphere.Considering the many possible differences in the twoestimates, including variable convective strength, uncertaintyin the plume size and mixing fraction among others, theagreement is reasonably good. It is almost certain thatconvective mass flux into the stratosphere varies by manyorders of magnitude since it can range from near zero to thevalues shown above. However, the similarity in the modeledand observational estimates of mass injection suggests that arange of convective events in the summertime continentalUnited States can impact the composition of the extratropicallower stratosphere, and perhaps the stratosphere as a whole.
4. Summary
[38] The unique sampling of the summer subtropicallower stratosphere by the WB-57F during the CRYSTAL-FACE mission has provided some insight into convectivetransport and mixing in this part of the atmosphere. We havetaken advantage of the combination of abundant forest firesin the central United States and eastern Canada, the loftingof the smoke plumes into the lower stratosphere by vigorousconvection and the southward advection in the lowerstratosphere over the sampled region of Florida to examinestratospheric mixing. A key component in the ability toidentify air that was recently transported from the tropo-sphere into the stratosphere by convection as opposed to bysome other process is the aerosol measurements of biomassburning particles [Jost et al., 2004]. The aerosol signaturesof biomass burning, along with anomalous trace gas mea-surements, clearly indicate the presence of recently injectedtropospheric air in the stratosphere.[39] We used measurements from the flights of 7 and
9 July 2002, when the most substantial smoke plumes weresampled, to make some simple calculations of mixing andthe effects of convection on the subtropical lower strato-sphere. Correlations of trace gases are used to calculatefractions of tropospheric air within the lower stratosphericplume. These fractions range from 0.1 up to nearly 0.5,which suggests that a portion of the plume maintained asignificant signature of the troposphere as it was advected inthe lower stratosphere for over a week. There is a distinctdifference in the calculated mixing fractions above andbelow 375 K. These differences could be due to inhomo-geneous mixing assuming the plume was created by a singleconvective event or convective strength differences assum-ing the plume was created by two nearly coincident events.We also estimated a range of mixing rates based on transittimescales of 7–12 days in the lower stratosphere betweenthe convection and the time of sampling. These mixing rateestimates have a large uncertainty due to imprecise knowl-
edge of the transit timescale as well as the amount of mixingthat occurred during the convective event.[40] The composition and mass of the input of tropo-
spheric air into the stratosphere by convection is of interestdue to the potential chemical and radiative impact on thestratosphere. From the mixing calculation we determinedmixing ratio distributions of CO, NOy, CO2 and watervapor, at the time of convective input into the stratosphere.Most of the tracers were enhanced by regional biomassburning and thus their mixing ratio distributions are shiftedtoward higher mixing ratios compared to typical troposphericvalues.Water vapor is different from the other tracers in that itis controlled primarily by the coldest temperatures within thecloud. The water vapor distributions from the measurementsabove and below 375K are substantially different. The plumesampled above 375 K has a water vapor distribution shiftedtoward lower mixing ratios, with a peak from 15–20 ppmv,compared to the plume below 375 K, with a peak near50 ppmv. Both of the water vapor mixing ratio distributionssuggest that midlatitude convection moistens the extratrop-ical lower stratosphere.[41] If the distributions were created by the same con-
vective event then this suggests an inhomogeneous verticaldistribution of tracers injected into the lower stratosphere.The upper levels of the convective penetration into thestratosphere could be associated with colder temperaturesthrough wave activity or perhaps increased particle fallout.While the lower levels of the convective penetration mayinject moister air into the stratosphere, the upper levels mayhave more impact on the stratosphere as a whole. Since airabove 360 K in the subtropics can rise in the upward branchof the mean stratospheric circulation the effect of theconvection may be distributed into the stratosphere as awhole. Forward trajectories from the 9 July flight path (notshown) suggest that the sampled plume moved further southtoward the equator where it was likely lifted into the tropicalstratosphere. We also estimated the mass of tropospheric airinjected into the stratosphere by the convection responsiblefor the plume above 375 K. The value of roughly 5.6 �1011 kg is somewhat smaller than that calculated from ahigh-resolution cloud model. The substantial variability inextratropical convective strength and a lack of observationalbased estimates of convective mass injection into thestratosphere suggest a need for further study.[42] The chance encounter of smoke plume air masses in
the lower stratosphere during CRYSTAL-FACE discussedin this paper highlights yet again the importance of aircraft-based measurements in the UT/LS region. The high reso-lution and wide range of data taken from the aircraft canreveal features of the transport and chemistry that cannot beattained by other sampling platforms.
[43] Acknowledgments. We would like to thank the pilots and crewof the NASAWB-57F. Funding for this research was provided by a NASARadiation Sciences Program grant.
ReferencesAndreae, M. O., et al. (2001), Transport of biomass burning smoke to theupper troposphere by deep convection in the equatorial region, Geophys.Res. Lett., 28, 951–954.
Brasseur, G., and S. Solomon (1986), Aeronomy of the Middle Atmosphere,2nd ed., D. Reidel, Norwell, Mass.
Danielsen, E. F. (1993), In situ evidence of rapid, vertical irreversibletransport of lower tropospheric air into the lower tropical stratosphere
D18304 RAY ET AL.: CONVECTIVE INFLUENCE ON THE LOWER STRATOSPHERE
12 of 13
D18304
by convective cloud turrets and by large-scale upwelling in tropicalcyclones, J. Geophys. Res., 98, 8665–8681.
Daube, B. C., Jr., K. A. Boering, A. E. Andrews, and S. C. Wofsy (2002), Ahigh-precision fast-response airborne CO2 analyzer for in situ samplingfrom the surface to the middle stratosphere, J. Atmos. Oceanic Technol.,19, 1532–1543.
Dunkerton, T. J. (1995), Evidence of meridional motion in the summerlower stratosphere adjacent to monsoon regions, J. Geophys. Res., 100,16,675–16,688.
Esler, J. G., D. G. H. Tan, P. H. Haynes, M. J. Evans, K. S. Law, P.-H.Plantevin, and J. A. Pyle (2001), Stratosphere-troposphere exchange:Chemical sensitivity to mixing, J. Geophys. Res., 106, 4717–4731.
Fahey, D. W., et al. (1996), In situ observations of NOy, O3, and the NOy/O3
ratio in the lower stratosphere, Geophys. Res. Lett., 23, 1653–1656.Fischer, H., et al. (2003), Deep convective injection of boundary layer airinto the lowermost stratosphere at midlatitudes, Atmos. Chem. Phys., 3,739–745.
Fromm, M. D., and R. Servranckx (2003), Transport of forest fire smokeabove the tropopause by supercell convection, Geophys. Res. Lett.,30(10), 1542, doi:10.1029/2002GL016820.
Fromm, M. D., J. Alfred, K. Hoppel, J. Hornstein, R. Bevilacqua,E. Shettle, R. Servranckx, Z. Li, and B. Stocks (2000), Observations ofboreal forest fire smoke in the stratosphere by POAM III, SAGE II, andlidar in 1998, Geophys. Res. Lett., 27, 1407–1410.
Gettelman, A., W. J. Randel, F. Wu, and S. T. Massie (2002), Transport ofwater vapor in the tropical tropopause layer, Geophys. Res. Lett., 29(01),1009, doi:10.1029/2001GL013818.
Hintsa, E. J., et al. (1998), Troposphere-to-stratosphere transport in thelowermost stratosphere from measurements of H2O, CO2, N2O and O3,Geophys. Res. Lett., 25, 2655–2658.
Hoor, P., H. Fischer, L. Lange, J. Lelieveld, and D. Brunner (2002), Sea-sonal variations of a mixing layer in the lowermost stratosphere as iden-tified by the CO-O3 correlation from in situ measurements, J. Geophys.Res., 107(D5), 4044, doi:10.1029/2000JD000289.
Hudson, P. K., D. M. Murphy, D. J. Cziczo, D. S. Thomson, J. A. de Gouw,C. Warneke, J. Holloway, H. Jost, and G. Hubler (2004), Biomass-burning particle measurements: Characteristic composition and chemicalprocessing, J. Geophys. Res., 109, D23S27, doi:10.1029/2003JD004398.
Jensen, E., and L. Pfister (2004), Transport and freeze-drying in the tropicaltropopause layer, J. Geophys. Res., 109, D02207, doi:10.1029/2003JD004022.
Jost, H.-J., et al. (2004), In-situ observations of mid-latitude forest fireplumes deep in the stratosphere, Geophys. Res. Lett., 31, L11101,doi:10.1029/2003GL019253.
Kelly, K. K., A. F. Tuck, L. E. Heidt, M. Loewenstein, J. R. Podolske, S. E.Strahan, J. C. Wilson, and D. Kley (1993), Water vapor and cloud watermeasurements over Darwin during the STEP 1987 tropical mission,J. Geophys. Res., 98, 8713–8724.
Lane, T. P., R. D. Sharman, T. L. Clark, and H.-M. Hsu (2003), An in-vestigation of turbulence generation mechanisms above deep convection,J. Atmos. Sci., 60, 1297–1321.
Lelieveld, J., B. Bregman, F. Arnold, V. Burger, P. J. Crutzen, H. Fischer,A. Waibel, P. Siegmund, and P. F. J. van Velthoven (1997), Chemicalperturbation of the lowermost stratosphere through exchange with thetroposphere, Geophys. Res. Lett., 24, 603–606.
Levizzani, V., and M. Setvak (1996), Multispectral, high-resolution satelliteobservations of plumes on top of convective storms, J. Atmos. Sci., 53,361–369.
Loewenstein, M., H.-J. Jost, J. Grose, J. Eilers, D. Lynch, S. Jensen, andJ. Marmie (2002), ARGUS: A new instrument for the measurement of thestratospheric dynamical tracers, N2O and CH4, Spectrochim. Acta,58(11), 2329–2345.
Mauzerall, D. L., J. A. Logan, D. J. Jacob, B. E. Anderson, D. R. Blake,J. D. Bradshaw, B. Heikes, G. W. Sachse, H. Singh, and B. Talbot (1998),Photochemistry in biomass burning plumes and implications for tropo-spheric ozone over the tropical South Atlantic, J. Geophys. Res., 103,8401–8423.
Murphy, D. M., D. S. Thomson, and M. J. Mahoney (1998), In situ mea-surements of organics, meteoritic material, mercury, and other elementsin aerosols at 5 to 19 km, Science, 282, 1664–1669.
Plumb, R. A., and M. K. W. Ko (1992), Interrelationships between mixingratios of long-lived stratospheric constituents, J. Geophys. Res., 97,10,145–10,156.
Plumb, R. A., W. Heres, J. L. Neu, N. M. Mahowald, J. del Corral, G. C.Toon, E. Ray, F. Moore, and A. E. Andrews (2002), Global tracermodeling during SOLVE: High-latitude descent and mixing, J. Geophys.Res., 107, 8309, doi:10.1029/2001JD001023 [printed 108 (D5), 2003].
Proffitt, M. H., and R. L. McLaughlin (1983), Fast-response dual-beamUV-absorption ozone photometer suitable for use in stratosphericballoons, Rev. Sci. Instrum., 54, 1719–1728.
Ray, E. A., F. L. Moore, J. W. Elkins, G. S. Dutton, D. W. Fahey, H. Vomel,S. J. Oltmans, and K. H. Rosenlof (1999), Transport into the NorthernHemisphere lowermost stratosphere revealed by in situ tracer measure-ments, J. Geophys. Res., 104, 26,565–26,580.
Ray, E. A., F. L. Moore, J. W. Elkins, D. F. Hurst, P. A. Romashkin, G. S.Dutton, and D. W. Fahey (2002), Descent and mixing in the 1999–2000northern polar vortex inferred from in situ tracer measurements, J. Geo-phys. Res., 107(D20), 8285, doi:10.1029/2001JD000961.
Richard, E. C., K. C. Aikin, E. A. Ray, K. H. Rosenlof, T. L. Thompson,A. Weinheimer, D. Montzka, D. Knapp, B. Ridley, and A. Gettelman(2003), Large-scale equatorward transport of ozone in the subtropicallower stratosphere, J. Geophys. Res., 108(D23), 4714, doi:10.1029/2003JD003884.
Ridley, B. A., J. G. Walega, J. E. Dye, and F. E. Grahek (1994), Distributionof NO, NOx, NOy and O3 to 12 km altitude during the summer monsoonseason over New Mexico, J. Geophys. Res., 99, 25,519–25,534.
Roach, W. T. (1967), On the nature of the summit areas of severe storms inOklahoma, Q. J. R. Meteorol. Soc., 93, 318–336.
Rosenlof, K. H. (1995), Seasonal cycle of the residual mean meridionalcirculation in the stratosphere, J. Geophys. Res., 100, 5173–5191.
Ryerson, T. B., et al. (2001), Observations of ozone formation in powerplant plumes and implications for ozone control strategies, Science, 292,719–723.
Thompson, T. L., and K. H. Rosenlof (2003), Accuracy and precision of theNOAA Aeronomy Laboratory pressure temperature instrument on theNASA WB-57F, poster presented at CRYSTAL-FACE Science TeamMeeting, NASA, Salt Lake City, Utah. (available as http://cloud1.arc.nasa.gov/crystalface/presentations_files/1-34_Rosenlof&Thompson.pdf )
Tuck, A. F., et al. (1997), The Brewer-Dobson circulation in the light ofhigh altitude in situ aircraft observations, Q. J. R. Meteorol. Soc., 123, 1–69.
Waibel, A. E., H. Fischer, F. G. Wienhold, P. C. Siegmund, B. Lee, J. Strom,J. Lelieveld, and P. J. Crutzen (1999), Highly elevated carbon monoxideconcentrations in the upper troposphere and lowermost stratosphere atnorthern midlatitudes during the STREAM II summer campaign in 1994,Chemosphere Global Change Sci., 1, 233–248.
Wang, P. K. (2003), Moisture plumes above thunderstorm anvils and theircontributions to cross-tropopause transport of water vapor in midlati-tudes, J. Geophys. Res., 108(D6), 4194, doi:10.1029/2002JD002581.
�����������������������D. J. Cziczo, P. K. Hudson, E. A. Ray, E. C. Richard, and K. H. Rosenlof,
NOAA Aeronomy Laboratory, MS R/AL6, 325 Broadway, Boulder, CO80305, USA. ([email protected])B. C. Daube, C. Gerbig, S. C. Wofsy, and I. Xueref, Department of
Atmospheric Sciences, Harvard University, 29 Oxford Street, Cambridge,MA 02138, USA.R. L. Herman, Jet Propulsion Laboratory, MS 183-401, 4800 Oak Grove
Drive, Pasadena, CA 91109, USA.H.-J. Jost, M. Loewenstein, and J. Lopez, NASA Ames Research Center,
Mail Stop 245-5, Moffett Field, CA 94035-1000, USA.D. Knapp, D. Montzka, B. Ridley, and A. Weinheimer, National Center
for Atmospheric Research, 1850 Table Mesa Drive, Boulder, CO 80307,USA.
D18304 RAY ET AL.: CONVECTIVE INFLUENCE ON THE LOWER STRATOSPHERE
13 of 13
D18304