Evidence for ice particles in the tropical stratosphere from in-situ measurements
18
Atmos. Chem. Phys., 9, 6775–6792, 2009 www.atmos-chem-phys.net/9/6775/2009/ © Author(s) 2009. This work is distributed under the Creative Commons Attribution 3.0 License. Atmospheric Chemistry and Physics Evidence for ice particles in the tropical stratosphere from in-situ measurements M. de Reus 1,2,* , S. Borrmann 1,2 , A. Bansemer 3 , A. J. Heymsfield 3 , R. Weigel 2 , C. Schiller 4 , V. Mitev 5 , W. Frey 2 , D. Kunkel 1,2 , A. K ¨ urten 6 , J. Curtius 6 , N. M. Sitnikov 7 , A. Ulanovsky 7 , and F. Ravegnani 8 1 Max Planck Institute for Chemistry, Particle Chemistry Department, Mainz, Germany 2 Institute for Atmospheric Physics, Mainz University, Germany 3 National Center for Atmospheric Research, Boulder, USA 4 Institute of Chemistry and Dynamics of the Geosphere, Research Centre J ¨ ulich, Germany 5 Swiss Centre for Electronics and Microtechnology, Neuchˆ atel, Switzerland 6 Institute for Atmospheric and Environmental Sciences, Goethe University of Frankfurt, Germany 7 Central Aerological Observatory, Dolgoprudny, Moskow Region, Russia 8 Institute of Atmospheric Sciences and Climate, Bologna, Italy * now at: Elementar Analysensysteme GmbH, Hanau, Germany Received: 19 August 2008 – Published in Atmos. Chem. Phys. Discuss.: 14 November 2008 Revised: 26 August 2009 – Accepted: 27 August 2009 – Published: 18 September 2009 Abstract. In-situ ice crystal size distribution measurements are presented within the tropical troposphere and lower stratosphere. The measurements were performed using a combination of a Forward Scattering Spectrometer Probe (FSSP-100) and a Cloud Imaging Probe (CIP), which were installed on the Russian high altitude research aircraft M55 “Geophysica” during the SCOUT-O 3 campaign in Darwin, Australia. One of the objectives of the campaign was to characterise the Hector convective system, which appears on an almost daily basis during the pre-monsoon season over the Tiwi Islands, north of Darwin. In total 90 encounters with ice clouds, between 10 and 19 km altitude were selected from the dataset and were analysed. Six of these encoun- ters were observed in the lower stratosphere, up to 1.4 km above the local tropopause. Concurrent lidar measurements on board “Geophysica” indicate that these ice clouds were a result of overshooting convection. Large ice crystals, with a maximum dimension up to 400 μm, were observed in the stratosphere. The stratospheric ice clouds included an ice water content ranging from 7.7×10 -5 to 8.5×10 -4 gm -3 and were observed at ambient relative humidities (with re- spect to ice) between 75 and 157%. Three modal lognormal size distributions were fitted to the average size distributions for different potential temperature intervals, showing that the Correspondence to: S. Borrmann ([email protected]) shape of the size distribution of the stratospheric ice clouds are similar to those observed in the upper troposphere. In the tropical troposphere the effective radius of the ice cloud particles decreases from 100 μm at about 10 km alti- tude, to 3 μm at the tropopause, while the ice water content decreases from 0.04 to 10 -5 gm -3 . No clear trend in the number concentration was observed with altitude, due to the thin and inhomogeneous characteristics of the observed cir- rus clouds. The ice water content calculated from the observed ice crystal size distribution is compared to the ice water content derived from two hygrometer instruments. This independent measurement of the ice water content agrees within the com- bined uncertainty of the instruments for ice water contents exceeding 3×10 -4 gm -3 . Stratospheric residence times, calculated based on gravi- tational settling, and evaporation rates show that the ice crys- tals observed in the stratosphere over the Hector storm sys- tem had a high potential of humidifying the stratosphere lo- cally. Utilizing total aerosol number concentration measure- ments from a four channel condensation particle counter dur- ing two separate campaigns, it can be shown that the fraction of ice particles to the number of aerosol particles remaining ranges from 1:300 to 1:30 000 for tropical upper tropospheric ice clouds with ambient temperatures below -75 ◦ C. Published by Copernicus Publications on behalf of the European Geosciences Union.
-
Upload
independent -
Category
Documents
-
view
2 -
download
0
Transcript of Evidence for ice particles in the tropical stratosphere from in-situ measurements

Atmos. Chem. Phys., 9, 6775–6792, 2009www.atmos-chem-phys.net/9/6775/2009/© Author(s) 2009. This work is distributed underthe Creative Commons Attribution 3.0 License.
AtmosphericChemistry
and Physics
Evidence for ice particles in the tropical stratospherefrom in-situ measurements
M. de Reus1,2,*, S. Borrmann1,2, A. Bansemer3, A. J. Heymsfield3, R. Weigel2, C. Schiller4, V. Mitev5, W. Frey2,D. Kunkel1,2, A. Kurten6, J. Curtius6, N. M. Sitnikov7, A. Ulanovsky7, and F. Ravegnani8
1Max Planck Institute for Chemistry, Particle Chemistry Department, Mainz, Germany2Institute for Atmospheric Physics, Mainz University, Germany3National Center for Atmospheric Research, Boulder, USA4Institute of Chemistry and Dynamics of the Geosphere, Research Centre Julich, Germany5Swiss Centre for Electronics and Microtechnology, Neuchatel, Switzerland6Institute for Atmospheric and Environmental Sciences, Goethe University of Frankfurt, Germany7Central Aerological Observatory, Dolgoprudny, Moskow Region, Russia8Institute of Atmospheric Sciences and Climate, Bologna, Italy* now at: Elementar Analysensysteme GmbH, Hanau, Germany
Received: 19 August 2008 – Published in Atmos. Chem. Phys. Discuss.: 14 November 2008Revised: 26 August 2009 – Accepted: 27 August 2009 – Published: 18 September 2009
Abstract. In-situ ice crystal size distribution measurementsare presented within the tropical troposphere and lowerstratosphere. The measurements were performed using acombination of a Forward Scattering Spectrometer Probe(FSSP-100) and a Cloud Imaging Probe (CIP), which wereinstalled on the Russian high altitude research aircraft M55“Geophysica” during the SCOUT-O3 campaign in Darwin,Australia. One of the objectives of the campaign was tocharacterise the Hector convective system, which appears onan almost daily basis during the pre-monsoon season overthe Tiwi Islands, north of Darwin. In total 90 encounterswith ice clouds, between 10 and 19 km altitude were selectedfrom the dataset and were analysed. Six of these encoun-ters were observed in the lower stratosphere, up to 1.4 kmabove the local tropopause. Concurrent lidar measurementson board “Geophysica” indicate that these ice clouds were aresult of overshooting convection. Large ice crystals, witha maximum dimension up to 400µm, were observed in thestratosphere. The stratospheric ice clouds included an icewater content ranging from 7.7×10⁻⁵ to 8.5×10⁻⁴ g m−3
and were observed at ambient relative humidities (with re-spect to ice) between 75 and 157%. Three modal lognormalsize distributions were fitted to the average size distributionsfor different potential temperature intervals, showing that the
Correspondence to:S. Borrmann([email protected])
shape of the size distribution of the stratospheric ice cloudsare similar to those observed in the upper troposphere.
In the tropical troposphere the effective radius of the icecloud particles decreases from 100µm at about 10 km alti-tude, to 3µm at the tropopause, while the ice water contentdecreases from 0.04 to 10−5 g m−3. No clear trend in thenumber concentration was observed with altitude, due to thethin and inhomogeneous characteristics of the observed cir-rus clouds.
The ice water content calculated from the observed icecrystal size distribution is compared to the ice water contentderived from two hygrometer instruments. This independentmeasurement of the ice water content agrees within the com-bined uncertainty of the instruments for ice water contentsexceeding 3×10⁻⁴ g m−3.
Stratospheric residence times, calculated based on gravi-tational settling, and evaporation rates show that the ice crys-tals observed in the stratosphere over the Hector storm sys-tem had a high potential of humidifying the stratosphere lo-cally.
Utilizing total aerosol number concentration measure-ments from a four channel condensation particle counter dur-ing two separate campaigns, it can be shown that the fractionof ice particles to the number of aerosol particles remainingranges from 1:300 to 1:30 000 for tropical upper troposphericice clouds with ambient temperatures below−75◦C.
Published by Copernicus Publications on behalf of the European Geosciences Union.

6776 M. de Reus et al.: Evidence for ice particles in the tropical stratosphere from in-situ measurements
1 Introduction
Cirrus clouds play a significant role in regulating the radia-tion balance of the Earth-atmosphere system and are, hence,an important component of the Earth’s climate system. Cir-rus clouds can absorb and reradiate outgoing terrestrial ra-diation, and thereby act like a greenhouse gas (warming theatmosphere). At the same time, they can reflect incoming so-lar radiation back to space and cause a cooling of the atmo-sphere. Which process dominates and, hence, the arithmeticsign of the net radiative forcing of cirrus clouds, appears tobe very sensitive to the cloud microphysical and macrophys-ical properties (Lynch et al., 2002). For example, thin cirrusclouds cause a small but positive radiative forcing at the topof the atmosphere, whereas thick cirrus clouds may causecooling (Stephens and Webster, 1981).
Cirrus clouds can also alter the chemical composition ofthe tropopause region by uptake of water and nitric acid(Voigt et al., 2006), while heterogeneous reactions of halo-gen species on the surface of cirrus particles can affect theozone budget of the tropopause region (Borrmann et al.,1996; Solomon et al., 1997).
In addition, cirrus clouds are involved in vertical transportas well as hydration and dehydration of airmasses. Clouddroplets, ice particles, aerosols, and water vapour enter theupper free troposphere by convection and are further trans-ported into the stratosphere by a slower radiatively driven as-cent, giving the airmass enough time to dehydrate by conden-sation and subsequent sedimentation of ice particles (Sher-wood and Dessler, 2001). Overshooting convection pene-trating directly into the stratosphere, however, might hydratethe stratosphere (Chaboureau et al., 2007; Grosvenor et al.,2007; Corti et al., 2008) and thereby contribute to the ob-served increase in stratospheric water vapour concentrations(Oltmans et al., 2000).
In order to quantify the radiative effect of cirrus cloudsand their influence on the water budget and air chemistry,detailed information about their microphysical properties arenecessary. Measurements within cirrus clouds show a widerange of particle shapes, sizes, and concentrations (Heyms-field and McFarquhar, 2002; Schiller et al., 2008; Kramer etal., 2009). Below, examples of in-situ cirrus particle size dis-tribution measurements are given at mid-latitudes and in thetropics, in the troposphere as well as in the stratosphere.
During the INCA (INterhemispheric differences in Cir-rus properties from Anthropogenic emissions) project, cir-rus measurements were performed in the mid-latitudes of thenorthern and Southern Hemispheres at up to 12 km in alti-tude. In the Northern Hemisphere ice crystals were foundto be smaller and associated with higher ice crystal numberconcentrations compared to the Southern Hemisphere. Themean ice crystal concentration was 2.2 cm−3 in the NorthernHemisphere and 1.4 cm−3 in the Southern Hemisphere, withan effective diameter of 36µm and 42µm, respectively. Nosignificant differences in the ice water content and ice crystal
shape were observed (Gayet et al., 2004). This is in agree-ment with mid-latitude Northern Hemisphere measurementspresented by Strom et al. (1997). They observed a medianice crystal concentration of 2.6 cm−3, while the crystal num-ber distribution peaks at diameters below 10µm. However,artefacts by shattering on the inlet in these datasets cannot beexcluded.
Size distributions of cirrus clouds in the upper tropical tro-posphere, exhibiting a pronounced peak at 10µm, have beenreported by Thomas et al. (2002). They found very thin lay-ers of subvisible cirrus clouds in the outflow of a cumulonim-bus cloud, with ice crystal number concentrations rangingbetween 0.04 and 0.87 cm−3, depending on the exact posi-tion within the cirrus layer. McFarquhar et al. (2000) re-port on a similar thin subvisible cirrus layer over the tropicalcentral Pacific, with a typical ice water content of between10−6 and 10−4 g m−3, maximum ice crystal sizes of between30 and 140µ m, and a positive cloud radiative forcing ofup to 5 Wm−2. In addition, ultrathin tropical troposphericclouds (UTTC) were observed directly beneath the tropicaltropopause, characterised by a very low ice crystal numberconcentration (0.05 cm−3). The different cirrus clouds re-ported in this study, all show a peak in the ice crystal num-ber size distribution at about 10µm diameter. These ultra-thin tropical tropospheric clouds may exist for many hoursas a cloud layer of only 200–300 m thick just a few hundredmeters below the tropical cold point tropopause covering upto 10 000 km2 (Peter et al., 2003). In-situ measurements ofcirriform clouds in the upper tropical troposphere have beenreported by Heymsfield (1986), who found ice crystals (trig-onal plates and columns) with sizes up to 50µm at temper-atures of−83◦C and Knollenberg et al. (1993) who foundhigh concentrations of ice crystals (>10 cm−3) in the anvilsof tropical convective systems.
Ice crystals have also been observed in the stratosphere.Besides polar stratospheric clouds, which are observed atcold temperatures over the Arctic and Antarctic, ice crystalshave been observed in the tropical stratosphere as well. Thepresence of clouds in the tropical stratosphere has been at-tributed to overshooting convection (Chaboureau et al., 2007;Grosvenor et al., 2007; Nielsen et al., 2007; Corti et al.,2008).
This paper shows direct evidence from in-situ measure-ments for the presence of ice crystals in the tropical strato-sphere, immediately above a large convective system, indi-cating direct transport of cloud particles from the troposphereto the stratosphere. Unique in-situ measurements of thecloud particle size distribution ranging from 3µm to 1.5 mmdiameter are presented. In addition, vertical profiles of the to-tal and non-volatile aerosol number concentration are shownand a relationship between the number of measured ice cloudparticles with respect to the available aerosol particles largerthan 10 nm is presented.
Atmos. Chem. Phys., 9, 6775–6792, 2009 www.atmos-chem-phys.net/9/6775/2009/

M. de Reus et al.: Evidence for ice particles in the tropical stratosphere from in-situ measurements 6777
2 Experiment and instrumentation
2.1 The SCOUT-O3 pre-monsoon in Darwin,Australia, 2005
During November and December 2005 four aircraft werestationed in Darwin, Australia for a combined mission ofthe SCOUT-O3 (Stratospheric-Climate Links with Empha-sis on the Upper Troposphere and Lower Stratosphere) andACTIVE (Aerosol and Chemical Transport in Tropical Con-vection) projects. The main goal of the mission was to in-vestigate the transport and transformation of water vapour,aerosol and trace gases in deep convection. Darwin waschosen as the aircraft base for the mission because of theHector storm system, which appears on an almost daily ba-sis over the Tiwi Islands, north of Darwin, during the pre-monsoon season in November and December (Connolly etal., 2006). The storms generated over the islands can reachheights up to 20 km. Hence, Hector events could play animportant role in vertical transport of mass and pollutantsinto the tropical tropopause layer and possibly the lowermoststratosphere. An overview of the objectives, measurementplatforms, instrumentation and performed flights during theSCOUT-O3/ACTIVE campaign is presented by Vaughan etal. (2008), while the meteorological situation is described indetail by Brunner et al. (2008).
As part of the SCOUT-O3 project nine flights were per-formed with the Russian high altitude research aircraft M55“Geophysica”. Ice crystal size distributions were measuredonboard the “Geophysica” using two instruments: a modi-fied Particle Measuring Systems (PMS) Forward ScatteringSpectrometer Probe (FSSP-100) with Droplet MeasurementTechnologies (DMT) high speed electronics (SPP-100) and aDMT Cloud Imaging Probe (CIP).
2.2 Modified FSSP-100 for cloud particle sizedistribution measurements (2.7<Dp<31µm)
The FSSP-100 measures the forward scattering of single par-ticles within a scattering angle of 4–12◦ (Dye and Baumgard-ner, 1984). Using Mie-calculations, the size of a particle isrelated to the measured scattering cross section, which im-plicitly assumes spherical particles. However, for size diam-eters smaller than 16µm it was shown that the FSSP forwardscattering geometry is insensitive towards asphericities forshape aspect ratios larger than 0.5 (Borrmann et al., 2000).Since this study focuses on stratospheric ice crystals, the re-fractive index of ice has been used. The settings of the in-strument during the SCOUT-O3 project allowed the deter-mination of the ice crystal size distribution in 40 size binsbetween 2.7 and 31µm diameter (Dp). Due to ambiguitiesin the Mie scattering curve and the low observed ice crys-tal number concentrations, the size distributions presented inthis paper have been combined into 7 size bins.
The uncertainty of the ice crystal number concentrationmeasured by the FSSP is mainly determined by the uncer-tainty in the sample volume, which has been estimated tobe 20% (Baumgardner et al., 1992). At low particle numberconcentrations the uncertainty due to counting statistics hasto be taken into account, which is defined as the square rootof the number of particles measured. Secondly, it has beenrecognized that shattering of large ice crystals on the hous-ing of the FSSP and CIP probe may produce large numbersof small particles, which, under certain circumstances, canlead to incorrect measurements of particle size distributionsand subsequently derived microphysical properties (McFar-quhar et al., 2007). Due to the relatively low ice crystal num-ber concentrations of relatively large ice crystals and the factthat the size of the largest ice crystal did not exceed 500µmin the upper tropical troposphere and lower stratosphere, itis not likely that shattering has significantly influenced themeasurements presented in this study. This will be discussedin detail in Sect. 4.2.
For calculating the particle volume and mass concentra-tion, additionally the uncertainty in the particle sizing is im-portant, which is dependent on particle shape, ambiguitiesin the Mie curve and uncertainties in the refractive index ofthe particles. Baumgardner et al. (1992) estimated the overalluncertainty of the FSSP volume concentration measurementsto be 60%. Uncertainties due to coincidence are not impor-tant for the ice clouds analysed in this paper due to the verylow ice crystal number concentration.
2.3 CIP for cloud particle size distributionmeasurements (25<Dp<1550µm)
The CIP is a two dimensional optical array probe followingthe initial design from Knollenberg et al. (1970). Two di-mensional shadow images of particles are obtained by a lin-ear array of 64 light detectors as they obscure a laser beam ata rate proportional to the airspeed. At 190 ms−1, the typicalcruising speed of the Geophysica in the upper troposphereand lower stratosphere, this corresponds to a sampling rateof 7.6 MHz at the 25µm resolution of the CIP. Each sampleof the 64 elements is called a slice; up to 128 slices com-pose a particle image. The resolution of the resulting parti-cle image is 25×25µm, leading to a detectable particle sizerange of 25–1550µm (62×25µm). Due to an underestima-tion of the airspeed measured by the CIP probe itself, whichresulted from an imprecise calibration of the pressure sensorin the pitot tube, the real resolution was 25×35µm duringthis project. For the particle size calculations this was takeninto account and corrected for.
From the recorded images the particle size has been de-duced using two different size definitions: the minimum andthe maximum dimension. These are defined as the diameterof a circle with the same cross sectional area as the shadedarea of the image and the maximum chord length within the
www.atmos-chem-phys.net/9/6775/2009/ Atmos. Chem. Phys., 9, 6775–6792, 2009

6778 M. de Reus et al.: Evidence for ice particles in the tropical stratosphere from in-situ measurements
particle, respectively. For spherical particles, these two di-ameters are identical.
Incidences of shattering have been removed from the CIPdataset by using a threshold interarrival time of 10−5 s (Fieldet al., 2006). This method assumes that shattering of a largeice crystal causes a burst of small particles with very shortinterarrival times, which can be distinguished from the longerinterarrival times of real cloud particles in a cirrus cloud.
Particles shading the first or the last diode of the arrayare removed from the dataset. Since mainly small particles(Dp<400µm) were observed in this project, this will notlead to a high rejection rate of observed particles. In addi-tion, particles are rejected when the ratio of the shaded areaof the particles to the area of a circle with the maximum di-mension is below 0.1. This eliminates many bad particles,for example “streakers” which are caused by splash or shatterproducts travelling slower than the true airspeed through thesample volume. This rejection criterion also removes mostof the images containing two particles.
The data acquisition system of the CIP is first started whenthe diode array detects a shaded diode, which leads to the lossof the first slice of each particle image. This lost leading slicehas been reconstructed by duplicating the first recorded slice(i.e. the second slice of the particle image) and then removinga pixel from each edge of this slice, until at least half of thepixels are gone. This reconstructed slice is inserted as slicezero in the image.
Image frames which show no shaded pixels are assumedto have triggered the data acquisition program, but only lefta signal in the first, non recorded, slice. These particles areassumed to have a maximum dimension of 43µm (1 pixel of25×35µm).
The size of out of focus particles has been corrected ac-cording to Korolev et al. (2007). This also includes a correc-tion in the sample volume of the instrument.
Analogous to the FSSP, the uncertainty in the particlenumber concentration measured with the CIP is mainly deter-mined by the uncertainty in the sample volume and, for lowparticle concentrations, by counting statistics. The samplevolume has been calculated using the entire-in method de-scribed by Heymsfield and Parrish (1978). The sample vol-ume increases with increasing particle size, thus compensat-ing for the decrease in concentration with increasing crystalsize. The uncertainty in the sample volume is estimated tobe 20%, similar as for the FSSP. Additional uncertainty inthe sample volume is caused by the relatively high aircraftspeed of the Geophysica aircraft (up to 200 ms−1), due tothe non-zero electronic response time of the CIP instrument(Baumgardner and Korolev, 1997).
In order to calculate the particle size distribution and vol-ume concentration, the uncertainty in the particle size has tobe taken into account. The uncertainty in the particle sizedecreases considerably with particle size and is±25µm forparticles>50µm diameter. The intensity of the laser lighton a diode has to decrease by more than 50% to be recorded
as shadowed. This means that theoretically a 25µm parti-cle which passes exactly over the middle of two diodes willbe recorded as a 50µm particle, but also a 74.9µm particlewill be interpreted as a 50µm particle when it completelyshadows two diodes and partially shadows two more by only49.8%. For the first particle size bin, with a nominal sizeof 25µm diameter, particles could have a diameter between12.5 and 49.9µm. The non-zero response time of the photo-diodes causes an additional uncertainty in the measured par-ticle size at high airspeed (Strapp et al., 2001). Moreover, theparticle diameter derived from the measurements depends onthe chosen definition of the particle size. To demonstrate thisuncertainty, ice crystal size distributions using the minimumand maximum dimensions of the particle are shown in Fig. 1.
2.4 Combined number size distributions from themodified FSSP-100 and the CIP
In this paper data of the FSSP and CIP are combined to at-tain ice crystal size distributions for particles with a diameterbetween 3µm to 1.5 mm. Figure 1 shows an example of acombined size distribution which was observed in the strato-sphere, 0.7 km above the local tropopause, over the Tiwi is-lands on 30 November 2005 (see Sect. 3.3). Additionally, theinterarrival time distribution for the ice crystals observed bythe CIP is shown for this time period, indicating the differentdistributions of the ice crystals in natural cirrus clouds andshattered crystal fragments. During the selected time period3009 ice crystals were recorded by the CIP. From these, 199particles are rejected based on the interarrival time criterion(6.6%), 15 (0.5%) because their area ratio was smaller than0.1 and 347 (11.5%) because the shadow image touched oneof the end diodes. Note that ice crystal images can be rejectedby different criteria at the same time. The ice crystal sizedistribution measured by the CIP, shown in Fig. 1, is there-fore based on a total of 2479 ice crystals, which is 82% ofthe total recorded images during this time period. The FSSPcounted 938 ice crystals during the same time period, whichnevertheless results in higher concentrations than have beenobserved by the CIP, because of the up to 10 times smallersample volume of the FSSP compared to the CIP.
A good agreement between the CIP and FSSP in the over-lap region was observed during this time period. However,this was not always the case for the measurements duringthe campaign. Note that the overlap region is very small andthe uncertainty of the CIP for particles smaller than 100µmis large due to the relatively large sizing uncertainty for thissize range and potential losses of particles with sizes smallerthan 100µm (Korolev et al., 1998). A large difference in thesize distribution can be observed for the different size defini-tions. In the remainder of this paper the maximum diameteris used for characterising the size of the ice crystals. Theuncertainty in the measured number concentrations, which isdisplayed in Fig. 1 is the sum of the uncertainty in sample
Atmos. Chem. Phys., 9, 6775–6792, 2009 www.atmos-chem-phys.net/9/6775/2009/

M. de Reus et al.: Evidence for ice particles in the tropical stratosphere from in-situ measurements 6779
(c)
(d)
Figure 1. (a) Ice crystal size distribution observed in the tropical stratosphere, 0.7 km above
the local tropopause, over the Tiwi islands on November 30, 2005 (event 1 in Figure 6). The
ice crystal size distribution has been composed from FSSP and CIP data. For the CIP data the
maximum and minimum dimension are shown. (b) Interarrival time distribution for the ice
crystals observed by the CIP for this time period, indicating the crystals which are produced
by shattering and therefore have been removed from the data set. (c) Ice crystal images
recorded by the CIP instrument for this time period. (d) Example of larger ice crystals
observed on November 28, 2005 at 10 km altitude.
33
Fig. 1. (a) Ice crystal size distribution observed in the tropical stratosphere, 0.7 km above the local tropopause, over the Tiwi islands on30 November 2005 (event 1 in Fig. 6). The ice crystal size distribution has been composed from FSSP and CIP data. For the CIP data themaximum and minimum dimension are shown.(b) Interarrival time distribution for the ice crystals observed by the CIP for this time period,indicating the crystals which are produced by shattering and therefore have been removed from the data set.(c) Ice crystal images recordedby the CIP instrument for this time period.(d) Example of larger ice crystals observed on 28 November 2005 at 10 km altitude.
volume and counting statistics. For clarity reasons, in othergraphs the error bars have been omitted.
From the number size distributions the volume size distri-bution and total mass (ice water content) can be calculatedwhich is explained in Sect. 3.2.
2.5 Ice water content determination from hygrometermeasurements
Besides calculating the ice water content from the observedice crystal size distributions, the ice water content was alsomeasured independently using two hygrometers. Thetotalwater content(gas-phase+particulate) has been measured us-ing the Lyman-α hygrometer FISH (Fast In-Situ Hygrome-ter; Zoger et al., 1999), which is equipped with a forwardfacing inlet. Ice particles are over-sampled with an enhance-ment depending on altitude and cruising speed of the air-craft, which has been corrected for. The sampling charac-teristics of the FISH inlet on the Geophysica research air-craft have been determined by computational fluid dynam-ics modeling (Kramer and Afchine, 2004). As shown in thispublication, the aspiration coefficient (or enhancement fac-tor) of the aircraft inlet increases from its minimum value(i.e. 1–2) for particles with radii smaller than 0.3µm to itsmaximum value which is typically achieved for particle radiilarger than 3–4µm. Since the IWC is mainly determinedby particles larger than 3–4µm in diameter (see Fig. 2) a
constant enhancement factor can be applied. For typical Geo-physica cruising altitude and speed, the enhancement factorfor particles with radii larger than 4µm is 9 (Schiller et al.,2008). The accuracy of the FISH instrument is typically bet-ter than 6% and the precision is 0.2 ppm for water vapourmixing ratios of 3 ppm.
The gas phase water vapour contenthas been measuredusing the FLASH (FLuorescent Airborne Stratospheric Hy-grometer) instrument (Sitnikov et al., 2007), with a measure-ment accuracy of 8%. The ice water content is determined bysubtracting the water vapour content measured by FLASHfrom the total water content measured by the FISH instru-ment (see also Schiller et al., 2008).
2.6 Interstitial particle measurements using the COPASinstrument
The interstitial aerosol number concentration has been mea-sured using two COndensation PArticle Counter Systems(COPAS). Each COPAS instrument is a two channel aerosolcounter designed for automated low pressure measurementsof the particle number concentration (Curtius et al., 2005;Weigel et al., 2009). One of the available four channelsis heated to 250◦C, causing volatile particles to evaporate(out of the detectable size range of the COPAS instrument)and meaning that only non-volatile particles are counted.The other three channels are not heated but operated with
www.atmos-chem-phys.net/9/6775/2009/ Atmos. Chem. Phys., 9, 6775–6792, 2009

6780 M. de Reus et al.: Evidence for ice particles in the tropical stratosphere from in-situ measurements
Figure 2. Normalised ice crystal size distributions of the selected cirrus events (black lines).
The median observed size distribution is included as red line. For clarity no error bars are
shown here and no information about the overlapping size region of FSSP and CIP. The
uncertainties are highlighted for a selected size distribution in Figure 1. The thick grey line
shows the ice crystal size distribution calculated using the parameterisation of McFarquhar
and Heymsfield (1997) for the average IWC and ambient temperature in the different
potential temperature bins.
34
Fig. 2. Normalised ice crystal size distributions of the selected cir-rus events (black lines). The median observed size distribution isincluded as red line. For clarity no error bars are shown here andno information about the overlapping size region of FSSP and CIP.The uncertainties are highlighted for a selected size distribution inFig. 1. The thick grey line shows the ice crystal size distributioncalculated using the parameterisation of McFarquhar and Heyms-field (1997) for the average IWC and ambient temperature in thedifferent potential temperature bins.
different temperature settings, resulting in different 50% cut-off diameters of 6, 10 and 14 nm, respectively. The totalaerosol number concentration for particles with diameterslarger than 6, 10 and 14 nm is denoted as N6, N10 and N14.The 50% cut off diameter of the heated channel is 10 nm,therefore, the particle number concentration measured bythis channel is referred to as N10 nv. The number concentra-tion of particles with diameters between 6 and 14 nm (N6−14)has been obtained by subtracting N14 from N6. These parti-cles are so small that they are assumed to be recently formedin the atmosphere by gas to particle conversion processes(Curtius, 2006). They are often called ultrafine or nucleationmode particles.
2.7 Other instrumentation
Ozone mixing ratios have been determined using the FastOZone ANalyzer (FOZAN), which is a chemiluminescencesensor operating with an precision of 0.01 ppm and an accu-racy of 8% (Yushkov et al., 1999). The ambient temperature
has been measured using a Thermo Dynamic Complex(TDC) probe with an accuracy of 0.5 K. Other parameterssuch as position and true air speed have been adopted fromthe onboard navigational system UCSE (Unified Communi-cations for Systems Engineer) of the “Geophysica” aricraft.
3 Observations of ice crystals in the outflow ofconvective clouds
During the SCOUT-O3 campaign nine flights were per-formed with the high altitude research aircraft M55 “Geo-physica” from Darwin, Australia. Five flights focussed onin-situ measurements of the Hector storm system, while dur-ing the remaining four survey flights remote sensing of watervapour, cirrus, and trace gases was prioritised. During theHector flights the aircraft did not penetrate the Hector stormsystem itself, because of aircraft safety reasons, but mainlyprobed the outflow from the storm system in the upper tro-posphere and overshooting convection in the lower strato-sphere. During the survey flights measurements were per-formed in cirrus clouds as well, however these were not di-rectly connected to the Hector storm system. The FSSP-100was operated on all Hector flights and three survey flights,while the CIP provided reliable data on four Hector flightsand one survey flight. In this paper we focus on those fiveflights during which the FSSP and CIP instruments wereoperated simultaneously, i.e. the flights on 25, 28, 29 and30 November (double flight), 2005.
Between the selected flights, the tropopause heights (de-fined by the in-situ measured cold point temperature) rangedin altitude from 16.8 to 18 km, partly because of the vicinityof the strong convective system. This corresponds to a coldpoint temperature ranging between−84 and−88◦C (Brun-ner et al., 2008).
Within the data sets a cirrus encounter was defined as atime period of at least 30 s in which particles with sizes be-yond the lower detection limit of the FSSP-100 (2.7µm di-ameter) were detected at temperatures below−35◦C. Whenthe aircraft changed altitude, the averaging times were ad-justed to ensure that the average was taken over an altituderange not exceeding 1 km. In addition, for longer encoun-ters with cirrus clouds more averages were made so that themaximum averaging time was 430 s. In total 90 cirrus en-counters, between 10 and 19 km altitude, were selected withan average duration of 138 s (corresponding to a horizontaldistance of about 26 km).
For each cirrus encounter the ice crystal size distributionhas been calculated by combining the data of the FSSP andCIP. To put the observed ice crystal size distribution data inan atmospheric perspective, other parameters (e.g. temper-ature, pressure, altitude) have been averaged over the sametime period.
Atmos. Chem. Phys., 9, 6775–6792, 2009 www.atmos-chem-phys.net/9/6775/2009/
M. de Reus et al.: Evidence for ice particles in the tropical stratosphere from in-situ measurements 6781
3.1 Ice crystal size distributions
The ice crystal size distributions (normalised to a totaldN/dlogDp value of 1) of the 90 cirrus encounters are pre-sented in Fig. 2 in potential temperature bins of 10 to 20 de-grees. Ice crystals observed at potential temperatures exceed-ing 385 K are clearly situated in the stratosphere. The regionbetween 365 and 385 K is influenced by tropospheric andstratospheric airmasses and is referred to as the tropopauseregion, while air masses below 365 K are within the tropo-sphere. From Fig. 2 it is unambiguous that ice crystals havebeen observed in the stratosphere. The five stratospheric sizedistributions shown in the upper panel of Fig. 2 are all ob-served during the first flight on 30 November when the Geo-physica aircraft encountered an area with ice crystals in thetropical stratosphere directly over the Hector convective sys-tem. A detailed discussion about these stratospheric ice crys-tals and its origin can be found in Sect. 3.3.
The majority of the ice crystal number size distributionspeak between 6 and 15µm diameter. Only 7% of the dis-tributions show a monotonically decreasing distribution withsize, with a maximum number concentration at sizes below3µm diameter, which could be due to the more recent for-mation of small ice crystals (Schroder et al., 2000) or sub-limation of larger ice crystals. Since we have no additionalinformation about the age of the different ice clouds, this hasnot been studied in detail. From Fig. 2 it can also be seenthat the largest particles, up to 1 mm maximum dimension,are observed in the lowest potential temperature bin. Whileascending to the tropopause region the size of the largest ob-served ice crystal decreases. Larger particles, with a max-imum dimension up to 400µm, are observed again in thestratosphere.
In order to learn more about the shape of the size distri-bution two/three modal lognormal size distributions were fit-ted to the median normalised size distribution in each poten-tial temperature bin (red lines in Fig. 2). The number con-centration, mean mode diameter and standard deviation ofeach mode describing the lognormal distribution are givenin Table 1. When ascending from the lowest level in thetroposphere to the tropopause region, the mean mode diam-eter of the smallest modes shifts to smaller sizes and thelargest mode even disappears in the upper troposphere andtropopause region. For example the mean mode diameter ofthe second mode decreases from 35µm in the middle tro-posphere to 25µm in the upper troposphere, and 18µm inthe tropopause region. The size distributions observed in thestratosphere, however, do not follow this trend, but are simi-lar to the ones observed in the upper troposphere.
Figure 2 also includes normalised ice crystal size distri-butions calculated according to the cirrus parameterisationreported by McFarquhar and Heymsfield (1997). This pa-rameterisation is based on ice crystal size distribution mea-surements in cirrus produced as outflows of deep convec-tion made during the Central Equatorial Pacific Experiment
Table 1. Number concentration (N), mean mode diameter (Dp) andstandard deviation (σ ) for the two/three modal lognormal fitted sizedistributions. Note that the lognormal distribution is fitted to themedian normalised size distribution shown in Fig. 2. The numberconcentration in each mode, however, is then scaled to the mediannumber concentration which is actually observed in the specifiedpotential temperature bin.
N (cm−3) Dp (µm) σ
>385 K 0.044 9 1.550.008 25 1.55
0.0004 65 1.75365–385 K 0.074 6 1.55
0.0009 18 1.55355–365 K 0.034 9 1.55
0.0009 25 1.55345–355 K 0.167 10 1.55
0.026 35 1.550.004 90 1.75
(CEPEX). It is valid for tropical anvil cirrus with an icewater content ranging from 10−4 to 1 g m−3 and an ambi-ent temperature between−20 and−70◦C. The average icewater content and ambient temperature observed within thepotential temperature bins are taken as input for the calcu-lations. The size distributions calculated according to theparameterisation show a similar decrease in ice crystal sizewith increasing potential temperature in the troposphere, butgenerally a more pronounced mode at diameters exceeding100µm is found. Due to the higher ambient temperaturein the stratosphere compared to the tropopause region, thelargest mode, which is absent in the tropopause region, ap-pears again higher up in the stratosphere, as has been ob-served in this study. We have to note, however, that the pa-rameterisation is based on size distribution measurements in-side tropical cirrus clouds at temperatures down to−70◦C,while the ambient temperatures in this study were−53,−80,−86, and−83◦C for the bottom to the top panel of Fig. 2,respectively. A discussion of the other reported size distribu-tions can be found below.
A two-modal ice crystal size distribution for crystalssmaller than 60µm diameter has also been retrieved fromsatellite measurements in a cirrus cloud associated with atropical convective system (Eremenko et al., 2005). Thesemeasurements show a bimodal size distribution with a pro-nounced second mode at altitudes exceeding 15 km. Thesmaller mode peaks at about 6µm diameter and the largermode at 20–40µm diameter, comparable to the distributionsshown in this study. The existence of a third mode could notbe confirmed due to the fact that only particles with diameters< 60µm diameter can be retrieved from this satellite mea-surement. Model calculations with a one dimensional micro-physical model by Chen et al. (1997) for a precipitating anvil
www.atmos-chem-phys.net/9/6775/2009/ Atmos. Chem. Phys., 9, 6775–6792, 2009

6782 M. de Reus et al.: Evidence for ice particles in the tropical stratosphere from in-situ measurements
Figure 3. The effective radius (Reff), ice crystal number concentration (N) and ice water
content (IWC) calculated from the ice crystals size distribution presented in Figure 2. The
black markers indicate the ice crystals observed in the stratosphere above the Hector storm
system. On the right axis the approximate altitude is shown corresponding to the potential
temperature on the left axis.
35
Fig. 3. The effective radius (Reff), ice crystal number concentration (N) and ice water content (IWC) calculated from the ice crystals sizedistribution presented in Fig. 2. The black markers indicate the ice crystals observed in the stratosphere above the Hector storm system. Onthe right axis the approximate altitude is shown corresponding to the potential temperature on the left axis.
show a tri-modal cloud particle size distribution. The small-est particles, with a modal value around 10µm diameter,originate mainly from frozen interstitial haze drops, whichnormally do not freeze until the temperature decreases below−40◦C. The medium sized particles (100µm) are mainlyfrom frozen cloud drops and the largest particles (1 mm)mainly from crystal aggregates and rimed ice (Chen et al.,1997). In our study three modes were observed with a meanmode diameter below 100µm, indicating a more compli-cated freezing process or different initial aerosol size distri-bution. The larger mode has not been observed in our mea-surements possibly because the ice crystal size distributionspresented in this study are mainly observed in the (detached)anvil of the Hector convective system and not directly in theHector system itself where precipitation could occur.
3.2 Effective radius and ice water content
From the observed size distributions several parameters havebeen deduced, among them the effective radius, the ice crys-tal number concentration and the ice water content, which areshown in Fig. 3 as a function of the potential temperature.
The effective radius (defined as the ratio of the third tothe second moment of a size distribution, in terms of spheresof equivalent cross-section area; McFarquar and Heymsfield,1998) is one of the key variables that are used for the cal-culation of the radiative properties of clouds, since it is pro-portional to the ratio of the ice water content and the extinc-tion coefficient (Heymsfield et al., 2006). For the selectedtropospheric cirrus events the effective radius ranges from 3
to 100µm and decreases with increasing potential tempera-ture, altitude and decreasing ambient temperature. This canbe explained by preferential lofting of the smaller ice crys-tals in the updraft of large convective cells. The observationof a decreasing effective radius with altitude is in agreementwith observations and model calculations in the tropics pre-sented by Chen et al. (1997), who show a decreasing effec-tive radius with altitude. Also Garrett et al. (2003) observeda decreasing effective radius with decreasing ambient tem-perature in the sub-tropics. They suggest that this is causedby the fact that homogeneous ice nucleation favours smallerice crystals at colder temperatures, due to the exponential de-pendence of the saturation vapour pressure over ice on tem-perature (Karcher and Lohmann, 2002), rather than the effectof ageing of the cirrus cloud or gravitational settling.
The observed total ice crystal number concentration waslow. Within the cirrus clouds it ranged between 0.01 and0.7 cm−3 and shows no clear correlation with potential tem-perature, although the highest ice crystal number concentra-tions are found at lower altitudes. Note here that for the thinand patchy cirrus clouds observed in this study the ice crystalnumber concentration depends very much on the position ofthe aircraft within the cloud and the chosen averaging times.
The ice water content has been calculated from the ob-served ice crystal size distribution using the algorithm pro-posed by Baker and Lawson (2006). They performed a lin-ear regression analysis on the logarithms of the data of a2-dimensional imaging probe to estimate an average mass(M) to area (A) relation of the form M=αAβ . They foundα to be 0.115 andβ to be 1.218, independent of the particle
Atmos. Chem. Phys., 9, 6775–6792, 2009 www.atmos-chem-phys.net/9/6775/2009/

M. de Reus et al.: Evidence for ice particles in the tropical stratosphere from in-situ measurements 6783
habit. This method is not applicable for the FSSP data, sincethis instrument determines the size of ice crystals based ona completely different principle. Therefore, ice crystals inthe FSSP size range are assumed to be solid ice spheres witha density of 0.917 g cm−3. The uncertainty in the resultingIWC has been estimated to be a factor 2 (Heymsfield, 2007).
Following the fact that smaller particles were observedwith increasing potential temperature in the troposphere, theIWC is also found to decrease with increasing potential tem-perature. In the upper troposphere an IWC of 10−5 g m−3
was observed, increasing to 10−2 g m−3 at 340 K, while val-ues between 10−3 and 10−4 g m−3 were found in the strato-sphere. A gradual decrease in ice water content with de-creasing ambient temperature has also been observed by Mc-Farquhar and Heymsfield (1997) in a tropical area at tem-peratures between−20◦C and −70◦C, and by Schiller etal. (2008) for a dataset containing polar, mid-latitude andtropical cirrus clouds at temperatures ranging from−23◦C to−90◦C. Note that the observed IWC is much lower than thevalues reported by Knollenberg et al. (1993) over the samearea and corresponding altitudes but during the monsoon sea-son. These measurements were performed during the STEPTropical Experiment at Darwin in January/February 1987.
The ice water content calculated from the ice crystal sizedistributions has been compared with the ice water contentdetermined from the two hygrometers (FISH and FLASH)and is shown in Fig. 4. The total uncertainty in the derivationof the IWC from the two hygrometer instruments is estimatedto be 20%. It is dependent on the exact position of the inletsof the hygrometers, the calculated enhancement factor of theFISH and the measurement uncertainty of the individual in-struments. For the IWC intercomparison hygrometer data forthree flights on 29 and 30 November (two flights) are used.These data were also included in the evaluation of the ice wa-ter content in Arctic, mid-latitude and tropical cirrus reportedby Schiller et al. (2008).
The data for the IWC derived using these two very dif-ferent methods show a close correspondence over a range ofalmost three orders of magnitude. The values lie, however,not exactly on the 1:1 agreement line. In air masses with alow IWC the hygrometer data attain higher values than theIWC calculated from the ice crystal size distributions. Atlarger IWC, the two measurements seem to agree much bet-ter. Considering the entire dataset shown in Fig. 4, 97% ofthe data points lie within a factor of four of the 1:1 line. Forice water contents exceeding 3×10⁻⁴ g m−3 the IWC deter-mined by the two very different measurement methods agreewithin the combined uncertainty of the instruments (i.e. afactor of 2.2 as indicated by the thin solid lines in Fig. 4). Atlow IWC, the ice crystal size distribution mainly consists ofsmall particles, so that the FSSP size range contributes morethan 50% to the observed IWC (see red markers in Fig. 4).Here, the IWC is underestimated by the microphysical mea-surements, indicating that shattering is not a problem for themicrophysical probes at these low IWCs, since in the case
Figure 4. Comparison of the ice water content derived from the size distribution
measurements to the IWC obtained from the hygrometer instruments. The thin solid lines
represent a deviation from the 1:1 line (thick solid line) with a factor 2.2, which corresponds
to the combined uncertainty of both methods. The data points are averages over at least 30
seconds and correspond to the ice cloud encounters on November 29 and the two flights of
November 30 from Figure 3.
36
Fig. 4. Comparison of the ice water content derived from the sizedistribution measurements to the IWC obtained from the hygrome-ter instruments. The thin solid lines represent a deviation from the1:1 line (thick solid line) with a factor 2.2, which corresponds tothe combined uncertainty of both methods. The data points are av-erages over at least 30 s and correspond to the ice cloud encounterson 29 November and the two flights of 30 November from Fig. 3.
of shattering the IWC as derived from the FSSP should havebeen overestimated. Since the discrepancy between hygrom-eter IWC and size distribution IWC appears mainly at lowIWC, where the IWC is determined by the size range of theFSSP, the main problem nevertheless might be inherent inthe FSSP measurements. In this case, the ice crystal numberconcentration is underestimated by the FSSP, probably due toan uncertainty of the FSSP sample volume. Also it should bekept in mind that the lower size detection limit of the FSSPwas set to 3µm and that smaller ice particles may well con-tribute significantly at very low IWC. We can, however, notexclude that the hygrometers have a larger uncertainty in thisIWC range because at these low IWC values two large num-bers of the same order of magnitude are subtracted for itscalculation.
3.3 Ice crystals in the stratosphere
On 30 November 2005 a flight was performed to investigatethe Hector convective system. The flight track of this flightis shown in Fig. 5. A large part of the flight was conducted inthe stratosphere above the Hector system. According to thepilot’s report the aircraft succeeded to pass there through avisible hazy area twice. From the FSSP data six time periodscould be selected during which ice crystals were observedfor at least 30 s. Unfortunately, CIP data during one timeperiod (No. 5) was lost during the disc write cycles. Theice crystal size distributions of the five remaining time pe-riods are shown in Fig. 2 (top panel), while the parameterscharacterising the ice crystal size distribution and the mete-orological situation are summarised in Table 2. Moreover,in Fig. 6a the time series of temperature, altitude, ice crystal
www.atmos-chem-phys.net/9/6775/2009/ Atmos. Chem. Phys., 9, 6775–6792, 2009

6784 M. de Reus et al.: Evidence for ice particles in the tropical stratosphere from in-situ measurements
Table 2. Average values of different meteorological variables and parameters derived from the ice crystal size distribution during the timeperiods in which ice crystals were observed in the stratosphere on 30 November (the number of the event corresponds to the number shownin Fig. 6).
1 2 3 4 5 6
Altitude (km) 18.0 18.0 18.4 18.4 18.7 18.2Temperature (◦C) −81.7 −87.1 −83.9 −84.1 −80.9 −83.2Pressure (hPa) 78.3 77.6 72.1 72.8 68.3 74.8Pot. Temp. (K) 396 386 401 399 414 398RHi (%) 76 157 95 107 75 89N (cm−3) 0.10 0.30 0.015 0.048 – 0.050IWC1 (µg L−1) 0.85 0.64 0.10 0.077 – 0.21IWC2 (µg L−1) 1.3 0.99 0.16 0.16 0.072 0.40Reff (µm) 25.3 17.9 23.6 11.5 – 19.5Rmean (µm) 9.3 4.6 7.7 5.1 – 7.1
1 IWC derived from the observed ice crystal size distribution.2 IWC derived from the two hygrometer measurements.
Figure 5. Flight track of the M55-Geophysica on November 30, 2005. The red symbols
indicate the geographical position where the ice crystals were observed in the stratosphere.
37
Fig. 5. Flight track of the M55-Geophysica on 30 November 2005.The red symbols indicate the geographical position where the icecrystals were observed in the stratosphere.
number concentration, relative humidity, ozone mixing ratioand total water content for the stratospheric part of the flighton 30 November 2005 are shown. In this figure the selectedtime periods are shaded and the events are numbered.
Finally Fig. 6b shows the vertical profile of aerosol andcloud particles below the aircraft, as observed by a down-ward looking Miniature Aerosol Lidar (MAL), which allowsobservations as close as 160 m from the aircraft (Mitev et al.,2002; Corti et al., 2008).
The ice crystals were observed at altitudes between 18 and18.7 km, at temperatures between−81 to −87◦C and pres-sures ranging from 68 to 78 hPa, which corresponds to a po-tential temperature level between 386 and 414 K. The coldpoint tropopause was situated at 17.3 km altitude during this
day, hence, the ice crystals were observed between 0.7 to1.4 km above the tropopause. During four events the air wassub-saturated with respect to ice (RHi varied between 75 and95}) indicating a cloud in its decaying state. The remain-ing two time periods (2 and 4) show a supersaturation, withan average relative humidity over ice of 107% and 157%,respectively, which indicates either recent ice crystal forma-tion or direct injection of troposperic ice crystals by recentupdraft from the troposphere.
The ice crystal size distribution can be characterised bythe effective radius Reff (i.e. the area weighted mean radiusof the ice particles), or by the geometric mean radius Rmean(i.e. the number weighted mean size radius). During the fiveselected time periods, Reff ranged between 12 and 25µmand Rmean between 4.6 and 9.3µm. The ice water contentcalculated from the observed ice crystal size distribution var-ied between 7.7×10⁻⁵ and 8.5×10⁻⁴ g m−3 and was withina factor of two from the IWC derived from the two hygrome-ters. Note that the observed IWC are larger by several ordersof magnitude than those of the climatology at these low tem-peratures (Schiller et al., 2008).
By looking at Fig. 6a closely it can be seen that forevents 2, 3 and 4, the increase in ice crystal number concen-tration corresponds with a decrease in O3 mixing ratio andtemperature, which is indicative for updraft of troposphericair into the stratosphere. Moreover, backscatter ratio profilesobserved by the lidar on board show remnants of a convec-tive system directly below the aircraft at times when the largetotal water mixing ratios and high ice crystal number concen-trations were observed in the stratosphere. Corti et al. (2008)investigated one of the events in detail and found that the ob-served IWC was much too high to be formed in-situ. Hence,the ice crystals in the stratosphere likely result from over-shooting convection of the Hector system.
Atmos. Chem. Phys., 9, 6775–6792, 2009 www.atmos-chem-phys.net/9/6775/2009/

M. de Reus et al.: Evidence for ice particles in the tropical stratosphere from in-situ measurements 6785
Figure 6. (a) Ten second averaged values of the temperature, altitude, relative humidity, ice
crystal number concentration (N), total water content (H2Otot) and O3 mixing ratio during the
stratospheric part of the flight on November 30, 2005. (b) Backscatter ratio below the aircraft
as measured by the downward looking lidar MAL. The black solid curve is the flight altitude.
Note that the local tropopause was situated at 17.3 km altitude on November 30, 2005, which
corresponds to the bottom of graph 6b.
38
Fig. 6. (a) Ten second averaged values of the temperature, altitude, relative humidity, ice crystal number concentration (N), total watercontent (H2Otot) and O3 mixing ratio during the stratospheric part of the flight on 30 November 2005.(b) Backscatter ratio below theaircraft as measured by the downward looking lidar MAL. The black solid curve is the flight altitude. Note that the local tropopause wassituated at 17.3 km altitude on 30 November 2005, which corresponds to the bottom of graph 6b.
The other events do not show a clear tropospheric signa-ture, which might be a result of mixing of tropospheric andstratospheric air. Another possible explanation for the miss-ing tropospheric signature in these air parcels might be thatthe ice crystals are formed in-situ in the stratosphere analo-gous to a pileus cloud. This can be excluded here, becausethe observed ice crystals are much too large and the observedtotal ice water content is much too high for in-situ ice forma-tion. Garrett et al. (2006), for example, show a pileus cloudwith effective radii between 2 and 4µm. However, also dur-ing these time periods indicated in Fig. 6 the lidar shows icecrystals down to the local tropopause, indicating overshoot-ing convection as source for the ice crystals.
The terminal settling velocities of the ice crystals ob-served in the stratosphere have been calculated after Mitchelland Heymsfield (2005) in order to determine their residencetimes in the stratosphere and thereby their potential for hu-midifying the stratosphere. Note that for these calculationsthe size of the ice crystals is kept constant which implies thatthe reduction in size of the ice crystals by sublimation hasnot been taken into account. Figure 7 shows the stratosphericresidence times for the ice crystal sizes based on gravitationalsettling only and for those sizes observed during event 1 inFig. 6. As vertical travelling distance the height above the
tropopause (i.e. 0.7 km for event 1) was used. The grav-itational settling velocity ranges from 0.001 cm s−1 for icecrystals with a size of 3.7µm to 54 cm s−1 for 438µm sizedparticles. Consequently, the residence time ranges from 0.5 hto several days.
In order to make an estimate of the ice water which willevaporate within the stratosphere, evaporation times of icecrystals of a certain size have been calculated according toPratte et al. (2006), using the observed temperature and RHias input values. They determined evaporation rates of icecrystals at upper tropospheric temperatures from laboratorymeasurements using a Knudsen flow reactor, resulting inlower values than those given in the literature. Therefore,we used the minimum and maximum rate reported by Pratteet al. (2006) to calculate a range of evaporation times (greyarea in Fig. 7). The given range of evaporation rates leadsto a large range of evaporation times. For example, 150µmice crystals would evaporate within one hour using the fastevaporation rate or one day using the slow evaporation rate.
From Fig. 7 it can be seen that even at the lowest evap-oration rate all ice crystals smaller than 50µm will evap-orate within the stratosphere, corresponding to an IWC of0.66µg L−1, which is 77% of the total IWC measured dur-ing this event. For the highest evaporation rate even 92%
www.atmos-chem-phys.net/9/6775/2009/ Atmos. Chem. Phys., 9, 6775–6792, 2009

6786 M. de Reus et al.: Evidence for ice particles in the tropical stratosphere from in-situ measurements
Figure 7. Evaporation (grey area) and stratospheric residence times (blue line) for the ice
crystals observed in event 1 of Figure 6 assuming that the ice crystals occurred 0.7 km above
the local tropopause. The accumulated ice water content calculated from the measured ice
crystal size distribution is given as red solid line on the right axis.
39
Fig. 7. Evaporation (grey area) and stratospheric residence times(blue line) for the ice crystals observed in event 1 of Fig. 6 assumingthat the ice crystals occurred 0.7 km above the local tropopause.The accumulated ice water content calculated from the measuredice crystal size distribution is given as red solid line on the rightaxis.
of the ice will evaporate in the stratosphere. For the otherstratospheric ice clouds which were found in a subsaturatedenvironment 47–92% (event 3) and 40–95% (event 6) of thetotal IWC will evaporate in the stratosphere.
The amount of ice evaporating in the stratosphere calcu-lated above constitutes a lower limit, since by mixing ofair masses the relative humidity of the air parcel contain-ing the ice crystals will diminish leading to faster evapo-ration. By evaporation the size of the ice crystals will de-crease, which reduces their fall speed and hence increasestheir stratospheric residence time.
The shape of small particles (<100µm) cannot be deter-mined from the CIP images, since they simply consist oftoo few pixels. The shape of the larger particles observedin the stratosphere, however, has been investigated qualita-tively. They were mainly aggregates and columns. Spher-ical objects were not observed, which indicates that largefrozen droplets from the main updraft were not carried intothe stratosphere in significant numbers. Detailed modellingof the cloud microphysics of such cumulonimbus clouds isrequired in order to assess the kinds of crystal habits expectedto occur in overshoots.
3.4 Interstitial aerosols
The aerosol number concentrations measured with the CO-PAS instrument during the five investigated flights are shownin Fig. 8. The number concentrations of the interstitialaerosol consisting of non-activated particles in between theice crystals are presented as coloured dots, while the greydots present the particle concentrations measured in clear,cloud and ice particle free air parcels, mainly in the vicin-ity of the cloud. Hence, the coloured dots show the aerosolnumber concentration during time periods where the FSSP
instrument did detect ice crystals, while the grey dots presenttime periods where the FSSP did not detect any ice crystals.
The total aerosol number concentration for particle sizeslarger than 14 nm (N14) decreases with increasing poten-tial temperature from about 200 cm−3 at 355 K to less than20 cm−3 at 435 K. At the same time, the number con-centration of non volatile aerosols (N10 nv) decreases from100 cm−3 to 10 cm−3. Since no information about theaerosol number concentration in the boundary layer is avail-able, no statement can be made about possible enhancedparticle concentrations in the outflow region of convectiveclouds, as has been observed by de Reus et al. (2001) overthe northern Indian Ocean. Ultrafine particles (N6−14) aremainly observed in the troposphere, with concentrationsranging from 10 to more than 1000 cm−3. Particles from pri-mary sources, such as soot from aircraft emissions, mineraldust or primary biological material, are normally larger insize (Seinfeld and Pandis, 2006). Furthermore, the forma-tion of these small particles must have been recent becausenucleation mode particles exist typically only for a few hoursto one day, since the aerosols grow by condensation and arelost by coagulation with larger particles (Curtius, 2006). Alikely place for the formation of the ultrafine particles is inthe outflow of the Hector storm system, because this regionis particularly favourable for new particle formation due tothe relatively high precursor gas concentrations transportedfrom the lower troposphere, a low pre-existing particle sur-face area due to the scavenging by large particles inside thecloud and the low ambient temperature in the outflow re-gion (de Reus et al., 2001). Therefore, it is unlikely that theparticles were transported aloft directly from the boundarylayer within the Hector system and they probably have beenformed in-situ in the outflow. This, however, needs confir-mation by suitable model calculations.
The presence of ultrafine particles in the stratosphericice clouds might indicate recent new particle formation, al-though the observed number concentrations are low com-pared to earlier observations of new particle formation intropical cirrus clouds (Lee et al., 2004).
To investigate the aerosol concentrations inside and out-side of clouds in detail, probability density functions ofthe total aerosol number concentration (N14) are shown inFig. 9. In the upper troposphere (365 K–386 K) the N14concentrations in and out of clouds show similar distri-butions, although somewhat higher aerosol concentrationswere observed in clear air compared to inside clouds. Thismight show the influence of scavenging within the clouds.In the stratosphere (>385 K), mainly concentrations below200 cm−3 were observed. However, a few occasions ofhigher aerosol concentrations were found for both in andout of clouds. These high concentrations mainly occurredduring the flights on 25 and 30 November and were ob-served by all four CPC channels of the two independentCOPAS instruments. Weigel et al. (2008) identified theplumes on 25 November as crossings of the Geophysica’s
Atmos. Chem. Phys., 9, 6775–6792, 2009 www.atmos-chem-phys.net/9/6775/2009/
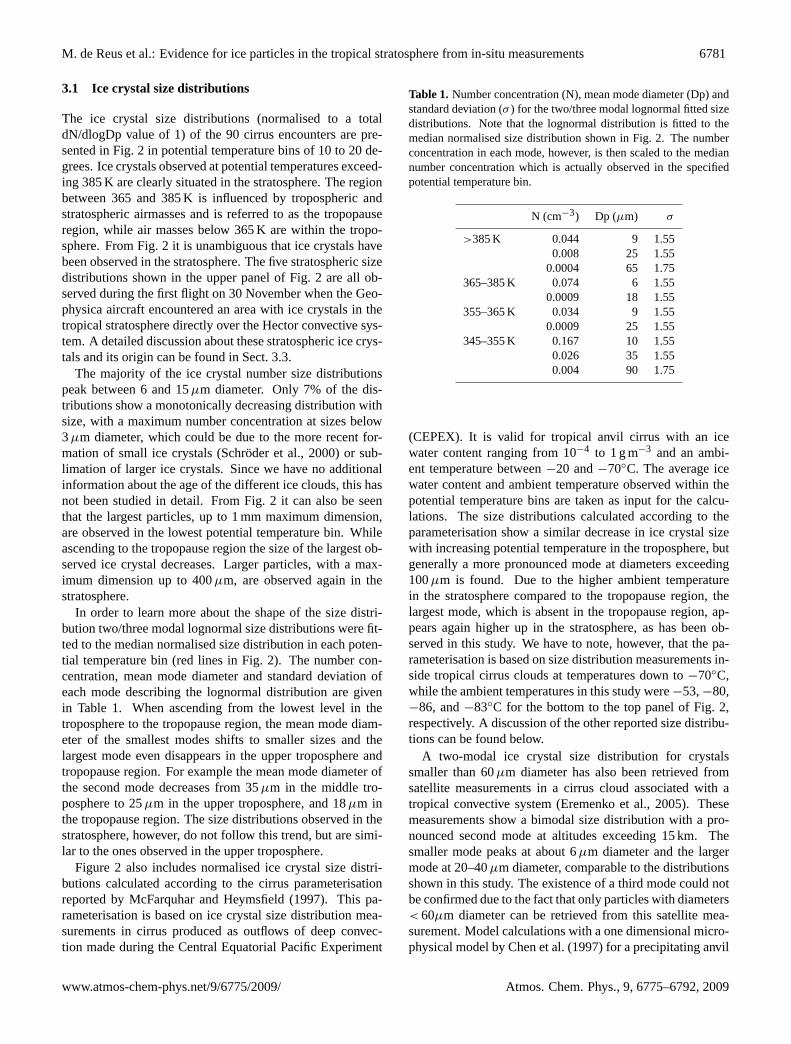
M. de Reus et al.: Evidence for ice particles in the tropical stratosphere from in-situ measurements 6787
Figure 8. Profiles of the total, ultrafine and non-volatile aerosol number concentration for in
(coloured dots) and out of cloud (grey dots) measurements.
40
Fig. 8. Profiles of the total, ultrafine and non-volatile aerosol number concentration for in (coloured dots) and out of cloud (grey dots)measurements.
own exhaust, as the short peaks in the particle number con-centration occurred simultaneously with peaks in the nitro-gen oxide mixing ratio. Unfortunately, for 30 November, nonitrogen oxide measurements are available and the origin ofthe high particle number concentrations in the stratospherecan only be guessed. They might originate from volcaniceruptions, contrail crossings, or from the updraft of aerosolfrom the troposphere in overshooting convection. Note thatafter the evaporation of ice crystals in overshooting convec-tion, higher aerosol concentrations originating from the tro-posphere might prevail in clear air samples as well.
In the potential temperature range between 345 and 365 Khigher aerosol concentrations were found within clouds com-pared to out of cloud measurements, which shows the influ-ence of the convective system. Higher aerosol concentra-tions are lifted up from the boundary layer within the clouds,whereas due to the lack of significant outflow of the convec-tive system in the middle troposphere, the clear air samplesshow relatively low aerosol concentrations at these altitudes(de Reus et al., 2001).
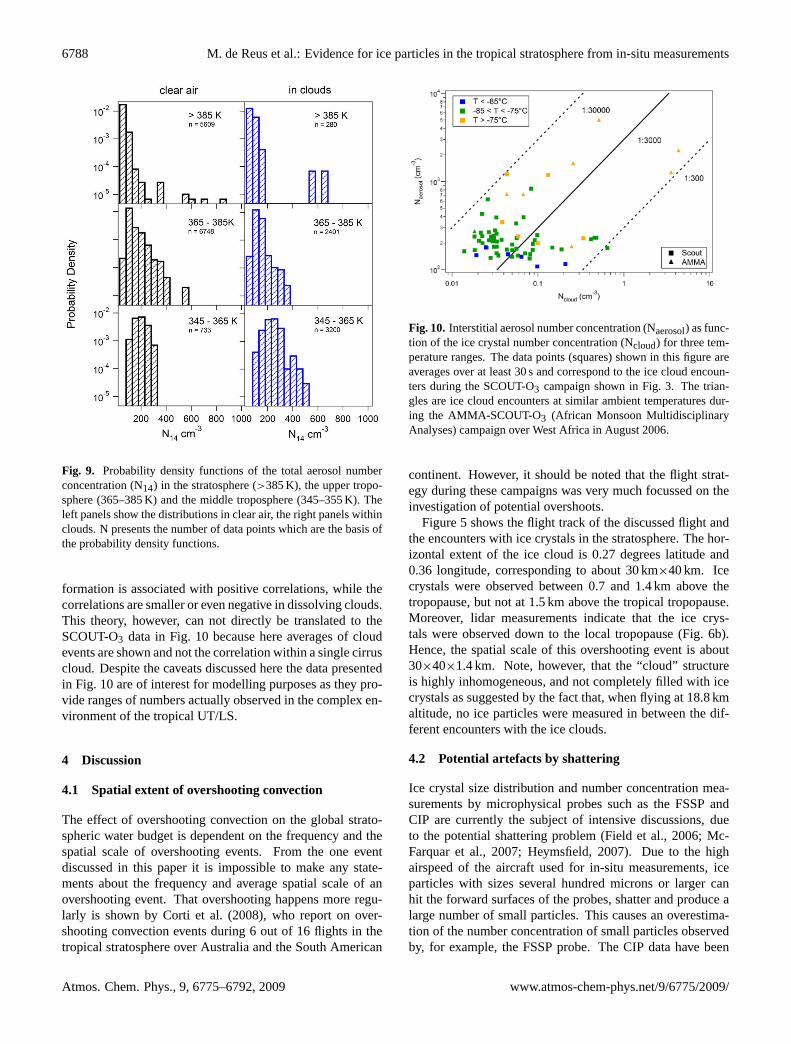
In Fig. 10 the relation between the interstitial particle num-ber concentration and ice crystal number concentration isshown. The idea behind this plot was to find out how manyaerosol particles out of the measured total number of avail-able particles would end up as cloud ice particles. By meansof the three lines presented in Fig. 10 one can see that the ra-tio between interstitial aerosol and ice crystals number densi-ties ranges from 1:300 to 1:30 000 in the data sets from Aus-tralia in 2005 and West Africa (AMMA-SCOUT-O3, BurkinaFaso, August 2006). The data from the AMMA-SCOUT-O3
campaign has been added here to show the range of ratiosin tropical ice clouds under other conditions. During theAMMA-SCOUT-O3 campaign, which was performed duringthe summer over the North African continent, ice clouds inthe upper troposphere were mainly observed in the outflowof large mesoscale convective systems (MSC). In both cam-paigns, during which the same instrumentation and aircraftwas employed, a similar range of ratios was observed. Ra-tios, as high as one ice crystal per a few hundred remainingaerosol particles were observed within tropical ice clouds.However, it is difficult to determine the degree of activationthat occurred with these clouds as there are may factors thatcould affect this ratio as the air parcel ages, such as removalof aerosol by washout, mixing with the local ambient airand with entrained air, that might contain differing levels ofaerosol. Also the ice could have been formed through a vari-ety of processes that are not related to heterogeneous aerosolice activation, such as homogeneous droplet freezing.
Seifert et al. (2004) investigated the relation between theinterstitial particle number concentration and the ice crystalnumber concentration for mid-latitude cirrus clouds in theNorthern and Southern Hemisphere. The observations whichare the basis of this analysis were performed during the twoINCA (Interhemispheric differences in cirrus properties fromanthropogenic emissions) campaigns. They found that thenumber concentrations of interstitial aerosols and ice crys-tals were positively related at low interstitial number con-centrations (<100 cm−3) and negatively correlated at higheraerosol concentrations. They explained this behaviour by dif-ferent phases of the cirrus lifecycle and accordingly cloud
www.atmos-chem-phys.net/9/6775/2009/ Atmos. Chem. Phys., 9, 6775–6792, 2009
6788 M. de Reus et al.: Evidence for ice particles in the tropical stratosphere from in-situ measurements
Figure 9. Probability density functions of the total aerosol number concentration (N14) in the
stratosphere (> 385 K), the upper troposphere (365 - 385 K) and the middle troposphere (345
- 355 K). The left panels show the distributions in clear air, the right panels within clouds. N
presents the number of data points which are the basis of the probability density functions.
41
Fig. 9. Probability density functions of the total aerosol numberconcentration (N14) in the stratosphere (>385 K), the upper tropo-sphere (365–385 K) and the middle troposphere (345–355 K). Theleft panels show the distributions in clear air, the right panels withinclouds. N presents the number of data points which are the basis ofthe probability density functions.
formation is associated with positive correlations, while thecorrelations are smaller or even negative in dissolving clouds.This theory, however, can not directly be translated to theSCOUT-O3 data in Fig. 10 because here averages of cloudevents are shown and not the correlation within a single cirruscloud. Despite the caveats discussed here the data presentedin Fig. 10 are of interest for modelling purposes as they pro-vide ranges of numbers actually observed in the complex en-vironment of the tropical UT/LS.
4 Discussion
4.1 Spatial extent of overshooting convection
The effect of overshooting convection on the global strato-spheric water budget is dependent on the frequency and thespatial scale of overshooting events. From the one eventdiscussed in this paper it is impossible to make any state-ments about the frequency and average spatial scale of anovershooting event. That overshooting happens more regu-larly is shown by Corti et al. (2008), who report on over-shooting convection events during 6 out of 16 flights in thetropical stratosphere over Australia and the South American
Fig. 10. Interstitial aerosol number concentration (Naerosol) as func-tion of the ice crystal number concentration (Ncloud) for three tem-perature ranges. The data points (squares) shown in this figure areaverages over at least 30 s and correspond to the ice cloud encoun-ters during the SCOUT-O3 campaign shown in Fig. 3. The trian-gles are ice cloud encounters at similar ambient temperatures dur-ing the AMMA-SCOUT-O3 (African Monsoon MultidisciplinaryAnalyses) campaign over West Africa in August 2006.
continent. However, it should be noted that the flight strat-egy during these campaigns was very much focussed on theinvestigation of potential overshoots.
Figure 5 shows the flight track of the discussed flight andthe encounters with ice crystals in the stratosphere. The hor-izontal extent of the ice cloud is 0.27 degrees latitude and0.36 longitude, corresponding to about 30 km×40 km. Icecrystals were observed between 0.7 and 1.4 km above thetropopause, but not at 1.5 km above the tropical tropopause.Moreover, lidar measurements indicate that the ice crys-tals were observed down to the local tropopause (Fig. 6b).Hence, the spatial scale of this overshooting event is about30×40×1.4 km. Note, however, that the “cloud” structureis highly inhomogeneous, and not completely filled with icecrystals as suggested by the fact that, when flying at 18.8 kmaltitude, no ice particles were measured in between the dif-ferent encounters with the ice clouds.
4.2 Potential artefacts by shattering
Ice crystal size distribution and number concentration mea-surements by microphysical probes such as the FSSP andCIP are currently the subject of intensive discussions, dueto the potential shattering problem (Field et al., 2006; Mc-Farquar et al., 2007; Heymsfield, 2007). Due to the highairspeed of the aircraft used for in-situ measurements, iceparticles with sizes several hundred microns or larger canhit the forward surfaces of the probes, shatter and produce alarge number of small particles. This causes an overestima-tion of the number concentration of small particles observedby, for example, the FSSP probe. The CIP data have been
Atmos. Chem. Phys., 9, 6775–6792, 2009 www.atmos-chem-phys.net/9/6775/2009/

M. de Reus et al.: Evidence for ice particles in the tropical stratosphere from in-situ measurements 6789
corrected for potential shattering events using the interarrivaltime method proposed by Field et al. (2006). This method as-sumes that the shattering of a large ice crystal causes a burstof small particles with very short interarrival times, whichcan be distinguished from the longer interarrival times of realcloud particles in a cirrus cloud (see Fig. 1b). Since informa-tion about the interarrival times of crystals observed by theFSSP probe is not available, we have investigated the shat-tering problem for our data set by comparing it to a data setwhich is not influenced by shattering as proposed by Heyms-field (2007). This data set, presented by McFarquar andHeymsfield (1997), has been the basis for a parameterisa-tion for cirrus cloud size distributions using the temperatureand total ice water content as input values. This parameteri-sation is valid for cirrus clouds in the outflow region of con-vective clouds, comparable to the ice clouds observed duringthis study. Using the observed IWC and temperature we cal-culated the IWC for the size ranges of the FSSP and CIPand compared this to the IWC measured by the two indi-vidual instruments (see Fig. 11). At low IWC both datasetsshow a similar distribution of the ice water content betweenthe two observed size ranges, while at higher IWC the IWCmeasured by the FSSP is below the value predicted by theMH97 parameterisation. When shattering occurs the IWCfor the FSSP size range should be overestimated, as has beenshown by Heymsfield (2007). Despite the low ice watercontent measured by the FSSP, the linear relation betweenthe IWCFSSPand the IWCCIP at higher IWC (>10−4 g m−3)might be an indication for the occurrence of shattering. Tosummarise, our dataset shows no indication for a severe shat-tering problem for IWC<10−4 g m−3. At higher IWC wecannot exclude the occurrence of shattering although the dis-cussion in Sect. 3.2 in connection with Fig. 4 indicates thatthe influence of shattering seems to be small.
5 Summary and conclusions
Large ice crystals, with sizes up to 400µm maximum di-mension, have been observed in the tropical stratosphere, upto 1.4 km above the local tropopause, directly above the Hec-tor cumulonimbus storm system. These particles have beentransported into the stratosphere by overshooting convectionand are remnants of a very fresh overshooting cumulonim-bus cloud top. The ice water content of the stratosphericice clouds ranged between 7.7×10⁻⁵ and 8.5×10⁻⁴ g m−3.The ice clouds were observed at ambient relative humidities(with respect to ice) between 75 and 157%. Calculations ofthe evaporation rates and stratospheric residence times of theice crystals show that they are likely to have humidified thestratosphere locally, although no estimate of the global sig-nificance could be made here.
In the tropical upper troposphere a decrease in effectiveradius was observed for ice clouds with altitude (or potentialtemperature) ranging from 100µm at about 10 km altitude to
Figure 11. Comparison of the ice water content measured by the FSSP and CIP instruments to
the IWC for the same size ranges calculated using the parameterisation of McFarquar and
Heymsfield (1997).
43
Fig. 11.Comparison of the ice water content measured by the FSSPand CIP instruments to the IWC for the same size ranges calculatedusing the parameterisation of McFarquar and Heymsfield (1997).
3µm at the tropopause. This could also be represented bythree modal lognormal size distributions fitted to the averageobserved size distribution at different potential temperaturelevels. The lognormal distributions show a decrease in meanmode diameter of all three modes when ascending towardsthe tropopause. The ice water content decreases accordinglyfrom 0.04 g m−3 in the middle troposphere to 10−5 g m−3
close to the tropopause. No clear trend in the number con-centration was observed with altitude, due to the thin andinhomogeneous characteristics of the observed cirrus clouds.
A large problem with in-situ ice crystal size distributionmeasurements is shattering of large ice crystals on the hous-ing of the microphysical instruments. A comparison ofthe observed ice crystal distributions with a parameterisa-tion by McFarquar and Heymsfield (1997) indicates that ourdataset shows no indication for a severe shattering problemfor IWC<10−4 g m−3. At higher IWC we cannot excludethe occurrence of shattering although we believe that its in-fluence is low. Moreover, a comparison of the ice water con-tent calculated from the observed ice crystal size distributionwith the ice water content derived from two hygrometer in-struments shows a good agreement for ice water contents ex-ceeding 2×10⁻⁴ g m−3, which is also a good indication forthe quality of the measurements and a low influence of shat-tering.
Probability density functions of the total aerosol numberconcentration in and out of clouds are presented. In the uppertroposphere and stratosphere the total aerosol number con-centration in and out of clouds show similar distributions,while in the middle troposphere higher aerosol concentra-tions within clouds were observed compared to clear air mea-surements. This could have been caused by the lack of out-flow of the convective system at these altitudes.
Utilizing total aerosol number concentration measure-ments from a four channel condensation particle counter dur-ing two separate campaigns, it can be shown that the fractionof ice particles to the number of aerosol particles remaining
www.atmos-chem-phys.net/9/6775/2009/ Atmos. Chem. Phys., 9, 6775–6792, 2009

6790 M. de Reus et al.: Evidence for ice particles in the tropical stratosphere from in-situ measurements
ranges from 1:300 to 1:30 000 for tropical upper troposphericice clouds with ambient temperatures below−75◦C.
We would like to emphasize that the performance of themeasurements presented in this study and the collection ofhigh quality data in the UT/LS by means of a specialisedhigh altitude research aircraft under the conditions given bythe Hector storm system is extremely difficult.
Acknowledgements.We thank Sebastian Raupach, Christian vonGlahn and Hermann Vossing from the University of Mainz forcarrying out the CIP and FSSP instrument preparation and datacollection during the SCOUT-O3 campaign. The SCOUT-O3project was funded by the European Commission (GOCE-CT-2004-505390) and additional financial support was provided by theMax Planck Society and the Collaborative Research Centre “TheTropospheric Ice Phase” (SFB-641). The participation of AaronBansemer and Andrew Heymsfield to the SCOUT/ACTIVE projectwas funded by the University of Manchester. Special thanks tothe entire “Geophysica” crew and the local authorities in Darwin(Australia) and Ouagadougou (Burkina Faso) for their excellentcollaboration during the campaign. Many helpful comments fromthe participants of the Oral Session 5 on Cirrus Clouds duringthe 15th International Conference on Clouds and Precipitation,July 2008 in Cancun, Mexico are greatly appreciated as is thediligent handling of the manuscript by the editor Dominik Brunner.
The service charges for this open access publicationhave been covered by the Max Planck Society.
Edited by: D. Brunner
References
Baker, B. and Lawson, R. P.: Improvement in determination of icewater content from two-dimensional particle imagery, Part I: im-age to mass relationships, J. Appl. Meteorol. Clim., 45, 1282–1290, 2006.
Baumgardner, D, Dye, J. E., Gandrud, B. W., and Knollenberg, R.G.: Interpretation of measurements made by the forward scat-tering spectrometer probe (FSSP-300) during the airborne arcticstratospheric expedition, J. Geophys. Res., 97, 8035–8046, 1992.
Baumgardner, D. and Korolev, A.: Airspeed corrections for opticalarray probe sample volumes, J. Atmos. Ocean. Tech., 14, 1224–1229, 1997.
Borrmann, S., Solomon, S., Dye, J. E., and Luo, B.: The potentialof cirrus clouds for heterogeneous chlorine activation, Geophys.Res. Lett., 23, 2133–2136, 1996.
Borrmann, S., Luo, B., and Mishchenko, M.: The application of theT-matrix method to the measurement of aspherical particles withforward scattering optical particle counters, J. Aerosol Sci., 31,789–799, 2000.
Brunner, D., Siegmund, P., May, P. T., Chappel, L., Schiller, C.,Muller, R., Peter, T., Fueglistaler, S., MacKenzie, A. R., Fix, A.,Schlager, H., Allen, G., Fjaeraa, A. M., Streibel, M., and Harris,N. R. P.: The SCOUT-O3 Darwin Aircraft Campaign: rationaleand meteorology, Atmos. Chem. Phys., 9, 93–117, 2009,http://www.atmos-chem-phys.net/9/93/2009/.
Chaboureau, J.-P., Cammas, J.-P., Duron, J., Mascart, P. J., Sit-nikov, N. M., and Voessing, H.-J.: A numerical study of tropical
cross-tropopause transport by convective overshoots, Atmos.Chem. Phys., 7, 1731–1740, 2007,http://www.atmos-chem-phys.net/7/1731/2007/.
Chen, J. P., McFarquhar, G. M., Heymsfield, A. J., and Ramanathan,A. J..: A modelling and observational study of the detailed mi-crophysical structure of tropical cirrus anvils, J. Geophys. Res.,102, 6637–6653, 1997.
Connolly, P. J., Choularton, T. W., Gallagher, M. W., Bower, K.N., Flynn, M. J., and Whiteway, J. A.: Cloud-resolving simula-tions of intense tropical Hector thunderstorms: Implications foraerosol-cloud interactions, Q. J. Roy. Meteorol. Soc., 132, 3079–3106, 2006.
Corti, T., Luo, B. P., de Reus, M., Brunner, D., Cairo, F., Mahoney,M. J., Martucci, G., Matthey, R., Mitev, V., dos Santos, F. H.,Schiller, C., Shur, G., Sitnikov, N. M., Spelten, N., Vossing,H. J., Borrmann, S., and Peter, T.: Unprecedented evidencefor overshooting convection hydrating the tropical stratosphere,Geophys. Res. Lett., 35, L10810, doi:10.1029/2008GL033641,2008.
Curtius, J., Weigel, R., Vossing, H.-J., Wernli, H., Werner, A.,Volk, C.-M., Konopka, P., Krebsbach, M., Schiller, C., Roiger,A., Schlager, H., Dreiling, V., and Borrmann, S.: Observationsof meteoric material and implications for aerosol nucleation inthe winter Arctic lower stratosphere derived from in situ particlemeasurements, Atmos. Chem. Phys., 5, 3053–3069, 2005,http://www.atmos-chem-phys.net/5/3053/2005/.
Curtius, J.: Nucleation of atmospheric aerosol particles, C. R.Physique, 7, 1027–1045, 2006.
de Reus, M., Krejci, R., Williams, J., Fischer, H., Scheele, R., andStrom, J.: Vertical and horizontal distributions of the aerosolnumber concentration and size distribution over the northern In-dian Ocean, J. Geophys. Res., 106, 28629–28641, 2001.
Dye, J. E. and Baumgardner, D.: Evaluation of the Forward Scat-tering Spectrometer Probe, Part I: Electronic and optical studies,J. Atmos. Ocean. Tech., 1, 329–344, 1984.
Eremenko, M. N., Zasetsky, A. Y., Boone, C. D., and Sloan, J.J.: Properties of high-altitude tropical cirrus clouds determinedfrom ACE FTS observations, Geophys. Res. Lett., 32, L15S07,doi:10.1029/2005GL022428, 2005.
Field, P. R., Heymsfield, A. J., and Bansemer, A.: Shattering andparticle interarrival times measured by optical array probes in iceclouds, J. Atmos. Ocean. Tech., 23, 1357–1371, 2006.
Garrett, T. J., Gerber, H., Baumgardner, D. G., Twohy, C.H., and Weinstock, E. M.: Small, highly reflective ice crys-tals in low-latitude cirrus, Geophys. Res. Lett., 30, 2132,doi:10.1029/2003GL018153, 2003.
Garrett, T. J., Dean-Day, J., Liu, C., Barnett, B., Mace, G., Baum-gardner, D., Webster, C., Bui, T., Read, W., and Minnis, P.: Con-vective formation of pileus cloud near the tropopause, Atmos.Chem. Phys., 6, 1185–1200, 2006,http://www.atmos-chem-phys.net/6/1185/2006/.
Gayet, J. F., Ovarlez, J., Shcherbakov, V., Strom, J., Schumann,U., Minikin, A., Auriol, F., Petzold, A., and Monier, M.: Cirruscloud microphysical and optical properties at southern and north-ern midlatitutes during the INCA Experiment, J. Geophys. Res.,109, D20206, doi:10.1029/2004JD004803, 2004.
Grosvenor, D. P., Choularton, T. W., Coe, H., and Held, G.: A studyof the effect of overshooting deep convection on the water con-tent of the TTL and lower stratosphere from Cloud Resolving
Atmos. Chem. Phys., 9, 6775–6792, 2009 www.atmos-chem-phys.net/9/6775/2009/

M. de Reus et al.: Evidence for ice particles in the tropical stratosphere from in-situ measurements 6791
Model simulations, Atmos. Chem. Phys., 7, 4977–5002, 2007,http://www.atmos-chem-phys.net/7/4977/2007/.
Heymsfield, A. J., and Parrish, J. L.: A computational tech-nique for increasing the effective sampling volume of the PMStwo-dimensional particle size spectrometer, J. Appl. Meteorol.,17, 1566–1572, 1978.
Heymsfield, A. J.: Ice particles observed in a cirriform cloud at−83◦C and implications for polar stratospheric clouds, J. Atmos.Sci., 43, 851–855, 1986.
Heymsfield, A. J. and McFarquhar, G. M.: Midlatitude and tropicalcirrus – microphysical properties, in: Cirrus, edited by: Lynch,D. K., Sassen, K., Starr, D. O., and Stephens, G., Oxford Univ.Press, New York, 2002.
Heymsfield, A. J., Schmidt, C., Bansemer, A., van Zadelhoff, G.J., McGill, M. J., Twohy, M. J., and Baumgardner, D.: Effec-tive radius of ice cloud particle populations derived from aircraftprobes, J. Atmos. Ocean. Tech., 23, 361–380, 2006.
Heymsfield, A. J.: On measurements of small ice par-ticles in clouds, Geophys. Res. Lett., 34, L23812,doi:10.1029/2007GL030951, 2007.
Karcher, B. and Lohmann, U.: A parameterization of cirrus cloudformation: Homogeneous freezing of supercooled aerosols, J.Geophys. Res., 107, 4010, doi:10.1029/2001JD000470, 2002.
Knollenberg, R. G.: The optical array: an alternative to scatteringor extinction for airborne particle size determination, J. Appl.Meteorol., 9, 86–103, 1970.
Knollenberg, R. G., Kelly, K., and Wilson, J. C.: Measurementsof high number densities of ice crystals in the tops of tropicalcumulonimbus, J. Geophys. Res., 98, 8639–8664, 1993.
Korolev, A. V., Strapp, J. W., and Isaac, G. A.: Evaluation of theaccuracy of PMS Optical Array Probes, J. Atmos. Ocean. Tech.,15, 708–720, 1998.
Korolev, A.: Reconstruction of the sizes of spherical particles fromtheir shadow images, Part I: Theoretical considerations, J. At-mos. Ocean. Tech., 24, 376–389, 2007.
Kramer, M., and Afchine, A.: Sampling characteristics of inletsoperated at low U/U0 ratios: new insights from computationalfluid dynamics (CFX) modeling, J. Aerosol Sci., 35, 683–694,doi:10.1016/j.jaerosci.2003.11.011, 2004.
Kramer, M., Schiller, C., Afchine, A., Bauer, R., Gensch, I., Man-gold, A., Schlicht, S., Spelten, N., Sitnikov, N., Borrmann, S.,de Reus, M., and Spichtinger, P.: Ice supersaturations and cir-rus cloud crystal numbers, Atmos. Chem. Phys., 9, 3505–3522,2009,http://www.atmos-chem-phys.net/9/3505/2009/.
Lee, S. H., Wilson, J. C., Baumgardner, D., Herman, R. L., We-instock, E. M., LaFleur, B. G., Kok, G., Anderson, B., Law-son, P., Baker, B., Strawa, A., Pittman, J. V., Reeves, J. M.,and Bui, T. P.: New particle formation observed in the trop-ical/subtropical cirrus clouds, J. Geophys. Res., 109, D20209,doi:10.1029/2004JD005033, 2004.
Lynch, D. K., Sassen, K., Starr, D. O., and Stephens, G.: Cirrus,Oxford Univ. Press, New York, 2002.
McFarquhar, G. M. and Heymsfield, A. J.: Parameterisation of trop-ical cirrus ice crystal size distributions and implications for ra-diative transfer: results from CEPEX, J. Atmos. Sci., 54, 2187–2200, 1997.
McFarquhar, G. M. and Heymsfield, A. J.: The definition and sig-nificance of an effective radius for ice clouds, J. Atmos. Sci., 55,
2039–2052, 1998.McFarquhar, G. M., Heymsfield, A. J., Spinhirne, J., and Hart, B.:
Thin and subvisual tropopause tropical cirrus: observations andradiative impacts, J. Atmos. Sci., 57, 1841–1853, 2000.
McFarquhar, G. M., Um, J., Freer, M., Baumgardner, D., Kok, G.L., and Mace, G.: Importance of small ice crystals to cirrus prop-erties: Observations from the tropical warm pool internationalcloud experiment (TWP-ICE), Geophys. Res. Lett., 34, L13803,doi:10.1029/2007GL029865, 2007.
Mitchell, D. L. and Heymsfield, A. J.: Refinements in the Treat-ment of ice particle terminal velocities, highlighting aggregates,J. Atmos. Sci., 62, 1637–1644, 2005.
Mitev, V., Matthey, R., and Makanov, V.: Miniature backscatter li-dar for cloud and aerosol observation from high altitude aircraft,Rec. Res. Dev. Geophys., 4, 207–223, 2002.
Nielsen, J. K., Larsen, N., Cairo, F., Di Donfrancesco, G., Rosen,J. M., Durry, G., Held, G., and Pommereau, J. P.: Solid particlesin the tropical lowest stratosphere, Atmos. Chem. Phys., 7, 685–695, 2007,http://www.atmos-chem-phys.net/7/685/2007/.
Oltmans, S. J., Vomel, H., Hofmann, D. J., Rosenlof, K. H., andKley, D.: The increase in stratospheric water vapour from bal-loonborne, frostpoint hygrometer measurements at WashingtonD.C. and Boulder, Geophys. Res. Lett., 27, 3453–3456, 2000.
Peter, Th., Luo, B. P., Wirth, M., Kiemle, C., Flentje, H., Yushkov,V. A., Khattatov, V., Rudakov, V., Thomas, A., Borrmann, S.,Toci, G., Mazzinghi, P., Beuermann, J., Schiller, C., Cairo, F., DiDonfrancesco, G., Adriani, A., Volk, C. M., Strom, J., Noone, K.,Mitev, V., MacKenzie, R. A., Carslaw, K. S., Trautmann, T., San-tacesaria, V., and Stefanutti, L.: Ultrathin Tropical TropopauseClouds (UTTCs): I, Cloud morphology and occurrence, Atmos.Chem. Phys., 3, 1083–1091, 2003,http://www.atmos-chem-phys.net/3/1083/2003/.
Pratte, P., van den Bergh, H., and Rossi, M. J.: The kinetics of H2Ovapor condensation and evaporation on different types of ice inthe range 130–210 K, J. Phys. Chem. A, 110, 3042–3058, 2006.
Schiller, C., Kramer, M., Afchine, A., Spelten, N., and Sitnikov, N.:The ice water content of Arctic, mid latitude and tropical cirrus,J. Geophys. Res., 113, D24208, doi:10.1029/2008JD010342,2008.
Schroder, F., Karcher, B., Duroure, C., Strom, J., Petzold, A., Gayet,J. F., Strauss, B., Wendling, P., and Borrmann, S.: On the transi-tion of contrails into cirrus clouds, J. Atmos. Sci., 57, 464–480,2000.
Seifert, M., Strom, J., Krejci, R., Minikin, A., Petzold, A., Gayet,J.-F., Schlager, H., Ziereis, H., Schumann, U., and Ovarlez, J.:Aerosol-cirrus interactions: a number based phenomenon at all?,Atmos. Chem. Phys., 4, 293–305, 2004,http://www.atmos-chem-phys.net/4/293/2004/.
Seinfeld, J. H. and Pandis, S. N.: Atmospheric chemistry andphysics: from air pollution to climate change, John Wiley andSons, Hoboken, NJ, 2006.
Sherwood, S. C. and Dessler, A. E.: A Model for transport acrossthe tropical tropopause, J. Atmos. Sci., 58, 765–779, 2001.
Sitnikov, N. M., Yushkov, V. A., Afchine, A. A., Korshunov, L.I., Astakov, V. I., Ulanovskii, A. E., Kramer, M., Mangold, A.,Schiller, C., and Ravegnani, F.: The FLASH instrument for watervapor measurements on board the high altitude airplane, Instru-ments and Experimental Techniques, 50, 113–121, 2007.
www.atmos-chem-phys.net/9/6775/2009/ Atmos. Chem. Phys., 9, 6775–6792, 2009

6792 M. de Reus et al.: Evidence for ice particles in the tropical stratosphere from in-situ measurements
Solomon, S., Borrmann, S., Garcia, R. R., Portmann, R., Thomason,L., Poole, L. R., Winkler, D., and McCormick, M. P.: Heteroge-neous chlorine chemistry in the tropopause region, J. Geophys.Res., 102, 21411–21429, 1997.
Stephens, G. L. and Webster, P. J.: Clouds and climate: sensitivityof simple systems, J. Atmos. Sci., 38, 235–247, 1981.
Strapp, J. W., Albers, F., Reuter, A., Korolev, A. V., Maixner, U.,Rashke, E., and Vukovic, Z.: Laboratory measurements of theresponse of a PMS OAP-2DC, J. Atmos. Ocean. Tech., 18, 1150–1170, 2001.
Strom, J., Strauss, B., Anderson, T., Schroder, F., Heintzenberg,J., and Wendling, P.: In-situ observations of the microphysicalproperties of young cirrus clouds, J. Atmos. Sci., 54, 2542–2553,1997.
Thomas, A., Borrmann, S., Kiemle, C., Cairo, F., Volk, M., Beuer-mann, J., Lepuchov, B., Santacesaria, V., Matthey, R., Rudakov,V., Yushkov, V., MacKenzie, A. R., and Stefanutti, L.: In-situmeasurements of background aerosol and subvisible cirrus inthe tropical tropopause region, J. Geophys. Res., 107, 4763,doi:10.1029/2001JD001385, 2002.
Vaughan, G., Schiller, C., MacKenzie, A. R., Bower, K., Peter,T., Schlager, H., Harris, N. R. P., and May, P. T.: SCOUT-O3/ACTIVE high-altitude aircraft measurements around deeptropical convection, B. Am. Meteorol. Soc., 89, 647–662, 2008.
Voigt, C., Schlager, H., Ziereis, H., Karcher, B., Luo, B. P., Schiller,C., Kramer, M., Popp, P. J., Irie, H., and Kondo, Y.: Nitricacid uptake in cirrus clouds, Geophys. Res. Lett., 33, L05803,doi:10.1029/2005GL025159, 2006.
Weigel, R., Hermann, M., Curtius, J., Voigt, C., Walter, S., Bottger,T., Lepukhov, B., Belyaev, G., and Borrmann, S.: Experimentalcharacterization of the COndensation PArticle counting Systemfor high altitude aircraft-borne application, Atmos. Meas. Tech.,2, 243–258, 2009,http://www.atmos-meas-tech.net/2/243/2009/.
Yushkov, V., Oulanovsky, A., Lechenuk, N., Roudakov, I., Ar-shinov, K., Tikhonov, F., Stefanutti, L., Ravegnani, F., Bonafe,U., and Georgiadis, T.: A chemiluminescent analyzer for strato-spheric measurements of the ozone concentration (FOZAN), J.Atmos. Ocean. Tech., 16, 1345–1350, 1999.
Zoger, M., Afchine, A., Eicke, N., Gerhards, M. T., Klein, E.,McKenna, D. S., Morschel, U., Schmidt, U., Tan, V., Tuitjer,F., Woyke, T., and Schiller, C.: Fast in-situ stratospheric hy-grometers: A new family of balloonborne and airborne Lyman-α
photofragment fluorescence hygrometers, J. Geophys. Res., 104,1807–1816, 1999.
Atmos. Chem. Phys., 9, 6775–6792, 2009 www.atmos-chem-phys.net/9/6775/2009/