Classification of ice crystal shapes in midlatitude ice clouds from three years of lidar...
14
Classification of Ice Crystal Shapes in Midlatitude Ice Clouds from Three Years of Lidar Observations over the SIRTA Observatory VINCENT NOEL Analytical Services and Materials, Hampton, Virginia HELENE CHEPFER Institut Pierre-Simon Laplace/Laboratoire de Me ´te ´orologie Dynamique, Université Pierre et Marie Curie, Paris, France MARTIAL HAEFFELIN AND YOHANN MORILLE Institut Pierre-Simon Laplace/Laboratoire de Me ´te ´orologie Dynamique, Ecole Polytechnique, Palaiseau, France (Manuscript received 18 April 2005, in final form 8 February 2006) ABSTRACT This paper presents a study of ice crystal shapes in midlatitude ice clouds inferred from a technique based on the comparison of ray-tracing simulations with lidar depolarization ratio measured at 532 nm. This technique is applied to three years of lidar depolarization ratio observations from the Site Instrumental de Recherche par Télédétection Atmosphérique (SIRTA) observatory in Palaiseau, France, amounting to 322 different days of ice cloud observations. Particles in clouds are classified in three major groups: plates, columns, and irregular shapes with aspect ratios close to unity. Retrieved shapes are correlated with radiosounding observations from a close-by meteorological station: temperature, relative humidity, wind speed, and direction. Results show a strong dependence of the relative concentration of different crystal shapes to most atmospheric variables, such as the temperature, with a clear successive dominance by platelike (temperature above 20°C), irregular (temperatures between 60° and 40°C), and columnlike shapes (temperatures below 60°C). Particle shapes are almost exclusively columnlike below 75°C. This is in sharp contrast with previous results of the same classification applied to tropical clouds, and highlights the high geographic variability of the ice clouds distribution of microphysical properties. Results also suggest that ice clouds created by jet streams (identified by high wind speeds) are strongly dominated by columnlike shapes, while front-created ice clouds (identified by lower wind speeds) show a much more variable mix of shapes, with the dominant shapes depending on other factors. Results also suggest different microphysical properties according to the average direction source of air masses and winds. Following these results, a possible parameterization of ice crystal shapes in midlatitude ice clouds as a function of temperature is provided. 1. Introduction Ice clouds permanently cover as much as 40% of the earth’s surface (Liou 1986). Moreover, recent satellite and ground-based observations suggest the coverage from subvisible ice clouds, which are hard to detect through conventional methods, may increase this to more than 50% (Wang et al. 1996; Sassen and Campbell 2001). This large spatial coverage makes them one of the major influences in the climate evolution, and a correct estimation of their radiative impact is essential to adequately reproduce and predict the climate (Cess et al. 1990, 1996). This radiative impact depends on the poorly known balance between their albedo and green- house effect, which is highly influenced by each cloud local microphysical properties (Sassen et al. 1989; Stephens et al. 1990). To improve their parameteriza- tion in general circulation models, a better understand- ing of these microphysical properties is essential (Sun and Shine 1995). Among these, the shape of ice par- ticles remains one of the major sources of uncertainties, Corresponding author address: Vincent Noel, Laboratoire de Météorologie Dynamique, Ecole Polytechnique, 91128 Palaiseau, France. E-mail: [email protected] 2978 JOURNAL OF THE ATMOSPHERIC SCIENCES VOLUME 63 © 2006 American Meteorological Society JAS3767
Transcript of Classification of ice crystal shapes in midlatitude ice clouds from three years of lidar...
Classification of Ice Crystal Shapes in Midlatitude Ice Clouds from Three Years ofLidar Observations over the SIRTA Observatory
VINCENT NOEL
Analytical Services and Materials, Hampton, Virginia
HELENE CHEPFER
Institut Pierre-Simon Laplace/Laboratoire de Meteorologie Dynamique, Université Pierre et Marie Curie, Paris, France
MARTIAL HAEFFELIN AND YOHANN MORILLE
Institut Pierre-Simon Laplace/Laboratoire de Meteorologie Dynamique, Ecole Polytechnique, Palaiseau, France
(Manuscript received 18 April 2005, in final form 8 February 2006)
ABSTRACT
This paper presents a study of ice crystal shapes in midlatitude ice clouds inferred from a technique basedon the comparison of ray-tracing simulations with lidar depolarization ratio measured at 532 nm. Thistechnique is applied to three years of lidar depolarization ratio observations from the Site Instrumental deRecherche par Télédétection Atmosphérique (SIRTA) observatory in Palaiseau, France, amounting to 322different days of ice cloud observations. Particles in clouds are classified in three major groups: plates,columns, and irregular shapes with aspect ratios close to unity. Retrieved shapes are correlated withradiosounding observations from a close-by meteorological station: temperature, relative humidity, windspeed, and direction.
Results show a strong dependence of the relative concentration of different crystal shapes to mostatmospheric variables, such as the temperature, with a clear successive dominance by platelike (temperatureabove �20°C), irregular (temperatures between �60° and �40°C), and columnlike shapes (temperaturesbelow �60°C). Particle shapes are almost exclusively columnlike below �75°C. This is in sharp contrastwith previous results of the same classification applied to tropical clouds, and highlights the high geographicvariability of the ice clouds distribution of microphysical properties. Results also suggest that ice cloudscreated by jet streams (identified by high wind speeds) are strongly dominated by columnlike shapes, whilefront-created ice clouds (identified by lower wind speeds) show a much more variable mix of shapes, withthe dominant shapes depending on other factors. Results also suggest different microphysical propertiesaccording to the average direction source of air masses and winds. Following these results, a possibleparameterization of ice crystal shapes in midlatitude ice clouds as a function of temperature is provided.
1. Introduction
Ice clouds permanently cover as much as 40% of theearth’s surface (Liou 1986). Moreover, recent satelliteand ground-based observations suggest the coveragefrom subvisible ice clouds, which are hard to detectthrough conventional methods, may increase this tomore than 50% (Wang et al. 1996; Sassen and Campbell
2001). This large spatial coverage makes them one ofthe major influences in the climate evolution, and acorrect estimation of their radiative impact is essentialto adequately reproduce and predict the climate (Cesset al. 1990, 1996). This radiative impact depends on thepoorly known balance between their albedo and green-house effect, which is highly influenced by each cloudlocal microphysical properties (Sassen et al. 1989;Stephens et al. 1990). To improve their parameteriza-tion in general circulation models, a better understand-ing of these microphysical properties is essential (Sunand Shine 1995). Among these, the shape of ice par-ticles remains one of the major sources of uncertainties,
Corresponding author address: Vincent Noel, Laboratoire deMétéorologie Dynamique, Ecole Polytechnique, 91128 Palaiseau,France.E-mail: [email protected]
2978 J O U R N A L O F T H E A T M O S P H E R I C S C I E N C E S VOLUME 63
© 2006 American Meteorological Society
JAS3767

which could modify ice cloud albedo by as much as 30%(Takano and Liou 1989). The modeled bidirectionalreflectance of ice clouds, which describes how incomingsunlight is redistributed in space through scattering, isalso highly sensitive to the assumed shape of ice crystals(Yang et al. 2001): using incorrect shapes for ice cloudsin optical depth retrieval algorithms can modify resultsby a factor of 3 (Mishchenko et al. 1996). Moreover,crystal shapes in ice clouds were recently found to in-fluence subsequent ice formation processes, leading toa feedback effects on the cloud microphysical and ra-diative properties (Sassen et al. 2003a). In the past twodecades, in situ observations from intensive field cam-paigns, such as the first and second International Sat-ellite Cloud Climatology Project (ISSCP) Regional Ex-periment (FIRE I and II), the European Cloud andRadiation Experiment (EUCREX), the InternationalCloud Experiment (ICE) have all exposed the high spa-tial and temporal variability of this parameter, andshown it to be one of the most difficult to study (Cox etal. 1987; Francis et al. 1994; Sauvage et al. 1999). More-over, recent field campaigns in the Tropics such as theCirrus Regional Study of Tropical Anvils and CirrusLayers–Florida Area Cirrus Experiment (CRYSTAL-FACE; Jensen et al. 2004) concluded that ice crystals inconvective ice clouds exhibit different properties fromthose generally assumed in most climate models(Heymsfield et al. 2002a; Garrett et al. 2003). Severalstudies have tried to retrieve particle shape using ob-servations from spaceborne instruments, such as theModerate Resolution Imaging Spectroradiometer(MODIS; Rolland et al. 2000) and Polarization and Di-rectionality of Earth’s Reflectance (POLDER; Chepferet al. 1999, 2001; Masuda et al. 2002). However, radio-metric observations from satellite suffer from the limi-tations of passive remote sensing; on one hand, thelower limit of detection for optically thin clouds is notwell known, which means the entire population of sub-visible ice clouds (potentially more than 20%; Goldfarbet al. 2001) may be overlooked; on the other hand, thevertical distance on which the observed quantities areintegrated is still unclear. A way to overcome theselimitations is to use active remote sensing (Chiriaco etal. 2004).
The present study uses observations of linear depo-larization ratio to retrieve information on the shape ofparticles inside ice clouds, using an already-publishedshape classification technique (Noel et al. 2002). Threeyears of observations are considered, leading to an ex-tensive study of ice crystal shapes that could be consid-ered representative of midlatitude ice clouds. Retrievedinformation about shapes is correlated with atmo-spheric variables: temperature, relative humidity, wind
speed, and direction. Results are compared with shapeinformation previously retrieved in midlatitude andtropical ice clouds using lidar and in situ probes.
The instrument used in this study is first presented insection 2, with a short description of the shape classifi-cation technique. The ice clouds lidar depolarizationratio dataset is then introduced in section 3, along withthe variability of atmospheric variables for the studiedcases. Results of the shape classification and their cor-relation with radiosounding variables are presented insection 4. Results are discussed and conclusions aregiven in section 5.
2. Ice crystal shape information from lidardepolarization ratio
The high sensitivity of the lidar instrument to opti-cally thin clouds makes it one of the instruments bestsuited to the study of ice clouds (Platt 1973), especiallywhen equipped to monitor the state of light polariza-tion (Sassen 1991). In this last configuration, the emit-ted beam of laser light is linearly polarized in a specificplane. The linear depolarization ratio � � (I⊥/I//) is thendefined as the ratio of backscattered light intensities inthe planes perpendicular (I⊥) and parallel (I//) to theplane of emission. This ratio � has been shown to beextremely sensitive to the microphysical properties ofprobed clouds (Chen et al. 2002), and especially particleshape (Sassen 1977). The present study uses a tech-nique that classifies particle shapes in ice clouds bycomparing observed depolarization ratios with resultsof a ray-tracing simulation (extensively described inNoel et al. 2001). The simulation follows modificationsin light polarization as it travels through modeled hex-agonal-based ice crystals, so the evolution of � can bestudied as a function of three parameters: the particleimaginary index of refraction, aspect ratio Q, and ori-entation in space. Effects of the index of refraction onlight polarization were shown to be negligible whenconsidering a constant lidar wavelength. Undoubtedlymore interesting, � is highly sensitive to the aspect ratioQ in the presence of randomly oriented particles. Asthe slope of �(Q) is not always positive, it is not possibleto link an observed � to a specific Q, however a rangeof possible values for Q can be estimated and crystalscan be classified into three shape groups. Low values �� 0.25 are attributed to thin platelike particles (Q �0.1), while high � � 0.5 are found to be the signature ofcolumnlike particles (Q � 1.5) and crystals of high com-plexity such as bullet rosettes. Experimental studieshave found that particles close to sphericity (early inthe particle formation, or through riming process) pro-duce low depolarization, in the same range as platelike
NOVEMBER 2006 N O E L E T A L . 2979

particles, so these shapes will be equivalent in the lidarclassification scheme. The last group describes interme-diate and irregular particle shapes (with aspect ratiosclose to unity) that produce average depolarization ra-tios (0.25 � � � 0.5). It should be stressed that thistechnique does not aim at retrieving the exact shape ofice crystals in ice clouds, as their infinite variety makesthis an unrealistic goal. Instead, the depolarization ratiois used to classify particles in a given cloud area intothree distinct groups: platelike, columnlike, and irregu-lar shapes. It is important to note that platelike andcolumnlike refer to particles that scatter light respec-tively like plates (including aggregates of plates) or col-umns (including aggregate of columns and bullet ro-settes). As lidar observations are vertically resolved,the variability of these groups with altitude, tempera-ture, etc., can be estimated.
During the classification, two phenomena need to beaccounted for. First, multiple scattering can greatlymodify observations of depolarization ratio (Hu et al.2001), thus a specific Monte Carlo multiple scatteringcode has been implemented to simulate this phenom-enon in ice clouds of variable composition and opticaldepths, showing it varies greatly with particle shape(Noel et al. 2002), and therefore the depolarizationranges given for each shape class need to be adjustedfor each lidar profile, with respect to the optical depthof the studied cloud. Moreover, Noel et al. (2001)showed that horizontally oriented crystals, which areknown to occur in midlatitude and high-latitude iceclouds (Platt 1977; Sassen 1980; Noel and Sassen 2005),especially at cloud top (Sassen et al. 2003b), usuallyproduce high backscattering and almost-zero depolar-ization ratios (� � 0.1) in good agreement with experi-mental studies (Platt et al. 1978). In that case, the de-polarization ratio is not sensitive to other parametersanymore, and the shape classification technique used inthe present study cannot be applied. Fluid dynamicsstudies (Jayaweera and Cottis 1969) show that the fallattitude of crystals strongly depends on their Reynoldsnumber Re: while particles with low Re (below unity)will adopt a random orientation, crystals with Re aboveunity will adopt a preferential orientation close to thehorizontal plane. Moreover, crystals with Re � 200 willtend to oscillate and flutter (Jayaweera and Mason1965), with amplitudes dependent on the crystal aspectratio: planar particles will follow horizontal orientationmore closely than complex and irregular shapes(Heymsfield and Kajikawa 1987). For pristine particlessuch as the planar crystals used in the present classifi-cation scheme, Re is typically lower than 200 (Mitchell1996), and thus such particles would tend to follow ahorizontal orientation. Recent studies using polarized
observations from the spaceborne radiometerPOLDER (Breon and Dubrulle 2004; Noel and Chep-fer 2004) have confirmed these findings, showing thatoriented crystals can be found in half of ice clouds, insmall concentrations however (0.1% to 1%). As thepresent study assumes random orientation of particles,to remain coherent with radiative transfer studies, oc-currences of oriented crystals had to be excluded fromthe observation dataset. This was achieved by removingcases with very low values of �, as only a small concen-tration of oriented crystals is enough to strongly affectthe depolarization (Sassen and Benson 2001).
This technique was first applied in Noel et al. (2002)on twelve cases of ground-based lidar observation of �in midlatitude ice clouds, with results in good agree-ment with previous in situ studies (Korolev and Isaac1999; Sassen and Benson 2001). More recently, thistechnique was applied to observations of ice clouds ontop of convective systems in the Tropics during theCRYSTAL-FACE campaign (Noel et al. 2004), high-lighting their specific microphysical properties. In thislast study, classification results were compared with di-rect ice particle images observed from collocated in situprobes, showing a good agreement. The technique wasalso compared to other remote sensing shape retrievaltechnique (Chepfer et al. 2005) leading to consistentresults. These last validation and comparisons mean theclassification technique can be trusted with a reason-able level of confidence.
3. The SIRTA ice cloud dataset
The 532-nm lidar Nuages aerosols (LNA) is operated5 days a week from 0800 to 2000 LT, except duringprecipitation, at the SIRTA observatory located at48.713°N, 2.208°E (Haeffelin et al. 2005). Its laserbeam, pointing at the zenith, leads to a nominal tem-poral resolution of 10 s (200 integrated pulses) and avertical resolution of 15 m. The dataset used in thisstudy extends from 2002 to 2004; on this period back-scattered profiles were analyzed to produce a “cloudmask” with a multitest algorithm called structure of theatmosphere (STRAT) that identifies the boundarylayer, molecular (i.e., particle-free) layers, and particlelayers in the troposphere (Morille et al. 2006). Cloudand aerosol layers were detected using a combinationof wavelet transform analysis (to detect signal discon-tinuities at layer boundaries) and backscattered signalthresholding (to remove variations due to noise). More-over, the LNA produces observations of linear depo-larization ratio (section 2), which is calibrated by de-tecting for each observation period a low-level, cloud-
2980 J O U R N A L O F T H E A T M O S P H E R I C S C I E N C E S VOLUME 63
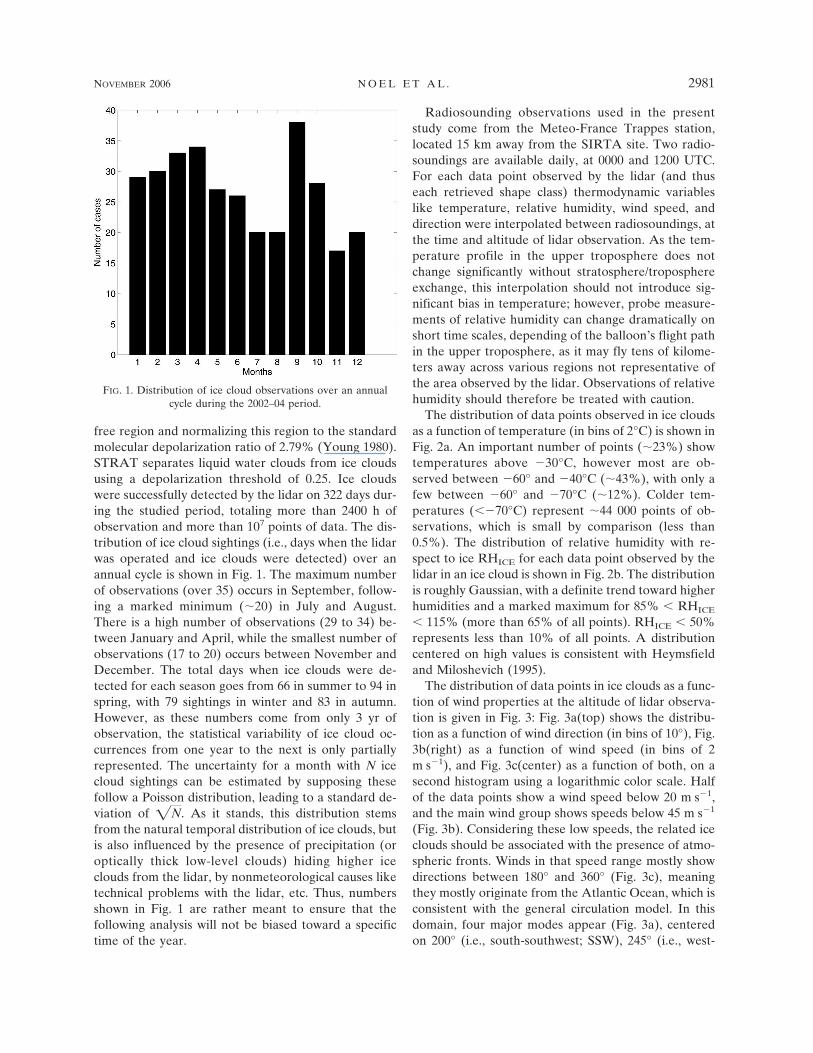
free region and normalizing this region to the standardmolecular depolarization ratio of 2.79% (Young 1980).STRAT separates liquid water clouds from ice cloudsusing a depolarization threshold of 0.25. Ice cloudswere successfully detected by the lidar on 322 days dur-ing the studied period, totaling more than 2400 h ofobservation and more than 107 points of data. The dis-tribution of ice cloud sightings (i.e., days when the lidarwas operated and ice clouds were detected) over anannual cycle is shown in Fig. 1. The maximum numberof observations (over 35) occurs in September, follow-ing a marked minimum (�20) in July and August.There is a high number of observations (29 to 34) be-tween January and April, while the smallest number ofobservations (17 to 20) occurs between November andDecember. The total days when ice clouds were de-tected for each season goes from 66 in summer to 94 inspring, with 79 sightings in winter and 83 in autumn.However, as these numbers come from only 3 yr ofobservation, the statistical variability of ice cloud oc-currences from one year to the next is only partiallyrepresented. The uncertainty for a month with N icecloud sightings can be estimated by supposing thesefollow a Poisson distribution, leading to a standard de-viation of �N. As it stands, this distribution stemsfrom the natural temporal distribution of ice clouds, butis also influenced by the presence of precipitation (oroptically thick low-level clouds) hiding higher iceclouds from the lidar, by nonmeteorological causes liketechnical problems with the lidar, etc. Thus, numbersshown in Fig. 1 are rather meant to ensure that thefollowing analysis will not be biased toward a specifictime of the year.
Radiosounding observations used in the presentstudy come from the Meteo-France Trappes station,located 15 km away from the SIRTA site. Two radio-soundings are available daily, at 0000 and 1200 UTC.For each data point observed by the lidar (and thuseach retrieved shape class) thermodynamic variableslike temperature, relative humidity, wind speed, anddirection were interpolated between radiosoundings, atthe time and altitude of lidar observation. As the tem-perature profile in the upper troposphere does notchange significantly without stratosphere/troposphereexchange, this interpolation should not introduce sig-nificant bias in temperature; however, probe measure-ments of relative humidity can change dramatically onshort time scales, depending of the balloon’s flight pathin the upper troposphere, as it may fly tens of kilome-ters away across various regions not representative ofthe area observed by the lidar. Observations of relativehumidity should therefore be treated with caution.
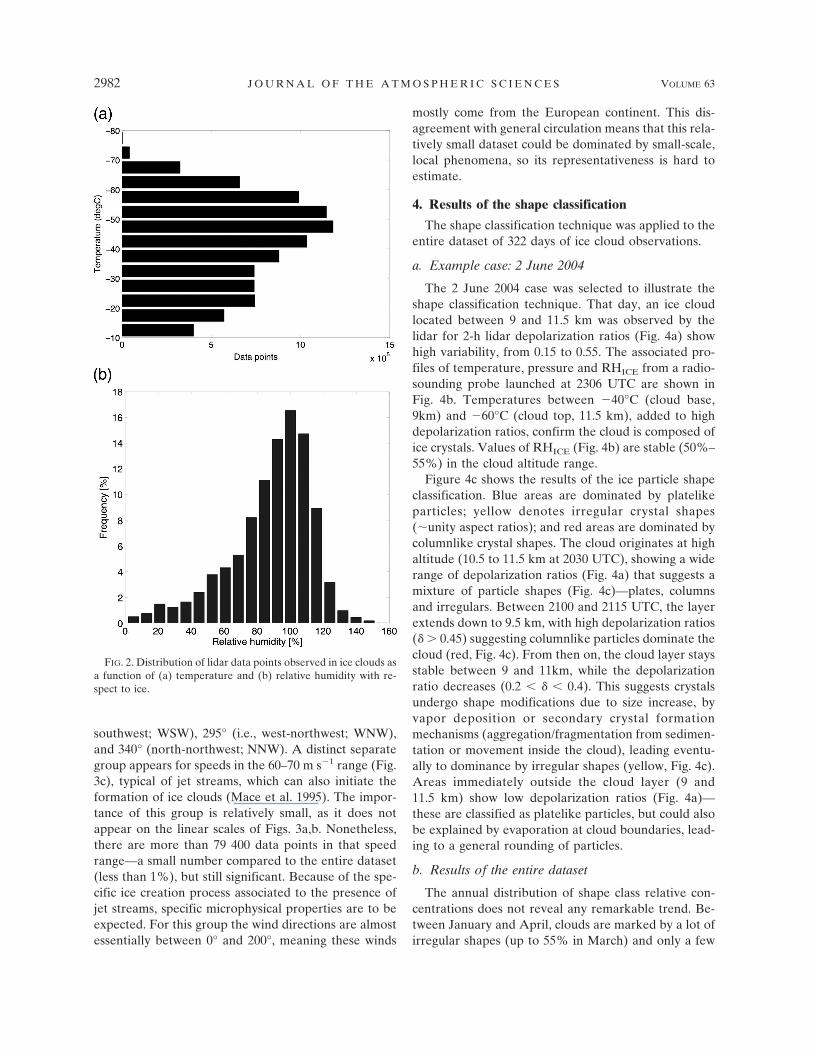
The distribution of data points observed in ice cloudsas a function of temperature (in bins of 2°C) is shown inFig. 2a. An important number of points (�23%) showtemperatures above �30°C, however most are ob-served between �60° and �40°C (�43%), with only afew between �60° and �70°C (�12%). Colder tem-peratures (��70°C) represent �44 000 points of ob-servations, which is small by comparison (less than0.5%). The distribution of relative humidity with re-spect to ice RHICE for each data point observed by thelidar in an ice cloud is shown in Fig. 2b. The distributionis roughly Gaussian, with a definite trend toward higherhumidities and a marked maximum for 85% � RHICE
� 115% (more than 65% of all points). RHICE � 50%represents less than 10% of all points. A distributioncentered on high values is consistent with Heymsfieldand Miloshevich (1995).
The distribution of data points in ice clouds as a func-tion of wind properties at the altitude of lidar observa-tion is given in Fig. 3: Fig. 3a(top) shows the distribu-tion as a function of wind direction (in bins of 10°), Fig.3b(right) as a function of wind speed (in bins of 2m s�1), and Fig. 3c(center) as a function of both, on asecond histogram using a logarithmic color scale. Halfof the data points show a wind speed below 20 m s�1,and the main wind group shows speeds below 45 m s�1
(Fig. 3b). Considering these low speeds, the related iceclouds should be associated with the presence of atmo-spheric fronts. Winds in that speed range mostly showdirections between 180° and 360° (Fig. 3c), meaningthey mostly originate from the Atlantic Ocean, which isconsistent with the general circulation model. In thisdomain, four major modes appear (Fig. 3a), centeredon 200° (i.e., south-southwest; SSW), 245° (i.e., west-
FIG. 1. Distribution of ice cloud observations over an annualcycle during the 2002–04 period.
NOVEMBER 2006 N O E L E T A L . 2981
southwest; WSW), 295° (i.e., west-northwest; WNW),and 340° (north-northwest; NNW). A distinct separategroup appears for speeds in the 60–70 m s�1 range (Fig.3c), typical of jet streams, which can also initiate theformation of ice clouds (Mace et al. 1995). The impor-tance of this group is relatively small, as it does notappear on the linear scales of Figs. 3a,b. Nonetheless,there are more than 79 400 data points in that speedrange—a small number compared to the entire dataset(less than 1%), but still significant. Because of the spe-cific ice creation process associated to the presence ofjet streams, specific microphysical properties are to beexpected. For this group the wind directions are almostessentially between 0° and 200°, meaning these winds
mostly come from the European continent. This dis-agreement with general circulation means that this rela-tively small dataset could be dominated by small-scale,local phenomena, so its representativeness is hard toestimate.
4. Results of the shape classification
The shape classification technique was applied to theentire dataset of 322 days of ice cloud observations.
a. Example case: 2 June 2004
The 2 June 2004 case was selected to illustrate theshape classification technique. That day, an ice cloudlocated between 9 and 11.5 km was observed by thelidar for 2-h lidar depolarization ratios (Fig. 4a) showhigh variability, from 0.15 to 0.55. The associated pro-files of temperature, pressure and RHICE from a radio-sounding probe launched at 2306 UTC are shown inFig. 4b. Temperatures between �40°C (cloud base,9km) and �60°C (cloud top, 11.5 km), added to highdepolarization ratios, confirm the cloud is composed ofice crystals. Values of RHICE (Fig. 4b) are stable (50%–55%) in the cloud altitude range.
Figure 4c shows the results of the ice particle shapeclassification. Blue areas are dominated by platelikeparticles; yellow denotes irregular crystal shapes(�unity aspect ratios); and red areas are dominated bycolumnlike crystal shapes. The cloud originates at highaltitude (10.5 to 11.5 km at 2030 UTC), showing a widerange of depolarization ratios (Fig. 4a) that suggests amixture of particle shapes (Fig. 4c)—plates, columnsand irregulars. Between 2100 and 2115 UTC, the layerextends down to 9.5 km, with high depolarization ratios(� � 0.45) suggesting columnlike particles dominate thecloud (red, Fig. 4c). From then on, the cloud layer staysstable between 9 and 11km, while the depolarizationratio decreases (0.2 � � � 0.4). This suggests crystalsundergo shape modifications due to size increase, byvapor deposition or secondary crystal formationmechanisms (aggregation/fragmentation from sedimen-tation or movement inside the cloud), leading eventu-ally to dominance by irregular shapes (yellow, Fig. 4c).Areas immediately outside the cloud layer (9 and11.5 km) show low depolarization ratios (Fig. 4a)—these are classified as platelike particles, but could alsobe explained by evaporation at cloud boundaries, lead-ing to a general rounding of particles.
b. Results of the entire dataset
The annual distribution of shape class relative con-centrations does not reveal any remarkable trend. Be-tween January and April, clouds are marked by a lot ofirregular shapes (up to 55% in March) and only a few
FIG. 2. Distribution of lidar data points observed in ice clouds asa function of (a) temperature and (b) relative humidity with re-spect to ice.
2982 J O U R N A L O F T H E A T M O S P H E R I C S C I E N C E S VOLUME 63

platelike particles. From May to December, platelikeand irregular shapes appear in similar concentrations.Concentration of column-like shapes is usually low,reaching a minimum of 16% in May. However, as mea-surements are not evenly distributed over time (section3), it is unclear whether these numbers are representa-tive of midlatitude ice clouds.
More significantly, the shape of ice particles appearshighly sensitive to temperature (Fig. 5): for tempera-tures above �20°C, platelike particles are predominant(50%–70%), followed by irregular particles (25%–40%), and a minority of columnlike particles (less than10%). As altitude increases and temperatures drop, theimportance of platelike particles decreases, with a si-multaneous increase in the two other classes. A thresh-old is reached at �50°C, where the relative concentra-tion of irregular shapes (�unity aspect ratio) reaches itsmaximum (�50% of all particles), while at the sametime columnlike particles become more frequent than
platelike particles. For colder temperatures (below�50°C), the concentration of irregular shapes andplatelike particles decreases to fall below 20% at�75°C, while the proportion of columnlike particlesgoes on increasing to reach its maximum (over 70%) at�75°C. A pronounced change seems to be occurringfor even colder temperatures (below �75°C) with asharp fall in columnlike concentrations and a sharp in-crease in platelike particles.
The shape class relative concentrations are shown inFig. 6 as a function of relative humidity with respect toice RHICE. Low humidity is dominated equally byplatelike and irregular shapes (45%–50%), followed byless than 25% of columnlike particles. At higher hu-midity, the proportion of platelike shapes decreaseswhile columnlike particles increase. This behavior stopsat RHICE � 100% (the most frequent value, Fig. 2b),with platelike particles below 30%, and columnlikereaching almost 30%. For RHICE � 100% platelike
FIG. 3. (a) Distribution of lidar data points observed in ice clouds as a function of wind direction. (b) Same as (a), but as a functionof wind speed. (c) Same as (a), but as a function of wind direction (x axis) and speed (y axis), in logarithmic color scale.
NOVEMBER 2006 N O E L E T A L . 2983
Fig 3 live 4/C
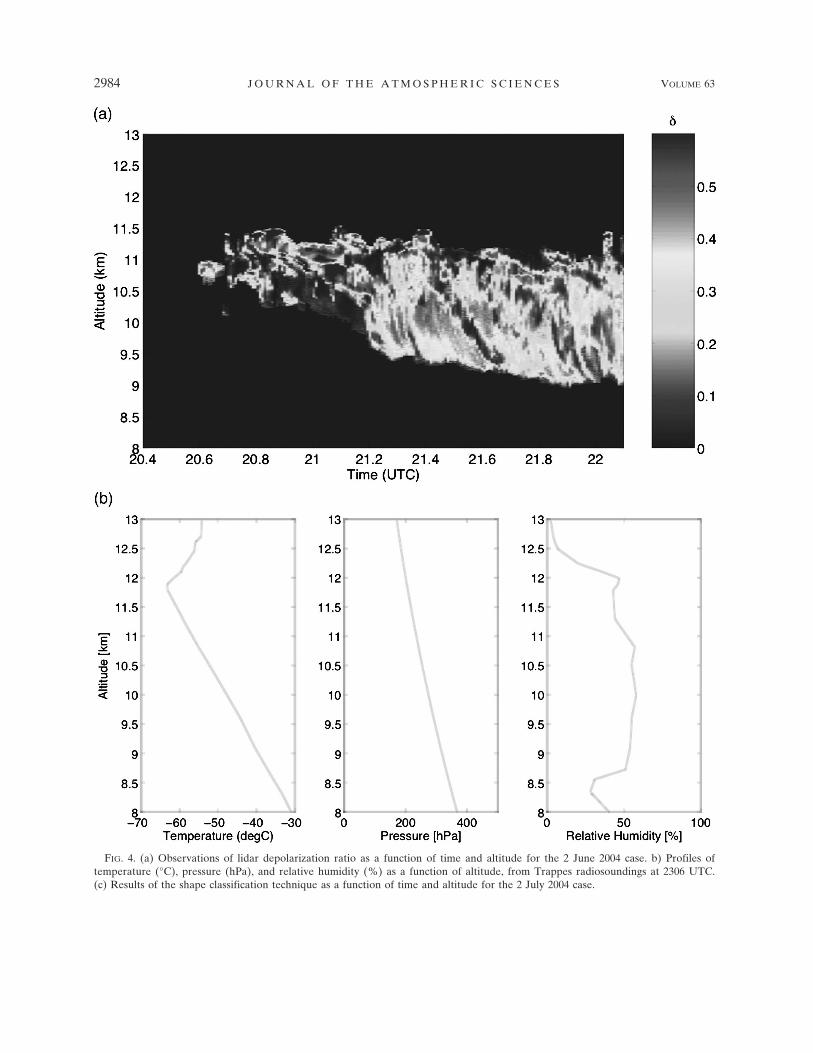
FIG. 4. (a) Observations of lidar depolarization ratio as a function of time and altitude for the 2 June 2004 case. b) Profiles oftemperature (°C), pressure (hPa), and relative humidity (%) as a function of altitude, from Trappes radiosoundings at 2306 UTC.(c) Results of the shape classification technique as a function of time and altitude for the 2 July 2004 case.
2984 J O U R N A L O F T H E A T M O S P H E R I C S C I E N C E S VOLUME 63

FIG. 5. Distribution of shape class relative concentrations as afunction of atmospheric temperature, with second-order polyno-mial regression (dashed lines).
FIG. 4. (Continued)
FIG. 6. Distribution of shape class relative concentrationsas a function of atmospheric relative humidity with respect toice.
NOVEMBER 2006 N O E L E T A L . 2985
Fig 4c live 4/C
concentrations increase (reaching 55% around RHICE
� 140%) and columnlike concentrations fall (below10% at RHICE � 150%). Such high values of RHICE
may suggest the presence of mixed-phase clouds. Theconcentration of irregular shapes stays between 35%and 50% overall. A sharp change can be observed forRHICE � 160%: platelike concentrations fall below25% while the irregular particles rise above 60%. How-ever there are less than 500 data points in this range(i.e., less than 0.1%) so the representativity of this be-havior is unclear.
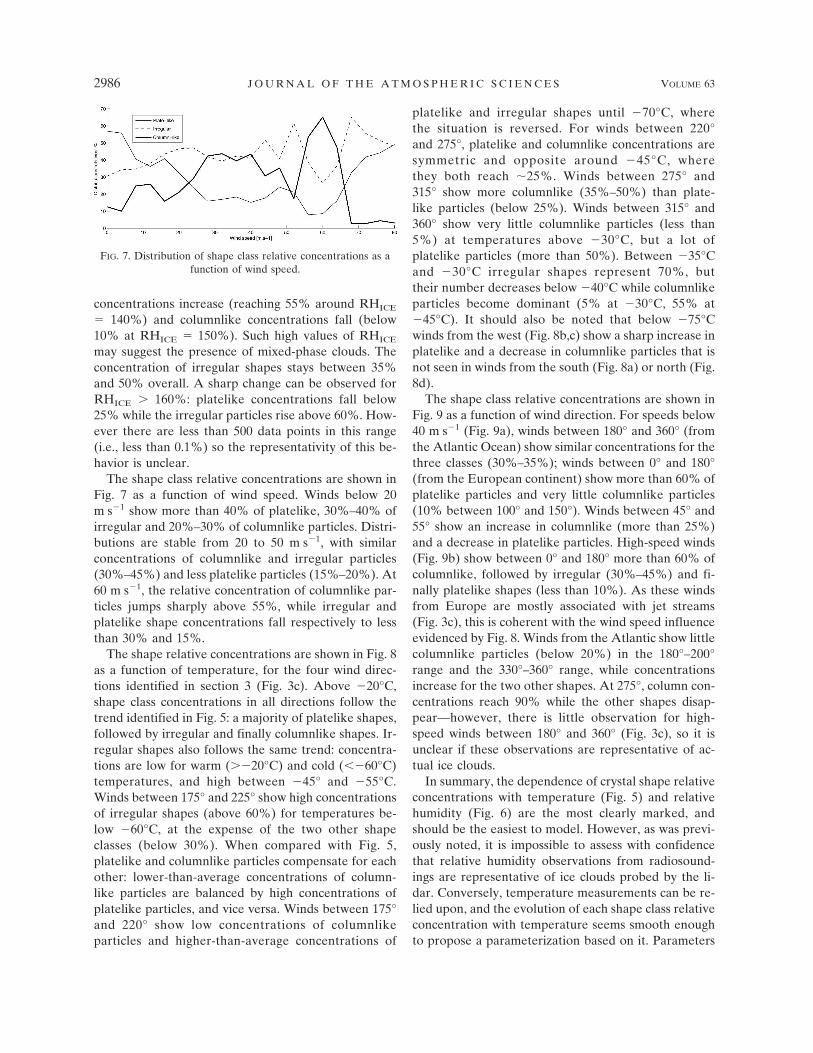
The shape class relative concentrations are shown inFig. 7 as a function of wind speed. Winds below 20m s�1 show more than 40% of platelike, 30%–40% ofirregular and 20%–30% of columnlike particles. Distri-butions are stable from 20 to 50 m s�1, with similarconcentrations of columnlike and irregular particles(30%–45%) and less platelike particles (15%–20%). At60 m s�1, the relative concentration of columnlike par-ticles jumps sharply above 55%, while irregular andplatelike shape concentrations fall respectively to lessthan 30% and 15%.
The shape relative concentrations are shown in Fig. 8as a function of temperature, for the four wind direc-tions identified in section 3 (Fig. 3c). Above �20°C,shape class concentrations in all directions follow thetrend identified in Fig. 5: a majority of platelike shapes,followed by irregular and finally columnlike shapes. Ir-regular shapes also follows the same trend: concentra-tions are low for warm (��20°C) and cold (��60°C)temperatures, and high between �45° and �55°C.Winds between 175° and 225° show high concentrationsof irregular shapes (above 60%) for temperatures be-low �60°C, at the expense of the two other shapeclasses (below 30%). When compared with Fig. 5,platelike and columnlike particles compensate for eachother: lower-than-average concentrations of column-like particles are balanced by high concentrations ofplatelike particles, and vice versa. Winds between 175°and 220° show low concentrations of columnlikeparticles and higher-than-average concentrations of
platelike and irregular shapes until �70°C, wherethe situation is reversed. For winds between 220°and 275°, platelike and columnlike concentrations aresymmetric and opposite around �45°C, wherethey both reach �25%. Winds between 275° and315° show more columnlike (35%–50%) than plate-like particles (below 25%). Winds between 315° and360° show very little columnlike particles (less than5%) at temperatures above �30°C, but a lot ofplatelike particles (more than 50%). Between �35°Cand �30°C irregular shapes represent 70%, buttheir number decreases below �40°C while columnlikeparticles become dominant (5% at �30°C, 55% at�45°C). It should also be noted that below �75°Cwinds from the west (Fig. 8b,c) show a sharp increase inplatelike and a decrease in columnlike particles that isnot seen in winds from the south (Fig. 8a) or north (Fig.8d).
The shape class relative concentrations are shown inFig. 9 as a function of wind direction. For speeds below40 m s�1 (Fig. 9a), winds between 180° and 360° (fromthe Atlantic Ocean) show similar concentrations for thethree classes (30%–35%); winds between 0° and 180°(from the European continent) show more than 60% ofplatelike particles and very little columnlike particles(10% between 100° and 150°). Winds between 45° and55° show an increase in columnlike (more than 25%)and a decrease in platelike particles. High-speed winds(Fig. 9b) show between 0° and 180° more than 60% ofcolumnlike, followed by irregular (30%–45%) and fi-nally platelike shapes (less than 10%). As these windsfrom Europe are mostly associated with jet streams(Fig. 3c), this is coherent with the wind speed influenceevidenced by Fig. 8. Winds from the Atlantic show littlecolumnlike particles (below 20%) in the 180°–200°range and the 330°–360° range, while concentrationsincrease for the two other shapes. At 275°, column con-centrations reach 90% while the other shapes disap-pear—however, there is little observation for high-speed winds between 180° and 360° (Fig. 3c), so it isunclear if these observations are representative of ac-tual ice clouds.
In summary, the dependence of crystal shape relativeconcentrations with temperature (Fig. 5) and relativehumidity (Fig. 6) are the most clearly marked, andshould be the easiest to model. However, as was previ-ously noted, it is impossible to assess with confidencethat relative humidity observations from radiosound-ings are representative of ice clouds probed by the li-dar. Conversely, temperature measurements can be re-lied upon, and the evolution of each shape class relativeconcentration with temperature seems smooth enoughto propose a parameterization based on it. Parameters
FIG. 7. Distribution of shape class relative concentrations as afunction of wind speed.
2986 J O U R N A L O F T H E A T M O S P H E R I C S C I E N C E S VOLUME 63

for second-order polynomial regressions, of the form Ci
� aiT2 � biT � ci, are given in Table 1, with the asso-
ciated curves plotted in dashed lines in Fig. 5. The con-centrations variation with temperature is well repro-duced.
5. Discussion and conclusions
A technique for classifying ice cloud areas into threemajor shape groups (platelike, irregular, or columnlikeshapes) based on observations of lidar depolarizationratio (section 2) has been applied to three years of iceclouds observations over the SIRTA ground-based site(section 3). Results of the shape classification (section4) have been compared with atmospheric variables liketemperature, relative humidity, wind speed, and direc-tion. A strong correlation of particle shape with mostatmospheric variables is found.
The correlation of retrieved particle shapes with rela-tive humidity (Fig. 6) shows that columnlike particlesare rare for low (�20%) or high (�120%) values ofRHICE. High values (110% � RHICE � 150%) arestrongly dominated by platelike particles, while themost frequent values (80% � RHICE � 120%) show abalanced mix of platelike, irregular, and columnlikeshapes (30%–45% for each shape). However, as rela-
TABLE 1. Parameters for second-order polynomial regression ofeach shape group i relative concentration as a function of tem-perature: Ci � aiT
2 � biT � ci.
Shape class a b c
Platelike (class 1) 0.0194 2.356 88.46Irregular (class 2) �0.0269 �2.149 5.71Columns (class 3) 0.0075 �0.206 5.82
FIG. 9. Distribution of shape class relative concentrations as afunction of wind direction, for wind speeds (a) below 45 m s�1 and(b) above 45 m s�1.
FIG. 8. Distribution of shape class relative concentrations as a function of temperature, for wind directions (a) between 175° and225° (SSW), (b) between 220° and 275° (WSW), (c) between 275° and 315° (WNW), and (d) between 315° and 360° (NNW).
NOVEMBER 2006 N O E L E T A L . 2987

tive humidity measurements from probes are difficult atthe high altitude of ice clouds because of the high spa-tial variability of this parameter, more detailed obser-vations (e.g., from coincident in situ probes; Heymsfieldand Miloshevitch 1995) are therefore needed to con-firm these results.
Correlation of particle shapes with wind direction(Figs. 8 and 9) shows that different composition of airmasses coming from different sources have a strongimpact on the microphysical properties of the createdice cloud: winds from the east (0°–180°) show a specificcomposition (low concentration of columnlike par-ticles, dominance of platelike particles for low windspeeds and irregular for high wind speeds), differentfrom the one of winds from the west (columnlike par-ticles dominate, whatever the wind speed). The corre-lation of retrieved particle shapes with wind speed (Fig.8) shows that higher wind speeds lead to more column-like particles, with a specific shape distribution for windspeeds �60 m s�1. This suggests that ice clouds createdin the presence of jet streams are dominated by col-umnlike particles (more than 50%) or particles of highcomplexity such as bullet rosettes (Heymsfield et al.2002b), followed by lower concentrations of irregularshapes (�30%) and a marked minority of platelikeshapes (�10%). As jet streams are generally present atcoldest temperatures, close to the tropopause, this isconsistent with the temperature distribution of shapeclasses (Fig. 5), which shows a majority of columns insuch temperature ranges. columnlike shapes are how-ever not restricted to jet-created ice clouds. The distri-bution of wind speeds (Fig. 3) shows that high windspeeds are poorly represented in ice clouds observedover the SIRTA (less than 1% of the entire populationof ice clouds). This might suggests that ice cloud cre-ation by jet streams is of limited importance at thislocation, but it might also be explained by correlation ofjet streams with lower, optically thick cloud systemsthat would hide the ice cloud to the lidar. Such a cor-relation could be coincidental, or due to some unex-plained relationship between low-level cloud systemsand jet streams. Jet-created ice clouds would then beunderrepresented in the current dataset.
The correlation between particle shapes and tem-perature is maybe the most pronounced one (Fig. 5),with a clear and successive dominance by platelike, ir-regular, and columnlike shapes as temperature de-creases. This evolution is due to the different physicalprocesses dominating crystal formation at differenttemperatures (Sassen et al. 1989), which are howeverstill unclear at this point. Concentration of platelikeparticles is higher in warm ice clouds (above �20°C)and decreases with colder temperatures while concen-
tration of irregular shapes slowly increases. This mix-ture of platelike and irregular shapes is coherent withthe temperature range, which is identified with theplate and dendrite growth regime (Pruppacher andKlett 1997). The concentration of columnlike particleslowly increases with decreasing temperatures, to com-pletely dominate the particle population at coldest tem-peratures (below �70°C), where the more pristine andgeometric particles are to be expected. This trend, co-herent with results from Hallett (1987), can be ex-plained either by in situ formation of pristine and geo-metric particles at extremely cold temperatures, or bygeneral changes in the shape of crystals as they movefrom warmer to colder temperatures (Sassen and Ben-son 2001). Relative concentration of irregular shapes islow at extreme temperatures (both coldest and warm-est), but dominates the ice particles population atmidlevel temperatures (�50° to �40°C). For the cold-est temperatures (below �75°C), a sharp increase inthe concentration of platelike particles is observed,coupled to a decrease in columnlike particle concentra-tions. This last change might just be a local effect due tothe small number of data points in this temperaturerange (Fig. 2a). However, the possibility that these ob-servations are significant of extremely cold ice cloudthat would exhibit specific microphysical properties(Heymsfield 1986) should not be excluded. The evolu-tion of shape class relative concentrations with tem-perature is reproduced quite well by second-order poly-nomial regressions. As the crystal shape influences itsfall speed in the cloud (Heymsfield and Iaquinta 2000),these relative concentrations could also help refine theparameterization of ice particle sedimentation speedsas a function of temperature or latitude, once a morecomprehensive lidar dataset is available.
Even if the considered dataset extends over a largetime period, the observations remain local, and it isunclear whether they are actually representative of theentire population of midlatitude ice clouds. It can benoted however that these results are consistent withprevious studies using lidar observations, such as the6-yr midlatitude ice cloud climatology presented bySassen and Benson (2001), which shows a regular in-crease in depolarization ratio with falling temperatures(from � � 0.25 at �17.5°C to � � 0.45 at �77.5°C), andconcludes to high concentrations of platelike particlesfor temperatures above �20°C. For temperatures be-low �55°C, ice crystal observations from in situ air-borne Particle Measuring System (PMS) probes stressthe high frequency of columnlike particles (Heymsfieldand Platt 1984). Other in situ observations in high- andmidlatitude ice clouds (Korolev and Hallett 2000) alsosuggest high concentrations of irregular shapes, with
2988 J O U R N A L O F T H E A T M O S P H E R I C S C I E N C E S VOLUME 63
coldest temperatures dominated by columns. Compari-son of the present results with passive satellite retriev-als is difficult because of the unknown vertical integrat-ing distance of such studies; however, analysis of satel-lite observations using the POLDER radiometer(Chepfer et al. 2001) have highlighted the strong vari-ability of dominant crystal shape with latitude.
In that respect, it is interesting to compare thepresent retrievals with results of the same analysis ap-plied to 3 days of tropical convective ice clouds (Noel etal. 2004), observed with the airborne and downward-looking cloud physics lidar (CPL; McGill et al. 2002)during the CRYSTAL-FACE campaign (Jensen et al.2004), that showed a constant minority of columnlikeparticles (less than 10%) coupled with a quasi-lineardecrease of the concentration of platelike particles(from 65% at �20°C to 10% at �70°C) and a simulta-neous increase in irregular shapes (from 30% at �20°Cto more than 80% at �70°C). Tropical convective iceclouds thus showed dominance of platelike particles atwarmest temperatures (above �35°C, similar to mid-latitude ice clouds), while irregular shapes dominatedall temperatures below �35°C, with no trace of theregular increase in columns observed in midlatitude iceclouds (Fig. 6).
These strong differences between tropical and mid-latitude ice clouds remind us that different formationprocesses lead to different microphysical properties,which in turn lead to strong differences in the cloudsradiative impact (Takano and Liou 1989). These differ-ences need to be taken into account in numerical mod-els of climate prediction. The large observation datasetof the present study (three years of observations) en-sures that the suggested parameterizations may be con-sidered representative of midlatitude ice clouds withsome confidence. Of course, this assumes that iceclouds observed over the SIRTA ground-based sitesare representative of midlatitude ice clouds; in order tovalidate that hypothesis, and make sure that no localsynoptic process due to the proximity to the AtlanticOcean is at work, more midlatitude ice clouds fromdifferent locations should be studied. Similar studies intropical convective ice clouds suggest that similar pa-rameterizations could be done at other latitudes, how-ever there too more observations are be required to getrepresentative results. Unfortunately, lidar studies oftropical convective systems are extremely difficult dueto their high optical thickness that blocks lidar penetra-tion from the ground. In this context, the space-basedCloud Aerosol Lidar and Infrared Pathfinder SatelliteObservations mission (CALIPSO; Winker et al. 2003)sent a 532-nm lidar into orbit in June 2006 to observeice cloud properties from above, even on top of opti-
cally thick cloud systems, all around the globe. Theshape classification technique featured in the presentstudy has been selected by the National Aeronauticsand Space Administration (NASA) to be applied on anoperational basis on the linear depolarization ratios ob-served from the CALIPSO lidar, and the retrievedshape class relative concentrations will be integratedinto the level 2 products available as soon as January2006. At this point, it is important to stress the limita-tions of the classification scheme: only three shape cat-egories can be considered, which reflects only partiallythe infinite variety of particles found in ice clouds.More research and simulations are therefore needed torefine this classification Moreover, the impact of orien-tation and shape on depolarization ratios is still notfully understood, thus the interpretation of these resultscould change based on new advances in light scatteringmodels or laboratory experiment. In the present day,however, this kind of study is one of the few that canprovide large-scale retrieval of information about par-ticle shape, leading to global maps of particle shapeclass concentrations and giving an invaluable insightinto the microphysical properties of ice clouds, what-ever the latitude. Moreover, results of this classificationwill be used operationally in algorithms of particle sizeretrieval using observations from the three-channel In-frared Imager (IIR) radiometer, also present on theCALIPSO platform (Chiriaco et al. 2006). These ob-servations will provide a unique point of view on themicrophysical properties of ice clouds that will allowstudying the link between thermodynamic variablesand the particle shape associated to various ice cloudformations types in different regions of the globe.
Acknowledgments. This research was supported inpart by the NASA Langley Research Center under con-tract NAS1-02058. The authors thank the SIRTA tech-nical and computer staff (Christophe Boitel, FlorianLapouge, Dr. Christophe Pietras, Bernard Romand)for taking the observations and making the dataset eas-ily accessible. The authors thank Dave M. Winker forhis support.
REFERENCES
Breon, F. M., and B. Dubrulle, 2004: Horizontally oriented platesin clouds. J. Atmos. Sci., 61, 2888–2898.
Cess, R. D., and Coauthors, 1990: Intercomparison and interpre-tation of climate feedback processes in 19 atmospheric gen-eral circulation models. J. Geophys. Res., 95, 16 601–16 615.
——, and Coauthors, 1996: Cloud feedback in atmospheric gen-eral circulation models: An update. J. Geophys. Res., 101,12 791–12 794.
Chen, W.-N., C. Chih-W., and J.-B. Nee, 2002: Lidar ratio and
NOVEMBER 2006 N O E L E T A L . 2989

depolarization ratio for cirrus clouds. Appl. Opt., 40, 6470–6476.
Chepfer, H., G. Brogniez, P. Goloub, F. M. Breon, and P. H. Fla-mant, 1999: Observations of horizontally oriented ice crystalsin cirrus clouds with POLDER-1/ADEOS-1. J. Quant. Spec-trosc. Radiat. Transfer, 63, 521–543.
——, P. Goloub, J. Riedi, J. De Haan, J. Hovenier, and P. H.Flamant, 2001: Ice crystal shapes in cirrus clouds derivedfrom POLDER-1/ADEOS-1. J. Geophys. Res., 106, 7955–7966.
——, V. Noel, P. Minnis, D. Baumgardner, L. Nguyen, G. Raga,M. J. McGill, and P. Yang, 2005: Particle habit in tropical iceclouds during CRYSTAL-FACE: Comparison of two remotesensing techniques with in-situ observations. J. Geophys.Res., 110, D16204, doi:10.1029/2004JD005445.
Chiriaco, M., H. Chepfer, V. Noel, A. Delaval, M. Haeffelin, P.Dubuisson, and P. Yang, 2004: Improving retrievals of cirruscloud particle size coupling lidar and three-channel radiomet-ric techniques. Mon. Wea. Rev., 132, 1684–1700.
——, and Coauthors, 2006: Comparison of CALIPSO-like, LaRC,and MODIS retrievals of ice-cloud properties over SIRTA inFrance and Florida during CRYSTAL-FACE. J. Appl. Me-teor. Climatol., in press.
Cox, S. K., D. S. MacDougal, D. A. Randall, and R. A. Schiffer,1987: FIRE—The First ISCCP Regional Experiment. Bull.Amer. Meteor. Soc., 68, 114–118.
Francis, P. N., A. Jones, R. W. Saunders, K. P. Shine, A. Slingo,and Z. Sun, 1994: An observational and theoretical study ofthe radiative properties of cirrus: Some results from ICE’89.Quart. J. Roy. Meteor. Soc., 120, 809–848.
Garrett, T. J., H. Gerber, D. G. Baumgardner, C. H. Twohy, andE. M. Weinstock, 2003: Small, highly reflective ice crystals inlow-latitude cirrus. Geophys. Res. Lett., 30, 2132, doi:10.1029/2003GL018153.
Goldfarb, L., P. Keckhut, M.-L. Chanin, and A. Hauchecorne,2001: Cirrus climatological results from lidar measurementsat OHP (44N, 6E). Geophys. Res. Lett., 28, 1687–1690.
Haeffelin, M., and Coauthors, 2005: SIRTA, a ground-based at-mospheric observatory for cloud and aerosol research. Ann.Geophys., 23, 253–275.
Hallett, J., 1987: Faceted snow crystals. J. Opt. Soc. Amer., 4,581–588.
Heymsfield, A. J., 1986: Ice particles observed in a cirriform cloudat �83°C and implications for polar stratospheric clouds. J.Atmos. Sci., 43, 851–855.
——, and C. M. R. Platt, 1984: A parameterization of the particlesize spectrum of ice clouds in terms of the ambient tempera-ture and the ice water content. J. Atmos. Sci., 41, 846–855.
——, and M. Kajikawa, 1987: An improved approach to calculat-ing terminal velocities of platelike crystals and graupels. J.Atmos. Sci., 44, 1088–1099.
——, and L. M. Miloshevich, 1995: Relative humidity and tem-perature influences on cirrus formation and evolution: Ob-servations from wave clouds and FIRE II. J. Atmos. Sci., 52,4302–4326.
——, and J. Iaquinta, 2000: Cirrus crystal terminal velocity. J.Atmos. Sci., 57, 916–938.
——, A. Bansemer, P. R. Field, S. L. Durden, J. L. Stith, J. E.Dye, W. Hall, and C. A. Grainger, 2002a: Observations andparameterizations of particle size distributions in deep tropi-cal cirrus and stratiform precipitating clouds: Results from insitu observations in TRMM field campaigns. J. Atmos. Sci.,59, 3457–3491.
——, S. Lewis, A. Bansemer, J. Iaquinta, L. M. Miloshevich, M.Kajikawa, C. Twohy, and M. R. Poellot, 2002b: A generalapproach for deriving the properties of cirrus and stratiformice cloud particles. J. Atmos. Sci., 59, 3–29.
Hu, Y. X., D. Winker, P. Yang, B. Baum, L. Poole, and L. Vann,2001: Identification of cloud phase from PICASSO-CENAlidar depolarization: A multiple scattering sensitivity study. J.Quant. Spectrosc. Radiat. Transfer, 70, 569–579.
Jayaweera, K. O. L. F., and B. J. Mason, 1965: The behaviour offreely falling cylinders and cones in a viscous fluid. J. FluidMech., 22, 709–720.
——, and R. E. Cottis, 1969: Fall velocities of platelike and co-lumnar ice crystals. Quart. J. Roy. Meteor. Soc., 95, 703–709.
Jensen, E. J., D. Starr, and O. B. Toon, 2004: Mission investigatestropical cirrus clouds. Eos, Trans. Amer. Geophys. Union, 85,45–50.
Korolev, A. V., and G. A. Isaac, 1999: Ice particle habits in Arcticclouds. Geophys. Res. Lett., 26, 1299–1302.
Korolev, G. A., and I. J. Hallett, 2000: Ice particle habits in strati-form clouds. Quart. J. Roy. Meteor. Soc., 126, 2873–2902.
Liou, K. N., 1986: Influence of cirrus clouds on weather and cli-mate processes: A global perspective. Mon. Wea. Rev., 114,1167–1199.
Mace, G. G., D. C. O’Starr, T. P. Ackerman, and P. Minnis, 1995:Examination of coupling between an upper-troposphericcloud system and synoptic-scale dynamics diagnosed fromwind profiler and radiosonde data. J. Atmos. Sci., 52, 4094–4127.
Masuda, K., H. Ishimoto, and T. Takashima, 2002: Retrieval ofcirrus optical thickness and ice-shape information using totaland polarized reflectance from satellite measurements. J.Quant. Spectrosc. Radiat. Transfer, 75, 39–51.
McGill, M. J., D. L. Hlavka, W. D. Hart, J. D. Spinhirne, V. S.Scott, and B. Schmid, 2002: The cloud physics lidar: Instru-ment description and initial measurement results. Appl. Opt.,41, 3725–3734.
Mishchenko, M. I., W. B. Rossow, A. Macke, and A. Lacis, 1996:Sensitivity of cirrus cloud albedo, bidirectional reflectanceand optical thickness retrieval accuracy to ice particle shape.J. Geophys. Res., 101, 16 973–16 985.
Mitchell, D. L., 1996: Use of mass- and area-dimensional powerlaws for determining precipitation particle terminal veloci-ties. J. Atmos. Sci., 53, 1710–1723.
Morille, Y., M. Haeffelin, P. Drobinski, and J. Pelon, 2006:STRAT: An automated algorithm to retrieve the verticalstructure of the atmosphere from single channel lidar data. J.Atmos. Oceanic. Technol., in press.
Noel, V., and H. Chepfer, 2004: Study of ice crystal orientation incirrus clouds based on satellite polarized radiance measure-ments. J. Atmos. Sci., 61, 2073–2081.
——, and K. Sassen, 2005: Study of planar ice crystal orientationsin ice clouds from scanning polarization lidar observations. J.Appl. Meteor., 44, 653–664.
——, H. Chepfer, G. Ledanois, and P. H. Flamant, 2001: Compu-tation of a single scattering matrix for nonspherical particlesrandomly or horizontally oriented in space. Appl. Opt., 40,4365–4375.
——, ——, G. Ledanois, A. Delaval, and P. H. Flamant, 2002:Classification of particle shape ratios in cirrus clouds basedon the lidar depolarization ratio. Appl. Opt., 41, 4245–4257.
——, D. M. Winker, M. McGill, and P. Lawson, 2004: Classifica-tion of particle shapes from lidar depolarization ratio in con-
2990 J O U R N A L O F T H E A T M O S P H E R I C S C I E N C E S VOLUME 63

vective ice clouds compared to in situ observations duringCRYSTAL-FACE. J. Geophys. Res., 109, D24213,doi:10.1029/2004JD004883.
Platt, C. M. R., 1973: Lidar and radiometric observations of cirrusclouds. J. Atmos. Sci., 30, 1191–1204.
——, 1977: Lidar observations of a mixed-phase altostratus cloud.J. Appl. Meteor., 16, 339–345.
——, N. L. Abshire, and G. T. McNice, 1978: Some microphysicalproperties of an ice cloud from lidar observations of horizon-tally oriented crystals. J. Appl. Meteor., 17, 1220–1224.
Pruppacher, H. R., and J. D. Klett, 1997: Microphysics of Cloudsand Precipitation. Kluwer Academic, 914 pp.
Rolland, P., K. N. Liou, M. D. King, S. C. Tsay, and G. M. Mc-Farquhar, 2000: Remote sensing of optical and microphysicalproperties of cirrus clouds using MODIS channels. J. Geo-phys. Res., 105, 11 721–11 738.
Sassen, K., 1977: Ice crystal habit discrimination with the opticalbackscatter depolarization technique. J. Appl. Meteor., 16,425–431.
——, 1980: Remote sensing of planar ice crystals fall attitude. J.Meteor. Soc. Japan, 58, 422–433.
——, 1991: The polarization lidar technique for cloud research: Areview and current assessment. Bull. Amer. Meteor. Soc., 72,1848–1866.
——, and S. Benson, 2001: A midlatitude cirrus cloud climatologyfrom the facility for atmospheric remote sensing. Part II: Mi-crophysical properties derived from lidar depolarization. J.Atmos. Sci., 58, 2103–2111.
——, and J. R. Campbell, 2001: A midlatitude cirrus cloud clima-tology from the Facility for Atmospheric Remote Sensing.Part I: Macrophysical and synoptic properties. J. Atmos. Sci.,58, 481–496.
——, M. Griffin, and G. C. Dodd, 1989: Optical scattering andmicrophysical properties of subvisual cirrus clouds and cli-matic implications. J. Appl. Meteor., 28, 91–98.
——, P. W. Arnott, D. O.’ C. Starr, G. G. Mace, Z. Wang, andM. R. Poellot, 2003a: Midlatitude cirrus clouds derived fromHurricane Nora: A case study with implications for ice crystalnucleation and shape. J. Atmos. Sci., 60, 873–891.
——, K. N. Liou, Y. Takano, and V. I. Khvorostyanov, 2003b:Diurnal effects in the composition of cirrus clouds. Geophys.Res. Lett., 30, 1539, doi:10.1029/2003GL017034.
Sauvage, L., H. Chepfer, V. Trouillet, P. H. Flamant, G. Brogniez,and J. Pelon, 1999: Remote sensing of cirrus radiative param-eters during EUCREX’94. Part I: Observations and analysesat the regional scale. Mon. Wea. Rev., 127, 486–503.
Stephens, G. L., S.-C. Tsay, P. W. Stackhouse, and P. J. Flatau,1990: The relevance of the microphysical and radiative prop-erties of cirrus clouds to climate and climate feedback. J.Atmos. Sci., 47, 1742–1753.
Sun, Z., and K. P. Shine, 1995: Parameterization of ice cloud ra-diative properties and its application to the potential climaticimportance of mixed-phased clouds. J. Climate, 8, 1874–1888.
Takano, Y., and K. N. Liou, 1989: Solar radiative transfer in cirrusclouds. Part I: Single-scattering and optical properties of hex-agonal ice crystals. J. Atmos. Sci., 46, 3–18.
Wang, P., P. Minnis, M. P. McCormick, G. S. Kent, and K. M.Skeens, 1996: A 6-year climatology of cloud occurrence fre-quency from SAGE II observations (1985–1990). J. Geophys.Res., 101, 407–429.
Winker, D. M., J. Pelon, and M. P. McCormick, 2003: TheCALIPSO mission: Spaceborne lidar for observation of aero-sols and clouds. Proc. SPIE Int. Soc. Opt. Eng., 4893, 1–11.
Yang, P., and Coauthors, 2001: Sensitivity of cirrus bidirectionalreflectance to vertical inhomogeneous of ice crystals habitsand size distribution for two Moderate-Resolution ImagingSpectroradiometer (MODIS). J. Geophys. Res., 106, 17 267–17 291.
Young, A. T., 1980: Revised depolarization corrections for atmo-spheric extinction. Appl. Opt., 19, 3427–3428.
NOVEMBER 2006 N O E L E T A L . 2991