Evidence of impact of aviation on cirrus cloud formation
25
ACPD 3, 3335–3359, 2003 Evidence of impact of aviation on cirrus cloud formation C. S. Zerefos et al. Title Page Abstract Introduction Conclusions References Tables Figures Back Close Full Screen / Esc Print Version Interactive Discussion © EGU 2003 Atmos. Chem. Phys. Discuss., 3, 3335–3359, 2003 www.atmos-chem-phys.org/acpd/3/3335/ © European Geosciences Union 2003 Atmospheric Chemistry and Physics Discussions Evidence of impact of aviation on cirrus cloud formation C. S. Zerefos 1 , K. Eleftheratos 1 , D. S. Balis 2 , P. Zanis 3 , G. Tselioudis 4 , and C. Meleti 2 1 Laboratory of Climatology & Atmospheric Environment, Faculty of Geology, National & Kapodistrian University of Athens, Greece 2 Laboratory of Atmospheric Physics, Aristotle University of Thessaloniki, Greece 3 Research Center for Atmospheric Physics & Climatology, Academy of Athens, Greece 4 Goddard Institute for Space Studies, National Aeronautics and Space Administration, USA Received: 28 May 2003 – Accepted: 23 June 2003 – Published: 30 June 2003 Correspondence to: C. S. Zerefos ([email protected]) 3335
-
Upload
independent -
Category
Documents
-
view
2 -
download
0
Transcript of Evidence of impact of aviation on cirrus cloud formation
ACPD3, 3335–3359, 2003
Evidence of impact ofaviation on cirruscloud formation
C. S. Zerefos et al.
Title Page
Abstract Introduction
Conclusions References
Tables Figures
J I
J I
Back Close
Full Screen / Esc
Print Version
Interactive Discussion
© EGU 2003
Atmos. Chem. Phys. Discuss., 3, 3335–3359, 2003www.atmos-chem-phys.org/acpd/3/3335/© European Geosciences Union 2003
AtmosphericChemistry
and PhysicsDiscussions
Evidence of impact of aviation on cirruscloud formationC. S. Zerefos1, K. Eleftheratos1, D. S. Balis2, P. Zanis3, G. Tselioudis4, andC. Meleti2
1Laboratory of Climatology & Atmospheric Environment, Faculty of Geology, National &Kapodistrian University of Athens, Greece2Laboratory of Atmospheric Physics, Aristotle University of Thessaloniki, Greece3Research Center for Atmospheric Physics & Climatology, Academy of Athens, Greece4Goddard Institute for Space Studies, National Aeronautics and Space Administration, USA
Received: 28 May 2003 – Accepted: 23 June 2003 – Published: 30 June 2003
Correspondence to: C. S. Zerefos ([email protected])
3335
ACPD3, 3335–3359, 2003
Evidence of impact ofaviation on cirruscloud formation
C. S. Zerefos et al.
Title Page
Abstract Introduction
Conclusions References
Tables Figures
J I
J I
Back Close
Full Screen / Esc
Print Version
Interactive Discussion
© EGU 2003
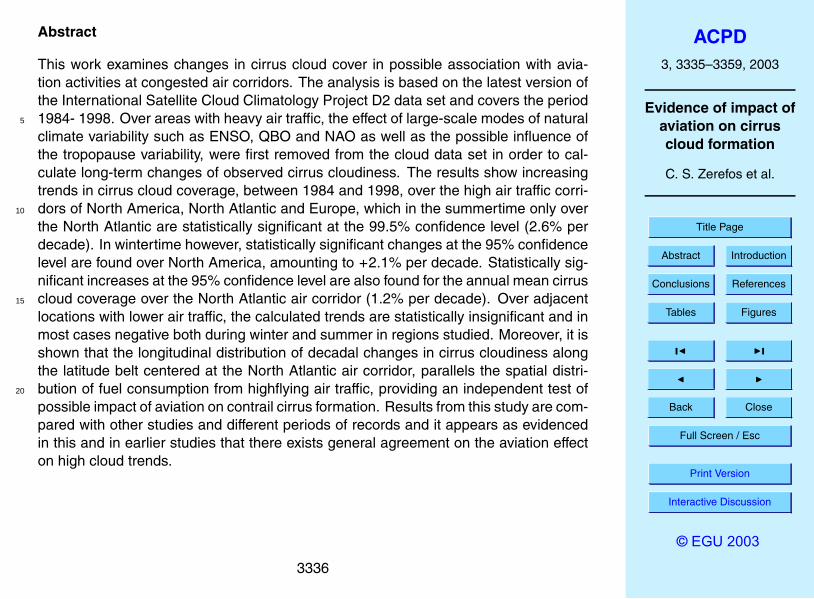
Abstract
This work examines changes in cirrus cloud cover in possible association with avia-tion activities at congested air corridors. The analysis is based on the latest version ofthe International Satellite Cloud Climatology Project D2 data set and covers the period1984- 1998. Over areas with heavy air traffic, the effect of large-scale modes of natural5
climate variability such as ENSO, QBO and NAO as well as the possible influence ofthe tropopause variability, were first removed from the cloud data set in order to cal-culate long-term changes of observed cirrus cloudiness. The results show increasingtrends in cirrus cloud coverage, between 1984 and 1998, over the high air traffic corri-dors of North America, North Atlantic and Europe, which in the summertime only over10
the North Atlantic are statistically significant at the 99.5% confidence level (2.6% perdecade). In wintertime however, statistically significant changes at the 95% confidencelevel are found over North America, amounting to +2.1% per decade. Statistically sig-nificant increases at the 95% confidence level are also found for the annual mean cirruscloud coverage over the North Atlantic air corridor (1.2% per decade). Over adjacent15
locations with lower air traffic, the calculated trends are statistically insignificant and inmost cases negative both during winter and summer in regions studied. Moreover, it isshown that the longitudinal distribution of decadal changes in cirrus cloudiness alongthe latitude belt centered at the North Atlantic air corridor, parallels the spatial distri-bution of fuel consumption from highflying air traffic, providing an independent test of20
possible impact of aviation on contrail cirrus formation. Results from this study are com-pared with other studies and different periods of records and it appears as evidencedin this and in earlier studies that there exists general agreement on the aviation effecton high cloud trends.
3336
ACPD3, 3335–3359, 2003
Evidence of impact ofaviation on cirruscloud formation
C. S. Zerefos et al.
Title Page
Abstract Introduction
Conclusions References
Tables Figures
J I
J I
Back Close
Full Screen / Esc
Print Version
Interactive Discussion
© EGU 2003
1. Introduction
Cirrus clouds are the most common form of high-level clouds forming in the vicinity ofthe tropopause. In the tropics, their formation is mainly triggered by deep convection(Jensen et al., 1996); in the northern middle latitudes, they are associated to the ex-istence of large ice supersaturated regions in the upper troposphere (Gierens et al.,5
2000). Cirrus cloud formation depends strongly on the existence of small particlesthat provide the surface on which ice crystals nucleate (Jensen and Toon, 1997). Cir-rus clouds have alternately two opposite effects; an IR greenhouse effect and a solaralbedo effect. Which effect dominates, depends strongly on optical properties. Thincirrus clouds usually produce a positive radiative forcing (RF) at the top of the atmo-10
sphere; thick cirrus clouds may cause cooling (Stephens and Webster, 1983; Fu andLiou, 1993; Fahey and Schumann, 1999).
Contrails are visible line-shaped clouds that form in the wake of aircraft, when therelative humidity in the plume of exhaust gases mixing with ambient air temporarilyreaches liquid saturation, so that liquid droplets form on cloud condensation nuclei and15
soon freeze to ice particles (Schumann, 2002). Parameters determining contrail for-mation and persistence are analytically described in Schumann (1996). Contrails mayevaporate quickly when the ambient air is dry, or persist for hours when the ambientair is substantially supersaturated with respect to ice (Jensen et al., 1998). Ice super-saturated regions in the upper troposphere of the northern middle latitudes are very20
common (Gierens et al., 1999; Jensen et al., 2001). These regions and the numberof aircraft flights in these regions control the area of the Earth covered by persistentcontrails (Fahey and Schumann, 1999).
The influence of contrails on the radiation budget depends mainly on their coverageand optical depth (Meyer et al., 2002; Schumann, 2002). Like thin layers of cirrus25
clouds, contrails usually produce a small heating at the top of the atmosphere. Re-gional and global estimates of contrail RF can be found in numerous studies (Meerkoet-ter et al., 1999; Minnis et al., 1999; Marquart and Mayer 2002; Meyer et al., 2002;
3337
ACPD3, 3335–3359, 2003
Evidence of impact ofaviation on cirruscloud formation
C. S. Zerefos et al.
Title Page
Abstract Introduction
Conclusions References
Tables Figures
J I
J I
Back Close
Full Screen / Esc
Print Version
Interactive Discussion
© EGU 2003
Ponater et al., 2002). IPCC follows Fahey and Schumann (1999) and retains a rangeof 5 to 60 mW/m2 for the present day contrail RF, around the best estimate of 20 mW/m2
(IPCC, 2001).Contrail occurrence and coverage have been observed using satellite and ground-
based observations. The mean coverage of line-shaped contrails is greatest over the5
USA, over Europe and over the North Atlantic (Fahey and Schumann, 1999). Sur-face observations of contrail occurrence from 17 bases across the continental USAindicated that contrail occurrence varies substantially with location and season. Mostcontrails prevailed in winter and least during the summer with a pronounced minimumin September (Minnis et al., 2003). Bakan et al. (1994), using NOAA/AVHRR infrared10
images, found a mean contrail cover of 0.5% over the eastern Atlantic/western Europeand showed that the highest contrail coverage (>2%) lies along the North Atlantic airroutes during the summertime. Sausen et al. (1998) calculated a global contrail covervalue of 0.09%, with maximum values exceeding 5% over certain regions in USA. Overthe USA and Europe, larger values occurred in winter than in summer. Calculations15
of the seasonal variability in contrail coverage over the US by Ponater et al. (2002)were found to be in agreement with previous studies (Minnis et al., 1997; Sausen etal., 1998). Over eastern Atlantic/western Europe they simulated a higher peak value inthe summer compared to the winter, which was consistent to the results by Bakan etal. (1994) but in contradiction to the findings of Meyer et al. (2002) and of Sausen et20
al. (1998).Few studies have examined trends in cirrus cloudiness. Wylie and Menzel (1999),
showed evidence of a gradual increase in the occurrence of high clouds in the north-ern middle latitudes (0.5% yr−1), while the change in the southern middle latitudes wasconsidered insignificant due to the very small cloud coverage. Boucher (1999) calcu-25
lated seasonal and annual mean global and regional trends in cirrus occurrence overland and ocean for the period 1982–1991. The highest increases in annual mean cir-rus occurrence were observed over the main air flight corridors (i.e. 13.3% per decadeover the northeastern USA and 7.1% per decade over the North Atlantic air corridor).
3338
ACPD3, 3335–3359, 2003
Evidence of impact ofaviation on cirruscloud formation
C. S. Zerefos et al.
Title Page
Abstract Introduction
Conclusions References
Tables Figures
J I
J I
Back Close
Full Screen / Esc
Print Version
Interactive Discussion
© EGU 2003
These trends were attributed to condensation trail formation by aircraft exhaust gases,excluding the contribution of other possible causes such as the effects of the El Chi-chon and Mount Pinatubo volcanic aerosols, or long-term changes in relative humidityand climate variations related to the North Atlantic Oscillation. Minnis et al. (2001), cal-culated trends in high cloud cover over air traffic and non-air traffic regions and found a5
statistically significant increase in high cloud coverage over areas where air traffic washeaviest relative to other regions, concluding that air traffic could cause an increasein cloud cover. Trends in cirrus-high level clouds over regions with contrail coveragegreater than or less than 0.5% were summarized in Fahey and Schumann (1999) (theirTable 3-5). Both satellite data and surface observations showed larger increases in10
cirrus-high level cloudiness in regions where contrails were expected to occur morefrequently than in all other areas.
Although satellite and surface-based observations of seasonal and decadal changesin cirrus frequency of occurrence over main air traffic regions suggested a possible rela-tionship between air traffic and cirrus formation, Fahey and Schumann (1999) stressed15
the difficulty to attribute observed changes in cirrus coverage to aircraft emissions. Theaim of the present work is to study changes in cirrus cloud cover over locations nearand remote from air corridors and to compare them with earlier results with respect toevidence of effects from aviation.
2. Data sources and methodology20
The cloud dataset analyzed in this study is produced by the International Satellite CloudClimatology Project (ISCCP) (Rossow et al., 1996). The data set contains detailed in-formation on the distribution of cloud radiative properties and their diurnal and seasonalvariations, as well as information on the vertical distribution of temperature and humid-ity in the troposphere. The data are based on observations from the suite of operational25
geostationary and polar orbiting satellites. Visible radiances are used to retrieve theoptical thickness of clouds and infrared radiances to retrieve cloud top temperature
3339

ACPD3, 3335–3359, 2003
Evidence of impact ofaviation on cirruscloud formation
C. S. Zerefos et al.
Title Page
Abstract Introduction
Conclusions References
Tables Figures
J I
J I
Back Close
Full Screen / Esc
Print Version
Interactive Discussion
© EGU 2003
and pressure. The revised (D2) version of the data set used in this study has a spa-tial resolution of 280 km (2.5◦ at the equator) and provides monthly averages of cloudproperties and their diurnal variation. For each map grid-box, both the mean propertiesof the cloud field and the properties of fifteen different cloud types are provided. Thecloud types are derived based on radiometric definitions that rely on cloud optical thick-5
ness and cloud top pressure. Cirrus clouds are defined as those with optical thicknessless than 3.6 and cloud top pressure less than 440 mb.
The air traffic density over the globe is examined using the aviation fuel consump-tion inventory (civil and military) as determined by the Deutsches Zentrum fur Luft-und Raumfahrt (DLR). The method used by DLR to produce this dataset has been10
described by Schmitt and Brunner (1997) and has been used in national and interna-tional work programs, such as the IPCC report, where it was noted that among otherglobal inventories of civil and military aircraft fuel emissions, DLR fuel consumptioninventory is suitable for calculating the effects of aircraft emissions on the atmosphere(Henderson and Wickrama, 1999). The emission data are monthly mean values for the15
year 1992 in kg, distributed over the world’s airspace by altitude, latitude and longitude.Data for every set of altitude, latitude and longitude are reported in an equal-area mapgrid with a 2.8◦ latitude ×2.8◦ longitude horizontal resolution and 1 km vertical resolu-tion. There are totally 17 altitude levels. The major air traffic corridors are found in thenorthern middle latitudes at cruising altitudes between 10–11 km.20
After Mount Pinatubo eruption in June 1991, ISCCP detected a significant decreaseof thin cirrus clouds, particularly over the ocean, accompanied by a comparable in-crease of altocumulus and cumulus clouds. In contrast, results from the split-windowobservations and 3I data, did not show any significant change in thin cirrus associatedwith the volcanic eruption over both ocean and land (Luo et al., 2002). The apparent25
large decrease of thin cirrus in the ISCCP data set was reported as a satellite arti-fact due to the additional visible reflection by volcanic aerosols hanging around in thestratosphere (Rossow and Schiffer, 1999). Because of the contamination of the satel-lite signal by the Mt. Pinatubo eruption, cirrus cloud data taken between January 1991
3340
ACPD3, 3335–3359, 2003
Evidence of impact ofaviation on cirruscloud formation
C. S. Zerefos et al.
Title Page
Abstract Introduction
Conclusions References
Tables Figures
J I
J I
Back Close
Full Screen / Esc
Print Version
Interactive Discussion
© EGU 2003
and June 1993 were not used in our analysis.The effect of natural phenomena on cirrus clouds, such as ENSO, QBO and the
NAO, is examined in detail in Zerefos et al. (2003). It was found that over certain latitu-dinal belts, a significant part of the cirrus cloud variability could be attributed to ENSOand NAO fluctuations. While ENSO and QBO effects were found to be insignificant5
over the northern middle latitudes, the North Atlantic Oscillation perturbs directly cirruscloudiness over the North Atlantic Ocean and Europe, since it affects the frequencyand the intensity of baroclinic storms from which cirrus clouds mainly form in these re-gions (Tselioudis and Jakob, 2002). Therefore, it was necessary to isolate and removefrom the data set the effect of these large-scale modes of natural climate variability, in10
order to search for other possible impacts on cirrus cloud long-term changes (i.e. fromaviation). These effects were removed by applying cross-correlation function analysisat each individual grid box. Cirrus cloud changes could also be related to dynamicalvariability seen for example trends in tropopause temperatures. The possible effectof the tropopause variability on cirrus cloud changes over examined regions with high15
and lower air traffic was also removed from the data set based on regression analysis,accordingly. This tropopause temperature was taken from the independently producedNCEP/NCAR reanalysis data set for the same period.
The ISCCP cloud properties have been tested extensively both against other satellitecloud retrievals and against surface cloud observations (Rossow and Schiffer, 1999). In20
the latest (D-series) version of the ISCCP dataset, changes in the retrieval thresholdsand the inclusion of an ice microphysics model for retrieval of optical thicknesses andtop temperatures of cold clouds, have improved the agreement of cirrus cloud amountswith both surface observations (Rossow and Schiffer, 1999) and an analysis of High-Resolution Infrared Sounder (HIRS) data (Stubenrauch et al., 1999). A small underes-25
timate of ISCCP cirrus cloud amounts ( ∼5% at middle northern latitudes) comparedto the HIRS results is caused by missed detection of very thin clouds (Stubenrauch etal., 1999; Rossow and Schiffer, 1999). The cloud analysis in this study is done in away that attempts to minimize potential systematic errors in the cirrus trends. Adjacent
3341
ACPD3, 3335–3359, 2003
Evidence of impact ofaviation on cirruscloud formation
C. S. Zerefos et al.
Title Page
Abstract Introduction
Conclusions References
Tables Figures
J I
J I
Back Close
Full Screen / Esc
Print Version
Interactive Discussion
© EGU 2003
regions observed by the same satellite are chosen for comparison, in order to avoidtrends introduced by satellite calibration and to minimize differences due to illuminationgeometry. This provides confidence that, even with the uncertainty in retrieving cirruscloud properties from satellite observations, the trends derived in the study reflect areal change in the amount of the cloud type defined as cirrus by the ISCCP retrieval5
process. These trends have been evaluated as to their statistical significance by apply-ing the t-test of each trend against the null hypothesis of no-trend for the appropriatenumber of degrees of freedom (Wonnacot and Wonnacot, 1982).
3. Results and discussion
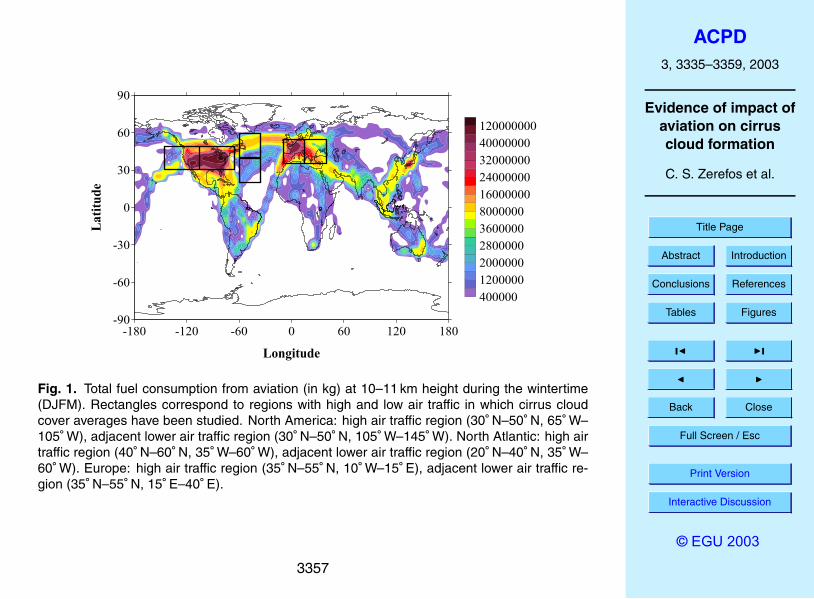
To examine the spatial distribution of fuel consumption from highflying aircrafts, Fig. 110
shows the geographical distribution of total fuel burned (in kg) at 10–11 km height ascalculated in four months (December, January, February, March) of 1992. From Fig. 1it appears that the most congested air traffic areas are found over the northern middlelatitude belt between 35◦ N–55◦ N (US, Europe and the North Atlantic air flight corridor).The seasonal dependence in aviation fuel consumption is quite large particularly in15
the North Atlantic air corridor with a maximum in the boreal summer and a minimumduring winter (Henderson and Wickrama, 1999). Over higher and lower latitudes of thenorthern hemisphere, for example 5◦ N–25◦ N, fuel consumption is much lower.
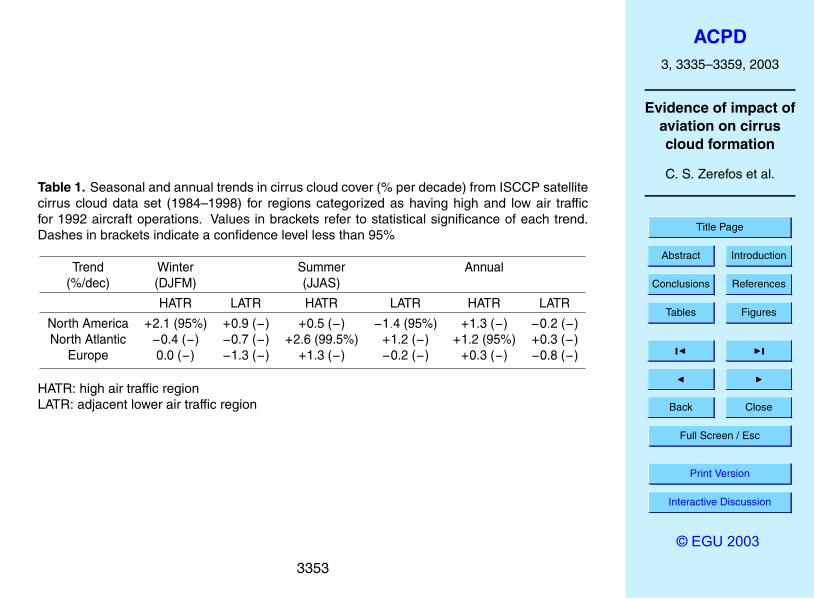
Table 1 summarizes decadal long-term changes in cirrus cloudiness calculated for 6regions of the northern hemisphere that correspond to different air traffic load. Two ad-20
jacent regions over North America, one with low air traffic and one with high air traffic,and similarly over the North Atlantic Ocean and over Europe, have been studied. Carewas taken to select regions experiencing similar climatological characteristics sincecontrail occurrence is strongly governed by meteorological conditions (Minnis et al.,2003) and to avoid interference from different satellites between adjacent regions. By25
this way, calculated trends between adjacent locations do not include substantial differ-ences in natural climate variability, such as for example different trends in annual mean
3342
ACPD3, 3335–3359, 2003
Evidence of impact ofaviation on cirruscloud formation
C. S. Zerefos et al.
Title Page
Abstract Introduction
Conclusions References
Tables Figures
J I
J I
Back Close
Full Screen / Esc
Print Version
Interactive Discussion
© EGU 2003
upper tropospheric humidity, which could strongly affect contrail properties (Minnis etal., 2003) or trends introduced by satellite calibrations. Therefore, a contrail cirrus sig-nal at these regions would be easier to detect. These regions are shown in Fig. 1 andare marked by black boxes. The long-term changes were estimated as the increase ordecrease of cirrus cloud cover (%) during the 15 yr period of this study inferred from a5
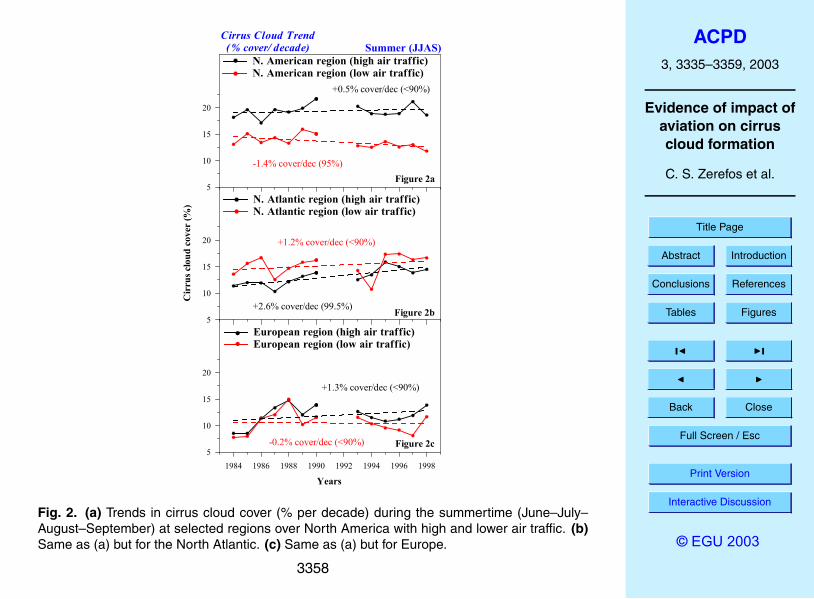
linear fit to the data. The analysis was performed for each month and for each seasonof the year, as well as for different locations over the North Atlantic Ocean, accordingly.Time series of cirrus cloudiness for the summer is plotted in Fig. 2.
As can be seen from Table 1, long-term changes in cirrus cloud cover over examinedregions with high air traffic, are higher in the summertime compared to the wintertime,10
except over North America, where higher increases are found during the wintertime.The largest increase is found along the North Atlantic air flight corridor in the summer,about 2.6% per decade and is statistically significant at the 99.5% confidence level.This is not a result of trends in tropopause temperatures because the statistically sig-nificant trend over the North Atlantic air corridor still remains significant after removing15
the tropopause variability together with all other natural perturbations. The correspond-ing trend over an adjacent lower air traffic location in the North Atlantic, which is viewedby the same satellite, is smaller (+1.2% per decade) and is not statistically significant.This is consistent with Boucher (1999) who found that cirrus frequency of occurrenceincreased significantly (97% confidence level) over the North Atlantic air corridor from20
1982 to 1991 compared to the rest of the North Atlantic Ocean.Part of the difference between the high and the lower air traffic regional long-term
changes over the North Atlantic could be related to the fact that contrail coverage ismaximum along the North Atlantic air flying routes during the summertime (Bakan etal., 1994), indicating possible impact from aviation on cirrus cloud formation. During25
winter, the calculated trend in cirrus cloud cover over the North Atlantic air flight corridoris not statistically significant. This is possibly due to the higher inter-annual naturalvariability in wintertime atmospheric synoptic systems, which may mask the impact ofhighflying air traffic on cirrus clouds.
3343
ACPD3, 3335–3359, 2003
Evidence of impact ofaviation on cirruscloud formation
C. S. Zerefos et al.
Title Page
Abstract Introduction
Conclusions References
Tables Figures
J I
J I
Back Close
Full Screen / Esc
Print Version
Interactive Discussion
© EGU 2003
Increasing trends in cirrus cloudiness are also found over the heavy air traffic loca-tions of North America and Europe in the summertime, which amount to about 0.5%and 1.3% per decade, respectively. Nevertheless, these trends are not statisticallysignificant due to large variance in cirrus cloud cover over these areas (Figs. 2a and2c). Over Europe, the calculated trend in cirrus cloud coverage during winter is 0.0%5
per decade. Over North America, the change in cirrus cloud cover is higher duringwinter (+2.1% per decade), when there is the highest contrail frequency of occurrence(Minnis et al., 1997; Sausen et al., 1998; Ponater et al., 2002; Minnis et al., 2003), com-pared to the summer and is statistically significant at the 95% confidence level. Lastly,the changes in annual mean cirrus cloud coverage over the high air traffic corridors10
of North America, North Atlantic and Europe, amount to +1.3%, +1.2% and +0.3%per decade, respectively, and are statistically significant only over the North Atlanticair corridor (95% confidence level). These trends are in agreement with the resultsgiven by Minnis et al. (2001), who calculated positive trends in mean annual high cloudcover over USA, Europe and the North Atlantic from surface-based and satellite obser-15
vations (HIRS and ISCCP). Over the adjacent lower air traffic selected locations, thecorresponding trends amount to −0.2%, +0.3% and −0.8% per decade, respectivelyand are not statistically significant.
Over regions where the main air routes exist, it was expected that a change in cirruscloudiness within a decade could be related to air traffic density, concerning the large20
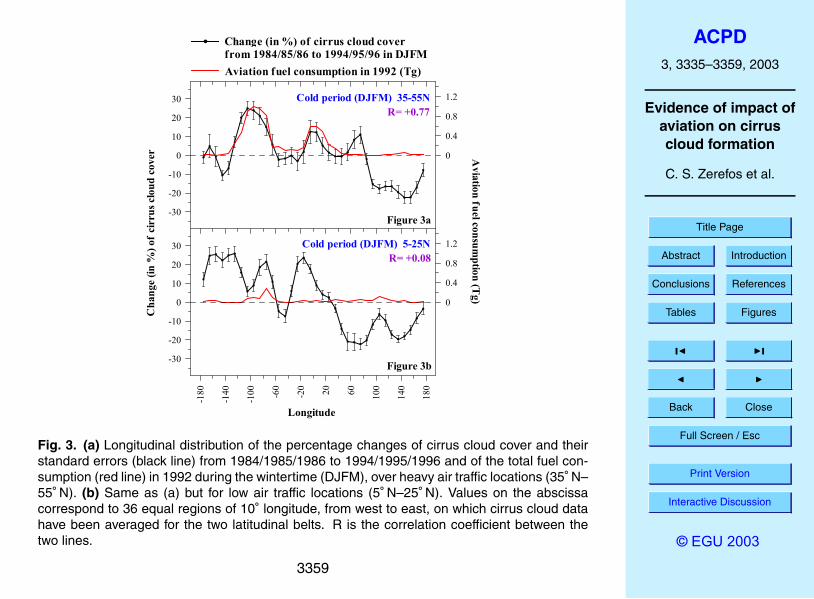
increase of transatlantic flights since the 80’s and the transformation of persistent con-trails to thin cirrus clouds. To investigate this assumption, decadal changes in cirruscloud cover were computed after removing the effects of ENSO, QBO and NAO per-turbations on cirrus clouds as well as the possible effect of the tropopause variability.Figure 3 shows the longitudinal distribution of the percentage change of cirrus cloud25
cover from 1984–1986 to 1994–1996 and of the total fuel consumption in 1992 duringthe wintertime (December, January, February, March). For comparison we present twofigures: Fig. 3a shows cirrus cover change over high air traffic locations (35◦ N–55◦ N)and Fig. 3b shows cirrus cover change over low air traffic locations (5◦ N–25◦ N).
3344

ACPD3, 3335–3359, 2003
Evidence of impact ofaviation on cirruscloud formation
C. S. Zerefos et al.
Title Page
Abstract Introduction
Conclusions References
Tables Figures
J I
J I
Back Close
Full Screen / Esc
Print Version
Interactive Discussion
© EGU 2003
From Fig. 3a it appears that the longitudinal distribution of cirrus cloudiness along thelatitude belt centered at the North Atlantic air corridor, parallels the fuel consumptionfrom highflying air traffic. The spatial distribution of the two variables has a significantpositive correlation coefficient (R= +0.77). The correlation suggests that the apparentincrease of thin cirrus clouds, about 20% over North America and about 9% over Eu-5
rope, could be related to contrail cloudiness formed by aviation activities. Over EastAsia however, the existence of complex circulation conditions in the area may mask thisissue. This analysis was also performed for the summer months, where it was foundthat the largest increases in cirrus cloudiness are found over Europe (∼12%) and theNorth Atlantic air corridor (∼23%). At lower latitudes (5◦ N–25◦ N), the air traffic density10
is much lower and the correlation is insignificant (Fig. 3b).
4. Comparison with previous studies
In order to validate the accuracy of our computed trend values we have reproducedand compared our results with previous studies examining long-term changes in highlevel cloudiness and their relationship to contrails. Two tables are shown: In Table 2,15
trends in cirrus cloud cover from this study are compared to corresponding trends inhigh level cloudiness over large air traffic and non-air traffic areas as defined by Minniset al. (2001) and in Table 3, trends in cirrus cloud cover from this study are compared totrends in cirrus-high level cloudiness over regions categorized as having a mean valueof contrail coverage less than or greater than 0.5% as given by Fahey and Schumann20
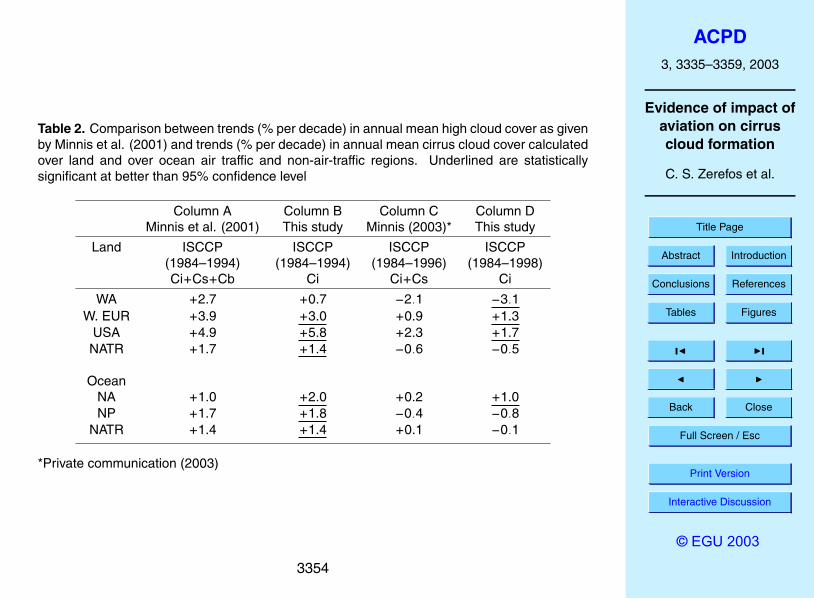
(1999).Column A in Table 2, shows trends in annual mean high cloud coverage (cirrus (Ci) +
cirrostratus (Cs) + deep convective (Cb)) from ISCCP 1984–1994 satellite observationsas given by Minnis et al. (2001) and column B shows trends in annual mean cirruscloud coverage (Ci) as calculated in this study. The trends were calculated based25
on monthly mean values, not annual, for the period July 1983–May 1991 and July1993– August 1994, so the monthly trends were multiplied by 12 (Minnis, 2003, private
3345
ACPD3, 3335–3359, 2003
Evidence of impact ofaviation on cirruscloud formation
C. S. Zerefos et al.
Title Page
Abstract Introduction
Conclusions References
Tables Figures
J I
J I
Back Close
Full Screen / Esc
Print Version
Interactive Discussion
© EGU 2003
communication). Column C shows more recent estimates of trends in annual meanCi+Cs cloud coverage from ISCCP 1984–1996 satellite observations by Minnis (2003,private communication) and column D shows trends in annual mean cirrus cloud coverfor the period 1984–1998 as calculated in this study. In order to be consistent withMinnis et al. (2001), trends in column D were calculated based on monthly mean5
values, so the monthly trends were multiplied by 12. This table provides a meansfor detecting and evaluating a trend movement in cirrus-high cloud coverage betweensuccessive time periods within the years 1984 and 1998.
As can be seen from Table 2, the calculated trend values from this study show con-sistent similarities to the corresponding values of Minnis et al. (2001) although some10
values are slightly different. In any case, any differences should be mainly attributedto the different data sets used in the two studies (high cloud data set in Minnis et al.(2001) and cirrus cloud dataset in this study). Analytically, for the period 1984–1994,our trend calculations over land air traffic regions are the following: over USA, we finda higher increase in cirrus cloud cover (5.8% per decade) compared to the result given15
by Minnis et al. (2001), which is statistically significant at the 99% confidence level.Over Western Europe (W. EUR), the trend in cirrus cloud cover of 3.0% per decade isstatistically significant at the 99% confidence level and is slightly smaller than the valuegiven by Minnis et al. (2001) (3.9% per decade). Over Western Asia (WA), the trendwe calculate (0.7% per decade) is not statistically significant. Over the remaining land20
non-air traffic areas (NATR), we find a similar to Minnis et al. (2001) increasing trendin cirrus cloud cover by 1.4% per decade, which is statistically significant at the 99%confidence level. However, this trend includes all land regions (the ATR data were notremoved from the result) (Minnis, 2003, private communication) and therefore it couldbe affected by contrail signals from land ATR regions. To investigate this assumption,25
we excluded land ATR regions from land NATR regions and we calculated a smallertrend, which was statistically insignificant. Over ocean air traffic regions, our calculatedtrend values are similar to those given by Minnis et al. (2001) and are statistically sig-nificant at the 99% confidence level. Over ocean non-air traffic regions, the trend we
3346
ACPD3, 3335–3359, 2003
Evidence of impact ofaviation on cirruscloud formation
C. S. Zerefos et al.
Title Page
Abstract Introduction
Conclusions References
Tables Figures
J I
J I
Back Close
Full Screen / Esc
Print Version
Interactive Discussion
© EGU 2003
calculate is statistically significant at the 95% confidence level but as discussed previ-ously, when excluding ocean ATR from ocean NATR regions, the corresponding trendis statistically insignificant.
More recent estimates of trends in annual mean Ci+Cs cloud cover by Minnis (privatecommunication, 2003) for the period 1984–1996 (column C), show a general decrease5
in cloud cover relative to the period 1984–1994, over all land and ocean ATR and NATRareas. Similar trends in cirrus cloud cover are also observed during the period 1984–1998 (column D). Over USA, W. EUR and NA these trends amount to about +1.3%,+1.7% and +1.0% per decade, respectively and are statistically significant at the 99%confidence level. However, when using annual mean values to calculate trends instead10
of monthly mean values, the corresponding trend values are less statistically signifi-cant.
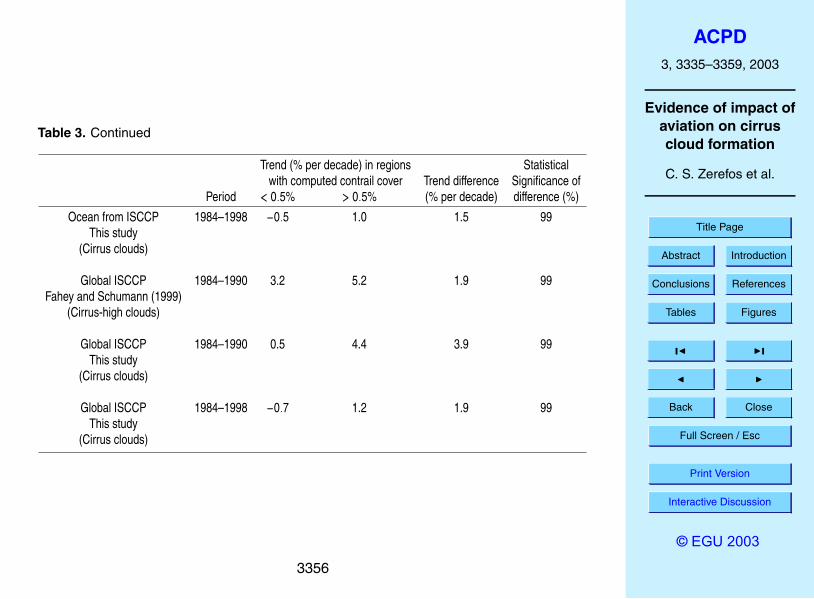
Table 3 shows the comparison between trends in cirrus-high cloud amounts as givenby Fahey and Schumann (1999) and trends in cirrus cloud amount as calculated fromthis study. From Table 3 it appears that in spite of the differences, trends results from15
this study and their statistical significance show consistent similarities to the resultsgiven by Fahey and Schumann (1999). Analytically, for the period 1984–1990, thedifference between trends in cirrus cloud cover over land contrail and non-contrail re-gions is 5.5% per decade and is statistically significant at the 99% confidence level.Over ocean, this trend difference is not statistically significant. Over both land and20
ocean (global ISCCP) the corresponding trend difference of 3.9% per decade is sta-tistically significant at the 99% confidence level. During the period 1984–1998, thereis a general decrease in cirrus cloud cover over all contrail and non-contrails regions.However, over regions with contrail coverage greater than 0.5% the trend values arepositive while over regions with contrail coverage less than 0.5% the trend values are25
negative. The differential increases in cirrus cloud coverage over contrail regions rela-tive to remaining non-contrail regions are statistically significant at the 99% confidencelevel for the land, ocean and global ISCCP 1984–1998 data.
3347
ACPD3, 3335–3359, 2003
Evidence of impact ofaviation on cirruscloud formation
C. S. Zerefos et al.
Title Page
Abstract Introduction
Conclusions References
Tables Figures
J I
J I
Back Close
Full Screen / Esc
Print Version
Interactive Discussion
© EGU 2003
5. Conclusions
This study examined changes in cirrus cloudiness over locations where contrail for-mation by aviation was expected to perturb the distribution of cirrus clouds and theirlong-term variability. Long-term changes in cirrus cloud cover were calculated for sixregions of the northern middle latitudes categorized as having high and low air traf-5
fic for 1992 aircraft operations. Two adjacent regions over North America, one withlow air traffic and one with high air traffic, and similarly over the North Atlantic Oceanand over Europe, have been studied. Care was taken to select regions experiencingsimilar climatological characteristics since contrail occurrence is strongly governed bymeteorological conditions (Minnis et al., 2003) and to avoid interference from differ-10
ent satellites between adjacent regions. The main results of the present work can besummarized as follows:Cirrus cloud cover increased significantly (99.5% confidence level), between 1984 and1998, over the high air traffic corridors of the North Atlantic, amounting to about 2.6%per decade during the summertime. This was not a result of trends in tropopause15
temperatures because the statistically significant trend over the North Atlantic air corri-dor still remained significant after removing the tropopause variability together with allother natural perturbations. In wintertime however, statistically significant changes atthe 95% confidence level were found over North America, amounting to about +2.1%per decade. Statistically significant increases at the 95% confidence level were also20
found for the annual mean cirrus cloud coverage over the North Atlantic air corridor(1.2% per decade). Over adjacent locations with lower air traffic the calculated trendsin cirrus cloud cover were statistically insignificant and in most cases negative bothduring winter and summer in regions studied.
Moreover, it was found that the longitudinal distribution of decadal changes in cirrus25
cloudiness along the latitude belt centered at the North Atlantic air corridor parallelsthe spatial distribution of fuel consumption from highflying air traffic. The two variableswere strongly correlated during the wintertime (R= +0.77), providing an independent
3348
ACPD3, 3335–3359, 2003
Evidence of impact ofaviation on cirruscloud formation
C. S. Zerefos et al.
Title Page
Abstract Introduction
Conclusions References
Tables Figures
J I
J I
Back Close
Full Screen / Esc
Print Version
Interactive Discussion
© EGU 2003
test of possible impact of aviation on contrail cirrus formation. At latitudes with lowerair traffic density, the observed changes in cirrus cloud coverage were not related tothe spatial distribution of fuel consumption.
Trends in cirrus cloud coverage from this study were compared with other studiesand different period of records (Fahey and Schumann, 1999; Minnis et al., 2001). As5
evidenced in this and in earlier studies in spite of the differences, there is a generalagreement on the aviation effect on high cloud trends. However, the period understudy is short for trend analyses and the results should be treated with caution as faras any aviation effects on cirrus cloud cover are considered. Other parameters thatcould possibly control contrail cover in these regions such as ambient air humidity,10
temperature and wind shear (Schumann, 2000) have not been studied as to their inter-annual variability and its relationship with cirrus cloud cover.
Acknowledgements. This study was conducted within the project “Liquid hydrogen fuelled air-craft system analysis” (CRYOPLANE, Contract No G4RD-2000-00192) and contributes to theproject “Aircraft emissions: Contribution of different climate components to changes in radiative15
forcingTrade-off to reduce atmospheric impact” (TRADE-OFF, Contract No EVK2-1999-00030)both funded by the European Commission. We acknowledge the assistance of V. Grewe fromDLR-Oberpfaffenhofen for providing the fuel consumption data for the year 1992 and of theunknown reviewers who have greatly helped improving the study.
References20
Bakan, S., Betancor, M., Gayler, V., and Grassl, H.: Contrail frequency over Europe fromNOAA-satellite images, Ann. Geophysicae, 12, 962–968, 1994.
Boucher, O.: Air traffic may increase cirrus cloudiness, Nature, 397, 30–31, 1999.Fahey, D. W., and Schumann, U.: Aviation-Produced Aerosols and Cloudiness, Chapter 3 in
Aviation and the Global Atmosphere, A Special Report of IPCC (Intergovernmental Panel25
on Climate Change), eds. Penner, J. E., Lister, D. H., Griggs, D. J., Dokken, D. J., andMcFarland, M., Cambridge University Press, Cambridge, UK, 65–120, 1999.
3349
ACPD3, 3335–3359, 2003
Evidence of impact ofaviation on cirruscloud formation
C. S. Zerefos et al.
Title Page
Abstract Introduction
Conclusions References
Tables Figures
J I
J I
Back Close
Full Screen / Esc
Print Version
Interactive Discussion
© EGU 2003
Fu, Q. and Liou, K. N.: Parameterization of the Radiative Properties of Cirrus Clouds, J. Atmos.Sci., 50, 2008–2025, 1993.
Gierens, K., Schumann, U., Helten, M., Smit, H., and Marenco, A.: A distribution law for rel-ative humidity in the upper troposphere and lower stratosphere from three years of Mozaicmeasurements, Ann. Geophysicae, 17, 1218–1226, 1999.5
Gierens, K., Schumann, U., Helten, M., Smit, H., and Wang, P. H.: Ice-supersaturated regionsand subvisible cirrus in the northern midlatitude upper troposphere, J. Geophys. Res., 105,22 743–22 754, 2000.
Henderson, S. C., and Wickrama, U. K.: Aircraft emissions: Current Inventories and FutureScenarios, Chapter 9 in Aviation and the Global Atmosphere, A Special Report of IPCC10
(Intergovernmental Panel on Climate Change), eds. Penner, J. E., Lister, D. H., Griggs, D. J.,Dokken, D. J., and McFarland, M., Cambridge University Press, Cambridge, UK, 291–332,1999.
Jensen, E. J., Toon, O. B., Selkirk, H. B., Spinhirne J. D., and Schoeberl, M. R.: On the for-mation and persistence of subvisible cirrus clouds near the tropical tropopause, J. Geophys.15
Res., 101, D16, 21 361–21 375, 1996.Jensen, E. J. and Toon, O. B.: The potential impact of soot particles from aircraft exhaust on
cirrus clouds, Geophys. Res. Lett., 24, 249–252, 1997.Jensen, E. J., Toon, O. B., Kinne, S., Sachse, G. W., Anderson, B. E., Chan, K. R., Twohy, C.
H., Gandrud, B., Heymsfield, A., and Miake-Lye, R. C.: Environmental conditions required20
for contrail formation and persistence, J. Geophys. Res., 103, D4, 3929–3936, 1998.Jensen, E. J., Toon, O. B., Vay, S. A., Ovarlez, J., May, R., Bui, T. P., Twohy, C. H., Gandrud,
B. W., Pueschel, R. F., and Schumann, U.: Prevalence of ice-supersaturated regions in theupper troposphere: Implications for optically thin ice cloud formation, J. Geophys. Res., 106,D15, 17 253–17 266, 2001.25
IPCC, Climate change 2001: The scientific basis, Contribution of Working Group I to theThird Assessment Report of the IPCC (Intergovernmental Panel on Climate Change), eds.Houghton, J. T., Ding, Y., Griggs, D. J., Noguer, M., Van der Linden, P. J., Dai, X., Maskell, K.,and Johnson, C. A., Chapter 6, Radiative forcing of climate change, Cambridge UniversityPress, Cambridge, UK, 349–416, 2001.30
Luo, Z., Rossow, W. B., Inoue, T., and Stubenrauch, C. J.: Did the Eruption of the Mt. PinatuboVolcano Affect Cirrus Properties?, J. Climate, 17, 2806–2820, 2002.
Marquart, S. and Mayer, B.: Towards a reliable GCM estimation of contrail radiative forcing,
3350
ACPD3, 3335–3359, 2003
Evidence of impact ofaviation on cirruscloud formation
C. S. Zerefos et al.
Title Page
Abstract Introduction
Conclusions References
Tables Figures
J I
J I
Back Close
Full Screen / Esc
Print Version
Interactive Discussion
© EGU 2003
Geophys. Res. Lett., 29, 8, 10.1029/2001GL014075, 2002.Meerkoetter, R., Schumann, U., Doelling, D. R., Minnis, P., Nakajima, T., and Tsushima, Y.:
Radiative forcing by contrails, Ann. Geophysicae, 17, 1080–1094, 1999.Meyer, R., Mannstein, H., Meerkoetter, R., Schumann, U., and Wendling, P.: Regional radiative
forcing by line-shaped contrails derived from satellite data, J. Geophys. Res., 107, D10,5
10.1029/2001JD000426, 2002.Minnis, P., Ayers, J. K., and Weaver, S. P.: Surface-Based Observations of Contrail Occurrence
Frequency Over the US, April 1993–April 1994, NASA Reference Publ., 1404, 1997.Minnis, P., Schumann, U., Doelling, D. R., Gierens, K. M., and Fahey, D. W.: Global distribution
of contrail radiative forcing, Geophys. Res. Lett., 26, 1853–1856, 1999.10
Minnis, P., Ayers, J. K., Palikonda, R., Doelling, D. R., Schumann, U., and Gierens, K.: Changesin cirrus cloudiness and their relationship to contrails, Proceedings American MeteorologicalSociety, Boston, Mass, USA, paper no. 11.9, 239–242, 2001.
Minnis, P., Ayers, J. K., and Weaver, S. P.: Contrail Frequency Over the USA From SurfaceObservations, J. Climate, In press, 2003.15
Ponater, M., Marquart, S., and Sausen, R.: Contrails in a comprehensive global cli-mate model: Parameterization and radiative forcing results, J. Geophys. Res., 107, D13,10.1029/2001JD000429, 2002.
Rossow, W. B., Walker, A. W., Beuschel, D. E., and Roiter, M. D.: International Satellite CloudClimatology Project (ISCCP) Documentation of New Cloud Datasets, WMO/TD 737, World20
Climate Research Programme, Geneva, Switzerland, 1996.Rossow, W. B. and Schiffer, R. A.: Advances in understanding clouds from ISCCP, Bull. Amer.
Meteor. Soc., 80, 2261–2288, 1999.Sausen, R., Gierens, K., Ponater, M., and Schumann, U.: A diagnostic study of the global
distribution of contrails part I: present day climate, Theor. Appl. Climatol., 61, 127–141, 1998.25
Schmitt, A. and Brunner, B.: Emissions from aviation and their development over time, In:Final Report on the BMBF Verbundprogramm, Schadstoffe in der Luftfahrt [Schumann, U.,Chlond, A., Ebel, A., Krcher, B., Pak, H., Schlager, H., Schmitt, A., and Wendling, P., (eds.)],DLR-Mitteilung 97–04, Deutsches Zentrum fr Luft- und Raumfahrt, Oberpfaffenhofen andCologne, Germany, 37–52, 1997.30
Schumann, U.: On conditions for contrail formation from aircraft exhausts, Meteor. Z., 5, 4–23,1996.
Schumann, U.: Introduction and Review of Previous Assessments: Questions and Previous An-
3351
ACPD3, 3335–3359, 2003
Evidence of impact ofaviation on cirruscloud formation
C. S. Zerefos et al.
Title Page
Abstract Introduction
Conclusions References
Tables Figures
J I
J I
Back Close
Full Screen / Esc
Print Version
Interactive Discussion
© EGU 2003
swers, in Aviation, Aerosols, Contrails and Cirrus Clouds (A2C3), Seeheim, Germany, editedby Schumann, U. and Amanatidis, G. T., EUR 19428, European Commission, Brussels, 21–26, 2000.
Schumann, U.: Contrail cirrus, in Lynch, D. K., Sassen, K., Starr, D. O’C., and Stephens, G.,(Eds.): Cirrus, Oxford Univ. Press, 231–255, 2002.5
Stephens, G. L. and Webster, P. J.: Clouds and Climate: Sensitivity of Simple Systems, J.Atmos. Sci., 38, 235–247, 1981.
Stubenrauch, C. J., Rossow, W. B., Cheruy, F., Chedin, A., and Scott, N. A.: Clouds as seenby satellite sounders (3I) and imagers (ISCCP). Part I. Evaluation of cloud parameters, J.Climate, 12, 2189–2213, 1999.10
Tselioudis, G., and Jakob, C.: Evaluation of midlatitude cloud properties in a weather andclimate model: Dependence on dynamic regime and spatial resolution, J. Geophys. Res.,107, D24, 4781, doi:10.1029/2002JD002259, 2002.
Wonnacot and Wonnacot: Statistics-Discovering its power, edited by John Willey and Sons,New York, 204–209, 1982.15
Wylie, D. P. and Menzel, W. P.: Eight Years of High Cloud Statistics Using HIRS, J. Climate, 12,170–184, 1999.
Zerefos C. S., Eleftheratos, K., Balis, D., Zanis, P., Meleti, C., and Tselioudis, G.: Effects ofnatural perturbations on cirrus clouds, EGS-AGU-EUG Joint Assembly, Nice, France, 6–11April, 2003.20
3352
ACPD3, 3335–3359, 2003
Evidence of impact ofaviation on cirruscloud formation
C. S. Zerefos et al.
Title Page
Abstract Introduction
Conclusions References
Tables Figures
J I
J I
Back Close
Full Screen / Esc
Print Version
Interactive Discussion
© EGU 2003
Table 1. Seasonal and annual trends in cirrus cloud cover (% per decade) from ISCCP satellitecirrus cloud data set (1984–1998) for regions categorized as having high and low air trafficfor 1992 aircraft operations. Values in brackets refer to statistical significance of each trend.Dashes in brackets indicate a confidence level less than 95%
Trend Winter Summer Annual(%/dec) (DJFM) (JJAS)
HATR LATR HATR LATR HATR LATR
North America +2.1 (95%) +0.9 (−) +0.5 (−) −1.4 (95%) +1.3 (−) −0.2 (−)North Atlantic −0.4 (−) −0.7 (−) +2.6 (99.5%) +1.2 (−) +1.2 (95%) +0.3 (−)
Europe 0.0 (−) −1.3 (−) +1.3 (−) −0.2 (−) +0.3 (−) −0.8 (−)
HATR: high air traffic regionLATR: adjacent lower air traffic region
3353
ACPD3, 3335–3359, 2003
Evidence of impact ofaviation on cirruscloud formation
C. S. Zerefos et al.
Title Page
Abstract Introduction
Conclusions References
Tables Figures
J I
J I
Back Close
Full Screen / Esc
Print Version
Interactive Discussion
© EGU 2003
Table 2. Comparison between trends (% per decade) in annual mean high cloud cover as givenby Minnis et al. (2001) and trends (% per decade) in annual mean cirrus cloud cover calculatedover land and over ocean air traffic and non-air-traffic regions. Underlined are statisticallysignificant at better than 95% confidence level
Column A Column B Column C Column DMinnis et al. (2001) This study Minnis (2003)* This study
Land ISCCP ISCCP ISCCP ISCCP(1984–1994) (1984–1994) (1984–1996) (1984–1998)Ci+Cs+Cb Ci Ci+Cs Ci
WA +2.7 +0.7 −2.1 −3.1W. EUR +3.9 +3.0 +0.9 +1.3
USA +4.9 +5.8 +2.3 +1.7NATR +1.7 +1.4 −0.6 −0.5
OceanNA +1.0 +2.0 +0.2 +1.0NP +1.7 +1.8 −0.4 −0.8
NATR +1.4 +1.4 +0.1 −0.1
*Private communication (2003)
3354

ACPD3, 3335–3359, 2003
Evidence of impact ofaviation on cirruscloud formation
C. S. Zerefos et al.
Title Page
Abstract Introduction
Conclusions References
Tables Figures
J I
J I
Back Close
Full Screen / Esc
Print Version
Interactive Discussion
© EGU 2003
Table 3. Comparison between trends (% per decade) in cirrus-high cloud amounts as givenby Fahey and Schumann (1999) and trends (% per decade) in cirrus cloud amount calculatedfor regions categorized as having a mean value of contrail coverage less than or greater than0.5%. Italics are trends in cirrus cloud amount for the period 1984–1998. Statistical significancerefers to level of confidence in difference between trends for the two regions. Dashes indicatea confidence level less than 95%
Trend (% per decade) in regions Statisticalwith computed contrail cover Trend difference Significance of
Period < 0.5% > 0.5% (% per decade) difference (%)
Land from ISCCP 1984–1990 1.2 4.7 3.5 95Fahey and Schumann (1999)
(Cirrus-high clouds)
Land from ISCCP 1984–1990 −0.1 5.4 5.5 99This study
(Cirrus clouds)
Land from ISCCP 1984–1998 −1.1 1.3 2.4 99This study
(Cirrus clouds)
Ocean from ISCCP 1984–1990 4.3 5.9 1.6 –Fahey and Schumann (1999)
(Cirrus-high clouds)
Ocean from ISCCP 1984–1990 1.1 2.3 1.2 –This study
(Cirrus clouds)
3355
ACPD3, 3335–3359, 2003
Evidence of impact ofaviation on cirruscloud formation
C. S. Zerefos et al.
Title Page
Abstract Introduction
Conclusions References
Tables Figures
J I
J I
Back Close
Full Screen / Esc
Print Version
Interactive Discussion
© EGU 2003
Table 3. Continued
Trend (% per decade) in regions Statisticalwith computed contrail cover Trend difference Significance of
Period < 0.5% > 0.5% (% per decade) difference (%)
Ocean from ISCCP 1984–1998 −0.5 1.0 1.5 99This study
(Cirrus clouds)
Global ISCCP 1984–1990 3.2 5.2 1.9 99Fahey and Schumann (1999)
(Cirrus-high clouds)
Global ISCCP 1984–1990 0.5 4.4 3.9 99This study
(Cirrus clouds)
Global ISCCP 1984–1998 −0.7 1.2 1.9 99This study
(Cirrus clouds)
3356
ACPD3, 3335–3359, 2003
Evidence of impact ofaviation on cirruscloud formation
C. S. Zerefos et al.
Title Page
Abstract Introduction
Conclusions References
Tables Figures
J I
J I
Back Close
Full Screen / Esc
Print Version
Interactive Discussion
© EGU 2003
-180 -120 -60 0 60 120 180
Longitude
-90
-60
-30
0
30
60
90Latitude
4000001200000200000028000003600000800000016000000240000003200000040000000120000000
Fig. 1. Total fuel consumption from aviation (in kg) at 10–11 km height during the wintertime(DJFM). Rectangles correspond to regions with high and low air traffic in which cirrus cloudcover averages have been studied. North America: high air traffic region (30◦ N–50◦ N, 65◦ W–105◦ W), adjacent lower air traffic region (30◦ N–50◦ N, 105◦ W–145◦ W). North Atlantic: high airtraffic region (40◦ N–60◦ N, 35◦ W–60◦ W), adjacent lower air traffic region (20◦ N–40◦ N, 35◦ W–60◦ W). Europe: high air traffic region (35◦ N–55◦ N, 10◦ W–15◦ E), adjacent lower air traffic re-gion (35◦ N–55◦ N, 15◦ E–40◦ E).
3357
ACPD3, 3335–3359, 2003
Evidence of impact ofaviation on cirruscloud formation
C. S. Zerefos et al.
Title Page
Abstract Introduction
Conclusions References
Tables Figures
J I
J I
Back Close
Full Screen / Esc
Print Version
Interactive Discussion
© EGU 2003
1984 1986 1988 1990 1992 1994 1996 1998
Years
5
10
15
20
5
10
15
20
Cir
rus c
loud
cov
er (%
)5
10
15
20
N. American region (high air traffic)N. American region (low air traffic)
N. Atlantic region (high air traffic)N. Atlantic region (low air traffic)
European region (high air traffic)European region (low air traffic)
Figure 2c
Figure 2b
Figure 2a
+0.5% cover/dec (<90%)
-1.4% cover/dec (95%)
+2.6% cover/dec (99.5%)
+1.2% cover/dec (<90%)
+1.3% cover/dec (<90%)
-0.2% cover/dec (<90%)
Summer (JJAS)Cirrus Cloud Trend(% cover/ decade)
Fig. 2. (a) Trends in cirrus cloud cover (% per decade) during the summertime (June–July–August–September) at selected regions over North America with high and lower air traffic. (b)Same as (a) but for the North Atlantic. (c) Same as (a) but for Europe.
3358
ACPD3, 3335–3359, 2003
Evidence of impact ofaviation on cirruscloud formation
C. S. Zerefos et al.
Title Page
Abstract Introduction
Conclusions References
Tables Figures
J I
J I
Back Close
Full Screen / Esc
Print Version
Interactive Discussion
© EGU 2003
-180
-140
-100 -60
-20 20 60 100
140
180
Longitude
-30
-20
-10
0
10
20
30
0
0.4
0.8
1.2
-30
-20
-10
0
10
20
30
0
0.4
0.8
1.2
Cold period (DJFM) 35-55N
Cold period (DJFM) 5-25NR= +0.08
R= +0.77
Change (in %) of cirrus cloud coverfrom 1984/85/86 to 1994/95/96 in DJFMAviation fuel consumption in 1992 (Tg)
Aviation
fuelconsumption
(Tg)
Cha
nge
(in %
) of
cirr
us c
loud
cov
er
Figure 3a
Figure 3b
Fig. 3. (a) Longitudinal distribution of the percentage changes of cirrus cloud cover and theirstandard errors (black line) from 1984/1985/1986 to 1994/1995/1996 and of the total fuel con-sumption (red line) in 1992 during the wintertime (DJFM), over heavy air traffic locations (35◦ N–55◦ N). (b) Same as (a) but for low air traffic locations (5◦ N–25◦ N). Values on the abscissacorrespond to 36 equal regions of 10◦ longitude, from west to east, on which cirrus cloud datahave been averaged for the two latitudinal belts. R is the correlation coefficient between thetwo lines.
3359