A New Myohaptic Instrument to Assess Wrist Motion Dynamically
Upload
independentCategory
view
0download
0
Evidence of Dynamically Dysregulated Gene ExpressionPathways in Hyperresponsive B Cells from AfricanAmerican Lupus PatientsIgor Dozmorov1, Nicolas Dominguez2, Andrea L. Sestak3, Julie M. Robertson2, John B. Harley4,5,
Judith A. James2,3, Joel M. Guthridge2*
1University of Texas Southwestern Medical Center, Dallas, Texas, United States of America, 2Oklahoma Medical Research Foundation, Oklahoma City, Oklahoma, United
States of America, 3University of Oklahoma Health Science Center, Oklahoma City, Oklahoma, United States of America, 4United States Department of Veterans Affairs
Medical Center, Cincinnati, Ohio, United States of America, 5Cincinnati Children’s Hospital Medical Center, Cincinnati, Ohio, United States of America
Abstract
Recent application of gene expression profiling to the immune system has shown a great potential for characterization ofcomplex regulatory processes. It is becoming increasingly important to characterize functional systems through multigeneinteractions to provide valuable insights into differences between healthy controls and autoimmune patients. Here weapply an original systematic approach to the analysis of changes in regulatory gene interconnections between in Epstein-Barr virus transformed hyperresponsive B cells from SLE patients and normal control B cells. Both traditional analysis ofdifferential gene expression and analysis of the dynamics of gene expression variations were performed in combination toestablish model networks of functional gene expression. This Pathway Dysregulation Analysis identified known transcriptionfactors and transcriptional regulators activated uniquely in stimulated B cells from SLE patients.
Citation: Dozmorov I, Dominguez N, Sestak AL, Robertson JM, Harley JB, et al. (2013) Evidence of Dynamically Dysregulated Gene Expression Pathways inHyperresponsive B Cells from African American Lupus Patients. PLoS ONE 8(8): e71397. doi:10.1371/journal.pone.0071397
Editor: Stamatis-Nick Liossis, University of Patras Medical School, Greece
Received December 20, 2012; Accepted June 29, 2013; Published August 15, 2013
Copyright: � 2013 Dozmorov et al. This is an open-access article distributed under the terms of the Creative Commons Attribution License, which permitsunrestricted use, distribution, and reproduction in any medium, provided the original author and source are credited.
Funding: This project was supported by National Institutes of Health, including the National Institute of Arthritis and Musculoskeletal and Skin Diseases, NationalInstitute of Allergy and Infectious Diseases, and National Institute of General Medical Sciences [through grant numbers: RR016478-10, AR058959-02, AI039824-15,AI058150, and R01A1045050-10 to ID, RR020143 to JMG, ID, and JBH, RR015577 to JMG, JBH, and JAJ, RR015577-10S1 to JMG, GM103510 to JMG and JAJ,N01AI000026 to JMG and JAJ, AI082714 to JAJ, AI101934 to JAJ, NO1AR062277 to JBH, AI031584 to JBH, JMG, and JAJ, AR053483 to JMG and JAJ, AR048940 toJBH and JAJ, AR049084 to JBH, AR042460 to JBH, AR012253 to JBH, AR062277 to JBH, AI024717 to JBH, DEO15223 to JBH; Alliance for Lupus Research to JBH; theUnited States Department of Veterans Affairs to JBH; and OHRS award number HR08-037 from the Oklahoma Center for the Advancement of Science andTechnology to JMG]. Additionally, this study was supported by the Lou Kerr Chair in Biomedical Research. This study is also made possible by the Kirkland ScholarAward Program at the Hospital for Special Surgery in New York City and is funded exclusively by Rheuminations, Inc., a non-profit foundation dedicated tosupporting research leading to the treatment and cure of lupus to JBH and JAJ. The contents of this study are solely the responsibility of the authors and do notnecessarily represent the official views of the National Institutes of Health or the National Institute of Arthritis and Musculoskeletal and Skin Diseases. The fundershad no role in study design, data collection and analysis, decision to publish, or preparation of the manuscript.
Competing Interests: The authors have declared that no competing interests exist.
* E-mail: [email protected]
Introduction
The use of microarray technology enables one to measure the
expressions of tens of thousands of genes simultaneously, allowing
an unbiased view of all biological processes with molecular
precision. Recent application of gene expression profiling to the
immune system has shown a great potential for characterization of
complex regulatory processes playing role in any immunological
phenomena. Gene expression profiling of inflammatory processes
and autoimmune pathologies [1,2], juvenile rheumatoid arthritis
[3,4,5], and Sjogren’s syndrome [6] has enhanced our under-
standing of the delicate balance between a controlled inflamma-
tion response and the development of autoimmune disorders.
A more advanced use of microarray analysis focusing on a
systems-level analysis represents a powerful method to characterize
altered biological systems through dynamic changes of individual
gene expression profiles. Advances in microarray technology and
systems-level analysis has allowed scientists an opportunity to
characterize functional systems through multigene interactions by
identifying and characterizing regulatory correlations between
individual genes. Identification of functional links between genes
responding dynamically to specific treatments through this system
biology approach is being increasingly reported in literature
[7,8,9]. The creative use of gene expression profiling could enable
further progress in better understanding the context of abnormal-
ities in signaling pathways in autoimmune patients, especially in
systemic lupus erythematosus (SLE).
SLE is a complex disease with heterogeneous clinical features
characterized by the production of autoantibodies and the
subsequent damage of multiple organ systems. Though the
immunological events triggering SLE remain unsolved, a central
role for B cells in the SLE pathogenesis has been established in
both mice and humans [10,11,12]. B cell defects including
abnormal function of key signaling molecules, B-cell receptor
signaling defects, and perturbations in B cell developmental
subsets are hypothesized to play a central role in the breakdown of
B cell tolerance and subsequently in SLE pathogenesis.
Research into initiation and pathogenesis of SLE among
patients has begun to offer a complex picture of cell signaling
and cellular response. A number of cell signaling pathways have
PLOS ONE | www.plosone.org 1 August 2013 | Volume 8 | Issue 8 | e71397

been shown to be altered in SLE patients [13,14,15,16]. These
include alterations in the interferon pathway [17], TNFa signaling
pathway [13,18], abnormal B cell receptor (BCR) signaling
[14,15], and increased phosphatidylinositol 3-kinase activity
[15,16]. Abnormal cellular responses and cellular populations
are also observed in SLE patients. FccRIIB expression is decreased
in the SLE patient memory B cells [19], patient memory B cell
subsets are hyper-responsive to stimulation [20], and consist of a
large number of transitional B cells [21,22] and
CD19+CD24hiCD38hi B cells that lack the suppressive regulatory
functions observed in controls [23].
In these proof-of-concept experiments, we expand current gene
expression profiling methods to apply a systematic approach to the
analysis of statistically significant changes in regulatory gene
interconnections between in B cells from normal control
individuals and the hyperresponsive B cells from SLE patients.
We use a novel self-verified experimental design (in which every
step, selection, or construction was accepted only when repro-
duced in duplicated experiments) to identify differentially
expressed genes between controls and SLE patients. Our Pathway
Dysregulation Analysis identified known transcription factors,
genes for inflammatory responses, genes for cell cycle progression,
genes for cell growth, genes for response to DNA damage, and
genes regulating apoptosis dysregulated in SLE patient derived cell
lines.
Materials and Methods
Ethics StatementThis study has been conducted according to the principles
expressed in the Declaration of Helsinki. These EBV-transformed
cell lines were originally generated from systemic lupus erythe-
matosus (SLE) patients and controls as a part of the Lupus Family
Registry and Repository and were provided as coded samples for
use in this study subject to appropriate IRB approvals at the
Oklahoma Medical Research Foundation and the University of
Oklahoma Health Sciences Center.
Cell Culture and in vitro ActivationPotential cell lines from 20 African-American female lupus
patients and 20 African-American female controls were screened
to identify cell lines that responded to receptor stimulation and
exhibited a hyperresponsive B cell phenotype associated with SLE
patient B cells. EBV lines were grown under standard culture
conditions in RPMI-1640 10% FBS supplemented with l-
glutamine, Penicillin-Streptomycin. Cells were washed and
cultured at 16106 cells/ml in serum free media overnight. Goat
anti-human-IgM F(ab)’2 polyclonal antibody (Jackson ImmunoR-
esearch, Inc.) at 50 mg/ml in RPMI-1640 10% FBS was used to
stimulate cells for the indicated periods of time. For signaling
experiments, 20 patient and 20 control B cell lines were stimulated
for 0.5 or 2 hours and then protein was isolated for Western
blotting. The degree of Erk1/2 phosphorylation initiated by anti-
IgM F(ab)’2 was used to designate each cell line as a ‘‘high
responder’’ or a ‘‘low responder’’, as shown in Figure 1. Although
cell lines derived from patients were generally more responsive
than those derived from controls, the extremes of the phenotype
were used in subsequent experiments, such that the patient lines
used were among those most responsive and the control lines used
were among those least responsive to BCR stimulation.
For gene expression analysis, a full time course was explored in
two high responding patient EBV cell lines and two low
responding control EBV cell lines. Time points used in these
experiments were 0.5, 1, 2, 4, 8, 16, and 24 hours following
stimulation with anti-IgM F(ab)’2 antibody. Preliminary analysis of
this data revealed that the differences in BCR pathway genes were
most evident in the early portion of the time course. Subsequent
replication experiments (utilizing another eight cell lines, four SLE
lines and four control lines) therefore used time points at baseline,
0.5, and 2 hours only.
Gene Expression ProfilingTotal RNA was isolated from B cells at each time point using
RNAqueous total RNA isolation kit (Ambion, Grand Island, NY)
and was quantitated by using a Nanodrop scanning spectropho-
tometer. cRNA was generated and labeled using the Affymetrix
cRNA labeling kit (Affymetrix, Santa Clara, CA) according to
manufacturer’s specifications. Gene expression was assayed using
Affymetrix GeneChipH Human Genome Focus Array represent-
ing 8500 verified human sequences from the NCBI RefSeq
database according to manufactures specifications.
Self-verifying Experimental DesignThis study’s experimental design is based on duplication of each
step of the experimental and analytical procedures. The analysis
starts with normalization of expression data followed by selection
of hypervariable expressed genes (HVE) distinctive from back-
ground at least in one time point. Only genes selected in both of
the duplicated experiments are used for further analysis. Verifi-
cation of the expression profile reproducibility for HVE genes was
carried out. Only genes whose expression profiles correlated with
the correlation coefficient were used for further analysis. Genes
were partitioned into clusters and only the genes gathered into the
same clusters in duplicated experiments were used for further
analysis. Finally, the networking of HVE genes based on partial
Figure 1. pERK1/2 is upregulated in hyperresponsive B cellsafter stimulation. B cells isolated from SLE patients and matchedcontrols were stimulated with anti-human IgM F(ab)’2 for 30 seconds or2 minutes. pERK1/2 (A) and normalized pERK1/2 intensity (B) showsincrease in hyperresponsive B cells after stimulation.doi:10.1371/journal.pone.0071397.g001
Dysregulated Pathways in Hyper-Reactive B Cells
PLOS ONE | www.plosone.org 2 August 2013 | Volume 8 | Issue 8 | e71397
correlation is examined and only reproducible edges are presented
in the final network.
Data AnalysisOur methods of data normalization and analysis are based on
the use of internal standards that characterize some aspect of
system behavior such as technical variability (presented in detail in
two recent publications [5,24]). These methods provide an
increase to the power of statistical criterion determined by the
content of the internal standard–normally several thousand
members–and this enables the use of relatively high statistical
thresholds without loss of the sensitivity of the selection. In general,
an internal standard is constructed by identifying a large family of
similarly behaving genes. Experimental conditions are denoted as
an equally expressed cohort. These internal standards were used to
robustly estimate parameters that describe some state of the
experimental system such as the identification of genes expressed
distinctly from background, differentially expressed genes, and
genes having similar dynamic behavior. Microarray data was
generated in compliance with the Minimal Information About a
Microarray Experiment (MIAME) guidelines. This data have been
deposited in NCBI’s Gene Expression Omnibus (GEO) database
(GEO Submission GSE37573, NCBI tracking system
#16567017).
Normalization. Normalization for differences among exper-
iments was conducted using a procedure described previously [25].
First, an internal standard is constructed by identifying a set of
normally distributed genes having expressions indistinguishable
from technological noise [26]. This background cohort enables the
statistical selection of genes above or below background with high
power. Genes expressed above background are used for unbiased
expression levels across arrays by means of a robust regression
procedure based on the use of the second internal standard – the
equally expressed cohort.
After normalization and adjustment of the gene expression
profiles to a common standard, log-transformed gene expressions
are used to calculate expression value deviations from the
averaged control profile. The log-transformed residuals are mostly
independent of expression level and approximate a normal
distribution based on the Kolmogorov-Smirnov criterion. Statis-
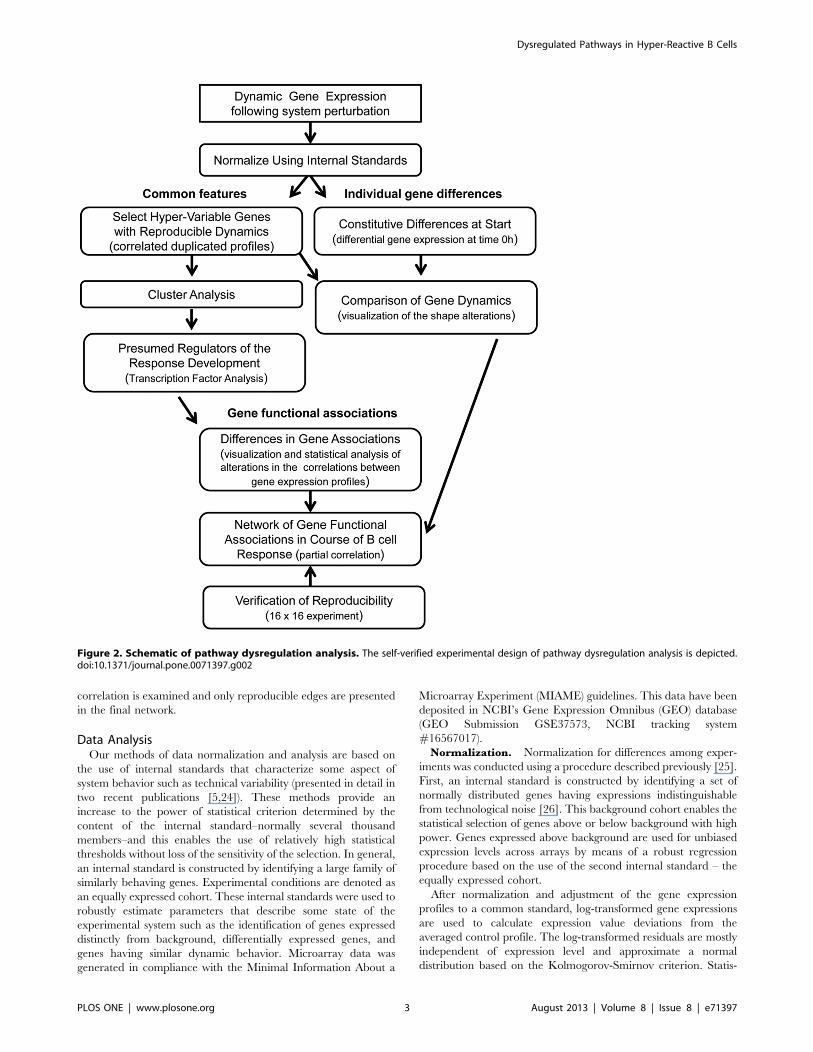
Figure 2. Schematic of pathway dysregulation analysis. The self-verified experimental design of pathway dysregulation analysis is depicted.doi:10.1371/journal.pone.0071397.g002
Dysregulated Pathways in Hyper-Reactive B Cells
PLOS ONE | www.plosone.org 3 August 2013 | Volume 8 | Issue 8 | e71397

tical analysis was performed using STATISTICA 6.1(StatSoft, Inc.
Tulsa, USA).
Internal standard for equity in expression and in
variability. The internal standard, or reference group, was
constructed by identifying a group of genes which are expressed
above background with inherently low variability as determined by
an F-test [25,27]. The reference group presents our third internal
standard- technological variation. By creating an estimate of the
technological variation, we are able to select a group of biologically
stable genes (BSG).
Hypervariable expressed genes. Genes whose expression
level varied significantly (P,1/N) when comparing an individual
gene’s variability to that of the reference group were denoted as
HVE [27]. The threshold of P,1/N, N represents the number of
genes expressed above background in at least one time point.
Associative analysis -identification of differentially
expressed genes [25]. These analyses include selections with
a Student T-test for replicates using the commonly accepted
significance threshold of p,0.05. However, a significant propor-
tion of the genes identified as differentially expressed will be a false
positive determination at this threshold level. An associative T-test,
in which the replicated residuals for each gene of the experimental
group are compared with the entire set of residuals from the
reference group defined above, was utilized. The hypotheses are
checked if gene expression in experimental group presented as
replicated residuals (deviations from averaged control group
profile) were associated with very representative (several thousands
of members) normally distributed set of residuals of gene
expressions in the reference group. The significance threshold
was corrected to make the appearance of false positive determi-
nations improbable. Only genes that passed through both tests are
presented in the result tables. Genes expressed distinctively from
background were determined by analysis of the association of each
replicated gene expression with normally distributed background
having an average equal to 0 and standard deviation equal to 1.
Analysis of the enrichment within gene classifications was assessed
using Ingenuity Pathway Analysis (IPA, http://www.ingenuity.
com/), Panther Classification System (Panther, http://www.
pantherdb.org/), DAVID Bioinformatics Resources 6.7, NIAID/
NIH (DAVID, http://david.abcc.ncifcrf.gov/home.jsp) and Gen-
eCards Batch Queries (GeneALaCart, http://www.genecards.
org/BatchQueries/index.php).
Figure 3. Variable gene clustering after stimulation of B cells from lupus patients and controls. Normalized gene expression data(average= 0, standard deviation= 1) from stimulated hyperresponsive B cells from SLE patients (left) and normal response B cells from control (right).Blue indicates negative normalized expression data and red indicates positive normalized expression data. Six gene clusters and the correspondingcluster profiles are shown to the right side of the heat-maps.doi:10.1371/journal.pone.0071397.g003
Dysregulated Pathways in Hyper-Reactive B Cells
PLOS ONE | www.plosone.org 4 August 2013 | Volume 8 | Issue 8 | e71397

Cross-validation of the SelectionsA jackknife procedure was used for characterization of the
robustness or reproducibility of the differentially expressed genes
selection. The comparative analysis was repeated for the two
groups of samples with exclusion of one sample from each group
throughout the analysis. For two groups with n and m replicates, n
6 m comparisons are possible. Genes selected as differentially
expressed in each of these comparisons (selected n6m times) were
ranked as having 100% of reproducibility.
F-means Cluster AnalysisThe clustering procedure consists of the following steps: gene
expression normalization, log-transformation and rescaling as
noted above; identifying HVE-genes within a group of samples by
comparing residual variability of each gene among samples with
variability of residuals of all genes in the reference group; and
determination of a parameter, termed connectivity, for each of
these hyper-variable genes. Connectivity was defined as the
number of genes deviated from the seeding profile within ranges
determined by the reference group. The p,0.05 threshold for the
F-test was used to diminish the proportion of false positive
selections.
HVE-genes of each group were sorted by their connectivity and
the clustering process was started with genes of highest connec-
tivity. The gene of highest connectivity and all genes whose
deviations from expression do not have variability higher than that
observed in the reference group are comprised in cluster #1. The
next highest gene connectivity and the genes that do not
significantly deviate from it comprised cluster #2, and the process
continued until all genes were analyzed. Genes that appeared in
more than one cluster were considered to be likely functional links
among these clusters. Genes with zero connectivity did not belong
to any cluster.
Correlation Mosaic AnalysisThe visual presentation of the gene co-expressions based on
gene clustering was performed using an original correlation matrix
technique as previously described [28]. Comprehensive pair-wise
correlations were calculated among gene expression levels such
that groups of genes that exhibited temporally correlated behavior
could be identified. The clustering procedure was based on the
Pearson correlation and follows the same sequence of operations
used in the F-means clustering above. However, instead of using
variability as a measure of distance, we use the correlation
coefficient. The number of clusters and cluster contents are
determined by the threshold for correlation coefficient, estimated
in simulation experiments. Matrices of correlation coefficients
were calculated for these clusters and are represented in a
correlation mosaic.
Gene Networking Based on the Use of Partial CorrelationThe method used here was slightly modified from a previously
described method [29,30]. The gene networking analysis was
performed in a pair-wise manner for all genes shown to be related
in a common cluster. Selection of the environment for each gene
(gene X) by determining all genes correlated with given one above
threshold te (gene X environment designated as Ex). Calculation of
a matrix of partial correlations between gene X and each gene
from environment Ex with extraction of the influence of all other
genes from Ex was performed. The Y row of the matrix consists of
partial correlations of given gene X with some other gene YeEx
and with removing the effects of all other genes from Ex (each
element in the Y row is partial correlation X vs Y (y-row) with
Figure 4. Transcription factor analysis of the variable geneclusters. Transcription factors tested are presented at the top of thediagram. The cluster content is shown along the right. Individualelements of the matrix are colored by the significance of the p-values(threshold p = 0.05): over-representation in the matrix is indicated inred, under-representation is indicated in green.doi:10.1371/journal.pone.0071397.g004
Dysregulated Pathways in Hyper-Reactive B Cells
PLOS ONE | www.plosone.org 5 August 2013 | Volume 8 | Issue 8 | e71397

withdrawal of the effect of gene Z from Ex (z-cell in the y-row)).The partial correlation of variables X and Y with respect to Z was
defined as prxy,z= (rxy2rxzryz)/((12rxz2)(12ryz
2))1/2.
Significance of the partial correlation between any pair of genes
(X &Y in above example) is based on the calculation of the
minimal PCm among all partial correlations in the row y and
averaged PCa partial correlations between them (for the row y).The partial correlation is recognized as essential if these values
exceed thresholds tm and ta correspondingly.
The presence of the only one member (PCxy,z) in the row below
threshold tm was evidence that association between X and Y genes
is indirect and is a result of their common association with some
third gene Z. However the presence analogous ‘‘hole’’ in the row z(Pxz,y,tm) is an evidence for the multiple association between X,Y, and Z genes (triangle association).
A Monte Carlo simulation study was used to define the
statistical thresholds (te, tm, and ta) below which partial
correlation coefficients were likely to be due to chance. For 8-
replicated randomized data simulating behavior of 200 genes,
using the thresholds te=0.8, tm=0.6, and ta=0.8 produced less
than 5% of false positive selections. The use of duplication
increased the sensitivity of the method essentially enabling to
decrease these thresholds to the levels te=0.6, tm=0.4, and
ta=0.4 without growth of proportion of the false positive
selections.
Results
Identification of Hyperactive B cell Lines from LupusPatientsB cells from lupus patients are known to be hyperresponsive to
stimulation through the BCR as evidenced by increased LYN and
ERK1/2 phosphorylation [19,31]. However, it was initially
unclear if the same differences would be observed in EBV
transformed B cell lines from lupus patients compared to B cell
lines derived from unaffected controls. Latent EBV transformation
can impact many cell processes, including BCR stimulation
[32,33,34,35], but it is unclear whether many of the long-term
EBV transformed cells actually express these EBV latent genes. To
minimize such influences, we screened potential cell lines from 20
African-American female lupus patients and 20 African-American
female controls to identify cell lines which responded to receptor
stimulation and exhibited a hyperresponsive B cell phenotype
associated with SLE patient B cells.
We assessed the amount of phospho-ERK1/2 generated
following BCR stimulation in these EBV transformed cell lines.
A representative ERK1/2 phosphorylation response in a case
versus a control cell line and normalized phospho-ERK1/2
intensities before stimulation and after stimulation for 2 minutes
are shown (Figure 1A and B). Almost all cells responded to
stimulation, but the average response was significantly higher in
the EBV transformed cells from the lupus cases (based on the
results of differential gene expression analysis).
The overarching goal of this research was to assess whether our
Pathway Dysregulation Analysis could identify known alterations
in the gene expression and signaling pathways of B cells from lupus
patients. As such, two control cell lines which were responsive to
Figure 5. Differences in gene dynamics between normal control SLE samples. The shown profiles are representative of gene dynamicsobserved in duplicated experiments. Three differences in gene dynamics are shown: quantitative differences (left), changes in gene profiles (middle),and changes from hyper variable to stable (right). Graphs were shown as hours after stimulation (x-axis) and normalized gene expressions (y-axis).Each line on the graph represents one cell line. Each cell line was classified as a high responder (solid line) or low responder (hatched line). SLE patientsample gene expression is shown in red; while normal control sample gene expression is shown in blue.doi:10.1371/journal.pone.0071397.g005
Dysregulated Pathways in Hyper-Reactive B Cells
PLOS ONE | www.plosone.org 6 August 2013 | Volume 8 | Issue 8 | e71397

BCR stimulation and two patient cell lines showing hyperrespon-
siveness to stimulation were selected for phase I of the study where
a complete time-course dynamic expression analysis was per-
formed. Four additional cases and controls were selected in the
same way from this screening group to be used in a more limited
time-course and focused analysis replication phase of the study
where expression at time points 0, 0.5 and 2 hours were analyzed.
Multi-level Analysis of the Dynamic Response of B cells toStimulation in vitro
Experimental data analysis pipeline. We applied a multi-
level analysis approach to understand the dynamic response of B
cells to stimulation. The first level of analysis identified genes with
constitutive differences in expression. These differences were not
altered in the course of B cell activation, were able to contribute
into activation dynamics as modulating factors creating specific
background, and were favorable for differences in dynamic
activation in patient B cells. The second level of analysis identified
differences in dynamic profiles of expression of individual genes
between the two phenotypic groups (gene profiles as independent
events). The third level of analysis identified differences in
collective behavior of genes associated with changes in gene to
gene regulatory interactions. The schematic of this analytical
approach is presented in Figure 2. Only reproducible results
between the two phenotypic pairs were used in the final analysis.
Using this strategy we were able to increase the sensitivity of the
statistical tests without the corresponding decrease of specificity
and to identify reproducible results in these two independent
experimental series within phase I.
Common Dynamic Expression Responses in LupusHyperresponsive B cells Compared to Control B cellsDynamic gene expression profiles that were independent of the
phenotype classifications (patient/control status and B cell
hyperresponsiveness) were analyzed. Only genes having statisti-
cally significant deviations from the majority of stable genes were
selected for the analysis. HVE genes were also assessed between
the phenotypic groups. As would be expected, most dynamic gene
expression profiles for individual genes were the same following
stimulation between the two phenotypic groups. Cluster analysis
groups genes based on similar expression profiles and provide
clues to the function or regulation of genes. About 500 genes were
selected for clustering and networking procedures based on their
expression levels (3SD above background at a minimum of one
time point) and reproducibility of the expression profiles (replicate
phenotype pairs with similar expression profiles and a correlation
above 0.8 for each gene in at least one group).
From this analysis, we derived six large clusters containing a
total of 160 genes, as shown in Figure 3 (a list of these genes
presented in Table S1 in File S1). Clusters are numbered in order
of the time of the maximal change in expression of the genes. The
six clusters observed included genes which expression was induced
during the stimulation protocol followed by a decline in their
expression. Cluster #1 presents genes with the earliest (0.5 h)
increase of expression and then immediate decline. Cluster #2
shows genes with maximal increase of expression at the 1 h time
point with Clusters 3–5 peaking at sequentially later time points
and with fewer numbers of genes. Cluster #6 presents genes that
had maximal expression before any stimulus was applied and
slowly decreased thereafter reaching minimal expression between
16 and 24 hours.
Although the general pattern observed here is the same in all
cell lines chosen for study, this general similarity does not exclude
significant differences in the behavior of a fraction of the genes
between the two phenotypic groups. The genes which do display a
difference in dynamic expression profile are described further
below.
Figure 6. Transcription factor analysis of uniquely activatedgenes in control and SLE patient samples. The transcriptionfactors tested are shown at the top of the figure. Blue text representsunique genes identified in control samples; while red text identifiesunique genes identified in SLE patient samples. Individual elements ofthe matrix are colored by the significance of the p-values (thresholdp = 0.05): over-representation in the matrix is indicated in red, under-representation is indicated in green.doi:10.1371/journal.pone.0071397.g006
Dysregulated Pathways in Hyper-Reactive B Cells
PLOS ONE | www.plosone.org 7 August 2013 | Volume 8 | Issue 8 | e71397

Transcriptional motif analysis within gene expression
clusters. Analyzing the significance of the individual gene
clusters identified by correlated dynamic expression profiles is
based upon the assumption that co-expressed genes are likely to
share common regulatory motifs [36,37]. Regulatory motifs
common to genes in each of the six clusters were identified using
the web-based program PAINT [38]. The predicted list of the
transcription factors for the 0.5, 1 and 2 hour time point clusters is
shown on the top of Figure 4. A detailed annotation of select
transcription factors and their association with known B cell
activation events is shown in Table S1 in File S1.
Genes within the clusters and the predicted transcription factors
(TFs) responsible for the co-expression of the clustered genes are in
agreement with the current B cell activation literature [9,39,40,41]
and are detailed in Table S2 in File S1. Analysis of the enrichment
within particular gene classifications was next assessed. Cluster 1
mainly consisted of ‘‘early response genes’’ (p = 3.1E212), while
clusters 2 and 3 consisted of ‘‘regulation of transcription’’ genes
(p = 2.9E29 and p= 1.2E26, respectively).
Many TFs known to regulate B cell genes following activation
are identified in this study; however, since these clustered genes
represent those which show no differences between the phenotypic
groups, the activation signals in the EBV transformed cells cause
predictable dynamic expression changes for most B cell genes.
Individual Gene DifferencesWhile similarities between the expression patterns observed in
the EBV-transformed lines exist, specific genes do differ between
the phenotypic groups. Utilizing hyperresponsive lupus patient
derived cell lines, we sought to identify constitutive differences in
gene expression at time 0. Individual gene dynamic expression
profiles and/or correlations between multiple gene dynamic
Figure 7. Correlative gene associations in normal B cell responses and in hyperresponsive B cell responses. Pearson correlation wasutilized to estimate the correlation coefficients. Negative correlations are shown in blue; while positive correlations are shown in red. Genes examinedare listed in table on the left. Gene numbers (right column) are used as coordinates along x and y-axis. Select gene expression graphs are shown onthe far right with the two SLE patient cell lines depicted in red and the two control cell lines depicted in blue. The order of genes is maintained givingclear visualization of differences in gene associations.doi:10.1371/journal.pone.0071397.g007
Dysregulated Pathways in Hyper-Reactive B Cells
PLOS ONE | www.plosone.org 8 August 2013 | Volume 8 | Issue 8 | e71397

profiles that are different between the two phenotypic groups were
examined.
Constitutive differences in gene expression between
phenotypic groups defined by hyperresponsive lupus
patient B cells and control B cells. Traditional differential
gene expression analysis was carried out at time 0 between SLE
patient hyperresponsive B cells and control B cells. This examines
the underlying expression signature characteristic to the hyperre-
sponsive state found in patient-derived cell lines. A detailed list,
including baseline differences between high-responders and low-
responders that regress to the mean over the course of stimulation,
is presented in Table S3 in File S2.
Differential gene expression analysis identified initial gene
expression differences which are important for regulating cellular
responses preceding B cell activation (such as ICAM1, VCAM1,
and chemokine receptors). We also observe SLE markers whose
association with disease is well known but whose role in B cell
activation is not clear such as IRF5, SlamF7 and TLR7.
Identification of differences in dynamic gene expression
profiles between phenotypic groups. A simple clustering
Figure 8. Gene network interaction after B cell stimulation of SLE patient and normal control samples. A gene network interaction map(from the initial analysis group) built using the partial correlations method is shown. Genes were grouped in different colored clusters representingmaximum expression levels at various time points after B cell stimulation. The center gene clusters represent genes with maximum expression levelsobtained after 0.5 hours of stimulation; then followed by colored circles for genes with maximum expression levels at 1, 2, 4, 8 hours, while the genesin peripheral circle reach maximum expression levels 16 to 24 hours after stimulation. Blue lines linking genes represent gene associations found innormal control samples. Red lines represent gene associations found in SLE patient samples. Black lines indicate gene associations found in bothgroups. Dashed lines represent negative gene associations.doi:10.1371/journal.pone.0071397.g008
Dysregulated Pathways in Hyper-Reactive B Cells
PLOS ONE | www.plosone.org 9 August 2013 | Volume 8 | Issue 8 | e71397

Dysregulated Pathways in Hyper-Reactive B Cells
PLOS ONE | www.plosone.org 10 August 2013 | Volume 8 | Issue 8 | e71397

analysis reveals, as expected, a very high level of similarity in the
dynamic expression profile of most genes. However, discreet
differences in the dynamic expression profiles for select genes were
found. We were able to discriminate between three types of gene
expression dynamics between the high and low B cell activation
response groups as outlined in Figure 5. These differences in gene
expression dynamics can reflect quantitative differences in the level
of expression despite similar profile patterns, changes in associa-
tion between genes, and gene clusters. Examples of these
differences are given in Figure 5 and in Table S3 in File S2.
Interestingly, these include genes previously associated with B cell
activation and SLE. Since our phenotypic groups are based upon
differences in B cell responsiveness to stimulation, it is encouraging
that we were able to identify these enhanced responses in dynamic
profiles of early response genes.
Several genes demonstrated very unique profiles of dynamic
expression responses following B cell stimulation. While these
genes have not previously been associated with SLE, they might
warrant further investigation as potential candidate genes. These
include genes such as ZBTB25, AICDA, HMGCL, PGF, HIG2,
HRSP12, GCHFR, and LGMN. Each of these genes was only
activated in normal responsive B cells. In contrast, some genes
such as GPR137B, NAB1, and TCIRG1 were only expressed in
hyperresponsive B cells from SLE patients. Transcription motif
analysis for such genes uniquely variable in only one subgroup is
shown in Figure 6.
Evidence of Potential Functional Associations betweenGenes Based Upon Dynamic Gene Expression Data
Analysis of differences in gene functional
associations. In the results presented above, we have outlined
three types of dynamics of gene expression. Of these, changes in
dynamic expression profiles and expression of genes exclusively in
one phenotype group can clearly be visualized using a correlative
mosaic presentation [28] as shown in Figure 7.
Correlative mosaics yield information about all gene-to-gene
associations within the functionally defined group of genes and
enables direct visual comparison of these associations between the
two phenotypes. Genes with similar profiles tended to cluster
together. Correlations were very high between genes within the
same cluster, suggesting a functional link [42].
Comparison of the correlation mosaic between the B cell
control samples and the hyperresponsive B cells derived from
lupus patients identifies regulatory associations that are different
between the two groups. In hyperresponsive B cells, significantly
changed dynamic expression profiles are easily observed. Other
patterns of dynamic expression, including genes whose pattern of
expression dynamics is similar between the phenotypic groups but
whose quantitative levels of expression differ, can also be easily
observed. These genes can not necessarily be excluded from
having a functional association difference because of the lack of
correlation differences in this type of visualization.
Use of discrete time periods of a dynamic gene
expression response to reconstruct networks of gene
functional associations. The correlative clustering presented
in Figure 7 partitions genes with similar expression dynamics into
highly correlated groups. However, not every pair of highly
correlated genes is necessarily functionally interconnected. As
such, we next utilized partial correlation coefficients which are
better able to identify direct functional interconnections and tend
to exclude third party influences [43]. The unique gene-gene
regulatory associations that appear in only one phenotypic group
were obtained from a paired analysis. Partial correlations were
calculated for each pair of genes. If significant partial correlations
appeared for any given pair of genes simultaneously in both
independent experiments, this was considered evidence for the
functional association between these genes. The resulting associ-
ations are visualized by the network shown in Figure 8. This figure
reveals groups of genes which likely share a common biological
process at the peak time interval where the cluster’s genes are
expressed. Networking gives additional information about cause-
effect or temporal nature of a relationship between genes. Detailed
information about all gene interconnections is given in Table S1 in
File S1.
Phenotype specific sub-networks focused on B cell
activation, apoptosis or lupus associated genes. If we focus
on genes that demonstrate statistically significant dynamic
behavior in one phenotypic group while remaining stable or not
expressed in another phenotypic group we can gain insight into
potentially functional genes and their interconnections in path-
ways. Figure 9A presents fragments of the dynamic expression
network we constructed in Figure 8, where a majority of the genes
display a prominent dynamic behavior only in the normally
responsive phenotypic group derived from controls. Based upon
information presented in Table S3 in File S2, all of these genes fall
into two functional categories: regulatory control of the B cell
activation and pro-apoptotic activity. In this analysis, these very
early response genes were correlated with the expression of
inflammatory, cytokine and chemokine receptor genes in samples
from normally responsive control B cells. Connections to genes
downstream of B cell activation and inflammation were observed.
In addition, interconnections between the early activation genes
and downstream apoptosis related pathway genes exist and were
only observed in the normal responsive B cells from control
subjects (Figure 9A).
In contrast, several interconnections are found between genes
based on correlated expression which are only observed in
hyperresponsive B cells (Figure 9B). While several of the gene
nodes in the activation/signaling/inflammation pathway are
similar between the normal responsive and hyperresponsive B
cells, it is the correlations between these genes that differ. Only a
few genes in the apoptosis pathway appear to be correlated with
the upstream early activation genes, suggesting that the apoptosis
pathway regulation is different between the two phenotypic
groups.
Confirmation analysis. While the results presented thus far
in two independent dynamic expression experiments unambigu-
ously demonstrate reproducibility, we carried out an additional
experimental series with 8 additional pairs of cell lines character-
ized as normal responsive and hyperresponsive. We only
replicated the most informative time points (0 and 0.5 hours)
and were able to demonstrate confirmation of approximately 80%
of earlier established differences (See Table S2 in File S1). The
analysis of dynamic changes in gene expressions between the two
earliest time points (0 and 0.5 hr) confirmed the same increase of
expression of most genes from cluster 1 in Figure 4 with the
exception of EGR4 (data not shown).
Figure 9. Dynamic gene networks in normal and SLE patient B cells. Unique dynamic gene networks of the examined (A) normal (n = 2) and(B) hyperresponsive B (n = 2) cells are shown. Genes that appear in both the normal and hyperresponsive B cells are in bold.doi:10.1371/journal.pone.0071397.g009
Dysregulated Pathways in Hyper-Reactive B Cells
PLOS ONE | www.plosone.org 11 August 2013 | Volume 8 | Issue 8 | e71397

Discussion
Gene expression profiling by microarray analysis has revolu-
tionized the study of biology by allowing for the simultaneous
examination of thousands of genes. However, the ultimate goal is
to characterize details of the studied system by identifying
functional associations between its genes.
Here we use a systems biology approach in proof-of-concept
experiments to analyze differences in gene functional associations
in B lymphocytes. B cells from two different phenotypically
discrete groups, normally responsive B cells derived from African-
American healthy donors and hyperresponsive B cells derived
African-American lupus patients were used to identify differences
in the regulation of sub-networks characteristic for the B cell
response. We employed a multistage analysis collectively called the
Pathway Dysregulation Analysis. The first step established genes
that responded to B cell activation irrespective of the phenotypic
group. The sequences of changes in expression, or the dynamic
profiles, were clustered to identify groups of genes with similar
functionality. The next step in the analysis was to establish
constitutive differences in gene expression between the phenotypic
groups. The third step was to identify genes where differences in
the dynamic expression profile could discriminate between the
phenotypic groups. The final step was to create a model reflecting
the complexity of the functional associations between genes in the
network and allow one to visualize unique features of the
interconnections.
A critical caveat of this approach, discriminating it from many
similar analyses, is that the course is determined in part by the
reproducibility of the data. First, all of the data (phenotype group 1
(patient), group 2 (control), stimulated and unstimulated) were
normalized together, thereby minimizing the systemic differences
within and between groups of samples (Level 1). Next, genes were
selected on the basis of their variability in the system; those with
significantly extended variation compared with the majority of
genes (which were stable both between both phenotypic groups
and under stimulatory conditions) (Level 2). This step demanded
replication; only HVE-genes with highly correlated profiles in
duplicated subgroups (cc.0.8) were used for subsequent analysis.
We cannot conclude that the differences seen between the two
phenotypic groups are necessarily representative of all SLE
patients and all controls as our study was focused on assessing
whether the Pathway Dysregulation Analysis method would
identify genes/pathways indicative of the reported biology. As
such, our experiments were not powered to fully test dynamic gene
expression differences between lupus patient and healthy control B
cells. However, differences in the dynamics of gene expression
following B cell activation between these two phenotypic groups
can give some insights into the genes and pathways which are
potentially different between these two groups.
Other multivariate methods of analysis show potential to rapidly
identify genes and groups of genes involved in normal and disease
processes. However, there are practically no examples of
reproduction of the sophisticated constructions created for the
explanation of biological phenomena. A well-recognized problem
with multivariate analyses in microarray experiments is reproduc-
ibility and verification [44]. To reduce this concern, we utilized an
experimental design with reproducibility testing at each level of
analysis.
The final results of our analysis include a very complicated
network of functional associations of many genes, but the details of
this complex network can be replicated by two independent
experiments. While this is of course encouraging, it is still difficult
to ascertain functional consequences of discrete differences in such
complicated networks. Our approach takes advantage of incorpo-
rating additional parameters derived from analysis of the
differences in the individual gene dynamics, contents of the
clusters, gene functional interconnections in the network, and
comparison of this information with prior knowledge about B cell
activation and gene expression dynamics. Numerous approaches
can create gene networks through reverse engineering methods.
However, most of these methods rely upon correlation or other
measures of association and are unable to discriminate between
direct and indirect associations [43]. Our technique is based on the
use of partial correlation which is able to discriminate between
direct and indirect associations similar to the method applied in
series of publications on the ARACNe method (Data Processing
Inequality method in [9,45,46,47]). More informative associations
can be obtained with methods based on the estimation of the
probabilities of associations and mutual information
([9,45,48,49,50], however, these methods need much more
information (more replicates or time points) to establish reliable
associations. These methods are more sensitive to experimental
errors and depend upon categorizing the data into a discrete
binary parameter (e.g. expressed/not expressed states) for entropy
calculation.
It is important to be able to discriminate between the
biologically driven variations of gene expression and the chaotic
noise type variations that are very common for microarray
experiments. The approaches usually employed are based on
subjectively established thresholds for this discrimination [9]. In
our analysis we employed the selection of hyper-variably expressed
genes. This is based upon the use of the internal standard
methodology and application of strong statistical criteria to enable
high power and high specificity selections of genes. Application of
an additional filter to the selection of genes in the dynamic analysis
is based upon the use of reproducibility of their dynamic
expression profiles. Variations due to background noise are
usually not reproducible.
Our study demonstrates that multilevel analysis is capable of
defining gene regulatory pathways which not only reflect the
differences in hyper vs. normal B cell responsiveness to activation,
but also represents candidate pathways that may be the target of
functional dysregulation in diseases with hyperresponsive B cells,
such as lupus.
Supporting Information
File S1 Table S1, Cluster allocations and functional intercon-
nection of 160 hyper-variably expressed genes in response to B cell
stimulation. Data is a composite of the initial analysis group
consisting of two control and two SLE patient cell lines. Table S2,
Differentially expressed genes between normal and SLE-patient
samples at early time points after B cell stimulation. Columns A
and B describe information about the genes in the array. Columns
C–H and I–M show normalized levels of gene expression (mean
and standard deviation) for normal control and SLE-patient
samples. Columns G and M depict the p-value obtained from an
associative test, while columns H and N have the ratio of patient to
control expression levels. The results of analysis are shown in
columns O–R. In columns O–R, the minimum expression level set
at .20 is used as the requirement for gene expression to be
considered above background. In columns O and P, minimum
differences in fold expression changes is set at .2. In columns Q
and R the restriction for fold differences is decreased to 1.3.
Expression Changes designations: A1= significant overexpression
in patient samples versus control samples; A2= significant
overexpression in control samples versus patient samples;
Dysregulated Pathways in Hyper-Reactive B Cells
PLOS ONE | www.plosone.org 12 August 2013 | Volume 8 | Issue 8 | e71397

A3= gene expressed only in patient samples; A4= gene expressed
in only control samples. Columns S-AF show the results of the
confirmatory analysis using the same samples as the initial analysis.
Data from the initial two SLE patient and two 2 control cell lines
are shown.
(XLSX)
File S2 Table S3, Differences in dynamic gene expression
profiles between phenotypic groups. Genes marked with blue are
overexpressed in normal control samples, marked with red are
overexpressed in pathological samples, bold symbols are used for
genes uniquely dynamical in one group and stabile or not
expressed in another. The lines on the graph are representative of
the two SLE patient (red) and two control (blue) cell lines initially
examined. Each phenotypic group was split into a high responder
(solid) or low responder (hatched) cell line based on response to
BCR stimulation.
(DOC)
Acknowledgments
The authors would like to thank the Lupus Family Registry and Repository
staff. We thank the patients and all other referring health care providers for
participating in this study.
Author Contributions
Conceived and designed the experiments: ID ALS JBH JAJ JMG.
Performed the experiments: ID ND ALS JMG. Analyzed the data: ID ALS
JMR JMG. Contributed reagents/materials/analysis tools: ID JBH JAJ
JMG. Wrote the paper: ID ND ALS JMR JBH JAJ JMG.
References
1. Braga-Neto UM, Marques ET Jr (2006) From functional genomics to functional
immunomics: new challenges, old problems, big rewards. PLoS Comput Biol 2:
e81.
2. Mandel M, Achiron A (2006) Gene expression studies in systemic lupuserythematosus. Lupus 15: 451–456.
3. Jarvis JN, Dozmorov I, Jiang K, Frank MB, Szodoray P, et al. (2004) Novel
approaches to gene expression analysis of active polyarticular juvenile
rheumatoid arthritis. Arthritis ResTher 6: R15–R32.
4. Lawrence S, Tang Y, Frank MB, Dozmorov I, Jiang K, et al. (2007) A dynamic
model of gene expression in monocytes reveals differences in immediate/early
response genes between adult and neonatal cells. J Inflamm (Lond) 4: 4.
5. Dozmorov IM, Jarvis J, Saban R, Benbrook DM, Wakeland E, et al. (2011)
Internal standard-based analysis of microarray data2–analysis of functional
associations between HVE-genes. Nucleic acids research 39: 7881–7899.
6. Szodoray P, Alex P, Jonsson MV, Knowlton N, Dozmorov I, et al. (2005)
Distinct profiles of Sjogren’s syndrome patients with ectopic salivary glandgerminal centers revealed by serum cytokines and BAFF. Clin Immunol 117:
168–176.
7. Madar A, Bonneau R (2009) Learning global models of transcriptional
regulatory networks from data. Methods in molecular biology 541: 181.
8. Kerbauy DB, Deeg HJ (2007) Apoptosis and antiapoptotic mechanisms in the
progression of myelodysplastic syndrome. Experimental hematology 35: 1739–
1746.
9. Mani KM, Lefebvre C, Wang K, Lim WK, Basso K, et al. (2008) A systemsbiology approach to prediction of oncogenes and molecular perturbation targets
in B-cell lymphomas. Molecular systems biology 4: 169.
10. Wakeland EK, Liu K, Graham RR, Behrens TW (2001) Delineating the genetic
basis of systemic lupus erythematosus. Immunity 15: 397–408.
11. Harley JB, Kelly JA (2002) Genetic basis of systemic lupus erythematosus: a
review of the unique genetic contributions in African Americans. J Natl Med
Assoc 94: 670–677.
12. Wu T, Qin X, Kurepa Z, Kumar KR, Liu K, et al. (2007) Shared signaling
networks active in B cells isolated from genetically distinct mouse models of
lupus. J Clin Invest 117: 2186–2196.
13. Zhu LJ, Landolt-Marticorena C, Li T, Yang X, Yu XQ, et al. (2010) Altered
expression of TNF-alpha signaling pathway proteins in systemic lupuserythematosus. J Rheumatol 37: 1658–1666.
14. Liossis SN, Kovacs B, Dennis G, Kammer GM, Tsokos GC (1996) B cells from
patients with systemic lupus erythematosus display abnormal antigen receptor-
mediated early signal transduction events. J Clin Invest 98: 2549–2557.
15. Taher TE, Parikh K, Flores-Borja F, Mletzko S, Isenberg DA, et al. (2010)
Protein phosphorylation and kinome profiling reveal altered regulation of
multiple signaling pathways in B lymphocytes from patients with systemic lupus
erythematosus. Arthritis Rheum 62: 2412–2423.
16. Suarez-Fueyo A, Barber DF, Martinez-Ara J, Zea-Mendoza AC, Carrera AC
(2011) Enhanced phosphoinositide 3-kinase delta activity is a frequent event in
systemic lupus erythematosus that confers resistance to activation-induced T cell
death. J Immunol 187: 2376–2385.
17. Niewold TB (2011) Interferon alpha as a primary pathogenic factor in human
lupus. Journal of interferon & cytokine research : the official journal of the
International Society for Interferon and Cytokine Research 31: 887–892.
18. Weckerle CE, Mangale D, Franek BS, Kelly JA, Kumabe M, et al. (2012) Large-scale analysis of tumor necrosis factor alpha levels in systemic lupus
erythematosus. Arthritis and rheumatism 64: 2947–2952.
19. Jenks SA, Sanz I (2009) Altered B cell receptor signaling in human systemic
lupus erythematosus. Autoimmun Rev 8: 209–213.
20. Dorner T, Jacobi AM, Lee J, Lipsky PE (2011) Abnormalities of B cell subsets in
patients with systemic lupus erythematosus. J Immunol Methods 363: 187–197.
21. Griffin DO, Rothstein TL (2011) A small CD11b(+) human B1 cell
subpopulation stimulates T cells and is expanded in lupus. J Exp Med 208:2591–2598.
22. Vossenkamper A, Lutalo PM, Spencer J (2012) Translational Mini-Review
Series on B cell subsets in disease. Transitional B cells in systemic lupus
erythematosus and Sjogren’s syndrome: clinical implications and effects of B cell-
targeted therapies. Clin Exp Immunol 167: 7–14.
23. Blair PA, Norena LY, Flores-Borja F, Rawlings DJ, Isenberg DA, et al. (2010)
CD19(+)CD24(hi)CD38(hi) B cells exhibit regulatory capacity in healthy
individuals but are functionally impaired in systemic Lupus Erythematosus
patients. Immunity 32: 129–140.
24. Dozmorov I, Lefkovits I (2009) Internal standard-based analysis of microarray
data. Part 1: analysis of differential gene expressions. Nucleic Acids Res 37:
6323–6339.
25. Dozmorov I, Centola M (2003) An associative analysis of gene expression array
data. Bioinformatics (Oxford, England) 19: 204–211.
26. Dozmorov I, Knowlton N, Tang Y, Centola M (2004) Statistical monitoring of
weak spots for improvement of normalization and ratio estimates in microarrays.
BMC bioinformatics [electronic resource] 5: 53.
27. Dozmorov I, Knowlton N, Tang Y, Shields A, Pathipvanich P, et al. (2004)
Hypervariable genes–experimental error or hidden dynamics. Nucleic acids
research 32: e147.
28. Dozmorov I, Saban MR, Gerard NP, Lu B, Nguyen NB, et al. (2003)
Neurokinin 1 receptors and neprilysin modulation of mouse bladder gene
regulation. Physiol Genomics 12: 239–250.
29. Dozmorov I, Saban MR, Knowlton N, Centola M, Saban R (2003) Connective
molecular pathways of experimental bladder inflammation. Physiol Genomics
15: 209–222.
30. Zimmerman RA, Dozmorov I, Nunlist EH, Tang Y, Li X, et al. (2004) 5alpha-
Androstane-3alpha,17beta-diol activates pathway that resembles the epidermal
growth factor responsive pathways in stimulating human prostate cancer LNCaP
cell proliferation. Prostate Cancer Prostatic Dis 7: 364–374.
31. Nicholas MW, Dooley MA, Hogan SL, Anolik J, Looney J, et al. (2008) A novel
subset of memory B cells is enriched in autoreactivity and correlates with adverse
outcomes in SLE. Clin Immunol 126: 189–201.
32. Caldwell RG, Wilson JB, Anderson SJ, Longnecker R (1998) Epstein-Barr virus
LMP2A drives B cell development and survival in the absence of normal B cell
receptor signals. Immunity 9: 405–411.
33. Carter KL, Cahir-McFarland E, Kieff E (2002) Epstein-barr virus-induced
changes in B-lymphocyte gene expression. Journal of virology 76: 10427–10436.
34. Park CH, Kim HR, Kim J, Jang SH, Lee KY, et al. (2004) Latent membrane
protein 1 of Epstein-Barr virus plays an important role in the serum starvation
resistance of Epstein-Barr virus-immortalized B lymphocytes. Journal of cellular
biochemistry 91: 777–785.
35. Rovedo M, Longnecker R (2008) Epstein-Barr virus latent membrane protein
2A preferentially signals through the Src family kinase Lyn. J Virol 82: 8520–
8528.
36. Dozmorov MG, Kyker KD, Saban R, Knowlton N, Dozmorov I, et al. (2006)
Analysis of the interaction of extracellular matrix and phenotype of bladder
cancer cells. BMC Cancer 6: 12.
37. Chiang DY, Brown PO, Eisen MB (2001) Visualizing associations between
genome sequences and gene expression data using genome-mean expression
profiles. Bioinformatics 17 Suppl 1: S49–55.
38. Vadigepalli R, Chakravarthula P, Zak DE, Schwaber JS, Gonye GE (2003)
PAINT: a promoter analysis and interaction network generation tool for gene
regulatory network identification. Omics : a journal of integrative biology 7:
235–252.
39. Klein U, Casola S, Cattoretti G, Shen Q, Lia M, et al. (2006) Transcription
factor IRF4 controls plasma cell differentiation and class-switch recombination.
Nat Immunol 7: 773–782.
40. Lefebvre C, Rajbhandari P, Alvarez MJ, Bandaru P, Lim WK, et al. (2010) A
human B-cell interactome identifies MYB and FOXM1 as master regulators of
proliferation in germinal centers. Molecular systems biology 6: 377.
Dysregulated Pathways in Hyper-Reactive B Cells
PLOS ONE | www.plosone.org 13 August 2013 | Volume 8 | Issue 8 | e71397

41. Basso K, Dalla-Favera R (2010) BCL6: master regulator of the germinal center
reaction and key oncogene in B cell lymphomagenesis. Adv Immunol 105: 193–
210.
42. Eisen MB, Spellman PT, Brown PO, Botstein D (1998) Cluster analysis and
display of genome-wide expression patterns. Proc Natl Acad Sci U S A 95:
14863–14868.
43. de la Fuente A, Bing N, Hoeschele I, Mendes P (2004) Discovery of meaningful
associations in genomic data using partial correlation coefficients. Bioinformatics
20: 3565–3574.
44. McShane LM, Radmacher MD, Freidlin B, Yu R, Li MC, et al. (2002) Methods
for assessing reproducibility of clustering patterns observed in analyses of
microarray data. Bioinformatics 18: 1462–1469.
45. Basso K, Margolin AA, Stolovitzky G, Klein U, Dalla-Favera R, et al. (2005)
Reverse engineering of regulatory networks in human B cells. Nat Genet 37:382–390.
46. Lim WK, Wang K, Lefebvre C, Califano A (2007) Comparative analysis of
microarray normalization procedures: effects on reverse engineering genenetworks. Bioinformatics 23: i282–288.
47. Margolin AA, Wang K, Lim WK, Kustagi M, Nemenman I, et al. (2006)Reverse engineering cellular networks. Nat Protoc 1: 662–671.
48. Friedman N, Linial M, Nachman I, Pe’er D (2000) Using Bayesian networks to
analyze expression data. J Comput Biol 7: 601–620.49. Ziv E, Middendorf M, Wiggins CH (2005) Information-theoretic approach to
network modularity. Phys Rev E Stat Nonlin Soft Matter Phys 71: 046117.50. Slonim N, Atwal GS, Tkacik G, Bialek W (2005) Information-based clustering.
Proc Natl Acad Sci U S A 102: 18297–18302.
Dysregulated Pathways in Hyper-Reactive B Cells
PLOS ONE | www.plosone.org 14 August 2013 | Volume 8 | Issue 8 | e71397
Copyright © 2022 FDOKUMEN