Green micas in the Archaean Isua and Malene supracrustal ...
Upload
uni-potsdamCategory
view
0download
0
Lithos 125 (2011) 482–502
Contents lists available at ScienceDirect
Lithos
j ourna l homepage: www.e lsev ie r.com/ locate / l i thos
Evidence from Dwyka tillite cobbles of Archaean basement beneath the Kalaharisands of southern Africa
David H. Cornell a,⁎, Valby van Schijndel a, Olafur Ingolfsson b, Anders Scherstén c,1, Linn Karlsson a,Joanna Wojtyla a, Kristin Karlsson a
a Department of Earth Sciences, University of Gothenburg, SE40530, Swedenb Institute of Earth Sciences, University of Iceland, Ís-101 Reykjavík, Icelandc Geological Survey of Denmark and Greenland, Ø. Voldgade 10, DK-1350 Cph. K, Copenhagen, Denmark
⁎ Corresponding author. Tel.: +46 31 786 2805; fax:E-mail address: [email protected] (D.H. Cornell).
1 Now at: Department of Earth and Ecosystem ScienUniversity, Sölvegatan 13, SE-22362, Sweden.
0024-4937/$ – see front matter © 2011 Elsevier B.V. Adoi:10.1016/j.lithos.2011.03.006
a b s t r a c t
a r t i c l e i n f oArticle history:Received 2 November 2010Accepted 3 March 2011Available online 10 March 2011
Keywords:KalahariDwyka FormationRehoboth ProvinceKaapvaal CratonIon probe zircon datingZircon oxygen isotope
We have found a new source of information about what lies beneath the Kalahari sands. The Kheis andRehoboth Provinces of southern Africa were thought to be underlain by either an ~1800 Ma orogenic belt, or anorthern branch of the ~1200 Ma Namaqua–Natal Province. Glacial diamictites of the PermocarboniferousDwyka Group exposed at Rietfontein west of the Kalahari sands carry cobbles plucked from the bedrock by theice sheet which covered the Gondwana supercontinent about 300 Ma ago. Despite altered mineralogy, thecobbles are not severely altered geochemically. Their normative mineral compositions give classifications astrondhjemites and granites, supported by rare earth element diagrams. Microbeam U–Pb zircon dating of thegranitic cobbles shows that they contain no evidence of crustal growth or orogeny at either 1800 or 1200 Ma.Rather they testify to the presence of 2500 to 2900 Ma Archaean trondhjemitic and granitic crust beneath theKalahari, with a lesser ~2050 Ma granite component. The pebble assemblages from the diamictites wesampled lack the diagnostic banded iron formation (BIF), stromatolitic limestone and other supracrustalpebbles which characterise diamictites derived from the Kaapvaal Craton, thus we envisage shorter transportdistances and derivation from the region now beneath the Kalahari sands. Three of the Archaean granitecobbles have unusual less-than-mantle zircon oxygen isotope values around +3 (δ18O VSMOW), which mayreflect interaction of their source with high-temperature, originally meteoric water before melting to producethe granites. Themafic cobbles described in a companion paper aremuch younger and are related to intrusionsof the 1.1 Ga Umkondo Large Igneous Province, probably located on the Kalahari Line or Rehoboth Province.Five trondhjemitic granites from the westernmost outcrops of the Kaapvaal Craton were dated, the oldestbeing 3061±9 Ma and four others between 2882±7 Ma and 2854±7 Ma, reflecting the cratonisation of theKimberley Terrane. Four of the Archaean Dwyka cobbles we dated are younger than the 2.7 Ga Kaapvaal coversequence and are thus too young to be derived from the craton.All the Dwyka cobbles described here are most likely derived from either the Rehoboth Province or theKalahari Line with origins from the Kheis Province, Kaapvaal Craton, or further afield considered unlikely. Weenvisage the Rehoboth Province to consist of an Archaean core supplemented by Palaeoproterozoicgranitoids, which was joined to the Kaapvaal Craton at an early stage of crustal development and played animportant role during later tectonic events. This has important implications not only for the tectonicframework and assembly of Southern Africa, but also for exploration for diamonds and other ore deposits.
+46 31 786 19 86.
ces, Division of Geology, Lund
ll rights reserved.
© 2011 Elsevier B.V. All rights reserved.
1. Introduction
The Precambrian framework of southern Africa is well known, asshown in Fig. 1a and reviewed by Johnson et al. (2006), with thenotable exception of the Kheis and Rehoboth Provinces which arelargely covered by Cretaceous to Recent Kalahari Desert sands.
According to published work, the Kheis Province could either be an~1800 Ma orogenic belt (Cornell et al., 1998), or a northern branch ofthe ~1200 Ma Namaqua–Natal Province (Moen, 1999; Moen andArmstrong, 2008). The Rehoboth Province also contains 1850–1720 Ma and 1.37–1.1 Ga components (Becker et al., 2006). In thiswork we investigate and date a group of sixteen granitoid cobblesplucked from the basement east of Rietfontein by the ~300 MaPermocarboniferous Dwyka ice sheet, now exposed in tillite on theborder between Namibia and South Africa (Visser, 1997). Surprising-ly, these cobbles contain no evidence of crustal growth or orogeny ateither 1800 or 1200 Ma, but rather suggest the presence of Archaean
KAAPVAALCRATON
3.1 Ga
Kalahari Basin
b
**Border
Rietfontein
*KoopanSuid10 km
N A
MIB
IA
BOTS-WANA
SOUTH AFRICA
*
27 S
20E
2030
E
26 45 S
27 15 S
Mafic (sub)-outcrops1.1 Ga
International BorderTectonic Province BoundaryInferred extent of UmkondoLarge Igneous ProvinceRoad River
ICE MOVEMENT DIRECTIONSMoore and Moore (2004)Visser (1987, 1997)
Sample locations
ZiMBN
SA
B: BotswanaM: MozambiqueN: Namibia
SA: South AfricaZi: Zimbabwe
200 km
Pretoria
Swaziland
Lesotho
Windhoek
Cape Town
a
Gaborone
N
*KarnaldamSannaspoort
Rehoboth
Rehoboth Province
Vioolsdrif
OKWA
Upington
Figure 1b
KO
*
*
Kh
eis
Pro
vin
ce
ZIMBABWE CRATON 3.2 Ga
*Kgokgole
Koppiespan**
Olifantshoek
Motition
Xadecx
Tshane cxTsetseng cx
Mabuasehube
Ditshipeng
LIMPOPO BELT2.7 Ga
SALDANHA
Groblershoop
Fig. 1. a. Crustal framework of southern Africa showing structural provinces modified after Cornell et al. (1998) and Corner (2003), large mafic intrusions and Dwyka ice movementvectors after Visser (1987, 1997, solid arrows) and Moore and Moore (2004, dashed arrows). The area covered by the Kalahari sand is shaded, after Haddon and McCarthy (2005),KO: Koras Group. b: Detail of sampling sites.
483D.H. Cornell et al. / Lithos 125 (2011) 482–502
granite beneath the Kalahari, with a younger 2.0 Ga graniticcomponent. In a companion paper (Van Schijndel et al., submittedfor publication) we dealt with the 1.1 Ga mafic cobbles and in thiswork we discuss the broader implications of both datasets.
1.1. Glacial clasts as provenance indicators
Glacial cobbles and boulders have been used in many studies toinvestigate the ice movement directions, the provenance of bouldersand the distance that they have been transported. Bouchard andSalonen (1990) report typical transport distances in basal tills of 4 to25 km in Finland and Canada. They note that local stratigraphy tendsto be dominant in till stone counts. By contrast, erratic boulders foundin Germany and Poland have been traced to their Scandinaviansources and testify to Quaternary glacial transport distances up to1000 km. In southern Africa, Visser et al. (1986) identified character-istic stromatolitic limestone, chert and banded iron formation clasts inDwyka diamictites some 300 km south of their provenance in the
Kaapvaal Craton cover sequence. It is significant that these threedistinctive rock types are clearly able to survive large transportdistances. Such huge transport distances probably involved thecombined effect of several glacial cycles.
2. Crustal framework of southern Africa
Fig. 1a depicts the structural provinces of southern Africa, withtheir ages, following Cornell et al. (1998) and modified using regionalmagnetic maps (Becker et al., 2006; Corner, 2003, 2008). These first-order subdivisions are important in understanding how and when thecontinents were assembled and for the planning of mineral prospect-ing. The continuity and boundaries of provinces such as theNamaqua–Natal Province have been established by geophysics, deepdrilling and radiometric dating despite the thick Phanerozoic coverwhich separates the Namaqua and Natal sectors (Cornell et al., 2006).However, the regions labelled Rehoboth and Kheis in Fig. 1a, arealmost entirely buried below the Late Cretaceous to Recent Kalahari
484 D.H. Cornell et al. / Lithos 125 (2011) 482–502
sands and are poorly understood. The descriptions, age and integrityof these tectonostratigraphic units are based on geophysical studies,combined with limited information from outcrops and from rocksexposed in adjacent terranes.
2.1. The Kheis Province
The Kheis Province is a region characterised by a thin-skinned, east-verging thrust belt comprising Palaeoproterozoic quartz-richmetasedi-ments and probably underlain by granitic rocks (Schlegel, 1988; Stowe,1986). It is bounded to the east along the Black Ridge Thrust (Altermannand Hälbich, 1991; Beukes and Smit, 1987) by the Kaapvaal Craton,which was not strongly deformed after 2.5 Ga. The Kaapvaal Cratonconsists of Archaean granite basement with a cover sequencedominated by Ventersdorp lavas, followed by dolomites, banded iron
24oS
20oE
Nam
ibia
So
uth
Afr
ica
B
ots
wan
a
REHOBOTH
Rehoboth Province
UPINGT
200 km KOOP
Namaqua
Natal
Province
Rehoboth Inlier
KAAPVA
Molopo Fa
Dolomite
Banded Ir
GriqualaSupergr
Intrusive
Koras Group; Volcanic and Intrusive rocks
Mafic Complexes; Tshane, Tsetseng and Xade
Hydrothermally altered magnetite- rich granites ; According to Corner (2008)
Mafic Complexes; According to Meixner (1984)
Quartzite Inliers
REHOBOTH and KHEIS PROVINCE
Granite Su
1870- 1720 Ma
Kimberlite
Gibeon Kimberlite Field
28oS
RIETFONTEIN
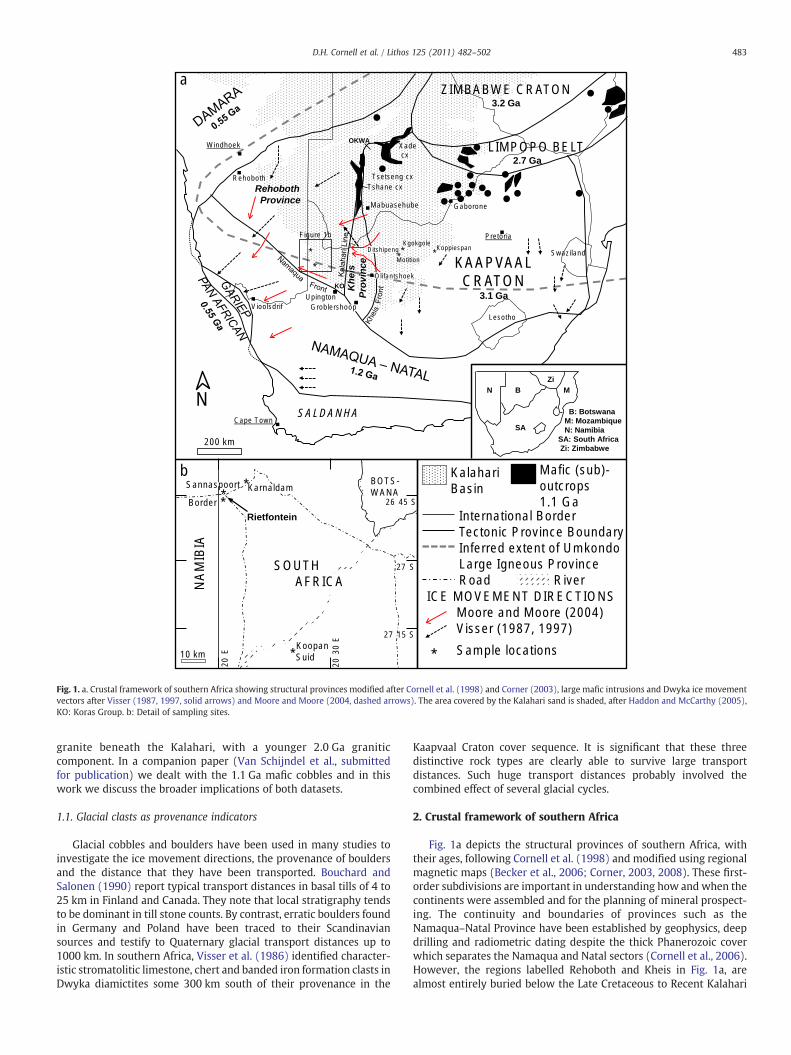
Fig. 2. Map showing the Rehoboth and Kheis provinces in the area marked in Fig. 1, with re2006; Lock and Carney, 1991; Miller, 2008) or interpreted from geomagnetic data (Corner,Moore (2004, solid arrows) and Visser (1987, solid arrows; 1997, dashed arrows) are show1999); BRF: Black Ridge Fault. BF: Blaauwbospan Fault (Stowe, 1986).
formation and jaspilites of the Griqualand West (greater Transvaal)Supergroup. Tinker et al. (2002) published a seismic reflection profile(A–B in Fig. 2) showing that the Kaapvaal supracrustal formations dipwestwards at the craton margin and are thickened by major thrustingtowards the east,which they thoughthappened soon after the extrusionof the 1928 MaHartley Basalt. However, there is some evidence that theKheis Province owes its structural pattern to the MesoproterozoicNamaqua–Natal orogeny. Moen (1999) documented the similarity ofstructural histories where the two provinces adjoin around Groble-rshoop (Fig. 1a). The 1290 MaWilgenhoutsdrif Group forms part of theKheis thrust belt, in which Rb–Sr muscovite that has ages from 1183 to1144 Ma byMoen andArmstrong (2008) shows that the Kheis Provincefabric is likely to correspond to the early Namaqua collisions. This idea issupported by a fewargon and zircondates, notably from theOkwa Inlierto the north (Fig. 1a, Key and Rundle, 1981; Singletary et al., 2003).
Xade cx
Tsetseng cx
Tshane cx 1105±11 Ma
ON
KA
LAH
AR
I LIN
E
K
hei
s
P
rovi
nce
AN SUID
24oE
MOLOPO FARMS CX
2050 Ma
AL CRATON
rm Complex
on Formation
nd West oup
s
Visser (1989,1997)
Moore and Moore (2004)
ICE MOVEMENT DIRECTIONS
DF
OLIFANTSHOEK
International Boundary
Tectonic Province Boundary
GANYESE DOME
A
B
GRANITE SUB-OUTCROP
b-outcrop
1090 Ma
BF
1101±1 Ma
Morokweng Impact Kelso
BR
T
MIDDELPUTS
levant details of basement geology known from outcrop and boreholes (Johnson et al.,2003, 2008; Meixner and Peart, 1984). Dwyka ice transport directions from Moore andn. Line AB indicates a seismic profile by Tinker et al. (2002). DP: Dabep Fault (Moen,

485D.H. Cornell et al. / Lithos 125 (2011) 482–502
HoweverMapeoet al. (2006) reportedprecise zircondates for theoriginof all fourmajor gneiss, granite and rhyolite units of the Okwa complex,with indistinguishable ages at 2056±2 Ma. Van Niekerk (2006)proposes that the Kalahari Line represents an extension of the~1280 Ma volcanic arc-related Areachap Group from the Namaqua–Natal Province into Botswana, based on an aeromagnetic mapinterpretation.
The western boundary of the Kheis Province is the Kalahari Line.Meixner and Peart (1984), described the Kalahari Line as a crustalsuture between the Archaean Kaapvaal Craton and a younger crustalblock to the west. They interpreted the Kalahari Line's magneticsignature in termsof a group ofmafic intrusions, ofwhich theXade andTshane intrusionshave beendrilled anddated at 1.1 Ga, correspondingto the Umkondo Large Igneous Province (Hanson et al., 2006;Pouliquen et al., 2008). However Corner (2008) modelled the KalahariLine as a zone of hydrothermally altered magnetite-rich granites,similar to the Colesburg Lineament on the Kaapvaal Craton (Corner,1998). He shows only three mafic bodies on the Kalahari Line, arguingthat most of the magnetic highs lack the positive gravity anomalies,which large mafic intrusions should show. Brett et al. (2000)confirmed the presence of both types of geophysical anomaly anddocumented the presence of large mafic intrusives, hydrothermallyaltered diorites and magnetic granites along their Kalahari SutureZone. The Kalahari Line seems to extend southwards into fault-boundedexposures of Koras Group bimodal lavas and intrusions, including theBetadamGabbronorite, the 1093±10Ma Rooiputs Granophyre and the1093±11Ma Blauwbosch Granite (Pettersson et al., 2007).
A foreland thrust complex developed in the 1.92 Ga OlifantshoekSequence redbeds west of Olifantshoek (Fig. 1a) was postulated byCornell et al. (1998), based on the work of Stowe (1986), to reflect apost-Bushveld (2.05 Ga) Wilson cycle, which culminated in the Kheiscollisional orogeny and ended by about 1.75 Ga. Several authors suchas Singletary et al. (2003), Jacobs et al. (2008), andMuller et al. (2008)distinguish the Kheis and Rehoboth Provinces or terranes and in thiswork we distinguish the Kheis Province from the Rehoboth Provinceas shown in Fig. 1a. (Note that Moen's (1999) and Moen andArmstrong's (2008) boundary is different, following the Dabep Faultso that his Kheis Province excludes the Olifantshoek Group to the eastand includes part of our Rehoboth Province. Van Niekerk (2006) alsoshows different boundaries for his Kheis Terrane.
2.2. The Rehoboth Province
This is a magnetically quiet region which extends from theKalahari Line to the Damara foreland in the northwest and to theNamaqua–Natal Province in the west. It corresponds to Corner's(2008) Nama Terrane, but the name Rehoboth has historical priority(Hartnady et al., 1985). Reeves (1978) reported surprisingly large'depth to magnetic basement' contours up to 15 km in the sand-covered region in Botswana west of the Kalahari Line, which wereinterpreted by Meixner and Peart (1984) to reflect a thick sedimen-tary sequence overlying oceanic basement. The oldest dated rocksexposed in the Rehoboth Basement Inlier comprise 1.87–1.76 Gamagmatic intrusions (Becker et al., 2004; Van Schijndel et al., 2011,Fig. 2). Samples from the Rehoboth Basement Inlier gave TDM Ndmodel ages from 2.37 to 1.66 Ga, (Ziegler and Stoessel, 1993). Redepletion model ages by Hoal and Heaman (1995) for peridotitexenoliths from the Gibeon kimberlites are 2.2 to 2.0 Ga, suggestingcrustal growth at that time. Detrital zircons aged 2749±42 Ma and2892±27 Ma in a b1750 Ma Billstein Formation quartzite from theRehoboth Basement Inlier (Van Schijndel et al., 2011) show that anArchaean crustal component is present in the Rehoboth Province.
The Rehoboth Province seems to have joined the Kaapvaal andZimbabwe Cratons and Limpopo Belt to form the Kalahari Craton beforeor during the Namaqua–Natal Orogeny, in which exotic terranescollided with, but only deformed the margins of the Proto–Kalahari
Craton (comprising Kaapvaal Craton together with Zimbabwe Craton,Limpopo, Kheis and Rehoboth Provinces) at about 1.2 Ga. (Jacobs et al.,2008). In the Rehoboth Province the 1.37–1.1 Ga Sinclair Sequencevolcanic and plutonic rocks exposed in the Damara Foreland area havebeen interpreted as representing a magmatic arc (Becker et al., 2006;Watters, 1976). This suggests that the Rehoboth Province experiencedan Andean-type crust-forming event at the end of the NamaquaWilsonCycle. The younger parts of the Sinclair Sequence are undeformed incontrast with the high-grade gneisses in the Namaqua–Natal Provinceto thewest, consistentwith the idea that theyoverlie RehobothProvincebasement which was not deformed by the Namaqua orogeny.
2.3. The Kaapvaal Craton
The Kaapvaal Craton is a huge crustal block comprising mainly ofArchaean granites with some greenstone belts. It has been subdividedinto the Kimberley, Witwatersrand, Pietersburg and SwazilandTerranes (Eglington and Armstrong, 2004; Schmitz et al., 2004).These are thought to have been assembled to form the craton beforeextrusion of the Ventersdorp lavas at 2700 Ma. The Kimberley Terraneoccupies the western part of the craton and comprises granites in therange of 3.2 to 2.7 Ga with subordinate greenstone belts such as theAmalia, Stella and Kraaipan belts, whereas the Witwatersrand blockhas components as old as 3.55 Ga in the Barberton GreenstoneTerrane (Johnson et al., 2006). The Kimberley Terrane is commonlyshown as extending to the Kalahari Line, including the Kheis Provincebecause it is thought to overlie Kaapvaal granitic basement. Thus thearea with high diamond prospecting potential includes the KheisProvince. However, a craton should not by most definitions includeareas deformed after the craton formed, so we distinguish the KheisProvince in Figs.1a and 2. The age of the westernmost exposures ofgranite in the Kimberley Terrane is not well documented and in thiswork we investigated five outcrop samples. Sample DC0912 is fromKoppiespan, just south of the Kraaipan Greenstone Belt and the othersare from basement outcrops at Kgokgole and Ditshiping (Table 1 andFig. 1a) in the ~160 km Ganyesa dome (Hunter and Hamilton, 1978,Fig. 2). Diamond drilling and regional gravity and magnetic data haveshown that the Ganyesa dome is centred on a 800 m-thick meteoriteimpact melt sheet dated at ~144 Ma (Andreoli et al., 1999; Reimoldet al., 2002). In view of these finds, including the discovery of asignificant central uplift beneath the Morokweng impact melt sheet,we think that the granites now exposed in the Ganyesa dome wereprobably buried beneath the Transvaal Sequence at the time ofglaciation.
3. Glacial diamictite exposures
At Rietfontein on the western margin of the Kalahari basin (Figs. 1band 2), glacial diamictites of the late Carboniferous to early PermianDwyka Group are exposed in dry river beds, unconformably overlyingthe Cambrian Nama Group siltstones (Fig. 3). The diamictites arematrix-supported, massive to stratified, and contain abundant cobble-sized (64–256 mm) clasts of crystalline bedrock, some of which havestriated and polished surfaces confirming the glacial origin. Fourlocalities were sampled as shown in Fig. 1b, called Border, Sannaspoort,Karnaldam (within a radius of 6 km from Rietfontein) and Koopan Suid(70 km to the south) and listed in Table 1. The cobbleswere taken out ofthematrix (in-situ) at the first two localities, whereas at Karnaldam andKoopan Suid they lay loosely on the diamictite. The Border andSannaspoort exposures are close to the base of the Dwyka Formation,whereas Karnaldam is midway up the Formation (b100 m thick in thisarea, Visser, 1987) and Koopan Suid close to the top, judging from thedistances between the base (Nama Group siltstone) and top (EccaGroup shale) on 1:250 000 SA Geological Survey maps. Structural andtextural observations suggest that the diamictite was deposited in aglaciolacustrine or possibly glaciomarine environment, in which the

Table 1Sample localities, hand specimen descriptions and ages for granitoid cobbles and outcrop samples.
Sample Hand specimen description and grain size Locality Latitude Longitude Age Error In-situ?
Dwyka cobbles from the western border of the Kalahari Basin Deg. Min. Deg. Min. Ma 2σ
DC0505 Pale brown granite, 10 mm Karnaldam 26 43.431 20 4.988 2047 14 NoDC0506 Pink granite, 3–10 mm Karnaldam 26 43.431 20 4.988 2017 15 NoDC0706 Dark brown weathered granite 20 mm, mafic xenoliths Sannaspoort 26 43.239 20 0.637 2797 6 YesDC0710 Pale brown biotite granite–gneiss, fine-10 mm Sannaspoort 26 43.239 20 0.637 2525 20 YesDC0712 Rapakivi granite, 15 mm grains Sannaspoort 26 43.239 20 0.637 2778 10 YesDC0716 Brown banded felsic biotite schist, fine-5 mm Sannaspoort 26 43.239 20 0.637 3079 15 YesDC0722 Pink 2-feldspar granite, 10 mm Karnaldam 26 43.431 20 4.988 2061 14 NoDC0723 Pale brown foliated biotite granite, 10 mm Border 26 45.072 20 0.841 2499 24 YesDC0724 Pale brown weathered biotite granite, 5 mm Border 26 45.072 20 0.841 2623 16 YesDC0727 Migmatite biotite granite gneiss, 3 mm Border 26 45.072 20 0.841 2621 13 YesDC0731 Migmatitic gte gneiss badly weathered Border 26 45.072 20 0.841 2013 10 YesDC0740 Brown granite, 20 mm Koopan S 27 20.399 20 18.79 2889 11 NoDC0743 Biotite granite, weathered, 10 mm Koopan S 27 20.399 20 18.79 2877 11 NoDC0745 Dark brown biotite granite, 5 mm Koopan S 27 20.399 20 18.79 2879 11 NoDC0747 Pale brown quartz feldspar porphyry, fine and 4 mm Koopan S 27 20.399 20 18.79 2661 24 NoDC07101 Gray rapakivi granite, 10 mm Sannaspoort 26 43.242 20 0.637 2912 13 Yes
Western Kaapvaal granites from outcrop Locality Latitude Longitude Age Error
DC0912 Pink foliated granite 5 mm Koppiespan 26 46.185 25 17.05 3061 9 OutcropDC0914 Pink massive granite, 5 mm, weathering orange Motition 26 57.116 23 52.79 2867 7 OutcropDC0915 Gray granodiorite, 2 mm Ditshiping 26 56.62 23 49.88 2882 7 OutcropDC0916 Pink massive granite, 5 mm, intrudes DC0915 Ditshiping 26 56.648 23 49.86 2854 7 OutcropDC0917 Pink massive granite, 4 mm, cut by 20 cm pegmatites Kgokgole 26 43.331 23 56.47 2857 6 Outcrop
486 D.H. Cornell et al. / Lithos 125 (2011) 482–502
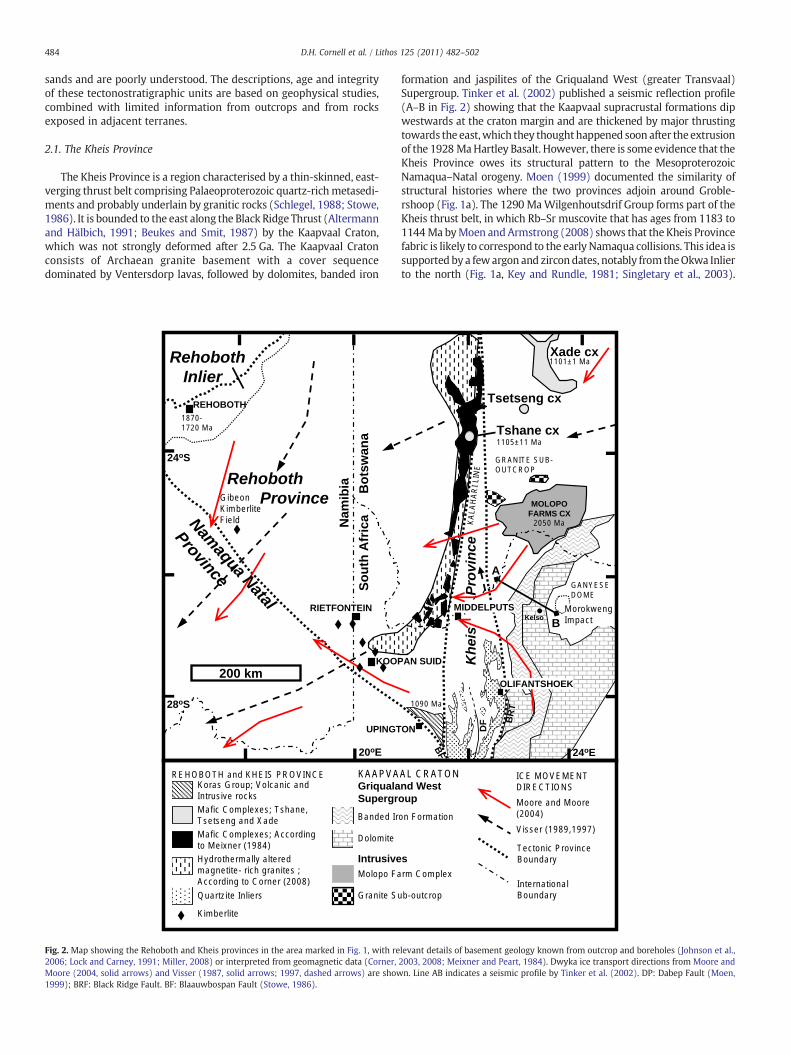
outsized clastsweredeposited fromafloating ice shelf or icebergs. Somelarge clasts were observed to have bent and penetrated the underlyinglaminae, which conformswith the clasts being deposited as dropstones.Lobate beds of massive matrix-supported diamictite, typically a fewdecimetres thick and a meter to few meters in lateral extent, withslightly scoured bases, are interpreted to be plug zone sediments ofcohesive debris flows into subaquaeous environment. At Border andKarnaldam, fluvoglacial beds of cross-bedded conglomerate and coarsesandstone are intercalated in the diamictite (Fig. 4), implying that theice-frontwas close by during their deposition. In the veld away from therivers, the surface is covered with pebbles representing erosion lagdeposits, in which the finer material is transported away leaving theclasts behind (Fig. 5).
Bearing in mind the generally westward transport directions forthe Dwyka ice sheet (Visser, 1997, Figs. 1a, 2) that provided the icerafted clasts from icebergs or an ice shelf, the exposures were
Fig. 3. Dwyka diamictite overlying Nama Group siltstone at Sannaspoort. The visiblepart of the pole is 600 mm long.
investigated and sampled to see if they contained information aboutwhat lies below the Kalahari sands.
4. Sampling and methods
Sample localities are given in Table 1. Cobbles were broken fromthe diamictite matrix and whole rock samples from granite outcropsin the western Kaapvaal Craton by hammer. Pebble counts onfluvoglacial conglomerates at Border and in the Molopo River atBogogobo (near Middelputs, Fig. 2), are given in Table 2 and theresults from Border agree approximately with the rock typeabundances of the larger cobbles.
The mafic and granitic pebbles were investigated separately and inthis work only the granitic pebbles are documented in detail. Themafic pebbles are described in a companion paper by Van Schijndelet al. (submitted for publication).
Fig. 4. Coarse-grained (~10 mm) cross-bedded sandstone forms channel-fills in DwykaGroup diamictites at Border. The book is 150 mm wide.
Fig. 5. Pebble lag surface in the field derived from erosion of Dwyka diamictite.
487D.H. Cornell et al. / Lithos 125 (2011) 482–502
Zircons were extracted from the granitic samples after arepresentative whole rock sample had been collected, by crushingto pass a 400-micron sieve, then washed and manually panned toconcentrate the heavy minerals. Zircon grains were hand-picked andmounted in epoxy pucks for SEM imaging (Raith et al., 2003). Wholerock analyses of most of the samples were made by standard X-rayand ICPMS methods, with results given in supplementary data TableA1.
4.1. U–Pb microbeam dating and oxygen isotope analysis
U–Pb dating was done using the NordSIM Cameca ims1270/80 ionprobe on grains mounted in epoxy pucks, as described byWhitehouseand Kamber (2005), and by laser ablation ICPMS at GEUS, as describedby Frei and Gerdes (2008). The U–Pb analytical data for the Dwykacobbles and for the western Kaapvaal granite outcrop samples aregiven in supplementary data Tables A3 and A4 respectively, withdiscordance calculations following Eglington and Harmer (1999).
Oxygen isotope analyses of zircons were made using the NordSIMion probewith a Cs primary beam andmulticollector on the same type
Table 2Pebble counts in Dwyka glacial material at two localities west of the Kaapvaal Craton.The Bogobo data is by Elin Jansson (2010), supervised by D. Cornell.
Bordernr.Rietfontein
Bogogobonr. Middelputs
Latitude 26°45.072′S 26°40.435′SLongitude 20°00.841′E 21°55.879′EPosition due west of Kaapvaal Craton 280 km 90 kmMafic lava (with feldspar at Border) 3.9 16.2Red sandstone 26.2 0.6Green sandstone 24.1 –
Granite 13.1 –
Dolerite or gabbro 21.4 –
Quartz 5.1 –
Dark hornfels 6.2 –
Banded iron formation (BIF) – 26.3Chert and jasper – 37.4Felsic lava – 12.3Quartz porphyry – 2.8Shale – 1.7Unidentified – 2.8Total 100 100Number of pebbles (N5 mm) 157 179Minimum size of pebbles counted (mm) 5.0 10
of epoxy mounts as for U–Pb dating, as described by Whitehouse andNemchin (2009). The oxygen isotope results are given in Table 3 andthe complete data in supplementary data A5. Some samples gavevalues with a larger spread than expected from the individual errors,assuming that the magmatic zircon of each sample had a single value,reflecting the magma oxygen isotope composition, which is unlikelyto have changed during zircon crystallisation. Mean values werecalculated for each sample using the weighted mean calculation ofISOPLOT v3.0 by Ludwig (2003) and only results with probabilitygreater than 0.15were accepted. The ion probe pits for each data pointwere examined by SEM and outlying points with obvious cracks orinclusions were omitted as SEM rejects, as suggested by Cavosiea et al.(2005). In the remaining data, rejection of one or two outlying pointswas allowed for groups of more than ten data. This is justified by thefact that even the homogeneous and crack-free 91500 standard zircongave some spurious values (see supplementary data A5).
5. Results
5.1. Petrology and geochemistry
In thin section the cobbles are seen to be extensively altered due todiagenesis or weathering, so that modal classification was notpossible. This alteration may be reflected geochemically in somesamples by variations in alkali elements, leading to diverse totalalkali–silica (TAS, supplementary data A2.2) classifications in Table 4such as syenodiorite for DC0710 and DC0745, although most cobblesamples do classify as granites.
Themobility of calciumduringDwykadiagenesis is evidencedby thepresence of ovoid calcite concretions in the diamictite at Sannaspoort.This may have given rise to variable catanorm anorthite contents(Table 4). Normative corundum N2% in three of the granitoids cobblesamples may also reflect alkali element or calcium mobility, whereasfelsic biotite schist DC0716, which is interpreted as a metasediment,consistent with 4% normative corundum. Nevertheless, all but onesample (DC0723, Na-enriched) plot within the igneous spectrum ofHughes (1973, supplementary data A2.1), suggesting that geochemicalalteration is not severe.
The rare earth profiles shown in Fig. 6 were probably not greatlyaffected by alteration, apart from samples DC0723 and DC0745 whichshow small Ce anomalies, reflecting oxidation during near-surfacealteration.
The ab-or-an catanorm-based granite classification of Barker(1979, Table 4 and supplementary data A2.3) identifies five cobblesamples as trondhjemites, which is consistent with their heavy rareearth-depleted rare earth profiles shown in Fig. 6a, and described inTable 4. Trondhjemites usually show heavy rare earth-depletion,which is interpreted to reflect the influence of garnet in the meltingresidue (discussed by e.g. Frost et al., 2006; Van Tonder and Mouri,2010).
Two other genetic groups are apparent from the rare earth profiles.Normal granites in Fig. 6b show regularly decreasing chondrite-normalised levels from La to Lu, but not significantly depleted inheavy rare earths and with less steep slopes compared to thetrondhjemites. Two granites (Fig. 6c) show light rare earth enrich-ment from La to Gd, but flat heavy rare earth profiles. This mightreflect hydrothermal alteration of these rocks or their source.
The west Kaapvaal outcrop samples are thought to be unaltered.They are all granites according to TAS and catanorm classifications,however the REE profiles in Fig. 6d show trondhjemitic, heavy rareearth depleted character for three of them. The other two sampleshave parallel profiles but with about four times higher concentrations,possibly reflecting their origin by crystal fractionation of trondhjemi-tic magmas. Thus the west Kaapvaal samples are all geochemicallyrather similar, whereas the Dwyka cobbles belong to three distinctgenetic types.

Table 3Results of ion microprobe oxygen isotope analyses of zircon in permil relative toVSMOW. The complete data is given in supplementary data A3. The procedure forcalculating weighted mean values for each sample is described in Section 4.1. SEM rej.shave cracks or inclusions, outliers look ok. Data in bold were used to calculate meanvalues.
Comments Grain δ18O ±1σ
DC0505 n3500 Karnaldam cbl. 2047 MaMain gp. 201 7.20 0.41Main gp. 203 7.43 0.49Main gp. 204 6.98 0.43Main gp. 205 7.68 0.45Main gp. 207 7.48 0.43Main gp. 209 7.62 0.47Mean of 6 Prob. 0.88 7.38 0.18
DC0506 Karnaldam cobble 2017 MaOutlier 214 5.34 0.40SEM rej. 348a 5.86 0.33SEM rej. 314b 6.24 0.36Main gp. 329a 6.40 0.31Main gp. 212 6.46 0.42Main gp. 337b 6.47 0.37Main gp. 317a 6.54 0.35Main gp. 314a 6.54 0.29Main gp. 311a 6.56 0.29Main gp. 328a 6.66 0.36Main gp. 306a 6.71 0.29Main gp. 202 6.80 0.40Main gp. 310a 6.80 0.32Main gp. 328b 6.80 0.30Main gp. 332a 6.84 0.31Main gp. 324a 6.92 0.33Main gp. 207 6.94 0.42Main gp. 337a 7.13 0.30Main gp. 317b 7.39 0.36SEM rej. 201 7.87 0.43SEM rej. 320b 7.87 0.53Outlier 320a 8.03 0.30SEM rej. 210 9.24 0.41SEM rej. 318b 9.32 0.32SEM rej. 318a 10.37 0.36Mean (16) Prob. 0.88 6.74 0.09
DC0706 n2875 Sannaspoort cobble 2797 MaOutlier 204 1.83 0.48
212 2.56 0.42219 2.67 0.44201 2.82 0.43210 3.44 0.42207 3.59 0.43
Mean of 5 Prob. 0.31 3.02 0.19
DC0710 n2879 Sannaspoort cbl. 2525 MaOutlier 322a 2.02 0.35SEMrej. 204b 2.68 0.31Outlier 849a 2.85 0.31SEMrej. 838b 3.01 0.34Outlier 216b 3.01 0.34SEMrej. 830a 3.08 0.37SEMrej. 839a 3.18 0.40Outlier 323c 3.26 0.38SEMrej. 305b 3.53 0.31Main gp. 323b 4.03 0.56Main gp. 841a 4.12 0.33Main gp. 305a 4.23 0.32Main gp. 309a 4.26 0.35Main gp. 820a 4.29 0.32Main gp. 323a 4.32 0.31Main gp. 827b 4.37 0.31Main gp. 827a 4.73 0.35Main gp. 209d 4.77 0.32Main gp. 312a 5.07 0.34SEMrej. 838a 5.40 0.32SEMrej. 318a 5.62 0.40SEMrej. 316a 5.74 0.30Outlier 305c 5.91 0.30Outlier 816a 5.93 0.32
Table 3 (continued)
Comments Grain δ18O ±1σ
DC0710 n2879 Sannaspoort cbl. 2525 MaSEMrej. 819a 5.93 0.32SEMrej. 217b 7.06 0.31SEMrej. 827c 7.24 0.34SEMrej. 835a 7.55 0.53Heterogeneous spl. may have main gp.
Main gp.10 Prob. 0.54 4.44 0.1127 of 28 Prob. 0.0 4.49 0.26
DC0712 n2876 Sannaspoort cbl. 2778 Ma203 2.18 0.47213 2.25 0.45303a 2.31 0.33312c 2.33 0.38304a 2.68 0.32203b 2.74 0.44311b 2.86 0.37312b 2.96 0.31312a 2.98 0.34311a 3.13 0.37303b 3.14 0.32213b 3.18 0.44
SEM rej. 309a 4.66 0.33Mean (12) Prob. 0.51 2.76 0.12
DC0716 n3502 Sannaspoort cbl. 3079 MaSEM rej. 213b 3.24 0.29gp. of 5 202 3.55 0.45gp. of 5 208 4.11 0.45gp. of 5 218a 4.13 0.26gp. of 5 213 4.22 0.45gp. of 5 215 4.46 0.41SEM rej. 216a 4.71 0.27SEM rej. 211a 5.13 0.29SEM rej. 202b 5.19 0.28Gp. of 9 204a 5.20 0.27Gp. of 9 219a 5.37 0.29Gp. of 9 212 5.38 0.42Gp. of 9 222a 5.79 0.29Gp. of 9 206a 5.84 0.28Gp. of 9 201a 5.84 0.31Gp. of 9 217a 5.95 0.29Gp. of 9 222b 6.08 0.29Gp. of 9 205a 6.14 0.30SEM rej. 209 6.32 0.42SEM rej. 214a 6.78 0.29Two gp.s distinguished in metasediment
Gp. of 9 Prob. 0.25 5.74 0.20Gp. of 5 Prob. 0.67 4.11 0.17
DC0722 Karnaldam cobble 2061 Ma202 7.69 0.45203 6.13 0.48204 7.31 0.41207 6.72 0.47209 7.24 0.47211 7.31 0.51
Mean of 6 prob. 0.22 7.09 0.19
DC0723 n2880 Border cobble 2499 MaSEM rej. 304a 1.73 0.34Low gp. 207 1.99 0.48SEM rej. 306a 2.08 0.33SEM rej. 315a 2.39 0.36SEM rej. 328c 2.40 0.35low gp. 342b 2.49 0.32SEM rej. 306b 2.50 0.33SEM rej. 342a 3.11 0.39SEM rej. 328a 3.22 0.34Main gp. 218 4.79 0.47Main gp. 201 4.79 0.44Main gp. 203 4.91 0.42Main gp. 213 5.17 0.45Main gp. 328b 5.24 0.33SEM rej. 220 6.26 0.46
488 D.H. Cornell et al. / Lithos 125 (2011) 482–502

Table 3 (continued)
Comments Grain δ18O ±1σ
Heterogeneous sample, poss. main gp.Main gp. 5 Prob. 0.89 5.02 0.19
DC0724 n2883 Border cobble 2623 MaSEM rej. 315a 3.21 0.33Main gp. 322a 4.25 0.33Main gp. 303a 4.74 0.36Main gp. 315b 4.92 0.33Main gp. 304a 4.97 0.34Main gp. 302a 5.07 0.30Main gp. 307a 5.11 0.32Main gp. 337a 5.26 0.42Main gp. 322b 5.72 0.37SEM rej. 336a 6.88 0.32Mean of 8 Prob. 0.19 4.98 0.12
DC0727 n3503 Border cobble 2621 MaMain gp. 204 3.59 0.42Main gp. 206 3.39 0.42Main gp. 208 3.47 0.47Main gp. 210 3.41 0.47Main gp. 211 3.77 0.46Main gp. 212 2.41 0.44Mean of 6 Prob. 0.34 3.33 0.18
DC0731 n2884 Border cobble 2013 MaSEM rej. 211b 1.84 0.27Low gp. 211 2.18 0.42Low gp. 217a 2.34 0.30Low gp. 222a 3.38 0.29Low gp. 213a 3.46 0.30Low gp. 222b 3.90 0.29SEM rej. 201a 4.53 0.28SEM rej. 220a 4.68 0.28SEM rej. 219a 5.01 0.29Main gp. 215b 6.88 0.28Main gp. 215 7.00 0.41Main gp. 210b 7.21 0.34Main gp. 204 7.51 0.53Main gp. 206 7.76 0.42Main gp. 210 7.78 0.43SEM rej. 212a 8.82 0.28Outlier 208 8.84 0.42SEM rej. 208b 9.35 0.28A coherent main gp. and a broad low gp.
Low gp. 6 Prob. 0.0 3.16 0.45Main gp. 6 Prob. 0.37 7.25 0.15
DC0740 n2885 Koopan S. cbl. 2889 MaLow gp. 216b 5.00 0.30Low gp. 215 5.30 0.44Low gp. 208a 5.31 0.32Low gp. 201 5.50 0.41Low gp. 204a 5.60 0.36High gp. 7 211 5.97 0.45High gp. 7 219a 6.27 0.28High gp. 7 222a 6.42 0.35High gp. 7 214b 6.59 0.33High gp. 7 210a 6.82 0.42High gp. 7 202 6.90 0.46High gp. 7 202b 6.91 0.33SEM rej. 214 7.25 0.43SEM rej. 213 7.50 0.46SEM rej. 216a 7.57 0.33SEM rej. 217a 7.70 0.35Inhomogeneous sample with two possible gps.
Low gp. 5 Prob. 0.76 5.31 0.16High gp. 7 Prob. 0.54 6.54 0.14
DC0743 n2881 Koopan S. cbl. 2877 MaOutlier 204 4.17 0.35Outlier 203b 4.19 0.34Gp. of 11 323a 4.41 0.30Gp. of 11 315a 4.66 0.32Gp. of 11 319b 5.03 0.36Gp. of 11 201 5.06 0.31Gp. of 11 308b 5.10 0.33
(continued on next page)
Table 3 (continued)
Comments Grain δ18O ±1σ
DC0743 n2881 Koopan S. cbl. 2877 MaGp. of 11 315b 5.20 0.31Gp. of 11 323b 5.27 0.35Gp. of 11 308a 5.31 0.35Gp. of 11 302a 5.31 0.31Gp. of 11 319a 5.48 0.30Gp. of 11 302b 5.61 0.38SEM rej. 206b 6.53 0.34Mean of 11 Prob. 0.3 5.11 0.10
DC07101 n2886 Sannasprt. cbl. 2912 MaSEM rej. 333a 4.46 0.34SEM rej. 335a 4.54 0.31SEM rej. 311b 4.68 0.31SEM rej. 330a 4.70 0.34SEM rej. 306a 4.76 0.40Gp. of 9 316a 4.86 0.38Gp. of 9 345a 4.95 0.38Gp. of 9 304b 5.27 0.39Gp. of 9 315c 5.40 0.41Gp. of 9 304a 5.47 0.32Gp. of 9 315a 5.61 0.35Gp. of 9 325a 5.64 0.33Gp. of 9 315b 5.90 0.40Gp. of 9 325b 5.92 0.45SEM rej. 311a 6.55 0.38Mean of 9 Prob. 0.50 5.44 0.13
DC0912 n3506 Koppiespan W. Kaapvaal Gte. 3046 MaOutlier 17 2.86 0.85
27 4.80 0.9628 4.65 0.8345 5.17 0.9348 5.32 0.8950 5.42 0.8558 4.61 0.80
Mean of 6 Prob. 0.97 4.98 0.35
DC0914 n3508 Motition W. Kaapvaal Gte. 2868 Ma24a 6.98 0.8824b 6.73 0.9032 6.36 0.8641 6.85 0.8552 7.34 0.91
Mean of 5 Prob. 0.96 6.84 0.39
DC0915 n3510 Ditshiping W. Kaapvaal Gte. 2882 MaSEM rej. 304c 4.00 0.36SEM rej. 342a 4.25 0.32Outlier 342b 5.26 0.28Gp. of 10 327a 5.34 0.36Gp. of 10 323c 5.39 0.34Gp. of 10 339a 5.74 0.36Gp. of 10 342c 6.03 0.37Gp. of 10 328a 6.17 0.36Gp. of 10 329a 6.19 0.33Gp. of 10 304b 6.25 0.35Gp. of 10 344a 6.40 0.32Gp. of 10 323b 6.45 0.44Gp. of 10 323a 6.53 0.40Outlier 304a 6.75 0.32Mean (10) Prob. 0.18 6.03 0.12
DC0916 n3509 Ditshiping W. Kaapvaal Gte. 2856 MaSEM rej. 339b 4.94 0.33
320a 5.29 0.33338a 5.35 0.36312b 5.44 0.34326b 5.54 0.31326a 5.56 0.29314a 5.63 0.30302a 5.69 0.30312c 5.71 0.31320b 5.73 0.35326c 5.88 0.31334a 5.92 0.31
(continued on next page)
489D.H. Cornell et al. / Lithos 125 (2011) 482–502

Table 3 (continued)
Comments Grain δ18O ±1σ
335a 5.93 0.30312a 6.05 0.44
SEM rej. 323a 6.08 0.34339a 6.11 0.35
SEM rej. 338b 6.81 0.33Mean (15) Prob. 0.87 5.72 0.09
DC0917 n3507 Kgokgole W Kaapvaal Gte. 2830 Ma318a 5.59 0.37329a 5.65 0.33321a 5.91 0.35323a 5.96 0.34326b 6.19 0.31326a 6.49 0.35
Mean of 6 Prob. 0.44 5.97 0.14
DC0916 n3509 Ditshiping W. Kaapvaal Gte. 2856 Ma
490 D.H. Cornell et al. / Lithos 125 (2011) 482–502
5.2. Age calculations
Sixteen of the granitic cobbles and five Kaapvaal outcrop graniteswere dated, with regression results using ISOPLOT v3.0 by Ludwig(2003) given in Table 5 and concordia diagrams in Fig. 7. Many of thezircon data were discordant due to complex lead-loss histories andmost datasets had to be culled as documented in Fig. 7 and Table 5.Concordia calculations were preferred where feasible (for fivesamples), because they do not involve any of the assumptions madewhen proposing lead loss models. Discordia regressions generally
Table 4Catanormmineral compositions and rock classifications. Catanormswere calculated from theTAS diagram and Barker (1979) catanorm AnAbOr classification diagram are given in supp
Dwyka cobbles TAS Class
Q C Or Plag Ab An Hy Hm Il Tn Ru Ap Cox et al.(1979)
DC0505 32.6 1.4 28.9 36.3 35.2 1.1 0.5 0.0 0.0 0.0 0.1 0.3 GraniteDC0506 35.2 1.8 32.0 29.7 29.2 0.5 0.8 0.0 0.0 0.0 0.1 0.4 GraniteDC0706 27.5 0.6 30.1 37.6 28.4 9.3 3.2 0.0 0.1 0.0 0.5 0.4 Granite
DC0710 15.4 3.1 31.6 42.9 38.1 4.7 5.3 0.0 0.2 0.0 0.8 0.9 Syenodio
DC0712 32.6 0.0 35.2 31.2 28.1 3.2 0.6 0.0 0.1 0.2 0.1 0.1 Granite
DC0716 35.3 4.4 11.4 38.5 32.2 6.4 10.0 0.0 0.0 0.0 0.3 0.0 Quartz diDC0722 31.0 0.2 36.2 31.6 26.9 4.7 0.6 0.0 0.1 0.0 0.2 0.2 Granite
DC0723 37.1 1.2 5.6 54.7 40.8 13.9 1.3 0.0 0.0 0.0 0.1 0.0 Granite
DC0724 29.3 1.1 20.9 45.9 39.0 6.9 1.5 1.0 0.0 0.2 0.0 0.0 GraniteDC0727 31.1 1.9 13.3 51.4 43.3 8.2 1.7 0.0 0.1 0.0 0.2 0.4 Granite
DC0731 30.1 1.0 31.9 35.1 28.9 6.2 1.1 0.0 0.1 0.0 0.3 0.5 GraniteDC0740 27.8 1.8 20.7 47.0 43.0 4.0 1.3 0.9 0.0 0.3 0.0 0.1 GraniteDC0743 24.7 1.8 18.4 51.6 45.1 6.5 2.5 0.0 0.1 0.0 0.2 0.7 GraniteDC0745 14.9 0.0 18.5 56.9 40.8 16.1 4.8 0.0 0.4 1.3 1.7 1.5 Syenodio
DC0747 34.7 2.5 15.6 45.0 37.0 8.0 1.9 0.0 0.0 0.0 0.2 0.0 GraniteDC07101 24.8 3.1 10.2 55.6 46.7 8.9 4.9 0.0 0.1 0.0 0.5 0.8 Quartz di
Western Kaapvaal Granites from outcropDC0912 30.0 0.9 24.7 42.6 38.9 3.6 0.7 0.8 0.0 0.0 0.1 0.3 Granite
DC0914 28.1 1.0 30.3 38.3 34.2 4.1 0.9 1.0 0.0 0.0 0.1 0.3 GraniteDC0915 32.3 0.9 25.2 40.3 36.8 3.5 0.5 0.6 0.0 0.0 0.1 0.1 Granite
DC0916 30.6 1.2 26.5 39.4 35.5 3.9 0.8 1.0 0.0 0.0 0.1 0.3 Granite
DC0917 28.6 1.1 19.9 47.4 41.5 5.9 1.3 1.2 0.0 0.0 0.2 0.3 Granite
have large lower intercept errors and only about half of the samplesconform to the recent lead loss model within error. The lowerintercepts for seven of the cobble samples overlap the 302 Ma age ofthe Dwyka Group (Bangert et al., 2000), reflecting ancient lead lossduring or after the glaciation and in such cases weighted mean Pb–Pbages on discordant samples are only minimum ages. Each sample thushas its own Pb-loss history due to different responses to glaciation,diagenetic and weathering events. Felsic biotite schist cobble sampleDC0716 was interpreted as a metasediment because of its modalbanding, with alternating felsic and biotite-rich bands. Half of thedata conformed to a 3079±15 Ma discordia line which is inter-preted as the age of the main provenance and all but three of theother grains were older, up to 3320 Ma, reflecting a mixedArchaean provenance. Some cobble samples like DC0723 are highlydiscordant but can nevertheless be interpreted: a group of datapoints with consistent Pb–Pb ages scatters about a discordia linesuggesting a lead-loss model with intercepts at 2499±24 and 77±38 Ma. The lower intercept is not far from Recent and is probablyrelated to weathering and groundwater movement in the near-surface environment. The two oldest points give a weighted meanminimum Pb–Pb age of 2484±9 Ma, within error of the discordiaupper intercept age. All the other points plot between the discordialine and concordia, consistent with ancient lead loss at differenttimes varying from 800 to 300 Ma. Thus we conclude that the upperintercept age probably reflects the Archaean magmatic origin of thesample.
The west Kaapvaal granite outcrop samples generally gave gooddiscordia regressions with Archaean upper intercept ages (Fig. 7t–v,
whole rock analyses in Table A1, using the GCDkit package of Janoušek et al. (2006). Thelementary A2.2 and A2.3.
Catanormclass
Classification according to rare earth element profile (Fig. 6)
Barker (1979)
Granite No dataGranite No dataQuartzMonzonite
Granite with light REE enrichment but flat heavy REE profileand -ve Eu anomaly
rite Granite Granite with consistent light vs heavy REE enrichment andminor+ve Eu anomaly
Granite Granite with light REE enrichment but flat heavy REE profileand -ve Eu anomaly
orite Trondhjemite Granitic and Trondhjemitic (metasediment).Granite Granite with consistent light vs heavy REE enrichment and
-ve Eu anomalyTrondhjemite Trondhjemite with low heavy REE and+ve Eu and -ve Ce
anomaliesGranite No dataTrondhjemite Granite with consistent light vs heavy REE enrichment and
small -ve Eu anomalyGranite No dataGranite No dataTrondhjemite No data
rite Granodiorite Granite with consistent light vs heavy REE enrichment butsmall positive Ce anomaly
Trondhjemite Trondhjemite with low heavy REE and small -ve Eu anomalyorite Trondhjemite Trondhjemite with low heavy REE and minor -ve Eu anomaly
Granite Trondhjemite with low, curved heavy REE profile and small-ve Eu anomaly
Granite Trondhjemite with low heavy REE and small -ve Eu anomalyGranite Granite with profile similar to trondhjemite but four times
higher concentrationsGranite Granite with profile similar to trondhjemite but four times
higher concentrationsGranite Trondhjemite with low heavy REE and small -ve Eu anomaly

1
10
100
1000
Sa
mp
le/C
ho
nd
rite
DC0722 DC0710
DC0727 DC0745
Granite cobbles with regular
light-REE enrichment
1
10
100
1000
La Ce Pr Nd Pm Sm Eu Gd Tb Dy Ho Er Tm Yb Lu
La Ce Pr Nd Pm Sm Eu Gd Tb Dy Ho Er Tm Yb Lu La Ce Pr Nd Pm Sm Eu Gd Tb Dy Ho Er Tm Yb Lu
La Ce Pr Nd Pm Sm Eu Gd Tb Dy Ho Er Tm Yb Lu
Sam
ple/
Cho
ndrit
eDC0723
DC0747
DC07101
DC0716
Trondhjemite cobbles
1
10
100
1000
Sa
mp
le/C
ho
nd
rite
DC0712 DC0706
Granite cobbles with flatheavy-REE profiles
1
10
100
1000
Sa
mp
le/C
ho
nd
rite
DC0912 DC0914DC0914 DC0915DC0916 DC0917
West Kaapvaal outcrop
trondhjemites & granites
a b
c d
Fig. 6. Rare earth element profiles for granitoids cobbles and west Kaapvaal granite samples.
491D.H. Cornell et al. / Lithos 125 (2011) 482–502
Table 5). Sample DC0912 from Koppiespan gives 3061±9 Ma, with alower intercept of 1132±220 Ma. Similar lower intercept ages werealso found in granites of the region by Mapeo et al. (2004) and
Reimold et al. (2002) and probably reflect the Namaqua tectogenesis.The 3061±9 Ma age is the oldest reported for the early trondhjemiticbasement of the Kraaipan Greenstone belt, other ages reviewed by
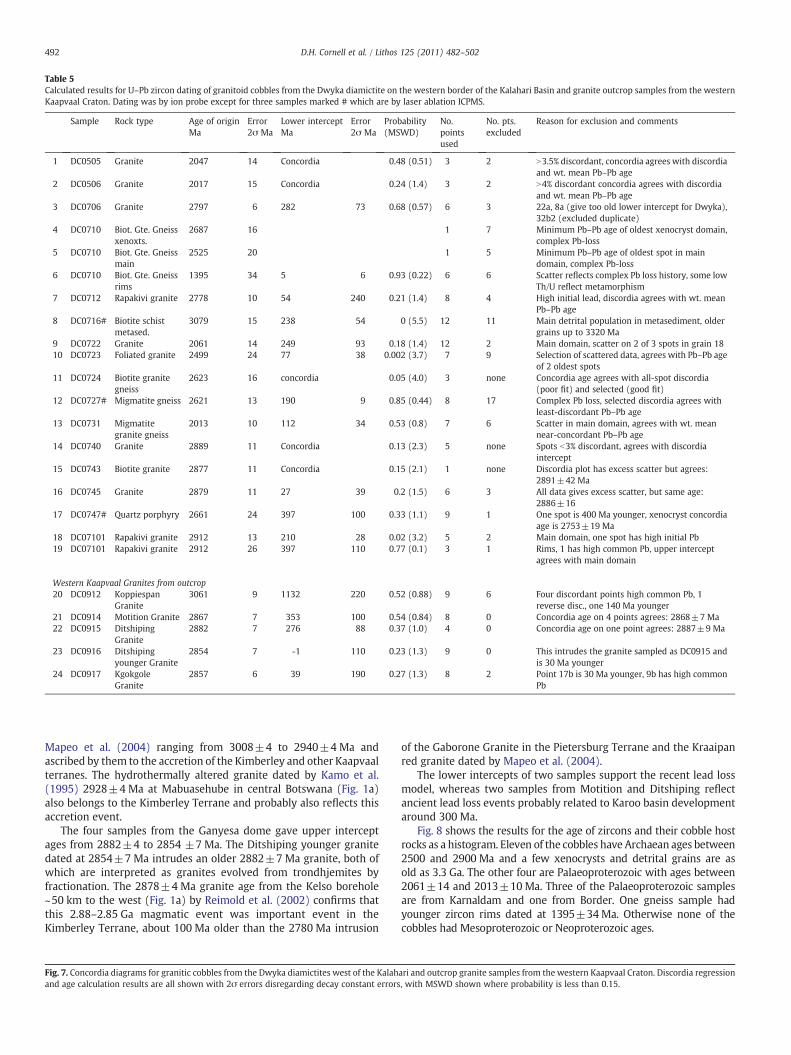
Table 5Calculated results for U–Pb zircon dating of granitoid cobbles from the Dwyka diamictite on the western border of the Kalahari Basin and granite outcrop samples from the westernKaapvaal Craton. Dating was by ion probe except for three samples marked # which are by laser ablation ICPMS.
Sample Rock type Age of originMa
Error2σ Ma
Lower interceptMa
Error2σ Ma
Probability(MSWD)
No.pointsused
No. pts.excluded
Reason for exclusion and comments
1 DC0505 Granite 2047 14 Concordia 0.48 (0.51) 3 2 N3.5% discordant, concordia agrees with discordiaand wt. mean Pb–Pb age
2 DC0506 Granite 2017 15 Concordia 0.24 (1.4) 3 2 N4% discordant concordia agrees with discordiaand wt. mean Pb–Pb age
3 DC0706 Granite 2797 6 282 73 0.68 (0.57) 6 3 22a, 8a (give too old lower intercept for Dwyka),32b2 (excluded duplicate)
4 DC0710 Biot. Gte. Gneissxenoxts.
2687 16 1 7 Minimum Pb–Pb age of oldest xenocryst domain,complex Pb-loss
5 DC0710 Biot. Gte. Gneissmain
2525 20 1 5 Minimum Pb–Pb age of oldest spot in maindomain, complex Pb-loss
6 DC0710 Biot. Gte. Gneissrims
1395 34 5 6 0.93 (0.22) 6 6 Scatter reflects complex Pb loss history, some lowTh/U reflect metamorphism
7 DC0712 Rapakivi granite 2778 10 54 240 0.21 (1.4) 8 4 High initial lead, discordia agrees with wt. meanPb–Pb age
8 DC0716# Biotite schistmetased.
3079 15 238 54 0 (5.5) 12 11 Main detrital population in metasediment, oldergrains up to 3320 Ma
9 DC0722 Granite 2061 14 249 93 0.18 (1.4) 12 2 Main domain, scatter on 2 of 3 spots in grain 1810 DC0723 Foliated granite 2499 24 77 38 0.002 (3.7) 7 9 Selection of scattered data, agrees with Pb–Pb age
of 2 oldest spots11 DC0724 Biotite granite
gneiss2623 16 concordia 0.05 (4.0) 3 none Concordia age agrees with all-spot discordia
(poor fit) and selected (good fit)12 DC0727# Migmatite gneiss 2621 13 190 9 0.85 (0.44) 8 17 Complex Pb loss, selected discordia agrees with
least-discordant Pb–Pb age13 DC0731 Migmatite
granite gneiss2013 10 112 34 0.53 (0.8) 7 6 Scatter in main domain, agrees with wt. mean
near-concordant Pb–Pb age14 DC0740 Granite 2889 11 Concordia 0.13 (2.3) 5 none Spots b3% discordant, agrees with discordia
intercept15 DC0743 Biotite granite 2877 11 Concordia 0.15 (2.1) 1 none Discordia plot has excess scatter but agrees:
2891±42 Ma16 DC0745 Granite 2879 11 27 39 0.2 (1.5) 6 3 All data gives excess scatter, but same age:
2886±1617 DC0747# Quartz porphyry 2661 24 397 100 0.33 (1.1) 9 1 One spot is 400 Ma younger, xenocryst concordia
age is 2753±19 Ma18 DC07101 Rapakivi granite 2912 13 210 28 0.02 (3.2) 5 2 Main domain, one spot has high initial Pb19 DC07101 Rapakivi granite 2912 26 397 110 0.77 (0.1) 3 1 Rims, 1 has high common Pb, upper intercept
agrees with main domain
Western Kaapvaal Granites from outcrop20 DC0912 Koppiespan
Granite3061 9 1132 220 0.52 (0.88) 9 6 Four discordant points high common Pb, 1
reverse disc., one 140 Ma younger21 DC0914 Motition Granite 2867 7 353 100 0.54 (0.84) 8 0 Concordia age on 4 points agrees: 2868±7 Ma22 DC0915 Ditshiping
Granite2882 7 276 88 0.37 (1.0) 4 0 Concordia age on one point agrees: 2887±9 Ma
23 DC0916 Ditshipingyounger Granite
2854 7 -1 110 0.23 (1.3) 9 0 This intrudes the granite sampled as DC0915 andis 30 Ma younger
24 DC0917 KgokgoleGranite
2857 6 39 190 0.27 (1.3) 8 2 Point 17b is 30 Ma younger, 9b has high commonPb
492 D.H. Cornell et al. / Lithos 125 (2011) 482–502
Mapeo et al. (2004) ranging from 3008±4 to 2940±4 Ma andascribed by them to the accretion of the Kimberley and other Kaapvaalterranes. The hydrothermally altered granite dated by Kamo et al.(1995) 2928±4 Ma at Mabuasehube in central Botswana (Fig. 1a)also belongs to the Kimberley Terrane and probably also reflects thisaccretion event.
The four samples from the Ganyesa dome gave upper interceptages from 2882±4 to 2854 ±7 Ma. The Ditshiping younger granitedated at 2854±7 Ma intrudes an older 2882±7 Ma granite, both ofwhich are interpreted as granites evolved from trondhjemites byfractionation. The 2878±4 Ma granite age from the Kelso borehole~50 km to the west (Fig. 1a) by Reimold et al. (2002) confirms thatthis 2.88–2.85 Ga magmatic event was important event in theKimberley Terrane, about 100 Ma older than the 2780 Ma intrusion
Fig. 7. Concordia diagrams for granitic cobbles from the Dwyka diamictites west of the Kalahand age calculation results are all shown with 2σ errors disregarding decay constant errors
of the Gaborone Granite in the Pietersburg Terrane and the Kraaipanred granite dated by Mapeo et al. (2004).
The lower intercepts of two samples support the recent lead lossmodel, whereas two samples from Motition and Ditshiping reflectancient lead loss events probably related to Karoo basin developmentaround 300 Ma.
Fig. 8 shows the results for the age of zircons and their cobble hostrocks as a histogram. Eleven of the cobbles have Archaean ages between2500 and 2900 Ma and a few xenocrysts and detrital grains are asold as 3.3 Ga. The other four are Palaeoproterozoic with ages between2061±14 and 2013±10Ma. Three of the Palaeoproterozoic samplesare from Karnaldam and one from Border. One gneiss sample hadyounger zircon rims dated at 1395±34Ma. Otherwise none of thecobbles had Mesoproterozoic or Neoproterozoic ages.
ari and outcrop granite samples from the western Kaapvaal Craton. Discordia regression, with MSWD shown where probability is less than 0.15.

2200
1800
1400
1000
600
24
10
9
8
29
0.0
0.1
0.2
0.3
0.4
0.5
0.0
0.1
0.2
0.3
0.4
0.50 2 4 6 8 10
0 2 4 6 8 10
207Pb/235U
All 5 pointsintercepts 2041 ± 17 & 197 ± 470 Maprobability 0.94
a DC0505 granite
Concordia Age 3 spots: 2047 ±14 Maprobability 0.48
Wt. Mean Pb-Pb all 52044 ± 13 probability 0.90
3000
2600
2200
1800
1400
1000
32b32a
22b
8c
1c1a
32b2
22a
8a
0.0
0.2
0.4
0.6
207Pb/235U
DC0706 granite
6 points (ellipses), excluding 3 (circles)intercepts 2797 ± 6 & 282 ± 73 Maprobability 0.68
600
1000
1400
2200
2600
0.0
0.1
0.2
0.3
0.4
0.5
0 2 4 6 8 10 12 14
207Pb/235U
xenocryst spots: crossed ellipses, minimum age of oldest: 2687 Ma
main spots: open ellipses minimum age of oldest: 2525 Ma
d DC0710 biotite granite gneissrim points (see figure e)intercepts 1395 ± 34 & 4.7 ± 6.3 Ma
complex
Pb-loss
1300
1100
900
700
500
300
1005b
36b34b
36b1
4b236b2
48b
16b
40b1
4b3
40b2
40b3
0.00
0.04
0.08
0.12
0.16
0.20
0.24
0.0 0.4 0.8 1.2 1.6 2.0 2.4 2.8
207Pb/235U
6 rim points (open ellipses)excl 6 (filled diamonds) intercepts 1395 ± 34 & 4.7 ± 6.3 Ma probability 0.93
DC0710 biot. gte. gneiss rim points
200
600
1000
1400
1800
2200
3a
9a1
9a218a2 25a1
25a2
25a3
51a
52a152a2
52a3
excluded 18a1&3
0.0
0.1
0.2
0.3
0.4
0 2 4 6 8
207Pb/235U
12 of 14 main points (ellipses)excluding two (circles)intercepts 2061 ± 14 & 249 ± 93 Maprobability 0.18
h DC0722 granite2000
50c xenocryst
b2 rim
b1 rim
3000
2600
2200
1800
1400
1000
36b 36a236a32a
31a
6a5a
1a
27c
27a
19c
19a
0.0
0.2
0.4
0.6
0 4 8 12 16 20 24
0 4 8 12 16 20 24
207Pb/235U
3 points with high common Pb
DC0712 rapakivi granite
wt. mean Pb-Pb 8 points 2776 ± 3 probability 0.28
8 points (ellipses) excluding four (circles)intercepts 2778 ± 10 & 54 ± 240 Ma probability 0.21
3400
3000
2600
2200
1800
1400
1000
81
80
79
78
70
69
6564
59
48
44
43
82b76b
76a
74
75b
75a
72
62 60
58
0.0
0.2
0.4
0.6
0.8
0 4 8 12 16 20 24 28
207Pb/235U
12 points in main detrital grain population (ellipses)excluding 11 points (filled squares, 52 reverse discordant, not shown)intercepts 3079 ± 15 & 238 ± 54
DC0716 felsic biotite schist, metasediment
older grains up to 3320 Ma
ancient Pb-loss, thus discordant Pb-Pb ages are invalid
2200
1800
1400
1000
600
17
15
13
9
14
207Pb/235U
b DC0506 granite
All 5 points, intercepts 2029 ± 34 Ma& 57 ± 170 Ma, MSWD 5.9, probabilty 0.001
Concordia Age 3 points 2017 ±15 Ma probability 0.24
Wt. mean Pb-Pb all 5 points2026 ± 16 Ma, probabilty 0.20
206 P
b/23
8 U20
6 Pb
/238 U
206 P
b/23
8 U20
6 Pb
/238 U
206 P
b/23
8 U20
6 Pb
/238 U
206 P
b/23
8 U20
6 Pb
/238 U
c
e
f
g
493D.H. Cornell et al. / Lithos 125 (2011) 482–502

494 D.H. Cornell et al. / Lithos 125 (2011) 482–502
5.3. Oxygen isotope analyses
Oxygen isotope analyses of magmatic zircons have been shown tofaithfully reflect the isotopic composition of the magmas from whichthey crystallised and they are much less prone to post-magmaticalteration than most other minerals (Valley, 2003). The zircon oxygenisotope data for zircons from granitic samples from Table 3 is shown inFig. 9, plotted against the U–Pb age of each sample. For two sampleswhich show a large spread of data, the results for probable maingroups are shown without error ellipses. The samples plot in threegroups. Three of the four ~2 Ga cobbles cluster with δ18O values from6.7 to 7.4‰ and one is heterogeneous. The five outcrop samples fromthe western Kaapvaal Craton Kimberley Terrane Archaean granitoidsshow a larger range from 5 to 6.8‰. The seven Archaean cobbles withhomogeneous values vary from 2.8 to 5.1‰, three of them remarkablylower than the small range ofmantle zircon (5.3±0.3‰, Cavosiea et al.,2005). Sample DC0716, interpreted as a metasediment, has groupsabove and below the mantle field.
6. Discussion
6.1. Transport distance from the ice-front
One question which arises is whether the cobbles were depositedessentially at the ice-front, or had been transported some distance inicebergs before deposition. We argue that the presence of fluvoglacialsandstone and conglomerate beds in the diamictite at Border andKarnaldam shows that deposition at those localities was close to theice-front. These coarsely cross-bedded layers do not show muchcontinuity and can only have deposited from glacial outflow close tothe ice front. All three granite samples from Karnaldam beingPalaeoproterozoic with a small spread of ages from 2061 to 2017 Ma(Table 1) might suggest a change of provenance up the stratigraphy,however one cobble with similar age of 2013 Ma was also taken fromBorder, suggesting that the provenance did not change much.
6.2. The mafic cobbles
The mafic cobbles were investigated geochemically and dated at1116.4±8.5 Ma in the companion paper by Van Schijndel et al.(submitted for publication). This overlaps with the 1099±9Ma to1112±0.5 MaUmkondo Large Igneous Province, awidespreadmagmaticevent represented by dykes and mafic intrusions on the Kalahari Craton,reviewedbyHanson et al. (2004). The cobbles also overlap in agewith the1090±12Ma upper Koras Group bimodal volcanic rocks and intrusionsin theKaaienTerraneof theNamaqua–Natal Province, datedbyPetterssonet al. (2007). Several mafic intrusions have been identified geophysically(Fig. 2), along the Kalahari Line, including the 1105±11Ma TshaneIntrusion and the 1109±1.3 Ma Xade Complex (reviewed by Hanson etal., 2006), The Koras intrusions exposed along the southern extension ofthe Kalahari Line around Upington include the undated Betadam Gabbroand the 1093±10Ma Rooiputs Granophyre and 1093±11Ma Blauw-bosch Granite (Pettersson et al., 2007). Thus the mafic cobbles mostprobably come from mafic intrusions along the Kalahari Line which arebroadly coevalwith theUmkondo Large Igneous Province (Figs. 1a and8).Surprisingly, the Dwyka cobbles we sampled did not include anygranitoids of Koras age. This allows us to speculate that the maficintrusions sampled by the Dwyka ice sheet intrude are not accompaniedby coeval granites and possibly intrude Archaean granitoids.
6.3. Source of the granitoid cobbles
Assuming transport broadly from the east, the cobbles could havecome from (1) the Kaapvaal Craton, (2) the Kheis Province, (3) theKalahari Line or (4) the Rehoboth Province. These possibilities will beconsidered, after discussion of the oxygen isotope data.
6.3.1. Oxygen isotope dataThe zircon oxygen isotope data was culled as explained in
Section 4.1, to produce a single value for the magmatic domain ofeach sample. The values for three Archaean granitic cobble samplesand one zircon group in a cobble interpreted as a metasediment areremarkably lower than mantle values, unique for Archaean zirconaccording to Valley et al. (2005). Do the sub-mantle values reflectalteration of zircons within the Dwyka Formation? The consistent andmuch higher values shown by three of the four ~2.0 Ga cobbles, whichhave been through the same diagenetic and weathering history in theDwyka Formation, make selective alteration of zircon in the Archaeancobbles seem unlikely. We conclude that although the ArchaeanWestern Kaapvaal outcrop and Dwyka cobble sample groups overlapslightly in age and oxygen isotope data, they cannot be considered asgenetically equivalent.
Oxygen isotope values for magmatic zircon are considered toclosely mimic those of the magma and its source (i.e. protolith),because at magmatic temperatures little fractionation can occur. Thewest Kaapvaal granite outcrop samples can be explained as havingformed by melting of unaltered protoliths derived from the mantlesuch as komatiites, or by melting of protoliths containing somesedimentary material, which usually have higher oxygen isotopevalues. The three Dwyka cobble samples with low values which do notoverlap the mantle range require a more exotic explanation. Onepossibility is that before melting to produce the granites, theirprotoliths had been altered by interaction with low-δ18O originallymeteoric water (possible composition −8 to −10 δ18O) at hightemperature (N300 °C to limit rock-water fractionation to about+10‰, with possible further fractionation of +2 during melting,Bottinga and Javoy, 1975). This is the scenario favoured for theSkye granites which also have anomalously low zircon oxygenisotope values, as discussed by Valley (2003). Samples DC0706 andDC0712 are granites which show flat heavy REE profiles andDC0727 has a profile which flattens out in the heavy REE part,features which may reflect hydrothermal alteration (e.g. Schade andCornell, 1989).
The most extreme case known is in the Dabie–Sulu orogenic belt ofChina, where Tang et al. (2008) reported δ18O values in zircons as low as−10‰. They interpreted this in terms of crystallisation from magmasformed by the melting of previously meteoric-hydrothermally alterednegative δ18O rocks in an active rift setting at about 780 Ma. Such aprocess should have affected the source region of at least three of ourgranitic cobble samples before the granitic magmas actually formed,that is before 2.8 Ga. A speculative setting for such a process is anArchaean subduction or terrane suture zone, in which low-δ18O waterswere rapidly transported down into an environment where high-temperature alteration could occur.
6.3.2. Could the granitoid cobbles come from the Kaapvaal Craton?The Archaean cobbles could have been transported more than
450 km from the granitic basement of the Kaapvaal Craton to the eastof the Kheis Province, assuming that the Ganyese Dome granites didnot crop out before the meteorite impact at 145 Ma (Fig. 2). However,in that case, cobbles derived from the Kaapvaal cover sequence,particularly the distinctive banded iron formations, jaspers anddolomites of the Griqualand West (greater Transvaal) Supergroupshould also be abundant in the diamictites sampled aroundRietfontein, which they are not, as shown in Table 2.
At Bogogobo (near Middelputs, Fig. 2) close to the Kalahari Line,the pebble counts are dominated by chert, jasper and banded ironformation (BIF, 65%), with 16%mafic lava, no granite and only one redsandstone (pebble counts by E. Jansson, 2010). This pebble assem-blage represents mainly the Griquatown BIFs and Ongeluk lavas of theupper Griqualand West Supergroup in the Kaapvaal cover sequence,which presently crop out ~100 km to the east (Fig. 2). Limestones anddolomites, now exposed on the circumference of the Ganyese Dome

1000
1400
1800
2200
2600
3000
16b9b
35a1
69
50
6
95b1
93
35b2
35a2
51b86b
95a95b276b9a 86a
51a74b331b2
31a116a74b2
74b1
23b207Pb/235U
8 points (ellipse & +)excluding 17 (circles)intercepts 2621 ± 13 Ma& 190 ± 9 Ma, probability 0.85
gte. gneisspossible migmatization
2350 Ma?
wt. mean Pb-Pb age of3 least discordant2602 ± 30 probability 0.99
complex
Pb-loss
++
1000
1400
1800
2200
2600
3000
25a29a
31a2
31a3
31a4
31a5
1a
11a
20a
31a
31a6
207Pb/235U
granite gneissConcordia Age 3 points2623 ±16 Maprobability 0.05
6 points (ellipses) excluding five (circles)intercepts: 2613 ± 13 & 580 ± 49 Maprobability 0.15all points give 2611 ± 31, poor fit
3000
2600
2200
1800
1400
100083a
82a
81a4
81a281a1
207Pb/235U
granite
81a3 Concordiaage 2877 ±11 Maprobability 0.15
All 6 points, intercepts 2891 ± 42 & 171 ± 180 MaMSWD 10.2, Probability 0.0omitting points does not improve fit
81a3
3000
2600
2200
1800
1400
1000
2a5
2a4
2a3
2a1
1a5
1a2
1a4
1a3
1a1
207Pb/235U
6 points (ellipses)excluding three (circles)intercepts 2879 ± 11 Ma& 27 ± 39 Ma, probability 0.20
all 9 points intercepts 2878 ± 42 & 146 ± 230 MaMSWD 14, probability 0.0
1000
1400
1800
2200
2600
3000
7a
7b1
7b2
7b3
12a
17a40a
1a1
1a2
10b1
17b
18b
34b1&2
36a
38a243a
207Pb/235U
206 P
b/23
8 U
foliated granite
7 points (ellipses) excluding 10 (circles) intercepts 2499 ± 24 & 77 ±38 Ma MSWD 3.7, probability 0.002
wt. mean Pb-Pb age of 2 oldest spots(valid in view of recent Pb-loss)7b1 & 7b3: 2484 ± 9 Ma probability 0.97
complex
Pb-loss
3000
2600
2200
1800
1400
1000
20a2
19a
18a
15a1- 4
4c
4b
207Pb/235U
206 P
b/23
8 U
8 points excluding one (circle)intercepts 2888 ± 10 & 75 ± 72 Maprobability 0.14
Concordia Age on 5 spots <3% discordant 2889 ±11 Ma probability 0.13
200
600
1000
1400
1800
220024a
24a2
24a3
24a4
36a
43a1
12a
34a
36a2
40a
48a1
48a2
207Pb/235U
206 P
b/23
8 U
11c metami ct core included
7 main points (ellipses)excluding 6 main (circles), and 4 rims (diamonds)intercepts 2013 ± 10 & 112 ± 34 Maprobability 0.53
granite gneiss3000
2600
2200
1800
1400
1000
121a2
121a1100
80a
71b
40b2
40a
38
1a
207Pb/235U
206 P
b/23
8 U
83b
34a xenocryst
9 main points excluding 83b (circle) intercepts 2661 ± 24 & 397 ± 100 Maprobability 0.33
12a xenocrystConcordia Age 2753 ±19 MaMSWD 4.5probability 0.0312b
k DC0727 migmatite
j DC0724 biotite n DC0743 biotite
o DC0745 granite
i DC0723 m DC0740 granite
l DC0731 migmatitic p DC0747 quartz porphyry
0 4 8 12 16 20 0 4 8 12 16 20
0 4 8 12 16 20 0 4 8 12 16 20
0 4 8 12 16 20 0 4 8 12 16 20
0 4 8 12 16 20
0.0
0.1
0.2
0.3
0.4
0.5
0.6
0.0
0.1
0.2
0.3
0.4
0.5
0.6
0.0
0.1
0.2
0.3
0.4
0.5
0.6
0.0
0.1
0.2
0.3
0.4
0.5
0.6
0.0
0.1
0.2
0.3
0.4
0.5
0.6
0.0
0.1
0.2
0.3
0.4
0.0
0.1
0.2
0.3
0.4
0.5
0.6
0.0
0.2
0.4
0.6
0 2 4 6 8
206 P
b/23
8 U20
6 Pb
/238 U
206 P
b/23
8 U20
6 Pb
/238 U
wt. mean Pb-Pb age3 spots 2014 ± 15 probability 0.67
Fig. 7 (continued).
495D.H. Cornell et al. / Lithos 125 (2011) 482–502

3000
2600
2200
1800
1400
1000
207Pb/235U
all 8 points, intercepts 2867 ± 7 Ma& 353 ± 100 Ma probability 0.54
s DC0914 Motition W. Kaapvaal Granite
6 points <2% discordant Concordia Age 2865 ±6 MaProbability 0.25
3000
2600
2200
1800
1400
100061a
50a
37a2
35a2
0.0
0.1
0.2
0.3
0.4
0.5
0.6
0 4 8 12 16 20 0 4 8 12 16 20
0 4 8 12 16 20
207Pb/235U
37a1
35a1
45b
22c xenoxt.
q DC07101 rapakivi granite
9b
22b
25b
4 main points (ellipses) excl. 2 (circles)intercepts 2910 ± 16 & 197 ± 17 Maprobability 0.71
3 rim points (diamonds) excl. 1 (filled)intercepts 2912 ± 26 & 397 ± 110 Maprobability 0.77
3000
2600
2200
1800
1400
1000
0.0
0.2
0.4
0.6
207Pb/235U
206 P
b/23
8 U
206 P
b/23
8 U
all 4 points, intercepts 2882 ± 7 Ma & 276 ± 88 Ma probability 0.3 7
t DC0915 Di tshiping older W. Kaapvaal Granite
Concordia age 18b 2887 ± 9 Maprobability 0.90
1400
1800
2200
2600
3000
0.0
0.2
0.4
0.6
0.0
0.2
0.4
0.6
0 4 8 12 16 20 24
207Pb/235U
9 points (ellipses)intercepts: 3061 ± 9 & 1132 ± 220 MaProbability 0.52
40 31
48
45c
r DC0912 Koppiespan W. Kaapvaal Gte. 45
28
6 excluded (diamonds)4 discordant points with high common Pb
2300
2500
2700
290012a
6a
1a10a
10c
0.25
0.35
0.45
0.55
0.65
0.25
0.35
0.45
0.55
0.65
7 9 11 13 15 17
7 9 11 13 15 17
207Pb/235U
All 9 points, intercepts at 2854 ± 7 & -1 ± 110 Ma
Probability 0.23
Wt. mean Pb-Pb all 9 points: 2854 ± 7 Ma
Probability 0.32
Concordia Age on 2 points, 1a & 10a:
2865 ±11 MaProbability 0.26
u DC0916 Ditshiping younger W. Kaapvaal Granite
2900
2700
2500
2300
207Pb/235U
8 points (ellipses) excluding 2 (diamonds)intercepts: 2857 ± 6 Ma& 39 ± 190 MaProbability 0.27
9b high common Pb
17b
v DC0917 Kgokgole W. Kaapvaal Granite
206 P
b/23
8 U
206 P
b/23
8 U20
6 Pb
/238 U
206 P
b/23
8 U
Fig. 7 (continued).
496 D.H. Cornell et al. / Lithos 125 (2011) 482–502
150 km to the east (Fig. 2) are not found in the pebble assemblageconfirming the suggestion that they were not exposed before theMorokweng meteorite impact 145 Ma ago. The nearest ArchaeanKaapvaal granites likely to have cropped out during Dwyka glaciationlie 300 km east of Bogogobo, and did not make it to the Bogogobooutcrops we investigated. By contrast, at Rietfontein 280 km west ofthe craton, the pebbles are predominantly red and green sandstones(37%), with 25% gabbro and basalt and 13% granite, with no BIF ordolomite (which are known to survive long glacial transport, seeSection 1.1 and Visser, 1986). No banded iron formation, jasper ordolomite clasts were found in-situ in the Dwyka outcrops nearRietfontein and only two iron formation and no jasper or dolomiteclasts were found amongst thousands of cobbles surveyed lying on theadjoining ablation lag surface, accumulated as the diamictite matrixwas eroded.
The abundant Nama sandstone pebbles and cobbles in thediamictites at Rietfontein were clearly derived locally and it thusseems likely that the granite and mafic cobbles had not beentransported from as far as the craton. The oxygen isotope and agedata shown in Figs. 8 and 9 also show that the granite cobbles did notcome from granites like those we sampled in the western KaapvaalCraton.
All eight mafic cobbles from Rietfontein Dwyka investigated byVan Schijndel et al. (submitted for publication) are geochemicallysimilar and thus probably belong to a single magmatic suite about1116 Ma old. If the cobbles were derived from the Kaapvaal Craton wewould expect to find mafic cobbles derived from the ~2.7 GaVentersdorp Supergroup, the 2222 Ma Ongeluk Formation or the1920 Ma old Hartley Basalt (Cornell et al., 1996, 1998) which crop outin the western Kaapvaal Craton. We found none.

0
1
2
3
4
0 500 1000 1500 2000 2500 3000 3500 4000
Nu
mb
er o
f ag
es
DC0710rims
Bushveld Complex
Archaean granitoid cobbles
DC0710 xenocryts
Pan- Africanorogenies
Namaqua-Natalorogeny
Kheisorogeny?
U-Pb Age Ma
Umkondo LIP &MAFIC
COBBLES
OldestRehoboth
basement
Kaap- vaal Craton
Zimbabwe Craton
Witwatersrand terrane
W. Kimberley terr. this work
Dwyka glaciation DC0716
detritalgrains
Kimberley terrane
Fig. 8. Histogram showing the distribution of microbeam U–Pb ages for Dwyka granite cobbles and the known ages of some regionally important geological features.
497D.H. Cornell et al. / Lithos 125 (2011) 482–502
Another aspect is that thewestern Kaapvaal craton granites dated inthe literature range in age from 3.20 down to 2.70 Ga, (Schmitz et al.,2004) and the youngest Archaean intrusion events in the KimberleyTerrane are trondhjemites at 2.88–2.85 Ga and granites at 2.78 Ga,whereas four of the thirteen Archaean granitoid cobbles we dated areyounger than 2.7 Ga. After 2.7 Ga Ventersdorp volcanic rocks coveredmost of the Kaapvaal Craton and in the interval between 2.67 and 2.50,during which time four of the dated Dwyka granitoid cobbles wereformed, Transvaal Sequence dolomites and banded iron formationswere being deposited in a quiet shelf environment on the entireKaapvaal Craton. These chemical sediments do contain tuffaceous
Fig. 9. Oxygen isotope data for zircons in granitic cobbles from the Dwyka Formation plottedKimberley Terrane shown for comparison. The error ellipses show 1σ uncertainties for oxygstatistically homogeneous for oxygen isotopes. Mantle-derived zircons plot within the narr
layers, reflecting minor magmatic activity, commonly assumed to bewest of the known craton, e.g. Altermann and Nelson (1998) and Knolland Beukes (2009) who identify volcanic episodes at 2.64, 2.59–2.50and 2.43 Ga.
The four Palaeoproterozoic cobbles we dated overlap in age withthe 2.05 Ga granites of the Bushveld Complex, and could possibly havecome from similar rocks associated with the 2044±24 Ma MolopoFarms Complex (Fig. 2), a sub-outcropping mafic intrusion regardedas a Bushveld extension, (Coetzee and Kruger, 1989) howeverassociated large granite plutons of the same age have not yet beendescribed. We conclude that the granite cobbles in the Dwyka at
against U–Pb age, with five outcrop granite samples from the Kaapvaal Craton westernen isotopes and 2σ uncertainties for ages. Samples shown without error bars were notow limits shown.

498 D.H. Cornell et al. / Lithos 125 (2011) 482–502
Rietfontein are very unlikely to have originated from as far east as theKaapvaal Craton. Bearing in mind that the cobbles are interpreted asbeing deposited from floating ice, we cannot completely exclude anorigin from further afield such as the Zimbabwe or Congo Cratons.However we think that this is unlikely in view of the large transportdistances required.
6.3.3. Did the cobbles originate from the Kheis Province?The N2.7 Ga granite cobbles might have originated from tectonic
slices of Kaapvaal basement in the Kheis Province thrust complex westof the craton, east of the Kalahari Line. It is generally accepted fromgeophysical evidence that the Kaapvaal basement extends to theKalahari Line and several workers include the Kheis Province in theKaapvaal Craton. However the Kheis Province is a Proterozoic thrustcomplex which cannot be a true part of the Archaean Kaapvaal Cratonbecause of the severe post-craton deformation. The seismic sectionshown asA–B in Fig. 2 described by Tinker et al. (2002) shows the entireKaapvaal supracrustal stratigraphy dipping westwards into the KheisProvince. Thus it seems likely that thrusts which exposed Kaapvaalbasement granites would also expose the Transvaal Group ironformations, jaspers and dolomites as well as Ongeluk and HartleyFormation mafic lavas. Metamorphic rocks should also be exposed inthrusts, for example mafic greenschists, because Rb–Srmuscovite datesaround 1170 reported by Moen and Armstrong (2008) for the KheisProvince quartzites reflect at least greenschist facies metamorphicconditions. None of these rock types were found in the cobbles fromRietfontein. Theonly evidenceof a Proterozoicmetamorphic event is the1395±34Madate for zircon rims in cobble sampleDC0710,whichdoesnot correspond to any known or envisaged event.
Thus we conclude that the granite cobbles probably did not comefrom as far east as the Kheis Province. A possible source for thePalaeoproterozoic cobbles is the 2056±2 Ma Okwa Inlier (Mapeo etal., 2006; Fig. 1a) which may lie in the northern extension of the KheisProvince, however this requires a transport distance of 550 km.
6.3.4. Did the cobbles originate in the Kalahari Line?The Kalahari Line does seem to reflect a major crustal discontinuity
or suture as postulated by Meixner and Peart (1984), because of theabrupt change in magnetic and outcrop fabric across it. South of theKalahari sand cover, the Kalahari Line is manifested as a number ofnorth-trending faults, between which undeformed 1173–1090 MaKoras Group lavas are exposed in preservational grabens, andthe extension of the Kalahari Line also represents a significantlithostratigraphic discontinuity in the supracrustal stratigraphy. TheBlaauwbospan Fault,which corresponds to the southernKalahari Line inFig. 2, is thewestern boundary of the thrust sheets of the Kheis Provinceaccording to Stowe (1986). The 1290 MaWilgenhoutsdrif Group formsthe uppermost sheet, thus its deformation and greenschist faciesmetamorphism cannot be older than 1.3 Ga and most likely reflectsthe 1.20 Ga collision of the Namaqua–Natal orogeny (Pettersson et al.,2007).
The extensive magnetic signature of the Kalahari Line seems to bepartly related to a zone of hydrothermally altered granites, assuggested by Corner (2008) and their alteration is probably relatedto the crustal suture. If the suture formed during the Archaean, thenthe hydrothermal alteration scenario envisaged to explain the cobbleoxygen isotope data could speculatively be related to the Archaeansubduction zone. Thus some of the Rietfontein Dwyka granitic cobblescould come from the Kalahari Line, although a broad area would seemmore likely than an essentially linear source.
The extent of mafic intrusions shown along the line in Fig. 2 afterMeixner and Peart (1984) is probably an exaggeration because ofthe lack of gravity anomalies associated with most magneticanomalies, according to Corner (2008). However, there are somewell-documented 1100 Ma mafic intrusions along the Kalahari Linesuch as the Tshane Complex, the hydrothermally altered Mabua
Diorite (Brett et al., 2000) and the Betadam gabbronorite which cropsout north of Upington. The Rietfontein Dwykamafic cobbles representmainly intrusive rocks with minor basalts, they are undeformed andare the same age as the known Kalahari Line mafic intrusions(Van Schijndel et al., submitted for publication). Thus they seem likelyto be derived frommafic intrusions either on the Kalahari Line or westof it in the Rehoboth Province. The granitic cobbles could well have asimilar source region.
6.3.5. Did the cobbles originate in the Rehoboth Province?Much of the Rehoboth Province crust in Namibia seems to have
originated in a prolonged subduction process between about 2.0 and1.7 Ga, according toBecker et al. (2005)andMiller (2008).However, ourmicrobeam U–Pb detrital zircon data for a b1.77 Ga Billstein Formationmetasediment in the Rehoboth Inlier (Van Schijndel et al., submitted forpublication), shows that Archaean components aged 2.75 and 2.90 Ga(concordant zircon) were present in the provenance, supporting ourspeculation based on the cobble data that the PalaeoproterozoicRehoboth crust (represented in that sample by 2.2 to 1.9 detritalzircons) was added to an Archaean core, not exposed at present. TheRehoboth Province was clearly a rigid cratonic block which must havebeen accreted to the Kalahari Craton before or during the NamaquaWilson cycle. Its western and northern boundaries were activecontinental margins which enjoyed subduction-related magmatism ofthe Sinclair Supergroup during the closure of Namaqua Wilson Cycleoceans (reviewed by Miller, 2008; Watters, 1976). The RehobothProvince then withstood collisions from the southwest along theNamaqua Front at about 1.2 Ga, developing a significant deformationfabric only along its margin.
Rietfontein lies in the Rehoboth Province. Below the Dwykadiamictites are the siltstones and sandstones of the Cambrian FishRiver Subgroup, Nama Group and the contact is exposed atSannaspoort (Fig. 3). The Nama siltstones probably thin westwards,exposing the Rehoboth Province basement beneath the Dwykadiamictites, which could well be the source of the granite cobbles.
Zircon xenocrysts in the range of 2.1 to 1.7 Ga found in the 1.17–1.09 Ga Koras bimodal intrusions and volcanic rocks near Upington(Pettersson et al., 2007), show that the south-western corner of theRehoboth Province has a Paleoproterozoic basement. The four 2061 to2013 Ma Dwyka granite cobbles also fit in this age bracket, thus theycould clearly come from Rehoboth Province basement west of theKalahari Line. Could the Archaean granite cobbles also come fromRehoboth Province basement? This seems more likely than theirorigin in the more distant Kaapvaal Craton or Kheis Province, asdiscussed above. The Archaean component in the Rehoboth Provincenow identified in the Rehoboth Inlier strengthens this idea. Howevermore borehole information about the Rehoboth Province basementeast of Rietfontein is needed to test the idea of an Archaeanhydrothermal event and explain the oxygen isotope data. The extreme'depth tomagnetic basement' that contours up to 15 km for the area inBotswana northeast of Rietfontein given by Reeves (1978) suggeststhat the sub-Kalahari basement in western Botswana is a thicksedimentary sequence, possibly equivalent to the Nama Group.However this probably thins southward. Thus the Archaean cobbleswe dated could definitely come from the zone of magnetite-enrichedgranites interpreted from magnetic data by Corner (2003), whichlargely follows the Kalahari Line, but swings westwards into theRehoboth Province at the Botswana border as shown in Fig. 2.
6.3.6. The sandstone cobblesThe red and green sandstone pebbles and cobbles which predom-
inate at Rietfontein probably comemainly from the directly underlyingCambrian Nama Group, reflecting short transport distances for most ofthe cobbles. Similar sandstones also occur in the ~1.8 Ga Brulpan (Moenand Armstrong, 2008) and 1.20 Ga Olifantshoek Groups further to the

KAAPVAAL
RICHTERSVELD
BUSHMANLAND -
GARIEP
C 1300 Ma
TUGELA OCEAN
UMZUMBE ARC
AREACHAPARCKAKAMAS BLOCK
HO
UT
S
REHOBOTH
SINCLAIRARC
DRIF
WIL
GE
N
KAAPVAAL
REHOBOTH
F 1170 Ma
KH
EIS
LOWERKORAS
BURIED TERRANES
NAMAQUA NATAL
KAAPVAAL REHOBOTH
RICHTERSVELD
BUSHMANLAND -
GARIEP
AREACHAP- KAKAMAS
UMZUMBE ARC
MARGATE ARC
D 1220 Ma
KH
EIS
B 2050 -1750 Ma
BUSHVELD MAGMATISMREHOBOTH
MAGMATISM
LIMPOPO METAMORPHISM
ZIMBABWE
OKWAGRANITES
WATERBERG BASINS
OL
IFAN
TSH
OE
K
BASIN
KAAPVAAL
REHOBOTH
BUSHMANLAND -
GARIEP
AREACHAP&KAKAMAS
TUGELA
UMZUMBE
MARGATE
E 1190 Ma
KH
EIS
RICHTERSVELD
ZIMBABWE
A 2500 Ma
REHOBOTHArchaean core?
LIMPOPO
KAAPVAAL CRATON
KIM
BE
RL
EY
TE
RR
AN
E
WITWATERSRAND
TERRANE
ZIMBABWE
PIETERSBURGTERRANE
SWAZILAND
TERRANE
BO
RG
AN
TAR
TIC
A
Fig. 10. Tectonic block diagrams A to F showing one possible sequence of events in the accretion of the Kheis, Rehoboth and Namaqua Provinces to the Kaapvaal Craton (thenattached to the Antarctic Borg Massif) during the Palaeoproterozoic and Mesoproterozoic eras.
499D.H. Cornell et al. / Lithos 125 (2011) 482–502
west. These rock types might prove to be useful markers when theKalahari basement is drilled.
6.4. Tectonic relationship between Rehoboth Province and KaapvaalCraton
We envisage two alternative scenarios which fit the current dataregarding the Archaean to Palaeoproterozoic relationship between theRehoboth Province and Kaapvaal Craton. The first one is that theKaapvaal Craton and an Archaean core of the Rehoboth Provinces werejoined during the late Archaean, about 2500 Ma ago and had a commonhistory from that time. This scenario is shown in tectonic blockdiagramsFig. 10A andB, according towhich theKalahari Line represents
the Archaean suture (with hydrothermal alteration in a subductionzone) betweenWestern Kaapvaal and Rehoboth crust, the latter with along history of Archaean plutonism, starting with trondhjemites from3.3 Ga (oldest detrital grains in DC0716) through 2.9 Ga, then joined bygranites until 2.6 or 2.5 Ga (the least reliable ages). This crustal suturewas then reactivated four times. The regional thermal and magmatic(superplume-related?) events associated with the 2.05 Ga bimodalintrusions of the Bushveld Complex, thermal metamorphism of theLimpopo Belt and entire Kaapvaal Craton (Cornell, 1978) should alsohave given rise to crustal growth in the Rehoboth Province, noting thatBushveld magmatism extended westwards as far as the Molopo FarmsComplex and Okwa Inlier (Fig. 2). Olifantshoek Group redbeds werelater deposited in a basin developed along the Kalahari Line at about

500 D.H. Cornell et al. / Lithos 125 (2011) 482–502
1.9 Ga, with the Rehoboth crustal surface at a lower elevation. At thesame time the Waterberg redbeds formed north of the BushveldComplex (Fig. 10B). Later, during the Namaqua–Natal Wilson Cycle, amajor ocean developed south of the assembled blocks (Fig. 10C). TheKalahari Line rifted to form a restricted Red Sea-like basin at about1300 Ma (Fig. 10C), inwhich theWilgenhoutsdrif Groupwas deposited.At the same time the Tugela and Areachap oceans began to close, withthe developmentof oceanic arcs to the south. TheWilgenhoutsdrif Basinclosed at 1200 Ma, forming the Kheis thrust complex, thrustingWilgenhoutsdrif, Brulpan and Olifantshoek metasediments onto theCraton. This was a response to the Namaqua collisions to the southduring which the arc terranes were accreted, sandwiched betweenthe Archaean Kaapvaal–Rehoboth block and the PalaeoproterozoicBushmanland, Richtersveld and Kakamas Terranes. (Fig. 10D and E, seeNamaqua–Natal review by Cornell et al., 2006). After assembly of theNamaqua–Natal terranes by 1190, pull-apart basins or rift valleysformed along the Kalahari Line in response to right-lateral movementsalong the Doornberg Lineament (Jacobs et al., 2008; Van Bever Donker,1991). In these small basins, the lower Koras volcanosedimentarysequencewasdeposited at 1170 Ma (Fig. 10F), and later theupperKorasvolcanic sequence and coevalUmkondomafic intrusions originating in asuperplume event from 1110 to 1090Ma (Fig. 11).
The second scenario is that the Rehoboth Province developed as astable crustal block with Archaean core far from the Kaapvaal Cratonuntil they joined during the Namaqua Wilson cycle. In this model(requiring modifications to Fig. 10A to C), the Areachap and Kakamasterranes were probably accreted onto the (present-day) south-westernmargin of the Rehoboth Province at an early stage of the 1200 Macollision. This was followed by an oblique collision of the RehobothProvincewith the Kaapvaal Cratonwith the suture corresponding to theKalahari Line, and joining the sequence of events described above fromFig. 10D. In thismodel the Kheis thrust sheets developed at ~1220Ma inthe sediments of the Kaapvaal Craton's passive continental margin. Wemarginally prefer the first scenario, because detrital zircons in theWilgenhoutsdrif Group correspond to a Kaapvaal Craton Provenance(Pettersson et al., 2007), suggesting that it formed in a restricted basinrather than a large ocean basin. These scenarios for tectonic evolutionare similar to, but differ in several details from that proposed by VanNiekerk (2006).
6.5. Further geological and economic implications
Theprobable occurrenceofArchaeangranitic crust alongandwest ofthe Kalahari Line implies that a large area of the Rehoboth Province
Fig. 11. Tectonic assembly of southern Africa during the formation of the UmkondoLarge Igneous Province at 1100 Ma. The Kalahari Line, an ancient zone of weakness, isreactivated due to transpressional strike-slip faulting in the Namaqua Front.
beneath the Kalahari sands could contain diamondiferous kimberlites. Itis also possible that Archaean basement extends into Namibia, wherehitherto only Proterozoic basement has been known. Muller et al.(2008) reviewed the diamond prospectivity of the Rehoboth Province(his Terrane) from several viewpoints. The mantle geotherm deter-mined from xenoliths at Gibeon is hotter than that of Kimberley on theKaapvaal Craton. Lower electrical resisitivities and shearwave velocitiesin the mantle beneath the Rehoboth and Kheis Provinces also suggesthotter, thinner mantle lithosphere than the Kaapvaal Craton, implyingpoor diamond prospectivity. However Appleyard et al. (2007) founda cool, Kaapvaal-like mantle geotherm in orthopyroxene eclogitexenoliths from the Rietfontein kimberlite, which they think originatedat 85–115 km depths in the graphite stability field. Xenoliths andxenocrysts from greater depths should thus be diamondiferous.Prospecting in the Rietfontein kimberlite did yield a small number ofdiamonds, although their legitimate origin is questioned by Gurney(1984).
Another aspect is the discovery of four granite cobbles close in ageto the 2050 Ma Bushveld Complex of the Kaapvaal Craton, whichcomprises both granite and mafic intrusions, and is coeval with theunexposed mafic Molopo Farms Complex (Fig. 2). This suggests thepossibility that the granite intrusions might be accompanied byBushveld-like layered mafic intrusions with similar mineral deposits(Cr, V, Ti, Platinum Group). Several other possible mineral depositscould be related to the Kalahari Line, according to Brett et al. (2010).These possibilities should be tested by drilling with geophysicalcontrol.
7. Conclusions
7.1 Dwyka diamictites which crop out around Rietfontein andKoopan Suid, west of the Kalahari Desert sands contain cobbleseroded and transported from the sub-Kalahari bedrock by thePermocarboniferous Dwyka ice sheet.
7.2 Geochemistry and zircon dating of sixteen granitoid cobblesreveal the presence of only two bedrock granite age groupsunder the Kalahari, an Archaean group comprising trondhje-mites and granites with ages 2500 to 3100 Ma and aPalaeoproterozoic granite group with ages between 2050 and2020 Ma.
7.3 The mafic cobbles (described in a companion paper by VanSchijndel et al., submitted for publication) are geochemicallycoherent and are dated at 1116.4±8.5 Ma. They probably allcome from intrusions related to the Umkondo Large IgneousProvince, either along the Kalahari Line or in the RehobothProvince west of the Line. The lack of Kaapvaal-derived maficcobbles supports a short transport distance for the graniticcobbles.
7.4 The granitoid cobbles contain no evidence to support previoustheories of crustal growth or orogeny in the region at either1800 or 1200 Ma.
7.5 The Archaean and Palaeoproterozoic granite cobbles areunlikely to have come from the Kaapvaal Craton or KheisProvince in view of the lack of characteristic Kaapvaalsupracrustal rock types in the cobble suite, the younger agesof some cobbles (2.7–2.5 Ga) compared to the known 3.0 to2.7 Ga age limits of western Kaapvaal basement and theanomalously low oxygen isotope ratios found in some of thecobbles, which are not matched by our data for the western-most Kaapvaal granite outcrops. Bearing in mind that thecobbles are interpreted as being deposited from floating ice, wecannot exclude an origin from further afield such as theZimbabwe or Congo Cratons. However we think that this isunlikely.
7.6 The granitic cobbles weremost likely derived from the RehobothProvince basement directly east of Rietfontein. Some of them

501D.H. Cornell et al. / Lithos 125 (2011) 482–502
could also come from the Kalahari Line, which might be anArchaean crustal suture, thus providing an explanation for thelow δ18O isotope data.
7.7 The possibility that the Rehoboth Province has an Archaeanbasement has important implications for mineral explorationand to the crustal evolution of southern Africa.
Supplementarymaterials related to this article can be found onlineat doi:10.1016/j.lithos.2011.03.006.
Acknowledgements
This paper is dedicated to the memory of Gawie Moen, a gentlegiant who contributed greatly to the Kheis Province debate. DHCacknowledges a Swedish National Research Council grant no. 2006–2402. OI received a travel grant from the University of IcelandResearch Fund. The careful reviews by R. Mapeo and W. Altermannimproved the quality of this paper. Martin Whitehouse and theNordSIM team are gratefully acknowledged for their help with ionprobe dating and important contributions regarding the method andquality control of oxygen isotope analysis of zircon. The NordSIMfacility is supported by the research councils in Denmark Norway andSweden and the Geological Survey of Finland, together with theSwedish Museum of Natural History. This is Nordsim contribution no.287 and a contribution to IGCP project 509, PalaeoproterozoicSupercontinents and Global Evolution.
References
Andreoli, M.A.G., Ashwal, L.D., Hart, R.J., Huizenga, J.M., 1999. A Ni- and PGE-enrichedquartz norite impact melt complex in the Late Jurassic Morokweng impact structure,South Africa. in: Dressler, B.O., Sharpton, V.L. (Eds.), Large Meteorite Impacts andPlanetary Evolution II, Geological Society of America. Special Paper 339, 91–108.
Altermann, W., Hälbich, I.W., 1991. Structural history of the southwestern corner of theKaapvaal Craton and the adjacent Namaqua realm: new observations and areappraisal. Precambrian Research 52, 133–166.
Altermann, W., Nelson, D.R., 1998. Sedimentation rates, basin analysis and regionalcorrelation of three Neoarchean sub-basins of the Kaapvaal Craton, as inferred fromprecise U-Pb zircon ages from volcaniclastic sediments. Sedimentary Geology 120,225–256.
Appleyard, C.M., Bell, D.R., le Roex, A.P., 2007. Petrology and geochemistry of eclogitexenoliths from the Rietfontein kimberlite, Northern Cape, South Africa. Contribu-tions to Mineralogy and Petrology 154, 309–333.
Bangert, B., Stollhofen, H., Geiger, M., Lorenz, V., 2000. Fossil record and high-resolutiontephrostratigraphy of Carboniferous glaciomarine mudstones, Dwyka Group,southern Namibia. Communications, Geological Survey Namibia 12, 235–245.
Barker, F., 1979. Trondhjemite: Definition, environment and hypothesis of origin. In:Barker, F. (Ed.), Trondhjemites, Dacites and Related Rocks. Elsevier, Amsterdam,pp. 1–12.
Becker, T., Wiegand, B., Hansen, B.T., Weber, K., 2004. Sm–Nd, Rb–Sr and U–Pb datafrom the Rehoboth basement inlier, Namibia: evidence of a Palaeoproterozoicmagmatic arc. Communications, Geological Survey of Namibia 13, 75–84.
Becker, T., Garoeb, H., Ledru, P., Milesi, J.P., 2005. The Mesoproterozoic event within theRehoboth basement inlier of Namibia; review and new aspects of stratigraphy,geochemistry, structure and plate tectonic setting. South African Journal of Geology108, 465–492.
Becker, T., Schreiber, U., Kampunzu, A.B., Armstrong, R.A., 2006. Mesoproterozoic rocksof Namibia and their plate tectonic setting. Journal of African Earth Sciences 46,112–140.
Beukes, N.J., Smit, C.A., 1987. New evidence for thrust faulting in Griqualand West,South Africa; implications for stratigraphy and the age of red beds. South AfricanJournal of Geology 90, 378–394.
Bouchard, M.A., Salonen, V.-P., 1990. Boulder Transport in Shield Areas. In: Kujansuu, R.,Saarnisto, M. (Eds.), Glacial indicator tracing. Balkema, Rotterdam, pp. 87–108.
Bottinga, Y., Javoy, M., 1975. Oxygen isotope partitioning among the minerals inigneous and metamorphic rocks. Reviews of Geophysics 13, 401–418.
Brett, J.S., Mason, R., Smith, P.H., 2000. Geophysical exploration of the Kalahari SutureZone. Journal of African Earth Sciences 30, 489–497.
Cavosiea, A.J., Valley, J.W., Wilde, S.A., E.I.M.F., 2005. Magmatic δ18O in 4400–3900 Madetrital zircons: a record of the alteration and recycling of crust in the EarlyArchaean. Earth and Planetary Science Letters 235, 663–681.
Coetzee, H., Kruger, F.J., 1989. The geochronology, Sr and Pb isotope geochemistry of theLosberg Complex, and the southern limit of Bushveld Complex magmatism. SouthAfrican Journal of Geology 92, 37–41.
Cornell, D.H., 1978. Petrologic Studies at T'Kuip: evidence for metamorphism andmetasomatic alteration of volcanic formations beneath the Transvaal volcanose-dimentary pile. Transactions Geological Society of South Africa 81, 261–270.
Cornell, D.H., Armstrong, R.A., Walraven, F., 1998. Geochronology of the ProterozoicHartley Basalt Formation, South Africa: constraints on the Kheis tectogenesis andthe Kaapvaal Craton's earliest Wilson cycle. Journal of African Earth Sciences 26,5–27.
Cornell, D.H., Schutte, S.S., Eglington, B.L., 1996. The Ongeluk basaltic andesiteformation in Griqualand West, South Africa: submarine alteration in a 2222 MaProterozoic sea. Precambrian Research 79, 101–123.
Cornell, D.H., Thomas, R.J., Gibson, R., Moen, H.F.G., Moore, J.M., Reid, D.L., 2006.Namaqua–Natal Province. In: Johnson, M.R., Anhauesser, C.R., Thomas, R.J. (Eds.),Geology of South Africa. Geological Society of South Africa and Council forGeoscience, Pretoria, pp. 325–379.
Corner, B., 1998. A geophysical perspective of the Kaapvaal Province. Southern AfricanGeophysical Review 2, 19–28.
Corner, B., 2003. Geophysically derived structural framework of sub-equatorial Africa.8th Biennial Technical Meeting, South African Geophysical Association of SAGA,Pilanesberg, South Africa, Poster.
Corner, B., 2008. The crustal framework of Namibia derived from an integratedinterpretation of geophysical and geological data. In: Miller, R.McG. (Ed.), TheGeology of Namibia, Vol.1, Chapter 2. Geological Survey of Namibia, Windhoek.
Cox, K.G., Bell, J.D., Pankhurst, R.J., 1979. The Interpretation of Igneous Rocks, 1st edn.George Allen and Unwin Ltd., London, ISBN: 0045520151, p. 445.
Eglington, B.M., Harmer, R.E., 1999. GEODATE for Windows, version 1: isotope regressionand modelling software. South African Council for Geoscience Open File Report1999–0206 O. http://sil.usask.ca/software_files/documentation/GEODATE%20for%20Windows.pdf.
Eglington, B.M., Armstrong, R.A., 2004. The Kaapvaal Craton and adjacent orogens,Southern Africa: a Geochronological Database and overview of the geologicaldevelopment of the craton. South African Journal of Geology 107, 13–32.
Frei, D., Gerdes, A., 2008. Precise and accurate in-situ U–Pb dating of zircon with highsample throughput by automated LA-SF-ICP-MS. Chemical Geology 261, 261–270.doi:10.1016/j.chemgeo.2008.07.025.
Frost, C.B., Frost, B.R., Kirkwood, R., Chamberlain, K.R., 2006. The tonalite–trondhjemite–granodiorite to granodiorite–granite transition in the late Archaean plutonic rocks ofthe central Wyoming Province. Canadian Journal of Earth Science 43, 1419–1444.
Gurney, J.J., 1984. A correlation between garnets and diamonds. In: Glover, J.E., Harris, P.G.(Eds.), Kimberlite Occurrence and Origin: A Basis for Conceptual Models inExploration. : GeologyDepartment andUniversity Extension, 8. University ofWesternAustralia Publication, pp. 143–166.
Haddon, I.G., McCarthy, T.S., 2005. TheMesozoic–Cenozoic interior sag basins of CentralAfrica: the Late-Cretaceous–Cenozoic Kalahari and Okavango basins. Journal ofAfrican Earth Sciences 43, 316–333.
Hanson, R.E., Crowley, J.L., Bowring, S.A., Ramezani, J., Gose, W.A., Dalziel, I.W.D.,Pancake, J.A., Seidel, E.K., Blenkinsop, T.G., Mukwakwami, J., 2004. Coeval large-scale magmatism in the Kalahari and Laurentian Cratons during Rodinia assembly.Science 304, 1126–1129.
Hanson, R.E., Harmer, R.E., Blenkinsop, T.G., Bullen, D.S., Dalziel, I.W.D., Gose, W.A., Hall,R.P., Kampunzu, A.B., Key, R.M., Mukwakwami, J., Pancake, J.A., Seidel, E.K., Ward, S.E.,2006.Mesoproterozoic intraplatemagmatism in theKalahari Craton: a review. Journalof African Earth Sciences 46, 141–167.
Hartnady, C.J., Joubert, P., Stowe, C.W., 1985. Proterozoic crustal evolution insouthwestern Africa. Episodes 8, 236–244.
Hoal, B.G., Heaman, L.M., 1995. The Sinclair sequence: U–Pb age constraints fromAwasib Mountain area. Communications, Geological Survey Namibia 10, 83–91.
Hughes, C.J., 1973. Spilites, keratophyres, and the igneous spectrum. GeologicalMagazine 109, 513–527.
Hunter, D., Hamilton, 1978. The Bushveld Complex. In: Tarling, D.H. (Ed.), Evolution ofthe Earth's crust. Academic Press, London, pp. 107–173.
Janoušek, V., Farrow, C.M., Erban, V., 2006. Interpretation of whole-rock geochemicaldata in igneous geochemistry: introducing Geochemical Data Toolkit (GCDkit).Journal of Petrology 47 (6), 1255–1259.
Jansson, E., 2010. What lies under the Kalahari sand?Masters Thesis B598, University ofGothenburg, 54pp., ISSN 1400–3821. http://www.gvc.gu.se/digitalAssets/1322/1322958_b598-klar—kopia.pdf.
Jacobs, J., Pisarevsky, S., Thomas, R.J., Becker, T., 2008. The Kalahari Craton during theassembly and dispersal of Rodinia. Precambrian Research 160, 142–158.
Johnson, M.R., Anhaeusser, C.R., Thomas, R.J. (Eds.), 2006. The Geology of South Africa:Geological Society of South Africa & Council for Geoscience, Pretoria. 691 pp.
Kamo,S.L., Key,R.M.,Daniels, L.R.M., 1995.Newevidence forNeoarchaean,hydrothermallyaltered granites in south–central Botswana. Journal of the Geological Society 152,747–750.
Key, R.M., Rundle, C.C., 1981. The regional significance of new isotopic ages fromPrecambrian windows through the "Kalahari Beds" in north-western Botswana.Transactions Geological Society of South Africa 84, 51–66.
Knoll, A.H., Beukes, N.J., 2009. Introduction: initial investigations of a NeoArchaean shelfmargin-basin transition (Transvaal Supergroup, South Africa). PrecambrianResearch 169, 1–14.
Lock, N.P., Carney, J.N., 1991. A window into basement rocks in southwest Botswana:inferences from borehole chip samples. Botswana Journal of Earth Sciences 1, 23–41.
Ludwig, K.R., 2003. ISOPLOT 3. 0: a geochronological toolkit for Microsoft Excel.Berkeley Geochronology Center Special Publication 4, 1–71.
Mapeo, R.B.M., Armstrong, R.A., Kampunzu, A.B., Ramokate, L.V., 2004. SHRIMP U–Pbzircon ages of granitoids from the Western Domain of the Kaapvaal Craton,Southeastern Botswana: implications for crustal evolution. South African Journal ofGeology 107, 159–172.
Mapeo, R.B.M., Ramokate, L.V., Corfu, F., Davis, D.W., Kampunzu, A.B., 2006. The Okwabasement complex, western Botswana: U–Pb zircon geochronology and

502 D.H. Cornell et al. / Lithos 125 (2011) 482–502
implications for Eburnean processes in southern Africa. Journal of African EarthSciences 46, 253–262.
Meixner, H.M., Peart, R.J., 1984. The Kalahari Drilling Project. Botswana GeologicalSurvey Bulletin. Government Printer, Gaborone, p. 27.
Miller, R.McG. (Ed.), 2008. The Geology of Namibia. Geological Survey of Namibia,Windhoek. 3 volumes.
Moen, H.F.G., 1999. The Kheis Tectonic Subprovince, southern Africa: a lithostrati-graphic perspective. South African Journal of Geology 102, 27–42.
Moen, H.F.G., Armstrong, R.A., 2008. New age constraints on the tectogenesis of theKheis Subprovince and the evolution of the eastern Namaqua Province. SouthAfrican Journal of Geology 111, 79–88.
Moore, J.M., Moore, A.E., 2004. The roles of primary kimberlitic and secondary Dwykaglacial sources in the development of alluvial and marine diamond deposits inSouthern Africa. Journal of African Earth Sciences 38, 115–134.
Muller, M.R., Jones, A.G., Fishwick, S., Hatton, C., Grütter, H., Evans, R.L., Garcia, X.,Miensopust, M.P., Hamilton, M.P., SAMTEX team, 2008. Diamond prospectivity ofthe Rehoboth Terrane, southern Africa, based on integrated geophysical andgeochemical constraints on its Proterozoic lithospheric structure and evolution. 9thInternational Kimberlite Conference Extended Abstract No. 9IKC-A-00363.
Pettersson, Å., Cornell, D.H., Moen, H.F.G., Reddy, S., Evans, D., 2007. Ion-probe dating of1.2 Ga collision and crustal architecture in the Namaqua–Natal Province ofsouthern Africa. Precambrian Research 158, 79–92.
Pouliquen, G., Key, R.M., Walker, A., 2008. The internal structure and geotectonic settingof the Xade and Tsetseng complexes in the western most part of the KaapvaalCraton. South African Journal of Geology 111, 345–356.
Raith, J.G., Cornell, D.H., Frimmel, H.E., de Beer, C.H., 2003. New insights into the geologyof the Namaqua Tectonic Province, South Africa, from ion probe dating of detritaland metamorphic zircon. Journal of Geology 111, 347–366.
Reeves, C.V., 1978. Reconnaissance Aeromagnetic Survey of Botswana 1975–77, FinalInterpretation Report. Botswana Geological Survey, Government Printer,Gaborone.
Reimold, W.A., Armstrong, R.A., Koeberl, C., 2002. A deep drillcore from theMorokwengimpact structure, South Africa: petrography, geochemistry, and constraints on thecrater size. Earth and Planetary Science Letters 201, 221–232.
Schade, J., Cornell, D.H., 1989. Rare earth element and isotopic evidence for thegenesis of the Prieska massive sulfide deposit, South Africa. Economic Geology84, 49–63.
Schlegel, G.C.J., 1988. Contribution to the metamorphic and structural evolution of theKheis Tectonic Province, northern Cape, South Africa. South African Journal ofGeology 91, 27–37.
Schmitz, M.D., Bowring, S.A., de Wit, M.J., Gartz, V., 2004. Subduction and terranecollision stabilize the western Kaapvaal craton tectosphere 2.9 billion years ago.Earth and Planetary Science Letters 222, 363–376.
Singletary, S.J., Hanson, R.E., Martin, M.W., Crowley, J.L., Bowring, S.A., Key, R.M.,Ramokate, L.V., Direng, B.B., Krol, M.A., 2003. Geochronology of basement rocks inthe Kalahari Desert, Botswana, and implications for regional Proterozoic tectonics.Precambrian Research 121, 47–71.
Stowe, C.W., 1986. Synthesis and interpretation of structures along the north-easternboundary of the Namaqua tectonic Province. South Africa: South African Journal ofGeology 89, 185–198.
Tang, J., Zheng, Y.F., Gong, B., Wu, Y.B., Gao, T.S., Yuan, H., Wu, F.Y., 2008. Extremeoxygen isotope signature of meteoric water in magmatic zircon from metagranitein the Sulu orogen, China: implications for Neoproterozoic rift magmatism.Geochimica et Cosmochimica Acta 72, 3139–3169.
Tinker, J., de Wit, M., Grotzinger, J., 2002. Seismic stratigraphic constraints onNeoArchaean— Palaeoproterozoic evolution of the western margin of the KaapvaalCraton, South Africa. South African Journal of Geology 105, 107–134.
Valley, J.W., Lackey, J.S., Cavosie, A.J., Clechenko, C.C., Spicuzza, M.J., Basei, M.A.S.,Bindeman, I.N., Ferreira, V.P., Sial, A.N., King, E.M., Peck, W.H., Sinha, A.K., Wei, C.S.,2005. 4.4 billion years of crustal maturation: oxygen isotope ratios of magmaticzircon. Contributions to Mineralogy and Petrology 150, 561–580.
Valley, J.W., 2003. Oxygen isotopes in zircon. In: Hanchar, J.M., Hoskin, P.W.O. (Eds.),Zircon: Reviews inMineralogy and Geochemistry, volume 53. Mineralogical Societyof America/Geochemical Society, Washington, DC, pp. 343–385.
Van Bever Donker, J., 1991. A synthesis of the structural geology of amajor tectonic boundarybetween a 1000m.y. mobile belt and a 3000m.y. craton. Tectonophysics 196, 359–370.
Van Niekerk, H.S., 2006. The origin of the Kheis Terrane and its relationship with theArchaean Kaapvaal Craton and the Grenvillian Namaqua Province in southernAfrica. PhD Thesis, University of Johannesburg.
Van Schijndel, V., Cornell, D.H., Hoffmann, K.-H., Frei, D., 2011. Three episodes of crustaldevelopment in the Rehoboth Province, Namibia. In: Van Hinsbergen, D.J.J., Buiter,S.J.H., Torsvik, T.H., Gaina, C., Webb, S. (Eds.), The formation and evolution of Africafrom the Archaean to Present. Geological Society Special Publication.
Van Schijndel, V., Cornell, D.H., Karlsson, L., Olsson, J.R. submitted for publication.Baddeleyite geochronology coupled with geochemistry of mafic cobbles from theCarboniferous Dwyka Diamictite reveal the sub-Kalahari basement, South Africa.Submitted to Lithos.
Van Tonder, Mouri, H., 2010. Petrology and geochemistry of the granitoid rocks of theJohannesburg Dome, Central Kaapvaal Craton, South Africa. South African Journal ofGeology 113, 257–286.
Visser, J.N.J., Hall, K.J., Loock, J.C., 1986. The application of stone counts in the glacigenePermo-carboniferous Dwyka Formation, South Africa. Sedimentary Geology 46,197–212.
Visser, J.N.J., 1987. The palaeogeography of part of southwestern Gondwana during thePermo–Carboniferous glaciation. Palaeogeography, Palaeoclimatology, Palaeoecology61, 205–219.
Visser, J.N., 1997. Deglaciation sequences in the Permo–Carboniferous Karoo andKalahari basins of southern Africa: a tool in the analysis of cyclic glaciomarine basinfills. Sedimentology 44, 507–521.
Watters, B.R., 1976. Possible late Precambrian subduction zone in SWA. Nature 259,471–473.
Whitehouse, M.J., Kamber, B.S., 2005. Assigning dates to thin gneissic veins in high-grade metamorphic terranes: a cautionary tale from Akilia, Southwest Greenland.Journal of Petrology 46, 291–318.
Whitehouse, M.J., Nemchin, A.A., 2009. High precision, high accuracy measurement ofoxygen isotopes in a large lunar zircon by SIMS. Chemical Geology 261, 31–41.
Ziegler, U.R.F, Stoessel, F.U., 1993. Age determinations in the Rehoboth Basement Inlier,Namibia. Memoirs, Geological Survey Namibia 14, 106 pp.
Copyright © 2022 FDOKUMEN