Evidence for thermal convection in the deep carbonate aquifer of the eastern sector of the Po Plain,...
12
Evidence for thermal convection in the deep carbonate aquifer of the eastern sector of the Po Plain, Italy V. Pasquale ⁎, P. Chiozzi, M. Verdoya Dipartimento per lo Studio del Territorio e delle sue Risorse, Settore di Geofisica, Università di Genova, Viale Benedetto XV 5, I-16132 Genova, Italy abstract article info Article history: Received 27 January 2012 Received in revised form 28 November 2012 Accepted 5 March 2013 Available online 16 March 2013 Keywords: Thermal regime Heat and mass transfer Thermal convection Rayleigh number Deep carbonate aquifer Permeability Temperatures recorded in wells as deep as 6 km drilled for hydrocarbon prospecting were used together with geological information to depict the thermal regime of the sedimentary sequence of the eastern sector of the Po Plain. After correction for drilling disturbance, temperature data were analyzed through an inver- sion technique based on a laterally constant thermal gradient model. The obtained thermal gradient is quite low within the deep carbonate unit (14 mK m −1 ), while it is larger (53 mK m −1 ) in the overlying im- permeable formations. In the uppermost sedimentary layers, the thermal gradient is close to the regional av- erage (21 mK m −1 ). We argue that such a vertical change cannot be ascribed to thermal conductivity variation within the sedimentary sequence, but to deep groundwater flow. Since the hydrogeological charac- teristics (including litho−stratigraphic sequence and structural setting) hardly permit forced convection, we suggest that thermal convection might occur within the deep carbonate aquifer. The potential of this mech- anism was evaluated by means of the Rayleigh number analysis. It turned out that permeability required for convection to occur must be larger than 3 10 −15 m 2 . The average over-heat ratio is 0.45. The lateral variation of hydrothermal regime was tested by using temperature data representing the aquifer thermal conditions. We found that thermal convection might be more developed and variable at the Ferrara High and its surroundings, where widespread fracturing may have increased permeability. © 2013 Elsevier B.V. All rights reserved. 1. Introduction Italy is one of the most important countries in the world with re- gard to the availability of geothermal resources, a large part of which is already extracted at relatively low cost (see e.g. Bertani, 2010; Pasquale, 2011). Temperatures often exceeding 200 °C at 2−3 km depth occur west of the Apennines mountain chain (Fig. 1), within a wide and several hundred kilometer long belt, affected by lithosphere extension and recent magmatism (Pasquale et al., 2010). This belt includes several geothermal fields mainly exploited for electricity generation. (e.g. Allegrini et al., 1995; Gianelli et al., 1988; Sommaruga and Verdiani, 1991). By excluding the volcanic belt, the deep aquifer hosted in the carbonate rocks of the Po Plain, the region extending between the Alps and Apennines, is probably the most important thermal water resource (Carella and Sommaruga, 2000). Such a general picture has been well established through numerous geophysical inves- tigations and drillings. In the Po Plain, exploration for hydrocarbons has given the main contribution to the knowledge of the structure and the stratigraphic setting of the sedimentary sequence. Generally, up to ten exploratory wells were drilled annually during the 1930s and 1940s, and both exploration and development operations intensified in the 1950s when the analysis of seismic reflection data was refined. Early explo- ration was focused on the shallow Tertiary anticlines, identified from seismic data. The deeper Mesozoic, folded and faulted carbonate suc- cessions were targeted in the 1970s and 1980s, with improved suc- cess rates achieved by the new seismic techniques (Pieri and Groppi, 1981). Since then, well logs, which often included tempera- ture records, and regional seismic sections were integrated with mag- netic and gravimetric modeling to obtain several geological cross-sections extending to the pre-Mesozoic crystalline basement (Cassano et al., 1986, 1990). Despite the extensive structural information, the knowledge of the thermal water resources in the deep aquifer of the Po Plain is still rather poor. In this paper, we focus on the eastern sector of the plain and try to gain a better knowledge of the thermal regime in the sedimentary sequence. We will argue that the deep aquifer in the carbonate rocks, to some degree karstified, may probably host thermal convection. Analyses of available temperature data from hy- drocarbon exploration wells together with structural information supply basic constraints for investigating the occurrence of this pro- cess. Thermal convection is considered to be a major mechanism for heat transfer in many geological environments, spanning from sedi- mentary basins (see e.g. Anderson, 2005; Pestov, 2000, and references therein), to geothermal fields (Hanano, 1998) and fractured rocks (Kühn et al., 2006; Murphy, 1979; Zhao et al., 2003). Tectonophysics 594 (2013) 1–12 ⁎ Corresponding author. Tel.: +39 010 3538090. E-mail address: [email protected] (V. Pasquale). 0040-1951/$ – see front matter © 2013 Elsevier B.V. All rights reserved. http://dx.doi.org/10.1016/j.tecto.2013.03.011 Contents lists available at SciVerse ScienceDirect Tectonophysics journal homepage: www.elsevier.com/locate/tecto
Transcript of Evidence for thermal convection in the deep carbonate aquifer of the eastern sector of the Po Plain,...
Tectonophysics 594 (2013) 1–12
Contents lists available at SciVerse ScienceDirect
Tectonophysics
j ourna l homepage: www.e lsev ie r .com/ locate / tecto
Evidence for thermal convection in the deep carbonate aquifer of the eastern sector ofthe Po Plain, Italy
V. Pasquale ⁎, P. Chiozzi, M. VerdoyaDipartimento per lo Studio del Territorio e delle sue Risorse, Settore di Geofisica, Università di Genova, Viale Benedetto XV 5, I-16132 Genova, Italy
⁎ Corresponding author. Tel.: +39 010 3538090.E-mail address: [email protected] (V. Pasqu
0040-1951/$ – see front matter © 2013 Elsevier B.V. Allhttp://dx.doi.org/10.1016/j.tecto.2013.03.011
a b s t r a c t
a r t i c l e i n f oArticle history:Received 27 January 2012Received in revised form 28 November 2012Accepted 5 March 2013Available online 16 March 2013
Keywords:Thermal regimeHeat and mass transferThermal convectionRayleigh numberDeep carbonate aquiferPermeability
Temperatures recorded in wells as deep as 6 km drilled for hydrocarbon prospecting were used togetherwith geological information to depict the thermal regime of the sedimentary sequence of the eastern sectorof the Po Plain. After correction for drilling disturbance, temperature data were analyzed through an inver-sion technique based on a laterally constant thermal gradient model. The obtained thermal gradient isquite low within the deep carbonate unit (14 mK m−1), while it is larger (53 mK m−1) in the overlying im-permeable formations. In the uppermost sedimentary layers, the thermal gradient is close to the regional av-erage (21 mK m−1). We argue that such a vertical change cannot be ascribed to thermal conductivityvariation within the sedimentary sequence, but to deep groundwater flow. Since the hydrogeological charac-teristics (including litho−stratigraphic sequence and structural setting) hardly permit forced convection, wesuggest that thermal convection might occur within the deep carbonate aquifer. The potential of this mech-anism was evaluated by means of the Rayleigh number analysis. It turned out that permeability required forconvection to occur must be larger than 3 10−15 m2. The average over-heat ratio is 0.45. The lateral variationof hydrothermal regime was tested by using temperature data representing the aquifer thermal conditions.We found that thermal convection might be more developed and variable at the Ferrara High and itssurroundings, where widespread fracturing may have increased permeability.
© 2013 Elsevier B.V. All rights reserved.
1. Introduction
Italy is one of the most important countries in the world with re-gard to the availability of geothermal resources, a large part of whichis already extracted at relatively low cost (see e.g. Bertani, 2010;Pasquale, 2011). Temperatures often exceeding 200 °C at 2−3 kmdepth occur west of the Apennines mountain chain (Fig. 1), within awide and several hundred kilometer long belt, affected by lithosphereextension and recent magmatism (Pasquale et al., 2010). This beltincludes several geothermal fields mainly exploited for electricitygeneration. (e.g. Allegrini et al., 1995; Gianelli et al., 1988; Sommarugaand Verdiani, 1991). By excluding the volcanic belt, the deep aquiferhosted in the carbonate rocks of the Po Plain, the region extendingbetween the Alps and Apennines, is probably the most importantthermal water resource (Carella and Sommaruga, 2000). Such a generalpicture has beenwell established through numerous geophysical inves-tigations and drillings.
In the Po Plain, exploration for hydrocarbons has given the maincontribution to the knowledge of the structure and the stratigraphicsetting of the sedimentary sequence. Generally, up to ten exploratorywells were drilled annually during the 1930s and 1940s, and both
ale).
rights reserved.
exploration and development operations intensified in the 1950swhen the analysis of seismic reflection data was refined. Early explo-ration was focused on the shallow Tertiary anticlines, identified fromseismic data. The deeper Mesozoic, folded and faulted carbonate suc-cessions were targeted in the 1970s and 1980s, with improved suc-cess rates achieved by the new seismic techniques (Pieri andGroppi, 1981). Since then, well logs, which often included tempera-ture records, and regional seismic sections were integrated with mag-netic and gravimetric modeling to obtain several geologicalcross-sections extending to the pre-Mesozoic crystalline basement(Cassano et al., 1986, 1990).
Despite the extensive structural information, the knowledge of thethermal water resources in the deep aquifer of the Po Plain is stillrather poor. In this paper, we focus on the eastern sector of theplain and try to gain a better knowledge of the thermal regime inthe sedimentary sequence. We will argue that the deep aquifer inthe carbonate rocks, to some degree karstified, may probably hostthermal convection. Analyses of available temperature data from hy-drocarbon exploration wells together with structural informationsupply basic constraints for investigating the occurrence of this pro-cess. Thermal convection is considered to be a major mechanism forheat transfer in many geological environments, spanning from sedi-mentary basins (see e.g. Anderson, 2005; Pestov, 2000, and referencestherein), to geothermal fields (Hanano, 1998) and fractured rocks(Kühn et al., 2006; Murphy, 1979; Zhao et al., 2003).
### #####
Adriatic
Sea
Bologna
N O R T H E R NA P E N N I N E S
11°
#
###
##
##
####
##
####
###
12° E
#
# ##
##
#A#
####
########
####
####
# ####
#### ##
###
###
#
#
Ravenna
#
#
###
###
45° N
#
##
##########
#####
#
#####
######
# #
##
# #
###
###
################
###
## #
#Ferrara
####
##
#
### #
##
##
#
##
A'
Ap
en
ni n e s
A l p s
TyrrhenianSea
Adriatic Sea
Po Plain
P e d e a p e n n i n i c zone
P e d e a l p i n e z o n e
S O U T H E R N A L P S
buried thrustApenninic
front
44°F
erra
raH
igh
*
*PTD
ATD
8
0
Dep
th (
km)
4
A
12
Ferrara High
P e d e a p e n n i n i c z o n e P e d e a l p i n e z o n e
A'
1 2 3 4 5 6
0
7
10 km
D D
DD
D
DD
DD
D
DD
D
D
G
C
2210-2450 2450-2550 2550-2650 2670-2780 2650-2780 2700-2810 (kg m-3)Density
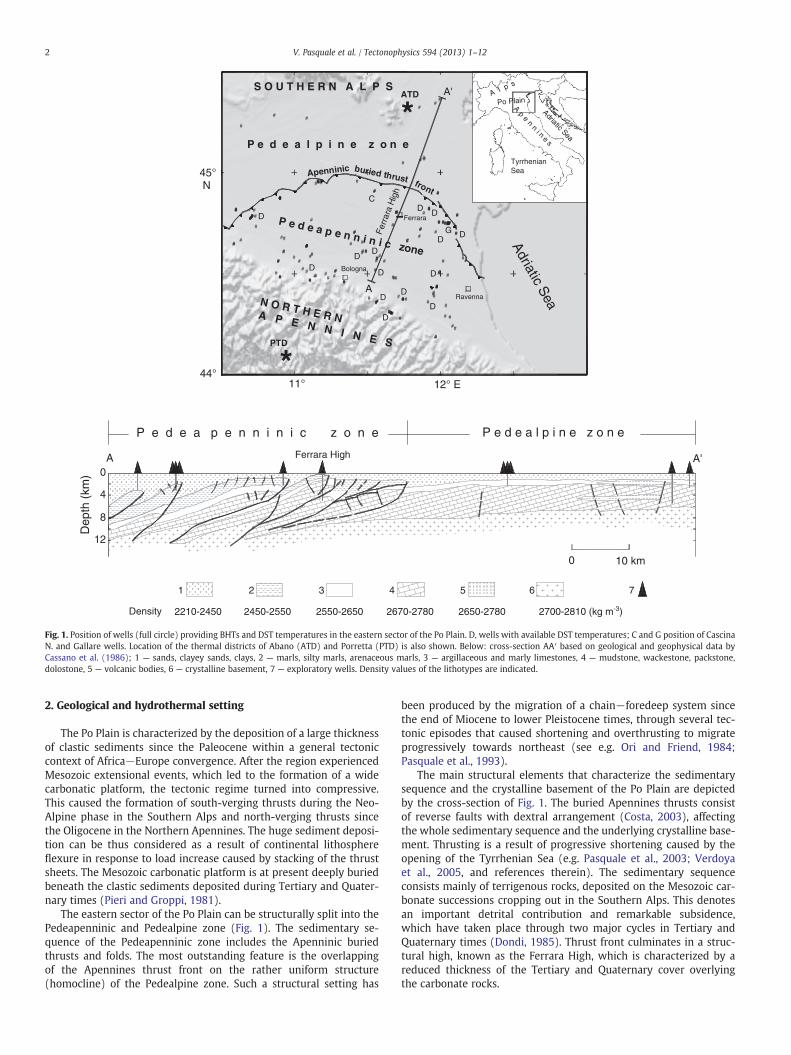
Fig. 1. Position of wells (full circle) providing BHTs and DST temperatures in the eastern sector of the Po Plain. D, wells with available DST temperatures; C and G position of CascinaN. and Gallare wells. Location of the thermal districts of Abano (ATD) and Porretta (PTD) is also shown. Below: cross-section AA′ based on geological and geophysical data byCassano et al. (1986); 1 — sands, clayey sands, clays, 2 — marls, silty marls, arenaceous marls, 3 — argillaceous and marly limestones, 4 — mudstone, wackestone, packstone,dolostone, 5 — volcanic bodies, 6 — crystalline basement, 7 — exploratory wells. Density values of the lithotypes are indicated.
2 V. Pasquale et al. / Tectonophysics 594 (2013) 1–12
2. Geological and hydrothermal setting
The Po Plain is characterized by the deposition of a large thicknessof clastic sediments since the Paleocene within a general tectoniccontext of Africa−Europe convergence. After the region experiencedMesozoic extensional events, which led to the formation of a widecarbonatic platform, the tectonic regime turned into compressive.This caused the formation of south-verging thrusts during the Neo-Alpine phase in the Southern Alps and north-verging thrusts sincethe Oligocene in the Northern Apennines. The huge sediment deposi-tion can be thus considered as a result of continental lithosphereflexure in response to load increase caused by stacking of the thrustsheets. The Mesozoic carbonatic platform is at present deeply buriedbeneath the clastic sediments deposited during Tertiary and Quater-nary times (Pieri and Groppi, 1981).
The eastern sector of the Po Plain can be structurally split into thePedeapenninic and Pedealpine zone (Fig. 1). The sedimentary se-quence of the Pedeapenninic zone includes the Apenninic buriedthrusts and folds. The most outstanding feature is the overlappingof the Apennines thrust front on the rather uniform structure(homocline) of the Pedealpine zone. Such a structural setting has
been produced by the migration of a chain−foredeep system sincethe end of Miocene to lower Pleistocene times, through several tec-tonic episodes that caused shortening and overthrusting to migrateprogressively towards northeast (see e.g. Ori and Friend, 1984;Pasquale et al., 1993).
The main structural elements that characterize the sedimentarysequence and the crystalline basement of the Po Plain are depictedby the cross-section of Fig. 1. The buried Apennines thrusts consistof reverse faults with dextral arrangement (Costa, 2003), affectingthe whole sedimentary sequence and the underlying crystalline base-ment. Thrusting is a result of progressive shortening caused by theopening of the Tyrrhenian Sea (e.g. Pasquale et al., 2003; Verdoyaet al., 2005, and references therein). The sedimentary sequenceconsists mainly of terrigenous rocks, deposited on the Mesozoic car-bonate successions cropping out in the Southern Alps. This denotesan important detrital contribution and remarkable subsidence,which have taken place through two major cycles in Tertiary andQuaternary times (Dondi, 1985). Thrust front culminates in a struc-tural high, known as the Ferrara High, which is characterized by areduced thickness of the Tertiary and Quaternary cover overlyingthe carbonate rocks.
3V. Pasquale et al. / Tectonophysics 594 (2013) 1–12
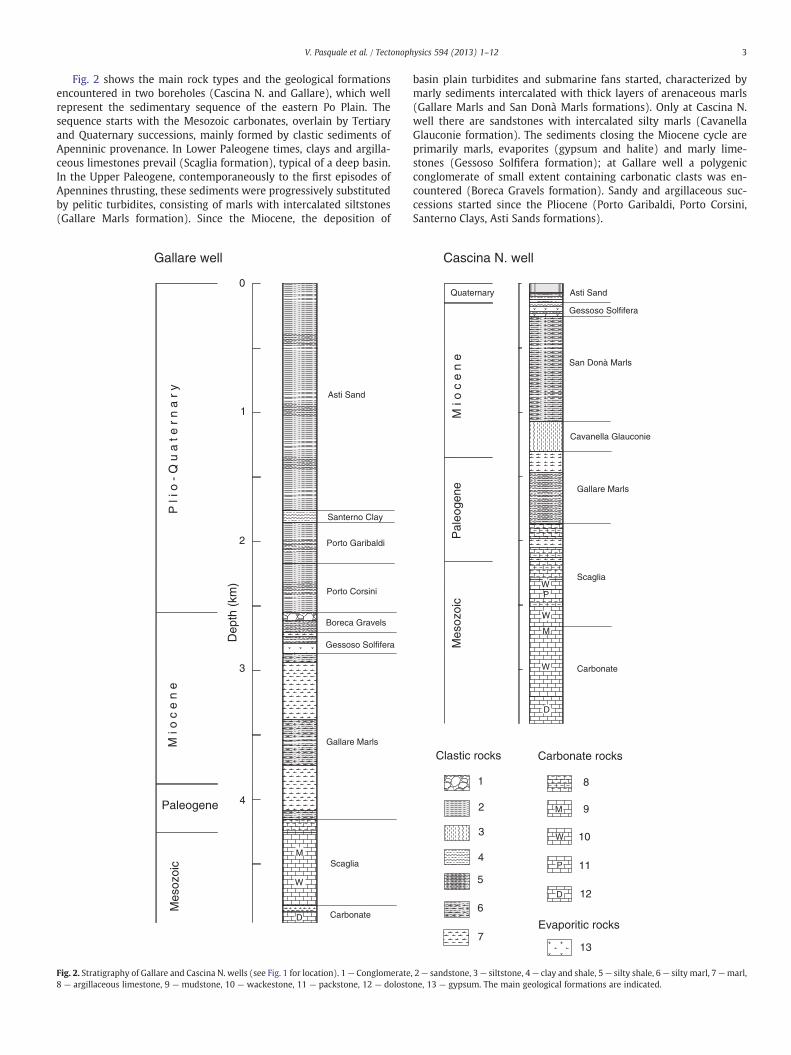
Fig. 2 shows the main rock types and the geological formationsencountered in two boreholes (Cascina N. and Gallare), which wellrepresent the sedimentary sequence of the eastern Po Plain. Thesequence starts with the Mesozoic carbonates, overlain by Tertiaryand Quaternary successions, mainly formed by clastic sediments ofApenninic provenance. In Lower Paleogene times, clays and argilla-ceous limestones prevail (Scaglia formation), typical of a deep basin.In the Upper Paleogene, contemporaneously to the first episodes ofApennines thrusting, these sediments were progressively substitutedby pelitic turbidites, consisting of marls with intercalated siltstones(Gallare Marls formation). Since the Miocene, the deposition of
Gallare well
1
2
3
0
Dep
th (
km)
4
Mes
ozoi
c
Paleogene
M i
o c
e n
eP
l i o
- Q
u a
t e
r n
a r
y
Asti Sand
Santerno Clay
Porto Garibaldi
Porto Corsini
Boreca Gravels
Gessoso Solfifera
Gallare Marls
Carbonate
ScagliaM
W
D
Fig. 2. Stratigraphy of Gallare and Cascina N. wells (see Fig. 1 for location). 1— Conglomerate8 — argillaceous limestone, 9 — mudstone, 10 — wackestone, 11 — packstone, 12 — dolosto
basin plain turbidites and submarine fans started, characterized bymarly sediments intercalated with thick layers of arenaceous marls(Gallare Marls and San Donà Marls formations). Only at Cascina N.well there are sandstones with intercalated silty marls (CavanellaGlauconie formation). The sediments closing the Miocene cycle areprimarily marls, evaporites (gypsum and halite) and marly lime-stones (Gessoso Solfifera formation); at Gallare well a polygenicconglomerate of small extent containing carbonatic clasts was en-countered (Boreca Gravels formation). Sandy and argillaceous suc-cessions started since the Pliocene (Porto Garibaldi, Porto Corsini,Santerno Clays, Asti Sands formations).
WP
W
M
W
D
Cascina N. well
Quaternary
M i
o c
e n
eP
aleo
gene
Mes
ozoi
c
Asti Sand
Gessoso Solfifera
San Donà Marls
Gallare Marls
Cavanella Glauconie
Scaglia
Carbonate
2
3
Clastic rocks
4
7
5
Carbonate rocks
8
9M
10W
11P
12D
Evaporitic rocks
13
6
1
, 2— sandstone, 3— siltstone, 4— clay and shale, 5— silty shale, 6— silty marl, 7—marl,ne, 13 — gypsum. The main geological formations are indicated.
Plio-Quaternary
Miocene
Paleogene
Crystalline basement
Mesozoic
pre-Mesozoic
LT1
LT2
LT3
LT4
421
5 6 7 8
Asti Sand
PortoGaribaldi
PortoCorsini S
ante
rno
Cla
y
Gessoso Solfifera
G a l l a r e M a r ls
Arenaceous Marl
S c a g l i a
Carbonate
3
San Donà Marls
Fig. 3. Stratigraphic column synthesizing the sedimentary sequence of the eastern sec-tor of the Po Plain and lithologic units (see text). Main sedimentary rocks: 1— sand andsandstone, 2 — clay and shale, 3 — clayey and marly sand, 4 — evaporite, 5 — marl andsilty shale, 6 — silty and arenaceous marl, 7 — argillaceous and marly limestone, 8 —
carbonate. The main geological formations are indicated.
4 V. Pasquale et al. / Tectonophysics 594 (2013) 1–12
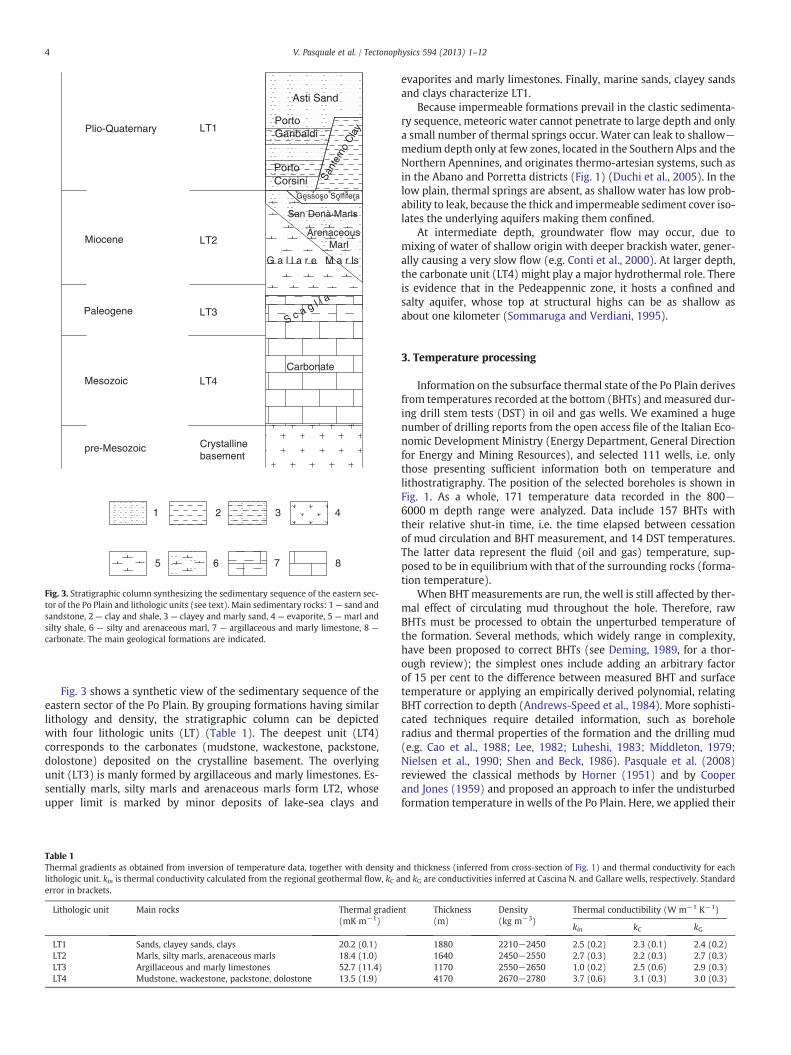
Fig. 3 shows a synthetic view of the sedimentary sequence of theeastern sector of the Po Plain. By grouping formations having similarlithology and density, the stratigraphic column can be depictedwith four lithologic units (LT) (Table 1). The deepest unit (LT4)corresponds to the carbonates (mudstone, wackestone, packstone,dolostone) deposited on the crystalline basement. The overlyingunit (LT3) is manly formed by argillaceous and marly limestones. Es-sentially marls, silty marls and arenaceous marls form LT2, whoseupper limit is marked by minor deposits of lake-sea clays and
Table 1Thermal gradients as obtained from inversion of temperature data, together with density alithologic unit. kin is thermal conductivity calculated from the regional geothermal flow, kC aerror in brackets.
Lithologic unit Main rocks Thermal gradie(mK m−1)
LT1 Sands, clayey sands, clays 20.2 (0.1)LT2 Marls, silty marls, arenaceous marls 18.4 (1.0)LT3 Argillaceous and marly limestones 52.7 (11.4)LT4 Mudstone, wackestone, packstone, dolostone 13.5 (1.9)
evaporites and marly limestones. Finally, marine sands, clayey sandsand clays characterize LT1.
Because impermeable formations prevail in the clastic sedimenta-ry sequence, meteoric water cannot penetrate to large depth and onlya small number of thermal springs occur. Water can leak to shallow−medium depth only at few zones, located in the Southern Alps and theNorthern Apennines, and originates thermo-artesian systems, such asin the Abano and Porretta districts (Fig. 1) (Duchi et al., 2005). In thelow plain, thermal springs are absent, as shallow water has low prob-ability to leak, because the thick and impermeable sediment cover iso-lates the underlying aquifers making them confined.
At intermediate depth, groundwater flow may occur, due tomixing of water of shallow origin with deeper brackish water, gener-ally causing a very slow flow (e.g. Conti et al., 2000). At larger depth,the carbonate unit (LT4) might play a major hydrothermal role. Thereis evidence that in the Pedeappennic zone, it hosts a confined andsalty aquifer, whose top at structural highs can be as shallow asabout one kilometer (Sommaruga and Verdiani, 1995).
3. Temperature processing
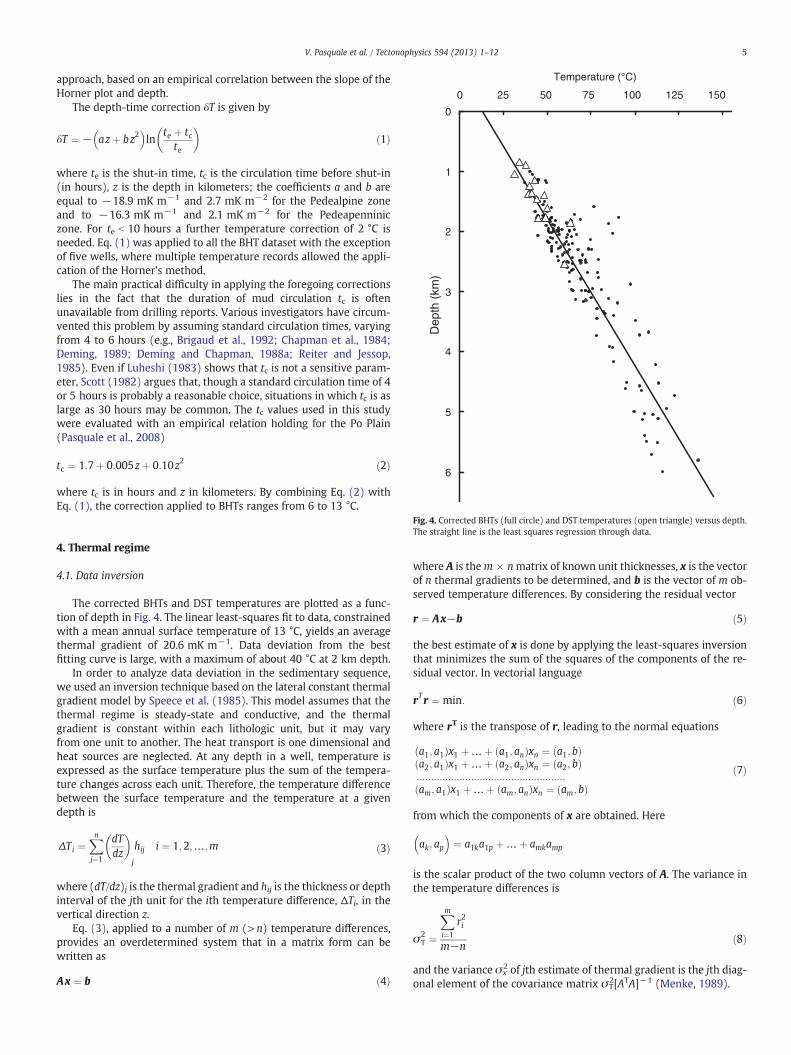
Information on the subsurface thermal state of the Po Plain derivesfrom temperatures recorded at the bottom (BHTs) andmeasured dur-ing drill stem tests (DST) in oil and gas wells. We examined a hugenumber of drilling reports from the open access file of the Italian Eco-nomic Development Ministry (Energy Department, General Directionfor Energy and Mining Resources), and selected 111 wells, i.e. onlythose presenting sufficient information both on temperature andlithostratigraphy. The position of the selected boreholes is shown inFig. 1. As a whole, 171 temperature data recorded in the 800−6000 m depth range were analyzed. Data include 157 BHTs withtheir relative shut-in time, i.e. the time elapsed between cessationof mud circulation and BHT measurement, and 14 DST temperatures.The latter data represent the fluid (oil and gas) temperature, sup-posed to be in equilibriumwith that of the surrounding rocks (forma-tion temperature).
When BHTmeasurements are run, the well is still affected by ther-mal effect of circulating mud throughout the hole. Therefore, rawBHTs must be processed to obtain the unperturbed temperature ofthe formation. Several methods, which widely range in complexity,have been proposed to correct BHTs (see Deming, 1989, for a thor-ough review); the simplest ones include adding an arbitrary factorof 15 per cent to the difference between measured BHT and surfacetemperature or applying an empirically derived polynomial, relatingBHT correction to depth (Andrews-Speed et al., 1984). More sophisti-cated techniques require detailed information, such as boreholeradius and thermal properties of the formation and the drilling mud(e.g. Cao et al., 1988; Lee, 1982; Luheshi, 1983; Middleton, 1979;Nielsen et al., 1990; Shen and Beck, 1986). Pasquale et al. (2008)reviewed the classical methods by Horner (1951) and by Cooperand Jones (1959) and proposed an approach to infer the undisturbedformation temperature in wells of the Po Plain. Here, we applied their
nd thickness (inferred from cross-section of Fig. 1) and thermal conductivity for eachnd kG are conductivities inferred at Cascina N. and Gallare wells, respectively. Standard
nt Thickness(m)
Density(kg m−3)
Thermal conductibility (W m−1 K−1)
kin kC kG
1880 2210−2450 2.5 (0.2) 2.3 (0.1) 2.4 (0.2)1640 2450−2550 2.7 (0.3) 2.2 (0.3) 2.7 (0.3)1170 2550−2650 1.0 (0.2) 2.5 (0.6) 2.9 (0.3)4170 2670−2780 3.7 (0.6) 3.1 (0.3) 3.0 (0.3)
0
1
2
3
4
5
6
0 25 50 75 100 125 150
Temperature (°C)
Dep
th (
km)
5V. Pasquale et al. / Tectonophysics 594 (2013) 1–12
approach, based on an empirical correlation between the slope of theHorner plot and depth.
The depth-time correction δT is given by
δT ¼ − azþ bz2� �
lnte þ tcte
� �ð1Þ
where te is the shut-in time, tc is the circulation time before shut-in(in hours), z is the depth in kilometers; the coefficients a and b areequal to −18.9 mK m−1 and 2.7 mK m−2 for the Pedealpine zoneand to −16.3 mK m−1 and 2.1 mK m−2 for the Pedeapenniniczone. For te b 10 hours a further temperature correction of 2 °C isneeded. Eq. (1) was applied to all the BHT dataset with the exceptionof five wells, where multiple temperature records allowed the appli-cation of the Horner's method.
The main practical difficulty in applying the foregoing correctionslies in the fact that the duration of mud circulation tc is oftenunavailable from drilling reports. Various investigators have circum-vented this problem by assuming standard circulation times, varyingfrom 4 to 6 hours (e.g., Brigaud et al., 1992; Chapman et al., 1984;Deming, 1989; Deming and Chapman, 1988a; Reiter and Jessop,1985). Even if Luheshi (1983) shows that tc is not a sensitive param-eter, Scott (1982) argues that, though a standard circulation time of 4or 5 hours is probably a reasonable choice, situations in which tc is aslarge as 30 hours may be common. The tc values used in this studywere evaluated with an empirical relation holding for the Po Plain(Pasquale et al., 2008)
tc ¼ 1:7þ 0:005zþ 0:10z2 ð2Þ
where tc is in hours and z in kilometers. By combining Eq. (2) withEq. (1), the correction applied to BHTs ranges from 6 to 13 °C.
Fig. 4. Corrected BHTs (full circle) and DST temperatures (open triangle) versus depth.The straight line is the least squares regression through data.
4. Thermal regime
4.1. Data inversion
The corrected BHTs and DST temperatures are plotted as a func-tion of depth in Fig. 4. The linear least-squares fit to data, constrainedwith a mean annual surface temperature of 13 °C, yields an averagethermal gradient of 20.6 mK m−1. Data deviation from the bestfitting curve is large, with a maximum of about 40 °C at 2 km depth.
In order to analyze data deviation in the sedimentary sequence,we used an inversion technique based on the lateral constant thermalgradient model by Speece et al. (1985). This model assumes that thethermal regime is steady-state and conductive, and the thermalgradient is constant within each lithologic unit, but it may varyfrom one unit to another. The heat transport is one dimensional andheat sources are neglected. At any depth in a well, temperature isexpressed as the surface temperature plus the sum of the tempera-ture changes across each unit. Therefore, the temperature differencebetween the surface temperature and the temperature at a givendepth is
ΔTi ¼Xnj¼1
dTdz
� �j
hij i ¼ 1;2;…;m ð3Þ
where (dT/dz)j is the thermal gradient and hij is the thickness or depthinterval of the jth unit for the ith temperature difference, ΔTi, in thevertical direction z.
Eq. (3), applied to a number of m (>n) temperature differences,provides an overdetermined system that in a matrix form can bewritten as
Ax ¼ b ð4Þ
where A is them × nmatrix of known unit thicknesses, x is the vectorof n thermal gradients to be determined, and b is the vector of m ob-served temperature differences. By considering the residual vector
r ¼ Ax−b ð5Þ
the best estimate of x is done by applying the least-squares inversionthat minimizes the sum of the squares of the components of the re-sidual vector. In vectorial language
rTr ¼ min: ð6Þ
where rT is the transpose of r, leading to the normal equations
a1; a1ð Þx1 þ…þ a1; anð Þxn ¼ a1; bð Þa2; a1ð Þx1 þ…þ a2; anð Þxn ¼ a2; bð Þ::::::::::::::::::::::::::::::::::::::::::::::::::::am; a1ð Þx1 þ…þ am; anð Þxn ¼ am; bð Þ
ð7Þ
from which the components of x are obtained. Here
ak; ap� �
¼ a1ka1p þ…þ amkamp
is the scalar product of the two column vectors of A. The variance inthe temperature differences is
σ2T ¼
Xmi¼1
r2i
m−nð8Þ
and the variance σx2 of jth estimate of thermal gradient is the jth diag-
onal element of the covariance matrix σT2[ATA]−1 (Menke, 1989).
a
5
15
25
35
45
55
Data number removed
The
rmal
gra
dien
t (m
K/m
)
LT1
LT2
LT3
LT4
b
5
6
7
8
9
10
0 1 2 3 4 5 6 7 0 1 2 3 4 5 6 7
Number of data removed
Tem
pera
ture
sta
ndar
d de
v. (
°C)
Fig. 5. (a) Thermal gradient of each lithologic unit and (b) standard deviation of temperature versus the number of temperature data removed, determined with inversion (see text).
6 V. Pasquale et al. / Tectonophysics 594 (2013) 1–12
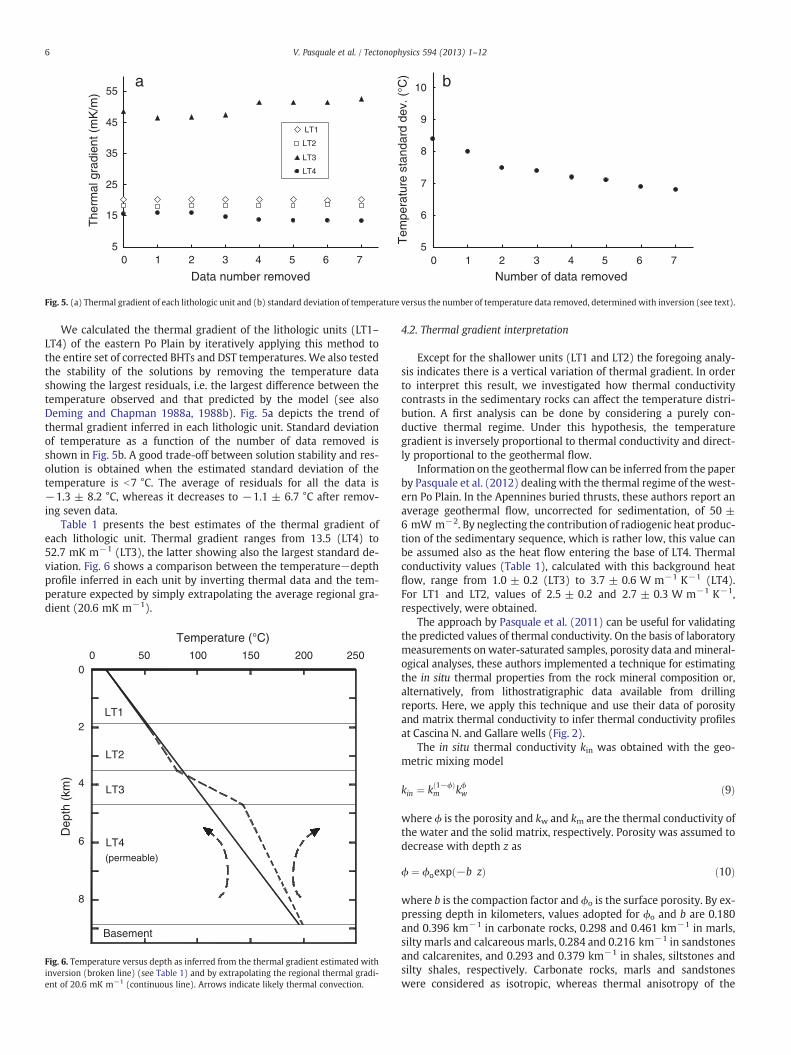
We calculated the thermal gradient of the lithologic units (LT1–LT4) of the eastern Po Plain by iteratively applying this method tothe entire set of corrected BHTs and DST temperatures. We also testedthe stability of the solutions by removing the temperature datashowing the largest residuals, i.e. the largest difference between thetemperature observed and that predicted by the model (see alsoDeming and Chapman 1988a, 1988b). Fig. 5a depicts the trend ofthermal gradient inferred in each lithologic unit. Standard deviationof temperature as a function of the number of data removed isshown in Fig. 5b. A good trade-off between solution stability and res-olution is obtained when the estimated standard deviation of thetemperature is b7 °C. The average of residuals for all the data is−1.3 ± 8.2 °C, whereas it decreases to −1.1 ± 6.7 °C after remov-ing seven data.
Table 1 presents the best estimates of the thermal gradient ofeach lithologic unit. Thermal gradient ranges from 13.5 (LT4) to52.7 mK m−1 (LT3), the latter showing also the largest standard de-viation. Fig. 6 shows a comparison between the temperature−depthprofile inferred in each unit by inverting thermal data and the tem-perature expected by simply extrapolating the average regional gra-dient (20.6 mK m−1).
0 50 100 150 200 250
Temperature (°C)
0
2
4
6
8
Dep
th (
km)
LT1
LT2
LT3
LT4(permeable)
Basement
Fig. 6. Temperature versus depth as inferred from the thermal gradient estimated withinversion (broken line) (see Table 1) and by extrapolating the regional thermal gradi-ent of 20.6 mK m−1 (continuous line). Arrows indicate likely thermal convection.
4.2. Thermal gradient interpretation
Except for the shallower units (LT1 and LT2) the foregoing analy-sis indicates there is a vertical variation of thermal gradient. In orderto interpret this result, we investigated how thermal conductivitycontrasts in the sedimentary rocks can affect the temperature distri-bution. A first analysis can be done by considering a purely con-ductive thermal regime. Under this hypothesis, the temperaturegradient is inversely proportional to thermal conductivity and direct-ly proportional to the geothermal flow.
Information on the geothermal flow can be inferred from the paperby Pasquale et al. (2012) dealing with the thermal regime of the west-ern Po Plain. In the Apennines buried thrusts, these authors report anaverage geothermal flow, uncorrected for sedimentation, of 50 ±6 mW m−2. By neglecting the contribution of radiogenic heat produc-tion of the sedimentary sequence, which is rather low, this value canbe assumed also as the heat flow entering the base of LT4. Thermalconductivity values (Table 1), calculated with this background heatflow, range from 1.0 ± 0.2 (LT3) to 3.7 ± 0.6 W m−1 K−1 (LT4).For LT1 and LT2, values of 2.5 ± 0.2 and 2.7 ± 0.3 W m−1 K−1,respectively, were obtained.
The approach by Pasquale et al. (2011) can be useful for validatingthe predicted values of thermal conductivity. On the basis of laboratorymeasurements on water-saturated samples, porosity data and mineral-ogical analyses, these authors implemented a technique for estimatingthe in situ thermal properties from the rock mineral composition or,alternatively, from lithostratigraphic data available from drillingreports. Here, we apply this technique and use their data of porosityand matrix thermal conductivity to infer thermal conductivity profilesat Cascina N. and Gallare wells (Fig. 2).
The in situ thermal conductivity kin was obtained with the geo-metric mixing model
kin ¼ k 1−ϕð Þm kϕw ð9Þ
where ϕ is the porosity and kw and km are the thermal conductivity ofthe water and the solid matrix, respectively. Porosity was assumed todecrease with depth z as
ϕ ¼ ϕoexp −b zð Þ ð10Þ
where b is the compaction factor and ϕo is the surface porosity. By ex-pressing depth in kilometers, values adopted for ϕo and b are 0.180and 0.396 km−1 in carbonate rocks, 0.298 and 0.461 km−1 in marls,silty marls and calcareous marls, 0.284 and 0.216 km−1 in sandstonesand calcarenites, and 0.293 and 0.379 km−1 in shales, siltstones andsilty shales, respectively. Carbonate rocks, marls and sandstoneswere considered as isotropic, whereas thermal anisotropy of the

7V. Pasquale et al. / Tectonophysics 594 (2013) 1–12
clay-rich lithologies (siltstones, shales and silty shales) was taken intoaccount. In anisotropic rocks, the vertical matrix conductivity, whichdecreases with depth due to the orientation of the clay and micaplatelets during burial, was estimated by using the relation
km ¼ 2:899−0:251 z: ð11Þ
The water thermal conductivity kw was assumed to change withtemperature as suggest by Deming and Chapman (1988a)
kw ¼ 0:5648þ 1:878 10−3T−7:231 10−6T2 T ≤ 137 BC ð12Þ
kw ¼ 0:6020þ 1:309 10−3T−5:140 10−6T2 T > 137 BC ð13Þ
whereas the temperature dependence of the solid matrix conductivi-ty was evaluated with the expression (Sekiguchi, 1984)
km ¼ 1:8418þ ko−1:8418ð Þ 10:002732 T þ 0:7463
−0:2485� �
ð14Þ
0
1000
2000
3000
4000
5000
1.0
Dep
th (
m)
Thermal conductivity (W m-1K-1)
LT1
LT2
LT3
LT4
a
2.0 3.0 4.0
Fig. 7. In situ vertical thermal conductivity (circle) versus depth of Gallare (a) and Cascinaaverage thermal conductivity for each lithologic unit (see text and Table 1).
where ko is the matrix conductivity at 20 °C. The total uncertainty onthermal conductivity, which takes into account the errors in correc-tion for anisotropy, temperature and porosity, is 10 percent.
The thermal conductivity profiles obtained with the foregoing tech-nique at Cascina N. and Gallare wells are shown in Fig. 7. Thermal con-ductivity is calculated at the middle-point of 20 m intervals. In theuppermost kilometers, compaction plays a major effect with respectto temperature and, for the same lithotype, this causes an increase ofconductivity with depth. Both wells show that the maximum values ofconductivity occur in lower part of LT3 and LT4. In LT2 and LT3, horizonsof shales, silty shales and siltstone are present at different depths andexhibit minima of conductivity. In these horizons, due to the presenceof thermally anisotropic sheet silicates, conductivity is constant or de-creases with depth. Table 1 shows the weighed average conductivityof the lithologic units in Cascina N. and Gallare wells. Conductivitywas calculated on the basis of the average conductivity and thicknessof the lithotypes forming each unit. Values range from 2.2 ± 0.3 to3.1 ± 0.3 W m−1 K−1. Conductivity of LT3 is decidedly higher thanthat calculated on the basis of the geothermal flow.
0
500
1000
1500
2000
2500
3000
3500
1.0
Thermal conductivity (W m-1K-1)
Dep
th (
m)
LT1
LT2
LT3
LT4
b
2.0 3.0 4.0
N. (b) wells (see also Fig. 2). The lithologic units (LT) are indicated. Hatched line is the
8 V. Pasquale et al. / Tectonophysics 594 (2013) 1–12
4.3. Thermal convection
If the vertical variation of the thermal gradient cannot be ascribedto thermal conductivity contrasts, a possible explanation could lie inthe heat transported by water flow in the deep carbonate unit(LT4). Thermal convection in an aquifer heated from below mayoccur provided that appropriate heat sources and permeability arepresent. Water flow could cause a decrease of thermal gradient inLT4 and a significant increase in the overlying impermeable unit(Fig. 6). Since LT4 is hydraulically insulated, thermal convectionmight be the driving mechanism.
Conditions for thermal convection in LT4, can be analyzed withthe Rayleigh number, Ra, defined as (Horton and Rogers, 1945;Lapwood, 1948)
Ra ¼g αw ρcp
� �wk h ΔT
νwkinð15Þ
where g is acceleration due to gravity, αw, νw and (ρcp)w are thermalexpansion coefficient, kinematic viscosity and volumetric heat capac-ity, respectively, of the saturating water, h is length over which con-vection occurs, ΔT is the temperature difference between the topand bottom of this length interval, k and kin are the permeabilityand the thermal conductivity.
In practical terms, the Rayleigh number helps to differentiate be-tween purely conductive systems, where isothermal constant densitymodels are applicable, and low-grade hydrothermal systems, wherenon-isothermal models must be used. When the Rayleigh number ex-ceeds the critical value of 4π2, convection starts and water flow formsconvective cells. Such a flow is often termed as density-driven con-vection to stress the role of density variations in driving the motion(e.g. Holzbecher, 1998, Turcotte and Schubert, 2002).
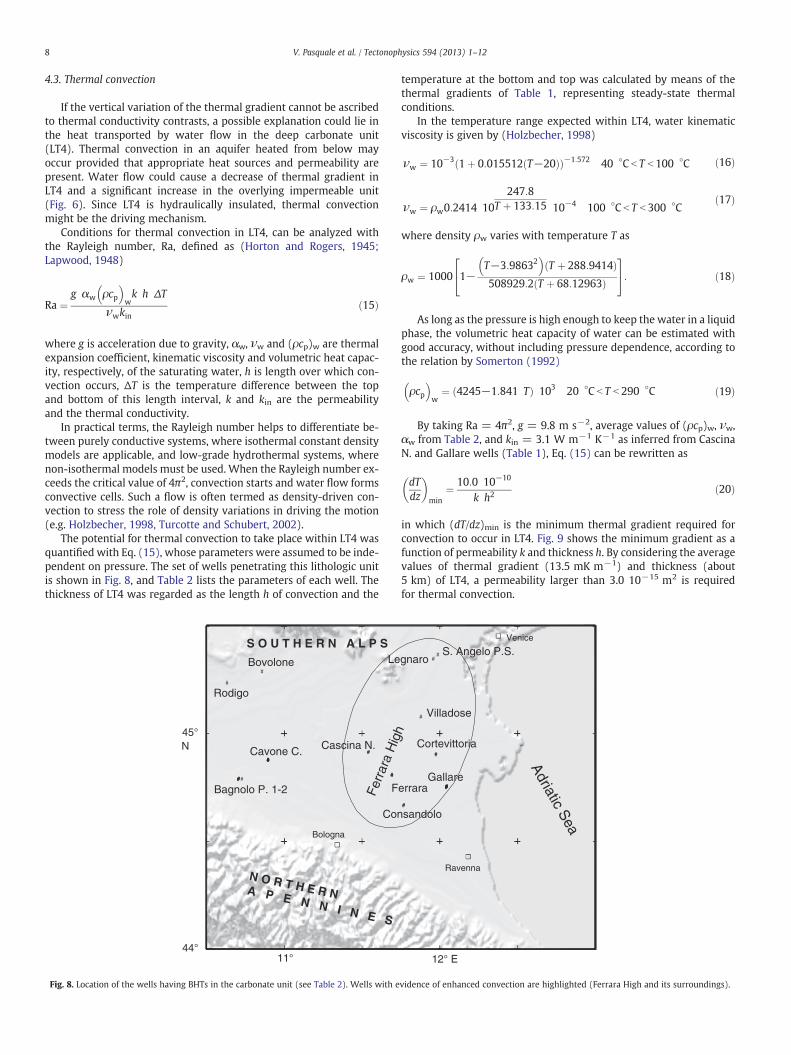
The potential for thermal convection to take place within LT4 wasquantified with Eq. (15), whose parameters were assumed to be inde-pendent on pressure. The set of wells penetrating this lithologic unitis shown in Fig. 8, and Table 2 lists the parameters of each well. Thethickness of LT4 was regarded as the length h of convection and the
Bologna
N O R T H E R NA P E N N I N E S
11°
#
45° N
#####
#####
#
##
###
44°
Bagnolo P. 1-2
Bovolone
Rodigo
Le
Cascina N.
F
Con
Cavone C.
Ferr
ara
Hi
S O U T H E R N A L P S
Fig. 8. Location of the wells having BHTs in the carbonate unit (see Table 2). Wells with e
temperature at the bottom and top was calculated by means of thethermal gradients of Table 1, representing steady-state thermalconditions.
In the temperature range expected within LT4, water kinematicviscosity is given by (Holzbecher, 1998)
νw ¼ 10−3 1þ 0:015512 T−20ð Þð Þ−1:572 40 BC b T b 100 BC ð16Þ
νw ¼ ρw0:2414 10
247:8T þ 133:15 10−4 100 BC b T b 300 BC
ð17Þ
where density ρw varies with temperature T as
ρw ¼ 1000 1−T−3:98632
� �T þ 288:9414ð Þ
508929:2 T þ 68:12963ð Þ
24
35: ð18Þ
As long as the pressure is high enough to keep the water in a liquidphase, the volumetric heat capacity of water can be estimated withgood accuracy, without including pressure dependence, according tothe relation by Somerton (1992)
ρcp� �
w¼ 4245−1:841 Tð Þ 103 20 BC b T b 290 BC ð19Þ
By taking Ra = 4π2, g = 9.8 m s−2, average values of (ρcp)w, νw,αw from Table 2, and kin = 3.1 W m−1 K−1 as inferred from CascinaN. and Gallare wells (Table 1), Eq. (15) can be rewritten as
dTdz
� �min
¼ 10:0 10−10
k h2ð20Þ
in which (dT/dz)min is the minimum thermal gradient required forconvection to occur in LT4. Fig. 9 shows the minimum gradient as afunction of permeability k and thickness h. By considering the averagevalues of thermal gradient (13.5 mK m−1) and thickness (about5 km) of LT4, a permeability larger than 3.0 10−15 m2 is requiredfor thermal convection.
Adriatic
Sea
12° E
Ravenna
######
##
#
##
#
##
S. Angelo P.S.gnaro
Villadose
Cortevittoria
erraraGallare
sandolo
Venice
gh
vidence of enhanced convection are highlighted (Ferrara High and its surroundings).
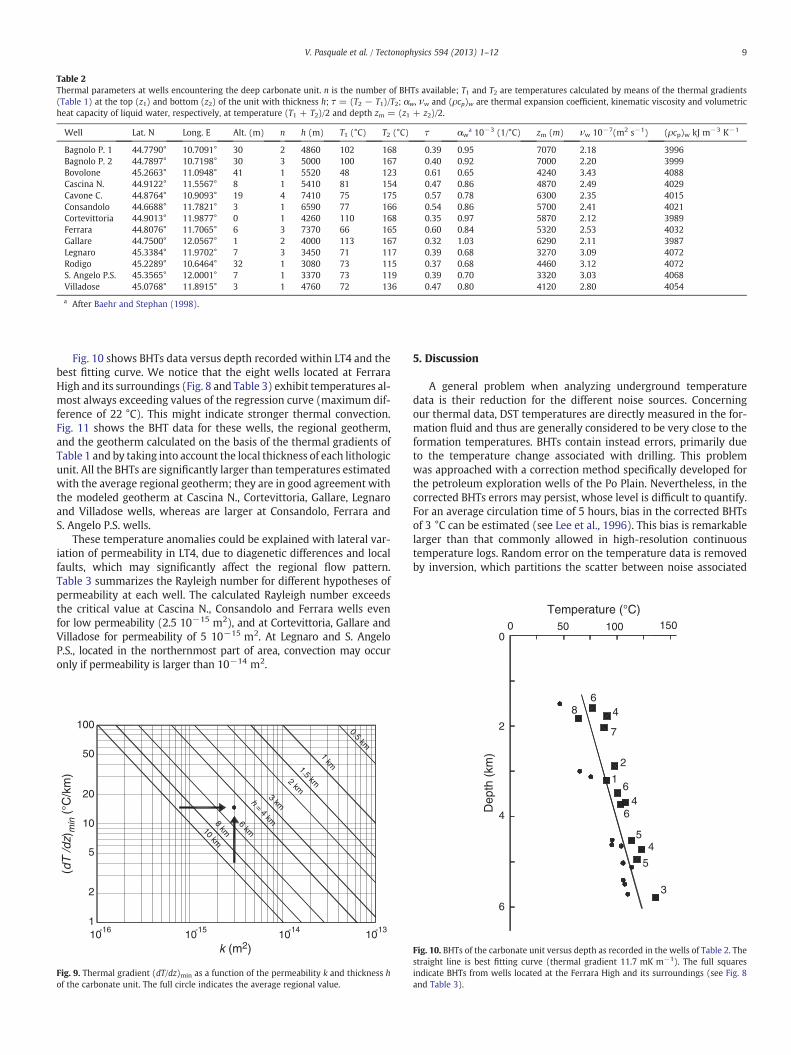
Table 2Thermal parameters at wells encountering the deep carbonate unit. n is the number of BHTs available; T1 and T2 are temperatures calculated by means of the thermal gradients(Table 1) at the top (z1) and bottom (z2) of the unit with thickness h; τ = (T2 − T1)/T2; αw, νw and (ρcp)w are thermal expansion coefficient, kinematic viscosity and volumetricheat capacity of liquid water, respectively, at temperature (T1 + T2)/2 and depth zm = (z1 + z2)/2.
Well Lat. N Long. E Alt. (m) n h (m) T1 (°C) T2 (°C) τ αwa 10−3 (1/°C) zm (m) νw 10−7(m2 s−1) (ρcp)w kJ m−3 K−1
Bagnolo P. 1 44.7790° 10.7091° 30 2 4860 102 168 0.39 0.95 7070 2.18 3996Bagnolo P. 2 44.7897° 10.7198° 30 3 5000 100 167 0.40 0.92 7000 2.20 3999Bovolone 45.2663° 11.0948° 41 1 5520 48 123 0.61 0.65 4240 3.43 4088Cascina N. 44.9122° 11.5567° 8 1 5410 81 154 0.47 0.86 4870 2.49 4029Cavone C. 44.8764° 10.9093° 19 4 7410 75 175 0.57 0.78 6300 2.35 4015Consandolo 44.6688° 11.7821° 3 1 6590 77 166 0.54 0.86 5700 2.41 4021Cortevittoria 44.9013° 11.9877° 0 1 4260 110 168 0.35 0.97 5870 2.12 3989Ferrara 44.8076° 11.7065° 6 3 7370 66 165 0.60 0.84 5320 2.53 4032Gallare 44.7500° 12.0567° 1 2 4000 113 167 0.32 1.03 6290 2.11 3987Legnaro 45.3384° 11.9702° 7 3 3450 71 117 0.39 0.68 3270 3.09 4072Rodigo 45.2289° 10.6464° 32 1 3080 73 115 0.37 0.68 4460 3.12 4072S. Angelo P.S. 45.3565° 12.0001° 7 1 3370 73 119 0.39 0.70 3320 3.03 4068Villadose 45.0768° 11.8915° 3 1 4760 72 136 0.47 0.80 4120 2.80 4054
a After Baehr and Stephan (1998).
0 50 100
Temperature (°C)
0150
9V. Pasquale et al. / Tectonophysics 594 (2013) 1–12
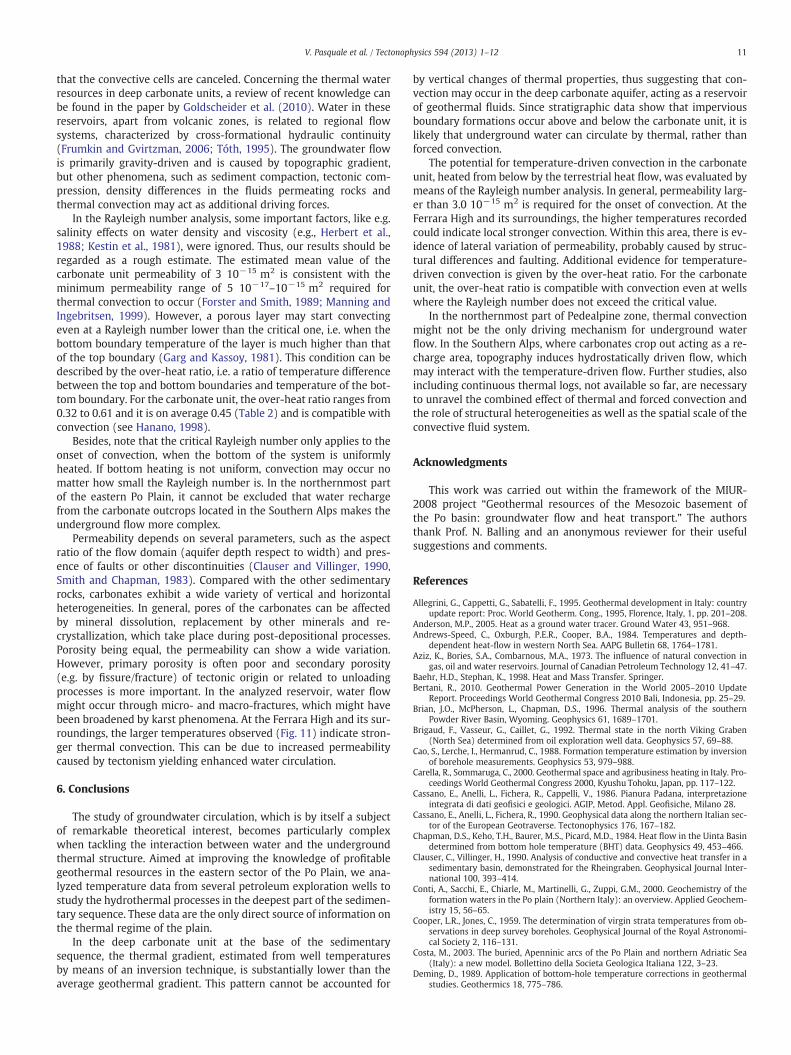
Fig. 10 shows BHTs data versus depth recorded within LT4 and thebest fitting curve. We notice that the eight wells located at FerraraHigh and its surroundings (Fig. 8 and Table 3) exhibit temperatures al-most always exceeding values of the regression curve (maximum dif-ference of 22 °C). This might indicate stronger thermal convection.Fig. 11 shows the BHT data for these wells, the regional geotherm,and the geotherm calculated on the basis of the thermal gradients ofTable 1 and by taking into account the local thickness of each lithologicunit. All the BHTs are significantly larger than temperatures estimatedwith the average regional geotherm; they are in good agreement withthe modeled geotherm at Cascina N., Cortevittoria, Gallare, Legnaroand Villadose wells, whereas are larger at Consandolo, Ferrara andS. Angelo P.S. wells.
These temperature anomalies could be explained with lateral var-iation of permeability in LT4, due to diagenetic differences and localfaults, which may significantly affect the regional flow pattern.Table 3 summarizes the Rayleigh number for different hypotheses ofpermeability at each well. The calculated Rayleigh number exceedsthe critical value at Cascina N., Consandolo and Ferrara wells evenfor low permeability (2.5 10−15 m2), and at Cortevittoria, Gallare andVilladose for permeability of 5 10−15 m2. At Legnaro and S. AngeloP.S., located in the northernmost part of area, convection may occuronly if permeability is larger than 10−14 m2.
1.5km
20 3km
(dT
/dz)
min
(°C
/km
)
h=
4km
2
101
-16
k (m2)
-1510 10-14
5
10 10km
6km
8km
50
100
2km
-1310
0.5km
1km
Fig. 9. Thermal gradient (dT/dz)min as a function of the permeability k and thickness hof the carbonate unit. The full circle indicates the average regional value.
5. Discussion
A general problem when analyzing underground temperaturedata is their reduction for the different noise sources. Concerningour thermal data, DST temperatures are directly measured in the for-mation fluid and thus are generally considered to be very close to theformation temperatures. BHTs contain instead errors, primarily dueto the temperature change associated with drilling. This problemwas approached with a correction method specifically developed forthe petroleum exploration wells of the Po Plain. Nevertheless, in thecorrected BHTs errors may persist, whose level is difficult to quantify.For an average circulation time of 5 hours, bias in the corrected BHTsof 3 °C can be estimated (see Lee et al., 1996). This bias is remarkablelarger than that commonly allowed in high-resolution continuoustemperature logs. Random error on the temperature data is removedby inversion, which partitions the scatter between noise associated
2
4
6
Dep
th (
km)
68 4
7
2
16
46
54
5
3
Fig. 10. BHTs of the carbonate unit versus depth as recorded in the wells of Table 2. Thestraight line is best fitting curve (thermal gradient 11.7 mK m−1). The full squaresindicate BHTs from wells located at the Ferrara High and its surroundings (see Fig. 8and Table 3).
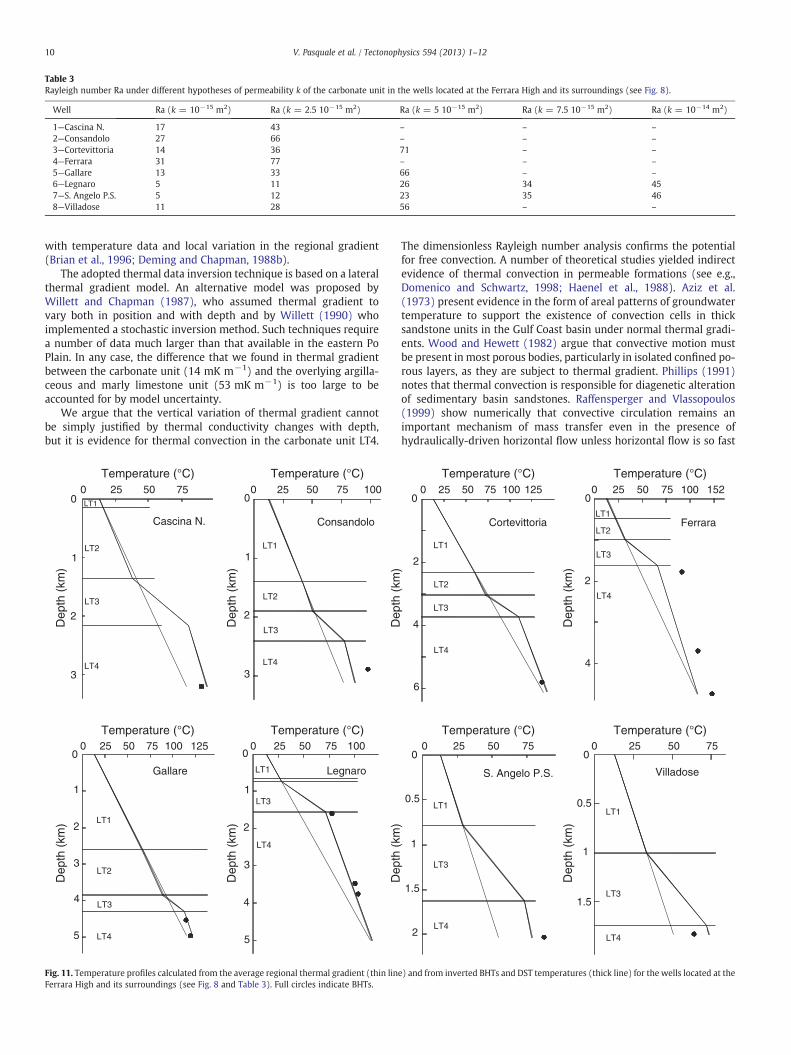
Table 3Rayleigh number Ra under different hypotheses of permeability k of the carbonate unit in the wells located at the Ferrara High and its surroundings (see Fig. 8).
Well Ra (k = 10−15 m2) Ra (k = 2.5 10−15 m2) Ra (k = 5 10−15 m2) Ra (k = 7.5 10−15 m2) Ra (k = 10−14 m2)
1—Cascina N. 17 43 – – –
2—Consandolo 27 66 – – –
3—Cortevittoria 14 36 71 – –
4—Ferrara 31 77 – – –
5—Gallare 13 33 66 – –
6—Legnaro 5 11 26 34 457—S. Angelo P.S. 5 12 23 35 468—Villadose 11 28 56 – –
10 V. Pasquale et al. / Tectonophysics 594 (2013) 1–12
with temperature data and local variation in the regional gradient(Brian et al., 1996; Deming and Chapman, 1988b).
The adopted thermal data inversion technique is based on a lateralthermal gradient model. An alternative model was proposed byWillett and Chapman (1987), who assumed thermal gradient tovary both in position and with depth and by Willett (1990) whoimplemented a stochastic inversion method. Such techniques requirea number of data much larger than that available in the eastern PoPlain. In any case, the difference that we found in thermal gradientbetween the carbonate unit (14 mK m−1) and the overlying argilla-ceous and marly limestone unit (53 mK m−1) is too large to beaccounted for by model uncertainty.
We argue that the vertical variation of thermal gradient cannotbe simply justified by thermal conductivity changes with depth,but it is evidence for thermal convection in the carbonate unit LT4.
0
Cascina N.
1
2
Dep
th (
km)
3
0 25 50
Temperature (°C)
LT1
LT2
LT3
LT4
Consandolo
0 50 75
Temperature (°C)100
LT1
LT2
LT3
LT4
Dep
th (
km)
3
2
1
0
Gallare
Temperature (°C)250 50 75 100
2
3
Dep
th (
km)
1
0
4
5
LT1
LT2
LT3
LT4
LegnaroLT1
LT3
LT4
5
Dep
th (
km)
4
3
2
1
0
Temperature (°C)0 25 50 75 100
75 25
125
Fig. 11. Temperature profiles calculated from the average regional thermal gradient (thin linFerrara High and its surroundings (see Fig. 8 and Table 3). Full circles indicate BHTs.
The dimensionless Rayleigh number analysis confirms the potentialfor free convection. A number of theoretical studies yielded indirectevidence of thermal convection in permeable formations (see e.g.,Domenico and Schwartz, 1998; Haenel et al., 1988). Aziz et al.(1973) present evidence in the form of areal patterns of groundwatertemperature to support the existence of convection cells in thicksandstone units in the Gulf Coast basin under normal thermal gradi-ents. Wood and Hewett (1982) argue that convective motion mustbe present in most porous bodies, particularly in isolated confined po-rous layers, as they are subject to thermal gradient. Phillips (1991)notes that thermal convection is responsible for diagenetic alterationof sedimentary basin sandstones. Raffensperger and Vlassopoulos(1999) show numerically that convective circulation remains animportant mechanism of mass transfer even in the presence ofhydraulically-driven horizontal flow unless horizontal flow is so fast
Cortevittoria
0 50 75 100
Temperature (°C)125
0
2
4
6
Dep
th (
km)
Ferrara
25 1520 75
Temperature (°C)50
LT1
LT2
LT3
LT4
LT4
LT3
LT2
LT1
0
2D
epth
(km
)
4
S. Angelo P.S.
LT1
LT3
LT4
0
0.5
1
2
Dep
th (
km)
1.5
Temperature (°C)0 25 50 75
Temperature (°C)0 25 50 75
LT1
LT3
LT4
Villadose
0
0.5
1
1.5
Dep
th (
km)
25 100
e) and from inverted BHTs and DST temperatures (thick line) for the wells located at the
11V. Pasquale et al. / Tectonophysics 594 (2013) 1–12
that the convective cells are canceled. Concerning the thermal waterresources in deep carbonate units, a review of recent knowledge canbe found in the paper by Goldscheider et al. (2010). Water in thesereservoirs, apart from volcanic zones, is related to regional flowsystems, characterized by cross-formational hydraulic continuity(Frumkin and Gvirtzman, 2006; Tóth, 1995). The groundwater flowis primarily gravity-driven and is caused by topographic gradient,but other phenomena, such as sediment compaction, tectonic com-pression, density differences in the fluids permeating rocks andthermal convection may act as additional driving forces.
In the Rayleigh number analysis, some important factors, like e.g.salinity effects on water density and viscosity (e.g., Herbert et al.,1988; Kestin et al., 1981), were ignored. Thus, our results should beregarded as a rough estimate. The estimated mean value of thecarbonate unit permeability of 3 10−15 m2 is consistent with theminimum permeability range of 5 10−17–10−15 m2 required forthermal convection to occur (Forster and Smith, 1989; Manning andIngebritsen, 1999). However, a porous layer may start convectingeven at a Rayleigh number lower than the critical one, i.e. when thebottom boundary temperature of the layer is much higher than thatof the top boundary (Garg and Kassoy, 1981). This condition can bedescribed by the over-heat ratio, i.e. a ratio of temperature differencebetween the top and bottom boundaries and temperature of the bot-tom boundary. For the carbonate unit, the over-heat ratio ranges from0.32 to 0.61 and it is on average 0.45 (Table 2) and is compatible withconvection (see Hanano, 1998).
Besides, note that the critical Rayleigh number only applies to theonset of convection, when the bottom of the system is uniformlyheated. If bottom heating is not uniform, convection may occur nomatter how small the Rayleigh number is. In the northernmost partof the eastern Po Plain, it cannot be excluded that water rechargefrom the carbonate outcrops located in the Southern Alps makes theunderground flow more complex.
Permeability depends on several parameters, such as the aspectratio of the flow domain (aquifer depth respect to width) and pres-ence of faults or other discontinuities (Clauser and Villinger, 1990,Smith and Chapman, 1983). Compared with the other sedimentaryrocks, carbonates exhibit a wide variety of vertical and horizontalheterogeneities. In general, pores of the carbonates can be affectedby mineral dissolution, replacement by other minerals and re-crystallization, which take place during post-depositional processes.Porosity being equal, the permeability can show a wide variation.However, primary porosity is often poor and secondary porosity(e.g. by fissure/fracture) of tectonic origin or related to unloadingprocesses is more important. In the analyzed reservoir, water flowmight occur through micro- and macro-fractures, which might havebeen broadened by karst phenomena. At the Ferrara High and its sur-roundings, the larger temperatures observed (Fig. 11) indicate stron-ger thermal convection. This can be due to increased permeabilitycaused by tectonism yielding enhanced water circulation.
6. Conclusions
The study of groundwater circulation, which is by itself a subjectof remarkable theoretical interest, becomes particularly complexwhen tackling the interaction between water and the undergroundthermal structure. Aimed at improving the knowledge of profitablegeothermal resources in the eastern sector of the Po Plain, we ana-lyzed temperature data from several petroleum exploration wells tostudy the hydrothermal processes in the deepest part of the sedimen-tary sequence. These data are the only direct source of information onthe thermal regime of the plain.
In the deep carbonate unit at the base of the sedimentarysequence, the thermal gradient, estimated from well temperaturesby means of an inversion technique, is substantially lower than theaverage geothermal gradient. This pattern cannot be accounted for
by vertical changes of thermal properties, thus suggesting that con-vection may occur in the deep carbonate aquifer, acting as a reservoirof geothermal fluids. Since stratigraphic data show that imperviousboundary formations occur above and below the carbonate unit, it islikely that underground water can circulate by thermal, rather thanforced convection.
The potential for temperature-driven convection in the carbonateunit, heated from below by the terrestrial heat flow, was evaluated bymeans of the Rayleigh number analysis. In general, permeability larg-er than 3.0 10−15 m2 is required for the onset of convection. At theFerrara High and its surroundings, the higher temperatures recordedcould indicate local stronger convection. Within this area, there is ev-idence of lateral variation of permeability, probably caused by struc-tural differences and faulting. Additional evidence for temperature-driven convection is given by the over-heat ratio. For the carbonateunit, the over-heat ratio is compatible with convection even at wellswhere the Rayleigh number does not exceed the critical value.
In the northernmost part of Pedealpine zone, thermal convectionmight not be the only driving mechanism for underground waterflow. In the Southern Alps, where carbonates crop out acting as a re-charge area, topography induces hydrostatically driven flow, whichmay interact with the temperature-driven flow. Further studies, alsoincluding continuous thermal logs, not available so far, are necessaryto unravel the combined effect of thermal and forced convection andthe role of structural heterogeneities as well as the spatial scale of theconvective fluid system.
Acknowledgments
This work was carried out within the framework of the MIUR-2008 project “Geothermal resources of the Mesozoic basement ofthe Po basin: groundwater flow and heat transport.” The authorsthank Prof. N. Balling and an anonymous reviewer for their usefulsuggestions and comments.
References
Allegrini, G., Cappetti, G., Sabatelli, F., 1995. Geothermal development in Italy: countryupdate report: Proc. World Geotherm. Cong., 1995, Florence, Italy, 1, pp. 201–208.
Anderson, M.P., 2005. Heat as a ground water tracer. Ground Water 43, 951–968.Andrews-Speed, C., Oxburgh, P.E.R., Cooper, B.A., 1984. Temperatures and depth-
dependent heat-flow in western North Sea. AAPG Bulletin 68, 1764–1781.Aziz, K., Bories, S.A., Combarnous, M.A., 1973. The influence of natural convection in
gas, oil and water reservoirs. Journal of Canadian Petroleum Technology 12, 41–47.Baehr, H.D., Stephan, K., 1998. Heat and Mass Transfer. Springer.Bertani, R., 2010. Geothermal Power Generation in the World 2005–2010 Update
Report. Proceedings World Geothermal Congress 2010 Bali, Indonesia, pp. 25–29.Brian, J.O., McPherson, L., Chapman, D.S., 1996. Thermal analysis of the southern
Powder River Basin, Wyoming. Geophysics 61, 1689–1701.Brigaud, F., Vasseur, G., Caillet, G., 1992. Thermal state in the north Viking Graben
(North Sea) determined from oil exploration well data. Geophysics 57, 69–88.Cao, S., Lerche, I., Hermanrud, C., 1988. Formation temperature estimation by inversion
of borehole measurements. Geophysics 53, 979–988.Carella, R., Sommaruga, C., 2000. Geothermal space and agribusiness heating in Italy. Pro-
ceedings World Geothermal Congress 2000, Kyushu Tohoku, Japan, pp. 117–122.Cassano, E., Anelli, L., Fichera, R., Cappelli, V., 1986. Pianura Padana, interpretazione
integrata di dati geofisici e geologici. AGIP, Metod. Appl. Geofisiche, Milano 28.Cassano, E., Anelli, L., Fichera, R., 1990. Geophysical data along the northern Italian sec-
tor of the European Geotraverse. Tectonophysics 176, 167–182.Chapman, D.S., Keho, T.H., Baurer, M.S., Picard, M.D., 1984. Heat flow in the Uinta Basin
determined from bottom hole temperature (BHT) data. Geophysics 49, 453–466.Clauser, C., Villinger, H., 1990. Analysis of conductive and convective heat transfer in a
sedimentary basin, demonstrated for the Rheingraben. Geophysical Journal Inter-national 100, 393–414.
Conti, A., Sacchi, E., Chiarle, M., Martinelli, G., Zuppi, G.M., 2000. Geochemistry of theformation waters in the Po plain (Northern Italy): an overview. Applied Geochem-istry 15, 56–65.
Cooper, L.R., Jones, C., 1959. The determination of virgin strata temperatures from ob-servations in deep survey boreholes. Geophysical Journal of the Royal Astronomi-cal Society 2, 116–131.
Costa, M., 2003. The buried, Apenninic arcs of the Po Plain and northern Adriatic Sea(Italy): a new model. Bollettino della Societa Geologica Italiana 122, 3–23.
Deming, D., 1989. Application of bottom-hole temperature corrections in geothermalstudies. Geothermics 18, 775–786.
12 V. Pasquale et al. / Tectonophysics 594 (2013) 1–12
Deming, D., Chapman, D.S., 1988a. Heat flow in the Utah–Wyoming Thrust Belt fromanalysis of bottom-hole temperature data measured in oil and gas wells. Journalof Geophysical Research 93, 13657–13672.
Deming, D., Chapman, D.S., 1988b. Inversion of bottom-hole temperature data: thePineview field, Utah–Wyoming thrust belt. Geophysics 53, 707–720.
Domenico, P.A., Schwartz, W., 1998. Physical and Chemical Hydrogeology, 2nd ed.Wiley.
Dondi, L., 1985. Pianura Padana: paleogeografia dall'Oligocene superiore al Pleistocene.Atti del Seminario Progetto Cartografia Geologica, Regione Emilia Romagna,Bologna. 76–101.
Duchi, V., Venturelli, G., Boccasavia, I., Bonicoli, F., Ferrari, C., Poli, D., 2005. Studiogeochimico dei fluidi dell'Appennino Tosco Emiliano Romagnolo. Bollettino dellaSocieta Geologica Italiana 124, 475–491.
Forster, C., Smith, L., 1989. The influence of groundwater flow on thermal regimes inmountainous terrain: a model study. Journal of Geophysical Research 94, 9439–9451.
Frumkin, A., Gvirtzman, H., 2006. Cross-formational rising groundwater at an artesiankarstic basin: the Ayalon Saline Anomaly, Israel. Journal of Hydrology 318,316–333.
Garg, S.K., Kassoy, D.R., 1981. Convective heat and mass transfer in hydrothermal sys-tems. In: Rybach, L., Muffler, L.J.P. (Eds.), Geothermal Systems. Wiley, pp. 37–76.
Gianelli, G., Puxeddu, M., Batini, F., Bertini, G., Dini, I., Panderi, E., Nicolich, R., 1988.Geological model of a young volcano–plutonic system: the geothermal region ofMonte Amiata (Tuscany, Italy). Geothermics 17, 27–36.
Goldscheider, N., Mádl-Szőmyi, J., Erőss, A., Schill, E., 2010. Review: thermal waterresources in carbonate rock aquifers. Hydrogeology Journal 18, 1303–1318.
Haenel, R., Rybach, L., Stegena, L., 1988. Handbook of Terrestrial Heat-Flow DensityDetermination. Kluwer Academic Publishers, Dordrecht.
Hanano, M., 1998. A simple model of a two-layered high-temperature liquid-dominatedgeothermal reservoir as a part of a large-scale hydrothermal convection system.Transport in Porous Media 33, 3–27.
Herbert, A., Jackson, C., Lever, D., 1988. Coupled groundwater flow and solute transportwith fluid density strongly dependent upon concentration. Water ResourcesResearch 24, 1781–1795.
Holzbecher, E.O., 1998. Modeling Density-Driven Flow in Porous Media. SpringerVerlag, Berlin.
Horner, D.R., 1951. Pressure build-up in wells. Proceedings of the Third World PetroleumCongress 2, 924–931.
Horton, C.W., Rogers Jr., F.T., 1945. Convection currents in a porous medium. Journal ofApplied Physics 16, 367–370.
Kestin, J., Khalifa, H., Correia, R., 1981. Tables of the dynamic and kinematic viscosity ofaqueous NaCl solutions in the temperature range 20–150 °C and the pressurerange 0.1–35 MPa. Journal of Physical and Chemical Reference Data 10, 71–87.
Kühn, M., Dobert, F., Gessner, K., 2006. Numerical investigation of the effect of hetero-geneous permeability distributions on free convection in hydrothermal system atMount Isa, Australia. Earth and Planetary Science Letters 244, 655–671.
Lapwood, E.R., 1948. Convection of a fluid in a porous medium. Proceedings of theCambridge Philological Society 44, 508–521.
Lee, T.C., 1982. Estimation of formation temperature and thermal property fromdissipation of heat generated by drilling. Geophysics 47, 1577–1584.
Lee, Y., Deming, D., Chen, K.F., 1996. Heat flow and heat production in the ArkomaBasin and Oklahoma Platform, southeastern Oklahoma. Journal of GeophysicalResearch 101, 25387–25401.
Luheshi, M.N., 1983. Estimation of formation temperature from borehole measurements.Geophysical Journal of the Royal Astronomical Society 74, 747–776.
Manning, C.E., Ingebritsen, S.E., 1999. Permeability of the continental crust: implica-tions of geothermal data and metamorphic systems. Reviews of Geophysics 37,127–150.
Menke, W., 1989. Geophysical Data Analysis: Discrete Inverse Theory. Academic Press,NY.
Middleton, M.F., 1979. A model for bottom hole temperature stabilization. Geophysics44, 1458–1462.
Murphy, H.D., 1979. Convective instabilities in vertical fractures and faults. Journal ofGeophysical Research 84, 6121–6130.
Nielsen, S.B., Balling, N., Christiansen, H.S., 1990. Formation temperatures determinedfrom stochastic inversion of borehole observations. Geophysical Journal Interna-tional 101, 581–590.
Ori, G.G., Friend, P.F., 1984. Sedimentary basins formed and carried piggyback on activethrust sheets. Geology 12, 475–478.
Pasquale, V., 2011. Geofisica, Edizioni Culturali Internazionali Genova, Genova.Pasquale, V., Verdoya, M., Chiozzi, P., 1993. Thermal effects of the dynamic activity
from the Ligurian Sea to the Eastern Alps. Annals of Geophysics 36, 91–104.Pasquale, V., Verdoya, M., Chiozzi, P., 2003. Heat flux budget in the southeastern conti-
nental margin of the Tyrrhenian basin. Physics and Chemistry of the Earth 28,407–420.
Pasquale, V., Chiozzi, P., Gola, G., Verdoya, M., 2008. Depth time correction of petro-leum bottom hole temperatures in the Po Plain, Italy. Geophysics 6, E187–E197.
Pasquale, V., Chiozzi, P., Verdoya, M., 2010. Tectonothermal processes and mechanicalstrength in a recent orogenic belt: Northern Apennines. Journal of GeophysicalResearch 115, 147–163.
Pasquale, V., Gola, G., Chiozzi, P., Verdoya, M., 2011. Thermophysical properties of thePo Basin rocks. Geophysical Journal International 186, 69–81.
Pasquale, V., Chiozzi, P., Verdoya, M., Gola, G., 2012. Heat flow in the Western Po Basinand surrounding orogenis belts. Geophysical Journal International 190, 8–22.
Pestov, I., 2000. Thermal convection in the Great Artesian Basin, Australia. WaterResources Management 14, 391–403.
Phillips, O.M., 1991. Flow and Reactions in Permeable Rocks. Cambridge UniversityPress.
Pieri, M., Groppi, G., 1981. Subsurface geological structure of the Po Plain, Italy. ConsiglioNazionale delle Ricerche, Progetto Finalizzato Geodinamica Sottoprogetto “Modellostrutturale”, Pubbl. n. 414 del Progetto Finalizzato Geodinamica. CNR, Roma, p. 32.
Raffensperger, J.P., Vlassopoulos, D., 1999. The potential for free convection in sedi-mentary basins. Hydrogeology Journal 7, 505–520.
Reiter, M.A., Jessop, A.M., 1985. Estimates of terrestrial heat flow in offshore easternCanada. Canadian Journal of Earth Sciences 22, 1503–1517.
Scott, G.N., 1982. Temperature equilibration in boreholes: A statistical approach, M.S.Thesis, University of Michigan, pp. 63.
Sekiguchi, K., 1984. A method for determining terrestrial heat flow in oil basinal areas.Tectonophysics 103, 67–79.
Shen, P.Y., Beck, A.E., 1986. Stabilisation of bottom hole temperature with finite circu-lation time and fluid flow. Geophysical Journal of the Royal Astronomical Society86, 63–90.
Smith, L., Chapman, D.S., 1983. On the thermal effects of groundwater flow 1: regionalscale systems. Journal of Geophysical Research 88, 593–608.
Somerton, W.H., 1992. Thermal Properties and Temperature Related Behaviour ofRock/Fluid Systems. Elsevier, Amsterdam.
Sommaruga, C., Verdiani, G., 1991. Elementi di Geotermia. Cooperativa UniversitariaStudio Lavoro, Milano.
Sommaruga, C., Verdiani, G., 1995. Geotermia Principi, ricerca, produzione. La NuovaItalia Scientifica, Roma.
Speece, M.A., Bowen, T.D., Folcik, J.L., Pollack, H.N., 1985. Analysis of temperatures insedimentary basins: the Michigan Basin. Geophysics 50, 1318–1334.
Tóth, J., 1995. Hydraulic continuity in large sedimentary basins. Hydrogeology Journal3, 4–16.
Turcotte, D., Schubert, G.L., 2002. Geodynamics Application of Continuum Physics toGeological Problems, 2nd ed. Cambridge University Press.
Verdoya, M., Pasquale, V., Chiozzi, P., 2005. Thermo-mechanical evolution and rheologyof the northern sector of the Tyrrhenian–Apennines system. Journal of Volcanologyand Geothermal Research 148, 20–30.
Willett, S.D., 1990. Stochastic inversion of thermal data in a sedimentary basin: resolvingspatial variability. Geophysical Journal International 103, 321–339.
Willett, S.D., Chapman, D.S., 1987. Analysis of temperatures and thermal processes inthe Uinta Basin. Canadian Society of Petroleum Geologists Memoir 12, 447–461.
Wood, J.R., Hewett, T.A., 1982. Fluid convection andmass transfer in porous sandstones—a theoretical model. Geochimica et Cosmochimica Acta 46, 1707–1713.
Zhao, C., Hobbs, B.E., Muhlhaus, H.B., Ord, A., Lin, G., 2003. Convective instability of 3-Dfluid saturated geological fault zones heated from below. Geophysical JournalInternational 155, 213–220.