Annexed EEG Meditation, Graphic full visual EEG experimentation process meditation

Intern. J . Neuroscience, 1992. Vol. 67, pp. 199-213 Reprints available directly from the publisher Photocopying permitted by license only
0 1992 Gordon and Breach Science Publishers S.A. Printed in the United States of America
EVENT-RELATED PROLONGATION OF INDUCED EEG RHYTHMICITIES
IN EXPERIMENTS WITH A COGNITIVE TASK
VASIL KOLEV
Brain Research Institute, Bulgarian Academy of Science, Acad. G . Bonchev Street, Bl. 23, 1113 Sofa , Bulgaria
and
MARTIN SCHURMANN
Institute of Physiology, Medical University Liibeck, Ratzeburger Allee 160. 2400 Liibeck I , Germany
(Received March 18, 1992)
Since we consider evoked potentials (EPs) and event-related potentials (ERPs) as an ensemble of induced rhythmicities we investigated ‘sensory” evoked potentials (EPs) and ‘cognitive” event-related potentials (ERPs) with respect to their frequency components (around 5 Hz and around 10 Hz). ‘Sensory” EP sessions consisted in standard EP measurements with tone bursts of 2000 Hz frequency. Prior to the subsequent ’cognitive” sessions, the subjects were instructed to expect frequent 2000 Hz tones and rare 1950 Hz tones, the rare tones thus being difficult to detect. A further instruction was to count the number of the “rare” stimuli. Not a single tone of different frequency, however, was presented. The single trials were then analyzed with respect to their 5 Hz and 10 Hz components. Time-locking was investigated using a modified single sweep wave identification (SSWI) method. Depending on features of the pre- stimulus EEG, it was observed that theta (4-7 Hz) and alpha (7-13 Hz) responses were pro- longed in the case of ’cognitive” sessions. We believe that the prolonged endogenous ERP components are induced rhythmicities triggered by additional information processing, when a high degree of un- certainty has to be resolved during our experimental conditions. For the analysis and visualization of these phenomena, the combination of digital filtering and SSWI showed relevant advantages in com- parison to other methods.
Keywords: Induced rhythmicity. evoked potentials (EPs) . event-related potentials (ERPs). 5 H z response, 10 H z response.
In a recent workshop of the Neuroscience Research Program on “Induced rhythms in the brain” some of the authors stated that single trial evoked potentials may be regarded as examples of “induced rhythmicities” (BaSar & Bullock 1992). By “in- duced rhythmicities“ we understand “oscillations caused or modulated by stimuli that do not directly drive successive cycles, forming a category distinct from spontaneous and from driven oscillations” (Bullock 1992).
Please mail correspondence to Dr. M. Schiirmann. This research was supported by DFG grant 436 BUL-112/40/90 to Dr. V. Kolev. We are grateful
to Dr. E. Rahn and to Dr. Yordanova for valuable discussion, to Dip1.-Ing. F. Greitschus for program development and to B. Stier for excellent technical assistance.
199
Int J
Neu
rosc
i Dow
nloa
ded
from
info
rmah
ealth
care
.com
by
Lul
ea U
nive
rsity
Of
Tec
hnol
ogy
on 0
8/08
/13
For
pers
onal
use
onl
y.
200 V. KOLEV AND M. SCHCJRMANN
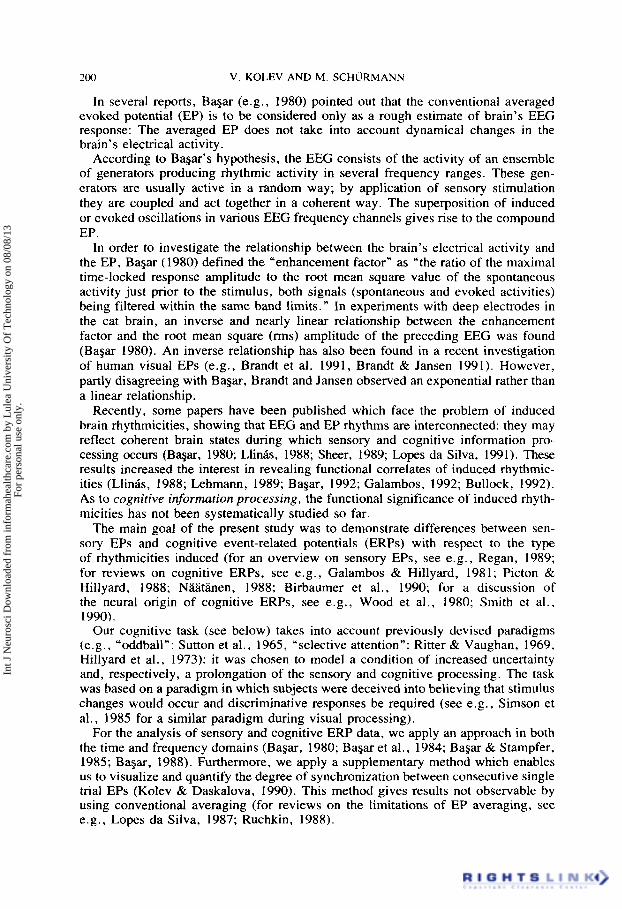
In several reports, Bagar (e.g., 1980) pointed out that the conventional averaged evoked potential (EP) is to be considered only as a rough estimate of brain’s EEG response: The averaged EP does not take into account dynamical changes in the brain’s electrical activity.
According to Bagar’s hypothesis, the EEG consists of the activity of an ensemble of generators producing rhythmic activity in several frequency ranges. These gen- erators are usually active in a random way; by application of sensory stimulation they are coupled and act together in a coherent way. The superposition of induced or evoked oscillations in various EEG frequency channels gives rise to the compound EP.
In order to investigate the relationship between the brain’s electrical activity and the EP, Bagar (1980) defined the “enhancement factor” as “the ratio of the maximal time-locked response amplitude to the root mean square value of the spontaneous activity just prior to the stimulus, both signals (spontaneous and evoked activities) being filtered within the same band limits.” In experiments with deep electrodes in the cat brain, an inverse and nearly linear relationship between the enhancement factor and the root mean square (rms) amplitude of the preceding EEG was found (BaSar 1980). An inverse relationship has also been found in a recent investigation of human visual EPs (e.g., Brandt et al. 1991. Brandt & Jansen 1991). However, partly disagreeing with Bagar, Brandt and Jansen observed an exponential rather than a linear relationship.
Recently, some papers have been published which face the problem of induced brain rhythmicities, showing that EEG and EP rhythms are interconnected: they may reflect coherent brain states during which sensory and cognitive information pro- cessing occurs (Bqar, 1980; Llink, 1988; Sheer, 1989; Lopes da Silva, 1 9 9 1 ) . These results increased the interest in revealing functional correlates of induced rhythmic- ities (Llinis, 1988; Lehmann, 1989; Bagar, 1992; Galambos, 1992; Bullock, 1992). As to cognitive information processing, the functional significance of induced rhyth- micities has not been systematically studied so far.
The main goal of the present study was to demonstrate differences between sen- sory EPs and cognitive event-related potentials (ERPs) with respect to the type of rhythmicities induced (for an overview on sensory EPs, see e.g., Regan, 1989; for reviews on cognitive ERPs, see e.g., Galambos & Hillyard, 1981; Picton & Hillyard, 1988; Naatiinen, 1988; Birbaumer et al., 1990; for a discussion of the neural origin of cognitive ERPs, see e.g., Wood et al., 1980; Smith et al.. 1990).
Our cognitive task (see below) takes into account previously devised paradigms (e.g., “oddball”: Sutton et al., 1965, “selective attention”: Ritter & Vaughan, 1969. Hillyard et al., 1973): it was chosen to model a condition of increased uncertainty and, respectively, a prolongation of the sensory and cognitive processing. The task was based on a paradigm in which subjects were deceived into believing that stimulus changes would occur and discriminative responses be required (see e.g., Simson et al., 1985 for a similar paradigm during visual processing).
For the analysis of sensory and cognitive ERP data, we apply an approach in both the time and frequency domains (Bagar, 1980; Bagar et al., 1984; Bagar & Stampfer. 1985; Bagar, 1988). Furthermore, we apply a supplementary method which enables us to visualize and quantify the degree of synchronization between consecutive single trial EPs (Kolev & Daskalova, 1990). This method gives results not observable by using conventional averaging (for reviews on the limitations of EP averaging, see e.g., Lopes da Silva, 1987; Ruchkin, 1988).
Int J
Neu
rosc
i Dow
nloa
ded
from
info
rmah
ealth
care
.com
by
Lul
ea U
nive
rsity
Of
Tec
hnol
ogy
on 0
8/08
/13
For
pers
onal
use
onl
y.

PROLONGED EEG RHYTHMICITIES 20 I
METHODS
Experimental Methods and Procedures
The experiments were canied out with 9 healthy volunteer subjects (mostly students) aged between 20 and 22 years. The EEG was recorded in frontal, vertex and parietal locations against an earlobe reference (Fz, Cz and Pz in the 10/20 international system). The bioelectrical signals were amplified with band limits of 0.5 and 70 Hz by using a Schwarzer EEG machine. The subjects sat in a soundproof and echo-free room that was dimly illuminated. As auditory stimulation 2000 Hz 60 dB tones of lo00 ms duration were applied with intervals varying randomly between 1.5 and 3.5 s.
We used methods of EP component analysis in both time and frequency domains, which included EEG-EP evaluation, computation of the amplitude frequency char- acteristics and response adaptive filtering (for details, see Bapr , 1980). For esti- mation of wave time-locking and synchronization we modified a method of single sweep wave extrema identification, based on our earlier studies (Kolev & Daskalova, 1990). The short description of the methods used is as follows (Fig. 1 is an overview of the methods presented and their relationship to each other).
a) Recording of EEG-EP epochs: with every stimulus presented segments of 1024 ms EEG activity preceding and 1024 ms of evoked activity following the stimulus were digitized with a sampling rate of 250 Hz. The epochs digitized were labeled and stored on computer disc memory.
b) Selection of single sweep EEG-EP epochs for averaging and further processing: The stored raw single EEG-EP epochs were selected with specified criteria off-line: EEG segments showing slow waves, sleep spindles, movement or ocular artifacts were eliminated.
c) Computation of amplitude frequency characteristics: The selectively averaged EPs were transformed to the frequency domain with fast Fourier transform (FIT) in order to obtain the amplitude frequency characteristics IG(jw)l:
where c(t) is the step response of the system, here, the sensory evoked potential. For details of the transient response frequency characteristics method see Bapr (1980).
d) Digital filtering: Ideal digital filtering (Bapr, 1980) which provides zero phase shift was used to compute EP frequency components. The band limits of the digital filters were chosen according to the local maxima of amplitude frequency charac- teristics.
e) Computation of enhancement factors: For each filtered single EEG-EP epoch the ratio of the maximal response amplitude to the root mean square (rms) value of the spontaneous activity amplitude just prior to the stimulus was calculated (Bapr, 1980).
f) Single sweep wave identification (SSWI): The single EEG-EP sweeps were dig- itally band-pass filtered in the appropriate frequency ranges. The locations of their wave extrema-maxima and minima-on the time axis were determined as de- scribed by Kolev & Daskalova (1990). For each time interval, e.g., 8 ms, the fol- lowing steps were performed:
Int J
Neu
rosc
i Dow
nloa
ded
from
info
rmah
ealth
care
.com
by
Lul
ea U
nive
rsity
Of
Tec
hnol
ogy
on 0
8/08
/13
For
pers
onal
use
onl
y.

202 V. KOLEV AND M. SCHUKMANN
Singlo sweep 1-1 EEG-€Pa
L 1
histogram I 7.
of ovorogod
and hl8togmm. f i l t ~ n d EEC-EP.
FIGURE I TRFC-transient response frequency characteristics method. (;Cjw)-amplitude frequency characteristic of the EPs, A(0-frequency characteristics of the digital filters. chosen according to the maxima in amplitude fre- quency characteristics, EHFA-calculation of enhancement factors. SSWI-single sweep wave identification (for details see text and Fig. 2). The arrows mark the stimulus onset.
Schematic representation o f the experimental methods:
Int J
Neu
rosc
i Dow
nloa
ded
from
info
rmah
ealth
care
.com
by
Lul
ea U
nive
rsity
Of
Tec
hnol
ogy
on 0
8/08
/13
For
pers
onal
use
onl
y.

PROLONGED EEG RHYTHMICITIES
Sum of counts
- l o -5 I 0
’ I I I 10 . . . . . . . . . . . . . . . . . . . . . . . . . . . . . . . . . . . . . . . . .
203
-1OOO -500 0 500 1000 ms
FIGURE 2 SSWI histogram visualizing the time-locking of single sweep components: in all t i l t e d sweeps maxima and minima were detected. In each time interval-e.g. 8 ms-the height of the his- togram bar refers to ”sum ofcounrs”, i.e.: the number of sweeps showing a maximum in this interval minus the number of sweeps showing a minimum in this interval (see text).
1 . The sweeps showing a maximum in this interval were counted giving counts (max); the sweeps showing a minimum in this interval were counted giving counts (min).
2. The sum of counts for the interval was computed: sum of counts = counts (max)-counts (min).
3. The sum of counts was displayed as a histogram bar.
A typical result is shown in Fig. 2. So far, this analysis has been performed for vertex (Cz) data. Evaluations of data from the remaining electrode positions, how- ever, are planned.
The use of SSWI for analysis of single EP (or ERP) dynamics permits us to assess phenomena unobservable using conventional averaging. These phenomena are re- lated to EP component-detection and their variation during the experimental session. The method presented seems to be useful in the case of confluent or lacking EP components (Kolev & Daskalova, 1990). In this study we give another application of the method: identification of time-locking of filtered EEG-EP epochs.
Experimental Paradigm
For the first experimental session the subjects were instructed to sit quietly with open eyes and to ignore the stimuli (experimental session with “passive listening” to iden- tical auditory stimuli).
For the second experimental session the subject’s instruction was to follow the stimuli carefully, to try to detect and to count -rare” tones of 1950 Hz frequency
Int J
Neu
rosc
i Dow
nloa
ded
from
info
rmah
ealth
care
.com
by
Lul
ea U
nive
rsity
Of
Tec
hnol
ogy
on 0
8/08
/13
For
pers
onal
use
onl
y.

203 V . KOLEV AND M. SCHURMANN
(experiment “with task”). Prior to the experiments 20 tones with alternating fre- quencies (2000 and 1950 Hz) were demonstrated to the subjects. During the exper- iment, however, the same stimulus sequence as in the first experiment (80 auditory stimuli of 2000 Hz) was administered. Thus, the task used in the second experimental session served to increase the subjects’ attention to the stimulus sequence and models a condition of increased uncertainty. It was expected that, during this experimental session, a prolongation of the sensory and cognitive processing occurs.
The subjects’ verbal reports after the experiments were different; some of them reported that they had counted 2-4 rare tones, some 12-14, or 35-40 and only 2 subjects reported correctly zero tones. All subjects also reported difficulties in con- centrating during the experimental session.
Enhancement Factors for Single EEG-EP Epochs
By choosing sweeps with high enhancement factors (see above), “a relcvant signal/ noise ratio can be obtained with only a very small number of sweeps” (Bagar, 1988).
In earlier studies (BaSar, 1980) an inverse and nearly linear relationship between enhancement factor and prestimulus EEG was reported in experiments with deep electrodes in cat brain. As to human visual EPs, Brandt and Jansen (1991) confirmed a general inverse relationship between enhancement and prestimulus alpha ampli- tude.
We investigated the relation between enhancement factor and rms amplitude of the preceding EEG, forming the scatter chart of enhancement factor versus r m s (Fig. 3; Schunnann & Kolev, unpublished results). In order to obtain comparable results for different subjects, nns amplitudes in single sweeps were normalized according to the formula:
X ( i ) = [rms(i) - RMS]/SD,
where X(i) is the normalized r m s amplitude (x-axis in Fig. 3); rms(i) is the rms value in sweep i; RMS is the mean rms value and SD is the standard deviation. The nor- malization was thus different for each subject.
It could be seen that the points on the scatter chart follow approximately the in- verse linear dependence described previously (Bagar, 1980). Studying human EEG- EP epochs, Bagar concluded that the most distinct averaged EPs are observed when the single sweep EEG-EP epochs have large enhancement factors (e.g., greater than I .5) and small rms values (Bagar, 1988). About 50% of the points fulfil the condition of enhancement factor greater than 1.5 and rms amplitude less than mean r m s value. Our attention was especially paid to the single sweep EEG-EP epochs satisfying this condition.
RESULTS
Comparison Between Filtered EEG-EP Epochs and SSWI Histograms Computed From Sensory and Cognitive Experiments
Filtered averaged EEG-EPs and SSWl histograms; theta range (4-7 H z ) For the estimation of synchronization phenomena in the theta range both averaged EPs and single sweep EPs were filtered in the 4-7 Hz range. The resulting averaged EPs and SSWI histograms for 4 representative subjects, one sensory and one cognitive ex-
Int J
Neu
rosc
i Dow
nloa
ded
from
info
rmah
ealth
care
.com
by
Lul
ea U
nive
rsity
Of
Tec
hnol
ogy
on 0
8/08
/13
For
pers
onal
use
onl
y.

PROLONGED EEG RHYTHMICITIES 205
EH FA
1 12.9
-2 -1
23.2 A
A
A A
A
21
A
A
-
A
0 1 2 SD RGURE 3 Scatter chart of enhancement factor (EHFA) versus root mean square (rms) amplitude ob- tained from 9 subjects (sensory EP session without task; lead: Cz; filter limits 1 to 30 Hz). The r m s amplitudes for each subject are normalized in order to make adequate comparisons (see text). The vertical line represents mean nns value, the horizontal line refers to an enhancement factor of 1.5; for each "quadrant" the percentage of scatter chart points is given. SD, standard deviation
periment each, are seen in Fig. 4. It can be seen that during the session with task the number of synchronized waves included in the EP components in the 50-500 ms range was greater than without task. Moreover time-locked theta rhythms up to 800-1000 ms after stimulus were present, whereas in the case of acoustical stimu- lation without task the time-locked components are observable up to 300-450 ms. As the heights of the histogram bars refer to the number of synchronized sweeps, it can be concluded that the variability among different single waves observed in the experiment with task is lower. The time-locked waves observed in the second ex- periment, with task, persisted in the time range about twice as long as in the case of experiments without task.
Alpha range (7-13 H z ) The averaged EEG-EP epochs of 4 representative subjects were filtered in the 7-13 Hz range giving the curves shown in Fig. 5. The corre- sponding single EEC-EP epochs were filtered in the same range and evaluated using the SSWI method. The resulting histograms are also shown in Fig. 5. A prolongation of the alpha response (time-locked wave components) can be seen during the ex- periment with task up to 800-1000 ms after stimulus presentation, whereas in ex- periments without task there were time-locked waves up to 350-400 ms, i.e., the time-locked alpha waves in the cognitive experiment persist about 2.5-3 times longer than in the case of passive listening.
The results reported were observed for all 9 subjects studied; however, in two of them the differences were less marked.
Int J
Neu
rosc
i Dow
nloa
ded
from
info
rmah
ealth
care
.com
by
Lul
ea U
nive
rsity
Of
Tec
hnol
ogy
on 0
8/08
/13
For
pers
onal
use
onl
y.

206 V. KOLEV AND M. SCHURMANN
A pv Subject 1 -5 1
5 L~.-,----.----.---.- -loo0 -500 0 500 loo0 ms
pv Subject 3 -5 1
-2.5
0
2.5
5 1u--- -loo0 -500 0 500 loo0 ms
-2.5
0
2.5
-1orm -500 0 500 loo0 ms
A ” Subject 8
-5 1
-loo0 -500 0 500 loo0 ms
1 -10 1
A -10
-5
0
5
10 -loo0 -500 0 500 lo00 ms
I\ -10
-5
0
5
FIGURE 4 Filtered averaged EEG-EPs (lead: Cz) and corresponding SSWI histograms from all single sweeps for 4 subjects in experimental session without (left column) and with task (right column). Fre- quency limirs are 4 to 7 H:. Along the left y-axis: amplitudes of EPs in p V (referring to curve), along the right y-axis: sum of counts (referring to SSWI histograms bars; for computation. see Fig. 2). Time interval for histogram plotting: 8 ms.
Int J
Neu
rosc
i Dow
nloa
ded
from
info
rmah
ealth
care
.com
by
Lul
ea U
nive
rsity
Of
Tec
hnol
ogy
on 0
8/08
/13
For
pers
onal
use
onl
y.

PROLONGED EEG RHYTHMICITIES 201
Sum of caunls
-10
-5
0
5
10 - . -loo0 -500 0 500 1oM) ms -1m -500 0 500 1wO ms
-10
-5
0
5
5 4 . . . . . . . . - . . -lo00 -m 0 500 loo0 ms -loo0 -500 0 500 loo0 m
-10
-5
0
5
5 4 . . . . . . 7 . . . . . -lo00 -500 0 500 loo0 ms -1000 -500 0 so0 ldoo ms1°
Subject9 -5 1 -10
-25 -5
0 0
2.5 5
10 -..-- -7_--- . . . -loo0 -500 0 500 1mms -loo0 -500 0 500 loo0 ms
FIGURE 5 Filtered averaged EEG-EPs (lead: Cz) and corresponding SSWI histograms from all single sweeps for 4 subjects in experimental session without (left column) and with task (right column). Fre- quency limits ure 7 ro I3 Hz. Along the left y-axis: amplitudes of EPs in pV (referring to curve), along the right y-axis: sum of counts (referring to SSWI histograms bars; for computation, see Fig. 2). Time interval for histogram plotting: 8 ms.
Alpha Discharge Waves Under “Small Signal” Amplitude Conditions In experiments with passive listening to auditory stimuli, we compared sensory EEG- EPs with pronounced spontaneous alpha activity to EEG-EPs with =small signal”
Int J
Neu
rosc
i Dow
nloa
ded
from
info
rmah
ealth
care
.com
by
Lul
ea U
nive
rsity
Of
Tec
hnol
ogy
on 0
8/08
/13
For
pers
onal
use
onl
y.

208
PV
V . KOLEV AND M . SCHURMANN
-5
0
5
FIGURE 6 Thick line: Average of EEG-EP epochs satisfying the condition: (a): enhancement factor > 1.5. rms < mean rms value: thin line: average of EEG-EP epochs satisfying the condition: (b) en- hancement factor < I .5, rms < mean rms value during the experiment with passive listening to auditory stimuli. Lead: Cz, filter limits: 7 to 13 Hz. Note the well distinct alpha discharge after 400 ms in (b).
prestimulus EEG. For this purpose we computed enhancement factors in 1-30 Hz filtered EEG-EP epochs with “low” rms values (less than mean r m s value) in order to separate the epochs into subgroups: group a contained epochs with enhancement factors greater than 1.5; group b-sweeps with enhancement factors less than 1.5. Alpha components of group b averages (“small signal” conditions) showed marked enhancement of alpha discharge patterns in comparison with group a averages (Fig. 6). That is, if “small signal” conditions are fulfilled, more synchronized waves in the 400-1000 ms range of the single sweep EPs were observed.
DISCUSSION
In the experiments with sensory EPs and cognitive ERPs we observed a new result concerning dynamic properties of ERP frequency components: time-locking of 10 Hz and 5 Hz waves up to 800-1000 ms after stimulus presentation during the ex- periment with task. The prolonged time-locking is well demonstrated by combined using of both digital filtering and SSWI methods.
What Does the Prolongation of Theta and Alpha Responses Mean in the Scope o.f Brain-Induced Rhythmicities?
Based on experimental observations ranging from cellular level to field potential level, as well as on theoretical considerations of dynamic systems theory, Bagar ( 1 992) suggests that induced rhythmicities reflect most important functional activities
Int J
Neu
rosc
i Dow
nloa
ded
from
info
rmah
ealth
care
.com
by
Lul
ea U
nive
rsity
Of
Tec
hnol
ogy
on 0
8/08
/13
For
pers
onal
use
onl
y.
PROLONGED EEG RHYTHMICITIES 209
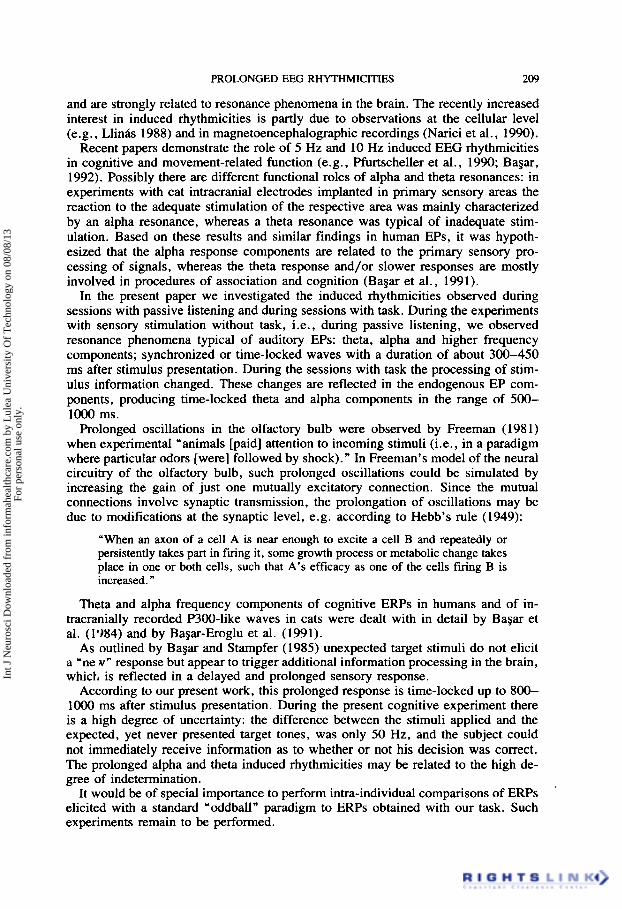
and are strongly related to resonance phenomena in the brain. The recently increased interest in induced rhythmicities is partly due to observations at the cellular level (e.g., Llink 1988) and in magnetoencephalographic recordings (Narici et al., 1990).
Recent papers demonstrate the role of 5 Hz and 10 Hz induced EEG rhythmicities in cognitive and movement-related function (e.g., Pfurtscheller et al., 1990; BaSar, 1992). Possibly there are different functional roles of alpha and theta resonances: in experiments with cat intracranial electrodes implanted in primary sensory areas the reaction to the adequate stimulation of the respective area was mainly characterized by an alpha resonance, whereas a theta resonance was typical of inadequate stim- ulation. Based on these results and similar findings in human EPs, it was hypoth- esized that the alpha response components are related to the primary sensory pro- cessing of signals, whereas the theta response and/or slower responses are mostly involved in procedures of association and cognition (Bagar et al., 1991).
In the present paper we investigated the induced rhythmicities observed during sessions with passive listening and during sessions with task. During the experiments with sensory stimulation without task, i.e., during passive listening, we observed resonance phenomena typical of auditory EPs: theta, alpha and higher frequency components; synchronized or time-locked waves with a duration of about 300-450 ms after stimulus presentation. During the sessions with task the processing of stim- ulus information changed. These changes are reflected in the endogenous EP com- ponents, producing time-locked theta and alpha components in the range of 500- 1OOO ms.
Prolonged oscillations in the olfactory bulb were observed by Freeman (198 1) when experimental “animals [paid] attention to incoming stimuli (i.e., in a paradigm where particular odors [were] followed by shock).” In Freeman’s model of the neural circuitry of the olfactory bulb, such prolonged oscillations could be simulated by increasing the gain of just one mutually excitatory connection. Since the mutual connections involve synaptic transmission, the prolongation of oscillations may be due to modifications at the synaptic level, e.g. according to Hebb’s rule (1949):
“When an axon of a cell A is near enough to excite a cell B and repeatedly or persistently takes part in firing it, some growth process or metabolic change takes place in one or both cells, such that A’s efficacy as one of the cells firing B is increased.
Theta and alpha frequency components of cognitive ERPs in humans and of in- tracranially recorded P300-like waves in cats were dealt with in detail by Bagar et al. (1’384) and by BaSar-Eroglu et al. (1991).
As outlined by Bagar and Stampfer (1985) unexpected target stimuli do not elicit a “ne w n response but appear to trigger additional information processing in the brain, which is reflected in a delayed and prolonged sensory response.
According to our present work, this prolonged response is time-locked up to 800- 1OOO ms after stimulus presentation. During the present cognitive experiment there is a high degree of uncertainty: the difference between the stimuli applied and the expected, yet never presented target tones, was only 50 Hz, and the subject could not immediately receive information as to whether or not his decision was correct. The prolonged alpha and theta induced rhythmicities may be related to the high de- gree of indetermination.
It would be of special importance to perform intra-individual comparisons of ERPs elicited with a standard ‘oddball” paradigm to ERPs obtained with our task. Such experiments remain to be performed.
Int J
Neu
rosc
i Dow
nloa
ded
from
info
rmah
ealth
care
.com
by
Lul
ea U
nive
rsity
Of
Tec
hnol
ogy
on 0
8/08
/13
For
pers
onal
use
onl
y.

210 V . KOLEV AND M . SCHUKMANN
-
1" ' O I t
I V
-500 0 50C 1000 ms
b)
ms
FIGUKE 7 Superimposed single sweep EEG-EP epochs (N=2.5), filtered in the range 7-13 Hr. for a subject from our experiments during (a) passive listening to identical auditory stimuli and (h) cognitive task. The stimulus onset is at 0 ms.
For some subjects a prolongation of simultaneously recorded theta and alpha re- sponses could be seen (Fig. 4 and Fig. 5). Such phenomena may be described in terms of global interacting brain systems, defined as a diffuse 'alpha response sys- tem" and a diffuse "theta response system" (Bagar, 1991).
It is interesting to note that all attempts to find prolonged theta and alpha phe- nomena with other methods were without success. Only the superposition of filtered single sweep EEG-EP epochs gave a satisfactory result (Fig. 7). The investigation of the cross-correlation coefficients, in the 400- loo0 ms range, between successive single sweeps did not give markedly different results for both experiments.
I s There an Adequate Method for Obtaining the Alpha Discharge PhenornenaY
As we pointed out, there exist some amplitude criteria which are optimal to obtaining alpha discharge phenomena. These observations were made in the normal sensory auditory EPs experiments with subjects showing abundant alpha rhythm. The con-
Int J
Neu
rosc
i Dow
nloa
ded
from
info
rmah
ealth
care
.com
by
Lul
ea U
nive
rsity
Of
Tec
hnol
ogy
on 0
8/08
/13
For
pers
onal
use
onl
y.

PROLONGED EEG RHYTHMICITIES 21 1
ditions fulfilled are “small signal” conditions (enhancement factor less than 1.5 and rms amplitude less than the mean value). It was shown (Bqar, 1988) that low am- plitude prestimulus alpha activity is associated with high amplitude poststimulus al- pha enhancement and vice versa. Moreover, if poststimulus alpha blocking occurs, there is usually evidence of an after-discharge phenomenon. Our present experiments confirm these findings and extend the observations on “small signal” conditions. The above-mentioned results support the existence of a functional relation between post- and prestimulus activity in the alpha band. When the ‘small signal” conditions are fulfilled the presence of both exogenous and alpha discharge components could be expected.
Investigating the Relationship between Prestimulus EEG and EP by Using the Enhancement Factor
According to earlier studies by BaSar (e.g., 1980) the relationship between enhance- ment factor and rms amplitude of the preceding EEG is nearly linear in experiments with deep electrodes in cat brain. This relationship could be used for predicting EP components. A similar conclusion was drawn for human EEG-EP epochs where the most distinct averaged EPs are observed when the single sweep EEG-EP epochs have large enhancement factors (e.g. greater than 1.5) and small rms values (Bagx, 1988).
Brandt and Jansen (1991, Brandt et al. 1991) observed a significant positive cor- relation between prestimulus alpha amplitude and N1-P2 peak-to-peak amplitude in visual evoked potentials. They reported a ‘general inverse relationship between [vi- sual evoked potential] enhancement and prestimulus alpha amplitude, replicating the results of Bapr.” In contrast with Bqar’s results, the relationship observed by Brandt and Jansen was exponential rather than linear. This difference may be partly due to the fact that their methodology differs from BaSar’s in the following respect: Brandt and Jansen averaged 25 sweeps each before computing the enhancement factor, whereas Bagar’s enhancement factors were computed in single sweeps without averaging.
CONCLUDING REMARKS
Stampfer and BaSar ( I 985) tentatively used the expression of “Task-related altera- tions in delta, theta and alpha activities” for the changes of ERPs. They discussed the interindependence of these three frequency components and their possible role in a comparative decision-making processing. Our investigations show that during the cognitive task with low stimulus discriminability, alpha and theta induced rhyth- micities are prolonged up to lo00 ms after stimulus presentations. This prolongation is accompanied by synchronization of the single sweep waves. Such phenomena cannot be seen in the averaged data, since the averaged ERPs fail to reflect these task-dependent changes. The authors cited above hypothesized that the recognition of the target stimuli occurs very rapidly, giving rise to endogenous components around the well-known P300 peak. The absence of strong recognition of the stimulus in- formation during the paradigm used most probably induces another family of en- dogenous components, such as alpha and theta rhythmicities time-locked and syn- chronized up to loo0 ms after stimulus application. It might be concluded that the paradigm with increased attention and high uncertainty gives evidence of the func- tional relation between the task requirements and the induced rhythmicities. It is interesting to investigate the development of such rhythmicities in the course of the experimental session. The analysis of the dynamics of induced rhythmicities in alpha
Int J
Neu
rosc
i Dow
nloa
ded
from
info
rmah
ealth
care
.com
by
Lul
ea U
nive
rsity
Of
Tec
hnol
ogy
on 0
8/08
/13
For
pers
onal
use
onl
y.

212 V. KOLEV AND M. SCHURMANN
and theta frequency channels, to our opinion, is of great importance, especially for cognitive experiments in the course of which essential changes in cognitive activity occur.
REFERENCES
Bagar, E. (1980). EEG-brain dynamics. Relation between EEG and brain evokedpotenrials. Amsterdam: Elsevier/North-Holland.
Bagar, E. (1988). EEG-dynamics and evoked potentials in sensory and cognitive processing by the brain. In E. Bagar (Ed.), Sensory and cognitive processing bv rhe brain (pp. 30-55). Berlin. Heidelberg, New York: Springer-Verlag.
BaSar. E. (1992). Brain natural frequencies are causal factors for resonances and induced rhythms. In E. Basar & T. H. Bullock (Eds.), Induced rhy thm in rhe brain (pp. 425-465). Boston: Birkhauser.
Bagar, E. , BaSar-Eroglu, C. , Rahn E. & Schiirmann, M. (1991). Sensory and cognitive components of brain resonance responses. Acta Otolaryngologica (Stockholm), Suppl. 491, 25-35.
BaSar, E., BaSar-Eroglu. C . , Rosen, B. & Schiitt, A. (1984). A new approach to endogeneous event- related potentials in man: relation between EEG and P300-wave. Internarional Journal of Neuro- science. 24, 1-2 1.
Bagar, E. & Bullock, T. H. (1992). Induced rhyrhms in the brain, Boston: Rirkhauser. BaSar, E. & Stampfer, H. G. (1985). Important association among EEG-dynamics, event-related po-
tentials, short-term memory and learning. International Journal of Neuroscience, 26, 161-180. BaSar-Eroglu, C . , B a p r , E. & Schmielau, F. (1991). P300 in freely moving cats with intracranial elec-
trodes. International Journal of Neuroscience, 60, 2 15-226. Birbaumer, N., Elbert, T . , Canavan, A. G . M. & Rockstroh, B. (1990). Slow potentials of the cerebral
cortex and behaviour. Physiological Reviews, 70, 1-41, Brandt, M. E., Jansen, B. H. & Carbonari, J. P. (1991). Pre-stimulus spectral EEG patterns and the
visual evoked response. Electroencephalography and Clinical Neurophysiology. 80, 16-20. Brandt, M. E. & Jansen, B. H. (1991). The relationship between prestimulus alpha amplitude and visual
evoked potential amplitude. International Journal of Neuroscience, 61 , 261-268. Bullock, T. H. (1992). Induced rhythms comprise a diverse class of oscillations. In E. B a p r & T . H.
Bullock (Eds.), Induced rhythms in rhe brain (pp. 1-28), Boston: Birkhauser. Freeman, W. J. (1981). Information processing in the olfactory bulb. In: R. Galambos & S. A. Hillyard,
(eds.) Electrophvsiological approaches to human rognitive processing. Boston: MIT Press (Neu- rosciences Research Program Bulletin, vol. 20).
Galambos. R. (1992). A comparison of certain gamma band (40-Hz) brain rhythms in cat and man. In E. Bagar & T. H. Bullock (Eds.), Induced rhythms in the brain (pp. 201-216). Boston: Birkhauser.
Galambos, R. & Hillyard, S. A. , eds. (1981). Electrophysiological approaches ro human cognifive processing. Boston: MIT Press (Neurosciences Research Program Bulletin, vol. 20).
Hebb, 0. (1949). The organization of behuviour. New York: Wiley. Hillyard, S. A, , Hink, R. F., Schwent, V. L. & Picton, T. W. (1973). Electrical signs of selective
attention in the human brain. Science. 182. 177-180. Kolev. V. & Daskalova. M. (in press). Recognition and analysis of single evoked potentials. 17, : Pro-
ceedings of the North-Sea conference on biomedical engineering. Antwerp. Lehmann, D. (1989). Microstates of the brain in EEG and ERP mapping studies. In E. B a p r 8 T. H.
Bullock (Eds.). Brain dynamics. Progress and perspectives (pp. 72-83). Berlin, Heidelberl . New York: Springer-Verlag.
Llinis. R. R. (1988). The intrinsic electrophysiological properties of mammalian neurons: insigt ts into central nervous system function. Science. 242, 1654-1664.
Lopes da Silva, F. H. (1987). Dynamics of EEGs as signals of neuronal populations: models and thc- oretical considerations. In E. Niedermeyer & F. H. Lopes da Silva (Eds.), Electroencephalography. basic principles. clinical applications and related fields (pp. 15-28), Second edition: Baltimore: Urban & Schwamenberg.
Lopes da Silva, F. H. (1992). The rhythmic slow activity (theta) of the limbic cortex: an oscillation in search of a function. In E. Basar & T. H. Bullock (Eds.), Induced rhvrhms in the brain (pp. 83- 102). Boston: Birkhauser.
Naatanen, R. (1988). Implications of ERP data for psychological theories of attention. Biological Psy- chology, 26, 117-163.
Narici, L.. Pizzella, V., Romani. G . L., Torrioli, G., Traversa, R . & Rossini. P. M. (1990). Evoked alpha and mu rhythm in humans: a neuromagnetic study. Brain Research. 520. 222-231.
Int J
Neu
rosc
i Dow
nloa
ded
from
info
rmah
ealth
care
.com
by
Lul
ea U
nive
rsity
Of
Tec
hnol
ogy
on 0
8/08
/13
For
pers
onal
use
onl
y.

PROLONGED EEG RHYTHMICITIES 213
Pfurtscheller, G., Klimexh, W., Berghold, A., MOM, W. & Schimke H. (1990). Event-related desyn- chronization (ERD) correlated with cognitive activity. In E. R. John (Ed.) Machinery of the mind (pp. 243-25 I) . Boston, Berlin, Basel: Birkhauser.
Picton, T. W. & Hillyard, S. A. (1988). Endogenous event-related potentials. In T. W. Picton (Ed.), Handbook of electroencephalography and clinical neurophysiology, revised series, vol. 3: Human event-related potentials (pp. 36 1-426). Amsterdam: Elsevier.
Regan, D. (1989). Human brain electrophysiology. New York, Amsterdam, London: Elsevier. Ritter, W. & Vaughan, H. G. Jr. (1969). Averaged evoked responses in vigilance and discrimination:
a reassessment. Science, 164, 326-328. Ruchkin, D. (1988). Measurement of event-related potentials: Signal extraction. In T. W. Picton (Ed.),
Handbook of electroencephalography and clinical neurophysiology, revised series, vol. 3: Human event-related potentials (pp. 7-43). Amsterdam: Elsevier.
Sheer D. E. (1989). Sensory and cognitive 4 0 - H ~ event-related potentials: behavioral correlates, brain function, and clinical application. In E. Basar and T. H. Bullock (Eds.), Brain dynamics. Progress and perspectives (pp. 339-374). Berlin, Heidelberg, New York: Springer-Verlag.
Simon, R., Ritter, W. & Vaughan, H. G. Jr. (1985). Effects of expectation on negative potentials during visual processing. Electroencephalography and Clinical Neurophysiology, 62. 25-3 1 .
Smith, M. E., Halgren, E., Sokolik, M., Baudena, P., Musolino, A., Liegeois-Chauvel, C. & Chauvel, P. (1990). The intracranial topography of the P3 event-related potential elicited during auditory oddball. Electroencephalography and Clinical Neurophysiology, 76, 235-248.
Sutton, S., Braren, M., Zubin, J . & John, E. R. (1965). Evoked potential correlates of stimulus un- certainty. Science, I.50. 1187-1 188.
Stampfer, H. G. & Bqar, E. (1985). Does frequency analysis lead to better understanding of human event related potentials. International Journal of Neuroscience, 26. 181-196.
Wood, C. C., Allison, T., Goff, W. R., Williamson, P. D. & Spencer, D. D. (1980). On the neural origin of P300 in man. In H. H. Kornhuber & L. Deecke (Eds.), Motivation. Motor and Sensory Processes of the brain: Electrical Potentials, Eehaviour and Clinical Use (pp. 5 1-56). Amsterdam: Elsevier (Progress in Brain Research, vol. 54).
Int J
Neu
rosc
i Dow
nloa
ded
from
info
rmah
ealth
care
.com
by
Lul
ea U
nive
rsity
Of
Tec
hnol
ogy
on 0
8/08
/13
For
pers
onal
use
onl
y.
Copyright © 2022 FDOKUMEN