Evaluation of traditional and consolidated rice farms in Guilan Province, Iran, using life cycle...
10
Evaluation of traditional and consolidated rice farms in Guilan Province, Iran, using life cycle assessment and fuzzy modeling Benyamin Khoshnevisan a, ⁎, Mohammad Ali Rajaeifar a , Sean Clark b , Shahaboddin Shamahirband c , Nor Badrul Anuar d , Nor Liyana Mohd Shuib e , Abdullah Gani d a Department of Agricultural Machinery Engineering, Faculty of Agricultural Engineering and Technology, University of Tehran, Karaj, Iran b Agriculture and Natural Resources Program, Berea College, Berea, KY, USA c Department of Computer Science, Islamic Azad University, Chalous Branch, P.O. Box 46615-397, Chalous, Iran d Department of Computer System & Technology, Faculty of Computer Science and Information Technology, University of Malaya, 50603 Kuala Lumpur, Malaysia e Department of Information System, Faculty of Computer Science & Information Technology, University of Malaya, 50603 Kuala Lumpur, Malaysia HIGHLIGHTS • Integrated (IF) and conventional (CF) rice were compared using LCA methodology. • Electricity and chemical fertilizers were the major energy inputs in rice cultivation. • IF had better environmental performance due to better agricultural management. • Electricity dominated most impact categories in both cultivation systems. abstract article info Article history: Received 22 November 2013 Received in revised form 11 February 2014 Accepted 11 February 2014 Available online xxxx Keywords: Rice LCA Environment Energy Consolidated farm management In this study the environmental impact of consolidated rice farms (CF) – farms which have been integrated to in- crease the mechanization index – and traditional farms (TF) – small farms with lower mechanization index – in Guilan Province, Iran, were evaluated and compared using Life cycle assessment (LCA) methodology and adaptive neuro-fuzzy inference system (ANFIS). Foreground data were collected from farmers using face-to-face question- naires and background information about production process and inventory data was taken from the EcoInvent®2.0 database. The system boundary was confined to within the farm gate (cradle to farm gate) and two functional units (land and mass based) were chosen. The study also included a comparison of the input–output energy flows of the farms. The results revealed that the average amount of energy consumed by the CFs was 57 GJ compared to 74.2 GJ for the TFs. The energy ratios for CFs and TFs were 1.6 and 0.9, respectively. The LCA results indicated that CFs pro- duced fewer environmental burdens per ton of produced rice. When compared according to the land-based FU the same results were obtained. This indicates that the differences between the two types of farms were not caused by a difference in their production level, but rather by improved management on the CFs. The analysis also showed that electricity accounted for the greatest share of the impact for both types of farms, followed by P-based and N-based chemical fertilizers. These findings suggest that the CFs had superior overall environmental performance compared to the TFs in the study area. The performance metrics of the model based on ANFIS show that it can be used to predict the environmental burdens of rice production with high accuracy and minimal error. © 2014 Elsevier B.V. All rights reserved. 1. Introduction Rice (Oryza sativa) is one of the most important agricultural crops in the world, ranking first in global production among all foods (FAO, 2011) and providing more than 70% of human caloric intake in some countries and over 30% in all of Asia (Pishgar-Komleh et al., 2011). In Iran it is typically consumed at least once per day as part of the main meal. According to Iran's Ministry of Agriculture, approximately 3 million tons of rice are produced domestically each year at an average yield of 5.3 t ha -1 (Anonymous, 2011). Yet this level of production is in- sufficient to satisfy domestic demand, resulting in the importation of about 1.7 Mt annually (Anonymous, 2009). Based on reports from the Ministry of Agriculture more than 60% of the total rice production occurs in Mazandaran and Guilan Provinces of northern Iran, where the average rice-farm size is less than 0.6 ha and Science of the Total Environment 481 (2014) 242–251 ⁎ Corresponding author at: Department of Agricultural Machinery Engineering, Faculty of Agricultural Engineering and Technology, University of Tehran, Karaj, Iran. Tel.: +98 2632801011; fax: +98 2632808138. E-mail address: [email protected] (B. Khoshnevisan). http://dx.doi.org/10.1016/j.scitotenv.2014.02.052 0048-9697/© 2014 Elsevier B.V. All rights reserved. Contents lists available at ScienceDirect Science of the Total Environment journal homepage: www.elsevier.com/locate/scitotenv
Transcript of Evaluation of traditional and consolidated rice farms in Guilan Province, Iran, using life cycle...

Science of the Total Environment 481 (2014) 242–251
Contents lists available at ScienceDirect
Science of the Total Environment
j ourna l homepage: www.e lsev ie r .com/ locate /sc i totenv
Evaluation of traditional and consolidated rice farms in Guilan Province,Iran, using life cycle assessment and fuzzy modeling
Benyamin Khoshnevisan a,⁎, Mohammad Ali Rajaeifar a, Sean Clark b, Shahaboddin Shamahirband c,Nor Badrul Anuar d, Nor Liyana Mohd Shuib e, Abdullah Gani d
a Department of Agricultural Machinery Engineering, Faculty of Agricultural Engineering and Technology, University of Tehran, Karaj, Iranb Agriculture and Natural Resources Program, Berea College, Berea, KY, USAc Department of Computer Science, Islamic Azad University, Chalous Branch, P.O. Box 46615-397, Chalous, Irand Department of Computer System & Technology, Faculty of Computer Science and Information Technology, University of Malaya, 50603 Kuala Lumpur, Malaysiae Department of Information System, Faculty of Computer Science & Information Technology, University of Malaya, 50603 Kuala Lumpur, Malaysia
H I G H L I G H T S
• Integrated (IF) and conventional (CF) rice were compared using LCA methodology.• Electricity and chemical fertilizers were the major energy inputs in rice cultivation.• IF had better environmental performance due to better agricultural management.• Electricity dominated most impact categories in both cultivation systems.
⁎ Corresponding author at: Department of Agriculturalof Agricultural Engineering and Technology, University o2632801011; fax: +98 2632808138.
E-mail address: [email protected] (B. Khoshnev
http://dx.doi.org/10.1016/j.scitotenv.2014.02.0520048-9697/© 2014 Elsevier B.V. All rights reserved.
a b s t r a c t
a r t i c l e i n f oArticle history:Received 22 November 2013Received in revised form 11 February 2014Accepted 11 February 2014Available online xxxx
Keywords:RiceLCAEnvironmentEnergyConsolidated farmmanagement
In this study the environmental impact of consolidated rice farms (CF) – farms which have been integrated to in-crease the mechanization index – and traditional farms (TF) – small farms with lower mechanization index – inGuilan Province, Iran, were evaluated and compared using Life cycle assessment (LCA) methodology and adaptiveneuro-fuzzy inference system (ANFIS). Foreground data were collected from farmers using face-to-face question-naires and background information about production process and inventory datawas taken from the EcoInvent®2.0database. The system boundarywas confined towithin the farm gate (cradle to farm gate) and two functional units(land andmass based) were chosen. The study also included a comparison of the input–output energy flows of thefarms. The results revealed that the average amount of energy consumed by the CFs was 57 GJ compared to 74.2 GJfor the TFs. The energy ratios for CFs and TFs were 1.6 and 0.9, respectively. The LCA results indicated that CFs pro-duced fewer environmental burdens per ton of produced rice. When compared according to the land-based FU thesame resultswere obtained. This indicates that the differences between the two types of farmswere not caused by adifference in their production level, but rather by improvedmanagement on the CFs. The analysis also showed thatelectricity accounted for the greatest share of the impact for both types of farms, followed by P-based and N-basedchemical fertilizers. These findings suggest that the CFs had superior overall environmental performance comparedto the TFs in the study area. The performancemetrics of themodel based onANFIS show that it can beused to predictthe environmental burdens of rice production with high accuracy and minimal error.
© 2014 Elsevier B.V. All rights reserved.
1. Introduction
Rice (Oryza sativa) is one of themost important agricultural crops inthe world, ranking first in global production among all foods (FAO,2011) and providing more than 70% of human caloric intake in some
Machinery Engineering, Facultyf Tehran, Karaj, Iran. Tel.: +98
isan).
countries and over 30% in all of Asia (Pishgar-Komleh et al., 2011). InIran it is typically consumed at least once per day as part of the mainmeal. According to Iran's Ministry of Agriculture, approximately3 million tons of rice are produced domestically each year at an averageyield of 5.3 t ha−1 (Anonymous, 2011). Yet this level of production is in-sufficient to satisfy domestic demand, resulting in the importation ofabout 1.7 Mt annually (Anonymous, 2009).
Based on reports from the Ministry of Agriculture more than 60% ofthe total rice production occurs in Mazandaran and Guilan Provinces ofnorthern Iran, where the average rice-farm size is less than 0.6 ha and
243B. Khoshnevisan et al. / Science of the Total Environment 481 (2014) 242–251
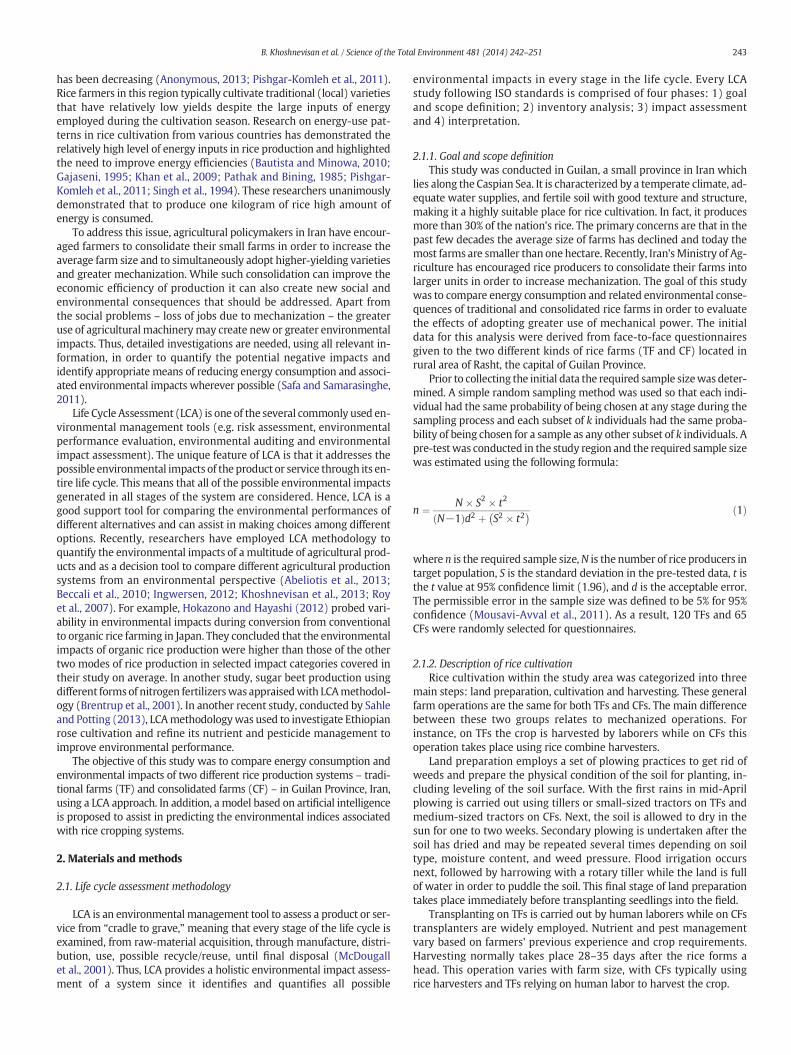
has been decreasing (Anonymous, 2013; Pishgar-Komleh et al., 2011).Rice farmers in this region typically cultivate traditional (local) varietiesthat have relatively low yields despite the large inputs of energyemployed during the cultivation season. Research on energy-use pat-terns in rice cultivation from various countries has demonstrated therelatively high level of energy inputs in rice production and highlightedthe need to improve energy efficiencies (Bautista and Minowa, 2010;Gajaseni, 1995; Khan et al., 2009; Pathak and Bining, 1985; Pishgar-Komleh et al., 2011; Singh et al., 1994). These researchers unanimouslydemonstrated that to produce one kilogram of rice high amount ofenergy is consumed.
To address this issue, agricultural policymakers in Iran have encour-aged farmers to consolidate their small farms in order to increase theaverage farm size and to simultaneously adopt higher-yielding varietiesand greater mechanization. While such consolidation can improve theeconomic efficiency of production it can also create new social andenvironmental consequences that should be addressed. Apart fromthe social problems – loss of jobs due to mechanization – the greateruse of agricultural machinery may create new or greater environmentalimpacts. Thus, detailed investigations are needed, using all relevant in-formation, in order to quantify the potential negative impacts andidentify appropriate means of reducing energy consumption and associ-ated environmental impacts wherever possible (Safa and Samarasinghe,2011).
Life Cycle Assessment (LCA) is one of the several commonly used en-vironmental management tools (e.g. risk assessment, environmentalperformance evaluation, environmental auditing and environmentalimpact assessment). The unique feature of LCA is that it addresses thepossible environmental impacts of the product or service through its en-tire life cycle. This means that all of the possible environmental impactsgenerated in all stages of the system are considered. Hence, LCA is agood support tool for comparing the environmental performances ofdifferent alternatives and can assist in making choices among differentoptions. Recently, researchers have employed LCA methodology toquantify the environmental impacts of a multitude of agricultural prod-ucts and as a decision tool to compare different agricultural productionsystems from an environmental perspective (Abeliotis et al., 2013;Beccali et al., 2010; Ingwersen, 2012; Khoshnevisan et al., 2013; Royet al., 2007). For example, Hokazono and Hayashi (2012) probed vari-ability in environmental impacts during conversion from conventionalto organic rice farming in Japan. They concluded that the environmentalimpacts of organic rice production were higher than those of the othertwo modes of rice production in selected impact categories covered intheir study on average. In another study, sugar beet production usingdifferent formsof nitrogen fertilizerswas appraisedwith LCAmethodol-ogy (Brentrup et al., 2001). In another recent study, conducted by Sahleand Potting (2013), LCAmethodologywas used to investigate Ethiopianrose cultivation and refine its nutrient and pesticide management toimprove environmental performance.
The objective of this study was to compare energy consumption andenvironmental impacts of two different rice production systems – tradi-tional farms (TF) and consolidated farms (CF) – in Guilan Province, Iran,using a LCA approach. In addition, a model based on artificial intelligenceis proposed to assist in predicting the environmental indices associatedwith rice cropping systems.
2. Materials and methods
2.1. Life cycle assessment methodology
LCA is an environmental management tool to assess a product or ser-vice from “cradle to grave,” meaning that every stage of the life cycle isexamined, from raw-material acquisition, through manufacture, distri-bution, use, possible recycle/reuse, until final disposal (McDougallet al., 2001). Thus, LCA provides a holistic environmental impact assess-ment of a system since it identifies and quantifies all possible
environmental impacts in every stage in the life cycle. Every LCAstudy following ISO standards is comprised of four phases: 1) goaland scope definition; 2) inventory analysis; 3) impact assessmentand 4) interpretation.
2.1.1. Goal and scope definitionThis study was conducted in Guilan, a small province in Iran which
lies along the Caspian Sea. It is characterized by a temperate climate, ad-equate water supplies, and fertile soil with good texture and structure,making it a highly suitable place for rice cultivation. In fact, it producesmore than 30% of the nation's rice. The primary concerns are that in thepast few decades the average size of farms has declined and today themost farms are smaller than one hectare. Recently, Iran'sMinistry of Ag-riculture has encouraged rice producers to consolidate their farms intolarger units in order to increase mechanization. The goal of this studywas to compare energy consumption and related environmental conse-quences of traditional and consolidated rice farms in order to evaluatethe effects of adopting greater use of mechanical power. The initialdata for this analysis were derived from face-to-face questionnairesgiven to the two different kinds of rice farms (TF and CF) located inrural area of Rasht, the capital of Guilan Province.
Prior to collecting the initial data the required sample sizewas deter-mined. A simple random sampling method was used so that each indi-vidual had the same probability of being chosen at any stage during thesampling process and each subset of k individuals had the same proba-bility of being chosen for a sample as any other subset of k individuals. Apre-testwas conducted in the study region and the required sample sizewas estimated using the following formula:
n ¼ N � S2 � t2
N−1ð Þd2 þ S2 � t2� � ð1Þ
where n is the required sample size,N is the number of rice producers intarget population, S is the standard deviation in the pre-tested data, t isthe t value at 95% confidence limit (1.96), and d is the acceptable error.The permissible error in the sample size was defined to be 5% for 95%confidence (Mousavi-Avval et al., 2011). As a result, 120 TFs and 65CFs were randomly selected for questionnaires.
2.1.2. Description of rice cultivationRice cultivation within the study area was categorized into three
main steps: land preparation, cultivation and harvesting. These generalfarm operations are the same for both TFs and CFs. The main differencebetween these two groups relates to mechanized operations. Forinstance, on TFs the crop is harvested by laborers while on CFs thisoperation takes place using rice combine harvesters.
Land preparation employs a set of plowing practices to get rid ofweeds and prepare the physical condition of the soil for planting, in-cluding leveling of the soil surface. With the first rains in mid-Aprilplowing is carried out using tillers or small-sized tractors on TFs andmedium-sized tractors on CFs. Next, the soil is allowed to dry in thesun for one to two weeks. Secondary plowing is undertaken after thesoil has dried and may be repeated several times depending on soiltype, moisture content, and weed pressure. Flood irrigation occursnext, followed by harrowing with a rotary tiller while the land is fullof water in order to puddle the soil. This final stage of land preparationtakes place immediately before transplanting seedlings into the field.
Transplanting on TFs is carried out by human laborers while on CFstransplanters are widely employed. Nutrient and pest managementvary based on farmers' previous experience and crop requirements.Harvesting normally takes place 28–35 days after the rice forms ahead. This operation varies with farm size, with CFs typically usingrice harvesters and TFs relying on human labor to harvest the crop.

Table 1Life cycle inventory data for rice cultivation (per two FUs).
Inputs Consolidated farms Traditional farms
Units L-Ba M-Bb L-B M-B
Average Average Average Average
Machinery kg 4675 891.2 3016.5 654.8Labor h 391.5 73.9 657.7 127.4Diesel fuel L 106.6 20.3 64 18.9Electricity kWh 2132.7 406.4 2879.2 778.1Chemical fertilizersNitrogen (N) kg 202.8 38.6 286.6 59.1Phosphate (P2O5) kg 139.4 26.6 235.8 54.2Potassium (K2O) kg 97.4 18.4 116.2 27.7
Farmyard manure kg 3117.9 590 2182.5 574.7Pesticides kg 22.8 4.3 36.2 2.5Seed kg 100.4 19.1 120.5 29.6
a Land based FU.b Mass based FU.
244 B. Khoshnevisan et al. / Science of the Total Environment 481 (2014) 242–251
2.1.3. System boundaryUsing the appropriate system boundary ensures that all emissions
associatedwith inputs, within field/farm activities and after the productleaves the farm, are included (Suh et al., 2004). For this study the farmgate was chosen as the system boundary and the environmental im-pacts were evaluated from extraction of input materials (i.e. fertilizerand pesticide production from rawmaterials) to the farm gate (harvest-ed rice). Thus, this analysis included all agricultural practices, materialinputs, agricultural machinery, infrastructure and energy carriers ap-plied during rice cultivation from cradle to farm gate (Fig. 1).
2.1.4. Functional unitThe functional unit (FU) describes the primary function(s) fulfilled
by a product-system, and indicates how much of this function is to beconsidered in the LCA study (Khoshnevisan et al., 2013). Thus, the FUis a quantification of the identified functions or performance character-istics of the product/service being studied. The FU is used as a referencewhen quantifying input and output data in the inventory analysis of anLCA study. To conduct an LCA for agricultural systems three FUs havebeen suggested by Nemecek et al. (2011). These are: (i) the land man-agement function, measured by cultivated hectare per year; (ii) the fi-nancial function expressed as a currency unit; and (iii) the productivefunction described by physical units (e.g. kg drymatter yield;MJ net en-ergy for lactation). According to the literature, mass-based and land-based FUs are most common in agricultural studies (Beccali et al.,2009; Cerutti et al., 2011; Charles et al., 2006; Van der Werf et al.,2007). In this study two FUs were chosen: mass-based (1 ton of pro-duced rice) and land-based (per ha) FUs were used.
2.1.5. Life cycle inventory (LCI)Inventory analysis is considered one of the most important stages of
an LCA since the stages that follow will be influenced by its results(Allen and Rosselot, 1997). The outcomes of this stage are utilized inthe life cycle impact assessment (LCIA). The initial data, collected withthe face-to-face questionnaires, was supplemented with informationabout manufacturing of agricultural inputs and energy carriers (agro-chemicals production, fertilizers production, electricity generation,transportation, etc.) from the EcoInvent®2.0 database. The detailedquantitative data for CFs and TFs are shown in Table 1.
2.1.5.1. Chemical fertilizers.A variety of chemical fertilizerswas reported-ly used for rice production in the study area and the type and amountvaried from farm to farm. To simplify the inventory analysis of thesefertilizers and estimate emissions related to their application, all ofthem were categorized as N-based, P-based or K-based fertilizers. The
p
Agro-chemicals production
Fpr
Energy carriers &transportation
delivery
Background system
Raw materials
Infrastructure production
Fig. 1. System boundary(Adapted from Abeliotis
EcoInvent®2.0 database provided the relevant information about theproduction of the fertilizers.
Pollutants from the cultivation step include emissions to air, waterand soil from the field. Emissions to water include substances thatleave the root zone of the plants, such as surplus nutrients not assimilat-ed by the crop and harvested. In calculating N-related emissions, for ex-ample, the starting point is an N-balance on the field scale. Knowninputs and outputs related to seed, fertilizer, changes in N in soil matterand harvested crop and straw are balanced in order to determine the Nsurplus. This surplus is then distributed across the different emissions.
The application of chemical fertilizers is responsible for severaldirect emissions as followings: ammonia to air, nitrate leaching togroundwater, phosphorus to water, nitrous oxide (N2O) to air, NOx tothe air, and heavy metals to agricultural soil, surface water and ground-water. Among the various methodologies developed to estimate directemissions of chemical fertilizers, procedures from Brentrup et al.(2000), EPA (1995) and IPCC (2006) were used this study. The guide-lines issued by IPCC (2006)were used in estimating the emissions of ni-trous oxide (N2O) to the air. Accordingly, the application of each 100 kgof N-based fertilizer is assumed to be responsible for emitting 1.25 kg ofN2O into the air. The emissions of NOx were assumed to be 2% and NH3
emissions 8% of the total amount of N-based fertilizers applied(Galloway et al., 1995). Likewise, it was assumed that 30% of total N fer-tilizers leached from the soil profile as nitrate (Erickson et al., 2001).
Themodeling of the phosphorus cycle is somewhat simpler than theN-cycle since it includes no emissions to air. The loss of P as phosphate iscalculated with a simple field balance. The inputs include seed and
Foreground system
Field operations
Field rocesses
Energy consumption
ertilizers oduction
Machinery production
& maintenance
Emissions
Rice
of rice production.et al., 2013).
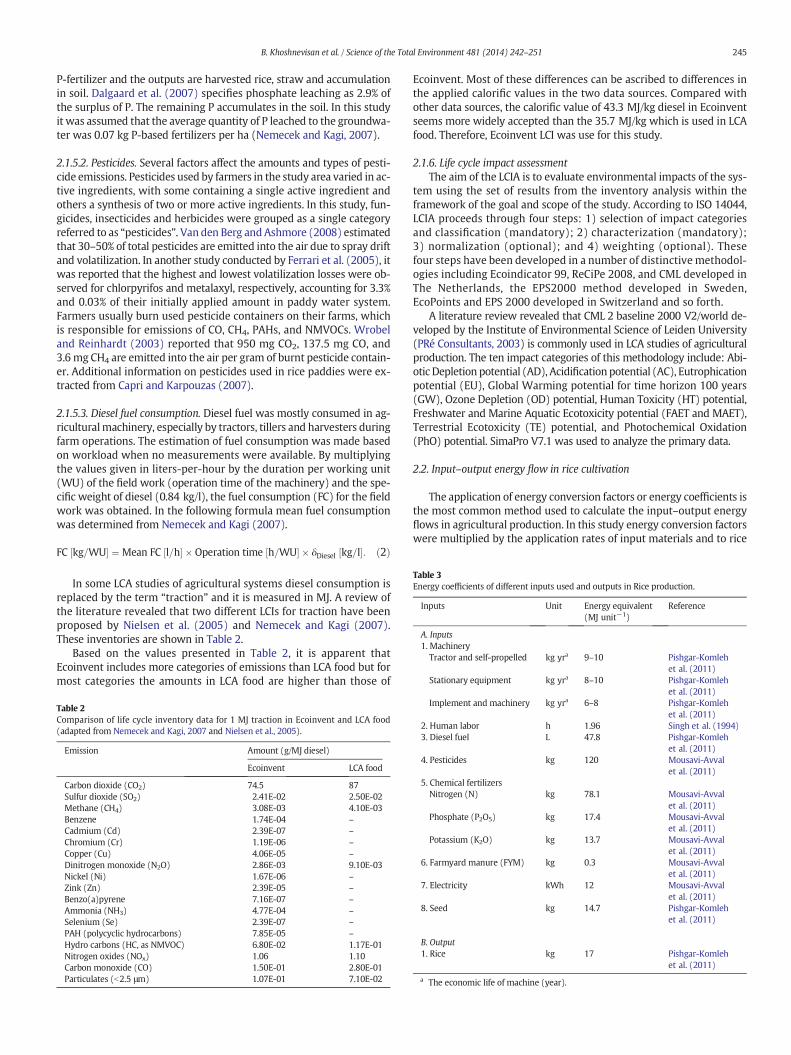
Table 3Energy coefficients of different inputs used and outputs in Rice production.
Inputs Unit Energy equivalent(MJ unit−1)
Reference
A. Inputs1. MachineryTractor and self-propelled kg yra 9–10 Pishgar-Komleh
et al. (2011)Stationary equipment kg yra 8–10 Pishgar-Komleh
245B. Khoshnevisan et al. / Science of the Total Environment 481 (2014) 242–251
P-fertilizer and the outputs are harvested rice, straw and accumulationin soil. Dalgaard et al. (2007) specifies phosphate leaching as 2.9% ofthe surplus of P. The remaining P accumulates in the soil. In this studyit was assumed that the average quantity of P leached to the groundwa-ter was 0.07 kg P-based fertilizers per ha (Nemecek and Kagi, 2007).
2.1.5.2. Pesticides. Several factors affect the amounts and types of pesti-cide emissions. Pesticides used by farmers in the study area varied in ac-tive ingredients, with some containing a single active ingredient andothers a synthesis of two or more active ingredients. In this study, fun-gicides, insecticides and herbicides were grouped as a single categoryreferred to as “pesticides”. Van den Berg andAshmore (2008) estimatedthat 30–50% of total pesticides are emitted into the air due to spray driftand volatilization. In another study conducted by Ferrari et al. (2005), itwas reported that the highest and lowest volatilization losses were ob-served for chlorpyrifos and metalaxyl, respectively, accounting for 3.3%and 0.03% of their initially applied amount in paddy water system.Farmers usually burn used pesticide containers on their farms, whichis responsible for emissions of CO, CH4, PAHs, and NMVOCs. Wrobeland Reinhardt (2003) reported that 950 mg CO2, 137.5 mg CO, and3.6mg CH4 are emitted into the air per gram of burnt pesticide contain-er. Additional information on pesticides used in rice paddies were ex-tracted from Capri and Karpouzas (2007).
2.1.5.3. Diesel fuel consumption. Diesel fuel was mostly consumed in ag-riculturalmachinery, especially by tractors, tillers and harvesters duringfarm operations. The estimation of fuel consumption was made basedon workload when no measurements were available. By multiplyingthe values given in liters-per-hour by the duration per working unit(WU) of the field work (operation time of the machinery) and the spe-cific weight of diesel (0.84 kg/l), the fuel consumption (FC) for the fieldwork was obtained. In the following formula mean fuel consumptionwas determined from Nemecek and Kagi (2007).
FC kg=WU½ � ¼ Mean FC l=h½ � � Operation time h=WU½ � � δDiesel kg=l½ �: ð2Þ
In some LCA studies of agricultural systems diesel consumption isreplaced by the term “traction” and it is measured in MJ. A review ofthe literature revealed that two different LCIs for traction have beenproposed by Nielsen et al. (2005) and Nemecek and Kagi (2007).These inventories are shown in Table 2.
Based on the values presented in Table 2, it is apparent thatEcoinvent includes more categories of emissions than LCA food but formost categories the amounts in LCA food are higher than those of
Table 2Comparison of life cycle inventory data for 1 MJ traction in Ecoinvent and LCA food(adapted from Nemecek and Kagi, 2007 and Nielsen et al., 2005).
Emission Amount (g/MJ diesel)
Ecoinvent LCA food
Carbon dioxide (CO2) 74.5 87Sulfur dioxide (SO2) 2.41E-02 2.50E-02Methane (CH4) 3.08E-03 4.10E-03Benzene 1.74E-04 –
Cadmium (Cd) 2.39E-07 –
Chromium (Cr) 1.19E-06 –
Copper (Cu) 4.06E-05 –
Dinitrogen monoxide (N2O) 2.86E-03 9.10E-03Nickel (Ni) 1.67E-06 –
Zink (Zn) 2.39E-05 –
Benzo(a)pyrene 7.16E-07 –
Ammonia (NH3) 4.77E-04 –
Selenium (Se) 2.39E-07 –
PAH (polycyclic hydrocarbons) 7.85E-05 –
Hydro carbons (HC, as NMVOC) 6.80E-02 1.17E-01Nitrogen oxides (NOx) 1.06 1.10Carbon monoxide (CO) 1.50E-01 2.80E-01Particulates (b2.5 μm) 1.07E-01 7.10E-02
Ecoinvent. Most of these differences can be ascribed to differences inthe applied calorific values in the two data sources. Compared withother data sources, the calorific value of 43.3 MJ/kg diesel in Ecoinventseems more widely accepted than the 35.7 MJ/kg which is used in LCAfood. Therefore, Ecoinvent LCI was use for this study.
2.1.6. Life cycle impact assessmentThe aim of the LCIA is to evaluate environmental impacts of the sys-
tem using the set of results from the inventory analysis within theframework of the goal and scope of the study. According to ISO 14044,LCIA proceeds through four steps: 1) selection of impact categoriesand classification (mandatory); 2) characterization (mandatory);3) normalization (optional); and 4) weighting (optional). Thesefour steps have been developed in a number of distinctive methodol-ogies including Ecoindicator 99, ReCiPe 2008, and CML developed inThe Netherlands, the EPS2000 method developed in Sweden,EcoPoints and EPS 2000 developed in Switzerland and so forth.
A literature review revealed that CML 2 baseline 2000 V2/world de-veloped by the Institute of Environmental Science of Leiden University(PRé Consultants, 2003) is commonly used in LCA studies of agriculturalproduction. The ten impact categories of this methodology include: Abi-otic Depletion potential (AD), Acidification potential (AC), Eutrophicationpotential (EU), Global Warming potential for time horizon 100 years(GW), Ozone Depletion (OD) potential, Human Toxicity (HT) potential,Freshwater and Marine Aquatic Ecotoxicity potential (FAET and MAET),Terrestrial Ecotoxicity (TE) potential, and Photochemical Oxidation(PhO) potential. SimaPro V7.1 was used to analyze the primary data.
2.2. Input–output energy flow in rice cultivation
The application of energy conversion factors or energy coefficients isthe most common method used to calculate the input–output energyflows in agricultural production. In this study energy conversion factorswere multiplied by the application rates of input materials and to rice
et al. (2011)Implement and machinery kg yra 6–8 Pishgar-Komleh
et al. (2011)2. Human labor h 1.96 Singh et al. (1994)3. Diesel fuel L 47.8 Pishgar-Komleh
et al. (2011)4. Pesticides kg 120 Mousavi-Avval
et al. (2011)5. Chemical fertilizersNitrogen (N) kg 78.1 Mousavi-Avval
et al. (2011)Phosphate (P2O5) kg 17.4 Mousavi-Avval
et al. (2011)Potassium (K2O) kg 13.7 Mousavi-Avval
et al. (2011)6. Farmyard manure (FYM) kg 0.3 Mousavi-Avval
et al. (2011)7. Electricity kWh 12 Mousavi-Avval
et al. (2011)8. Seed kg 14.7 Pishgar-Komleh
et al. (2011)
B. Output1. Rice kg 17 Pishgar-Komleh
et al. (2011)
a The economic life of machine (year).

Table 4Energy inputs and output for rice production (GJ/ha−1).
Inputs Traditional cultivation Consolidated cultivation
Average Percentage Average Percentage
A. InputsMachinery 0.5 1 0.8 1Labor 1.3 2 0.8 1Diesel fuel 3.1 4 5.1 9Electricity 34.5 47 25.6 45Chemical fertilizersNitrogen(N) 22.4 30 15.8 28Phosphate(P2O5) 4.1 5 2.4 4Potassium(K2O) 1.6 2 1.3 2
Farmyard manure 0.7 1 0.9 2Pesticides 4.3 6 2.7 5Seed 1.8 2 1.5 3Total input energy 74.2 100 57.0 100
B. OutputRice 63.0 90.0Energy ratio (output/input) 0.9 1.6
246 B. Khoshnevisan et al. / Science of the Total Environment 481 (2014) 242–251
yields to compute the input and output energies. The energy conversionfactors used are summarized in Table 3.
2.3. Environmental modeling of consolidated farms
To investigate whether a model based on artificial intelligence (AI)could be effective in predicting the environmental indices of rice cultiva-tion in consolidated farms, a model was developed based on fuzzy logic.
Fuzzy sets, first introduced by Zadeh in 1965, are a novel way ofcharacterizing non-probabilistic uncertainties. Adaptive neuro-fuzzy in-ference systems (ANFIS) which combine artificial neural networks(ANN) and fuzzy systems (FS) integrate the best features of FS andANN by representing prior knowledge within a set of constraints (net-work topology) to reduce the optimization search space.
Selection of inputs was the first step in developing the ANFIS-basedpredictive model. Eight agricultural inputs including N, P and K-basedfertilizers, agricultural machinery, pesticides, electricity, farmyard ma-nure, diesel fuel and farm size were selected as inputs to the modeland the ten LCA indices were considered outputs. To ensure this selec-tion was accurate, the correlation of inputs (dependent variables)with the model's outputs (independent variables) was analyzed usingSPSS software. The results of this evaluation showed that there weresignificant correlations between inputs and outputs while the correla-tions among selected inputs were not significant.
In an ANFIS network four mandatory steps are followed, which in-clude: fuzzification; definition of the knowledge base; processing of therules; and defuzzification. The first layer of each standard ANFIS suppliesthe input values andmembership functions (MFs) to the next layer while
0
10
20
30
40Consolidated farms
Traditional farms
Fig. 2. The share of total mean energy inputs in rice production.
in the second layerMFs are utilized tomap input data to the set {0,1}. Dif-ferent types of MFs can be employed in this step including triangular,Gaussian, and bell-shaped MFs. In this study the bell-shaped MF(Eq. (3)) was exercised with its maximum equal to 1 and its minimumequal to 0 (Petković et al., 2014a, 2014b; Shamshirband et al., 2014).
μ xð Þ ¼ 11þ x−cð Þ=aj j2b ð3Þ
where a, b, and c are changeable basis parameters. Each node in thethird layer, which is called the rule layer, performs the pre-conditionmatching of the fuzzy rules and calculates the normalized weights.Deffuzification takes place in layer four where the output valuesresulting from the inference of rules are provided.
Two learning algorithms arewidely usedwhen FIS is trained to spec-ify the relationship between input and output in order to determine theoptimized distribution of MFs. These learning algorithms include prop-agation and hybrid (a combination of propagation and least squaresmethod). In this study, a hybrid learning algorithm was applied.
The necessary elements and modifications included in the ANFISstructure are as follows: types (triangular, trapezoidal, bell-shaped,Gaussian and sigmoid) and number of input MFs; number of epochs;optimization methods (hybrid or back propagation); and types of out-put MF (constant or linear).
Three statistical parameters were extracted from the developedmodels to appraise the accuracy of the models and help us to opt forthe bestmodel. Rootmean square error (RMSE), coefficient of determina-tion (R2) andmean absolute percentage error (MAPE) were calculated asfollows:
R2 ¼ 1−Xn
i¼1Pi−Aið Þ2Xni¼1
A2i
0@
1A ð4Þ
RMSE ¼ffiffiffiffiffiffiffiffiffiffiffiffiffiffiffiffiffiffiffiffiffiffiffiffiffiffiffiffiffiffi1n
XPi−Aið Þ2
rð5Þ
MAPE ¼ 1n
Xni¼1
Pi−Aij jAi
� 100� �
ð6Þ
where Pi and Ai are the respective predicted and actual environmental in-dices for the ith farmer and n is the number of points in the data set.Matlab software was used to develop fuzzy models.
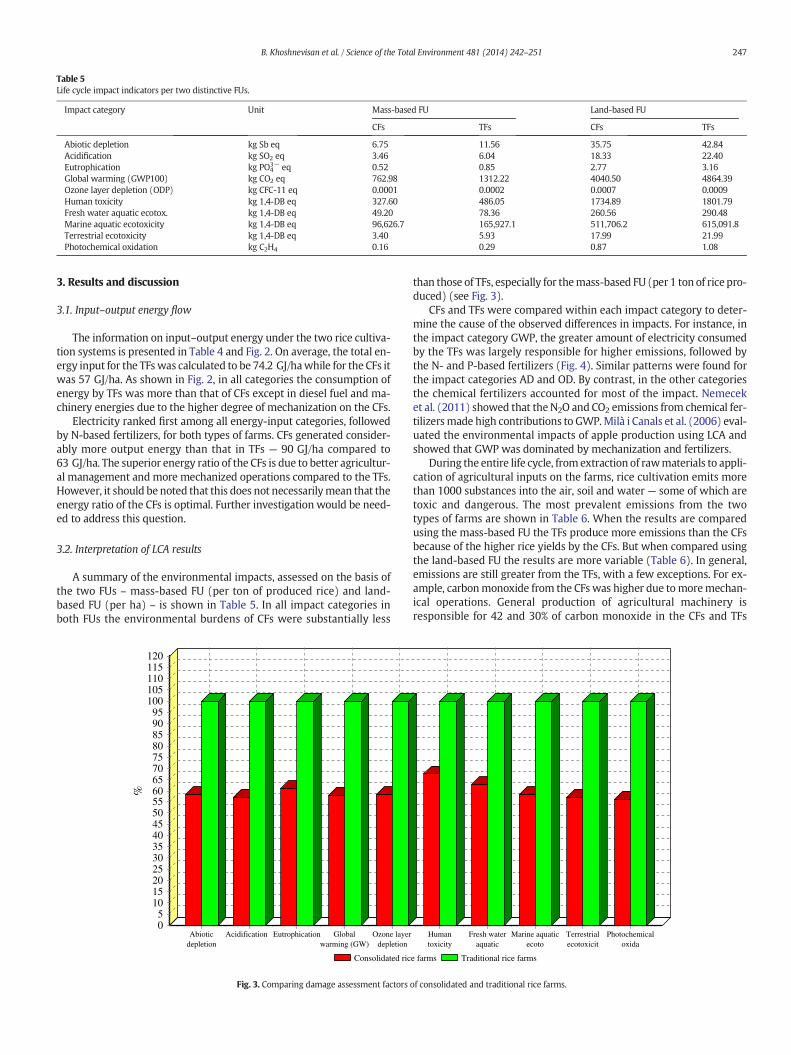
Table 5Life cycle impact indicators per two distinctive FUs.
Impact category Unit Mass-based FU Land-based FU
CFs TFs CFs TFs
Abiotic depletion kg Sb eq 6.75 11.56 35.75 42.84Acidification kg SO2 eq 3.46 6.04 18.33 22.40Eutrophication kg PO4
3− eq 0.52 0.85 2.77 3.16Global warming (GWP100) kg CO2 eq 762.98 1312.22 4040.50 4864.39Ozone layer depletion (ODP) kg CFC-11 eq 0.0001 0.0002 0.0007 0.0009Human toxicity kg 1,4-DB eq 327.60 486.05 1734.89 1801.79Fresh water aquatic ecotox. kg 1,4-DB eq 49.20 78.36 260.56 290.48Marine aquatic ecotoxicity kg 1,4-DB eq 96,626.7 165,927.1 511,706.2 615,091.8Terrestrial ecotoxicity kg 1,4-DB eq 3.40 5.93 17.99 21.99Photochemical oxidation kg C2H4 0.16 0.29 0.87 1.08
247B. Khoshnevisan et al. / Science of the Total Environment 481 (2014) 242–251
3. Results and discussion
3.1. Input–output energy flow
The information on input–output energy under the two rice cultiva-tion systems is presented in Table 4 and Fig. 2. On average, the total en-ergy input for the TFswas calculated to be 74.2 GJ/hawhile for the CFs itwas 57 GJ/ha. As shown in Fig. 2, in all categories the consumption ofenergy by TFs was more than that of CFs except in diesel fuel and ma-chinery energies due to the higher degree of mechanization on the CFs.
Electricity ranked first among all energy-input categories, followedby N-based fertilizers, for both types of farms. CFs generated consider-ably more output energy than that in TFs — 90 GJ/ha compared to63 GJ/ha. The superior energy ratio of the CFs is due to better agricultur-al management and more mechanized operations compared to the TFs.However, it should be noted that this does not necessarilymean that theenergy ratio of the CFs is optimal. Further investigation would be need-ed to address this question.
3.2. Interpretation of LCA results
A summary of the environmental impacts, assessed on the basis ofthe two FUs – mass-based FU (per ton of produced rice) and land-based FU (per ha) – is shown in Table 5. In all impact categories inboth FUs the environmental burdens of CFs were substantially less
Consolidated ric
Abioticdepletion
Acidification Eutrophication Globalwarming (GW)
Ozone layerdepletion
%
12011511010510095908580757065605550454035302520151050
Fig. 3. Comparing damage assessment factors
than those of TFs, especially for themass-based FU (per 1 ton of rice pro-duced) (see Fig. 3).
CFs and TFs were compared within each impact category to deter-mine the cause of the observed differences in impacts. For instance, inthe impact category GWP, the greater amount of electricity consumedby the TFs was largely responsible for higher emissions, followed bythe N- and P-based fertilizers (Fig. 4). Similar patterns were found forthe impact categories AD and OD. By contrast, in the other categoriesthe chemical fertilizers accounted for most of the impact. Nemeceket al. (2011) showed that theN2O and CO2 emissions from chemical fer-tilizersmade high contributions to GWP.Milà i Canals et al. (2006) eval-uated the environmental impacts of apple production using LCA andshowed that GWP was dominated by mechanization and fertilizers.
During the entire life cycle, fromextraction of rawmaterials to appli-cation of agricultural inputs on the farms, rice cultivation emits morethan 1000 substances into the air, soil and water — some of which aretoxic and dangerous. The most prevalent emissions from the twotypes of farms are shown in Table 6. When the results are comparedusing the mass-based FU the TFs produce more emissions than the CFsbecause of the higher rice yields by the CFs. But when compared usingthe land-based FU the results are more variable (Table 6). In general,emissions are still greater from the TFs, with a few exceptions. For ex-ample, carbonmonoxide from the CFs was higher due tomoremechan-ical operations. General production of agricultural machinery isresponsible for 42 and 30% of carbon monoxide in the CFs and TFs
e farms Traditional rice farms
Humantoxicity
Fresh wateraquatic
Marine aquaticecoto
Terrestrialecotoxicit
Photochemicaloxida
of consolidated and traditional rice farms.

0
500
1000
1500
2000
2500
CO
2 eq
.
Consolidated
Traditional
Fig. 4. The share of agricultural inputs and farmoperations in the impact category of GWP.
Table 6Some inventory of emissions in consolidated versus traditional rice farms per two FUs.
Emissions To air(Land based FU)
To air (Mass based FU)
CFs TFs CFs TFs
Ammonia (g) 49.3 49.5 9.3 13.3Carbon dioxide (kg) 336.2 340.2 63.5 91.8Carbon monoxide (kg) 4.3 3.9 811.4E−3 1Dinitrogen monoxide (g) 11.9 14.3 2.2 3.9Lead (mg) 509.8 463.3 96.3 125Methane (g) 10.5 13.8 2 3.7Nitrogen oxides (kg) 2.3 2.6 435.9E−3 688.5E−3
NMVOCa (g) 241 264.8 45.5 71.4Particulate matter, PM10 (g) 58.2 74.6 11 20.1Sulfur dioxide (g) 212.5 193.5 40.1 52.2
a Non-methane volatile organic compound.
248 B. Khoshnevisan et al. / Science of the Total Environment 481 (2014) 242–251
respectively. Therefore, the greater use of agriculturalmachinery in CFs,especially in planting and harvesting operations, resulted in more car-bon monoxide emissions to the air. This was also the case for lead andsulfur dioxide.
Consolidated
Abioticdepletion
Acidification Eutrophication Globalwarming (GW
Ozone laydepletion
5e-8
4.5e-8
4e-8
3.5e-8
3e-8
2.5e-8
2e-8
1.5e-8
1e-8
5e-9
8.27e-24
Fig. 5. Comparing normalized impact categor
In order to compare the ten impact categories, normalized valueswere employed. Normalization is the calculation of the magnitude ofthe indicator results relative to reference information (e.g. annual emis-sion per capita). The process is undertaken by dividing the impact indi-cator result (of all impact categories) by a selected reference value (ISO,14040, 2006). Normalized impact categories of CFs and TFs are shown inFig. 5. The impact category MAET is much greater than all other impactcategories. This normalization shifts the focus toward impact categorieswith greater magnitude by simultaneously reducing the relativemagni-tudes of other impact categories.
To determinewhich inputmaterials or energy sources accounted forthe greatest share of the normalized impact categories, the contributionof the production and use of the inputs to each impact indicator was de-termined (Fig. 6). The production and application of fertilizers made alarge contribution to all impact categories. Given this finding, if theaim is decreasing the negative environmental consequences of rice cul-tivation, the application of chemical fertilizers, especially P-based andN-based fertilizers should be considered and aligned more to cropneeds and soil analyses. In a study of energy consumption and green-house gas emissions from fertilizer production, Kongshaug (1998), con-cluded that the production and utilization of chemical fertilizersaccounted for 1.2% of global GHG emissions. Other LCA studies of agri-cultural crops have also reported that chemical fertilizers have signifi-cant negative environmental consequences in agricultural production(Cellura et al., 2012; Khoshnevisan et al., 2013; Sahle and Potting, 2013).
An additional optional step in LCA isweighting, a procedure inwhichnormalized indicator results are converted into the same unit using nu-merical factors (ISO, 14040, 2006). The weighting process is highly sub-jective since it is based upon specific criteria chosen by the LCApractitioners to give preference to certain environmental impact catego-ries over others. The summary of emissions for 1 ton of rice produced byCFs and TFs, based on weighting step, is shown in Table 7. Here, Pt is anabbreviation for Point, which is used in the weighting step with 1000 Ptequal to the total environmental impact of one (average) European citi-zen during one year (Mousazadeh et al., 2009).
3.3. Evaluation of developed fuzzy model
A reviewof the literature shows thatmodels based on fuzzy logic arewidely used in different fields of engineering (Fernandez de Canete
rice farms Traditional rice farms
er Humantoxicity
Fresh wateraquatic
Marine aquaticecoto
Terrestrialecotoxicit
Photochemicaloxidati
ies of consolidated and traditional farms.
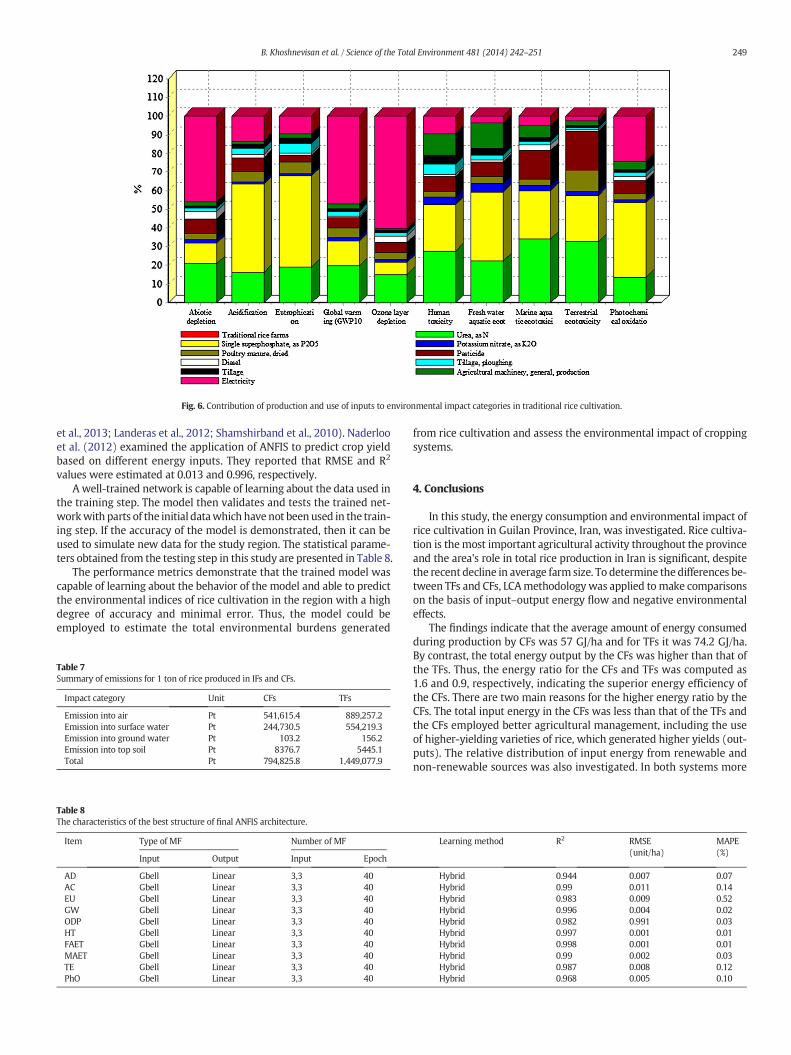
Fig. 6. Contribution of production and use of inputs to environmental impact categories in traditional rice cultivation.
249B. Khoshnevisan et al. / Science of the Total Environment 481 (2014) 242–251
et al., 2013; Landeras et al., 2012; Shamshirband et al., 2010). Naderlooet al. (2012) examined the application of ANFIS to predict crop yieldbased on different energy inputs. They reported that RMSE and R2
values were estimated at 0.013 and 0.996, respectively.A well-trained network is capable of learning about the data used in
the training step. The model then validates and tests the trained net-workwith parts of the initial datawhich have not been used in the train-ing step. If the accuracy of the model is demonstrated, then it can beused to simulate new data for the study region. The statistical parame-ters obtained from the testing step in this study are presented in Table 8.
The performance metrics demonstrate that the trained model wascapable of learning about the behavior of the model and able to predictthe environmental indices of rice cultivation in the region with a highdegree of accuracy and minimal error. Thus, the model could beemployed to estimate the total environmental burdens generated
Table 7Summary of emissions for 1 ton of rice produced in IFs and CFs.
Impact category Unit CFs TFs
Emission into air Pt 541,615.4 889,257.2Emission into surface water Pt 244,730.5 554,219.3Emission into ground water Pt 103.2 156.2Emission into top soil Pt 8376.7 5445.1Total Pt 794,825.8 1,449,077.9
Table 8The characteristics of the best structure of final ANFIS architecture.
Item Type of MF Number of MF
Input Output Input Epoch
AD Gbell Linear 3,3 40AC Gbell Linear 3,3 40EU Gbell Linear 3,3 40GW Gbell Linear 3,3 40ODP Gbell Linear 3,3 40HT Gbell Linear 3,3 40FAET Gbell Linear 3,3 40MAET Gbell Linear 3,3 40TE Gbell Linear 3,3 40PhO Gbell Linear 3,3 40
from rice cultivation and assess the environmental impact of croppingsystems.
4. Conclusions
In this study, the energy consumption and environmental impact ofrice cultivation in Guilan Province, Iran, was investigated. Rice cultiva-tion is themost important agricultural activity throughout the provinceand the area's role in total rice production in Iran is significant, despitethe recent decline in average farm size. To determine the differences be-tween TFs and CFs, LCAmethodologywas applied to make comparisonson the basis of input–output energy flow and negative environmentaleffects.
The findings indicate that the average amount of energy consumedduring production by CFs was 57 GJ/ha and for TFs it was 74.2 GJ/ha.By contrast, the total energy output by the CFs was higher than that ofthe TFs. Thus, the energy ratio for the CFs and TFs was computed as1.6 and 0.9, respectively, indicating the superior energy efficiency ofthe CFs. There are two main reasons for the higher energy ratio by theCFs. The total input energy in the CFs was less than that of the TFs andthe CFs employed better agricultural management, including the useof higher-yielding varieties of rice, which generated higher yields (out-puts). The relative distribution of input energy from renewable andnon-renewable sources was also investigated. In both systems more
Learning method R2 RMSE(unit/ha)
MAPE(%)
Hybrid 0.944 0.007 0.07Hybrid 0.99 0.011 0.14Hybrid 0.983 0.009 0.52Hybrid 0.996 0.004 0.02Hybrid 0.982 0.991 0.03Hybrid 0.997 0.001 0.01Hybrid 0.998 0.001 0.01Hybrid 0.99 0.002 0.03Hybrid 0.987 0.008 0.12Hybrid 0.968 0.005 0.10

250 B. Khoshnevisan et al. / Science of the Total Environment 481 (2014) 242–251
than 94% of the total energy consumed was in the form of non-renewable energy.
The cradle-to-farm-gate LCA of rice cultivation demonstrated thatCFs were environmentally preferable to TFs in all selected impact cate-gories. Based on the findings of this analysis, chemical fertilizers – inboth production process and application on the farms – had the mostsubstantial effect on all impact categories.
The outcomes of this study demonstrate that farmers should be en-couraged to consolidate small farms and the government should pro-vide adequate support to assist farmers in this process. Furtherinvestigations should explore where energymight be saved in both cul-tivation systems. A variety ofmethodsmight be employed in identifyingmeans of saving energy in rice cultivation. For example, inefficient ener-gy uses from different sources could be calculated using data envelop-ment analysis or evolutionary algorithms such as a multi-objectivegenetic algorithmand ant colony approach to estimate the optimumen-ergy required for rice cultivation. Further, the new higher-yielding vari-eties of rice that have been introduced to rice farmers by the Iran RiceResearch Institution should be more widely adopted to reduce the neg-ative environmental burdens generated per ton of rice produced.
The LCA results indicate that application of more mechanical powerand an associated increase in the mechanization index will lead to bet-ter environmental performance rather than increased environmentalburdens from rice cultivation. If farmers are unable to consolidatetheir farms, they should at least be aware of appropriate farm manage-ment practices for use on small farms. Thus, they should be encouragedto cultivate higher yielding rice varieties and apply agricultural inputsaccording to crop requirements and soil analyses.
Acknowledgment
The first author would like to thank the University of Tehran for giv-ing their financial support; and the participating farmers. This paper isalso financially supported by the Malaysian Ministry of Educationunder the University of Malaya High Impact Research Grant UM.C/625/1/HIR/MoE/FCSIT/17.
References
Abeliotis K, Detsis V, Pappia C. Life cycle assessment of bean production in the Prespa Na-tional Park, Greece. J Clean Prod 2013;41:89–96.
Allen DT, Rosselot KS. ‘Life-cycle assessment’, in pollution prevention for chemical pro-cesses. New York: John Wiley & Sons, Inc.; 1997.
Anonymous International Rice Research Institute; 2009 [Available from: http://beta.irri.org].
Anonymous. Annual agricultural statistics. Ministry of Jihad-e-Agriculture of Iran; 2011[Available from. http://www.maj.ir].
Anonymous. Annual agricultural statistics. Ministry of Jahad-e-Agriculture of Iran; 2013[Available in: http://www.maj.ir/portal/Home/Default.aspx?CategoryID=20ad5e49-c727-4bc9-9254-de648a5f4d52].
Bautista EG, Minowa T. Analysis of the energy for different rice production systems in thePhilippines. The Philippine Agricultural Scientist 2010;93:346–57.
Beccali M, Cellura M, Iudicello M, Mistretta M. Resource consumption and environmentalimpacts of the agrofood sector: life cycle assessment of Italian citrus-based products.Environ Manage 2009;43:707–24.
Beccali M, Cellura M, Iudicello M, Mistretta M. Life cycle assessment of Italian citrus-basedproducts. Sensitivity analysis and improvement scenarios. J Environ Manage2010;91:1415–28.
Brentrup F, Küsters J, Lammel J, Kuhlmamm H. Methods to estimate on field nitrogenemissions from crop production as an input to LCA studies in the agricultural sector.Int J Life Cycle Assess 2000;5:349–57.
Brentrup F, Küsters J, Kuhlmann H, Lammel J. Application of the Life Cycle Assessmentmethodology to agricultural production: an example of sugar beet production withdifferent forms of nitrogen fertilisers. Eur J Agron 2001;14:221–33.
Capri E, Karpouzas D. Pesticide risk assessment in rice paddies — theory and practice.Elsevier Ltd.; 2007
Cellura M, Longo S, Mistretta M. Life Cycle Assessment (LCA) of protected crops: an Italiancase study. J Clean Prod 2012;28:56–62.
Cerutti AK, Bruun S, Beccaro GL, Bounous G. A review of studies applying environmentalimpact assessment methods on fruit production systems. J Environ Manage 2011;92:2277–86.
Charles R, Jolliet O, Gaillard G, Pellet D. Environmental analysis of intensity level in wheatcrop production using life cycle assessment. Agr Ecosyst Environ 2006;113:216–25.
Dalgaard R, Schmidt JH, Halberg N, Christensen P, Thrane M, Pengue WA. LCA of soybeanmeal. Int J Life Cycle Assess 2007;8:324–30.
EPA. Compilation of air pollutant emissions factors; 1995.Erickson JE, Cisar JL, Volin JC, Snyder GH. Comparing nitrogen runoff and leaching be-
tween alternative residential landscapes. Crop Sci 2001;41:1889–95.FAO Food and Agriculture Organization; 2011 [http://faostat.fao.org/site/339/default.
aspx].Fernandez de Canete J, Garcia-Cerezo A, Garcia-Moral I, Del Saz P, Ochoa E.
Object-oriented approach applied to ANFIS modeling and control of a distillation col-umn. Expert Syst Appl 2013;40:5648–60.
Ferrari F, Karpouzas DG, Trevisan M, Capri E. Measuring and predicting environmentalconcentrations of pesticides in air after application to paddy water systems. EnvironSci Technol 2005;39:2968–75.
Gajaseni J. Energy analysis of wetland rice systems in Thailand. Agr Ecosyst Environ1995;52:173–8.
Galloway JN, Schlesinger WH, Levy HI, Michaels A, Schnoor JL. Nitrogen fixation: anthro-pogenic enhancement environmental response. Global Biogeochem Cycles 1995;9:235–52.
Hokazono S, Hayashi K. Variability in environmental impacts during conversion from con-ventional to organic farming: a comparison among three rice production systems inJapan. J Clean Prod 2012;28:101–12.
Ingwersen WW. Life cycle assessment of fresh pineapple from Costa Rica. J Clean Prod2012;35:152–63.
IPCC. IPCC guidelines for national greenhouse gas inventories. In: Buendia L, Miwa K,Ngara T, Tanabe K, editors. Prepared by the national greenhouse gas inventories pro-gramme, Japan; 2006.
ISO 14040. Environmental management: life cycle assessment; principles and framework.2nd. edn. ; 2006 [Geneva, Switzerland].
Khan MA, Awan IU, Zafar J. Energy requirement and economic analysis of rice productionin western part of Pakistan. Soil Environ 2009;28:60–7.
Khoshnevisan B, Rafiee S, Mousazadeh H. Environmental impact assessment of openfield and greenhouse strawberry production. Eur J Agron 2013. http://dx.doi.org/10.1016/j.eja.2013.05.003.
Kongshaug G. Energy consumption and greenhouse gas emissions in fertilizer production.IFA Technical Conference, Marrakech, Morocco; 1998.
Landeras G, López JJ, Kisi O, Shiri J. Comparison of gene expression programming withneuro-fuzzy and neural network computing techniques in estimating daily incomingsolar radiation in the Basque Country (Northern Spain). Energy Convers Manag2012;62:1–13.
McDougall F, White P, Franke M, Hindle P. “Life cycle assessment” in integrated solidwaste management: a life cycle inventory. Malden: Blackwell Science; 2001.
Milà i Canals L, Burnip GM, Cowell SJ. Evaluation of the environmental impacts of appleproduction using Life Cycle Assessment (LCA): case study in New Zealand. AgrEcosyst Environ 2006;114:226–38.
Mousavi-Avval SH, Rafiee S, Jafari A, Mohammadi A. Optimization of energy consumptionfor soybean production using Data Envelopment Analysis (DEA) approach. Appl En-ergy 2011;88:3765–72.
Mousazadeh H, Keyhani A, Mobli H, Bardi U, Lombardi G, el Asmar T. Environmental as-sessment of RAMseS multipurpose electric vehicle compared to a conventional com-bustion engine vehicle. J Clean Prod 2009;17:781–90.
Naderloo L, Alimardani R, Omid M, Sarmadian F, Javadikia P, Torabi MY, et al. Applicationof ANFIS to predict crop yield based on different energy inputs. Measurement2012;45:1406–13.
Nemecek T, Kagi T. Life cycle inventories of agricultural production systems. Eco inventreport No. 15 Dübendorf, CH: Swiss Centre for Life Cycle Inventories; 2007 [Availablefrom: http://www.ecoinvent.org/documentation/reports/].
Nemecek T, Huguenin-Elie O, Dubois D, Gaillard G, Schaller B, Chervet A. Life cycle assess-ment of Swiss farming systems: II. Extensive and intensive production. Agr Syst2011;104:233–45.
Nielsen PH, Weidema BP, Nielsen AM, Dalgaard R, Halberg N. LCA food database. www.lcafood.dk, 2005.
Pathak BS, Bining AS. Energy use pattern and potential for energy saving in rice–wheatcultivation. Energy Agric 1985;4:271–8.
Petković D, Ćojbašić Ž, Nikolić V, Shamshirband S, Mat Kiah ML, Anuar NB, et al. Adaptiveneuro-fuzzy maximal power extraction of wind turbine with continuously variabletransmission. Energy 2014a;64:868–74.
Petković D, Pavlović NT, Shamshirband S, Mat Kiah ML, Badrul Anuar N, Idna Idris MY.Adaptive neuro-fuzzy estimation of optimal lens system parameters. Opt Lasers Eng2014b;55:84–93.
Pishgar-Komleh SH, Sefeedpari P, Rafiee S. Energy and economic analysis of rice produc-tion under different farm levels in Guilan province of Iran. Energy 2011;36:5824–31.
PRé Consultants. SimaPro 5 Database Manual; 2003.Roy P, Shimizu N, Okadome H, Shiina T, Kimura T. Life cycle of rice: challenges and choices
for Bangladesh. J Food Eng 2007;79:1250–5.Safa M, Samarasinghe S. Determination and modelling of energy consumption in wheat
production using neural networks: “a case study in Canterbury province, NewZealand”. Energy 2011;36:5140–7.
Sahle A, Potting J. Environmental life cycle assessment of Ethiopian rose cultivation. SciTotal Environ 2013;443:163–72.
Shamshirband S, Kalantari S, Bakhshandeh Z. Designing a smart multi-agent system basedon fuzzy logic to improve the gas consumption pattern. Sci Res Essays 2010;5:592–605.
Shamshirband S, Petković, Ćojbašić Z, Nikolić N, Anuar NB, Liyana Shuib N, et al. Adaptiveneuro-fuzzy optimization of wind farm project net profit. Energy Convers Manag2014. http://dx.doi.org/10.1016/j.enconman.2014.01.038.
Singh S, Singh S, Mittal JP, Pannu CJS, Bhangoo BS. Energy inputs and crop yield relation-ships for rice in Punjab. Energy 1994;19:1061–5.

251B. Khoshnevisan et al. / Science of the Total Environment 481 (2014) 242–251
Suh S, Lenzen M, Treloar GJ, Hondo H, Horvath A, Huppes G. System boundary selec-tion in life-cycle inventories using hybrid approaches. Environ Sci Tech 2004;38:657–64.
Van den Berg LJL, Ashmore MR. Ecotoxicology: nitrogen. In: Jorgensen SE, Fath B, editors.Encyclopedia of ecology. Elsevier; 2008. p. 267–75.
Van derWerf HMG, Tzilivakis J, Lewis K, Basset-MensC. Environmental impacts of farm sce-narios according to five assessment methods. Agr Ecosyst Environ 2007;118:327–38.
Wrobel C, Reinhardt T. Review of potential air emissions from burning polyethylene plas-tic sheeting with piled forest debris. Report prepared for USDA Forest Service, PacificNorthwest; 2003.