Autophagy triggered by magnolol derivative negatively regulates angiogenesis
Upload
sungkyunkwanCategory
view
4download
0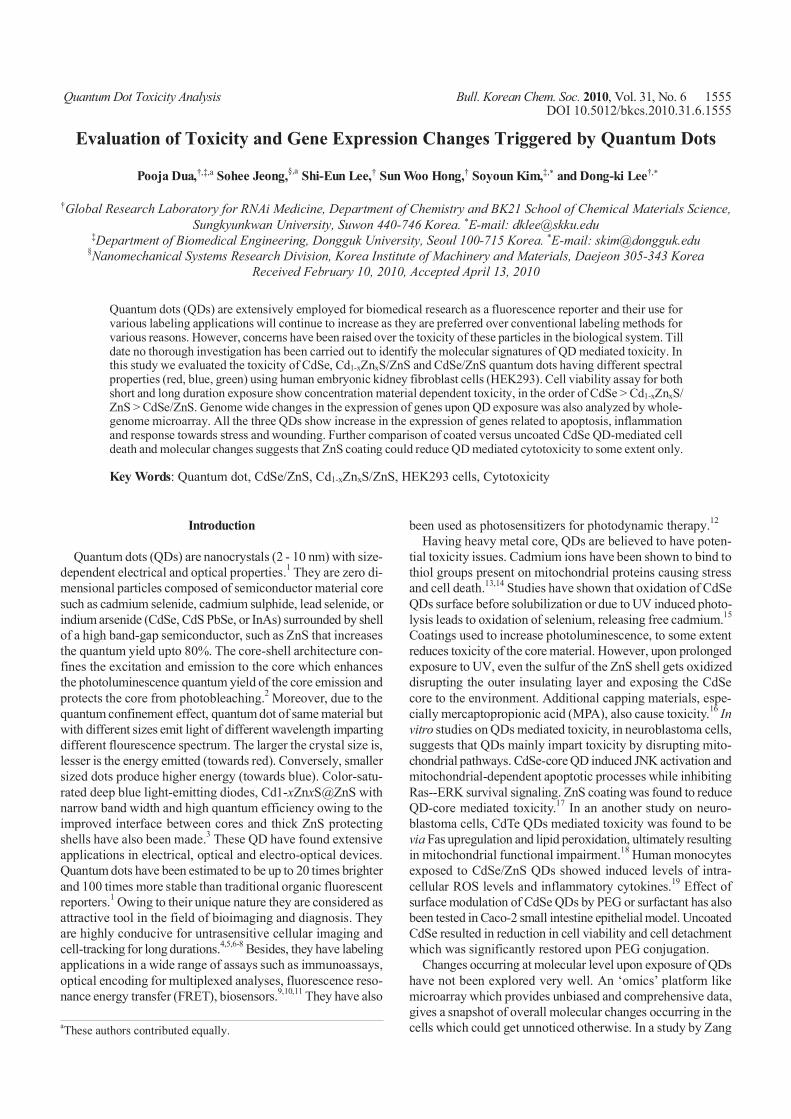
Quantum Dot Toxicity Analysis Bull. Korean Chem. Soc. 2010, Vol. 31, No. 6 1555DOI 10.5012/bkcs.2010.31.6.1555
Evaluation of Toxicity and Gene Expression Changes Triggered by Quantum Dots†Pooja Dua,†,‡,a Sohee Jeong,§,a Shi-Eun Lee,† Sun Woo Hong,† Soyoun Kim,‡,* and Dong-ki Lee†,*
†Global Research Laboratory for RNAi Medicine, Department of Chemistry and BK21 School of Chemical Materials Science, Sungkyunkwan University, Suwon 440-746 Korea. *E-mail: [email protected]
‡Department of Biomedical Engineering, Dongguk University, Seoul 100-715 Korea. *E-mail: [email protected]§Nanomechanical Systems Research Division, Korea Institute of Machinery and Materials, Daejeon 305-343 Korea
Received February 10, 2010, Accepted April 13, 2010
Quantum dots (QDs) are extensively employed for biomedical research as a fluorescence reporter and their use for various labeling applications will continue to increase as they are preferred over conventional labeling methods for various reasons. However, concerns have been raised over the toxicity of these particles in the biological system. Till date no thorough investigation has been carried out to identify the molecular signatures of QD mediated toxicity. In this study we evaluated the toxicity of CdSe, Cd1-xZnxS/ZnS and CdSe/ZnS quantum dots having different spectral properties (red, blue, green) using human embryonic kidney fibroblast cells (HEK293). Cell viability assay for both short and long duration exposure show concentration material dependent toxicity, in the order of CdSe > Cd1-xZnxS/ ZnS > CdSe/ZnS. Genome wide changes in the expression of genes upon QD exposure was also analyzed by whole- genome microarray. All the three QDs show increase in the expression of genes related to apoptosis, inflammation and response towards stress and wounding. Further comparison of coated versus uncoated CdSe QD-mediated cell death and molecular changes suggests that ZnS coating could reduce QD mediated cytotoxicity to some extent only.
Key Words: Quantum dot, CdSe/ZnS, Cd1-xZnxS/ZnS, HEK293 cells, Cytotoxicity
Introduction
Quantum dots (QDs) are nanocrystals (2 - 10 nm) with size- dependent electrical and optical properties.1 They are zero di-mensional particles composed of semiconductor material core such as cadmium selenide, cadmium sulphide, lead selenide, or indium arsenide (CdSe, CdS PbSe, or InAs) surrounded by shell of a high band-gap semiconductor, such as ZnS that increases the quantum yield upto 80%. The core-shell architecture con-fines the excitation and emission to the core which enhances the photoluminescence quantum yield of the core emission and protects the core from photobleaching.2 Moreover, due to the quantum confinement effect, quantum dot of same material but with different sizes emit light of different wavelength imparting different flourescence spectrum. The larger the crystal size is, lesser is the energy emitted (towards red). Conversely, smaller sized dots produce higher energy (towards blue). Color-satu-rated deep blue light-emitting diodes, Cd1-xZnxS@ZnS with narrow band width and high quantum efficiency owing to the improved interface between cores and thick ZnS protecting shells have also been made.3 These QD have found extensive applications in electrical, optical and electro-optical devices. Quantum dots have been estimated to be up to 20 times brighter and 100 times more stable than traditional organic fluorescent reporters.1 Owing to their unique nature they are considered as attractive tool in the field of bioimaging and diagnosis. They are highly conducive for untrasensitive cellular imaging and cell-tracking for long durations.4,5,6-8 Besides, they have labeling applications in a wide range of assays such as immunoassays, optical encoding for multiplexed analyses, fluorescence reso-nance energy transfer (FRET), biosensors.9,10,11 They have also
aThese authors contributed equally.
been used as photosensitizers for photodynamic therapy.12
Having heavy metal core, QDs are believed to have poten-tial toxicity issues. Cadmium ions have been shown to bind to thiol groups present on mitochondrial proteins causing stress and cell death.13,14 Studies have shown that oxidation of CdSe QDs surface before solubilization or due to UV induced photo-lysis leads to oxidation of selenium, releasing free cadmium.15 Coatings used to increase photoluminescence, to some extent reduces toxicity of the core material. However, upon prolonged exposure to UV, even the sulfur of the ZnS shell gets oxidized disrupting the outer insulating layer and exposing the CdSe core to the environment. Additional capping materials, espe-cially mercaptopropionic acid (MPA), also cause toxicity.16 In vitro studies on QDs mediated toxicity, in neuroblastoma cells, suggests that QDs mainly impart toxicity by disrupting mito-chondrial pathways. CdSe-core QD induced JNK activation and mitochondrial-dependent apoptotic processes while inhibiting Ras--ERK survival signaling. ZnS coating was found to reduce QD-core mediated toxicity.17 In an another study on neuro-blastoma cells, CdTe QDs mediated toxicity was found to be via Fas upregulation and lipid peroxidation, ultimately resulting in mitochondrial functional impairment.18 Human monocytes exposed to CdSe/ZnS QDs showed induced levels of intra-cellular ROS levels and inflammatory cytokines.19 Effect of surface modulation of CdSe QDs by PEG or surfactant has also been tested in Caco-2 small intestine epithelial model. Uncoated CdSe resulted in reduction in cell viability and cell detachment which was significantly restored upon PEG conjugation.
Changes occurring at molecular level upon exposure of QDs have not been explored very well. An ‘omics’ platform like microarray which provides unbiased and comprehensive data, gives a snapshot of overall molecular changes occurring in the cells which could get unnoticed otherwise. In a study by Zang

1556 Bull. Korean Chem. Soc. 2010, Vol. 31, No. 6 Pooja Dua et al.
et al., effect of PEG-silane QDs on human skin fibroblast cells HSF-42 were studied at both phenotypic and molecular level. Although some cell death and necrotic changes were observed by imaging, no significant changes in expression, in number or magnitude were seen with genome-wide microarray.20 To better understand the toxicity of QDs of different material composi-tion and coating, we performed genome wide microarray analy-sis of human embryonic kidney fibroblast cells (HEK-293) exposed to red, green and deep blue QDs at concentrations that show very marginal changes in cell viability.
Experimental Section
Cell culture and QDs. Human embryonic kidney 293 (HEK 293) cells were grown in the Dulbecco’s Modified Eagle Me-dium (Gibco BRL) containing 10% Fetal Bovine Serum (Gibco BRL) and 1% Penicillin and Streptomycin. CdSe, Cd1-xZnxS/ ZnS and CdSe/ZnS quantum dots were synthesized using pre-viously reported colloidal routes.21-23 And further modified to make them disperse in PBS buffer.24,25 Briefly, CdSe/ZnS core- shell quantum dots were prepared via step-wise process of CdSe or Cd1-xZnxS core synthesis followed by epitaxial growth of ZnS. Resulting quantum dots were washed extensively to remove any residual surfactants and further encapsulated with octyl-amine-modified polyacrylic acid. Polymer encapsulated quan-tum dots were dispersed in PBS. Photoluminescence maximum wavelength of each QDs were 455, 550, 625 nm, respectively.
WST-1 cell viability assay. HEK293 cells were seeded in 96-well cell culture plate at a density of 6 × 10³ cells per well and incubated overnight. The cells were incubated with CdSe/ ZnS (red), Cd1-xZnxS/ZnS (deep blue) and CdSe (green) at various concentrations in complete DMEM for 4 and 24 h. For each concentration 6 well replicates were taken. Following incubation, 10 µL of premix WST-1 reagent (TaKaRa) was added in each well and were further incubated for 2 h. The color development was measured on an ELISA plate reader at 450 nm. All absorbance values were corrected against blank which con-tained complete media alone. Percent cell viability was calculat-ed considering untreated control as 100% viable. Concentration that results in 50% cell death (IC50) was calculated using Sigma plot10.0.
DNA microarray. Cells were grown to 60% cell density and treated with CdSe/ZnS (red), Cd1-xZnxS/ZnS (deep blue), CdSe (green) in complete media for 4 h. Total RNA was extracted using the TRI Reagent® kit (Ambion) according to manu-facturer’s instructions. 10 µg of total RNA was used for each double-stranded cDNA (dscDNA) synthesis, employing a com-mercial kit (Invitrogen). Reactions were stopped with EDTA and the dscDNA treated with RNase A. Samples were ethanol- precipitated. 1 µg of dscDNA was used for labeling by Klenow fragment (NEB) using Cy3-labeled random 9 mer (TriLink Biotechnologies) and labeled samples were precipitated using isopropanol. 4 µg of Cy3-labeled DNA (containing sample tracking control and alignment oligo) was hybridized to Nim-blegen 385 K 4-plex human microarray for 18 h at 42 oC using the Nimblegen Hybridization system (Nimblegen). Arrays were washed and array images were obtained using a GenePix 4000B scanner (Axon Instruments).
Microarray data analysis. Scanned images were imported into NimbleScan software (Nimblegen). Expression data was normalized through quantile normalization and Robust Multi-chip Average (RMA) algorithm.26 To visualize overall changes in gene expression MA plots were generated, where X axis represents the average of log2 expression of control and test samples and Y axis corresponds to ratio of log2 expression value of test to control. Fold changes in expression for 24,000 genes were calculated for each nanoparticle relative to untreated control. Transcripts with more than 2 fold changes in either direction were selected. Commonly regulated genes were clus-tered using Eisen Cluster Analysis and Visualization Software.27 The genes that were differentially expressed by the test materials were functionally categorized using a web based program, Data-base for Annotation, Visualization and Integrated Discovery (DAVID).28 Enrichment in gene ontology terms, for both up- and down-regulated genes was seen at Fisher exact p < 0.05 and Count Threshold 2.
Results and Discussion
Synthesis and use of Quantum dots is continuously increas-ing due to their unique physicochemical properties and wide applications in biomedical sciences. Although there has been concerns about the toxicity they would impart due to the material they are composed of, yet, there is no sufficiently clear data in this regard. Moreover, the existing data derives contrasting conclusions which makes it even more difficult to classify QDs on toxicity scale.29,30 Therefore in the present study we have tried to understand the effect of exposure of QDs on human embryonic kidney fibroblast cells at both cellular and molecular level. We evaluated and compared the toxicity of QDs with different chemical composition and spectral properties. For this we used CdSe/ZnS (red-625), Cd1-xZnxS/ZnS (deep blue-550), CdSe (green-455). Amongst these red and blue QDs were sur-face encapsulated with ZnS, while green QD had a naked CdSe core.
To see the effect of QDs on HEK293 cell viability, cells were exposed to increasing concentrations of test materials for 4 and 24 h and cell viability was measured to account the toxicity at a cellular level. Untreated cells were used as control. In com-parison to other existing assays used to measure metabolic activity of viable cells, WST-1 assay is the most sensitive and has least background interference; hence was used in our study. As shown in Fig. 1, QDs showed a concentration-dependent loss in cell viability. Reduction in cell viability was more pro-minent for 24 h incubation. Amongst QDs, green QD without ZnS shell coating was found to be most toxic with IC50 of 19.09 nM and 8.35 nM for 4 and 24 h respectively. Amongst the coated QDs, blue QD was found to be more toxic than red QD at both the time points. The cell viability data suggests that QD show material dependent toxicity. Even size could have been a factor governing the toxicity as small sized QDs show better cell permeabilization, as has been shown earlier with both CdSe and CdTe QDs.31,32 Moreover, the toxicity was seen to be increased without ZnS epitaxial coating, which is in agree-ment with the earlier published findings.17
To further study the QD mediated changes at molecular level

Quantum Dot Toxicity Analysis Bull. Korean Chem. Soc. 2010, Vol. 31, No. 6 1557
CdSe/ZnS (red)
0 10 100 120 140 160 180 200
Concentration (nM)
Cd1-xZnxS/ZnS (blue)
0 10 20 40 60 80 100 200
Concentration (nM)
CdSe (green)
0 1 2 4 6 8 10 20
Concentration (nM)
(A)24hr 4hr
% C
ell V
iabi
lity
120
100
80
60
40
20
0
24hr 4hr120
100
80
60
40
20
0
% C
ell V
iabi
lity
% C
ell V
iabi
lity
120
100
80
60
40
20
0
24hr 4hr
(B)QD IC50 - 4hrs (nM) IC50 - 24hrs (nM)
CdSe/ZnS (red) ND 135.98Cd1-xZnxS/ZnS (blue) 79.81 42.34
CdSe (green) 19.09 8.35
Figure 1. Effect of CdSe/ZnS, Cd1-xZnxS/ZnS, CdSe on viability of HEK293 cells. Cell viability after 4 and 24 h exposure to the test compounds was determined by WST-1 assay (A). The data is represented as mean± SE of three independent experiments and is expressed as percent cell viability with respect to untreated control as 100% viable. The IC50 values of tested QDs as computed by Sigma plot 10.0 are given (B).
CdSe/ZnS(red)
Cd1-xZnxS/ZsS(blue)
8601198
852584
579729
320193 173
75
9141
134118
InducedRepressed
5 7 9 11 13 15
Mean Log2 Intensity
(A)
8
6
4
2
0
-2
-4
-6
-8
(B)
Inte
nsity
Rat
io (L
og2)
Cd1-xZNxS/ZnS (blue) CdSe/ZnS (green) CdSe/ZnS (red)
(C)
Figure 2. Venn diagrams illustrating genes induced or repressed by more than 2 fold upon nanoparticle exposure (A). MA Scatter plot showing overall distribution of gene expression upon nanoparticle exposure (B). The commonly regulated genes were clustered and tree view is given (C). The red and green color represents >2 fold up and down-regulated genes respectively.
1558 Bull. Korean Chem. Soc. 2010, Vol. 31, No. 6 Pooja Dua et al.
0 10 20 30 40 50
Number of genes
0 10 20 30 40 50 60
Number of genes
0 10 20 30 40 50
Number of genes
cadmium ion bindingdefense response
oxidative stress induced gene expression induction of apoptosis
MAPK signaling pathwaymetallothionein superfamily
response to stressresponse to wounding
CdSe/ZnS (red)
thermoregulationcellular response to stress
defense responsewound healing
apoptosisnegative regulation of metabolic process
regulation of cell cycleMAPK signaling pathway
inflammatory responsep53 signaling pathway
Cd1-xZnxS/ZnS (blue)
inflammatory responseresponse to stress
IL 6 signaling pathwayoxidative stress induced gene expression
p53 signaling pathwaydefense response
cell cycle arrestapoptosis
cadmium ion bindingchromatin assembly or disassembly
MAPK signaling pathwaymetallothionein superfamily
CdSe (green)
(A)
0 10 20 30 40
Number of genes
0 10 20 30
Number of genes
0 10 20 30
Number of genes
caspase activator activityTNF/Stress related signaling
apoptosiscell cycle arrest
p38 MAPK signaling pathwayATM signaling pathway
thermoregulationapoptotic mitochondrial changes
CdSe/ZnS (red)
chemotaxisinflammatory responseresponse to wounding
response to external stimuluschromatin assembly or disassembly
Cd1-xZnxS/ZnS (blue)
CdSe (green)
(B)
cytokine-cytokine receptor interactionresponse to external stimulus
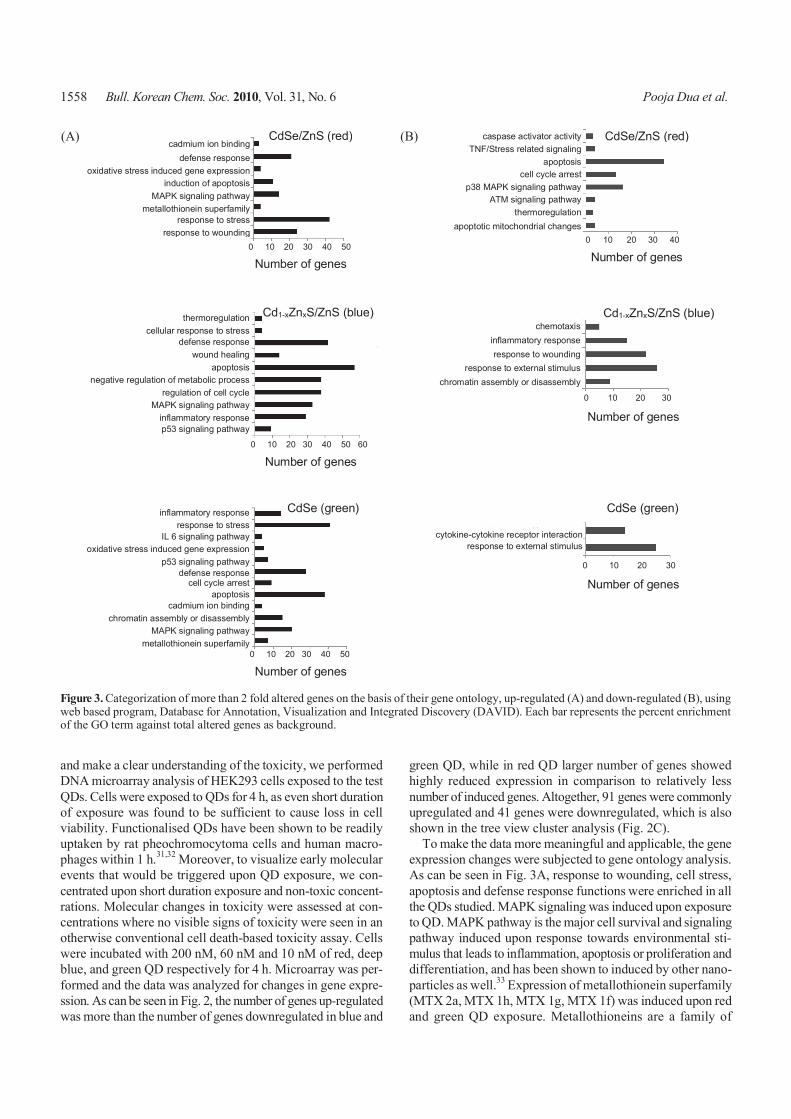
Figure 3. Categorization of more than 2 fold altered genes on the basis of their gene ontology, up-regulated (A) and down-regulated (B), using web based program, Database for Annotation, Visualization and Integrated Discovery (DAVID). Each bar represents the percent enrichment of the GO term against total altered genes as background.
and make a clear understanding of the toxicity, we performed DNA microarray analysis of HEK293 cells exposed to the test QDs. Cells were exposed to QDs for 4 h, as even short duration of exposure was found to be sufficient to cause loss in cell viability. Functionalised QDs have been shown to be readily uptaken by rat pheochromocytoma cells and human macro-phages within 1 h.31,32 Moreover, to visualize early molecular events that would be triggered upon QD exposure, we con-centrated upon short duration exposure and non-toxic concent-rations. Molecular changes in toxicity were assessed at con-centrations where no visible signs of toxicity were seen in an otherwise conventional cell death-based toxicity assay. Cells were incubated with 200 nM, 60 nM and 10 nM of red, deep blue, and green QD respectively for 4 h. Microarray was per-formed and the data was analyzed for changes in gene expre-ssion. As can be seen in Fig. 2, the number of genes up-regulated was more than the number of genes downregulated in blue and
green QD, while in red QD larger number of genes showed highly reduced expression in comparison to relatively less number of induced genes. Altogether, 91 genes were commonly upregulated and 41 genes were downregulated, which is also shown in the tree view cluster analysis (Fig. 2C).
To make the data more meaningful and applicable, the gene expression changes were subjected to gene ontology analysis. As can be seen in Fig. 3A, response to wounding, cell stress, apoptosis and defense response functions were enriched in all the QDs studied. MAPK signaling was induced upon exposure to QD. MAPK pathway is the major cell survival and signaling pathway induced upon response towards environmental sti-mulus that leads to inflammation, apoptosis or proliferation and differentiation, and has been shown to induced by other nano-particles as well.33 Expression of metallothionein superfamily (MTX 2a, MTX 1h, MTX 1g, MTX 1f) was induced upon red and green QD exposure. Metallothioneins are a family of

Quantum Dot Toxicity Analysis Bull. Korean Chem. Soc. 2010, Vol. 31, No. 6 1559
cystein-rich metal binding proteins that are involved in metal detoxification and protection of cells against reactive oxygen species (ROS). These proteins are also upregulated upon expo-sure of Cd2+ ions.34 With both green and red emitting QDs cad-mium ion mediated responses were enriched, suggesting that in case of CdSe core, both coated and non-coated, cadmium could leak out of the central core, which could be one of the main reasons of QD-associated toxic responses. This observation is in good agreement with earlier reported facts about QD toxi-city.15,35 However, metallothionein gene expression was not seen to be induced with deep blue emitting quantum dots. Nei-ther was any free Cd2+ mediated gene expression observed in this case, suggesting that Cd1-xZnxS/ZnS, comparatively have more stable structure. The thick inorganic shell in these QDs due to extra zinc makes them highly resistant to environmental exposure.36 Also, oxidative stress mediated response-associated genes were seen to be induced by both red and green QDs, but not blue. In comparison to red and blue QDs, green QD show-ed much stronger enrichment in toxicity associated functions. IL6 signaling pathway (IL6R, vFOS, vJUN), cell cycle arrest and P53 signaling pathway (GADD45 (G,A,B), serpin1, PMA 1P1) was found to be strongly induced with these naked QDs. Amongst genes that were commonly up-regulated by all the three QDs, some showed association with inflammation and cell stress (FOSB, EGR1,TAK1, INHEB, RAB33A).
In comparison to the up-reguation in toxicity associated pro-cesses, very few toxicity associated functions were down-re-gulated (Fig. 3B). Down-regulated genes in red QD showed strong enrichment in antiapoptotic functions. Reduction in acti-vation of Caspases and ATM damage sensing signaling pathway along with inhibition in p38 MAPK pathway was seen, which suggests that upon cellular DNA damage induced apoptosis and inflammation, cells respond and in turn try to inhibit the cell death by various mechanisms. Deep blue QD also showed reduction in expression of genes involved in inflammation and wounding.
Conclusion
HEK293 cells exposed to Cd based quantum dots with di-fferent spectral properties and material composition show toxic responses. The effect of QD exposure analysed by microarray analysis suggests that QDs induce expression of oxidative stress, apoptosis and inflammation associated genes which results in loss in cell viability. We should note that the polymer coating on the surface of QDs could potentially trigger the core material- independent cytotoxicity.35 Nonetheless, the concentration- dependent cell viability assay suggests that at least for the three QDs tested in our experiment, QD mediated toxicity is mainly dependent on core material and ZnS coating partially reduces the toxicity of the metallic core. Overall, our results support the idea that the use of unmodified QDs for biomedical purposes should be followed with careful consideration.
Acknowledgments. This work was supported by the grant from Ministry of Environment as "The Eco-technopia 21 pro-ject" (091-081-073) and Global Research Laboratory grant 2008-00582 from National Research Foundation of Korea to
D.-k. L. P.D acknowledges the support from Sungkyunkwan University Post-doctoral Fellowship 2008. S. Jeong acknow-ledges the support from the Nano R&D program through the Korea Science and Engineering Foundation funded by the Ministry of Education, Science and Technology (Grant 2009- 0083219) and National Platform Technology Project of Ministry of Knowledge Economy.
References
1. Bruchez, M., Jr.; Moronne, M.; Gin, P.; Weiss, S.; Alivisatos, A. P. Science 1998, 281, 2013-2016.
2. Danek, M. J., K. F.; Murray, C. B.; Bawendi, M. G. Chem. Mater. 1996, 8, 173-180.
3. Ki Bae, W.; Kwak, J.; Lim, J.; Lee, D.; Ki Nam, M.; Char, K.; Lee, C.; Lee, S. Nanotechnology 2009, 20, 75202.
4. Tholouli, E.; Sweeney, E.; Barrow, E.; Clay, V.; Hoyland, J. A.; Byers, R. J. J. Pathol. 2008, 216, 275-285.
5. Cui, B.; Wu, C.; Chen, L.; Ramirez, A.; Bearer, E. L.; Li, W. P.; Mobley, W. C.; Chu, S. Proc. Natl. Acad. Sci. USA 2007, 104, 13666-13671.
6. Chan, W. C.; Nie, S. Science 1998, 281, 2016-2018. 7. Voura, E. B.; Jaiswal, J. K.; Mattoussi, H.; Simon, S. M. Nat. Med.
2004, 10, 993-998. 8. Walling, M. A.; Novak, J. A.; Shepard, J. R. Int. J. Mol. Sci. 2009,
10, 441-491. 9. Medintz, I. L.; Konnert, J. H.; Clapp, A. R.; Stanish, I.; Twigg,
M. E.; Mattoussi, H.; Mauro, J. M.; Deschamps, J. R. Proc. Natl. Acad. Sci. USA 2004, 101, 9612-9617.
10. Duong, H. D.; Rhee, J. I. Talanta 2007, 73, 899-905.11. Kang, W. J.; Chae, J. R.; Cho, Y. L.; Lee, J. D.; Kim, S. Small
2009, 5, 2519-2522.12. Yaghini E, S. A. Nanomedicine (Lond) 2009, 3, 353-363.13. Rikans, L. E.; Yamano, T. J. Biochem. Mol. Toxicol. 2000, 14,
110-117.14. Li, M.; Xia, T.; Jiang, C. S.; Li, L. J.; Fu, J. L.; Zhou, Z. C. Toxi-
cology 2003, 194, 19-33.15. Derfus, A. M. C.; W. C. W.; Bhatia, S. N. Nano Lett. 2004, 4,
2163-2169.16. Hoshino A, F. K.; Oku, T.; Suga, M.; Sasaki, Y.; Ohta, T. Nano
Lett. 2004, 4, 2163-2169.17. Chan, W. H.; Shiao, N. H.; Lu, P. Z. Toxicol. Lett. 2006, 167, 191-
200.18. Choi, A. O.; Cho, S. J.; Desbarats, J.; Lovric, J.; Maysinger, D. J.
Nanobiotechnology 2007, 5, 1.19. Lee, H. M.; Shin, D. M.; Song, H. M.; Yuk, J. M.; Lee, Z. W.; Lee,
S. H.; Hwang, S. M.; Kim, J. M.; Lee, C. S.; Jo, E. K. Toxicol. Appl. Pharmacol. 2009, 238, 160-169.
20. Zhang, T.; Stilwell, J. L.; Gerion, D.; Ding, L.; Elboudwarej, O.; Cooke, P. A.; Gray, J. W.; Alivisatos, A. P.; Chen, F. F. Nano Lett. 2006, 6, 800-808.
21. Murray, C. B. N., D.; Bawendi, M. G. J. Am. Chem. Soc. 1993, 115, 8706-8715.
22. Bae, W. K. N., M. K.; Char, K.; Lee, S. Chem. Mater. 2008, 20, 5017-5323.
23. Hines, M. A. G.-S., P. J. Phys. Chem. 1996, 100, 468-471.24. Jeong, S.; Achermann, M.; Nanda, J.; Ivanov, S.; Klimov, V. I.;
Hollingsworth, J. A. J. Am. Chem. Soc. 2005, 127, 10126-10127.25. Wu, X.; Liu, H.; Liu, J.; Haley, K. N.; Treadway, J. A.; Larson,
J. P.; Ge, N.; Peale, F.; Bruchez, M. P. Nat. Biotechnol. 2003, 21, 41-46.
26. Hong, S. W.; Hong, S. M.; Yoo, J. W.; Lee, Y. C.; Kim, S.; Lis, J. T.; Lee, D. K. Proc. Natl. Acad. Sci. USA 2009, 106, 14276-14280.
27. Eisen, M. B.; Spellman, P. T.; Brown, P. O.; Botstein, D. Proc. Natl. Acad. Sci. USA 1998, 95, 14863-14868.
28. Dennis, G., Jr.; Sherman, B. T.; Hosack, D. A.; Yang, J.; Gao, W.; Lane, H. C.; Lempicki, R. A. Genome. Biol. 2003, 4, 3.

1560 Bull. Korean Chem. Soc. 2010, Vol. 31, No. 6 Pooja Dua et al.
29. Geys, J.; Nemmar, A.; Verbeken, E.; Smolders, E.; Ratoi, M.; Hoylaerts, M. F.; Nemery, B.; Hoet, P. H. Environ. Health Per-spect 2008, 116, 1607-1613.
30. Hauck, T. S.; Anderson, R. E.; Fischer, H. C.; Newbigging, S.; Chan, W. C. Small 2010, 6, 138-144.
31. Lovric, J.; Bazzi, H. S.; Cuie, Y.; Fortin, G. R.; Winnik, F. M.; Maysinger, D. J. Mol. Med. 2005, 83, 377-385.
32. Clift, M. J.; Rothen-Rutishauser, B.; Brown, D. M.; Duffin, R.; Donaldson, K.; Proudfoot, L.; Guy, K.; Stone, V. Toxicol. Appl. Pharmacol. 2008, 232, 418-427.
33. Park, E. J.; Yi, J.; Chung, K. H.; Ryu, D. Y.; Choi, J.; Park, K. Toxicol. Lett. 2008, 180, 222-229.
34. Klaassen, C. D.; Liu, J.; Diwan, B. A. Toxicol. Appl. Pharmacol. 2009, 238, 215-220.
35. Kirchner, C.; Liedl, T.; Kudera, S.; Pellegrino, T.; Munoz Javier, A.; Gaub, H. E.; Stolzle, S.; Fertig, N.; Parak, W. J. Nano Lett. 2005, 5, 331-338.
36. Chen, Y.; Vela, J.; Htoon, H.; Casson, J. L.; Werder, D. J.; Bussian, D. A.; Klimov, V. I.; Hollingsworth, J. A. J. Am. Chem. Soc. 2008, 130, 5026-5027.
Copyright © 2022 FDOKUMEN