Evaluation of the impact of ownership structure ... - DiVA Portal
53
Evaluation of the impact of ownership structure on Environmental and Social performance Evidence from Swedish companies Master thesis Author: Olga Keynonen Supervisor: Natalia Semenova Examiner: Ulf Larsson Olaison Term: VT18 Subject: Business Administration Level: Second level Course code: 4FE21E
-
Upload
khangminh22 -
Category
Documents
-
view
4 -
download
0
Transcript of Evaluation of the impact of ownership structure ... - DiVA Portal

Evaluation of the impact of
ownership structure on
Environmental and Social
performance
Evidence from Swedish companies
Master thesis
Author: Olga Keynonen
Supervisor: Natalia Semenova
Examiner: Ulf Larsson Olaison
Term: VT18
Subject: Business Administration
Level: Second level
Course code: 4FE21E


Abstract
Corporate social responsibility (CSR) is widely discussed in the business
community in terms of its effectiveness. However, studies of factors that can
affect CSR are not so many. The purpose of this study is to evaluate of the
impact of ownership structure on Environmental and Social performance. This
study was conducted on the example of 174 cases among Swedish companies,
listed on the Stockholm Stock Exchange, Environmental and Social
performance, which was represented by the largest information provider
Thomson Reuters. Using the experience of previous studies, a model of
relationship between ownership structure and Environmental and Social
performance was founded and a multiple regression analysis was performed.
The most significant result of the study, confirmed by previous empirical
studies and theoretical literature, is the existence of a relationship between
capital structure and CSR performance. Foreign investors, who came to the
Swedish market, have a stable positive connection with performance. This
form of ownership, like majority control, did not find sufficient evidence to
the impact on Environmental and Social performance in this study. The
Minority control and Joint Minority and Management control showed no
influence on performance in Swedish companies.
Key words
Corporate Social Responsibility (CSR), Ownership structure, Agency theory,
Stakeholder theory, Socioemotional wealth (SEW), Environmental
Performance, Social Performance, Majority control, Minority control,
Management control, Foreign ownership.

Acknowledgments
First of all, I would like to express my gratitude to Linnaeus University and
pedagogical staff, who offered me this economic program, where I got the
necessary knowledge and skills to carry out a study. Without the support of
these people, I could not complete this thesis.
Special thanks go to my examiner Ulf Larsson Olaison who inspired me to
write this paper and provided me with great support in the area of my
theoretical research in CSR.
Heartfelt gratitude is expressed to the supervisor or Semenova Natalia who
opened for me a way to the world of empirical research of CSR performance
and helped me to find a sufficient amount of data for studying Swedish
companies.
In addition, I would like to thank Åsa Gustavsson for patience and tolerance
to international students and great help in acquiring the skills of oppositional
discussions.
I am, of course, grateful to my family, who supported me.
I thank you all very much!

Table of contents
1 Introduction .................................................................................................... 1
1.1 Background .............................................................................................. 1
1.2 Problem area ............................................................................................ 2
1.2.1 Owner structure and CSR performance. How they can be related? 2
1.2.2 Arguments for the influence of the ownership structure on CSR performance ..................................................................................................... 3
1.2.3 Motivation for choosing country ..................................................... 5
1.3 Purpose ..................................................................................................... 6
1.4 Delimitation ............................................................................................... 6
1.5 Structure .................................................................................................... 6
2 Methodology ................................................................................................... 7
2.1 Scientific perspective .............................................................................. 7
2.2 Scientific approach .................................................................................. 8
2.3 Research strategy ................................................................................... 8
2.4 Research design ...................................................................................... 9
3 The theoretical framework ........................................................................ 10
3.1 The theoretical framework of previous study .................................... 10
3.2 The influence of agency theory ........................................................... 10
3.3 The influence of stakeholder theory ................................................... 11
3.4 Ownership classification ....................................................................... 12
3.5 The role family ownership in relationship between ownership structure and CSR performance ..................................................................... 13
3.6 The role institutional ownership in relationship between ownership structure and CSR performance ..................................................................... 14
3.7 The role foreign ownership in relationship between ownership structure and CSR performance ..................................................................... 15
3.8 Swedish context ..................................................................................... 16
3.8.1 Ownership structure in Sweden .................................................. 16
3.8.2 CSR performance in Sweden ...................................................... 17
3.9 Hypothesis development ...................................................................... 17
4 Empirical part ............................................................................................... 20
4.1 Sampling method and data collection ................................................ 20
4.2 Analysis method .................................................................................... 21
4.2.1 Model specification ........................................................................ 21
4.2.2 Dependent variable ....................................................................... 22
4.2.3 Independent variable ..................................................................... 22
4.2.4 Control variable .............................................................................. 23
4.2.5 Descriptive Statistics ..................................................................... 23
4.2.6 Assumptions for multiple regression analysis ........................... 24
4.2.7 Multiple regression with stepwise method ................................. 25
4.3 Scientific credibility ................................................................................ 25
4.4 Ethical considerations ........................................................................... 27

5 Result and discussion ............................................................................... 28
5.1 Empirical results..................................................................................... 28
5.2 Analysis ................................................................................................... 31
6 Conclusion .................................................................................................... 34
Referents ............................................................................................................... 36
Appendices
Appendix 1
Table of ESG ASSETS 4 Environmental and Social performance of Swedish
companies for period from 2104 to 2016………………………………...…41

1(47)
1 Introduction
1.1 Background
One of the most important trends among the business community of recent
times is the growth of corporate social responsibility (CSR). The very idea that
companies voluntarily take into account the interests of society and are
responsible for how business influences public interests is not new. There are
both CSR supporters and CSR opponents all over the world, but CSR practices
are spreading more and more in many countries (Carroll et al., 2010).
Attention to this issue is so high that special systems of assessments of CSR
performance have been formed. Along with the ratings of the business
reputation of companies such as “America’s most admired companies”,
“World’s most respected companies”, “Most Admired Company”, social stock
indices are published (DSI400, FTSE 4 Good, Dow Jones Sustainability Index,
NASDAQ Social Index) and (CPI, Social Index (SI)). New discussions in the
business community relate no longer to the existence of CSR, as such, but
about which CSR case to apply (Matten and Moon, 2008) for solving serious
economic, environmental and social problems.
Successful application of business case models leads to lower costs and risks,
increases long-term shareholder value, reduces staff turnover, improves team
morale, uniqueness of projects and increases the company’s competitiveness
(Carroll et al., 2010). In addition, the use of CSR helps build relationships with
stakeholders and attracts investors, enhances the reputation and legitimacy of
the company and helps in finding win-win options for business. The
combination of businesses’ interests and participation in CSR lead to the fact
that social and economic problems turn into an economic benefit (Carroll et
al., 2010).
However, despite the processes of globalization of the world community
(Yoshikawa and Rasheed, 2009) there are differences in the understanding of
CSR between, for example, the US and European countries (Matten and Moon,
2008). This may be due, first of all, to the cross-national differences in
corporate governance (Filatotchev et al., 2013), which in turn is due to the
historical differences between Anglo-Saxon model and Rhenish models of
capitalism (Nölke and Perry, 2008). The Rhenish model in the classification
of Michel Albert (Albert, 1991) is typical for all economically developed

2(47)
countries in Europe. In later literature, the European model of capitalism is
called social (Crouch, 2005). A distinctive feature of Europe has always been
a high concentration of property. In addition, two-thirds of all European
companies are family companies (KPMG, 2015). The European market model
is more integrated into the social and political structure than the US economy.
The European stock market is not the central source of funds for companies.
More than that, in European countries governments are more concerned with
economic and social activities, unlike the US (Matten and Moon, 2008). The
task of a social state in the European tradition is not only a guarantee of the
effectiveness of the law, but also the provision of a social state, at least a
minimum level of social security (Nölke and Perry, 2008). These features of
different models of capitalism have led to differences in corporate governance
between different countries.
The international flows of goods, services and information that are growing
every year, the growing mobility of people in an open economy, and the
democratization of the financial resources lead to the financialization of
society (van der Zwan, 2014). Understanding of the cross-national differences
in corporate governance leads to the recognition of the importance of national
institutions (Filatotchev et al., 2013) but also explains some of the problems
of convergence of the global economy (Yoshikawa and Rasheed, 2009).
The structure of world capital is changing, large companies are focusing on
international financial markets, the presence of foreign investors is increasing
worldwide. Reforms of national pension systems create new links between
Europe and world markets, trade unions grow, the interests of the owner and
employee are combined (van der Zwan, 2014). This, in turn, requires new
views on corporate governance and its modern component - corporate social
responsibility of business.
1.2 Problem area
1.2.1 Owner structure and CSR performance. How they can be related?
Interest in the corporate social responsibility of business among investors,
politicians, economists and society as a whole has generated the interest to
identify factors that could affect to CSR performance. At present, not much
research has been done to provide answers to all the questions, to study all the
interrelations regarding to CSR performance. This paper focuses on two areas

3(47)
of corporate governance: corporate social responsibility of business in
assessing the company’s environmental and social performance and the
company’s ownership structure in terms of its impact on strategic decision-
making. How can they be related? As whole, previous studies in the field of
ownership structure, such as: Lehmann and Weigand (2000), Gompers et al.
(2003), Cornett et al. (2007) show the connection between the best
management of the company’s performance. However, studies of the
relationship between ownership structure and CSR performance have more
controversial results. A study among US companies has shown that the impact
of family ownership can vary in different dimensions of CSR performance.
Family businesses can be positively and negatively related to CSR
performance at the same time (Block and Wagner, 2014). Studies of French
listed companies have shown that neither family nor institutional shareholders
affect the CSR performance, and large shareholders pay less attention to CSR
performance and are reluctant to invest in it (Ducassy and Montandrau, 2015).
The results of a study about the influence of stakeholders (in the form of
controlling shareholders) on the CSR performance show that there is a positive
relationship between state-controlled possessions and the CSR performance,
while other types of shareholders do not affect the CSR performance (Lopatta
et al., 2017). The study of foreign ownership levels among Chinese companies
showed higher CSR performance in companies with a higher share of foreign
ownership (Mcguinness, et.al., 2017). A study among European multinational
firms show that the concentration of shareholders is significantly related to
CSR policies (Dam and Scholtens, 2013).
1.2.2 Arguments for the influence of the ownership structure on CSR performance
One of the arguments in favor of the relationship between the ownership
company’s structure and company’s performance (through strategic decisions)
lies in agency theory. The agency theory describes not only the relationship
between the investor and the management of the firm (Jensen and Meckling,
1976) but also takes into account the different interests of small shareholders
compared to large shareholders. A large shareholder can effectively monitor
and influence the company’s strategy (Shleifer and Vishny, 1997) and through
the Board, large owners can promote a clear representation of the interests of
shareholders in the decision-making process (Hillman and Dalziel, 2003).
Minority shareholders' rights, on the contrary, are not protected, they may not
be able to effectively control the administration (La Porta et al, 1998).

4(47)
Managers, who are also part of the agency conflict, can act opportunistically
(Fama and Jensen, 1983). Having, as a rule, better and relevant information
(Fama, 1980), managers actively participate in business and influence the
strategic decisions and company’s performance. From the point of view of
stakeholder theory, management’s activity is based on the principles of
legitimacy and fiduciary (Evan and Freeman, 1988) and is not aimed at
protecting the interests of the large owners.
The second argument in support of the impact of ownership structure on
company’s performance relates to such type of large owner, as a family owner.
Despite the obvious interest of any investor to maximize profits (Friedman,
1970), large family owners associated with the company, may be interested in
maximizing the value of the company through strategic decisions (including
CSR performance). The goal of family owners is the benefits associated with
the company’s reputation (Carroll et al., 2010) and the enhancement of their
own reputation as people with high social responsibility. The logic behind this
is in the theory of socioemotional wealth (SEW), which suggests that family
firms are motivated by the conservation of SEW in their strategic decisions
(Berrone et al., 2012). However, the cost of CSR performance is an additional
expense for a company that destroys the wealth of shareholders and runs
counter to the principle of maximizing profits (Demsetz and Lehn 1985).
Therefore, other owners cannot approve CSR performance if they do not see
the benefits.
Third argument in support of the impact of ownership structure on company’s
performance is associated with an increase in the worldwide share of foreign
investors (Yoshikawa and Rasheed, 2009). Two aspects are of interest here.
On the one hand, a foreign investor evaluating financial risks, will look for
companies with better performances (Oxelheim and Randoy, 2005). On the
other hand, with the increase in the share of foreign investors in the company,
the company’s policy regarding company’s performance (CSR performance)
may change due to the fact that foreign investors will impose their
understanding of CSR performance. Differences in the understanding of CSR
performance may be related to the specifics of the formation of CSR cases in
different countries around the world (Matten and Moon, 2008), related to
historical, cultural, economic and political prerequisites and different systems
of capitalism (Nölke and Perry, 2008).

5(47)
1.2.3 Motivation for choosing country
In this study, the author will concentrate on Sweden. Sweden was chosen, first
of all, as a country with high CSR performance. The Swedish CSR, in this
paper, is an example of a European country where an active business
community has created a flexible CSR concept (De Geer et al., 2009) and
where social and environmental issues are solved quite successfully. The
Swedish CSR is characterized by state regulation and responsibility to
shareholders. The flexibility of the Swedish CSR concept lies in the fact that
the traditional ideals of the Swedish welfare state do not conflict with the
solution of global environmental and social problems (De Geer et al.,2009).
Swedish companies take an active part in environmental protection projects,
energy-saving, resource-saving programs and occupy high places in
international social and environmental ratings. Social performance of Swedish
CSR is aimed at developing the rights of workers, educational projects, R&D
and improving the safety of working conditions (CSR in Sweden, 2017).
Besides, Sweden, as a member of the Scandinavian family of countries,
historically was characterized by a high concentration of property (La Porta
et.al.,) and the stability of large enterprises (Högfeldt, 2005). Large Swedish
business (its family basis), together with the two largest banks, controls more
than half of the total market value of the Stockholm Stock Exchange (Högfeldt,
2005). In 1993, Sweden deregulated the financial market, which facilitated the
entry of foreign investors into the Swedish market. As a result, foreign owners
began to invest increasingly in the Swedish market, compared with many other
markets. This led to a significant increase in foreign ownership on the
Stockholm Stock Exchange (Holmén, 2011).
Previous studies of the relationship between the ownership structure and CSR
performance were conducted among US companies, some European and Asian
companies and their results are not unambiguous. Therefore, the author hopes
to supplement this poorly studied research area with the example of Swedish
companies. The author also considers that this study may be interesting to
potential investors with high social responsibility, as well as analysts in terms
of disclosing information on the relationship between the ownership structure
and CSR performance.

6(47)
1.3 Purpose
The purpose of this article is to evaluate the impact of ownership structure on
Environmental and Social performance. The study is conducted among
Swedish companies listed on the Swedish Stock Exchange.
1.4 Delimitation
In this paper are studied Swedish companies, Environmental and Social
performance of which are provided by the information provider Thomson
Reuters. This, somewhat, limited the number of companies listed on the
Swedish Stock Exchange, that could participate in this study. Companies were
selected from a Large, Medium and Small list. But the number of companies
on the Small list is insignificant compared to the Large and Medium ones. This
delimitation is done because information about these companies is publicly
available, which facilitates the conduct of the study. The study period is also
limited from 2014 to 2016. During this period of research, the companies
experienced both ups and downs, which leads to more equitable result when a
particular business cycle does not affect the results of the study. The
phenomenon that is not considered in this study is the so-called property of the
pyramid. Owners of companies are accepted as separate actors, independent
of each other. The limitation in the study is that the study measures the
proportion of the voting rights of investors, rather than the proportion of
ownership.
1.5 Structure
Methodology this research is presented in Part 2 of the paper. The theoretical
foundations of this research that develop into hypotheses of empirical research
will be found in Part 3. In addition, this part describes characteristics of such
owners as family owners, institutional investors and foreign owners, as well
as the Swedish context of this study. Part 4 is devoted to empirical regression
analysis. Part 5 gives detailed analysis of the results and significance of the
study. Finally, Part 6 presents the conclusions of this document and offers
suggestions for further research in the field of this problem.

7(47)
2 Methodology
2.1 Scientific perspective
Business research is research aimed at business and management. Such study
includes sociology, psychology, anthropology and economics for conceptual
and theoretical inspiration (Bryman and Bell, 2015). Business research
strategy can be based on positivist philosophy, realism or interpretivism.
Positivism is based on applying the principles of the natural sciences to study
social reality. This is an objective approach that focuses on testing theories and
establishing scientific laws. In its most general form, its main purpose is to
establish the cause and effect. Interpretivism proceeds from the assumption
that subjective meanings play a key role in social action. Its purpose is to
identify key interpretations and meanings shared by individuals and social
groups. Realism asserts that structures are the basis of social events and
discourses, but since they are observed only indirectly, they should be
described in theoretical terms and, accordingly, are conditional in nature
(Walliman, 2006).
This paper is built on the basis of a positivist view of knowledge (the
philosophy of positivism), based on assumptions that have been made and are
empirically verified, and then confirmed or rejected. For this, the author
studies the impact of ownership structure on Environmental and Social
performance, that can be confirmed or rejected by hypotheses derived from
selected theories. Then these hypotheses are checked using models that will
find the patterns of the empirical data on which the study is based. The results
depend on quantitative observations that lead to statistical analysis. In these
studies, the role of the researcher is limited to the collection of data and
interpretation in an objective manner. The author is independent of the
research and in the study there are no provisions relating to human interests,
so studies can be objective. The author’s own interpretations do not play a
decisive role in the results of this type of research, that is, the result will be the
same if another researcher studies the data used.

8(47)
2.2 Scientific approach
Among the general approaches to obtaining new knowledge on the basis of
previously obtained knowledge (theories), the most common are deductive and
inductive methods (Saunders et al., 2009; Bryman and Bell, 2015). The
deductive approach describes the relationship between different variables,
which is aimed at checking the correctness of the theories. Deduction (from
the Latin “deductio”) is a transition in the process of cognition from general
knowledge about a certain class of objects and phenomena to knowledge of
the particular and the individual. The deductive approach includes: Theory,
Hypothesis, Data collection, Findings, Hypothesis confirmed or rejected and
Revision of theory (Bryman and Bell, 2015).
Induction (from the Latin “inductio”) is a transition in the process of cognition
from private knowledge to the general; from the knowledge of a lesser degree
of community to the knowledge of a greater degree of community. In other
words, it is a method of research, cognition, connected with the generalization
of the results of observations and experiments. The main function of induction
in the process of cognition is obtaining general judgments, in which empirical
and theoretical laws, hypotheses, generalizations can act. (Bryman and Bell,
2015; Saunders et al., 2014).
The scientific approach of this study will be deductive with developing
hypotheses on the basis of the existing theory. This approach has also been
used most often in previous studies in this field (Dam and Scholtens, 2013;
Block and Wagner, 2014; Ducassy and Montandrau, 2015; Lopatta et al.;
Mcguinness, et.al., 2017). Hypotheses will be proposed by the author to study
the positive or negative relationship between the type of ownership structure
and the Environmental and Social Performance of Swedish companies.
Hypotheses are formulated on the basis of theories of corporate governance
and corporate social responsibility and meet the goals and problems of this
paper.
2.3 Research strategy
For business research, the choice of research strategies, as a rule, consists of
qualitative and quantitative research. Quantitative research is a research
strategy that focuses on the quantitative collection and analysis of data, and is

9(47)
associated with a deductive approach, testing theories, combining practices
with norms, a natural scientific model with a positivist approach related to
objective reality (Bryman and Bell, 2015).
Qualitative research, accordingly, is a research strategy that focuses on
qualitative data analysis and is associated with an inductive approach in the
relationship between theory and research, in which a new theory is generated,
practices and norms are rejected, preference is given to individual interpreting
and a view of social reality as a new (Bryman and Bell, 2015). Given the
purpose of this study, as well as a positive philosophy and a didactic approach,
the author will apply a quantitative study.
2.4 Research design
Research design is a combination of requirements for the collection and
analysis of data needed to achieve the research objectives (Mouton, 1996). To
better investigate the impact of the ownership structure on the CSR
Performance of the company, a quantitative data analysis is conducted, that
entails the collection of numerical data and the manifestation of the view on
the relationship between theory and research as deductive. Quantitative
research examines the relationship between numerical measurable values
using statistical methods. This will allow us to strengthen theoretical trends
with empirical data from different companies. This methodology is also
suitable for studies based on a positivist view of knowledge, for investigating
cause relationships (Bryman and Bell, 2015).

10(47)
3 The theoretical framework
3.1 The theoretical framework of previous study
Deductive researches intend the study of well-known theories from the field
of relations about studied objects. (Bryman and Bell, 2015). Deductive
researches in the field of corporate governance involve the study of theories
from the field of corporate governance. Researchers who study the impact of
ownership structure on CSR performance look for answers, for example, in the
conflict of interests between large and small owners (Hope; Dam and
Scholtens, 2013; Ducassy and Montandrau, 2015), between foreign and
domestic owners ((Mcguinness, et.al., 2017); they explore difference between
family and nonfamily companies (Block and Wagner, 2014) or assess the
impact of state regulation (Lopatta, 2017).
3.2 The influence of agency theory
In this study, the author turns to the agency theory. Jensen and Meckling
describe the corporation as an amazing social acquisition. Millions of people
voluntarily entrust to managers millions dollars. The growth of the market
value of the corporation assumes that creditors and investors were not
disappointed with the results, despite the costs of the agency (Jensen and
Meckling,1976). In other words, the goals of the investors were achieved.
However, the goals of different type of investors may differ, which leads to a
conflict of interest.
An example of such a conflict of interest is the conflict between large and
small shareholders (Hope, 2013). Despite the fact that any investor is interested
in maximizing profit (Friedman, 1970) and is not interested in additional costs,
the large owners can seek to attain other goals. For example, the large owners
may be interested in improving the company’s reputation (or their own
reputation) (Carroll et al., 2010) and increasing the value of the company
through additional costs for CSR performance (Jensen and Meckling, 1976).
In addition, large owners can perform effective monitoring and thereby
influence the company’s operations and strategy (Shleifer and Vishny, 1997).
In the same time, the role of minority owners depends on the overall protection

11(47)
of shareholder rights in the country (La Porta et al., 1998) and they may not be
able to effectively control the management.
The second conflict of interest arises between agent and principal
(management and owners) (Fama and Jensen, 1983). Agent’s opportunistic
actions, caused by the asymmetry of information (Fama, 1980) can be resolved
by an incitement system and agent will likely make strategic decisions
(including CSR performance) based on the interests of large owners
(Filatotchev et al., 2013).
However, the agency theory has recently been criticized in connection with
the rethinking of questions: What is a firm? What is a corporation? A
Corporation is a legal entity that has the right to operate in the legal system,
own specific assets and enter into obligations. The Firm is an economic
activity created as a result of contracts, firm connect the corporation with the
owners of resources (Robé, 2011). This allowed for a new look at the
relationship between the owner and the company: (1) shareholders do not own
firms, they own shares, (2) the assets of the firm do not belong to the
shareholders, they belong to the firm, (3) firms do not have a legal personality,
(4) managers are not owners, but make their own decisions, (5) responsibility
for decisions is managers’ responsibility (Robé, 2011). A new approach to
agency theory increases the role of executive directors and reduces the role of
large owners. (Weinstein, 2012).
3.3 The influence of stakeholder theory
Same economists argue that the corporation have only one responsibility to
maximize profits for its shareholders (Friedman, 1970). However, with the
shift towards environmental preservation in the 1970s and 1980s, it became
generally accepted that the responsibilities of an organization should go far
beyond the notion of profit and loss for social responsibility (Carroll, 2010).
The idea of corporate social responsibility has gained prominence, and
corporations have taken the need to view their activities from the standpoint
of economic, legal, ethical and discretionary aspects (Carroll, 2010). This
attracted the attention of new stakeholders.
In order to better understand the goals of stakeholders regarding to CSR
performance, the author refers to the stakeholder theory. According this
theory, the stakeholders (or interested parties) include any individuals, groups
or organizations that significantly influence the decisions made by the firm

12(47)
and are affected by these decisions (Freeman, 1984). A simplified list of
stakeholders of a modern company includes owners, consumers, consumer
protection groups, competitors, the media, workers, SIG - Special Interest
Groups, environmentalists, suppliers, government agencies, local
organizations communities.
According to stakeholder’s concept, each of the stakeholder groups has the
right not to be used as a means to achieve someone’s goal and therefore should
participate in determining the direction of the company’s development (Evan
and Freeman, 1988). Accordingly, the social responsibility of managers is to
adopt and implement two universal management principles: the principle of
corporate legitimacy (the management of the company for the benefit of all
stakeholders) and the principle of fiduciary in relation to stakeholders
(management actions as agent of all stakeholders) (Evan and Freeman, 1988).
This theory gives grounds to assume that strategic decisions of company can
based not on the interests of large owners, but on the interests of all
stakeholders, that is, the company’s CSR performance can does not reflect the
goals of large owners.
3.4 Ownership classification
Ownership structure is an important component in this study and it is
considered in related to CSR performance. Therefore, the question of how to
classify the ownership structure is described from the point of view of its
influence on corporate governance. Thus, it is more interesting: who takes
strategic decisions, that is, who votes, but not who owns the company. The
author uses the most acceptable classification of ownership, that is depending
on the share of voting rights, that the largest owner of the company owns
(Berle and Means, 1932).
Table 1. Ownership classification.
№ Classification Percent
1 Private property >80%
2 Majority control 50 – 80 %
3 Minority control 20 – 50 %
4 Joint ownership-minority and management
control
5 – 20%
5 Management control < 5 %

13(47)
According to classification (table 1), the company is considered “private
property”, if the largest owner has a stake in the vote of at least 80 percent.
“Majority control” requires the largest owner to control 50 to 80 percent of the
company's voting rights. The next classification in accordance with this scale
is the companies is “minority control”. In this case, the largest owner has
between 20 and 50 percent of the voting rights and therefore should seek
support from other shareholders to promote their proposals. Another low
concentration of ownership is “joint ownership-minority and management
control” means the right to vote from five to 20 percent. The latter type (less
than 5 percent) is considered manageable through “management control”.
(Berle and Means, 1932). The author intends to apply this classification of
ownership in this research.
3.5 The role family ownership in relationship between ownership structure and CSR performance
Particular attention the author gives to this form of large owners, like family
owners. Companies controlled by the family are one of the most developed
forms of concentrated property around the world (La Porta et al.,1999). They
are still one of the most common forms of business today and the driving force
of the global economy. According to the latest data, family companies account
for two-thirds of all business worldwide, generating more than 70% of world
GDP annually (KPMG, 2015).
The goal of most family companies is to hand management control over from
generation to generation and to preserve the wealth (Stein, 1989). For family
companies, it is characteristic that they invest most of their private wealth in
their company, therefore, they have strong economic incentives for monitoring
managers and reducing agency costs. In such companies, the agency’s
problems between managers and large shareholders (Fama and Jensen, 1983)
can be reduced or even eliminated, since family members often personally
participate in the board of directors.
In addition, family companies are focused on family interests (Canella et al.,
2015). As a result, such companies are more concerned about family reputation
than about economic losses. According to the theory of social identity, family
companies are one of the most important social groups in which the
identification of an organization affects the positive behavior of people
(Canella et al., 2015). Thus, identification affects strategic choice and decision
making in the family business.

14(47)
The care of family companies about the reputation of the family is confirmed
by the theory of the socio-emotional wealth (SEW). Owners of family
companies agree to incur economic losses to save their SEW (Berrone et al,
2010). In family firms, the preservation of SEW is critical to the company’s
strategic choice. In other words, family recognition and reputation play an
important role for the owners of family companies. If a family or business
reputation is threatened by something, then they are ready to make economic
sacrifices in order to maintain their reputation.
Empirical studies of CSR performance in the family context are ambiguous.
For example, one of them have shown that impact of family ownership can be
positively and negatively related to CSR performance (Block and Wagner,
2014). Studies in European countries do not show a positive effect on CSR
performance from family companies (Ducassy and Montandrau, 2015).
Thus, a large family business can differ in its strategic decisions from other
types of owners and its impact on corporate governance, including the CSR
performance of the company can be significant.
3.6 The role institutional ownership in relationship between ownership structure and CSR performance
Democratization of finance and significant growth of financial activity of the
society (van der Zwan, 2014) lead to the growth of institutional investors (for
example, pension funds, hedge funds, insurance companies, etc.). Thus, their
role in various aspects of the economy, including corporate governance,
increase, which promotes the interests of the institutional minority (Filatotchev
et al., 2013). The author considers institutional investors in terms of their
interest in CSR performance.
Institutional investors invest money in the interest of others and strive to
maximize the risk-income ratio. Institutional investors avoid companies with
strong information asymmetry and provide more effective control than other
categories of shareholders (Carney, 1997).
Institutional investors have the ability, skills and resources to influence the
performance of companies (Cornett et.al, 2005). Institutional investors can be
both large owners and small owners. Their impact depends on the company’s
share, large external institutions can have better access to information, more
accurate assessment and skills that they use to include in their valuation, and
to increase the value of the company (Bethel et al.,1998). Besides, institutional

15(47)
investors also have incentives to monitor management activities (Shleifer and
Vishny, 1986).
Institutions can more effectively manage a representative on the Board and can
exert pressure on the market by selling and buying (Mintzberg, 1983), which
gives them the opportunity to influence strategic decisions. However,
performance of boards of directors and ownership concentration may differ
depending on the legal system and institutional characteristics in a specific
country minority (Filatotchev et al., 2013).
Empirical studies have shown that the positive impact of institutional investors
is characteristic of the United States and countries with a common law
(Johnson and Greening,1999; Neubaum and Zahra ,2006). Countries with civil
law (La Porta et al., 1998) show relatively weak influence institutions
(Ducassy and Montandrau, 2015). Large investors and the family business
resists pressure from institutional investors (Johnson et al., 2010).
Thus, the importance of institutional investors in corporate governance
increases with time, but their influence on strategic decisions in the field of
CSR can depend on the legal conditions of the country.
3.7 The role foreign ownership in relationship between ownership structure and CSR performance
The modern world economy is characterized by significant rates strengthening
economic ties between individual countries. The processes of globalization
and convergence (Yoshikawa and Rasheed, 2009) of the world economy create
new conditions for the management of financial and human capital, social,
environmental, economic and legal relations. Financialization and
liberalization of capital transactions (van der Zwan, 2014) and the
development of the financial system increase access to foreign capital in
various countries. All this leads to an increase in the share of foreign
ownership throughout the world (Yoshikawa and Rasheed, 2009).
Foreign owners are interested in the financial success of the companies they
invest in. If investment risks are significant, investors prefer to influence the
strategic decisions of the Board and the management of the company
(Oxelheim and Randoy, 2005). In addition, foreign ownership is interested in
the disclosure of financial and non-financial information of the company
(Hope et al., 2013), that is raises the level of the company’s reporting and
improves the company’s performance. Therefore, investing in socially

16(47)
responsible companies is a way for a foreign ownership to reduce economic
risks. In other words, a foreign ownership is most likely interested in a
company with a high CSR performance.
The role of foreign ownership in CSR performance can also be important
because of the imposition of its own CSR policy, caused by differences in the
understanding of CSR in various countries of the world (Matten and Moon,
2008).
Thus, a foreign ownership can impact on strategic decisions of company,
including the CSR performance and should be considered as one of the types
of ownership in the context of this study.
3.8 Swedish context
3.8.1 Ownership structure in Sweden
The Sweden is always characterized by a high concentration of ownership,
where several players control almost all large companies, registered on the
Stockholm Stock Exchange. The two largest banks, SEB and Handelsbanken
own a significant part of Swedish companies. The biggest actor on the Swedish
market is the Wallenberg family, which controls up to 50 percent of the total
market value of the Stockholm Stock Exchange (Högfeldt, 2005). Swedish
banks, in view of the ban on issuing direct shares, transfer their assets and
create holding companies. Holding companies are formally separated from
banks, but listed as closed-end funds. Thus, holding companies are the
backbone of the typical Swedish property of the pyramid, with several
portfolios owners (Högfeld, 2005).
Sweden as a member of the Scandinavian family group of countries with civil
law is characterized weak protection of the shareholder’s rights (La Porta et
al., 1998). This influenced the formation of the Swedish corporate governance
code, where the role of the Board is particularly high (Cuomo et al., 2016).
Swedish large companies are controlled by investors, that means that voice as
a mechanism for corporate governance dominates (Hedlund, 1985). The
institutional minority has very little influence on strategic decisions (Agnblad
et al., 2001).
In addition, Sweden has a high level of social control and a high level of
business responsibility, which has a positive impact on investment (Stafsudd,

17(47)
2009). Wide restrictions on foreign ownership also played an important role
in the development of the Swedish property model. Foreign ownership was
severely restricted in Sweden. But after the lifting of restrictions in 1993, the
foreign ownership of the Stockholm Stock Exchange increased by about 40%
(Holmén, 2011).
3.8.2 CSR performance in Sweden
Swedish companies have a long history of active work in the field of CSR. The
high results of this work are indicated by estimates in various international
CSR ratings. In 2013, Sweden topped Robeco SAM's sustainability rating,
which counts 59 countries based on 17 environmental, social and governance
indicators (CSR, 2017).
At the international level, Sweden has proven itself in the field of energy and
environmental technologies, taking the third place in the Global Cleantech
Innovation Index 2012 rating. According to The World Economic Forum’s
Global Gender Gap Report 2012, Sweden ranks fourth in the world in gender
equality. Sweden is one of the least corrupt countries in the world, and ranks
fourth on Transparency International’s Corruption Perceptions Index 2012
(CSR, 2017).
CSR performance in Sweden is supported at the state level. The Swedish CSR
case is distinguished by quite strong state regulation. So in 2017, the Swedish
government obliged large Swedish companies to provide a report on
sustainable development. The sustainability report should contain non-
financial information necessary to understand the company’s development, its
status, the results and consequences of its activities, including information
relating to the environment, personnel and social conditions, human rights and
the fight against corruption (KPMG, 2015).
The active participation of Swedish companies in CSR activities and the
availability of statistical data on environmental and social ratings of Swedish
companies will allow us to conduct an empirical study in this paper.
3.9 Hypothesis development
Based on the foregoing, the author supposes that conflict between large and,
and small owners, between foreign and domestic owners, between managers

18(47)
and large owners can lead to various strategic decisions of the companies,
including strategic decisions in the field of CSR performance.
The large owners may be interested in increasing the company’s reputation
(Carroll et al., 2010) and increasing the value of the company even at
additional costs (Jensen and Meckling, 1976). They conduct effective
monitoring and influence the company’s strategy (Shleifer and Vishny, 1997).
Given the characteristics of the Swedish context, the main large owners are
likely to be a family. The goal of most such family companies is to provide
control over wealth (Stein, 1989). The social identification of family
companies influences the strategic choice and decision-making in the family
business (Canella et al., 2015). The family owners agree to incur economic
losses to save their SEW (Berrone et al, 2010), and this is critical to the
strategic choice of the company, including the results of CSR.
The first hypothesis supposes that in Swedish companies, where the largest
owner has the voting right more than 50 percent (majority control), the
Environmental and Social performance will be high.
H1 “Majority control” as a type of property is related positively to company’s
Environmental / Social performance.
Minority control (the largest owner has the voting right between 20% and
50%) in the company can be represented by different types of stakeholders.
Given the Swedish context, it can be both institutional investors and other type
of owners. Despite the growth of pension funds, hedge funds, insurance
companies and the increase in their role in various aspects of the economy,
including corporate governance (Filatotchev et al., 2013), the main goal of
institutional investors is to maximize profits with the least financial risk
(Carney, 1997). Institutional investors also have incentives to monitor
management activities (Shleifer and Vishny, 1986), but in countries with civil
laws (Sweden), where the rights of shareholders are protected less (La Porta,
1998), influence of the institutional minority is weak (Ducassy and
Montandrau, 2015) and does not affect the CSR performance.
The second hypothesis supposes that in Swedish companies, where the largest
owner has the voting right between 20 and 50 percent (minority control), the
Environmental and Social performance does not relate to type of ownership.
H2 “Minority control” as a type of property has no influence on the company’s
Environmental / Social performance.

19(47)
In companies where the largest owner owns less than 20% of the voting shares
(joint minority and management control), the main actor is the manager (or
agent). Agents’ actions in making strategic decisions can be opportunistic
(Fama, 1980), in the interests of large owners (Filatotchev et al., 2013) and in
the interests of all stakeholders according the principle of corporate legitimacy
and the principle of fiduciary relations (Evan and Freeman, 1988). However,
take into account the Swedish context, the Swedish Code of Corporate
Governance assigns an important role to the Board of Directors (Cuomo et al.,
2016) which supports the interests of shareholders in making managerial
decisions.
The third hypothesis supposes that in Swedish companies, where the largest
owner has the voting right less 20 percent (joint minority and management
control), the Environmental and Social performance does not relate to type of
ownership.
H3 “Joint Minority and Management control” as a type of property has no
influence on the company’s Environmental / Social performance.
Foreign owners who invest in Swedish companies are interested in the
financial success of companies and can influence the strategic decisions of the
Board (Oxelheim and Randoy, 2005). In addition, foreign ownership is
interested in disclosing the financial and non-financial information of the
company (Hope et al., 2013) and shows a higher level of CSR performance
(Mcguinness, et.al., 2017).
The fourth hypothesis supposes that in Swedish companies with foreign
ownership (foreign ownership), the Environmental and Social performance
will be high.
H4 “Foreign ownership” as a type of property is related positively to the
company’s Environmental / Social performance.

20(47)
4 Empirical part
4.1 Sampling method and data collection
For quantitative research, a structured interview or self- completion
questionnaire are usually used (Bryman and Bell, 2015). This study uses
statistical information obtained from electronic databases. As a probabilistic
sampling strategy, a simple sampling is used to select companies for research.
The data used for the empirical analysis are taken from two main data sources:
Holding and Thomson Reuters Eikon. Data used to determine the type of
ownership of companies and control variables are collected from Holding and
the data used to measure CSR performance is from Thomson Reuters Eikon
(Eikon, 2018). This study is of a quantitative nature and is based on a large
number of empirical observations. As a result, the study can be generalized to
draw conclusions about a greater number of subjects than those included in the
sample. (Johansson-Lindfors, 1993) In this study, this means that our results
can be summarized for all companies listed on the Stockholm Stock Exchange:
Large, Medium and Small list. The Swedish companies listed on the
Stockholm Stock Exchange and having received an assessment of the
environmental and social performance in the Thomson Reuters EIKON for the
period from 2014 to 2016 were included in the sample. In 2014, 49 companies
received an evaluation, in 2015 - 61 companies and in 2016 - 64 companies,
respectively. Thus, 174 cases were formed to participate in the study. Further,
the proportion of shares of the largest owners was studied. It should be noted
that in the sample there are no companies with a share of the largest owner
with more than 80% and less than 5%. These companies were not represented
in the CSR performance assessment presented by Thomson Reuters EIKON.
The statistic of the companies is also examined in the industry context. The
industry was put into this study using the Global Industrial Standard (GICS).
GICS consists of 11 sectors, 24 industry groups, 68 industries. In this study,
the classification of sectors is used. Data selection is presented in Table 2.
Table 2. Data selection
Companies’ market classification
based on the Stockholm Stock Exchange
Capitalization Frequency (%)
2014 2015 2016
Large 96,0 83,6 81,3
Medium 2,0 11,5 15,6
Small 2,0 4.9 3,1

21(47)
Total 100 100 100
Companies’ ownership type
based on the Berle and Means classification
Type of ownership Frequency (%)
2014 2015 2016
Private property 0 0 0
Majority control 12,3 9,8 9,4
Minority control 57,1 57,4 54,7
Joint ownership-minority and
management control
30,6 32,8 35,9
Management control 0 0 0
Total 100 100 100
Companies’ industries sector based on the GICS
Industries sector Frequency (%)
2014 2015 2016
Energy 2,0 1,6 1,6
Materials 10,2 8,3 7,8
Industrials 22,5 31,2 31,3
Financials 18,4 14,7 14,0
Information Technology 2,0 3,3 3,1
Consumer Staples 16,3 16,4 15,6
Consumer Discretionary 6,1 4,9 6,3
Health Care 6,1 4,9 6,3
Real Estate 12,3 11,4 10,9
Telecommunication Services 4,1 3,3 3,1
Utilities 0 0 0
Total 100 100 100
4.2 Analysis method
4.2.1 Model specification
For this study, multiple regression is used, since it is necessary to predict the
value of a variable based on the value of several other variables. Multiple
regression also allows to determine the overall fit (variance) of the model and
the relative contribution of each of the predictors to the overall explained
variance. Choosing this model (1) for research, the author presumes that the
influence of independent variables on the dependent variable is measured by
the size of their B-coefficients and that this “effect” does not depend on other
variables. Independent variables can affect each other, however, the effect of
independent variables on the dependent variable is independent of other
independent variables. The analysis is performed using SPSS statistics.

22(47)
Using this regression model (1), the author draws on the experience of
previous studies of the relationship between the ownership structure and CSR
performance, such as: Block and Wagner, 2014; Ducassy and Montandrau,
2015; Lopatta et al.; Mcguinness et al., 2017.
The basic regression model takes the form:
(1) ESPi,t= β0 + β1MajCi,t + β2 MinCi,t+ β3 MMCi,t + β4 FOi,t
+ β5 FAi,t + β6FIi,t + εi,t
where ESPi,t is ESG ASSETS4 Environmental and Social performance;
MajCi,t is the majority control; MinCi.t is the minority control; MMCi,t is the
joint minority and management control; FOi,t is the foreign ownership; FAi,t is
the firm age size; FIi,t is firm Industry; εi,t is random model error; i = 1,2,…64
firms, t= 2014,2015,2016 years.
The author explores two directions of CSR performance: Environmental and
Social, therefore, two identical models are considered, the first is
Environmental performance, the second is Social performance.
4.2.2 Dependent variable
Dependent variable of this paper are Environmental and Social ESG ASSETS4.
The ESG ASSETS4 Environmental measures a company’s impact on living
and non-living natural systems, including the air, land and water, as well as
complete ecosystems. It reflects how well a company uses best management
practices to avoid environmental risks and capitalize on environmental
opportunities in order to generate long term shareholder value (Eikon, 2018).
The ESG ASSETS4 Social measures the company’s impact on improving the
quality of life of workers and their families, as well as the local community
and society as a whole. This reflects how well a company uses the best
management methods to interact with the customer, improve labor relations
and staff rights; interact with society on various social problems (Eikon, 2018).
These variables are interval variables; their values are shown in the table 2.
4.2.3 Independent variable
To measure the ownership structure of companies, the ownership classification
according to Berle and Means is applied (table 1). The sample of data for this
study showed the absence of enterprises with a share of the largest owner more
than 80 percent and less than 5 percent. In this regard, the three ownership

23(47)
groups were formed (according to the voting shares of the largest owner):
“majority control” - more than 50% of voting shares, “minority control” -
from 20% to 50% of voting shares and “joint minority ownership and
management control” - less than 20% of voting shares. This variable is dummy
variables and takes the value “0” or “1”.
To measure the impact of foreign ownership in this study, an interval variable
“foreign ownership” (FO) is used that describes the percentage of voting
shares owned by foreign investors. FO acquires a value from 0% to 84%.
4.2.4 Control variable
Control variables used in this model are based on the previous literature (Block
and Wagner, 2014; Ducassy and Montandrau, 2015; Lopatta et al.;
Mcguinness et al., 2017). As control variables, firm age size and industrial
models are also included to ensure that differences in the environmental and
social performance of companies are not the effect of sectoral differences
(Brammer et al.,2006). As shown by the sample of companies for this survey,
out of 11 sectors only 10 sectors were submitted. Thus, the control variable
“firm industry”. FI is a dummy variable and takes the value either 0 or 1.
The second control variable estimates the age of the firm (FA) that is, the
number of years of operation of the company from the date of its
establishment. FA is interval variable, shows the age of the company and takes
values from 2 years up to 35 years.
4.2.5 Descriptive Statistics
Table 3 provides descriptive statistics for the regression variables.
Table 3. Descriptive statistics
Variables N Minimum Maximum Mean Std. Deviation
ESG ASSETS4
Environmental
174 8,71 95,23 72,0363 27,66616
ESG ASSETS4
Social
174 6,55 96,17 66,9829 28,61507
Majority control
MajC
174 0,0 1,0 ,103 ,3054
Minority control
MinC
174 0,0 1,0 ,563 ,4974

24(47)
Minority and
management
control MMC
174 0,0 1,0 ,333 ,4728
Foreign
ownership FO
174 0 84 38,49 18,444
Firm Age FA 174 2 35 23,20 8,699
Valid N
(listwise)
174
4.2.6 Assumptions for multiple regression analysis
The first assumption relates to verifying the linearity relation between
independent and dependent variables. This is achieved by case wise diagnosis.
In this study, both models (Environmental and Social) show the case wise
diagnosis of all 174 cases within the norm / 3 /.
The second assumption is tested multicollinearity of regression model, which
helps to establish whether there is a link between the variables in one or two
samples. Multicollinearity occurs when the independent variables are too
highly correlated with each other. Variance Inflation Factor (VIF) – the
variance inflation factor of the linear regression must be < 10. Collinearity
diagnostics of independent variables in this study do not show the
multicollinearity effect.
The dependent variables in this study are interval variables. Among the
independent and control variables, there are both dummy and interval
variables. Therefore, to check collinearity between variables, two tests are
carried out: Pearson’s bivariate correlation and Spearman’s rho bivariate
correlation. Correlation matrix is presented in the table 5.
The third assumption is tested autocorrelation of the residues. To verify this,
the Durbin-Watson test was carried out. The Durbin-Watson test gave a
satisfactory value for the coefficients for the Environmental and Social
models; 1,784 and 1,874 respectively, which means that there is no
autocorrelation of the residues.

25(47)
4.2.7 Multiple regression with stepwise method
In this study 95% confidence interval uses in both models.
For a more accurate study of models with several independent variables,
multiple regression with a stepwise method is performed, which allows to
establish how the estimated slope of the regression line changes with the
introduction of new independent variables. Stepwise regression does multiple
regression a number of times, each time removing the weakest correlated
variable. At the end it be found the variables that explain the distribution best.
For both models a 6 -step selection of the most significant variables is carried
out. The results of multiple regression are presented in table 4. The B-
coefficients of the regression models represent the independent contributions
of each independent variable to the dependent variable. Beta coefficients allow
to compare the relative contributions of each independent variable to the
prediction of the dependent variable. Variables not specified in the models are
excluded from the analysis.
4.3 Scientific credibility
Traditionally, validity is one of the key categories in the analysis of empirical
data of business research. In this study, validity is understood as the degree of
correspondence between the results of the research process of reality
(Johnston, 1980). Within the framework of quantitative research, it is
customary to allocate construct validity, external and internal validity (Bryman
and Bell, 2015). The first is related to ensuring the correctness of the
measurement, the second and third - with the identification of causal
relationships in the framework of experimental studies (Lahm, 2007). To
exclude the erroneous results of the study, this study uses a period of three
years to evaluate the variables.
The validity of this study is achieved by checking the regression model for
linearity, multicollinearity and autocorrelation of residues.
The category reliability refers to the stability and consistency of the results
obtained. It is accepted to distinguish three types of reliability: stability,
internal reliability and inter-rater reliability (Bryman and Bell, 2015). Stability
is a characteristic that shows how the results of a survey, using a specific
methodology, change over time. The definition of stability is acceptable in
cases of measuring stable properties that are not subject to long-term changes.

26(47)
If the corresponding methodology is reliable, then the results of the first and
second surveys should show stable results. If the first and second polls are
poorly agreed, then the methodology is unreliable and cannot be used in
studies. The stability value is determined using correlation coefficients
(Maxwell, 1992).
Internal reliability shows how consistent the results obtained with the help of
different indicators that measure one characteristic. Thus, this type of
reliability is suitable for complex composite scales based on a group of
indicators. High internal reliability will be demonstrated in the case when the
results of the indicators change in one direction. One of the main ways to
determine internal reliability is to use the Alpha Cronbach coefficient
(Maxwell, 1992). The internal consistency check is necessary, first of all, to
make sure whether the indicators of the methodology measure the same
property.
Inter-rater reliability is determined in studies using content analysis or in other
studies that require the encoding of textual material. This kind of reliability
shows the quality of the instructions that guide the encoding of various parts
of the text. High consistency of the work of different encoders indicates that
the corresponding instruction is correctly written. The coefficients used to
determine the reliability of the encoding depend on the nature of the properties
to be encoded. If the property is quantitative, one of the correlation coefficients
can be used. If the property is qualitative, then, for example, Kohp Cohen
coefficient will suit (Maxwell, 1992).
In this study, the reliability of information is achieved through the use of data
from Thomson Reuters. Thomson Reuters has more than 40 years of
experience gathering timely and high-quality fundamental data, providing
both standardized and company-specific data and quantitative tools for in-
depth financial analysis. With Thomson Reuters the most complete, detailed
and modern industry classification is available. The company provides
coverage of more than 250,000 securities in 130 countries and has the largest
available archive of company events and corporate shares, in which more than
1 million events cover companies listed on the stock exchange around the
world, covering about 100 countries.
Thomson Reuters provides comprehensive, structured and standardized data
and ESG analysis data on climate change and social issues that may be
important for assessing the performance of the company (Eikon, 2018).

27(47)
4.4 Ethical considerations
The ethical aspect in business research is very important. It is customary to
consider four main factors in the collection of primary data used in the study:
harm to participants, lack of informed agreement, breach of privacy and
deception (Bryman and Bell,2015). This study uses statistical data on the
ownership structure and CSR performance of Swedish companies. Personal
data received from participants through interviews, questionnaires or in some
other way is not used. The data for the study are obtained from the databases
of the Holdings and Thomson Reuters EIKON and are publicly available
information. Thus, the study did not require any consent from the participants.
Using of data about ownership structure and environmental and social
performance of Swedish companies are not a violation of confidentiality, and
according to the author, cannot cause harm to the participants.

28(47)
5 Result and discussion
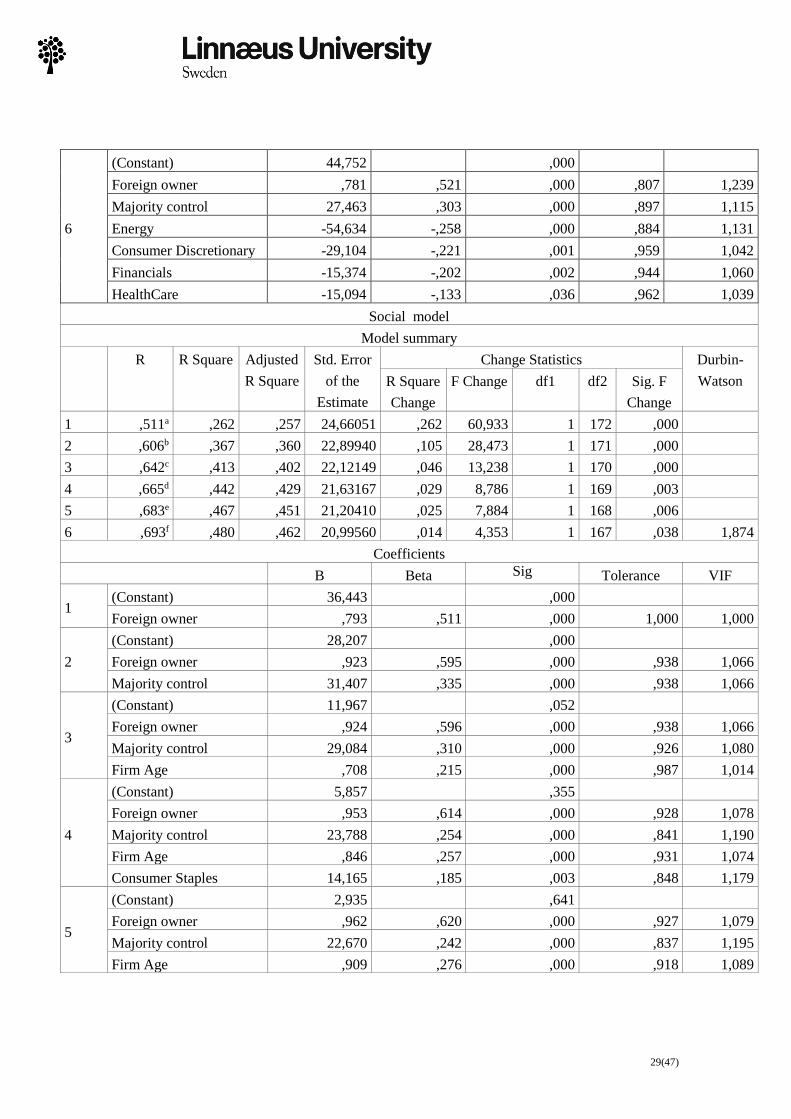
5.1 Empirical results Table 4. Multiple regression with a stepwise method
Environmental model
Model summary
R R Square Adjusted
R Square
Std. Error of
the Estimate
Change Statistics Durbin-
Watson R Square
Change
F Change df1 df2 Sig. F
Change
1 ,358 ,128 ,123 25,90358 ,128 25,344 1 172 ,000
2 ,474 ,225 ,216 24,49774 ,097 21,307 1 171 ,000
3 ,523 ,273 ,260 23,79133 ,048 11,305 1 170 ,001
4 ,558 ,311 ,295 23,23543 ,038 9,232 1 169 ,003
5 ,587 ,345 ,325 22,72987 ,034 8,601 1 168 ,004
6 ,601 ,362 ,339 22,49921 ,017 4,462 1 167 ,036 1,784
Coefficients
Variables B Beta Sig Tolerance VIF
1 (Constant) 51,347 ,000
Foreign owner ,538 ,358 ,000 1,000 1,000
2
(Constant) 43,725 ,000
Foreign owner ,657 ,438 ,000 ,938 1,066
Majority control 29,066 ,321 ,000 ,938 1,066
3
(Constant) 39,953 ,000
Foreign owner ,775 ,517 ,000 ,838 1,194
Majority control 29,890 ,330 ,000 ,936 1,068
Energy -49,352 -,233 ,001 ,891 1,122
4
(Constant) 39,381 ,000
Foreign owner ,825 ,550 ,000 ,818 1,223
Majority control 29,232 ,323 ,000 ,935 1,069
Energy -52,915 -,250 ,000 ,885 1,130
Consumer Discretionary -25,945 -,197 ,003 ,970 1,031
5
(Constant) 43,168 ,000
Foreign owner ,795 ,530 ,000 ,810 1,234
Majority control 26,176 ,289 ,000 ,906 1,103
Energy -54,246 -,256 ,000 ,884 1,131
Consumer Discretionary -28,245 -,214 ,001 ,962 1,040
Financials -14,287 -,188 ,004 ,954 1,048
29(47)
6
(Constant) 44,752 ,000
Foreign owner ,781 ,521 ,000 ,807 1,239
Majority control 27,463 ,303 ,000 ,897 1,115
Energy -54,634 -,258 ,000 ,884 1,131
Consumer Discretionary -29,104 -,221 ,001 ,959 1,042
Financials -15,374 -,202 ,002 ,944 1,060
HealthCare -15,094 -,133 ,036 ,962 1,039
Social model
Model summary
R R Square Adjusted
R Square
Std. Error
of the
Estimate
Change Statistics Durbin-
Watson R Square
Change
F Change df1 df2 Sig. F
Change
1 ,511a ,262 ,257 24,66051 ,262 60,933 1 172 ,000
2 ,606b ,367 ,360 22,89940 ,105 28,473 1 171 ,000
3 ,642c ,413 ,402 22,12149 ,046 13,238 1 170 ,000
4 ,665d ,442 ,429 21,63167 ,029 8,786 1 169 ,003
5 ,683e ,467 ,451 21,20410 ,025 7,884 1 168 ,006
6 ,693f ,480 ,462 20,99560 ,014 4,353 1 167 ,038 1,874
Coefficients
B Beta Sig Tolerance VIF
1 (Constant) 36,443 ,000
Foreign owner ,793 ,511 ,000 1,000 1,000
2
(Constant) 28,207 ,000
Foreign owner ,923 ,595 ,000 ,938 1,066
Majority control 31,407 ,335 ,000 ,938 1,066
3
(Constant) 11,967 ,052
Foreign owner ,924 ,596 ,000 ,938 1,066
Majority control 29,084 ,310 ,000 ,926 1,080
Firm Age ,708 ,215 ,000 ,987 1,014
4
(Constant) 5,857 ,355
Foreign owner ,953 ,614 ,000 ,928 1,078
Majority control 23,788 ,254 ,000 ,841 1,190
Firm Age ,846 ,257 ,000 ,931 1,074
Consumer Staples 14,165 ,185 ,003 ,848 1,179
5
(Constant) 2,935 ,641
Foreign owner ,962 ,620 ,000 ,927 1,079
Majority control 22,670 ,242 ,000 ,837 1,195
Firm Age ,909 ,276 ,000 ,918 1,089

30(47)
Consumer Staples 15,917 ,208 ,001 ,833 1,200
Telecom Services 23,273 ,160 ,006 ,974 1,027
6
(Constant) 1,463 ,815
Foreign owner ,944 ,609 ,000 ,919 1,089
Majority control 21,188 ,226 ,000 ,824 1,214
Firm Age ,950 ,289 ,000 ,909 1,100
Consumer Staples 17,601 ,230 ,000 ,809 1,236
Telecom Services 24,780 ,171 ,003 ,967 1,035
Materials 12,523 ,119 ,038 ,951 1,052
Table 5. Person and Spearman’s rho correlation statistics
Spearman’s
rho
Person
Environ-
mental
Correlation
Sig
Social
Correlation
Sig
Majority
control
Correlation
Sig
Minority
control
Correlation
Sig
Management
control
Correlation
Sig
Foreign
ownership
Correlation
Sig
Firm Age
Correlation
Sig
Environmental
Correlation
Sig
,830**
(0,000)
,109
(0,153)
,015
(0,841)
-,086
(0,287)
,421**
(0,000)
,219**
(0,004)
Social
Correlation
Sig
,830**
(0,000)
,126
(0,097)
-,026
(0,737)
-,055
(0,474)
,538**
(0,000)
,281**
(0,000)
Majority
control
Correlation
Sig
,212**
(0,005)
,187*
(0,013)
-,386**
(0,000)
-,240**
(0,001)
-,278**
(0,000)
,123
(0,106)
Minority
control
Correlation
Sig
-,0118
(0,121)
-,047
(0,540)
,386**
(0,000)
-,803**
(0,000)
,060
(0,433)
,048
(0,529)
Management
control
Correlation
Sig
-,013
(0,867)
-,072
(0,348)
-,240**
(0,001)
-,803**
(0,000)
,117
(0,125)
-,130
(0,087)
Foreign
ownership
Correlation
Sig
,358**
(0,000)
,511**
(0,000)
-,249**
(0,001)
,085
(0,264)
,071
(0,349)
,047
(0,540)
Firm Age
Correlation
Sig
,123
(0,105)
,232**
(0,002)
,116
(0,127)
,032
(0,671)
-,109
(0,152)
-,032
(0,671)
**. Correlation is significant at the 0.01 level (2-tailed).
*. Correlation is significant at the 0.05 level (2-tailed).

31(47)
Table 4 provide the results of multiple regression and Table 5 provide
correlation statistics of variables for the Environmental and Social model of
this study. Foreign owners show a strong significant relationship with the
Environmental and Social Performance of companies (p <0.01 in both
models). Majority control shows a good result with the Environmental and
Social performance in Pearson (p <0,01 and p<0.05 respectively), but weak in
Spearman’s rho (p>0,05). Minority control, and Joint Minority and
Management control show weak results (p>0.05) in both models.
The multiple regression of the Environmental model shows an increase in the
estimated slope of the regression line for Foreign ownership with the
participation of Majority control. The decline in the slope of the regression
line for Foreign ownership gives the companies belonging to Energy,
Consumer Discretionary, Financials and Health Care industries. Other
industries and Firm age do not show any influence on the Environmental
Performance.
The multiple regression of the Social model shows an increase in the estimated
slope of the regression line for Foreign ownership with the participation of
Majority control. In addition, the slope of the regression line increases the firm
age and belonging to Consumer Staples, Telecom Services and Materials.
Other industries do not show any influence on the Social Performance.
5.2 Analysis
In respect to the first hypothesis (H1), multiple regression did not find
sufficient confirmation of the positive influence of Majority control (with a
voting shares more than 50% and less than 80%) on the Environmental and
Social performance in the context of Swedish companies. However, the results
on increasing the impact of Foreign ownership in Swedish companies with
Majority control seem interesting. The positive impact on CSR performance
from Majority control in the Swedish context of family companies (Högfeld,
2005) is supported both in the theory of social identity (Canella et al., 2015)
and in the theory of socioemotional wealth (Berrone et al., 2012). However,
this study did not find sufficient evidence for impact of Majority control.
Previous studies also have contradictory results in the US (Block and Wagner,
2014) and in the France (Ducassy and Montandrau, 2015). In this study, the
narrowing of significance of Majority control in Swedish companies could be
affected by restrictions caused by the selection of companies, since companies

32(47)
with the voting rights of the largest owner with more than 80% do not
participate in the research.
In respect to the second (H2) and third hypotheses (H3), multiple regression
showed the lack of influence of Minority control (with a voting shares more
than 20% and less than 50%) and Joint Minority and Management control
(with a voting shares more than 5% and less than 20%) on the Environmental
and Social performance of Swedish companies.
Given the Swedish context, in the category of Minority control the most active
are institutional investors. The main goal of institutional investors is to save
depositors’ money and maximize profits (Carney, 1997). However, in Sweden
the rights of shareholders are protected less (La Porta, 1998) and influence of
the institutional minority is weak (Ducassy and Montandrau, 2015). The
results of the study are confirmed by previous studies in European companies
(Dam and Scholtens, 2013; Lopatta et al., 2017) which also did not reveal
significant links between stakeholders and CSR performance.
In Swedish companies with Joint minority and management control,
opportunistic actions of the manager (Fama, 1980) are limited by a strong
Board of Directors (Cuomo et al., 2016) which supports the interests of large
shareholders in making (Filatotchev et al., 2013). On the other hand, the agent
acts in the interests of all stakeholders (Evan and Freeman, 1988), its activities
have no significant impact on the Environmental and Social performance.
In respect to the fourth hypothesis (H4), multiple regression significant
evidence of the positive impact of Foreign ownership on Environmental and
Social performance in the data for Swedish companies. Favorable conditions
of the Swedish market (Högfeldt, 2005; van der Zwan, 2014) and high level
of social control and business responsibility (Stafsudd, 2009) attracted foreign
investors who are interested in investing in companies with high performance
(Oxelheim and Randoy, 2005). With regard to Foreign ownership, previous
empirical studies also reveal a positive impact on the company’s performance.
(Hope et al., 2013; Mcguinness, et.al., 2017).
In addition, the results of the multiple regression with stepwise method showed
the strengthening of the impact of Foreign ownership for Social performance
in companies with extensive Firm Age. For the Environmental performance,
the Firm Age did not show any influence. Such a result may be due to the fact
that some environmental requirements (such as emissions of chemicals, carbon
dioxide, toxic heavy metal, etc.) are mandatory for all companies (CSR, 2017),
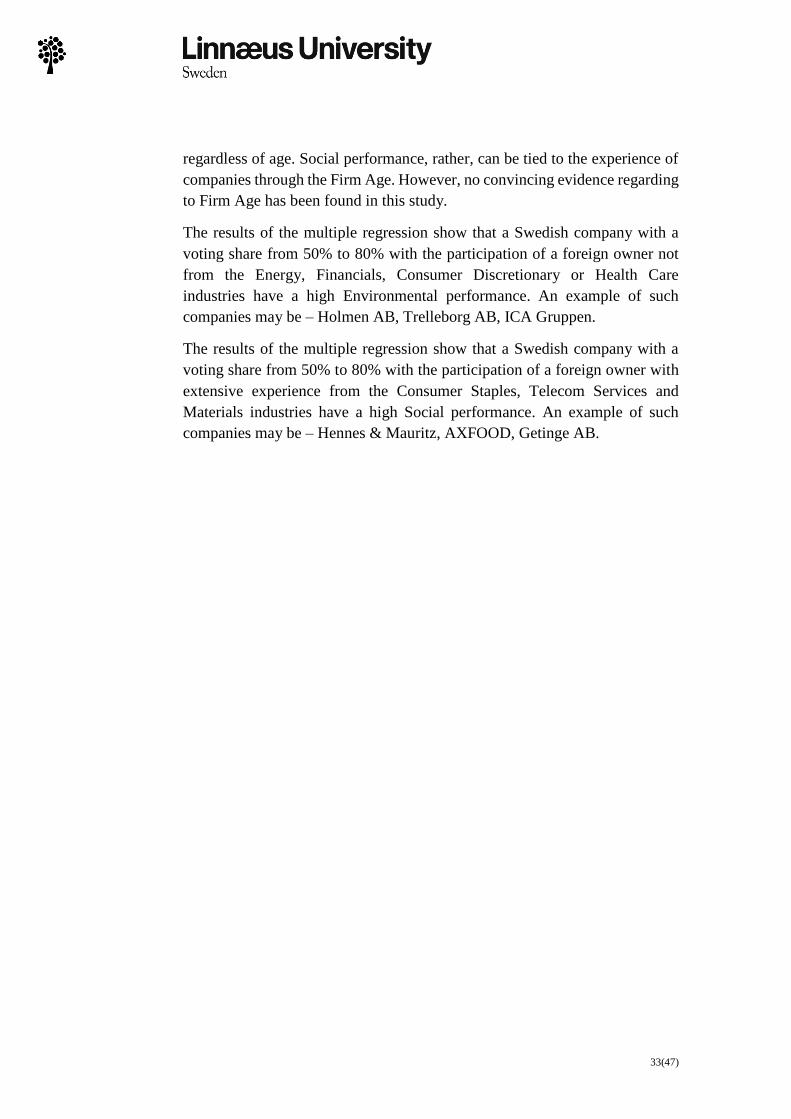
33(47)
regardless of age. Social performance, rather, can be tied to the experience of
companies through the Firm Age. However, no convincing evidence regarding
to Firm Age has been found in this study.
The results of the multiple regression show that a Swedish company with a
voting share from 50% to 80% with the participation of a foreign owner not
from the Energy, Financials, Consumer Discretionary or Health Care
industries have a high Environmental performance. An example of such
companies may be – Holmen AB, Trelleborg AB, ICA Gruppen.
The results of the multiple regression show that a Swedish company with a
voting share from 50% to 80% with the participation of a foreign owner with
extensive experience from the Consumer Staples, Telecom Services and
Materials industries have a high Social performance. An example of such
companies may be – Hennes & Mauritz, AXFOOD, Getinge AB.

34(47)
6 Conclusion
This study focused on identifying the relationship between ownership
structure and the environmental and social performance of companies by the
example of Swedish companies, listed on the Swedish Stock Exchange. As the
main ownership classification used ownership classification by Berle and
Means, with the proportion of voting shares of the largest owner. To assess
CSR performance, Environmental and Social performance was used,
represented by the information provider Thomsen Reuters under period from
2014 to 2016.
After the selection of companies, taking into account the limitations (Thomsen
Reuters assessment, period), three groups of owners were formed: Majority
control (from 50% to 80%), Minority control (from 20% to 50%), Joint
Minority and Management control (from 5 to 20%). Companies with a voting
share more than 80% and less than 5 % were not included in the study, which
is also a limitation of this paper. Also in this study, the share of foreign
ownership in Swedish companies was taken into account. As additional
variables of the regression model of this study, the Firm Age and industry
affiliation was used.
To substantiate the motivation of different groups of shareholders in making
strategic decisions, aimed at improving the Environmental and Social
performance of Swedish companies, the author discusses the conflict between
large and small shareholders, between large shareholders and managers, as
well as the importance of the family business, institutional investors and
foreign investors in the Swedish market.
This study showed at least three main results. First, the ownership structure
can influence the Environmental and Social performance of Swedish
companies and this relationship can be studied and evaluated by the regression
model.
Second, the share of Foreign ownership of Swedish companies is positively
related to the Environmental and Social performance. Minority control and
Join Minority and Management control do not affect the Environmental and
Social performance of Swedish companies.

35(47)
Thirdly, Majority control has not found sufficient evidence in the context of
Swedish companies, but enhances the positive impact on the performance of
Foreign ownership.
It can be said, that this paper has made contribution to the research line on
assessing the relationship between the ownership structure of companies and
the Environmental and Social performance. Given the fact that this type of
research is relatively small, the results of this study could be developed in other
studies regarding to CSR performance. In addition, the results of this study
give more weight to previous studies, which revealed a positive relationship
between Foreign ownership and aspects of CSR (Mcguinness et al., 2017).
Evidence about the absence of any influence of Minority control and Joint
Minority and Management control, found in this study, confirmed previous
research (Ducassy and Montandrau, 2015, Lopata et al., 2017).
The specificity of Swedish companies, controlled by large owners needs
additional research in terms of identifying the true owners and the impact of
property pyramids. This can serve as inspiration for the following studies.

36(47)
Referents
Agnblad, J., Berglöf, E., Högfeldt, P. and Svancar, H. (2001) Ownership and
control in Sweden: strong owners, weak minorities and social control. The
control of corporate Europe, 1(1), pp. 228-258.
Albert, M. Capitalisme contre capitalism (1991) (Seuil,).
Berrone, P., Cruz, C., Gomez-Mejia, L.R. and Larraza-Kintana, M. (2010)
Socioemotional Wealth and corporate responses to insitiutional pressures:
Do family-controlled firms pollute less? Administrative Science Quarterly,
55, pp. 82-113.
Berrone, P., Cruz, C., and Gomez-Mejia, L. R. (2012) Socioemotional Wealth
in Family Firms:Theoretical Dimensions, Assessment Approaches, and
Agenda for Future Research. Family Business Review, 25(3), pp.258-279
Bethel, J., Liebiskind, J. and Opler, T. (1998) Block share purchases and
corporate performance. Journal of Finance 53, 605-635.
Block, J. H. and Wagner, M. (2014) The Effect of Family Ownership on
Different Dimensions of Corporate Social Responsibility: Evidence from
Large US Firms. Business Strategy and the Environment, 23(7), pp. 475-
492.
Brammer, S. J., BrookS, C. and PaveliN, S. (2006) Corporate social
performance and stock returns: UK evidence from disaggregate measures.
Financial Management, Autumn, pp. 97–116.
Brammer, S. J. and PaveliN, S. (2006) Corporate reputation and social
performance: the importance of fit. Journal of Management Studies, 43(3),
pp. 435–455.
Cannella, A. A. Jr., Jones, C. D. and Withers, M. C. (2015) Family- versus
lone-founder-controlled public corporations: Social identity theory and
boards of directors. Academy of Management Journal, 58(2), pp. 436-459.
Carney, W.J. (1997) Large bank stockholders in Germany: saviors or
substitutes? J. Appl. Corporate Finance. 9 (4), pp. 74–81.
Carroll, Archie B., and Kareem, M. Shabana. (2010) The business case for
corporate social responsibility: A review of concepts, research and practice.
International journal of management reviews, 12(1), pp. 85-105.
Cormier, D. and Magnan, M. (2007) The revised contribution of
environmental reporting to investors’ valuation on of a firm’s earnings: An
international perspective. Ecological Economics, 62(3–4), pp. 613–626.

37(47)
Cornett, M.M., Marcus, A.J. and Tehranian, H. (2008) Corporate governance
and pay-for-performance: The impact of earnings management Journal
of financial economics, 87 (2), pp. 357-373
Cuomo, F., Mallin, C. and Zattoni, A. (2016) Corporate governance codes: A
review and research agenda. Corporate Governance: An International
Review, 24(3), pp. 222-242.
Dam, L. and Scholtens, B. (2013) Ownership Concentration and CSR Policy
of European Multinational Enterprises. Journal of Business Ethics, 118(1),
pp.117-126.
De Geer, H., Borglund, T. and Frostenson, M. (2009) Reconciling CSR with
the Role of the Corporation in Welfare States: The Problematic Swedish
Example. Journal of Business Ethics, (89), pp. 269-283.
Demsetz, H. and Kennet L. (1985) The structure of corporate ownership:
Causes and consequences. Journal of Political Economy, (93), pp.1155-
1177.
Djelic, M. L. and Etchanchu, H. (2017) Contextualizing corporate political
responsibilities: Neoliberal CSR in historical perspective. Journal of
Business Ethics, 142(4), pp. 641-661.
Ducassy, I. and Montandrau, S. (2015) Corporate social performance,
ownership structure, and corporate governance in France. Research in
International Business and Finance, 34, pp.383.
Evan W. M. and Freeman R. E. (1988) A Stakeholder Theory of the Modern
Corporation: Kantian Capitalism. Ethical Theory and Business / Ed. by T.
L. Beauchamp, N. E. Bowie. Englewood Cliffs, NJ: Prentice Hall, pp. 97–
106.
Filatotchev, I., Jackson, G. and Nakajima, C. (2013) Corporate governance
and national institutions: A review and emerging research agenda. Pacific
Journal of Management, 30(4), pp. 965-986.
Freeman R. E. (1984) Stakeholder Management: A Stakeholder Approach.
Marshfield, MA: Pitman Publishing.
Friedman, M. (1970) The social responsibility of business is to increase its
profits. New York Times Magazine, (13).
Gehrig,T. (1993) An informational based explanation of the domestic bias in
international equity investments. Scandinavian Journal of Economics,
95(1), pp. 97-109.
Hedesström, T. M., and Biel, A. (2008) Evaluating companies’ social and
environmental performance: Current practice and some recommendations.
Göteborg Psychological Reports, 38 (1).

38(47)
Hillman, A. J. and Dalziel, T. (2003) Boards of directors and firm
performance: Integrating agency and resource dependence perspectives.
Academy of Management Review, 28(3), pp. 383-396.
Holmén, M. (2011) Foreign Investors and Dual Class Shares. Centre for
Finance Working Paper, University of Gothenburg.
Hope, O.K. (2013) Large shareholders and accounting research. China
Journal of Accounting Rehears 6 (2013), pp 3-20.
Hope, O.K., Kang, T. and Kim J.W. (2013) Voluntary disclosure practices by
foreign firms cross-listed in the United States. J. Contemp. Account. Econ.,
9 (2013), pp. 50-66.
Högfeldt, P. (2005) The history and politics of corporate ownership in Sweden.
I Morck, R. K. (red.) A history of corporate governance around the world:
Family business groups to professional managers. Chicago and London:
University of Chicago Press, pp. 517-580.
Jensen M. and Meckling W. (1976) Theory of the Firm. Managerial Behavior,
Agency Costs and Ownership Structure. Journal of Financial Economics.
Johnson, R. A. and Greening, D. W. (1999) The effects of corporate
governance and institutional ownership types on corporate social
performance. Acad. Manage. J. 42, pp. 564–576.
Johnson, R.A., Schnatterly, K., Johnson, S. G. and Chiu, S. C. (2010)
Institutional investors and institutional environment: a comparative
analysis and review. J. Manage. Stud. 47(8),1 pp.590–1613.
Jonung, L. (2002) Vem ska äga Sverige? 1:a uppl. Kristianstad:
Författarna och SNS förlag.
Johnston J. and Pennypacker H. (1980) Strategies and tactics of human
behavioral research. New Jersey: Erlbaum
Johansson-Lindfors, M-B. (1993) Att utveckla kunskap: om metodologiska och
andra vägval vid samhällsvetenskaplig kunskapsbildning, Lund :
Studentlitteratur.
Knapp, J. R., Dalziel, T. and Lewis, M. W. (2011) Governing top managers:
Board control, social categorization, and their unintended influence on
discretionary behaviors. Corporate Governance: An International Review,
19(4), pp. 295-310.
Lahm K. (2007) Quantitative validity. The Blackwell Encyclopedia of
Sociology, ed. by George Ritzer. - Malden, Oxford, Carlton: Blackwell
Publishing, pp. 5173-5175.
La Porta, R., Lopez-De-Silanes F., Shleifer, A. and Vishny, R. (1998) Law and
finance. Journal of Political Economy, 106(6), pp. 1113-1155

39(47)
Lazonick, W. and O’Sullivan, M. (2000) Maximizing shareholder value: A
new ideology for corporate governance. Economy and Society, 29(1), pp.
13‐35.
Letza, S., Sun, X. and Kirkbride, J. (2004) Shareholding versus stakeholding:
Acritical review of corporate governance. Corporate Governance: An
international Review, 12(3), pp. 242-260.
Lopatta, K., Jaeschke, R. and Chen, C. (2017) Stakeholder Engagement and
Corporate Social Responsibility (CSR) Performance: International
Evidence. Corporate Social Responsibility and Environmental
Management, 24(3), pp.199-209.
Matten, D., and Moon, J. (2008) “Implicit” and “explicit” CSR: A conceptual
framework for a comparative understanding of corporate social
responsibility. Academy of management Review, 33(2), pp. 404-424.
Maxwell J., (1992) Understanding and Validity in Qualitative Research.
Harvard Educational Review. (3), pp. 279-300.
Mintzberg, H. (1983) Power in and around organizations. Prentice-Hall,
Englewood Cliffs, NJ
Mcguinness, P. B, Vieito, J. P. and Wang, M. (2017) The role of board gender
and foreign ownership in the CSR performance of Chinese listed firms.
Journal of Corporate Finance, (42), pp.75-99
Mouton J. (1996) Basic Concepts in the Methodology of the Social Sciences.
– Pretoria: HSRC Publishers.
Murray, A. and Gray, R. (2006) Do financial markets care about social and
environmental disclosure? Further evidence and exploration from the UK.
Accounting, Auditing and Accountability Journal, 19(2), pp. 228–255.
Neubaum, D. O. and Zahra, S.A. (2006) Institutional ownership and corporate
social performance: the moderating effects of investment horizon activism
and coordination. J. Manage.32(1), pp.108–131.
Nölke, A. and Perry, J (2008) The power of transnational private governance:
Financialization and the IASB. Business and Politics, 9(3), pp.1–27.
Oxelheim, L. and Randoy, T. (2005) The Anglo-American financial influence
on CEO compensation in non-Anglo-American Firms. J. Int. Bus. Stud., 36
(4), pp. 470-483
Saunders, M. Lewis, P. and Thornhill, A. (2016). Research Methods for
Business Students. 7 ed., Harlow: Pearson Education Limited.
Schadewitz, H. and Niskala, M. (2010) Communication via responsibility
reporting and its effect on firm value in Finland. Corporate Social
Responsibility and Environmental Management, 17, pp.96–106.

40(47)
Sharma, P., Chrisman, J.J. and Gersick, K.E. (2012) 25 Years of Family
Business Review: Reflections on the Past and Perspectives for the Future,
Family Business Review,25 (1), pp. 5-15
Shleifer, A., and Vishny, R. (1986) Large shareholders and corporate control.
Journal of Political Economy ,94, pp. 461–488.
Shleifer, A., and Vishny, R. W. (1997) A survey of corporate governance.
Journal of Finance, 52, pp. 737–783.
Stein, Jeremy C. (1989) “Efficient Capital Markets, Inefficient Firms: A
Model of Myopic Corporate Behavior.” Quarterly Journal of Economics,
104 (Dec.), pp. 655-669.
van der Zwan, N. (2014) Making sense of financialization. Socio-Economic
Review, 12(1), pp. 99-129.
von Koch, C., Nilsson, O. and Eriksson, K. (2014) Does shareholder protection
affect the performance of analysts as a gatekeeper? Journal of Management
& Governance, 18(2), pp. 315-345.
Walliman N., (2006) Social Research Methods. - London, Thousand Oaks,
New Delhi: Sage.
Yoshikawa, T. and Rasheed, A. A. (2009) Convergence of corporate
governance: Critical review and future directions. Corporate Governance:
An International Review, 17(3), pp. 388-404.
CSR in Sweden (2017) Sustainability report [online] Available at:
https://sweden.se/business/csr-in-sweden/ [Accessed 28 March 2018].
KPMG (2015) European family business trend [online] Available at:
https://assets.kpmg.com/content/dam/kpmg/pdf/2015/12/european-family-
business-trends-2015.pdf [Accessed 30 March 2018].
Eikon (2018) Thomsonreuters index [online] Available at:
https://eikon.thomsonreuters.com/index.html[Accessed 30 March 2018].

41(47)
Appendix 1 Table of ESG ASSETS4 Environmental and Social performance of Swedish
companies for the period 2014-2016.
№
Company’s name
ESG ASSETS 4
Environmental
ESG ASSETS 4
Social
2014
1 NORDEA BANK
93,05 86,41
2 ATLAS COPCO
93,57 96,15
3 VOLVO
92,29 93,07
4 SWEDBANK
90,21 85,11
5 ERICSSON
93,94 88,6
6 HENNES & MAURITZ
88,31 82,38
7 SVENSKA HANDBKN.
77,25 83,59
8 SANDVIK
94,14 89,37
9 SEB
92,3 92,01
10 ASSA ABLOY
94,39 94,1
11 TELIA COMPANY
91,78 90,88
12 HEXAGON
52,27 64
13 INVESTOR
8,71 31,61
14 ALFA LAVAL
93,67 86,42
15 BOLIDEN
76,91 95,63
16 ELECTROLUX
93,18 88,09
17 LUNDIN PETROLEUM
40,3 77,66
18 SKANSKA
89,73 84,76
19 SKF
94,16 92,15
20 SWEDISH MATCH
75,28 93,47
21 ICA GRUPPEN
77,62 65,83
22 KINNEVIK
40,59 15,93
23 SCA
92,66 89,63

42(47)
24 AXFOOD
89,84 87,65
25 CASTELLUM
80,18 24,28
26 ELEKTA
83,39 76,8
27 FABEGE
80,48 78,05
28 HUSQVARNA
92,75 80,92
29 INTRUM JUSTITIA
14,83 30,77
30 BIOVITRUM
16,93 7,71
31 TELE2
49,45 65,04
32 BILLERUD KORSNAS
93,26 92,3
33 GETINGE
85,01 68,67
34 HOLMEN
88,94 73,57
35 INDUSTRIVARDEN
8,72 6,55
36 NIBE INDUSTRIER
58,29 15,08
37 SECURITAS
27,42 65,21
38 TRELLEBORG
92,01 90,65
39 HEXPOL
52,25 24,32
40 JM
91,79 92,86
41 KUNGSLEDEN
47,88 28,81
42 NCC
85,92 64,69
43 ORIFLAME HOLDING
93,53 85,58
44 PANDOX
87,5 89,48
45 SAS
80,46 78,22
46 WIHLBORGS
FASTIGHETER 90,86 71,49
47 NOBIA
90,37 60,05
48 RATOS
35,97 31,94
49 ENIRO
49,36 29,88
2015
1 NORDEA BANK
94,77 92,55

43(47)
2 ATLAS COPCO
94,85 95,93
3 VOLVO
94,08 93,62
4 SWEDBANK
90,84 84,92
5 ERICSSON
94,57 92,41
6 HENNES & MAURITZ
92,48 87,26
7 SVENSKA HANDBKN
84,13 86,84
8 SANDVIK
94,81 81,96
9 SEB
92,16 92,56
10 ASSA ABLOY
94,95 95,34
11 TELIA COMPANY
94,05 90,16
12 HEXAGON
69,68 64,15
13 INVESTOR
10,2 52,07
14 ALFA LAVAL
94,36 89,41
15 BOLIDEN
76,45 95,9
16 ELECTROLUX
94,15 86,86
17 LUNDIN PETROLEUM
58,7 82,72
18 SKANSKA
91,59 87,56
19 SKF
94,45 91,47
20 SWEDISH MATCH
81,79 94,23
21 ICA GRUPPEN
82,69 72,88
22 KINNEVIK
63,83 28,02
23 SCA
94,81 89,58
24 AXFOOD
91,82 91,27
25 CASTELLUM
86,75 47,62
26 ELEKTA
91,89 79,39
27 FABEGE
89,57 81,57
28 FASTIGHETS BALDER
33,8 7,73
29 HUSQVARNA
94,31 88,32

44(47)
30 INTRUM JUSTITIA
21,28 46,59
31 BIOVITRUM
24,44 15,59
32 TELE2
56,07 78,35
33 BILLERUD KORSNAS
94,12 92,52
34 GETINGE
91,95 79,53
35 HOLMEN
91,87 87,17
36 INDUSTRIVARDEN
10,2 15,51
37 KINDRED GROUP SDR
25,88 10,56
38 NIBE INDUSTRIER
85,06 64,14
39 SAAB
66,95 49,75
40 SECURITAS
34,46 75,08
41 TRELLEBORG
90,44 91
42 BEIJER REF AB
12,12 10,2
43 HEXPOL
66,32 35,87
44 JM
93,3 93,87
45 KUNGSLEDEN
48,16 33,04
46 NCC
88,45 78,48
47 ORIFLAME HOLDING
94,15 89,54
48 PANDOX
89,9 93,22
49 SAS
82,14 85,14
50 WIHLBORGS
FASTIGHETER 93,11 78,27
51 NOBIA
91,3 83,51
52 NOLATO
71,02 32,19
53 RATOS
51,23 38
54 CTT SYSTEMS
15,18 10,84
55 ENIRO
59,48 34,63
56 FINGERPRINT CARDS
17,37 22,03
57 GUNNEBO
68 30,22

45(47)
58 LINDAB
INTERNATIONAL 54,84 23,92
59 NEDERMAN HOLDING
55,13 26,42
60 SVEDBERGS I
DALSTORP 11,65 6,9
61 VBG GROUP
15,61 12,44
2016
1 NORDEA BANK
93,66 88,59
2 ATLAS COPCO
94,74 96,17
3 VOLVO
93,31 94,14
4 SWEDBANK
92,52 90,15
5 ERICSSON
95,17 91,24
6 HENNES & MAURITZ
92,73 90,71
7 SVENSKA HANDBKN
87,03 88,35
8 SANDVIK
95,15 87,38
9 SEB
93,77 93,65
10 ASSA ABLOY
95,23 96
11 TELIA COMPANY
93,58 89,89
12 HEXAGON
77,55 68,41
13 INVESTOR
11,37 56,18
14 ALFA LAVAL
94,82 92
15 BOLIDEN
77,79 95,91
16 ELECTROLUX
94,51 90,81
17 LUNDIN PETROLEUM
68,19 78,32
18 SKANSKA
92,51 91,28
19 SKF
94,98 93,23
20 SWEDISH MATCH
82,06 88,97
21 ICA GRUPPEN
84,51 78,46
22 KINNEVIK
65,54 42,19
23 SCA
93,71 89,67

46(47)
24 AXFOOD
93,33 92,19
25 CASTELLUM
88,97 69,13
26 ELEKTA
92,99 78,74
27 FABEGE
92,58 86,66
28 FASTIGHETS BALDER
37,97 9,44
29 HUSQVARNA
94,62 91,39
30 INTRUM JUSTITIA
26,48 59,16
31 BIOVITRUM
26,96 17,79
32 TELE2
74,44 80,13
33 BILLERUD KORSNAS
93,81 90,18
34 GETINGE
88,22 66,87
35 HOLMEN
92,87 88,7
36 INDUSTRIVARDEN
12,03 22,01
37 KINDRED GROUP SDR
23,77 13,86
38 LOOMIS
36,31 22,98
39 NIBE INDUSTRIER
88,94 69,75
40 SAAB
84,47 58,15
41 SECURITAS
38,2 88,54
42 TRELLEBORG
91,45 93,64
43 BEIJER REF AB
14,88 15,99
44 HEXPOL
86,27 49,84
45 JM
94,25 95,09
46 KUNGSLEDEN
64,56 65,99
47 NCC
92,51 83,29
48 ORIFLAME HOLDING
94,79 92,18
49 PANDOX
91,85 89,22
50 SAS
84,62 80,17
51 WIHLBORGS
FASTIGHETER 94,05 84,34

47(47)
52 NOBIA
92,53 82,11
53 NOLATO
86,05 45,51
54 RATOS
66,32 50,04
55 SECTRA
13,13 19,45
56 BERGMAN & BEVING
28,17 26,03
57 CLAS OHLSON
28,11 41,42
58 CTT SYSTEMS
18,97 13,72
59 ENIRO
66,21 43,04
60 FINGERPRINT CARDS
49,39 37,22
61 GUNNEBO
76,17 43,42
62 LINDAB
INTERNATIONAL 65,07 34,54
63 NEDERMAN HOLDING
66,61 33,39
64 VBG GROUP
19,56 21,78