Evaluation of the effects of shaking intensity on the process of methylene blue discoloration by...
28
Evaluation of the effects of shaking intensity on the process of methylene blue 1 2 3 4 discoloration by metallic iron Noubactep C.*, Kurth A.-M.F., Sauter M. Angewandte Geologie, Universität Göttingen, Goldschmidtstraße 3, D - 37077 Göttingen, Germany. 5 6 7 8 9 10 11 12 13 14 15 16 17 18 19 20 21 22 23 24 25 26 * Corresponding author: e-mail: [email protected] ; Tel. +49 551 39 3191, Fax: +49 551 399379 Abstract The term mixing (shaking, stirring, agitating) is confusing because it is used to describe mass transfer in systems involving species dissolution, species dispersion and particle suspension. Each of these mechanisms requires different flow characteristics in order to take place with maximum efficiency. This work was performed to characterize the effects of shaking intensity on the process of aqueous discoloration of methylene blue (MB) by metallic iron (Fe 0 ). The extent of MB discoloration by three different materials in five different systems and under shaking intensities varying from 0 to 300 min -1 was directly compared. Investigated materials were scrap iron (Fe 0 ), granular activated carbon (GAC), and deep sea manganese nodules (MnO 2 ). The experiments were performed in essay tubes containing 22 mL of the MB solution (12 mg/L or 0.037 mM). The essay tubes contained either: (i) no reactive material (blank), (ii) 0 to 9.0 g/L of each reactive material (systems I, II and III), or (iii) 5 g/L Fe 0 and 0 to 9.0 g/L GAC or MnO 2 (systems IV and V). The essay tubes were immobilized on a support frame and shaken for 0.8 to 5 days. Non-shaken experiments lasted for duration up to 50 days. Results show increased MB discoloration with increasing shaking intensities below 50 min -1 , a plateau between 50 and 150 min -1 , and a sharp increase of MB discoloration at shaking intensities ≥ 200 min -1 . At 300 min -1 , increased MB discoloration was visibly accompanied by suspension of dissolution products of Fe 0 /MnO 2 and suspension of GAC fines. The results suggest that, shaking intensities aiming at facilitating contaminant mass transfer to the Fe 0 surface should not exceed 50 min -1 . 1
-
Upload
xn--uni-gttingen-8ib -
Category
Documents
-
view
2 -
download
0
Transcript of Evaluation of the effects of shaking intensity on the process of methylene blue discoloration by...

Evaluation of the effects of shaking intensity on the process of methylene
blue
1
2
3
4
discoloration by metallic iron
Noubactep C.*, Kurth A.-M.F., Sauter M.
Angewandte Geologie, Universität Göttingen, Goldschmidtstraße 3, D - 37077 Göttingen, Germany.
5
6
7
8
9
10
11
12
13
14
15
16
17
18
19
20
21
22
23
24
25
26
* Corresponding author: e-mail: [email protected]; Tel. +49 551 39 3191, Fax: +49 551 399379
Abstract
The term mixing (shaking, stirring, agitating) is confusing because it is used to describe mass
transfer in systems involving species dissolution, species dispersion and particle suspension.
Each of these mechanisms requires different flow characteristics in order to take place with
maximum efficiency. This work was performed to characterize the effects of shaking intensity
on the process of aqueous discoloration of methylene blue (MB) by metallic iron (Fe0). The
extent of MB discoloration by three different materials in five different systems and under
shaking intensities varying from 0 to 300 min-1 was directly compared. Investigated materials
were scrap iron (Fe0), granular activated carbon (GAC), and deep sea manganese nodules
(MnO2). The experiments were performed in essay tubes containing 22 mL of the MB
solution (12 mg/L or 0.037 mM). The essay tubes contained either: (i) no reactive material
(blank), (ii) 0 to 9.0 g/L of each reactive material (systems I, II and III), or (iii) 5 g/L Fe0 and
0 to 9.0 g/L GAC or MnO2 (systems IV and V). The essay tubes were immobilized on a
support frame and shaken for 0.8 to 5 days. Non-shaken experiments lasted for duration up to
50 days. Results show increased MB discoloration with increasing shaking intensities below
50 min-1, a plateau between 50 and 150 min-1, and a sharp increase of MB discoloration at
shaking intensities ≥ 200 min-1. At 300 min-1, increased MB discoloration was visibly
accompanied by suspension of dissolution products of Fe0/MnO2 and suspension of GAC
fines. The results suggest that, shaking intensities aiming at facilitating contaminant mass
transfer to the Fe0 surface should not exceed 50 min-1.
1

Keywords: Adsorption; Co-precipitation; Methylene Blue; Shaking Intensity; Zerovalent
Iron.
27
28
29
30
31
32
33
34
35
36
37
38
39
40
41
42
43
44
45
46
47
48
49
50
51
Introduction
The processes occurring at the interface Fe0/H2O are of great interest for the use of metallic
iron in environmental remediation (e.g. in Fe0/H2O systems). A great deal of work has been
reported in this area during the past 20 years [1-10]. Since the seminal work of Matheson and
Tratnyek [1], a substantial amount of literature concerning the removal mechanism of various
contaminants in Fe0/H2O systems has been published. This is not surprising given that: (i) the
concept of permeable reactive barrier (PRB) is regarded as a significant advance in
remediation technology [11,12], and (ii) iron PRBs have been demonstrated very efficient to
mitigate contaminants in surface and ground waters [3-5]. Moreover, Fe0/H2O systems have
been shown to effectively removed aqueous species of various nature. These include viruses
[13], bacteria [14], inorganics [15,16], redox-sensitive organics [1,17], and redox-insensitive
organics [18]. The large diversity of contaminants successfully removed in Fe0/H2O systems
has recently prompted the revision of the initial "reductive transformation" concept [1,19].
The "reductive transformation" concept is obviously inconsistent with quantitative removal of
redox-insensitive species. A new concept of "adsorption/co-precipitation" was introduced
[20,21] stipulating that adsorption and co-precipitation are the fundamental mechanisms of
contaminant removal in Fe0/H2O systems. The adsorption/co-precipitation concept is free of
contradictions inherent to reductive transformation concept and explains some controversial
experimental facts [20]. After the new concept, a Fe0/H2O system should be regarded as a
zone of precipitating iron oxides. Each species (including contaminants) entering this zone
will be first adsorbed onto and/or co-precipitated with iron (hydr)oxides but could undergo
further abiotic transformations [including reduction by electrons from Fe0, FeII, H2/H and
oxidation by Fenton reagents (FeII and H2O2), , which react to highly oxidizing •OH-radicals].
2

Regarding Fe0/H2O systems as zones of precipitating iron oxides suggests a profound analysis
of the process of iron precipitation to better characterize its impact on contaminant removal
under given relevant conditions. The adsorption of a contaminant onto a solid/H
52
53
54
55
56
57
58
59
60
61
62
63
64
65
66
67
68
69
70
71
72
73
74
75
76
77
2O interface
involves a cascade of complex events occurring almost simultaneously: (i) transport of
contaminant molecules from the bulk solution to the interface by diffusion or
diffusion/convection processes; (ii) adsorption of contaminant molecules at the solid/H2O
interface; (iii) structural modifications of the fixed molecules together for high surface
coverages and interactions of the incoming molecules with previously accumulated
contaminant molecules [22]. In real natural systems, adsorption competition between
molecules of different nature and molecular weight should be additionally considered.
The particularity of Fe0/H2O systems is three fold: (i) Fe0 dissolution and precipitation yields
a complex hydroxide and oxide mixture of unknown composition, (ii) Fe0 and FeII are
potential reducing agents, and (iii) the weight fraction of iron hydroxide and oxide particles
increases from zero at the beginning to more or less higher proportions depending on the
reaction progress. The net result is a multi-solid reaction system involving many types of
solids of widely differing sizes and density (Fe0 and various iron hydroxides/oxides). The
large changes in the solid composition during the reaction will certainly influence the mass
transfer of species to the Fe0/H2O interface and thereby play a significant role in the
determination of reaction rates [23]. Moreover, in situ formed iron oxides are not inert with
regard to contaminant removal [20,21]. Therefore, the effective mass transfer to the Fe0/H2O
interface depends also on the affinity of iron hydroxides/oxides to the contaminants.
The process of iron oxide precipitation results from the hydrolysis and precipitation of
FeII/FeIII hydroxides followed by dehydration. Thereby, amorphous iron hydroxides
[Fe(OH)2/Fe(OH)3] of very large surface areas are transformed to more crystalline oxides
(FeOOH, Fe2O3, Fe3O4). The most characteristic feature is that the system undergoes an
irreversible process controlled by hydrodynamic and physicochemical conditions. The present
3

work mainly pay the attention to the hydrodynamic conditions. In accelerated batch
experiments, the reaction progress is largely dependent on the particle size of used Fe
78
79
80
81
82
83
84
85
86
87
88
89
90
91
92
93
94
95
96
97
98
99
100
101
102
103
0 and
mixing procedure (agitating, shaking, stirring) and mixing intensity/speed. For a system in
which new solid phases of various size and density are present, used mixing designs and
mixing intensities should be one of the major sources of reported discrepancies. In fact
mixing may hold original and new formed particles in suspension [24, 25], thereby disturbing
the natural layered disposition of Fe0 and Fe-oxides.
The two objectives of this work were: (i) to characterise the effect of shaking intensity on the
process of methylene blue (MB) discoloration from the aqueous solution by metallic iron
(Fe0), and (ii) to identify the critical shaking intensity above which the process of MB
discoloration by Fe0 is significantly disturbed to be representative for natural situations. The
critical shaking intensity is defined as the shaking intensity above which mixing operations
induce more that speeding up external mass-transfer of contaminants from the bulk solution to
the vicinity of Fe0 (see next section). For this purpose separate discoloration experiments were
performed in five different systems (i) metallic iron (system I), (ii) granular activated carbon
(system II), (iii) manganese nodules (system III), (iv) “Fe0 + GAC” (system IV), and (v) "Fe0
+ MnO2" (system V). The results were comparatively discussed.
Background of the experimental methodology
In laboratory batch experiments mixing operations are mainly used for two purposes [24, 25]:
(i) accelerating solid phase dissolution (process I), and (ii) accelerating mass transfer of solute
to a solid/liquid interface (process II). The latter aspect includes efforts to keep reactive
surface in suspension (process III). Depending on the aqueous chemical reactivity of the solid
phase and the mixing intensity, process I, II and III are more or less likely to occur. For an
inert solid phase as granular activated carbon (GAC) process I may not occur. But for reactive
solid phases (Fe0, MnO2) process I through III may simultaneously occur depending on the
mixing intensity. With other words, in a Fe0/H2O system mixing operations may induce at
4

least two antagonistic effects: (i) mass transfer to the Fe0/H2O interface and (ii) accelerated
Fe
104
105
106
107
108
109
110
111
112
113
114
115
116
117
118
119
120
121
122
123
124
125
126
127
128
129
0 dissolution. Mass transfer to the Fe0/H2O interface has been largely considered while
accelerated Fe0 dissolution and its consequences on the process of contaminant removal have
been almost overseen [20,21]. Moreover, vigorous mixing can also induce two negative
effects: (i) breaking the material grains subject to friability (attrition) [25], and (ii) eliminating
the diffusion inhibition of surface processes [26]. Tomashov and Vershinina [26] have shown
that a sufficiently vigorous stirring and continuous renewal of the Fe0 surface (scouring)
eliminates the inhibition of the electrode-process step associated with adsorption or the
formation of surface layers.
The transport of solutes in a Fe0/H2O system proceeds in two ways: advection and diffusion.
Advection is caused by water flow, while diffusion is caused by the concentration gradient
[27,28]. Diffusion of solutes in water corresponds with the chemical reactions, if advection
due to the water flow is slow enough. Advection does not induce any additive process in the
system but speeds up processes observable when diffusion is the sole transport mechanism
(Assumption 1). Assumption 1 is the main argument on which this study is built. Thereafter,
results achieved in non-disturbed systems (diffusion-controlled), relevant for environmental
situations, should be reproducible under shaken conditions. Accordingly, relevant shaking
intensities for Fe0/H2O systems should not induce further processes causing suspension of in-
situ generated corrosion products or abrasion of oxide films. Clearly, applied mixing
intensities should solely speed up external mass-transfer of contaminants from the bulk
solution to the vicinity of the solid.
Materials and methods
Reagent and materials
Methylene blue (MB) is a traditionally favourite dye of choice for laboratory and technical
purposes [29-31]. Its molecule has a minimum diameter of approximately 0.9 nm [31] and is
used as redox indicator [32]. As positively charged ions, MB should readily adsorb onto
5

negatively charged surface. That is at pH > pHpzc; pHpzc being the pH at the point of zero
charge [33]. The used initial concentration was 12 mg L
130
131
132
133
134
135
136
137
138
139
140
141
142
143
144
145
146
147
148
149
150
151
152
153
154
155
-1 (~0.037 mM) MB and it was
prepared by diluting a 1000 mg L-1 stock solution. All chemicals were analytical grade.
The used Fe0 material is a readily available scrap iron. Its elemental composition was
determined by X-Ray Fluorescence Analysis and was found to be: C: 3.52%; Si: 2.12%; Mn:
0.93%; Cr: 0.66%. The material was fractionated by sieving. The fraction 1.6 - 2.5 mm was
used. The sieved Fe0 was used without any further pre-treatment.
The used granular activated carbon (GAC) from LS Labor Service GmbH
(Griesheim/Germany) was crushed and sieved. The particle sized fraction ranging from 0.63
to 1.0 mm was used without further characterization.
Manganese nodules (MnO2) collected from the deep sea was crushed and sieved. An average
particle size of 1.5 mm was used. Its elemental composition was determined by X-Ray
Fluorescence Analysis and was found to be: Mn: 41.8%; Fe: 2.40%; Si: 2.41%; Ni: 0.74%;
Zn: 0.22%; Ca: 1.39%; Cu: 0.36%. These manganese nodules originated from the pacific
ocean (Guatemala basin: 06°30 N, 92°54 W and 3670 m deep). The target chemically active
component is MnO2, which occurs naturally mainly as birnessite and todorokite [34].
Rationale for choice of test conditions
Materials selected for study were known to be effective for adsorbing MB (GAC), discoloring
MB (Fe0, MnO2) or delaying the availability of iron corrosion products in Fe0/H2O systems
(MnO2) [35]. MB co-precipitation with in situ formed iron corrosion products was
demonstrated to be the main mechanism of discoloration [36].
Table 1 summarises the function of the individual materials and gives the material surface
coverage in individual reaction vessels. The detailed method for the calculation of the surface
coverage (θ) is presented by Jia et al. [18]. The minima of reported specific surface area
(SSA) values of the adsorbents were used for the estimation of surface coverage. The Fe0 SSA
was earlier measured by Mbudi et al. [37]. The value 120 Å2 is considered for the molecular
6

cross-sectional area of MB [31]. From Tab. 1 it can be seen that, apart from Fe0 (θ = 18.8), all
other materials were present in excess “stoichiometry” (θ ≤ 0.13). This means that the
available surface of Fe
156
157
158
159
160
161
162
163
164
165
166
167
168
169
170
171
172
173
174
175
176
177
178
179
180
181
0 could be covered by up to 18 mono-layers of MB, whereas the other
materials should be covered to less than one fifth with MB (θ = 1 corresponds to a mono-layer
coverage). Therefore, depending on the initial pH value and the affinity of MB for the
individual materials (pHpzc) and the kinetics of MB transport to the reactive sites (material
porosity, shaking intensity), the MB discoloration should be quantitative for sufficient
experimental duration. A survey of the pHpzc values given in Tab. 1 suggests that MB
adsorption onto all used adsorbents should be favourable because the initial pH was 7.8. At
this pH value all surfaces are negatively charged; MB is positively charged. Because the
available Fe0 surface can be covered by up to 18 layers of MB, a progressive MB
discoloration in presence of Fe0 is expected.
Discoloration studies
Batch experiments with shaking intensities varying from 0 to 300 min-1 were conducted in
essay tubes for experimental durations varying from 0.83 to 50 days. The essay tubes were
immobilized on a support frame and shaken for 0.8 to 7 days. A rotary shaker HS 501 D from
“Janke & Kunkel”, DCM Laborservice, with a maximum shaking intensity of 300 min-1 was
used. A non-disturbed experiment was conducted for 25 and 50 days. The batches consisted
of 0 to 9.0 g L-1 of a material (GAC, Fe0, MnO2 systems I, II and III) or 5 g L-1 Fe0 and 0 to
9.0 g L-1 GAC (system IV) and MnO2 (system V) respectively. A reaction time of 25 d for the
non-disturbed experiment was selected to allow a MB discoloration efficiency of about 80%
in the system with Fe0 alone. The experiment with 50 d reaction time targeted a better
characterization of system V (Fe0 + MnO2). The extent of MB discoloration in the five
systems was characterized under various shaking intensities. For this purpose 0.0 to 0.20 g of
Fe0 and the additives were allowed to react in sealed sample tubes containing 22.0 mL of a
MB solution (12 mg L-1) at laboratory temperature (about 20° C). Initial pH was ~7.8. After
7

equilibration, up to 3 mL of the supernatant solutions were carefully retrieved (no filtration)
for MB measurements (no dilution). In the experiments at shaking intensities > 150 min
182
183
184
185
186
187
188
189
190
191
192
193
194
195
196
197
198
199
200
201
202
203
204
205
206
207
-1 the
samples were centrifuged at 5000 min-1 for 20 min prior to spectrophotometric analysis [38].
Analytical methods
MB concentrations were determined by a Cary 50 UV-Vis spectrophotometer (Varian) at a
wavelength of 664.5 nm using cuvettes with 1 cm light path. The pH value was measured by
combined glass electrodes (WTW Co., Germany). Electrodes were calibrated with five
standards following a multi-point calibration protocol in agreement with the current IUPAC
recommendation [39].
Each experiment was performed in triplicate and averaged results are presented.
Results and Discussion
After the determination of the residual MB concentration (C) the corresponding percent MB
discoloration was calculated according to the following equation (Eq. 1):
P = [1 - (C/C0)] * 100% (1)
where C0 is the initial aqueous MB concentration (about 12 mg L-1), while C gives the MB
concentration after the experiment. The operational initial concentration (C0) for each case
was acquired from a triplicate control experiment without additive material (so-called blank).
This procedure was to account for experimental errors during dilution of the stock solution,
MB adsorption onto the walls of the reaction vessels and all other possible side reaction
during the experiments.
Evidence for the effect of shaking on the process MB discoloration
Preliminary qualitative experiments at 300 min-1 showed that the MB solution in the essay
tubes in all systems became very turbid due to particle attrition (breaking the grains of GAC,
MnO2) or suspension of in-situ generated iron oxides (Fig. SC1 – supplementary Content). In
systems IV and V (see table 2), suspended iron oxides may compete with MB for adsorption
site on GAC or MnO2. Attrition of GAC and MnO2 certainly increases the surface area of the
8

208
209
210
211
212
213
214
215
216
217
218
219
220
221
222
223
224
225
226
227
228
229
230
231
232
233
adsorbents, accelerating the MB adsorption kinetics. Keeping in mine that relevant mixing
operations should solely provide a uniform distribution of the MB in the solution
(Assumption 1), further experiments targeted at better characterizing the effects of shaking
intensity on the process of MB discoloration.
Effects of the shaking intensity on the MB discoloration in investigated systems
Figure 1 compares the extent of MB discoloration in the five investigated systems as the
shaking intensity varies from 0 to 300 min-1 for an experimental duration of 24 h (1 d).
The observed general trend can be summarized as follows: (i) shaking at 50 min-1
significantly increases the extent of MB discoloration in all systems comparatively to non-
disturbed experiments; (ii) increasing the shaking intensity from 50 to 200 min-1 has no
significant effect on MB discoloration (except for system II); (iii) increasing the shaking
intensity from 200 to 300 min-1 resulted in total MB discoloration for all systems except
system I.
Interestingly, the expected lower MB discoloration in system V relative to system I could not
be observed at all tested shaking intensity for 1 d. In other words, the well-documented
reductive dissolution of MnO2 by FeII [40,41] could not be observed. Therefore, shaking
operations definitively significantly influences the mechanism of contaminant removal in
Fe0/H2O systems.
The increased discoloration efficiency of system II at 200 min-1 comparatively to system IV
suggests that suspended corrosion products have impaired MB discoloration by competing for
GAC adsorption sites. Accordingly, fines from GAC which are responsible for increased
discoloration at a shaking intensity of 200 min-1 in system II are (at least partly) covered by
suspended corrosion products in system IV yielding lower MB discoloration. At 300 min-1
enough fine are present for total MB discoloration despite the inhibitory effects of suspended
corrosion products. The fact that MB discoloration was the lowest in system I (Fe0 alone) is
consistent with the hypothesis of discoloration inhibition by suspended corrosion products.
9

234
235
236
237
238
239
240
241
242
243
244
245
246
247
248
249
250
251
252
253
254
255
256
257
258
259
With regards on the mechanism of MB discoloration [36] it should be considered that
suspended corrosion products are kept in the solution and their polymerisation is impaired
yielding low precipitation and thus, low extent of MB co-precipitation.
The fact that the well documented impact of MnO2 on the process of MB discoloration (MB
co-precipitation) by Fe0 could not be experimentally observed could suggest that, for a mass
of 5 g/l, a reaction time of 1 day was too short (Assumption 2). Before testing the validity of
assumption 2, the results of shaken experiments for 5 days should first be presented and
compared to that of non-disturbed experiments for 25 days. Kurt [38] demonstrated increased
MB discoloration with increased shaking time.
Effects of shaking intensity on the kinetics of MB discoloration
Figure 2 compares the extent of MB discoloration as function of material loading in systems I,
II and III under non-disturbed conditions for 25 days (Fig. 2a) and at a shaking intensity of
150 min-1 for 5 days (Fig. 2b). The results showed that under non-disturbed conditions less
than 60 % of the initial amount of MB could be discoloured in all systems and Fe0 was the
most efficient material (58 %). The order of increasing discoloration efficiency was MnO2 <
GAC < Fe0. At mass loadings ≥ 8 g/L the discoloration efficiency of GAC and Fe0 were very
comparable. This observation can be explained by the porous nature of GAC: slow intra-
particle diffusion [25].
Under shaken conditions, Fe0 was clearly the less efficient material and its maximal
discoloration efficiency was 50 %. This result confirms that shaking is someway inhibiting for
the process of MB discoloration. The discoloration efficiency for MnO2 and GAC was larger
than 60 %. The order of increasing discoloration efficiency was Fe0 < MnO2 < GAC. It is
important to note that: (i) MB discoloration was completed in the presence of GAC for mass
loadings > 5 g L-1, and (ii) in all the systems a plateau was observed for loadings > 4.5 g L-1.
This plateau corresponds to slow processes that can not be significantly accelerated under the
experimental conditions (150 min-1, 5 days). This conclusion is supported by the fact that an
10

higher discoloration efficiency could be observed under non-disturbed conditions with Fe0 for
25 days. As all materials were at the bottom of the essay tubes a slow process common to all
systems can be inter-particle MB diffusion to the material (re)active sites. For Fe
260
261
262
263
264
265
266
267
268
269
270
271
272
273
274
275
276
277
278
279
280
281
282
283
284
285
0 additional
slow processes are the oxidative dissolution of Fe0 (chemical reaction) and the MB diffusion
across the oxide film on Fe0 surface [23]. For MnO2 the additional slow process can be the
reductive dissolution (yielding MnII species) or MB intra-particle diffusion to the reactive site.
For porous GAC possible slow processes are MB inter-particle and intra-particle diffusion.
Figure 2 clearly shows that shaking accelerates the kinetics of MB transport to the surface of
GAC and MnO2 yielding higher discoloration efficiency relative to non-disturbed systems.
Thereby GAC is always more efficient than MnO2. Therefore, assumption 1 is verified for
GAC and MnO2. As concerning the system with Fe0, it is obvious that shaking the system for
at 150 min-1 for 5 days was not sufficient to achieved more than 50 % MB discoloration .
These results may suggest either that (i) iron corrosion was too slow to produce enough
corrosion products for MB co-precipitation, (ii) the kinetics of corrosion products
precipitation was too high to induce quantitative MB co-precipitation, or (iii) in-situ formed
corrosion products are kept suspended in the solution (co-precipitation occurs to a lesser
extent). To bring more clarity in this issue, the effect of MnO2 on MB discoloration by Fe0
(systems I and V) in non-disturbed experiments and experiments at 150 min-1 for 5 days were
compared.
Effects of shaking intensity on MB discoloration in Fe0/MnO2/H2O systems
Figure 3 compares the extent of MB discoloration as function of material loading in systems I,
III and V under non-disturbed conditions for 25 days (Fig. 3a) and at a shaking intensity of
150 min-1 for 5 days (Fig. 3b). The results of systems I and III have already been discussed
(Fig. 2). This section will focus on system V to test the validity of assumption 2.
Figure 3a clearly shows that under non-disturbed conditions, MB discoloration is inhibited in
the presence of MnO2 as expected. However, this inhibition is limited to low MnO2 mass
11

loadings (≤ 4.5 g/l). The initial discoloration efficient of 48 % at 0 g/l MnO2 decreases to 13
% at 1.1 g/l MnO
286
287
288
289
290
291
292
293
294
295
296
297
298
299
300
301
302
303
304
305
306
307
308
309
310
2 and then increases with increasing MnO2 mass loading. The fact that the
discoloration efficiency at MnO2 mass loading > 4.5 g/l was higher than in both system I and
system III (Fig. 3a) suggests that MB serves as redox indicator [32] to evidence extensive
oxidation of FeII to FeIII in the presence of large amounts of MnO2. Because the experiments
were performed under oxic conditions, the observed reducing conditions should be regarded
as a transition state afterwards the colorless Leuco-Methylene Blue (LMB) is backwards
oxidized to MB by diffused molecular oxygen. Note that, in his experiments for 35 days using
20 mg/l MB and the same experimental conditions, Noubactep [36] could not observed the
redox indicator properties of MB but a slight further decrease of MB discoloration with
increasing MnO2 mass loading. The redox indicator properties of MB was also not observed
in shaken experiments (Fig. 3b). Hence, the merit of non-disturbed experiments to evidence
theoretically foreseeable processes [42] is underlined here.
Figure 3b shows no significant effect of MnO2 on the process of MB discoloration by Fe0. It
can be seen that the extent of MB discoloration remains constant to approximatively 40 %
when the MnO2 loading increases from 0 to 9 g/l. Therefore, assumption 2 is not verified,
showing that shaking disturbs the process of iron precipitation and thus the process of MB co-
precipitation with iron corrosion products. On the other side, the redox indicator properties of
MB are not also evidenced as discussed above.
Figure 4 compares the MB discoloration efficiency in system V after 25 and 50 days. It is
very interesting to see that for sufficient long experimental duration (50 d), MB discoloration
is quantitative for all MnO2 loadings (≤ 9.1 g/l). This result corroborates the ability of non-
disturbed experiments to evidence theoretically foreseeable processes. Accordingly mixing
operation may accelerate investigated process in such a way that important aspects are
overseen. Two examples could be given in this study: (i) the well-documented redox indicator
12

311
312
313
314
315
316
317
318
319
320
321
322
323
324
325
326
327
328
329
330
331
332
333
334
335
properties of MB [32], and (ii) the reductive dissolution of MnO2 inducing delay in the
availability of free corrosion products for MB co-precipitation [36].
Conclusions
The effects of shaking intensity on the process of MB discoloration was characterized in a
sequence of experiments. The working hypothesis was that any relevant mixing operation for
real world situations should solely accelerate the diffusive transport of MB from the aqueous
solution to the interface solid/H2O. The results indicated that shaking intensities ≥ 50 min-1
lead to a suspension of in-situ generated iron corrosion products and to a delay of the process
of MB co-precipitation. More importantly, apart from non-disturbed systems, none of the
tested experimental conditions could reproduce the well-documented reductive dissolution of
MnO2 by FeII species [40,41] which would have been reflected by a delay in MB co-
precipitation by Fe0 in the presence of MnO2. Finally, non-disturbed experiments could
evidence the well-documented redox indicator properties of MB. Mixing intensity < 50 min-1
were not tested, but the complexity of mixing operations on processes in Fe0/H2O systems
could be unambiguously evidenced. Generally, the mixing intensity is considered of utmost
importance when it leads to attrition of the reactive media [25]. However, even this aspect is
not usually taken into account in most studies, and mixing intensities higher than 300-1 min
have been used in characterising redox processes in Fe0/H2O systems [43,44].
Implication for future works
As part of any proposed process, the fundamentals of the reaction need to be investigated to
aid in the optimisation of the process [1,45]. The present work has unambiguously shown the
influence of shaking intensity on the process of contaminant removal in Fe0/H2O systems on
the example of methylene blue discoloration by metallic iron (Fe0). It can be expected that
other mixing procedures (stirring, agitating, vortex) have similar disturbing impacts. These
disturbing impacts are yet to characterise and consider for further technology development.
13

The results of the present work have shown that, while using mixing operations as a tool to
accelerate the reaction kinetics and achieve elevated removal efficiencies within relative short
times, a severe bias was introduced. The net effect of elevated mixing intensities is two fold:
(i) to inhibit the precipitation of iron oxides in the vicinity of Fe
336
337
338
339
340
341
342
343
344
345
346
347
348
349
350
351
352
353
354
355
356
357
358
359
360
0 by favouring the transport
of FeII and FeIII species away from the Fe0 surface, and (ii) to sustain suspension of initial
corrosion products and delay quantitative precipitation.
Given the large diversity of mixing devices used in experiments for contaminant removal in
Fe0/H2O, the critical value of 50 min-1 given in this work has only an indicative value. For any
mixing device preliminary investigations should help to identify the domain of mixing
intensities for which mixing can be considered to facilitate contaminant transport to the
interface Fe0/H2O without substantially disturbing the process of iron oxide precipitation. In
general, experiments pertinent to subsurface Fe0/H2O systems should not be performed under
shaking conditions higher than the groundwater flowing velocities.
Repeating reported experiments with several organic and inorganic compounds exhibiting
various (i) redox reactivity, (ii) molecular sizes and (iii) affinity for iron oxides will enable a
better comprehension of the influence of shaking on the process of contaminant removal for
environmental remediation.
Acknowledgments
For providing the iron material investigated in this study the authors would like to express
their gratitude to the branch of the MAZ (Metallaufbereitung Zwickau, Co) in Freiberg
(Germany). Mechthild Rittmeier, Florian Deisinger and Gerhard Max Hundertmark are
acknowledged for technical support. The work was granted by the Deutsche
Forschungsgemeinschaft (DFG-No 626/2-2).
Supplementary Content: Photographic documentation of turbid systems as results of
shaking at 300 min-1 for 1 and 3 d.
14

References 361
362
363
364
365
366
367
368
369
370
371
372
373
374
375
376
377
378
379
380
381
382
383
384
385
[1] L.J. Matheson, P.G. Tratnyek, Reductive dehalogenation of chlorinated methanes by iron
metal, Environ. Sci. Technol. 28 (1994), 2045-2053.
[2] S.F. O'Hannesin, R.W. Gillham, Long-term performance of an in situ "iron wall" for
remediation of VOCs. Ground Water 36 (1998), 164-170.
[3] J.L. Jambor, M. Raudsepp, K. Mountjoy, Mineralogy of permeable reactive barriers for
the attenuation of subsurface contaminants. Can. Miner. 43 (2005), 2117-2140.
[4] A.D. Henderson, A.H. Demond, Long-term performance of zero-valent iron permeable
reactive barriers: a critical review. Environ. Eng. Sci. 24 (2007), 401-423.
[5] D.F. Laine, I.F. Cheng, The destruction of organic pollutants under mild reaction
conditions: A review. Microchem. J. 85 (2007), 183-193.
[6] A.B. Cundy, L. Hopkinson, R.L.D. Whitby, Use of iron-based technologies in
contaminated land and groundwater remediation: A review. Sci. Tot. Environ. 400 (2008), 42-
51.
[7] R.L. Johnson, R.B. Thoms, R.O'B. Johnson, T. Krug, Field evidence for flow reduction
through a zero-valent iron permeable reactive barrier. Ground Water Monit. Remed. 28
(2008), 47-55.
[8] R.L. Johnson, R.B. Thoms, R.O'B. Johnson, J.T. Nurmi, P.G. Tratnyek, Mineral
precipitation upgradient from a zero-valent iron permeable reactive barrier. Ground Water
Monit. Remed. 28 (2008), 56-64.
[9] J. Suk O, S.-W. Jeen, R.W. Gillham, L. Gui, Effects of initial iron corrosion rate on long-
term performance of iron permeable reactive barriers: Column experiments and numerical
simulation. J. Contam. Hydrol. 103 (2009), 145-156.
[10] R. Thiruvenkatachari, S. Vigneswaran, R. Naidu, Permeable reactive barrier for
groundwater remediation. J. Ind. Eng. Chem. 14 (2008), 145-156.
15

386
387
388
389
390
391
392
393
394
395
396
397
398
399
400
401
402
403
404
405
406
407
408
409
410
[11] D.C. McMurty, R.O. Elton, New approach to in-situ treatment of contaminated
groundwaters. Environ. Progr. 4/3 (1985), 168-170.
[12] R.C. Starr, J.A. Cherry, In situ remediation of contaminated Ground water: The funnel-
and-Gate System. Ground Water 32 (1994), 465-476.
[13] Y. You, J. Han, P.C. Chiu, Y. Jin, Removal and inactivation of waterborne viruses using
zerovalent iron. Environ. Sci. Technol. 39 (2005), 9263-9269.
[14] A. Hussam, A.K.M. Munir, A simple and effective arsenic filter based on composite iron
matrix: Development and deployment studies for groundwater of Bangladesh. J. Environ. Sci.
Health A 42 (2007), 1869-1878.
[15] D.W. Blowes, C.J. Ptacek, S.G. Benner, W.T. Mcrae Che, T.A. Bennett, R.W. Puls,
Treatment of inorganic contaminants using permeable reactive barriers. J. Contam. Hydrol. 45
(2000), 123-137.
[16] K.J. Cantrell, D.I. Kaplan, T.W. Wietsma, Zero-valent iron for the in situ remediation of
selected metals in groundwater. Journal of Hazardous Materials 42 (1995), 201-212.
[17] R. Miehr, G.P. Tratnyek, Z.J. Bandstra, M.M. Scherer, J.M. Alowitz, J.E. Bylaska,
Diversity of contaminant reduction reactions by zerovalent iron: Role of the reductate.
Environ. Sci. Technol. 38 (2004), 139-147.
[18] Y. Jia, Aagaard P., Breedveld G.D, Sorption of triazoles to soil and iron minerals,
Chemosphere 67 (2007) 250-258.
[19] E.J. Weber, Iron-mediated reductive transformations: investigation of reaction
mechanism. Environ. Sci. Technol. 30 (1996), 716-719.
[20] C. Noubactep, Processes of contaminant removal in “Fe0–H2O” systems revisited: The
importance of co-precipitation. Open Environ. J. 1 (2007), 9-13.
[21] C. Noubactep, A critical review on the mechanism of contaminant removal in Fe0–H2O
systems. Environ. Technol. 29 (2008), 909-920.
16

411
412
413
414
415
416
417
418
419
420
421
422
423
424
425
426
427
428
429
430
431
432
433
434
435
[22] M.J. Mura, S. Behr, E.F. Bres, J.C. Voegel, Dynamic processes at the liquid/solid
interface in the albumin/apatite system. Clin. Mater 5 (1990), 285-295.
[23] K.S. Geetha, G.D. Surender, Solid-liquid mass transfer in the presence of micro-particles
during dissolution of iron in a mechanically agitated contactor. Hydrometallurgy 36 (1994),
231-246.
[24] P. Polasek, Differentiation between different kinds of mixing in water purification – back
to basics, Water SA 33 (2007), 249-252.
[25] C.S. André, M. Khraisheh, Removal of humic substances from drinking water using
GAC and iron-coated adsorbents: Consideration of two kinetic models and the influence of
mixing. Environ. Eng. Sci. 26 (2009), 235-244.
[26] N.D. Tomashov, L.P. Vershinina, Kinetics of some electrode processes on a continuously
renewed surface of solid metal. Electrochim. Acta 15 (1970), 501-517.
[27] A.T. Corey, B.W. Auvermann, Transport by Advection and Diffusion Revisited. Vadose
Zone Journal 2 (2003), 655-663.
[28] A.T. Corey, S.D. Logsdon, Limitations of the chemical potential. Soil Sci. Soc. Am. J. 69
(2005), 976-982.
[29] Potgieter J.H., Adsorption of methylene blue on activated carbon: An experiment
illustrating both the Langmuir and Freundlich isotherms. J. Chem. Educ. 68 (1991), 349-350.
[30] Avom J., J. Ketcha, C. Noubactep, P. Germain, Adsorption of methylene blue from an
aqueous solution onto activated carbons from palm-tree cobs. Carbon 35 (1997), 365-369.
[31] A.A. Attia, B.S. Girgis, N.A. Fathy, Removal of methylene blue by carbons derived from
peach stones by H3PO4 activation: Batch and column studies. Dyes and Pigments 76 (2008),
282-289.
[32] B.D. Jones, J.D. Ingle, Evaluation of redox indicators for determining sulfate-reducing
and dechlorinating conditions. Water Res. 39 (2005), 4343-4354.
17

436
437
438
439
440
441
442
443
444
445
446
447
448
449
450
451
452
453
454
455
456
457
458
459
460
461
[33] V. Ender, Zur Struktur der Phasengrenze Metalloxid/Elektrolyt-Potentialbildung und
Ladungsbilanz. Acta Hydrochim. Hydrobiol. 19 (1991), 199-208.
[34] J.E. Post, Manganese oxide minerals: Crystal structures and economic and environmental
significance. Proc. Natl. Acad. Sci. USA 96 (1999), 3447-3454.
[35] C. Noubactep, G. Meinrath, J.B. Merkel, Investigating the mechanism of uranium
removal by zerovalent iron materials. Environ. Chem. 2 (2005), 235-242.
[36] C. Noubactep, Characterizing the Discoloration of Methylene Blue in Fe0/H2O Systems.
J. Hazard. Mater. (2009), (Accepted).
[37] C. Mbudi, P. Behra, B. Merkel, The Effect of Background Electrolyte Chemistry on
Uranium Fixation on Scrap Metallic Iron in the Presence of Arsenic. Paper presented at the
Inter. Conf. Water Pollut. Natural Porous Media (WAPO2), Barcelona (Spain) April 11 – 13
(2007), 8 pages.
[38] Kurth A.-M.F., Discoloration of Methylene Blue by Elemental Iron - Influence of the
Shaking Intensity. Bachelor Thesis, University of Göttingen (Germany) (2008) 36 pages.
[39] R.P. Buck, S. Rondinini, A.K. Covington, F.G.K. Baucke, C.M.A. Brett, M.F. Camoes,
M.J.T. Milton, T. Mussini, R. Naumann, K.W. Pratt, P. Spitzer, G.S. Wilson, Measurement of
pH. Definition, standards, and procedures (IUPAC Recommendations 2002), Pure Appl.
Chem. 74 (2002), 2169-2200.
[40] D.F.A. Koch, Kinetics of the reaction between manganese dioxide and ferrous ion. Aust.
J. Chem 10 (1957), 150-159.
[41] D. Postma, C.A.J. Appelo, Reduction of Mn-oxides by ferrous iron in a flow system:
column experiment and reactive transport modelling. Geochim. Cosmochim. Acta 64 (2000),
1237-1247.
[42] B.K. Lavine, G. Auslander, J. Ritter, Polarographic studies of zero valent iron as a
reductant for remediation of nitroaromatics in the environment. Microchem. J. 70 (2001), 69-
83.
18

462
463
464
465
466
467
468
[43] Z. Hao, X. Xu, J. Jin, P. He, Y. Liu, D. Wang, Simultaneous removal of nitrate and
heavy metals by iron metal, J. Zhejiang Univ. Sci. 6B (2005), 353-356.
[44] W.S. Pereira, R.S. Freire, Azo dye degradation by recycled waste zero-valent iron
powder. J. Braz. Chem. Soc. 17 (2006), 832-838.
[45] M.L. de Vries, I.E. Grey, Influence of pressure on the kinetics of synthetic ilmenite
reduction in hydrogen. Metal. Mater. Trans. B 37B (2006), 199-208.
19

Table 1: Characteristics, surface coverage and function of the individual reactive materials of
this study. Apart from Fe the given value of specific surface area (SSA) for are the
minima of reported data. The point of zero charge (pH ) for all materials is lower
than the initial pH value. Therefore, MB adsorption onto the negatively charged
surfaces is favorable. The surface coverage is estimated using the method presented
by Jia et al. [18]. The total surface that can be covered by the amount of MB present
in 22 mL of a 0.037 mM is
468
469
470
471
472
473
474
475
0
pzc
SMB = 0.997 m2. Modified after Noubactep [36].
System pHpzc SSA Savailable Coverage Function
(m2 g-1) (m2) (-)
Fe0 7.6 0.29 0.032 18.8 MB co-precipitant
Fe0 + MnO2 - - 4.432 0.13 -
MnO2 2.0 - 6.0 40 4.4 0.14 delays CP availability
GAC 7.0 - 8.0 200 22 0.03 MB adsorbent
Fe0 + GAC - (-) 22.032 0.03 -
476
477
20

Table 2: Overview on the investigated systems with the predicted and observed effects of
mixing on their behaviour.
477
478
System Composition Expected effect Predicted Observed
of the material(s) mixing effects mixing effects
I Fe0 MB co-precipitation scouring suspension of Fe-oxides
II GAC MB adsorption attrition increased adsorption
III MnO2 MB adsorption attrition increased adsorption
IV Fe0, GAC increased MB discoloration unknown adsorption and co-precipitation
V Fe0, MnO2 decreased MB discoloration unknown adsorption and co-precipitation
479
480
481
482
21

Figure 1 482
0 50 100 150 200 250 3000
20
40
60
80
100 blank Fe0
MnO 2 GAC Fe0 + MnO 2
Fe0 + GAC
MB
rem
oval
/ [%
]
shaking intensity / [min-1]
483
484
22

484 Figure 2
0 2 4 6 8 10
20
40
60
80
100 (a)[MB]0 = 11.5 mg/Lt = 25 daysvr = 0 rpm Fe0
MnO2 GAC
MB
rem
oval
/ [%
]
mass loading / [g/L]
485
486
0 2 4 6 8 10
20
40
60
80
100 (b)
[MB]0 = 11.1 mg/Lt = 5 daysvr = 150 rpm
Fe0
MnO2 GAC
MB
rem
oval
/ [%
]
mass loading / [g/L]
487
488
489
23
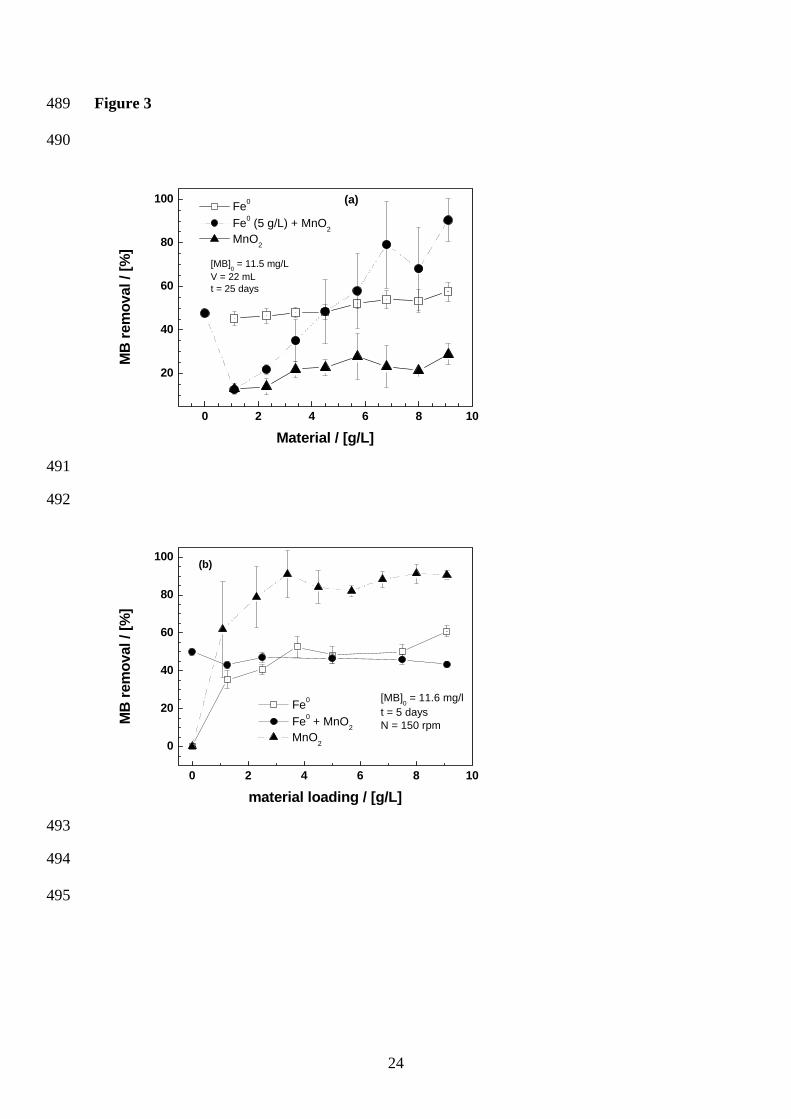
Figure 3 489
490
0 2 4 6 8 10
20
40
60
80
100 (a)
[MB]0 = 11.5 mg/LV = 22 mLt = 25 days
Fe0
Fe0 (5 g/L) + MnO2 MnO2
MB
rem
oval
/ [%
]
Material / [g/L]
491
492
0 2 4 6 8 10
0
20
40
60
80
100(b)
[MB]0 = 11.6 mg/lt = 5 daysN = 150 rpm
Fe0
Fe0 + MnO2 MnO2
MB
rem
oval
/ [%
]
material loading / [g/L]
493
494
495
24

Figure 4 495
0 2 4 6 8 100
20
40
60
80
100
25 days 35 days 50 days
MB
rem
oval
/ [%
]
MnO2 loading / [g/L]
496
497
498
25

Figure Captions 498
499
500
501
502
503
504
505
506
507
508
509
510
511
512
513
514
515
516
517
518
519
Figure 1: Methylene blue discoloration in all five systems for 24 hours as a function of the
shaking intensity. The lines are not fitting functions, they simply connect points to facilitate
visualization.
Figure 2: Methylene blue discoloration by the individual materials under non-disturbed
conditions (a) and at a shaking intensity of 150 min-1 (b). The lines are not fitting functions,
they simply connect points to facilitate visualization.
Figure 3: Methylene blue discoloration by Fe0 as influenced by the presence of MnO2 in non-
disturbed experiments for 25 days (a) and experiments shaken at 150 min-1 for 5 days. the
individual materials und non-disturbed conditions for 25 days. The lines are not fitting
functions, they simply connect points to facilitate visualization.
Figure 4: Comparison of the extent of MB discoloration by Fe0 (5 g/l) as influenced by the
MnO2 mass loading in non-disturbed experiments for 25, 35 and 50 days. It can be seen than
if the experiments were performed only for 50 days, neither the redox indicator properties of
MB (25 days) nor the delay in MB discoloration in the presence of MnO2 (25 and 35 days)
could be evidence (see text). It can be emphasized that, when using various Fe0 mass
loadings, mixing devices and reaction times, investigators have studies different processes
and compared them to each other. The experiment for 35 days were performed with 20 mg/l
MB [36]. The lines are not fitting functions, they simply connect points to facilitate
visualization.
26

Supplementary Content 519
520
521
522
523
524
525
526
527
528
529
530
531
532
533
534
Evidence for the effect of shaking on the process MB discoloration
Figure SC1 shows the photographs of essay tubes containing all investigated systems in two
experiments performed at a shaking intensity of 300 min-1. The duration of the experiments
were one and three days. The photographs show clearly that shaking at 300 min-1 induces
suspension of Fe0 and MnO2 dissolution products. The photographs presented in Fig. 1 were
made one week after the end of the experiments. Immediately at the end of the experiment,
suspended fines could be observed in the essay tubes containing GAC alone, showing that the
vibration induced by this shaking intensity was sufficient to produce fines from a chemically
inert material (GAC). At this shaking intensity, the expected lower MB discoloration in
system V (Fe0 + MnO2) relative to system I (Fe0 alone) could not be observed. Therefore,
assumption 1 (Assumption 1: any shaking intensity relevant for natural situations should
solely speed up processes observed under non-disturbed conditions) is not verified suggesting
that a shaken intensity of 300 min-1 is too high to be relevant for natural situations. Natural
situations are mostly characterized be diffusion-controlled processed.
27

Figure SC1 534
535
536
537
538
539
540
Figure SC1: Photographs of shaken essay tubes containing from the left to the right: no
additive (blank), Fe0 alone, MnO2 alone, GAC alone, Fe0 + MnO2 and Fe0 +
GAC. The essay tubes were shaken for 3 days (up) and 1 day (bottom). The
photographs were made one week after the end of shaking operations.
28