Treatment and prognostic impact of transient leukemia in neonates with Down syndrome

Evaluation of the distortion of EEG signals caused by a hole in the skull
mimicking the fontanel in the skull of human neonates
Lars Flemminga,b,*, Yaozhi Wanga, Arvind Caprihanc, Michael Eiseltd,Jens Haueisenb, Yoshio Okadaa
aBiomedical Research and Integrative NeuroImaging (BRaIN Imaging) Center, Department of Neurology MSC 10-5620,
School of Medicine, University of New Mexico, Albuquerque, NM 87131, USAbDepartment of Neurology, Biomagnetic Center Jena, Friedrich-Schiller-University, D-07740 Jena, Germany
cMIND Institute, School of Medicine, University of New Mexico, Albuquerque, NM 87131, USAdDepartment of Pathophysiology, Friedrich-Schiller-University, D-07740 Jena, Germany
Accepted 19 January 2005
Abstract
Objective: Interpretation of Electroencephalography (EEG) signals from newborns is in some cases difficult because the fontanels and
open sutures produce inhomogeneity in skull conductivity. We experimentally determined how EEG is influenced by a hole mimicking the
anterior fontanel since distortion of EEG signals is important in neurological examinations during the perinatal period.
Methods: Experiments were carried out on 10 anesthetized farm swine. The fontanel was mimicked by a hole (12!12 mm) in the skull.
The hole was filled with 3 types of medium differing in conductivity (air, 0 S/m; sucrose–agar, 0.017 S/m; saline–agar, 1.28 S/m). Three
positions of the snout were stimulated with a concentric bipolar electrode to activate cortical areas near the middle, the edge, and the outside
of the hole. The somatic-evoked potential (SEP) was recorded by a 4!4 electrode array with a 4 mm grid spacing. It was placed on the 4
quadrants of a 28!28 mm measurement area on a saline-soaked filter paper over the skull, which served as artificial scalp.
Results: The SEP over the hole was clearly stronger when the hole was filled with sucrose– or saline–agar as compared to air, although
paradoxically the leakage current was stronger for the sucrose– than saline–agar. The current leaking from the hole was strongly related to
position of the active tissue. It was nearly negligible for sources 6–10 mm away from the border of the hole. The distortion was different for 3
components of the SEP elicited by each stimulus, probably indicating effects of source distance relative to the hole.
Conclusions: EEG is strongly distorted by the presence of a hole/fontanel with the distortion specifically dependent on both conductivity
of the hole and source location.
Significance: The distortion of the EEG is in contrast to the lack of distortion of magnetoencephalography (MEG) signals shown by
previous studies. In studying brain development with EEG, the infant’s head and sources should be modeled accurately in order to relate the
signals to the underlying activity. MEG may be particularly advantageous over EEG for studying brain functions in infants since it is
relatively insensitive to skull defects.
q 2005 International Federation of Clinical Neurophysiology. Published by Elsevier Ireland Ltd. All rights reserved.
Keywords: Electroencephalography; Magnetoencephalography; Evoked response; Somatosensory; Fontanel; Pig; Newborn; Infant
1. Introduction
Brain functions of human infants, including pre-term and
term babies, have been traditionally evaluated with EEG as
1388-2457/$30.00 q 2005 International Federation of Clinical Neurophysiology.
doi:10.1016/j.clinph.2005.01.007
* Corresponding author. Address: Department of Neurology, Biomag-
netic Center Jena, Friedrich-Schiller-University, D-07740 Jena, Germany.
E-mail address: [email protected] (L. Flemming).
part of a neurological examination. The evaluation is useful
in infants with risk factors such as complications during
labor and delivery (Sunshine, 1997). EEG is also useful for
staging the development of the nervous system, since
differences in the functional organization of certain
brain regions are already present in newborns (Eiselt
et al., 2001), and for differential diagnosis of seizures
from non-seizures in the paroxysmal motor behavior
Clinical Neurophysiology 116 (2005) 1141–1152
www.elsevier.com/locate/clinph
Published by Elsevier Ireland Ltd. All rights reserved.

L. Flemming et al. / Clinical Neurophysiology 116 (2005) 1141–11521142
(De Weerd, 1995; Tharp, 1997). However, neonatal EEG
monitoring is still in need of development, particularly in
relating EEG signals to the underlying brain functions.
Interpretation of the underlying physiology and patho-
physiology is complicated by the presence of the fontanels
and sutures in the skull. The anterior and posterior fontanels
are present at the bregma and the lambda. The skull is not
present within the fontanels. The brain below the fontanels
is protected by the dura, which is thicker within the opening.
The fontanels and sutures are squeezed together during
delivery, but become larger during the first months and then
eventually close. The anterior fontanel may be large enough
to admit an adult’s thumb. The posterior fontanel is closed
within the first 2 month. The anterior fontanel stays open as
long as 16 months or, in abnormal cases, even for several
years. The sutures can be quite wide near the fontanels. The
mean width of the coronal and lambdoidal sutures at their
midpositions is 3–4 mm for infants between 0 and 60 days
after birth (Eramie and Ringertz, 1976). The sutures may
stay unfused for several years (Hansman, 1966). EEG
signals may be profoundly affected by the fontanels and
sutures, which are effectively skull defects, since they
represent areas of high conductivity relative to the skull.
Volume currents might be affected by these openings in the
skull. Thus, it is necessary to evaluate the effect of these
skull openings on EEG in order to accurately infer
physiological functions in human infants.
This report describes distortions of the somatosensory-
evoked potentials (SEPs) by a hole in the skull of neonatal
pigs. Although the EEG signal distortion by skull defects
can be studied using mathematical models of the head as
discussed later, we chose to study the problem in an
experimental preparation since such study is rare and
empirical assessment always provides a solid foundation for
future modeling studies. Our results may be useful for
interpreting distortions of EEG signals in humans arising
from skull defects like the fontanels and sutures in human
infants, since the head of the piglet is large and the scalp and
skull are comparable to those of human infants in thickness.
The neonatal farm swine of 1–3 weeks of age has a skull
thickness of 2–3 mm near the vertex, similar to the thickness
in human newborns (Hansman, 1966). Unlike human
neonates, the piglets do not have a fontanel and the sutures
are nearly closed at birth. A square hole was, therefore,
created in the skull to mimic a fontanel. The SEP distortion
was evaluated as a function of distance of active tissue from
the hole and for 3 different conductivities of the hole.
2. Materials and methods
2.1. Preparation
The protocol used in this study was approved by the
Animal Use Committees of the Albuquerque Veterans
Affairs Medical Center and the University of New Mexico
School of Medicine. Animals were treated according to the
National Institute of Health ‘Guide for the Care and Use of
Laboratory Animals, Revised 1996’.
Experiments were carried out on 10 farm swine (Sus
scrofa). The weight ranged between 8 and 16 kg and the age
between 4 and 6 weeks. Pigs were chosen because of their
large gyrencephalic brain resembling to some extent the
human brain. By 3–5 weeks of age, the neocortex of the pig
has a well-established 6-layer structure (Craner, 1988).
Piglets were sedated and anesthetized with a combination
of ketamine plus xylazine. Initially, the anesthetic agent was
injected in the gluteal muscle and later in the right cephalic
vein. The catheter placed in the right femoral artery was
used for monitoring the blood pressure and for blood gas
analysis. The same catheter was used for the continuous
injection of 0.9% sodium chloride solution (about 5 ml/kg
per h). This fluid substitution was necessary to maintain
blood volume and blood pressure within physiological
values under the artificial ventilation.
Tracheostomy for artificial ventilation was performed
after sedation. The ventilation rate was varied between 14
and 18/min and the volume between 150 and 220 ml to
maintain physiological conditions according to the blood
gas parameters of pCO2 (30–44 mmHg) and pO2 (90–
120 mmHg). During the surgery an anesthetic level of
12 mg/kg per h ketamine plus 1.2 mg/kg per h xylazine was
maintained. Lidocaine (1%) was used for each surgical
approach and for the pressure point of the ear bars of a
head holder. The scalp was removed and a square hole of
12!12 mm cut out in the skull over the left hemisphere
(Fig. 1). The location of the hole was over the rostrum
region of the primary somatosensory cortex (SI). The dura
was kept intact.
The level of anesthesia was reduced to 6 mg/kg per h for
ketamine and 0.6 mg/kg per h for xylazine during
the measurement. D-Tubocurarine was injected (0.3 mg/kg
per h) after the surgery to avoid involuntary movements
during the data acquisition. Body-temperature was kept
constant with a thermal jacket at 37–38 8C.
2.2. Stimulation
For the stimulation we used a concentric bipolar
electrode which was a modified 6 mm Genuine Grass
Ag/AgCl disc electrode with a tungsten needle in the center.
The electrode was fixed on the snout with collodion after the
insertion of the needle. In Exp. 1 the concentric bipolar
electrode was placed on the right side of snout with the
central needle electrode in the location which projected to a
cortical area below the hole (Fig. 1). In Exp. 2, 3 bipolar
electrodes were fixed on the right part of the snout. The
central needle electrodes were placed in the snout locations
that projected to a cortical area within the skull opening,
near the border, and 6–10 mm outside the hole (Fig. 7). The
placement of the electrode on the snout was based on
the data of Craner (1988) and Okada et al. (1999a).

Fig. 1. Sixty-four-channel EEG measurement of 3 different conductivities within the hole. The position of the hole is marked by the solid square. The
measurement covered an area of 28!28 mm over the left somatosensory cortex (dotted square). Electrode spacing is 4 mm. Time range from K10 to 100 ms,
low-pass filter of 200 Hz, high-pass filter of 0.5 Hz, and 30 averages.
L. Flemming et al. / Clinical Neurophysiology 116 (2005) 1141–1152 1143
The stimulus was a brief current pulse (50 ms, 4–7 mA)
applied at 1 pulse/s.
2.3. Electrical measurement
The SEP was recorded with a 4!4 Ag–AgCl electrode
array with an electrode spacing of 4 mm that was placed on
a 0.9% NaCl saline-soaked filter paper covering the exposed
skull. The filter paper served as an artificial scalp. The
electrode array was moved systematically to cover an area
of 28!28 mm. The reference electrode was attached to the
left ear. The measurements were carried out in an
electromagnetically shielded chamber. The custom made
preamplifier had a gain of 5 and the CyberAmp 380 of Axon
Instruments had a gain of 1000. We used a high-pass filter of
0.1 Hz and a low-pass filter of 200 Hz with a sampling rate
of 2 kHz and averaged the data across 30 epochs. The 60 Hz
noise was removed online. The A/D converter had a
resolution of 16 bits and an input range of K1 to C1 V.
Thus, we had a resolution of 3 nV.
The SEP distribution on the artificial scalp was
measured sequentially under the following conditions:
(1) air in the hole, (2) isotonic 3% agar containing
330 mEq of sucrose (sucrose–agar), (3) isotonic 3% agar
containing 0.9% NaCl (saline–agar), (4) again with
sucrose–agar and (5) finally with air in the hole. The
sucrose and air conditions were repeated to check for
possible changes in the SEP due to changes in
physiological and extraneous conditions. In the agar
conditions the sucrose– or saline–agar was poured into
the hole in liquid form with a temperature of less than
38 8C, then the skull was covered with a saline-soaked
filter paper. The SEP measurements were started 10 min
later, after allowing for the agar to gel and for its
conductivity to equilibrate. Additionally, the SEP was
measured on the dura beneath the hole in each condition
to monitor possible changes in the SEP directly on the
cortex.
The resistivities of sucrose– and saline–agar were
determined with a variation of the classical 4-electrode
method, by passing a constant 20 ms square-wave current to
a pair of large Ag–AgCl electrode plates and measuring the
potential in the agar block at 200 mm steps along the
direction of the applied current through a hole in the top of
the plate. The resistivity of sucrose–agar was 280 Um and
that of saline–agar was 0.78 Um at room temperature. These
values correspond to conductivity of 0.0036 and 1.28 S/m,
respectively. The resistivity of the sucrose–agar under the
experimental conditions with the saline-soaked filter paper
placed over the agar decreased with the time after placing
the filter paper, going from 199 Um at 10 min to 48 Um at
80 min. We estimated that the resistivity during the SEP
measurement was about 60–120 Um, corresponding to
conductivities of 0.016–0.0083 S/m.
Two experiments were carried out with each animal. In
the first experiment, the amplitude distortion of the SEP was
determined for an active tissue in the middle of the skull
opening (see Fig. 1), which was subjected to a maximum
amplitude distortion. The SEP measurements were repeated
twice at each of 64 locations in order to check for reliability.

L. Flemming et al. / Clinical Neurophysiology 116 (2005) 1141–11521144
In the second experiment, the amplitude distortion was
determined as a function of distance of the active tissue
from the hole, by activating the cortical areas 4, 7, and 10
(Fig. 7). The SEP was measured only once at each electrode
position in each condition in order to compare the SEPs as
much as possible under stable physiological conditions
during the entire experiment.
The data from 6 out of 10 animals were used for the final
analysis of results of Exp. 1 and data from 5 out of 10
animals were used for Exp. 2 because of lack of stability
across the replications and incomplete set of data in the
remaining animals.
2.4. MRI
After the experiment, the brain was perfused and fixed
with 4% formaldehyde under a deep anesthesia. The entire
head was stored in a 4% formaldehyde solution to preserve
the shape of the brain for MRI scans. MRI images of the
head were taken on a 4 T Varian scanner. A fast spin echo,
multi-slice pulse sequence (Hennig, 1988) with an effective
echo time (TE) of 45 ms and 16 averages were used. The
pulse sequence had a train of 4 echoes with the center of the
k-space being traversed in the 3rd echo. The in-plane
resolution was 0.5 mm!0.5 mm and the slice thickness was
0.5 mm giving an isotropic voxel of 0.5 mm3. A 16 cm
quadrature /bird-cage rf coil was used.
2.5. Data processing and source localization
The data were filtered with a high-pass filter of 0.3 Hz
and a low-pass filter of 200 Hz. The stimulation artifact was
removed. In the case of Experiment 1 the data from the two
replications were averaged for the analysis.
Source localization was performed at the time instant of
the peak of the first cortical response after stimulation
(component c1, see Fig. 5). A single equivalent current
dipole for the source and a boundary element method
(BEM) was used to model the head. The BEM model was
based on the MRI images of one representative animal. It
consisted of 3 compartments representing the brain, the
skull, and the scalp. The brain was modeled with 2490
surface triangles (edge length of 2.5 mm), the skull with
3306 surface triangles (edge length 2.5 mm), and the scalp
with 5786 surface triangles (edge length 2.0 mm). For the
compartments we assumed a homogeneous conductivity of
0.25 (brain), 0.013 (skull), and 0.25 (scalp) S/m (Haueisen
et al., 1997b).
For each animal, the data set of the sucrose–agar
condition was used for the source localization since the
conductivity of the sucrose–agar (0.016–0.008 S/m) was
closest to the conductivity of the skull, estimated to be
0.013 S/m. The conductivity difference between the
sucrose–agar and the skull was neglected. Source localiz-
ation was performed with the software Curry version 4.5.
2.6. Analysis and statistics
The Laplacian method was used to estimate the radial
current source density Im in the artificial scalp (Babiloni
et al., 1996, 1997; Gevins et al., 1994, 1999; He, 1999;
Hjorth, 1975; Le et al., 1994; Nunez et al., 1994). Since
there is no primary source in the artificial scalp, the potential
on the scalp follows the Laplace equation: sV$VfeZ0,
where s is the conductivity of the scalp, fe is the
potential on the scalp, Vfe is the gradient of the scalp
potential and V$ is the divergence operator on the gradient
of the potential. The equation can be written as:
sv2fe=vx2Csv2fe=vy2ZKsv2fe=vz2, approximating the
local scalp surface as a plane, where v is the partial
differential operator. The right-hand side can be re-written
as: vJz/vz, where Jz is the current density along the z-axis
perpendicular to the scalp surface. vJz/vz can be viewed as
an effective current source density KIm in units of A/m3 that
produces a divergence of current in the scalp. Im is positive
when the positive charge is entering the scalp (current
source) and negative when the positive charge is leaving the
scalp (current sink). We estimated Im from a discrete version
of the left-hand side: s{4V(x0,y0)KV(h,y0)KV(Kh,y0)KV(x0,h)KV(x0,Kh)}/h2, where V(x,y) are the potentials
measured at 5 positions centered at position xZx0 and yZy0
(He, 1999). The inter-electrode distance hZdxZdy was
4 mm in this study. The value of s for the artificial scalp
(filter paper soaked with saline) was assumed to be the
same as that of the extracellular conductivity of the brain,
0.25 S/m because of the tortuosity produced by the fibers in
the paper. The Laplacian estimate should be applicable even
when the underlying geometry of the skull and brain is
inhomogeneous as it is the case in the present preparation
since the Laplace equation is locally valid and the artificial
scalp is homogeneous.
A within-subject repeated ANOVA test was used for the
statistical analyses of both experiments. In the first
experiment, we determined the effects of the conductivity
of the hole, separately on 3 components of the SEP
produced by an active cortical tissue within the hole. In
the second experiment, we investigated the effect of
distance of the active area from the hole and conductivities
of the hole on the SEP. The Wilcoxon test was also used for
the second experiment.
3. Results
3.1. Experiment 1
The circle in the inset of Fig. 1 shows the estimated
source location in the rostrum region (shaded area
delineated by the circular coronal sulcus) of the SI cortex
activated by the snout stimulation. This area was within the
square 12!12 mm hole created in the skull. The SEP
measurements were carried out within the dashed square

Fig. 2. Difference maps of the 64-channel EEG measurement shown in Fig. 1. Measurement of air1 and air2 were averaged and subtracted from the other
measurements. The position of the hole is marked by a square. Time range, filters, etc. See Fig. 1.
L. Flemming et al. / Clinical Neurophysiology 116 (2005) 1141–1152 1145
area. The SEP over the hole was larger in the sucrose1–agar
condition compared to the air1 condition in which the hole
was filled with a non-conducting medium (namely air).
Similarly, the SEP over the hole in the saline–agar condition
was stronger than in the air condition. The SEP patterns in
the sucrose2–agar and air2 conditions were similar to the
sucrose1–agar and air1 conditions, indicating good repro-
ducibility of the data.
Fig. 2 shows difference maps of the SEPs between the
sucrose and air conditions and between the saline and air
conditions. The SEPs in air conditions 1 and 2 were
averaged and the averaged SEP was subtracted from the
SEPs in the sucrose and saline conditions. The SEPs were
stronger over the hole in the sucrose– and saline–agar
conditions as compared to the air condition. In contrast the
difference waves were close to zero at the edges of the
measurement area indicating that the effects of the hole were
confined within the area of measurements. The largest
differences were seen above the hole where the active tissue
was located.
These results suggest that the current leaking from the
hole was stronger when the hole was filled with
Fig. 3. Laplacian derivation maps of the difference maps shown in Fig. 2. The pos
a conducting medium. The radial current leaking from the
hole can be directly estimated by the Laplacian derivation of
the potentials. Fig. 3 shows the Laplacian derivation of the
difference waves in the 3 conditions. This analysis
demonstrates several interesting features. First, the current
clearly leaks through the hole. Second, the amount of
current leak is somewhat counter intuitively larger in the
sucrose condition than in the saline condition. Third, the
polarity of the waveform is opposite just outside the hole as
compared to the waveforms inside the hole, indicating that
the current leaking through the intact skull just outside the
hole was weaker in the saline– and sucrose–agar conditions
compared to the air condition. This last result is consistent
with the fact that the current leak was stronger in the hole in
these conditions compared to the control condition of the
hole filled with air.
The Laplacian derivations of the original SEP data in
the 3 conditions provide results that are consistent with the
results from the difference data. Fig. 4 shows the Laplacian
of the SEP data in the air, and in the sucrose–agar and
saline–agar conditions averaged across the two replications.
In the air condition, the current leaking through the hole was
ition of the hole is marked by a square. Time range, filters, etc. See Fig. 1.
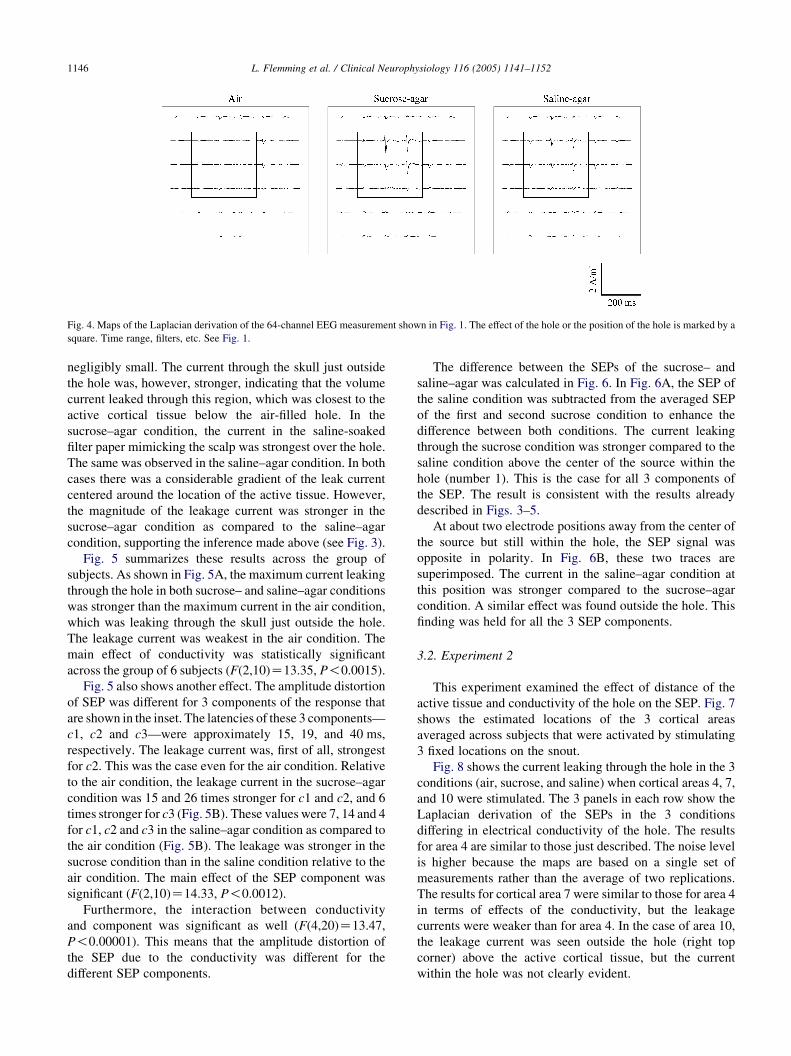
Fig. 4. Maps of the Laplacian derivation of the 64-channel EEG measurement shown in Fig. 1. The effect of the hole or the position of the hole is marked by a
square. Time range, filters, etc. See Fig. 1.
L. Flemming et al. / Clinical Neurophysiology 116 (2005) 1141–11521146
negligibly small. The current through the skull just outside
the hole was, however, stronger, indicating that the volume
current leaked through this region, which was closest to the
active cortical tissue below the air-filled hole. In the
sucrose–agar condition, the current in the saline-soaked
filter paper mimicking the scalp was strongest over the hole.
The same was observed in the saline–agar condition. In both
cases there was a considerable gradient of the leak current
centered around the location of the active tissue. However,
the magnitude of the leakage current was stronger in the
sucrose–agar condition as compared to the saline–agar
condition, supporting the inference made above (see Fig. 3).
Fig. 5 summarizes these results across the group of
subjects. As shown in Fig. 5A, the maximum current leaking
through the hole in both sucrose– and saline–agar conditions
was stronger than the maximum current in the air condition,
which was leaking through the skull just outside the hole.
The leakage current was weakest in the air condition. The
main effect of conductivity was statistically significant
across the group of 6 subjects (F(2,10)Z13.35, P!0.0015).
Fig. 5 also shows another effect. The amplitude distortion
of SEP was different for 3 components of the response that
are shown in the inset. The latencies of these 3 components—
c1, c2 and c3—were approximately 15, 19, and 40 ms,
respectively. The leakage current was, first of all, strongest
for c2. This was the case even for the air condition. Relative
to the air condition, the leakage current in the sucrose–agar
condition was 15 and 26 times stronger for c1 and c2, and 6
times stronger for c3 (Fig. 5B). These values were 7, 14 and 4
for c1, c2 and c3 in the saline–agar condition as compared to
the air condition (Fig. 5B). The leakage was stronger in the
sucrose condition than in the saline condition relative to the
air condition. The main effect of the SEP component was
significant (F(2,10)Z14.33, P!0.0012).
Furthermore, the interaction between conductivity
and component was significant as well (F(4,20)Z13.47,
P!0.00001). This means that the amplitude distortion of
the SEP due to the conductivity was different for the
different SEP components.
The difference between the SEPs of the sucrose– and
saline–agar was calculated in Fig. 6. In Fig. 6A, the SEP of
the saline condition was subtracted from the averaged SEP
of the first and second sucrose condition to enhance the
difference between both conditions. The current leaking
through the sucrose condition was stronger compared to the
saline condition above the center of the source within the
hole (number 1). This is the case for all 3 components of
the SEP. The result is consistent with the results already
described in Figs. 3–5.
At about two electrode positions away from the center of
the source but still within the hole, the SEP signal was
opposite in polarity. In Fig. 6B, these two traces are
superimposed. The current in the saline–agar condition at
this position was stronger compared to the sucrose–agar
condition. A similar effect was found outside the hole. This
finding was held for all the 3 SEP components.
3.2. Experiment 2
This experiment examined the effect of distance of the
active tissue and conductivity of the hole on the SEP. Fig. 7
shows the estimated locations of the 3 cortical areas
averaged across subjects that were activated by stimulating
3 fixed locations on the snout.
Fig. 8 shows the current leaking through the hole in the 3
conditions (air, sucrose, and saline) when cortical areas 4, 7,
and 10 were stimulated. The 3 panels in each row show the
Laplacian derivation of the SEPs in the 3 conditions
differing in electrical conductivity of the hole. The results
for area 4 are similar to those just described. The noise level
is higher because the maps are based on a single set of
measurements rather than the average of two replications.
The results for cortical area 7 were similar to those for area 4
in terms of effects of the conductivity, but the leakage
currents were weaker than for area 4. In the case of area 10,
the leakage current was seen outside the hole (right top
corner) above the active cortical tissue, but the current
within the hole was not clearly evident.
Fig. 5. (a) Comparison of the amplitude of the Laplacian derivation for the 3 different conductivities and their 3 components (15, 20, 40 ms) for 6 animals. (b)
Comparison of the ratio (based on the Laplacian derivation) sucrose/air and saline/air for the 3 components. The bar in both figures shows the standard error of
the mean.
L. Flemming et al. / Clinical Neurophysiology 116 (2005) 1141–1152 1147
The effects of location of active tissue are shown in Fig. 9
for the group of 5 subjects. The figure shows the ratio of the
leakage currents between the sucrose–agar and air and
between the saline–agar and air conditions. The analysis
was carried out for component 1 which was strongly
distorted by the hole. Separately for the sucrose– and saline–
agar conditions, the largest absolute amplitude of this
component was divided by the absolute amplitude of the
same component of the same recording electrode of the air
condition. If there was no clear peak in the air condition the
averaged value within the time range of the first component
of sucrose and saline was used. For the case where the
amplitude of the response outside the hole was stronger than
the amplitude within the hole, the absolute amplitude of the
first component of the recording electrode within the hole
closest to the recording electrode outside the hole with the
strongest response was used for computing the ratios.
The results of 5 animals were averaged. The bars show the
standard error of mean. The SEP produced by stimulation of
area 4 was clearly more influenced by the conductivity than
areas 7 and 10. The effect of the hole was very small (ratio
of near 1) for area 10. This figure also shows the stronger
leakage current in the sucrose– than saline–agar condition
for each area of activation, corroborating the results from
Exp. 1. The effect was significant with the Wilcoxon test for
area 4 (P!0.05), but only marginal for area 7 (PZ0.08).

Fig. 6. (a) Difference maps of the 64-channel EEG measurement shown in
Fig. 1. Measurement of saline was subtracted from the average of sucrose1
and sucrose2 measurement. The position of the hole is marked by a square.
The trace of the recording electrode above the center of the active area is
labeled with the number 2. (b) Superposition of the two marked channels.
Time range, filters, etc. See Fig. 1.
Fig. 7. Map shows the measured area of 28!28 mm (dashed square) over
the left somatosensory cortex. The solid square shows the position of the
hole, and the numbers 4, 7, and 10 shows the estimated averaged source
locations (active cortical areas).
L. Flemming et al. / Clinical Neurophysiology 116 (2005) 1141–11521148
The non-significant effect could be caused by the small
number of animals. There was no difference between the
sucrose– and saline–agar for area 10. The ANOVA showed
that the main effects of distance (F(2,8)Z5.02, P!0.039)
and conductivity (F(1,4)Z9.28, P!0.038) were significant.
The SEP distortion clearly depended on the distance of the
active area and the distortion was different for the saline–
and sucrose–agar normalized to the air condition (Fig. 10).
But, the interaction of distance and conductivity was not
significant (F(2,8)Z2.01, PO0.05).
4. Discussion
The above results clearly demonstrate that a hole in the
skull of the neonatal piglet may produce a strong distortion
of EEG signals. The leakage of current through the hole
and the surrounding skull was clearly affected by the
conductivity of the hole and distance of the active tissue
producing the SEP. The distortion was different for the
different components of the SEP.
In the case of a hole filled with air, the volume current
from an active tissue below the hole cannot flow through the
air in the hole since it is non-conducting. The current must
go around the hole and flow to the conducting saline-soaked
filter paper through the region of the skull closest to
the hole. This qualitatively explains the results for the air
condition in Fig. 4.
In the case of a hole filled with saline–agar, the current
should preferentially flow through the hole, following the
path of least distance and resistance to the paper above. The
leakage current should be therefore strongest above
the active tissue and should become gradually weaker
with distance on the filter paper, as we found in Fig. 4.
The sucrose–agar is soaked by saline in the filter paper
from above. Thus, its conductivity is not zero, but it
equilibrates to about 0.016 S/m. This is about 80 times less
than the conductivity (1.28 S/m) of the saline–agar, which is
close to the conductivity of saline (1.33 S/m), and 9–16
times less than the conductivity of a brain tissue (0.15–
0.25 S/m, Okada et al., 1994). The conductivity of the
equilibrated sucrose–agar was fortuitously very close to
the conductivities of the skull in vitro and in vivo estimated
in recent studies (0.016–0.041 S/m for the spongiform layer
and 0.003–0.010 S/m for the external compact layers,
Akhtari et al., 2002; 0.032–0.080 S/m, Hoekema et al.,
2003; 0.015 S/m, Oostendorp et al., 2000). The similarity of
the sucrose–agar conductivity to these values of the skull
justifies our use of a homogeneous conductivity model for
the head in our localization model. Therefore, we should
expect the current leakage to be strongest over the active
tissue and it should decrease gradually away from the peak
location as if there was no hole. The results show strong

Fig. 8. Maps of the Laplacian derivation of the 64-channel EEG measurement for the 3 different conductivities and for active areas 4, 7, and 10. The position of
the hole is marked by a square (solid line). Time range, filters, etc. See Fig. 1.
L. Flemming et al. / Clinical Neurophysiology 116 (2005) 1141–1152 1149
leakage currents that seem to be largely confined to the hole
when the source was just below the hole.
The leakage current is in fact even stronger than the
current in the saline–agar condition (Fig. 4). This is quite
reliable as seen in the several lines of analyses. The result is
quite paradoxical: Since the saline–agar’s conductivity is
higher than the sucrose–agar’s, the leakage current should
be stronger for the saline– than the sucrose–agar. We offer
the following hypothesis to explain this phenomenon. In the
case of the saline–agar condition, we assume that a layer of
saline is produced between the agar and the dura. This leads
to a shunting of the volume current from the active tissue
below and a fraction of the volume current flows up through
the agar to reach the filter paper. In the case of the sucrose–
agar condition, we assume that the conductive saline layer is
thinner or absent. This leads to less shunting and flow of
a larger fraction of the volume current through the sucrose–
agar than the saline–agar, thus giving rise to stronger
leakage currents in the sucrose–agar condition. This is a
testable hypothesis and should be evaluated in the future.
The leakage of current through the hole was quite strong
for the currents produced by active tissue below the hole.
The distortion became nearly negligible when the active
tissue was located 6–10 mm away from the edge of the hole
(Fig. 10). The leakage current was up to 25 times stronger in
the sucrose and saline conditions compared to the air
condition when the source was beneath the hole and 5 times
stronger when the source was near the edge of the hole.
The differences in leakage current found for the 3
components of the SEP may be explained by the differences
in the location of the corresponding active tissue with
respect to the hole. The leakage current in the sucrose

Fig. 9. Comparison of the effect of the amplitude distortion of the EEG
measurement for the different conductivities and for the different active
areas. The biggest amplitude of the Laplacian derivation for the
conductivities saline–agar and sucrose–agar of the first component
(15 ms) was divided by the amplitude of the Laplacian derivation of the
same time-point and the same channel of the conductivity air. The results of
5 animals were averaged. The bars show the standard error of mean.
L. Flemming et al. / Clinical Neurophysiology 116 (2005) 1141–11521150
condition relatively to the air condition was 15, 26, and 6
times stronger for the first, second, and third component,
respectively. Similar results we achieved in the saline
condition. Okada et al. (1996) found that the 3 components
are located in different areas of the SI cortex of the piglets.
The cortical components within a latency range of 50 ms
become deeper (depthZapproximately 5, 8, 11 mm for c1,
c2, and c3).
Our results are principally in accordance with several
different simulation studies (Benar and Gotman, 2002;
Chauveau et al., 2004; Oostenveld and Oostendorp, 2002;
Fig. 10. Comparison of the ratio (based on the Laplacian derivation)
saline/air and sucrose/air in dependence of the distance to the border of the
hole. Negative values are for a position inside the hole and positive values
are for a position outside the hole.
Vanrumste et al., 2000; Van de Broek et al., 1998). Van
de Broek et al. (1998) used a finite element method to
represent a hole in the middle layer (skull) of a 3-shell
spherical model of the human head and found the
strongest influence on the electric potentials for a radial
dipole just below the hole. Vanrumste et al. (2000)
employed a realistic finite difference model of the human
head with a hole in the temporal skull region and found
for radial dipoles the strongest localization error below the
hole, while for tangential dipoles the strongest localization
error was at the border of the hole. Investigations of
Oostenveld and Oostendrop, and Benar and Gotman were
based on boundary element methods (BEM). Oostenveld
and Oostendrop used a 3-sphere model compared to Benar
and Gotman who based their BEM on a T1-weighted MRI
scan of a patient. Both studies achieved results that are
comparable to those of Vanrumste et al. and Van den
Broek et al. The approach of Chauveau et al. with a 3-
dimensional resistor mesh model confirmed those results.
All studies show that for dipoles far away from the hole
no distortion of the electric potentials and thus no
localization errors are to be expected. Effects of a hole
in the skull may be more extensive than our results.
Heasman et al. (2002) demonstrated effects of a hole in a
human cadaver skull on the electric potential for
superficial tangential dipoles located 50–60 mm away
from the hole. The potentials on the outer surface of the
skull were different when a 4 mm diameter hole was filled
with saline or wax and the rest of the skull was filled with
saline. The distortion was more extensive than in our case
because, as we suppose, the adult skull is thicker and thus
the resistance through the skull must have been greater
than in our study. Based on these results, it appears that
the distortion of EEG signals depends quantitatively on a
number of factors such as distance of the active tissue
from the area of skull defect, the microscopic conductivity
geometry of the hole, and more generally on the
conductivity geometry of the entire skull and the head.
The EEG distortion may not be confined to active tissues
within 10 mm of the defect as was the case in our study,
but may be more extensive.
The present results are useful for inferring effects of the
fontanel and suture in infant skull on EEG signals in
neonatal studies. In our study we did not directly compare
the SEP with a hole in the skull against the SEP over the
intact skull. Nor did we produce a condition that closely
mimics the fontanel in human infants, by creating a dura
fused to the scalp. Therefore, we do not have quantitative
estimates of EEG distortion in a condition that resembles the
skull of human infants. These studies obviously need to be
carried out. Nevertheless, the effects of conductivity of the
hole on the SEP found in the present study indicate that the
inhomogeneity in conductivity of the skull should distort
EEG signals.
Although the signal distortion by holes in the skull
is a serious problem for EEG, advances in EEG
L. Flemming et al. / Clinical Neurophysiology 116 (2005) 1141–1152 1151
methodology enable us to take this problem into account
in estimating brain activity from EEG signals. One can
now model the skull effects with a finite element method
and interpret EEG signals in terms of underlying
generators (Haueisen et al., 1997a). In such models,
one must take various parameters (e.g. thickness and
conductivity of the skull and scalp) into account. In long-
term studies of newborns, it would be necessary to take
into account changes in the fontanels and sutures and
thickness of the skull with age. With the help of a proper
modeling, EEG-based source localization in newborns
should be possible.
Brain activity in infants can be also studied with MEG.
In comparison to EEG, MEG does not show compli-
cations due to the inhomogeneity in skull conductivity.
Okada et al. (1999a,b) found virtually no effect of a large
hole in the skull on the MEG signals produced by shallow
cortical sources in the primary somatosensory cortex of
the piglets in vivo. Barth et al. (1986) earlier found no
obvious effect of a hole in the human cadaver skull on
MEG. This remarkable property of magnetic field points
to the study of human infants as an area where one can
take advantage of MEG.
In evaluating the practical advantages of MEG and EEG
for infant studies, one needs to consider other factors such as
movement artifacts. Both techniques suffer when the baby is
awake and moves during measurements. EEG suffers from
muscle artifacts and movement of the leads associated with
the body movement. The lead movement can be eliminated
with an electrode attached to a preamplifier. MEG suffers
from the fact that the sensors are not attached to the head, so
that the sensor positions move relative to the head. Recently
a method called signal source separation was introduced by
Taulu et al. (2004). This technique, as well as other
techniques, could be used to continuously monitor the head
movement, calculate the sensor positions on the head even
when the infant moves (Cheour et al., in press). Alter-
natively, MEG and EEG could be used while the baby is
asleep. In such a condition, both types of signals can be
measured simultaneously and can be compared in newborns
(Pihko et al., 2004).
The advances in MEG and EEG methodology indicate
that human brain development may be a fruitful area of
investigation using these completely safe, electrophysio-
logical methods.
Acknowledgements
This work was supported by the German Academic
Exchange Service (DAAD), the European Community (IST
1999-10378), and by the NIH Grant (R01-NS30968).
Special thanks go to Yoshio Okada for the great opportunity
to perform this scientific work at his laboratory.
References
Akhtari M, Bryant HC, Mamelak AN, Flynn ER, Heller L, Shih JJ,
Mandelkern M, Matlachov A, Ranken DM, Best ED, DiMauro MA,
Lee RR, Sutherling WW. Conductivities of three-layer live human
skull. Brain Topogr 2002;14:151–67.
Babiloni F, Babiloni C, Carducci F, Fattorini L, Onorati P, Urbano A.
Spline Laplacian estimate of EEG potentials over a realistic magnetic
resonance-constructed scalp surface model. Electroenceph Clin Neu-
rophysiol 1996;98:363–73.
Barth DS, Sutherling W, Broffman J, Beatty J. Magnetic localization of a
dipolar current source implanted in a sphere and a human cranium.
Electroenceph Clin Neurophysiol 1986;63:260–73.
Benar CG, Gotman J. Modeling of post-surgical brain and skull defects in
the EEG inverse problem with the boundary element method. Clin
Neurophysiol 2002;113:48–56.
Chauveau N, Franceries X, Doyon B, Rigaud B, Morucci JP, Celsis P.
Effects of skull thickness, anisotropy, and inhomogeneity on forward
EEG/ERP computations using a spherical three-dimensional resistor
mesh model. Hum Brain Mapp 2004;21:86–97.
Cheour M, Imada T, Taulu S, Ahonen A, Salonen J, Kuhl P.
Magnetoencephalography is feasible for infant assessment of auditory
discrimination. Exp Neurol, 2004 Nov;190 (Suppl 1):544–51.
Craner SL. A developmental analysis of the organization of the
somatosensory cortices of the domestic pig. PhD Thesis. East Carolina
Univ., School of Medicine; 1988.
De Weerd AW. Atlas of EEG in the first months of life. New York:
Elsevier; 1995.
Eiselt M, Schindler J, Arnold M, Witte H, Zwiener U, Frenzel J. Functional
interaction within the newborn brain investigated by adaptive
coherence analysis of EEG. Clin Neurophysiol 2001;31:104–13.
Eramie U, Ringertz H. Normal width of cranial sutures in the neonate and
infant. Acta Radiol Diagn 1976;17:565–72.
Gevins A, Le J, Martin NK, Brickett P, Desmond J, Reutter B. High
resolution EEG: 124-channel recording, spatial deblurring and MRI
integration methods. Electroenceph Clin Neurophysiol 1994;90:
337–58.
Gevins A, Le J, Leong H, McEvoy LK, Smith ME. Deblurring. J Clin
Neurophysiol 1999;16:204–13.
Hansman CF. Growth of interorbital distance and skull thickness as
observed in roentgenographic measurements. Radiology 1966;86:
87–96.
Haueisen J, Ramon C, Eiselt M, Brauer H, Nowak H. Influence of tissue
resitivities on neuromegnetic fields and electric potentials studied with a
finite element model of the head. IEEE Trans Biomed Eng 1997a;44:
727–35.
Haueisen J, Bottner A, Funke M, Brauer H, Nowak H. The influence of
boundary element discretization on the forward and inverse problem in
electroencephalography and magnetoencephalography. Biomed Tech
1997b;42:240–8.
He B. Brain electric source imaging: scalp Laplacian mapping and cortical
imaging. Crit Rev Biomed Eng 1999;27(3–5):149–88.
Heasman BC, Valentin A, Alacron G, Garcia Seonane JJ, Binnie CD,
Guy CN. A hole in the skull distorts substantially the distribution of
extracranial electrical fields in an in vitro model. J clin Neurophysiol
2002;19(2):163–71.
Hennig J. Multiecho imaging sequence with low refocussing angles.
J Magn Reson 1988;78:397–407.
Hjorth B. An on-line transformation of EEG scalp potentials into
orthogonal source derivations. Electroenceph Clin Neurophysiol
1975;39:526–30.
Hoekema R, Wieneke GH, Leijten FS, van Veelen CW, van Rijen PC,
Huiskamp GJ, Ansems J, van Huffelen AC. Measurement of the
conductivity of skull, temporarily removed during epilepsy surgery.
Brain Topogr 2003;16:29–38.
L. Flemming et al. / Clinical Neurophysiology 116 (2005) 1141–11521152
Le J, Menon V, Gevins A. Local estimate of surface Laplacian derivation
on a realistically shaped scalp surface and its performance on noisy
data. Electroenceph Clin Neurophysiol 1994;92:433–41.
Nunez PL, Silberstein RB, Cadusch PJ, Wijesinghe RS, Westdorp AF,
Srinivasan RA. Theoretical and experimental study of high resolution
EEG based on surface Laplacians and cortical imaging. Electroenceph
Clin Neurophysiol 1994;90:40–57.
Okada YC, Huang J-C, Rice ME, Tranchina D, Nicholson C. Origin of the
apparent tissue conductivity in the molecular and granular layers of the
in vitro turtle cerebellum and the interpretation of current source–
density analysis. J Neurophysiol 1994;72:742–53.
Okada YC, Papuashvili NS, Xu C. What can we learn from MEG studies of
the somatosensory system of the swine?. In: Hashimoto I, Okada YC,
Ogawa S, editors. Visualization of information processing in the human
brain: recent advances in MEG and functional MRI (EEG. Clin Neurol
Suppl 47). Amsterdam: Elsevier; 1996.
Okada YC, Lahteenmaki A, Xu C. Comparison of MEG and EEG on the
basis of somatic evoked responses elicited by stimulation of the snout in
the juvenile swine. Clin Neurophysiol 1999a;110:214–29.
Okada YC, Lahteenmaki A, Xu C. Experimental analysis of distortion of
MEG signals by the skull. Electroenceph Clin Neurophysiol 1999b;110:
230–8.
Oostendorp TF, Delbeke J, Stegeman DF. The conductivity of the human
skull: results of in vivo and in vitro measurements. IEEE Trans Biomed
Eng 2000;11:1487–92.
Oostenveld R, Oostendorp TF. Validating the boundary element method for
forward and inverse EEG computations in the presence of a hole in the
skull. Hum Brain Mapp 2002;17:179–92.
Pihko E, Lauronen L, Wikstrom H, Taulu S, Nurminen J, Kivitie-Kallio S,
Okada Y. Somatosensory evoked potentials and magnetic fields elicited
by tactile stimulation of the hand during active and quiet sleep in
newborns. Clin Neurophysiol 2004;115:448–55.
Sunshine R. Epidemiology of perinatal asphyxia. In: Stevenson DK,
Sunshine P, editors. Fetal and neonatal brain injury: mechanisms,
management and the risks of practice. New York: Oxford University
Press; 1997. p. 3–23.
Taulu S, Kajola M, Simola J. Suppression of interference and artifacts by
the signal space separation method. Brain Topograph 2004;16:
269–75.
Tharp B. Use of the electroencephalogram in assessing acute brain damage
in the newborn. In: Stevenson DK, Sunshine P, editors. Fetal and
neonatal brain injury: mechanisms, management and the risks of
practice. New York: Oxford University Press; 1997. p. 287–301.
Van de Broek SP, Reinders F, Donderwinkel M, Peters MJ. Volume
conduction effects in the EEG and MEG. Electroenceph Clin
Neurophysiol 1998;106:522–34.
Vanrumste B, Van Hoesy G, Van de Walle R, D’Have M, Lemahieu I,
Boon P. Dipole location errors in electroencephalogram source analysis
due to volume conductor model errors. Med Biol Eng Comput 2000;38:
528–34.
Copyright © 2022 FDOKUMEN