Evaluation of the coupled multielectrode array sensor as a real-time corrosion monitor
16
Evaluation of the coupled multielectrode array sensor as a real-time corrosion monitor Lietai Yang * , Narasi Sridhar, C. Sean Brossia, Darrell S. Dunn Southwest Research Institute Ò , 6220 Culebra Road, San Antonio, TX 78238, USA Received 11 July 2004; accepted 19 August 2004 Available online 23 November 2004 Abstract Coupled multielectrode array sensors made of carbon steel and stainless steels were evalu- ated and compared with electrochemical noise (EN) sensors. Good correlations between sen- sor signals and solution corrosivity were observed for all multielectrode array sensors. Some correlation between the average pit index and solution corrosivity was observed for the carbon steel EN sensors, but not for the stainless steel EN sensors. The time-average noise resistances from the stainless steel EN sensors correlate well with solution corrosivity. There were, how- ever, large random fluctuations and drifting for all EN signals, which make the EN sensors unreliable as real-time monitors. Ó 2004 Elsevier Ltd. All rights reserved. Keywords: C. Crevice corrosion; C. Pitting corrosion; Corrosion sensor; Multielectrode sensor 1. Introduction Coupled multielectrode array sensor is an emerging technology for in situ moni- toring nonuniform corrosion [1–5]. It has been tested extensively with carbon steels, stainless steels, and nickel-base alloys as probe elements in a wide range of aqueous 0010-938X/$ - see front matter Ó 2004 Elsevier Ltd. All rights reserved. doi:10.1016/j.corsci.2004.08.002 * Corresponding author. Corrosion Science 47 (2005) 1794–1809 www.elsevier.com/locate/corsci
-
Upload
independent -
Category
Documents
-
view
2 -
download
0
Transcript of Evaluation of the coupled multielectrode array sensor as a real-time corrosion monitor
Corrosion Science 47 (2005) 1794–1809
www.elsevier.com/locate/corsci
Evaluation of the coupled multielectrodearray sensor as a real-time corrosion monitor
Lietai Yang *, Narasi Sridhar, C. Sean Brossia,Darrell S. Dunn
Southwest Research Institute�, 6220 Culebra Road, San Antonio, TX 78238, USA
Received 11 July 2004; accepted 19 August 2004
Available online 23 November 2004
Abstract
Coupled multielectrode array sensors made of carbon steel and stainless steels were evalu-
ated and compared with electrochemical noise (EN) sensors. Good correlations between sen-
sor signals and solution corrosivity were observed for all multielectrode array sensors. Some
correlation between the average pit index and solution corrosivity was observed for the carbon
steel EN sensors, but not for the stainless steel EN sensors. The time-average noise resistances
from the stainless steel EN sensors correlate well with solution corrosivity. There were, how-
ever, large random fluctuations and drifting for all EN signals, which make the EN sensors
unreliable as real-time monitors.
� 2004 Elsevier Ltd. All rights reserved.
Keywords: C. Crevice corrosion; C. Pitting corrosion; Corrosion sensor; Multielectrode sensor
1. Introduction
Coupled multielectrode array sensor is an emerging technology for in situ moni-
toring nonuniform corrosion [1–5]. It has been tested extensively with carbon steels,
stainless steels, and nickel-base alloys as probe elements in a wide range of aqueous
0010-938X/$ - see front matter � 2004 Elsevier Ltd. All rights reserved.
doi:10.1016/j.corsci.2004.08.002
* Corresponding author.
L. Yang et al. / Corrosion Science 47 (2005) 1794–1809 1795
solutions [2,3,6] and in the process streams of industrial plant [7]. It has been dem-
onstrated that the sensor gives a real-time measurement of the corrosivity of the
environment. As the area of the electrode is 2–4 orders of magnitude smaller than
conventional electrodes, the sensor also offers the ability to predict the penetration
rate for localized corrosion [3]. The effectiveness of a single parameter, such as thestandard deviation or the most anodic current among different electrodes [3], greatly
simplifies data analyses and makes the multielectrode sensor a potentially useful tool
for field applications. In addition, the coupled multielectrode sensor does not require
the presence of bulk electrolyte, it can be used for measurement of corrosion not only
in an aqueous solution but also under salt deposits [8,9] and biofilm deposits [10]. In
the present work, the responses of the coupled multielectrode array sensor to differ-
ent environments known to promote localized corrosion were further evaluated. Be-
cause the electrochemical noise (EN) method has been considered as a promisingtechnique for monitoring localized corrosion [11–13], parallel tests were also con-
ducted with the EN sensors in the same environments. Direct comparisons of the
two methods are presented in this paper.
Epoxy
Joinedtogether
To Multi-Channel Voltmeter
R
R
R
R
R
Electrode (insulated)
Sealingtube Sensing
surface
Sensingelectrode
Epoxycast
(a) (b)
13 mm
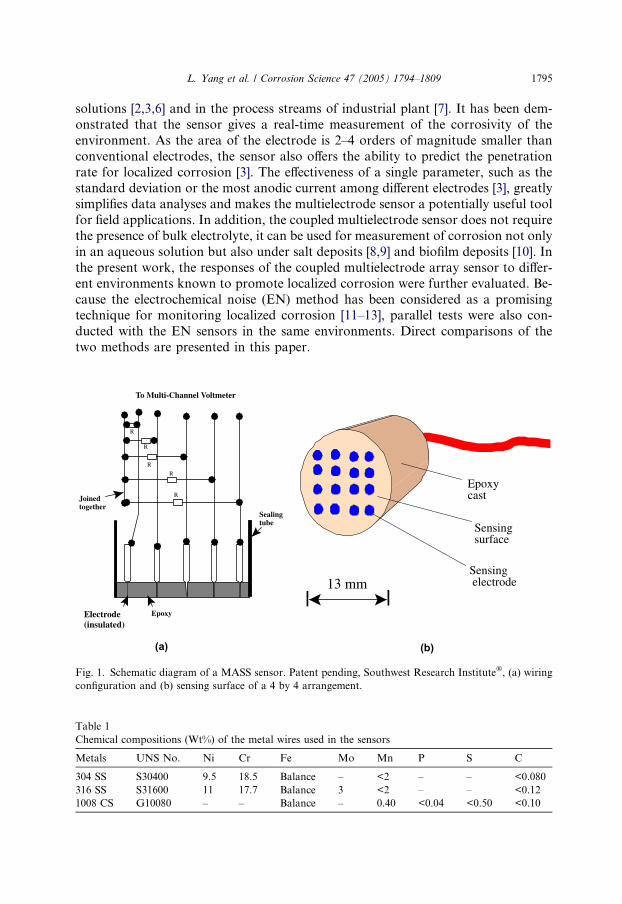
Fig. 1. Schematic diagram of a MASS sensor. Patent pending, Southwest Research Institute�, (a) wiring
configuration and (b) sensing surface of a 4 by 4 arrangement.
Table 1
Chemical compositions (Wt%) of the metal wires used in the sensors
Metals UNS No. Ni Cr Fe Mo Mn P S C
304 SS S30400 9.5 18.5 Balance – <2 – – <0.080
316 SS S31600 11 17.7 Balance 3 <2 – – <0.12
1008 CS G10080 – – Balance – 0.40 <0.04 <0.50 <0.10
1796 L. Yang et al. / Corrosion Science 47 (2005) 1794–1809
2. Experimental
2.1. Coupled multielectrode array sensor
The schematic diagram of a 4 by 4 coupled multielectrode array sensor is shown inFig. 1. For corrosion monitoring purpose, the row and column arrangement of the
electrodes is not necessary and the electrodes can be in a random configuration. The
resistance values in Fig. 1 were such that the potential drops across them are negli-
gibly low. The multielectrode array sensor system (MASS) used in the experiment
has been described elsewhere [2,3]. In Fig. 1, the sensing electrodes of the MASS sen-
sor are coupled to simulate one piece of a metal, and the currents that flow from the
anodes (or more anodic electrodes if all the electrodes corrode) to the cathodes (or
less anodic electrodes) are measured as the corrosion signal. Four MASS sensors(two CS, one SS 304 and one SS 316) were used in the experiment. The sensing elec-
trodes of CS, SS 304 and SS 316 sensors are made of Type 1008 carbon steel (UNS
1.0E-10
1.0E-9
1.0E-8
1.0E-7
1.0E-6
1.0E-5
1.0E-4
1.0E-3
0 10 20 30 40 50 60 70 80 90 100 110 120
Time (Arbitrary Unit)
Sens
or S
igna
l (A)
CS-E7SS304SS316CS-E1
Aerated0.5M NaCl pH=1.14
6 wt% FeCl3
AeratedDI water
59 Minutes
6 wt% FeCl32M NaNO3
Aerated0.5M NaCl pH=10
0.5 M NaCl &0.01 M H2O2
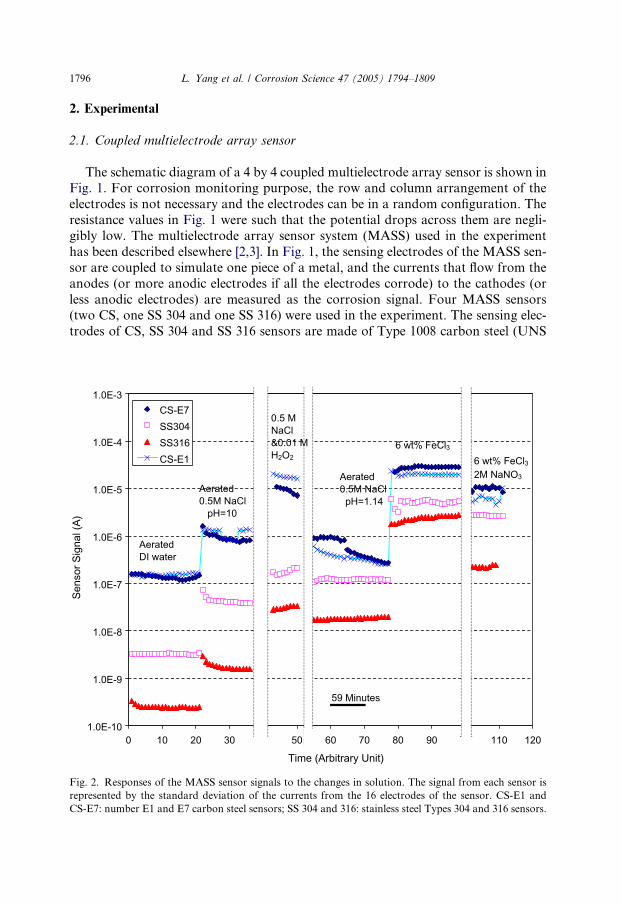
Fig. 2. Responses of the MASS sensor signals to the changes in solution. The signal from each sensor is
represented by the standard deviation of the currents from the 16 electrodes of the sensor. CS-E1 and
CS-E7: number E1 and E7 carbon steel sensors; SS 304 and 316: stainless steel Types 304 and 316 sensors.
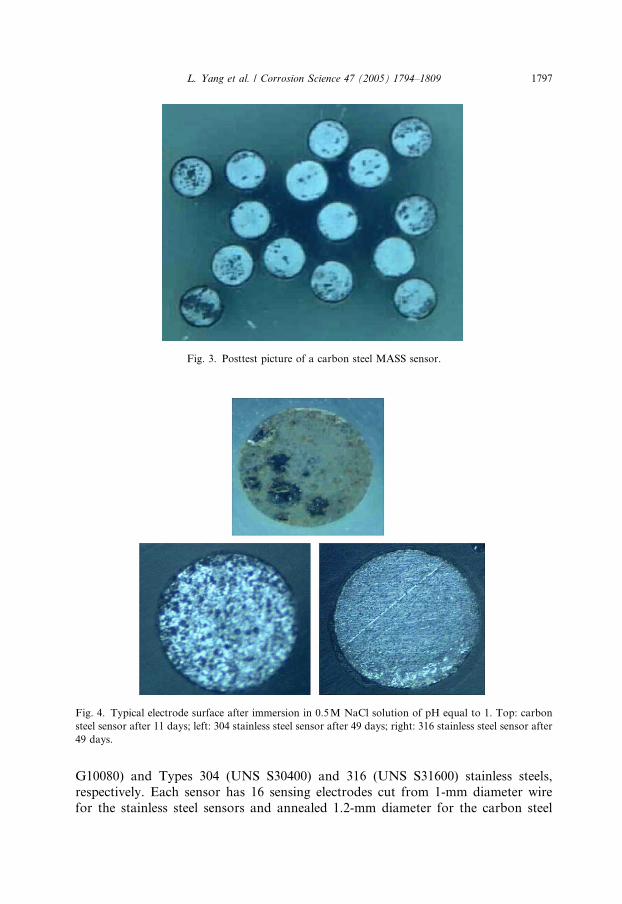
Fig. 4. Typical electrode surface after immersion in 0.5M NaCl solution of pH equal to 1. Top: carbon
steel sensor after 11 days; left: 304 stainless steel sensor after 49 days; right: 316 stainless steel sensor after
49 days.
Fig. 3. Posttest picture of a carbon steel MASS sensor.
L. Yang et al. / Corrosion Science 47 (2005) 1794–1809 1797
G10080) and Types 304 (UNS S30400) and 316 (UNS S31600) stainless steels,
respectively. Each sensor has 16 sensing electrodes cut from 1-mm diameter wire
for the stainless steel sensors and annealed 1.2-mm diameter for the carbon steel
-0.80
-0.60
-0.40
-0.20
0.00
0.20
0.40
0.60
0.80
0 10 20 30 0 50 60 70 8 0 90 100 110 120Time (Arbitrary Unit)
Pote
ntia
l (V
SCE)
PtCS-E7304316CS-E1
Aerated0.5M NaCl pH=1.14
6 wt% FeCl3
AeratedDI water
Aerated0.5M NaCl pH=10
59 Minutes
0.5 M NaCl &0.01 M H2O2
6 wt% FeCl32M NaNO3
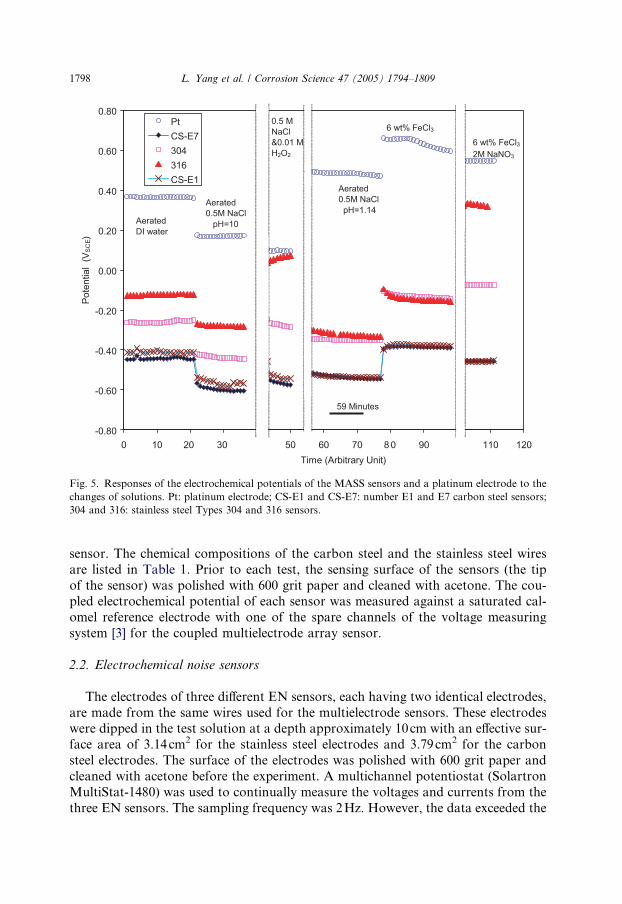
Fig. 5. Responses of the electrochemical potentials of the MASS sensors and a platinum electrode to the
changes of solutions. Pt: platinum electrode; CS-E1 and CS-E7: number E1 and E7 carbon steel sensors;
304 and 316: stainless steel Types 304 and 316 sensors.
1798 L. Yang et al. / Corrosion Science 47 (2005) 1794–1809
sensor. The chemical compositions of the carbon steel and the stainless steel wires
are listed in Table 1. Prior to each test, the sensing surface of the sensors (the tip
of the sensor) was polished with 600 grit paper and cleaned with acetone. The cou-pled electrochemical potential of each sensor was measured against a saturated cal-
omel reference electrode with one of the spare channels of the voltage measuring
system [3] for the coupled multielectrode array sensor.
2.2. Electrochemical noise sensors
The electrodes of three different EN sensors, each having two identical electrodes,
are made from the same wires used for the multielectrode sensors. These electrodeswere dipped in the test solution at a depth approximately 10cm with an effective sur-
face area of 3.14cm2 for the stainless steel electrodes and 3.79cm2 for the carbon
steel electrodes. The surface of the electrodes was polished with 600 grit paper and
cleaned with acetone before the experiment. A multichannel potentiostat (Solartron
MultiStat-1480) was used to continually measure the voltages and currents from the
three EN sensors. The sampling frequency was 2Hz. However, the data exceeded the
-0.4090
-0.4088
-0.4086
-0.4084
-0.4082
-0.4080
-0.4078
-0.4076
-0.4074
-0.4072
-0.4070
-0.4068
7:52:19 7:55:12 7:58:05 8:00:58 8:03:50 8:06:43 8:09:36Time (H:M:S)
Pote
ntia
l (V
SCE)
5.34E-7
5.36E-7
5.38E-7
5.40E-7
5.42E-7
5.44E-7
5.46E-7
5.48E-7
5.50E-7
Cur
rent
(A)
PotentialCurrent
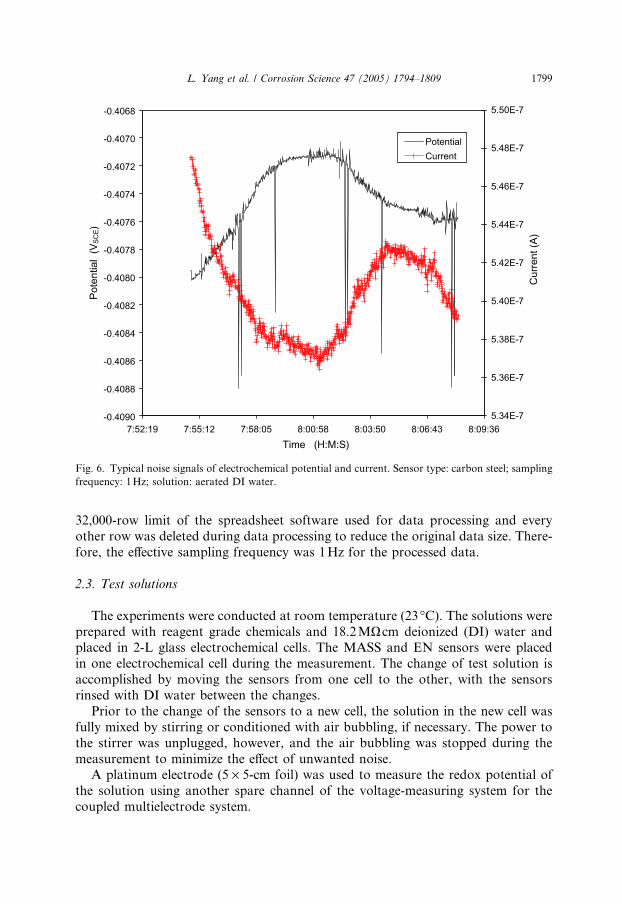
Fig. 6. Typical noise signals of electrochemical potential and current. Sensor type: carbon steel; sampling
frequency: 1Hz; solution: aerated DI water.
L. Yang et al. / Corrosion Science 47 (2005) 1794–1809 1799
32,000-row limit of the spreadsheet software used for data processing and every
other row was deleted during data processing to reduce the original data size. There-
fore, the effective sampling frequency was 1Hz for the processed data.
2.3. Test solutions
The experiments were conducted at room temperature (23 �C). The solutions wereprepared with reagent grade chemicals and 18.2MXcm deionized (DI) water andplaced in 2-L glass electrochemical cells. The MASS and EN sensors were placed
in one electrochemical cell during the measurement. The change of test solution is
accomplished by moving the sensors from one cell to the other, with the sensors
rinsed with DI water between the changes.
Prior to the change of the sensors to a new cell, the solution in the new cell was
fully mixed by stirring or conditioned with air bubbling, if necessary. The power to
the stirrer was unplugged, however, and the air bubbling was stopped during the
measurement to minimize the effect of unwanted noise.A platinum electrode (5 · 5-cm foil) was used to measure the redox potential of
the solution using another spare channel of the voltage-measuring system for the
coupled multielectrode system.
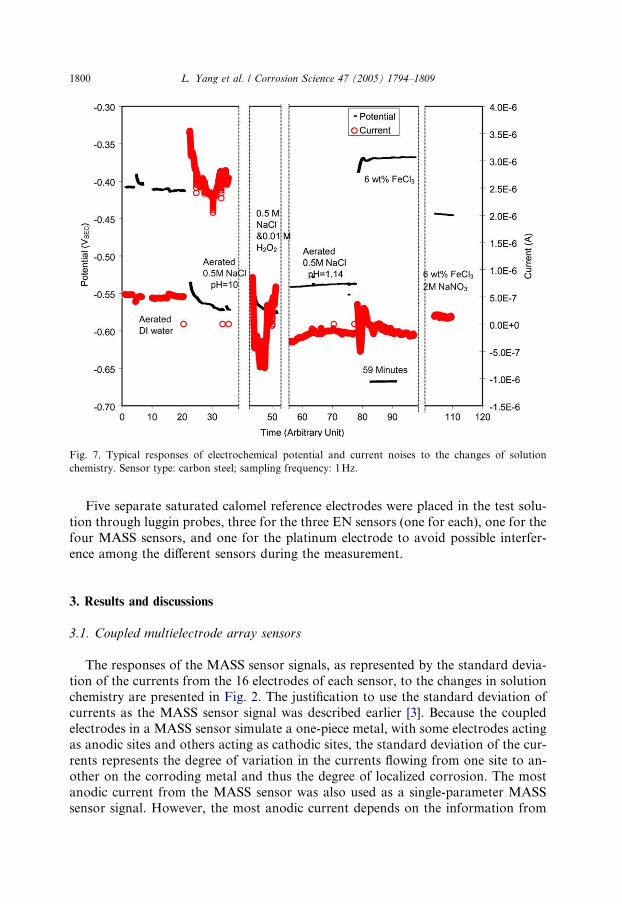
Fig. 7. Typical responses of electrochemical potential and current noises to the changes of solution
chemistry. Sensor type: carbon steel; sampling frequency: 1Hz.
1800 L. Yang et al. / Corrosion Science 47 (2005) 1794–1809
Five separate saturated calomel reference electrodes were placed in the test solu-
tion through luggin probes, three for the three EN sensors (one for each), one for the
four MASS sensors, and one for the platinum electrode to avoid possible interfer-
ence among the different sensors during the measurement.
3. Results and discussions
3.1. Coupled multielectrode array sensors
The responses of the MASS sensor signals, as represented by the standard devia-
tion of the currents from the 16 electrodes of each sensor, to the changes in solution
chemistry are presented in Fig. 2. The justification to use the standard deviation ofcurrents as the MASS sensor signal was described earlier [3]. Because the coupled
electrodes in a MASS sensor simulate a one-piece metal, with some electrodes acting
as anodic sites and others acting as cathodic sites, the standard deviation of the cur-
rents represents the degree of variation in the currents flowing from one site to an-
other on the corroding metal and thus the degree of localized corrosion. The most
anodic current from the MASS sensor was also used as a single-parameter MASS
sensor signal. However, the most anodic current depends on the information from
L. Yang et al. / Corrosion Science 47 (2005) 1794–1809 1801
only one of the measured values and therefore has a greater uncertainty than the sin-
gle parameters derived from the standard deviation [3]. Fig. 2 shows that the resis-
tance order of the three metals to nonuniform corrosion in all the solutions tested
is 316 SS > 304 SS > 1008 CS, which is in agreement with the industrial experience
with these metals. Fig. 2 also shows that the increasing orders of severity for nonuni-form corrosion such as pitting corrosion are
DI water < low pH NaCl < high pH NaCl < FeCl3 þNaNO3< NaClþH2O2 < FeCl3
for Type 1008 carbon steel and
DI water < high pH NaCl < low pH NaCl < NaClþH2O2
< FeCl3 þNaNO3 < FeCl3for the two stainless steels. The inhibiting effect of NaNO3 on nonuniform corrosion
can be clearly noted for all three metals. In the NaCl solution, the carbon steel and
the stainless steel sensors showed an opposite dependence on pH because the corro-
sion of carbon steel materials tends to be more uniform at low pH and more local-ized at high pH [14].
1.0E-06
1.0E-05
1.0E-04
1.0E-03
1.0E-02
1.0E-01
1.0E+00
1.0E+01
1.0E+02
0 20 06 60 80 100 120Time (Arbitrary Unit)
Pit I
ndex
1.0E-7
1.0E-6
1.0E-5
1.0E-4
1.0E-3
1.0E-2
MAS
S Se
nsor
Sig
nal
(A)
P. IndexP.Index, Moving AverageMASS 7MASS 1
Aerated0.5M NaCl pH=1.14
6 wt% FeCl3
AeratedDI water
Aerated0.5M NaCl pH=10
59 Minutes
6 wt% FeCl32M NaNO3
0.5 M NaCl &0.01 M H2O2
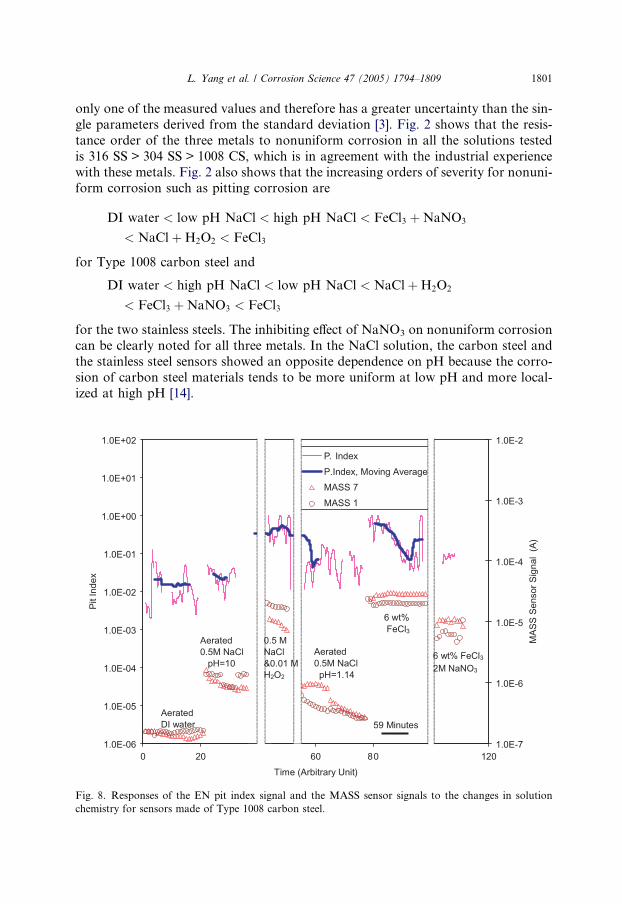
Fig. 8. Responses of the EN pit index signal and the MASS sensor signals to the changes in solution
chemistry for sensors made of Type 1008 carbon steel.
1.0E-6
1.0E-5
1.0E-4
1.0E-3
1.0E-2
1.0E-1
1.0E+0
1.0E+1
0 10 20 30 40 50 60 70 80 90 100 110 120Time (Arbitrary Unit)
Pit I
ndex
1.0E-9
1.0E-8
1.0E-7
1.0E-6
1.0E-5
1.0E-4
1.0E-3
1.0E-2
MAS
S Se
nsor
Sig
nal (
A)
P. Index
MASS Sensor
Aerated0.5M NaCl pH=1.14
6 wt% FeCl3
AeratedDI water
Aerated0.5M NaCl pH=10
59 Minutes
6 wt% FeCl32M NaNO3
0.5 M NaCl &0.01 M H2O2
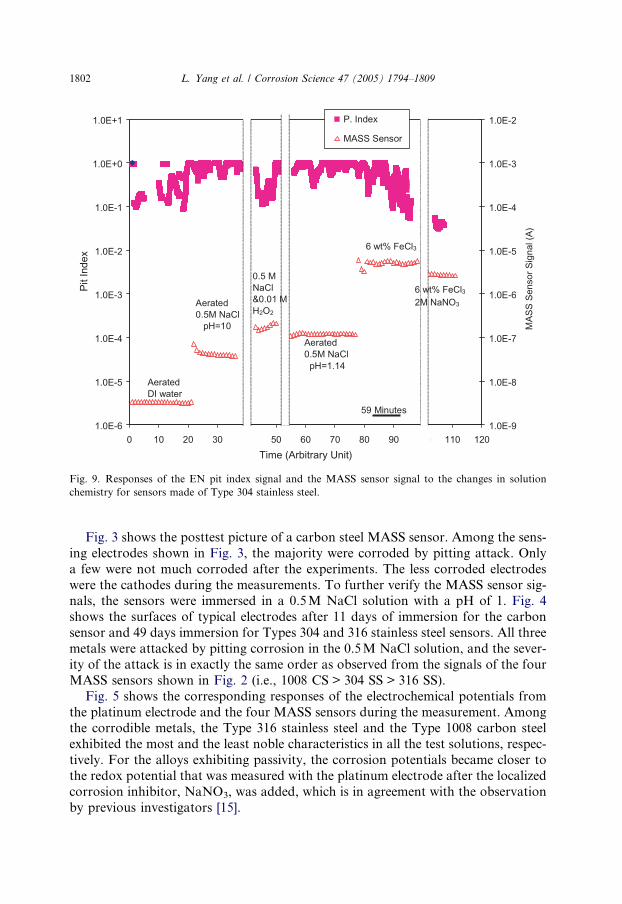
Fig. 9. Responses of the EN pit index signal and the MASS sensor signal to the changes in solution
chemistry for sensors made of Type 304 stainless steel.
1802 L. Yang et al. / Corrosion Science 47 (2005) 1794–1809
Fig. 3 shows the posttest picture of a carbon steel MASS sensor. Among the sens-
ing electrodes shown in Fig. 3, the majority were corroded by pitting attack. Only
a few were not much corroded after the experiments. The less corroded electrodes
were the cathodes during the measurements. To further verify the MASS sensor sig-nals, the sensors were immersed in a 0.5M NaCl solution with a pH of 1. Fig. 4
shows the surfaces of typical electrodes after 11 days of immersion for the carbon
sensor and 49 days immersion for Types 304 and 316 stainless steel sensors. All three
metals were attacked by pitting corrosion in the 0.5M NaCl solution, and the sever-
ity of the attack is in exactly the same order as observed from the signals of the four
MASS sensors shown in Fig. 2 (i.e., 1008 CS > 304 SS > 316 SS).
Fig. 5 shows the corresponding responses of the electrochemical potentials from
the platinum electrode and the four MASS sensors during the measurement. Amongthe corrodible metals, the Type 316 stainless steel and the Type 1008 carbon steel
exhibited the most and the least noble characteristics in all the test solutions, respec-
tively. For the alloys exhibiting passivity, the corrosion potentials became closer to
the redox potential that was measured with the platinum electrode after the localized
corrosion inhibitor, NaNO3, was added, which is in agreement with the observation
by previous investigators [15].
L. Yang et al. / Corrosion Science 47 (2005) 1794–1809 1803
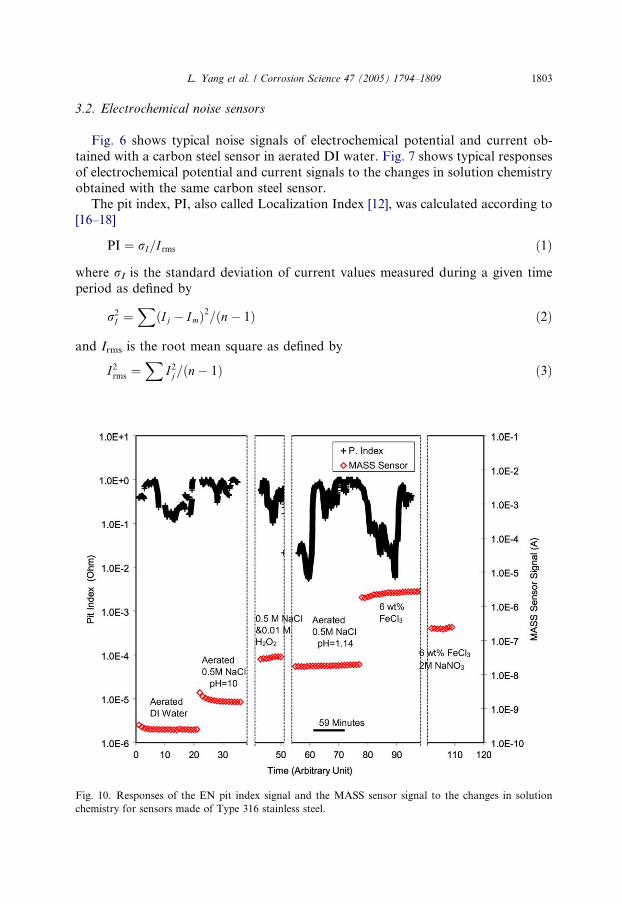
3.2. Electrochemical noise sensors
Fig. 6 shows typical noise signals of electrochemical potential and current ob-
tained with a carbon steel sensor in aerated DI water. Fig. 7 shows typical responses
of electrochemical potential and current signals to the changes in solution chemistryobtained with the same carbon steel sensor.
The pit index, PI, also called Localization Index [12], was calculated according to
[16–18]
PI ¼ rI=I rms ð1Þ
where rI is the standard deviation of current values measured during a given timeperiod as defined by
r2I ¼X
ðIj � ImÞ2=ðn� 1Þ ð2Þ
and Irms is the root mean square as defined by
I2rms ¼X
I2j=ðn� 1Þ ð3Þ
Fig. 10. Responses of the EN pit index signal and the MASS sensor signal to the changes in solution
chemistry for sensors made of Type 316 stainless steel.
1804 L. Yang et al. / Corrosion Science 47 (2005) 1794–1809
In Eqs. (2) and (3), Ij is the current value measured at the jth time interval, n is the
number of time intervals, and Im is the mean current in the given time period. By
definition, 0 6 PI 6 1. Figs. 8–10 show the responses of the pit index calculated with
n = 451 (the corresponding time period is 451s) for the carbon steel and Types 304
and 316 stainless steel sensors. In Fig. 8, the moving average of the pit index is theaverage of adjacent 2001 PI values (1000 data points on each side). For comparison,
the sensor signal from each MASS probe is also plotted in the corresponding figures.
According to the classification proposed by Eden [12] if the PI approaches 1, the cor-
rosion process is unstable and, therefore, more likely to be stochastic; conversely, if
the PI approaches the order of 0.001, the corrosion is mainly uniform. Figs. 8 and 9,
however, show no significant correlation between the PI values and the localized cor-
rosiveness of the solutions. The level of fluctuations and drifting of the PI values,
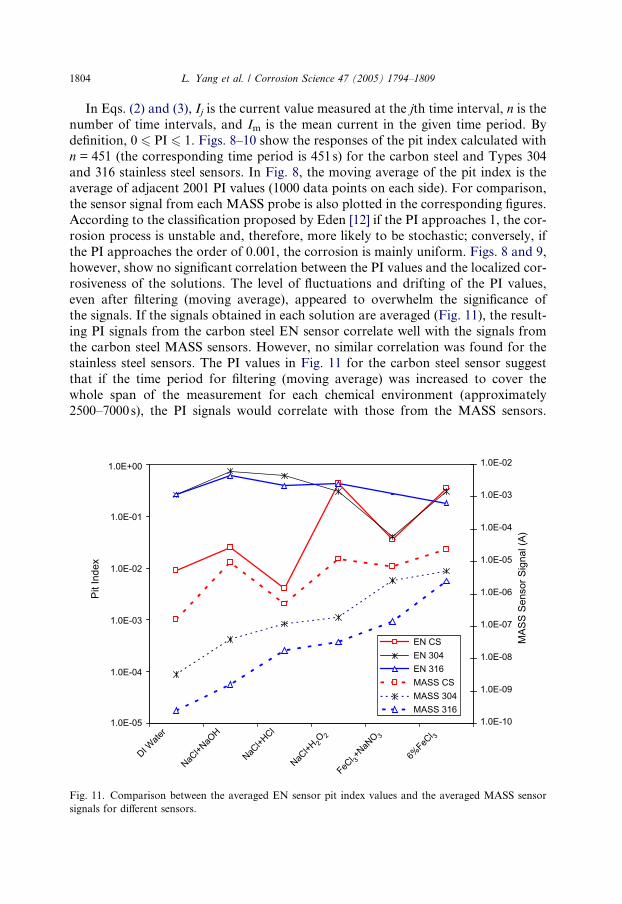
even after filtering (moving average), appeared to overwhelm the significance ofthe signals. If the signals obtained in each solution are averaged (Fig. 11), the result-
ing PI signals from the carbon steel EN sensor correlate well with the signals from
the carbon steel MASS sensors. However, no similar correlation was found for the
stainless steel sensors. The PI values in Fig. 11 for the carbon steel sensor suggest
that if the time period for filtering (moving average) was increased to cover the
whole span of the measurement for each chemical environment (approximately
2500–7000s), the PI signals would correlate with those from the MASS sensors.
1.0E-05
1.0E-04
1.0E-03
1.0E-02
1.0E-01
1.0E+00
DI Wate
r
NaCl+N
aOH
NaCl+H
Cl
NaCl+H
2O2
FeCl 3+
NaNO 3
6%FeC
l 3
Pit I
ndex
1.0E-10
1.0E-09
1.0E-08
1.0E-07
1.0E-06
1.0E-05
1.0E-04
1.0E-03
1.0E-02
MAS
S Se
nsor
Sig
nal (
A)
EN CSEN 304EN 316MASS CSMASS 304MASS 316
Fig. 11. Comparison between the averaged EN sensor pit index values and the averaged MASS sensor
signals for different sensors.
L. Yang et al. / Corrosion Science 47 (2005) 1794–1809 1805
The response of the EN sensor would be exceptionally long, however, taking 40–
120min to derive one filtered value. The results shown in Fig. 11 are consistent with
the behavior of the EN sensors reported in the literature i.e., in some cases, good cor-
relations between the PI and the corrosiveness of localized corrosion could be ob-
tained [11,13], and in other cases, the PI was found not to correlate with the onsetof pitting [16,18]. Therefore, the PI as a localized corrosion indicator must be used
with caution. In addition, the PI is dependent on the measurement period for deter-
mining the PI values.
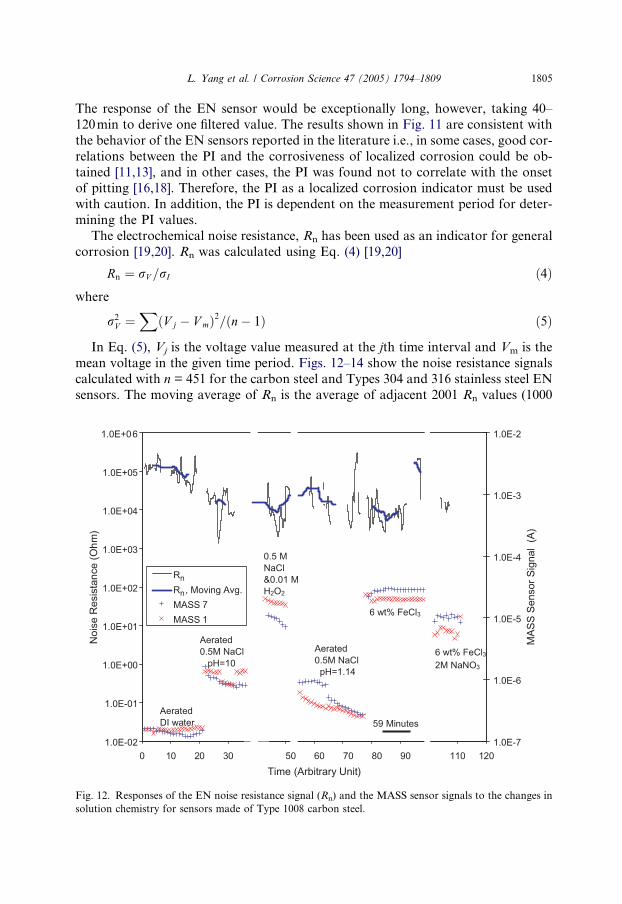
The electrochemical noise resistance, Rn has been used as an indicator for general
corrosion [19,20]. Rn was calculated using Eq. (4) [19,20]
Rn ¼ rV =rI ð4Þwhere
r2V ¼X
ðV j � V mÞ2=ðn� 1Þ ð5Þ
In Eq. (5), Vj is the voltage value measured at the jth time interval and Vm is the
mean voltage in the given time period. Figs. 12–14 show the noise resistance signals
calculated with n = 451 for the carbon steel and Types 304 and 316 stainless steel EN
sensors. The moving average of Rn is the average of adjacent 2001 Rn values (1000
1.0E-02
1.0E-01
1.0E+00
1.0E+01
1.0E+02
1.0E+03
1.0E+04
1.0E+05
1.0E+06
0 10 20 30 05 50 60 70 80 90 00 110 120Time (Arbitrary Unit)
Noi
se R
esis
tanc
e (O
hm)
1.0E-7
1.0E-6
1.0E-5
1.0E-4
1.0E-3
1.0E-2
MAS
S Se
nsor
Sig
nal
(A)
RnRn, Moving Avg.MASS 7MASS 1
Aerated0.5M NaClpH=1.14
6 wt% FeCl3
AeratedDI water
0.5 M NaCl&0.01 M H2O2
6 wt% FeCl32M NaNO3
59 Minutes
Aerated0.5M NaCl pH=10
Fig. 12. Responses of the EN noise resistance signal (Rn) and the MASS sensor signals to the changes in
solution chemistry for sensors made of Type 1008 carbon steel.
1.0E+0
1.0E+1
1.0E+2
1.0E+3
1.0E+4
1.0E+5
1.0E+6
1.0E+7
1.0E+8
0 10 20 30 40 50 60 70 80 90 100 110 120
Time (Arbitrary Unit)
Noi
se R
esis
tanc
e (O
hm)
1.0E-9
1.0E-8
1.0E-7
1.0E-6
1.0E-5
1.0E-4
1.0E-3
1.0E-2
MAS
S Se
nsor
Sig
nal
(A)
RnRn, Moving AverageMASS Sensor
Aerated0.5M NaCl pH=1.14
6 wt% FeCl3
AeratedDI water
59 Minutes
6 wt% FeCl32M NaNO3
0.5 M NaCl &0.01 M H2O2
Aerated0.5M NaCl pH=10
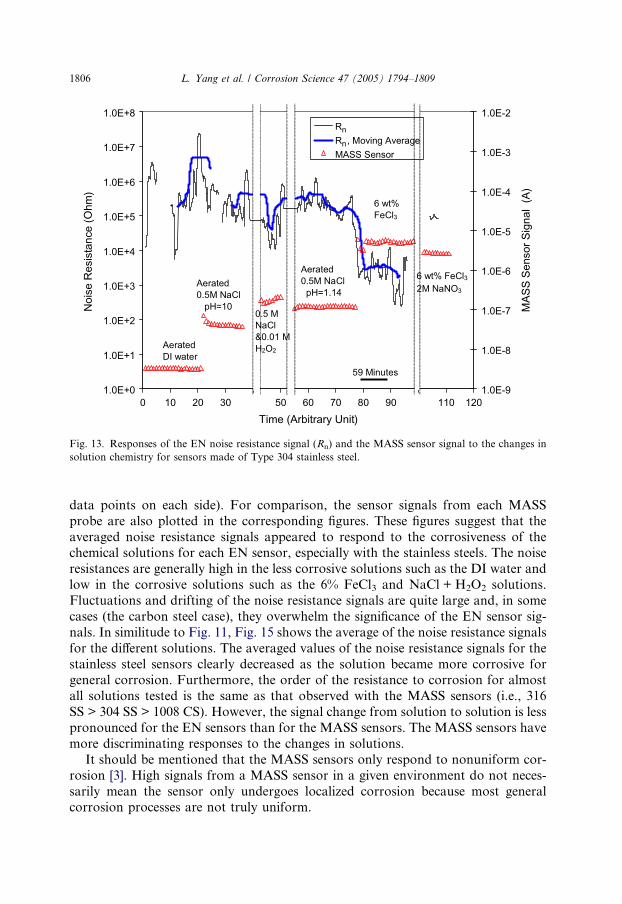
Fig. 13. Responses of the EN noise resistance signal (Rn) and the MASS sensor signal to the changes in
solution chemistry for sensors made of Type 304 stainless steel.
1806 L. Yang et al. / Corrosion Science 47 (2005) 1794–1809
data points on each side). For comparison, the sensor signals from each MASS
probe are also plotted in the corresponding figures. These figures suggest that the
averaged noise resistance signals appeared to respond to the corrosiveness of thechemical solutions for each EN sensor, especially with the stainless steels. The noise
resistances are generally high in the less corrosive solutions such as the DI water and
low in the corrosive solutions such as the 6% FeCl3 and NaCl + H2O2 solutions.
Fluctuations and drifting of the noise resistance signals are quite large and, in some
cases (the carbon steel case), they overwhelm the significance of the EN sensor sig-
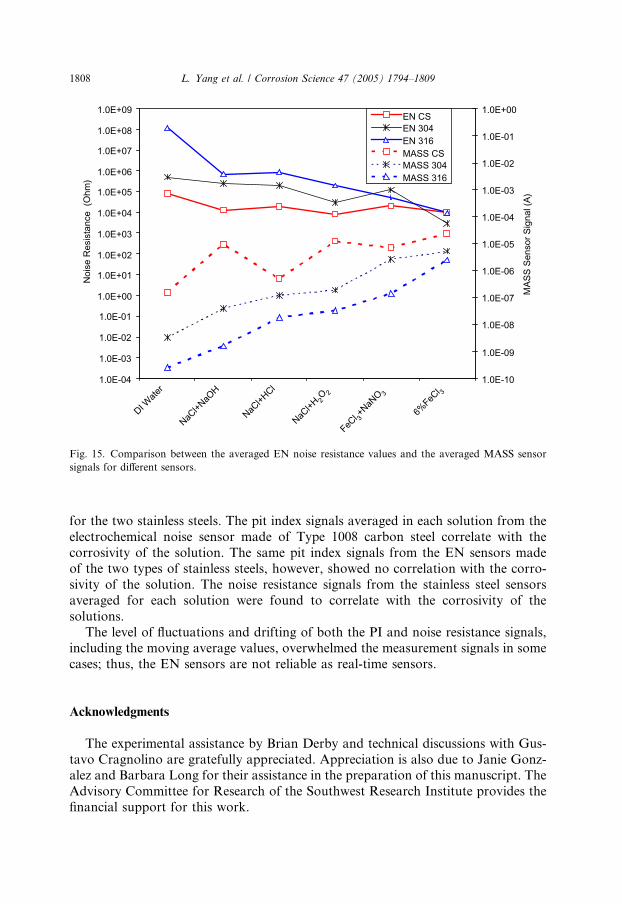
nals. In similitude to Fig. 11, Fig. 15 shows the average of the noise resistance signals
for the different solutions. The averaged values of the noise resistance signals for the
stainless steel sensors clearly decreased as the solution became more corrosive forgeneral corrosion. Furthermore, the order of the resistance to corrosion for almost
all solutions tested is the same as that observed with the MASS sensors (i.e., 316
SS > 304 SS > 1008 CS). However, the signal change from solution to solution is less
pronounced for the EN sensors than for the MASS sensors. The MASS sensors have
more discriminating responses to the changes in solutions.
It should be mentioned that the MASS sensors only respond to nonuniform cor-
rosion [3]. High signals from a MASS sensor in a given environment do not neces-
sarily mean the sensor only undergoes localized corrosion because most generalcorrosion processes are not truly uniform.
1.0E+0
1.0E+1
1.0E+2
1.0E+3
1.0E+4
1.0E+5
1.0E+6
1.0E+7
1.0E+8
1.0E+9
1.0E+10
0 10 20 30 40 50 60 70 80 90 100 110 120Time (Arbitrary Unit)
Noi
se R
esis
tanc
e (O
hm)
1E-10
1E-9
1E-8
1E-7
1E-6
1E-5
1E-4
1E-3
1E-2
1E-1
MAS
S Se
nsor
Sig
nal (
A)
RnRn, Moving AverageMASS Sensor
Aerated0.5M NaCl pH=1.14
6 wt% FeCl3
AeratedDI Water
Aerated0.5M NaCl pH=10
59 Minutes
0.5 M NaCl &0.01 M H2O2 6 wt% FeCl3
2M NaNO3
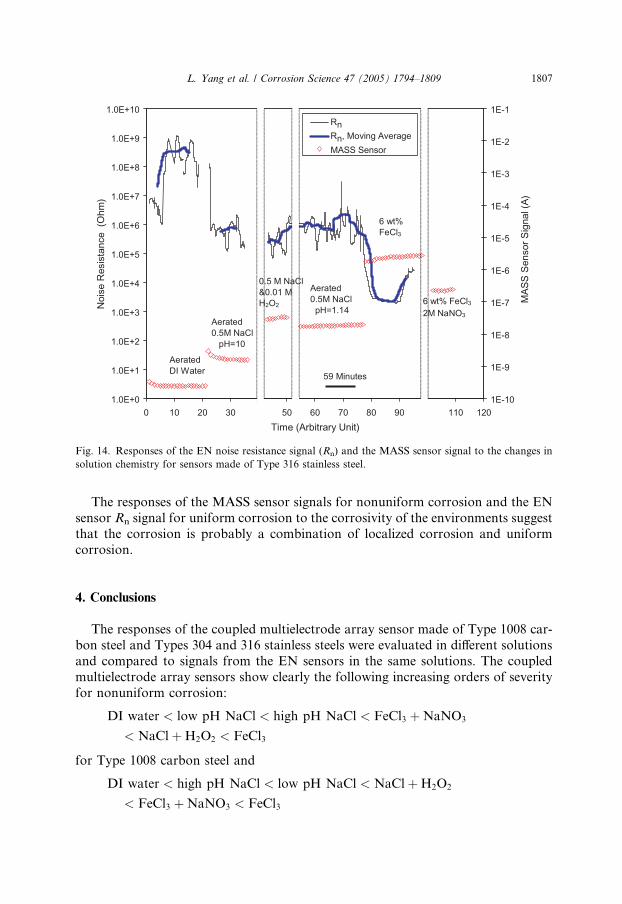
Fig. 14. Responses of the EN noise resistance signal (Rn) and the MASS sensor signal to the changes in
solution chemistry for sensors made of Type 316 stainless steel.
L. Yang et al. / Corrosion Science 47 (2005) 1794–1809 1807
The responses of the MASS sensor signals for nonuniform corrosion and the EN
sensor Rn signal for uniform corrosion to the corrosivity of the environments suggest
that the corrosion is probably a combination of localized corrosion and uniform
corrosion.
4. Conclusions
The responses of the coupled multielectrode array sensor made of Type 1008 car-
bon steel and Types 304 and 316 stainless steels were evaluated in different solutions
and compared to signals from the EN sensors in the same solutions. The coupled
multielectrode array sensors show clearly the following increasing orders of severity
for nonuniform corrosion:
DI water < low pH NaCl < high pH NaCl < FeCl3 þNaNO3< NaClþH2O2 < FeCl3
for Type 1008 carbon steel and
DI water < high pH NaCl < low pH NaCl < NaClþH2O2
< FeCl3 þNaNO3 < FeCl3
1.0E-04
1.0E-03
1.0E-02
1.0E-01
1.0E+00
1.0E+01
1.0E+02
1.0E+03
1.0E+04
1.0E+05
1.0E+06
1.0E+07
1.0E+08
1.0E+09
DI Wate
r
NaCl+N
aOH
NaCl+H
Cl
NaCl+H
2O2
FeCl 3+
NaNO 3
6%FeC
l 3
Noi
se R
esis
tanc
e (O
hm)
1.0E-10
1.0E-09
1.0E-08
1.0E-07
1.0E-06
1.0E-05
1.0E-04
1.0E-03
1.0E-02
1.0E-01
1.0E+00
MAS
S Se
nsor
Sig
nal (
A)
EN CSEN 304EN 316MASS CSMASS 304MASS 316
Fig. 15. Comparison between the averaged EN noise resistance values and the averaged MASS sensor
signals for different sensors.
1808 L. Yang et al. / Corrosion Science 47 (2005) 1794–1809
for the two stainless steels. The pit index signals averaged in each solution from the
electrochemical noise sensor made of Type 1008 carbon steel correlate with the
corrosivity of the solution. The same pit index signals from the EN sensors made
of the two types of stainless steels, however, showed no correlation with the corro-
sivity of the solution. The noise resistance signals from the stainless steel sensors
averaged for each solution were found to correlate with the corrosivity of the
solutions.
The level of fluctuations and drifting of both the PI and noise resistance signals,including the moving average values, overwhelmed the measurement signals in some
cases; thus, the EN sensors are not reliable as real-time sensors.
Acknowledgments
The experimental assistance by Brian Derby and technical discussions with Gus-
tavo Cragnolino are gratefully appreciated. Appreciation is also due to Janie Gonz-alez and Barbara Long for their assistance in the preparation of this manuscript. The
Advisory Committee for Research of the Southwest Research Institute provides the
financial support for this work.
L. Yang et al. / Corrosion Science 47 (2005) 1794–1809 1809
References
[1] L. Yang, N. Sridhar, O. Pensado, Development of a multielectrode array sensor for monitoring
localized corrosionProceedings of the Extended Abstract, vol. I, The Electrochemical Society,
Washington, DC, 2001, p. 182, Abstract #182.
[2] L. Yang, D.S. Dunn, Evaluation of corrosion inhibitors in cooling water systems using a coupled
multielectrode array sensor, in: Proceedings of the NACE International, Houston, Texas, 2002, Paper
No. 02004.
[3] L. Yang, N. Sridhar, O. Pensado, D.S. Dunn, Corrosion 58 (2002) 1004.
[4] L. Yang, N. Sridhar, Coupled multielectrode online corrosion sensor, Mater. Performance 42 (9)
(2003) 48–52.
[5] Y.J. Tan, Corros. Sci. 41 (1999) 226–247.
[6] L. Yang, N. Sridhar, G. Cragnolino, Comparison of localized corrosion of Fe–Ni–Cr–Mo alloys in
concentrated brine solutions using a coupled multielectrode array sensor, in: Proceedings of the
NACE International, Houston, Texas, 2002, Paper No. 545.
[7] A. Anderko, N. Sridhar, C.S. Brossia, D.S. Dunn, L. Yang, B.J. Saldanha, S.L. Grise, M.H. Dorsey,
An electrochemical approach to predicting and monitoring localized corrosion in chemical process
streams, in: Proceedings of the NACE International, Houston, Texas, 2003, Paper No.03375.
[8] L. Yang, R.T. Pabalan, L. Browning, G.A. Cragnolino, Measurement of corrosion in saturated
solutions under salt deposits using coupled multielectrode array sensors, in: Proceedings of the NACE
International, Houston, Texas, 2003, Paper No. 03426.
[9] L. Yang, R.T. Pabalan, L. Browning, D.S. Dunn, Corrosion behavior of carbon steel and stainless
steel materials under salt deposits in simulated dry repository environments, in: R.J. Finch, D.B.
Bullen (Eds.), Scientific Basis for Nuclear Waste Management XXVI, M.R.S. Symposium
Proceedings, vol. 757, Materials Research Society, Warrendale, PA:, 2003, pp. 791–797.
[10] C.S. Brossia, L. Yang, Studies of microbiologically influenced corrosion using a coupled multielec-
trode array sensor, in: Proceedings of the NACE International, Houston, Texas, 2003, Paper No.
03575.
[11] N. Rothwell, D.A. Eden, G. Row, Electrochemical noise techniques for determining corrosion rates
and mechanisms, in: Proceedings of the NACE International, Houston, Texas, 1992, Paper No. 223.
[12] D.A. Eden, Uhlig�s Corrosion Handbook, Second ed., John Wiley and Sons, Inc., New York, 2000.[13] E. Garcia-Ochoa, R. Ramirez, V. Torres, F.J. Rodriguez, J. Genesca, Corrosion 58 (2002) 756–760.
[14] G.P. Marsh, K.J. Taylor, I.D. Bland, C. Westcott, P.W. Tasker, S.M. Sharland, Evaluation of the
localized corrosion of carbon steel overpacks for nuclear waste disposal in granite environments, in:
Proceedings, vol. 59, The Materials Research Society, Pittsburgh, Pennsylvania, 1958, pp. 421–428.
[15] J. Kolts, N. Sridhar, Temperature effect in localized corrosion, in corrosion of nickel base alloys, in:
R.C. Scarberry (Ed.), Proceedings of the International Conference on Corrosion of Nickel-Base
Alloys, American Society for Metals, Materials Park, Ohio, 1984, pp. 191–198.
[16] R.G. Kelly, M.E. Inman, J.L. Hudson, Analysis of electrochemical noise for type 410 stainless steel in
chloride solutions, in electrochemical noise measurement for corrosion applications, in: J.R. Kearns,
J.R. Scully, P.R. Roberge, D.L. Reichert, J.L. Dawson (Eds.), ASTM Special Technical Publication
1277, Conshohocken, Pennsylvania, 1996, pp. 101–113.
[17] A. Nagiub, F. Mansfeld, Corros. Sci. 43 (2001) 2147–2171.
[18] S.T. Pride, J.R. Scully, J.L. Hudson, Analysis of electrochemical noise from metastable pitting in
aluminum, aged Al–2%Cu, and AA 2024-T3 in electrochemical noise measurement for corrosion
applications, in: J.R. Kearns, J.R. Scully, P.R. Roberge, D.L. Reichert, J.L. Dawson (Eds.), ASTM
Special Technical Publication 1277, Conshohocken, Pennsylvania, 1996, p. 307.
[19] D.A. Eden, K. Hladhy, D.C. John, J.L. Dawson, in: Proceedings of the NACE International,
Houston, Texas, 1986, Paper No. 274.
[20] Y.J. Tan, S. Bailey, B. Kinsella, Corros. Sci. 38 (1996) 1681–1695.