Evaluation of real-time holding strategies for improved bus service reliability
6
Cats O., Burghout W., Toledo T. and Koutsopoulos H.N. (2010). Evaluation of Real-Time Holding Strategies for Improved Bus Service Reliability. IEEE conference on Intelligent Transportation Systems, Proceedings, ITSC, Portugal, 718-723. EVALUATION OF REAL-TIME HOLDING STRATEGIES FOR IMPROVED BUS SERVICE RELIABILITY Oded Cats 1,2 , Wilco Burghout 2 , Tomer Toledo 1 , Haris N. Koutsopoulos 2 1 Technion – Israel Institute of Technology, Haifa, Israel 2 Royal Institute of Technology (KTH), Stockholm, Sweden Abstract—Service reliability is one of the main measures of performance determining transit system level of service. Holding control strategies are a common transit operations practice aimed to reduce transit service unreliability by setting criteria for departure from time point stops. In order to adequately analyze the sources of uncertainty involved with transit performance, it is essential to model dynamically the interactions between traffic conditions, passenger demand and transit operations. BusMezzo, a transit simulation model has been developed on a platform of a mesoscopic traffic simulation model, which enables the representation of large- scale transit systems. The model implements several real-time holding strategies. It is used to evaluate the application of these strategies in a real-world high-demand bus line in the Tel Aviv metropolitan area, under various scenarios. An analysis of the results suggests that a holding strategy based on the mean headway from the preceding bus and the next bus, restricted by a maximum allowable holding time, is especially efficient. I. INTRODUCTION Advanced Public Transport Systems (APTS) designed to improve operations, management and operations of transit systems are increasingly integrated into transit systems. The need to integrate and efficiently operate these systems poses a challenge to planners and operators. As new technologies and applications are proposed, tools to assist in their development and evaluation prior to field implementation are needed. In the context of general traffic operations, simulation models have been established as the primary tool for evaluation at the operational level. Transit simulations provide a dynamic perspective on transit operations, enabling comparisons of various scenarios and representation of complex interactions between the network components: general traffic, transit vehicles, passengers and transit operations. A report on simulation models concluded that their capabilities to effectively simulate APTS applications in large networks is limited [1]. While they found that few microscopic models simulate well the local impacts of APTS, none of the mesoscopic models they reviewed had any transit simulation component at all. While most efforts in modeling public transportation and APTS have focused on microscopic simulations, these models are inefficient when applied to large-scale networks because of the unnecessary level of detail and extensive computational effort they require. In contrast, mesoscopic simulation models, which represent individual vehicles but avoid detailed modeling of their second-by-second movement, may be useful for system-wide evaluation of transit operations and APTS, as they are for general traffic. Service reliability is one of the main factors determining transit system level of service, as unreliable service results in longer waiting times, uneven passenger loads and missed transfers. Moreover, service irregularity is associated with higher operation costs due to fleet assignment considerations. There are several sources of variability that contribute to service uncertainty, including variability in the departure times from the origin terminal, riding time and dwell time. Holding control strategies are a common transit operations practice aimed to reduce transit service unreliability by setting a criteria for departure from time point stops. Studying the effect of holding strategies analytically is difficult, even for a single line, because of the interrelated stochastic processes involved, in particular in the case of strategies based on real-time information. Many of the previous studies in this area did not consider the inter- effect among multiple time points, assumed constant passenger arrival rates or dwell times and neglected capacity constraints and trip chaining effects. This paper reports a simulation-based evaluation of real- time holding strategies aimed to improve service regularity. The evaluation is performed using BusMezzo, a transit mesoscopic simulation model. The model represents explicitly all of the important sources of uncertainty associated with transit operations. The rest of the paper is organized as follows: First, the overall framework and implementation of the transit simulation model are presented. Various holding control strategies are discussed and then applied on a high-demand bus line in the Tel-Aviv metropolitan area. The case study analyzes the impacts of holding strategies on bus performance and level of service and their effectiveness. Finally, a discussion and concluding remarks are presented. II. TRANSIT SIMULATION A. Mezzo The transit simulation model is built within the platform of Mezzo, a mesoscopic traffic simulation model. Mezzo is an object-oriented, event-based simulator, which models vehicles individually, but does not represent lanes explicitly. Links in Mezzo are divided into two parts: a running part, which contains vehicles that are not delayed by the downstream capacity limit; and a queuing part, which extends upstream from the end of the link when capacity is exceeded. The boundaries between the running and queuing parts are dynamic and depend on the extent of the queue. Travel time on the running part is defined by a speed- density function, while the travel time on the queuing part is determined by queue servers. Separate servers with their corresponding capacities are used for each turning
-
Upload
csregistry -
Category
Documents
-
view
3 -
download
0
Transcript of Evaluation of real-time holding strategies for improved bus service reliability

Cats O., Burghout W., Toledo T. and Koutsopoulos H.N. (2010). Evaluation of Real-Time Holding Strategies for Improved Bus Service Reliability. IEEE conference on Intelligent Transportation Systems, Proceedings, ITSC, Portugal, 718-723.
EVALUATION OF REAL-TIME HOLDING STRATEGIES FOR IMPROVED
BUS SERVICE RELIABILITY
Oded Cats1,2
, Wilco Burghout2, Tomer Toledo
1, Haris N. Koutsopoulos
2
1Technion – Israel Institute of Technology, Haifa, Israel 2Royal Institute of Technology (KTH), Stockholm, Sweden
Abstract—Service reliability is one of the main measures of
performance determining transit system level of service.
Holding control strategies are a common transit operations
practice aimed to reduce transit service unreliability by setting
criteria for departure from time point stops. In order to
adequately analyze the sources of uncertainty involved with
transit performance, it is essential to model dynamically the
interactions between traffic conditions, passenger demand and
transit operations. BusMezzo, a transit simulation model has
been developed on a platform of a mesoscopic traffic
simulation model, which enables the representation of large-
scale transit systems. The model implements several real-time
holding strategies. It is used to evaluate the application of these
strategies in a real-world high-demand bus line in the Tel Aviv
metropolitan area, under various scenarios. An analysis of the
results suggests that a holding strategy based on the mean
headway from the preceding bus and the next bus, restricted
by a maximum allowable holding time, is especially efficient.
I. INTRODUCTION
Advanced Public Transport Systems (APTS) designed to
improve operations, management and operations of transit
systems are increasingly integrated into transit systems. The
need to integrate and efficiently operate these systems poses
a challenge to planners and operators. As new technologies
and applications are proposed, tools to assist in their
development and evaluation prior to field implementation
are needed. In the context of general traffic operations,
simulation models have been established as the primary tool
for evaluation at the operational level. Transit simulations
provide a dynamic perspective on transit operations,
enabling comparisons of various scenarios and
representation of complex interactions between the network
components: general traffic, transit vehicles, passengers and
transit operations. A report on simulation models concluded
that their capabilities to effectively simulate APTS
applications in large networks is limited [1]. While they
found that few microscopic models simulate well the local
impacts of APTS, none of the mesoscopic models they
reviewed had any transit simulation component at all. While
most efforts in modeling public transportation and APTS
have focused on microscopic simulations, these models are
inefficient when applied to large-scale networks because of
the unnecessary level of detail and extensive computational
effort they require. In contrast, mesoscopic simulation
models, which represent individual vehicles but avoid
detailed modeling of their second-by-second movement,
may be useful for system-wide evaluation of transit
operations and APTS, as they are for general traffic.
Service reliability is one of the main factors determining
transit system level of service, as unreliable service results
in longer waiting times, uneven passenger loads and missed
transfers. Moreover, service irregularity is associated with
higher operation costs due to fleet assignment
considerations. There are several sources of variability that
contribute to service uncertainty, including variability in the
departure times from the origin terminal, riding time and
dwell time. Holding control strategies are a common transit
operations practice aimed to reduce transit service
unreliability by setting a criteria for departure from time
point stops. Studying the effect of holding strategies
analytically is difficult, even for a single line, because of the
interrelated stochastic processes involved, in particular in
the case of strategies based on real-time information. Many
of the previous studies in this area did not consider the inter-
effect among multiple time points, assumed constant
passenger arrival rates or dwell times and neglected capacity
constraints and trip chaining effects.
This paper reports a simulation-based evaluation of real-
time holding strategies aimed to improve service regularity.
The evaluation is performed using BusMezzo, a transit
mesoscopic simulation model. The model represents
explicitly all of the important sources of uncertainty
associated with transit operations. The rest of the paper is
organized as follows: First, the overall framework and
implementation of the transit simulation model are
presented. Various holding control strategies are discussed
and then applied on a high-demand bus line in the Tel-Aviv
metropolitan area. The case study analyzes the impacts of
holding strategies on bus performance and level of service
and their effectiveness. Finally, a discussion and concluding
remarks are presented.
II. TRANSIT SIMULATION
A. Mezzo
The transit simulation model is built within the platform of
Mezzo, a mesoscopic traffic simulation model. Mezzo is an
object-oriented, event-based simulator, which models
vehicles individually, but does not represent lanes explicitly.
Links in Mezzo are divided into two parts: a running part,
which contains vehicles that are not delayed by the
downstream capacity limit; and a queuing part, which
extends upstream from the end of the link when capacity is
exceeded. The boundaries between the running and queuing
parts are dynamic and depend on the extent of the queue.
Travel time on the running part is defined by a speed-
density function, while the travel time on the queuing part is
determined by queue servers. Separate servers with their
corresponding capacities are used for each turning

movement in order to capture link connectivity and lane
channeling.
B. Transit simulation framework
Mezzo was extended to simulate transit operations with six
transit-oriented classes: Bus Type, Bus Vehicle, Bus Line,
Bus Route, Bus Trip and Bus Stop. As an event-based
simulation model, the time clock of the simulation
progresses from one event to the next according to a
chronological list of events that refers to the relevant objects
that change state. At the start of the simulation, all objects
are initialized and some of them register an event. The
execution of most events triggers the generation of new
subsequent events. On initialization of the simulation run,
the list of the bus lines that are modeled is read and the
corresponding Bus Line, Bus Route and Bus Type objects
are created. At this stage, events are registered in the event
list for the next scheduled departure for each line. When a
scheduled trip departure event is activated the Bus Trip
object is generated and the scheduled Bus Vehicle is
assigned as soon as it is available, representing trip chaining
explicitly. Link travel times are calculated based on traffic
conditions as for all vehicles in Mezzo, while dwell times
are calculated every time a bus vehicle enters a bus stop.
Based on the dwell time and taking into account any control
strategies that may be implemented, the timing for a new
event to exit the bus stop is determined. Finally, when the
bus arrives at the end of its route and the trip ends, Mezzo
progresses the bus according to its vehicle schedule.
The main simulation loop is designed to support the
implementation of control strategies, where each object that
is a potential subject for control strategy is indicated by a
flag. Every time that a transit-related event is executed, the
model checks whether a control strategy is defined for this
type of event, and if so, executing the control logic to
determine the appropriate action. For example, if holding
control is in place, for every bus that enters a stop, the
simulation checks whether the bus stop is listed as a time
point stop for that specific trip and if it is, for how long the
bus should be held according to the applicable holding
strategy (if at all). The result of this check may affect the
time associated with the stop exit event that will be
generated. A detailed description of the transit-related object
framework and simulation progress as well as model
validation is presented in [2].
C. Implemented transit models
The additional transit simulation components were designed
to enable detailed representation of the operations of public
transportation. The main transit simulation sub-models are
passenger arrival and alighting processes, dwell time
functions and trip chaining. These important sources of
uncertainty and their implementation are presented briefly.
Passenger demand is represented at the bus stop level and is
defined by arrival rates at stops of passengers for each line
and the demand to get off the bus at each stop. This level of
representation is detailed enough to support study of the
impacts of demand on service times and on crowding levels,
while avoiding explicit generation of individual passengers.
Thus, the inputs to the model are time-dependent matrices of
passenger arrival rates and alighting fractions for each bus
stop and each bus line. They are used as mean values in
stochastic arrival and alighting processes. We adopt the
commonly used assumption that passenger arrivals follow a
Poisson distribution in the case of high-frequency service.
The passenger alighting process is assumed to follow a
Binomial distribution with the number of draws equal to the
number of passengers on-board.
Dwell times include the time needed for the doors to open,
boarding and alighting of passengers, the closing of the
doors and the bus to get off the stop. Dwell times in the
simulation model are determined as a function of the door
that has the longest passenger service time, as well as the
type of stop (bay or in-lane) and physical space availability.
Passenger service time depends on the distribution of
boarding and alighting passengers between the vehicle doors
and the crowding level on the bus. In addition, the dwell
time calculation incorporates an error term that captures the
variability in dwell time function parameters. The default
dwell time function parameters implemented in the model
are based on those recommended by the Transit Capacity
and Quality of Service Manual [3].
Transit vehicles follow a schedule with a list of trips that are
carried out sequentially. Trip chaining is modeled explicitly.
The actual departure time of a chained trip being calculated
as the latter of the scheduled departure time and the time the
bus vehicle is available to depart after it completed its
previous trip and a minimal recovery time. The explicit
representation of trip chaining allows the simulation to
capture the propagation of delays from one trip to the next
and its effect on the level of service. Furthermore, it allows
taking into account fleet size constraints through the
respective recovery time policy.
III. HOLDING CONTROL STRATEGIES
Holding strategies are a set of transit operation strategies
aimed at improving service reliability by defining a subset
of stops, known as time point stops, where departure times
are subject to strategy constraints [4]. There are three main
decisions involved in implementing holding strategies: the
number of time points, their location along the route and the
holding criteria. Although hypothetically all stops might be
defined as time points, a typical bus line has only a couple
of time point stops (such as main transfer and Central
Business District stations). Several studies [5,6] suggested
that time-point stops should be located at the beginning of a
sequence of high-demand stops. In contrast, [7] found that
there are no significant benefits for defining time points
along bus routes, except the origin terminal. They searched
for the optimum time point location by formulating and
solving a deterministic analytic model, claiming that since
the holding effect is short in nature, the solution for the
deterministic problem is a reasonable approximation.
While holding strategies are aimed at reducing passenger
waiting times they may also introduce longer travel times
for passengers on-board. Several previous studies took into
account the delay caused to passengers on-board due to
holding strategies by incorporating it into the objective

Cats O., Burghout W., Toledo T. and Koutsopoulos H.N. (2010). Evaluation of Real-Time Holding Strategies for Improved Bus Service Reliability. IEEE conference on Intelligent Transportation Systems, Proceedings, ITSC, Portugal, 718-723.
function or by conducting multi-criteria optimization [e.g.
5]. In order to conduct an accurate estimation of this trade-
off and the resulting optimal holding threshold, real-time
Automatic Vehicle Location (AVL) and Automatic
Passenger Count (APC) data is required.
Holding control strategies differ in their criteria for
departure time from a time point stop and the information
that their implementation requires. They are classified
according to whether they are based on a schedule criterion
or a headway criterion. Schedule-based holding enforces
buses that arrive early at a time point stop to wait at the stop
until a pre-defined slack from their scheduled departure
time. The equivalent mathematical definition is:
(1)
Where is the exit (departure) time for line on trip
from stop , is the corresponding scheduled exit
(departure) time and is a non-negative slack size defined
for line at stop . is the actual arrival time and
is the dwell time.
Headway-based holding strategies imply that if the current
headways between the transit vehicle and the preceding
and/or subsequent vehicles do not fulfill a minimal headway
requirement, then the transit vehicle has to wait at the stop
until the requirement is met. In case the headway
requirement takes into account only the headway from the
preceding bus, can be expressed as follows:
(2)
Where
is the planned headway between trips
and on line and is a threshold ratio parameter. This
threshold ratio specifies the minimal allowed headway
relative to the planned headway. Headway-control strategies
are intended for short headways, when maintaining even
headways reduces passenger waiting times. Schedule-
control strategies are more likely to be useful if headways
are longer and passengers tend to follow the timetables [8].
An analytical study on the optimal threshold criteria [6]
concluded that the optimal threshold level is in the range of
0.6 to 0.8 times the planned headway.
Headway-based strategies are not limited to consider only
the headway from the preceding bus. It is possible to also
incorporate the headway to the next bus into the holding
strategy. In order to have even headways on both sides, the
holding criterion is based on the average headway:
( ( ) ( )
) (
)
(3)
Where is the last stop that was visited by bus trip
and is the scheduled riding time between stops
and . The fraction in the first expression is the average
between the known headway from the preceding bus and the
predicted headway from the following one. Applying this
control strategy at origin terminals in a simulation model of
urban rail operations was found promising [9]. AVL systems
allow implementing this strategy also at intermediate stops
along the bus route. Although this holding strategy is
independent of the planned headway, [10] analyzed the
performance of a similar adaptive control strategy based on
bus-to-bus communication and concluded that the deviation
from the schedule and the deviations of the headway are
small and bounded under realistic assumptions.
In addition, it is possible to combine the two headway-based
strategies (2) and (3) in order to restrict the maximum
allowable holding time:
( (
) ) (4)
IV. CASE STUDY
A. Bus line description
The transit simulator is applied to a case study to evaluate
the operations of line 51 in the Tel Aviv metropolitan area in
Israel, under various candidate holding strategies. This high
demand urban line connects a dense satellite residential city
to the CBD. Its 14 kilometer long route follows a heavily
congested urban arterial. The line includes 30 stops on the
inbound direction and 33 on the outbound direction. The
scheduled headway during the peak period is 8 minutes and
the average running time is 49 minutes inbound and 41
minutes outbound. In the case study running times between
stops were assumed to follow lognormal distributions, with
means equal to the scheduled times. At both trip ends,
recovery times were calculated based on the 85th
percentile
of the trip travel times, calculated according to the
lognormal distribution [11]. These recovery times were then
used as minimum requirements in determining the trip
assignment for each bus vehicle, while the layover times are
already integrated into the scheduled times.
B. Experiment
In the case study four holding strategies defined by
expressions (1) to (4) in addition to the base case scenario
with no control strategy were studied. The number and
location of time points, as well as the slack size or threshold
headway ratio, are determined according to common values
and methods in the literature. In order to maintain
comparable settings, the same number and location of time
points were used with all strategies. Applying the rule of
locating time point stops at the beginning of a sequence of
high demand stops on line 51 boarding profiles, three time
point stops (7, 13 and 21) were defined on the inbound route
and two on the outbound route (8 and 20). While
dispatching from the origin terminal is determined by the
schedule and vehicle availability, the second stop on each
direction was defined as a time point stop in order to
regulate the service from the beginning of the trip.
After the number and location of time-points are set, the
holding criteria parameter values have to be defined.
Schedule-based holding is simulated with a slack size of
zero, which implies that the bus does not depart from time
point stop before its scheduled time. In order to examine the
sensitivity of the results to the threshold ratio parameter
value, the holding strategy defined by (2) was simulated
with three levels of threshold ratio: 0.6, 0.7 and 0.8,
following recommended values from previous studies.
In summary, seven scenarios were evaluated, as follows: No
control (strategy 0); Schedule-based control (strategy 1);
Headway-based control based on the preceding bus (strategy
2 with three values of ); Headway-based control based on
the mean of the headway from the preceding and the
expected headway to the next bus (strategy 3); Combination
of strategies 2 and 3 (strategy 4 with ).
The simulations were conducted for the peak period
between 6:30AM and 9:30AM with flat peak hour passenger
demand and headway of 6 minutes for the inbound direction
and 7 minutes for the outbound direction. For each scenario
60 three-hour simulation runs were conducted. This number
of replications results in an allowable error of less than 5%
for the outbound route and less than 10% for the inbound
route for the standard deviation of the headway which is the
outcome of a complex interaction between all random
processes in the system. It should be noted that different
applications or output measures require different number of
replications, depending on the desired level of accuracy. The
total execution time for the 60 runs was about 10 seconds on
a PC with a Pentium 4, 2.26 GHz, 1.85 GB RAM running
windows XP. The reported results are the average of the 60
replications for each scenario.
C. Results
The detailed representation of the bus operations in the
simulation model allows analyzing the system performance
ranging from the level of a single trip or a specific stop to
overall system performance measures.
Figure 1 presents the coefficient of variation of the headway
along the inbound direction for the peak hour (7:30AM-
8:30AM). The time point stops are marked with vertical
dashed lines. As the distance from the origin terminal grows,
the variability accumulates and causes the propagation of
bus service unreliability. This result is consistent with the
findings in empirical studies [12]. It is evident that under
headway-based holding strategies there is an immediate
decrease in the coefficient of variation of the headway after
each time point stop, preventing the continuous propagation
of headway variability. Moreover, mean-headway strategies
(s=3 and s=4) are the most efficient in reducing headway
coefficient of variation. The second time point (stop 7) is
especially useful as it corrects irregular dispatching from the
origin terminal, when the information from the next bus
becomes available. For the preceding-headway strategy
(strategy 2), = 0.7 yields the highest reduction. As the
schedule-based strategy is designed to improve schedule
adherence objectives, it is not surprising that is inefficient
when it comes to regulating headways and is displayed only
for completeness.
Figure 1: Coefficient of variation of the headway
under various control strategies (inbound direction)
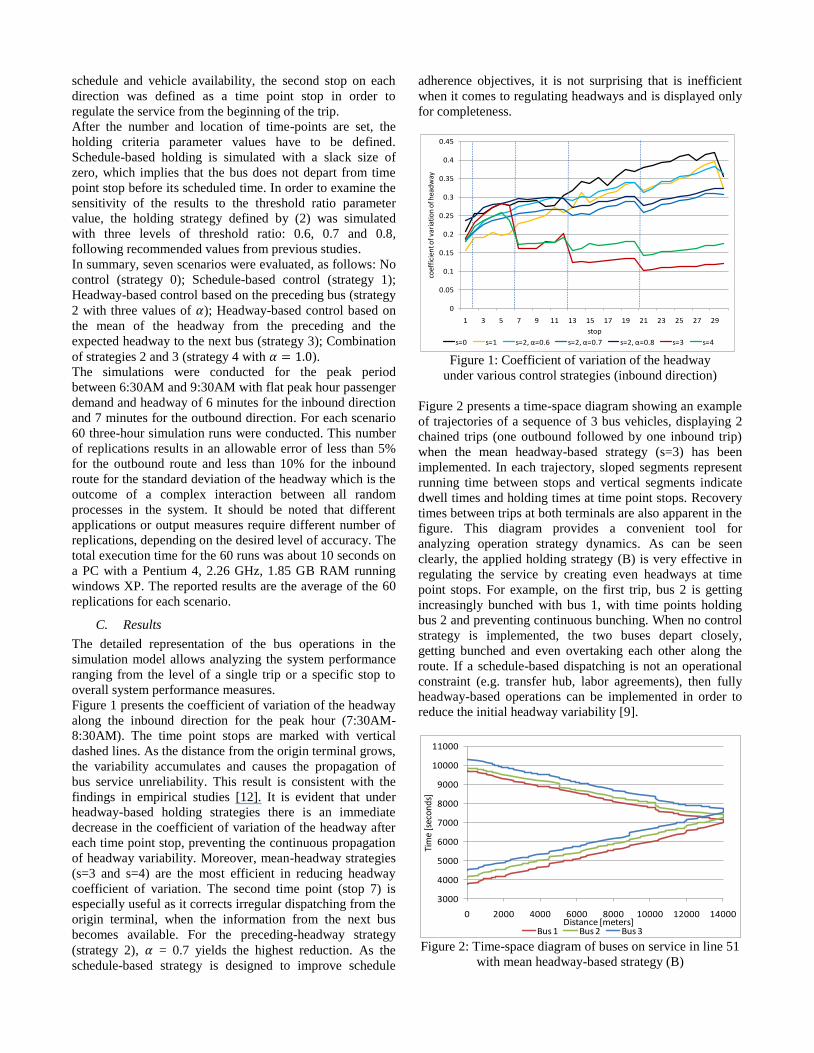
Figure 2 presents a time-space diagram showing an example
of trajectories of a sequence of 3 bus vehicles, displaying 2
chained trips (one outbound followed by one inbound trip)
when the mean headway-based strategy (s=3) has been
implemented. In each trajectory, sloped segments represent
running time between stops and vertical segments indicate
dwell times and holding times at time point stops. Recovery
times between trips at both terminals are also apparent in the
figure. This diagram provides a convenient tool for
analyzing operation strategy dynamics. As can be seen
clearly, the applied holding strategy (B) is very effective in
regulating the service by creating even headways at time
point stops. For example, on the first trip, bus 2 is getting
increasingly bunched with bus 1, with time points holding
bus 2 and preventing continuous bunching. When no control
strategy is implemented, the two buses depart closely,
getting bunched and even overtaking each other along the
route. If a schedule-based dispatching is not an operational
constraint (e.g. transfer hub, labor agreements), then fully
headway-based operations can be implemented in order to
reduce the initial headway variability [9].
Figure 2: Time-space diagram of buses on service in line 51
with mean headway-based strategy (B)
0
0.05
0.1
0.15
0.2
0.25
0.3
0.35
0.4
0.45
1 3 5 7 9 11 13 15 17 19 21 23 25 27 29
coef
fici
ent o
f va
riat
ion
of h
ead
way
stop
s=0 s=1 s=2, α=0.6 s=2, α=0.7 s=2, α=0.8 s=3 s=4
3000
4000
5000
6000
7000
8000
9000
10000
11000
0 2000 4000 6000 8000 10000 12000 14000
Tim
e [s
econ
ds]
Distance [meters]Bus 1 Bus 2 Bus 3

Cats O., Burghout W., Toledo T. and Koutsopoulos H.N. (2010). Evaluation of Real-Time Holding Strategies for Improved Bus Service Reliability. IEEE conference on Intelligent Transportation Systems, Proceedings, ITSC, Portugal, 718-723.
At the system level, several measures of performance were
calculated for each scenario. Table 1 summarizes these
measures for the inbound direction. While there is no
obvious relationship between schedule adherence and
service headway, the probability to adhere to the planned
headway decreases for shorter headways [12]. The
variability of headways is the main measure for evaluating
transit reliability, in particular for short-headway services,
when bus bunching occurs. Headway coefficient of variation
was calculated for each stop along the route. The reported
statistics are the mean values across all stops in each
direction. Note that the average headway during the entire
simulated peak period is constant as the number of
dispatched buses does not change. Headway-based holding
strategies reduced headway variability, resulting in shorter
passenger waiting times, but they also imply an increase in
total travel time which may impose higher operational costs.
The coefficient of variation decreases up to 20% under the
preceding-headway strategies and more than 45% when the
mean-headway strategy restricted by the planned headway
(s=4) was implemented. The mean-headway strategy (s=3)
results in service regularity gains at the cost of significant
increase in travel time. However, imposing a limit on
holding time for this information demanding mean-headway
strategy (s=4), achieved the highest improvement in service
reliability, with a moderate increase in travel time that is not
higher than the preceding-headway strategy (s=2).
Another important measure of service reliability is on-time
performance. For a scheduled headway of six minutes, a bus
is considered in this study to adhere to schedule in the peak
hour at a specific stop, if it arrives between one minute early
and three minutes late compared to its scheduled arrival [e.g.
13]. Due to the small share of early arrivals, the schedule-
based strategy (s=1) did not improve substantially the share
of on-time arrivals. Headway-based strategies may cause
systematic deviation from the schedule especially with
higher values of the headway ratio parameter ( ).
The evaluation of holding control strategies requires taking
into consideration their effect on several measures. On the
one hand, an effective holding strategy improves service
reliability by reducing headway variability or increasing
schedule adherence which result in shorter passenger
waiting times, more even crowding levels and lower fleet
costs due to layover considerations. On the other hand,
holding strategies may cause delays to passengers on-board
and longer travel times that may require higher fleet costs.
As expected, higher values of headway thresholds result in
both higher probability to trigger holding and longer holding
times. The majority of the buses are not held at stops in all
holding scenarios. The small portion of long holding times
(more than 2 minutes) under mean-headway strategy (s=3)
is eliminated by introducing an upper limit on the holding
time (s=4).Figure 3 summarizes the trade-off between the
decreased waiting time per passenger (y-axis) and the
average increase in in-vehicle time (x-axis) caused by the
implementation of holding control strategies. The dark
square denotes the no control strategy without any delay
caused by holding and the benchmark for waiting time,
assuming that passengers arrive randomly at stops. Such an
analysis can identify dominated alternatives – alternatives
that can be eliminated as they are worse than another
alternative in at least one performance measure and are not
better than it in any other performance measure. In our case,
none of the holding control strategies are dominated by the
no-control scenario. The mean-headway strategy (s=3) is
dominated by its restricted version (s=4) as it results in both
longer average passenger waiting times and riding times.
The schedule-based strategy (s=1) is also dominated by the
preceding-headway strategy with and .
Table 1: Service measures of performance for inbound
direction under various scenarios Scenario Measure of performance
S
CV
(h)
Av
era
ge
wa
itin
g t
ime
per
pa
ss.
(sec
) Av
era
ge
incr
ease
in
tota
l tr
av
el
tim
e (s
ec)
Ea
rly
arr
iva
ls (
%)
La
te
arr
iva
ls (
%)
On
-tim
e
arr
iva
ls (
%)
0 --- 0.34 200.43 0.00 0.44 29.44 70.12
1 --- 0.34 200.29 26.63 0.38 27.58 72.04
2 0.6 0.30 195.37 12.09 0.31 31.07 68.62
0.7 0.28 194.12 25.85 0.23 32.90 66.86
0.8 0.27 192.72 46.82 0.23 40.15 59.62
3 --- 0.23 188.97 79.70 0.22 41.36 58.41
4 1.0 0.18 185.14 44.78 0.24 37.95 61.81
Figure 3: Trade-off between delay and waiting time under
various holding strategies (inbound direction)
It is worth noting that in the case of longer headways, when
passengers arrive at stops according to the schedule and in
case of high importance for transfer coordination, a
schedule-based strategy that improves schedule adherence
will result in shorter waiting times. The preceding-headway
strategy together with the no control scenario and the
restricted mean-headway strategy compose the set of non-
dominated strategies in our analysis. As the threshold ratio
is set higher, there is a larger gain in terms of reduced
waiting time but also an increase in passenger delay due to
0
5
10
15
20
0 5 10 15 20 25 30 35
Ave
rage
red
uct
ion
in w
aiti
ng
tim
e p
er
pas
sen
ger
[sec
on
ds]
Average increase in passenger in-vehicle time caused by holding [seconds]
s=0 s=1 s=2, α=0.6 s=2, α=0.7 s=2, α=0.8 s=3 s=4

holding times. This relationship seems to have a linear
pattern within the recommended range of values. In order to
determine which alternative is the optimal strategy for a
specific case, it is common to compose a compensatory
function by defining the relative importance for each of the
different objectives. For example, if passenger waiting and
in-vehicle time are the only two relevant objectives, and
assuming the common ratio of 2 between their relative
importance (passenger waiting time is twice as important as
passenger in-vehicle time), all the non-dominated strategies
are beneficial. It is expected that with shorter headways, the
extra in-vehicle time is lower, making the holding strategies
even more efficient.
V. CONCLUSIONS
A simulation-based evaluation enables to analyze the effects
of real-time holding strategies on bus performance and level
of service by capturing the interactions between traffic
conditions, transit operations and passenger demand.
Several holding control strategies aimed to improve service
regularity were implemented in BusMezzo, a mesoscopic
transit simulation model. The simulation model represents
schedules, boarding and alighting processes, passengers left
behind, dwell time, layover and recovery time and trip
chaining. The holding strategies were applied on a real-
world high-demand line in the Tel Aviv metropolitan area.
All candidate holding strategies improved service regularity
substantially. In particular, an analysis of the results
suggests that a holding strategy based on the mean headway
from the preceding bus and the next bus, restricted by a
maximum allowable holding time, is especially efficient.
This strategy yields significant gains in terms of improved
service regularity and shorter passenger waiting times. In
addition, its narrower distribution of headways has the
potential to compensate for the increase in total travel time,
by requiring a smaller fleet size for carrying out the same
service frequency under a given layover policy.
Future work will focus on the implementation of additional
control strategies such as conditional transit signal priority,
expressing and short turns, enabling evaluation of
integrative control schemes. These control strategies will
allow compensating for delays caused by holding strategies
and have the potential to reduce late arrivals. Holding
strategies based on headway-based dispatching are also
subject for a future study. A detailed representation of
passenger demand draws an additional interesting direction
for future research as it would enable to capture the
interaction between transit operation strategies and
passenger route choice and to capture the role of missed
transfers.
REFERENCES
[1] Boxill, S.A. and L. Yu (2000). An evaluation of traffic simulation models for supporting ITS development. Center for Transportation
training and Research, Texas Southern University.
[2] Cats O., Burghout W., Toledo T. and Koutsopoulos H.N. (2010). Mesoscopic modelling of bus public transportation. Proceedings and
CD of the 89th Transportation Research Board (TRB) Annual Meeting,
Washington DC.
[3] TCRP (2003). Transit capacity and quality of service manual (TCQSM)
2nd edition. Transportation Research Board, TCRP Report 100,
Washington, DC.
[4] Abkowitz M. and Lepofsky M. (1990). Implementing headway-based
reliability control on transit routes. Journal of Transportation Engineering, 116 (1), 49-63.
[5] Abkowitz M. and Engelstein I. (1984). Methods for maintaining transit
service regularity. Transportation Research Record 961, 1-8. [6] Turnquist M.A. and S.W. Blume (1980). Evaluating potential
effectiveness of headway control strategies for transit systems.
Transportation Research Record 746, 25-29, Washington DC. [7] Eberlein X.J., Wilson N.H.M. and Bernstein D. (2001). The holding
problem with real-time information available. Transportation Science,
35(1), 1-18. [8] Strathman J.G, Dueker K.J., Kimpel T., Gerhart R., Turner K., Taylpr
P., Callas S., Griffin D. and J. Hopper (1999). Automated bus
dispatching, operations control and service reliability. Transportation Research Record 1666, pp. 28-36, Washington DC.
[9] Koutsopoulos H.N. and Z. Wang (2007). Simulation of urban rail
operations. Transportation Research Record, 2006, 84-91. [10] Daganzo C.F. (2009). A headway-based approach to eliminate bus
bunching: Systematic analysis and comparison. Transportation Research Part B, 43, 913-921.
[11] TCRP (1999). Data analysis for bus planning and monitoring.
Transportation Research Board, Synthesis of transit practice 34, Washington, DC.
[12] Chen X., Yu L., Zhang Y. and J. Guo (2009). Analyzing urban bus
reliability at the stop, route and network levels. Transportation Research Part A, 43, 722-734.
[13] SL – AB StorStockholms Lokaltrafik (2008). Annual Report 2008.
Available at: http://sl.se/upload/eng_text/uploads/annual_reports/SL_annual_report0
8.pdf