Evaluation of Methods for Estimation of Cyclic Stress-Strain ...
15
metals Article Evaluation of Methods for Estimation of Cyclic Stress-Strain Parameters from Monotonic Properties of Steels Tea Marohni´ c *, Robert Basan and Marina Franulovi´ c Faculty of Engineering, University of Rijeka, Vukovarska 58, HR-51000 Rijeka, Croatia; [email protected] (R.B.); [email protected] (M.F.) * Correspondence: [email protected]; Tel.: +385-51-651-536 Academic Editor: Filippo Berto Received: 11 November 2016; Accepted: 30 December 2016; Published: 7 January 2017 Abstract: Most existing methods for estimation of cyclic yield stress and cyclic Ramberg-Osgood stress-strain parameters of steels from their monotonic properties were developed on relatively modest number of material datasets and without considerations of the particularities of different steel subgroups formed according to their chemical composition (unalloyed, low-alloy, and high-alloy steels) or delivery, i.e., testing condition. Furthermore, some methods were evaluated using the same datasets that were used for their development. In this paper, a comprehensive statistical analysis and evaluation of existing estimation methods were performed using an independent set of experimental material data compriseding 116 steels. Results of performed statistical analyses reveal that statistically significant differences exist among unalloyed, low-alloy, and high-alloy steels regarding their cyclic yield stress and cyclic Ramberg-Osgood stress-strain parameters. Therefore, estimation methods were evaluated separately for mentioned steel subgroups in order to more precisely determine their applicability for the estimation of cyclic behavior of steels belonging to individual subgroups. Evaluations revealed that considering all steels as a single group results in averaging and that subgroups should be treated independently. Based on results of performed statistical analysis, guidelines are provided for identification and selection of suitable methods to be applied for the estimation of cyclic stress-strain parameters of steels. Keywords: estimation methods; monotonic properties; cyclic stress-strain parameters; Ramberg-Osgood; steel grouping; statistical analysis 1. Introduction Development of computer technology and CAE software solutions have enabled performing complex simulations of material and product behavior under cyclic loading and fatigue life determination already during early stages of product development process. In recent years, rapid increases in computing power and availability of distributed and cloud-based resources have been seen. Within short time frame, complex simulations can be run for multiple materials. An example of these are strain-based, i.e., local strain-life fatigue, analyses which have been widely adopted in automotive, aeronautic, and power industry for fatigue life predictions of highly-loaded steel and aluminium components [1,2]. In order to perform these analyses, both cyclic stress-strain and strain-life fatigue curves and parameters that define them must be known. Well-accepted and widely used representation of stress-strain response of the majority of metallic materials is the cyclic Ramberg-Osgood (R-O) equation [3,4]: Δε 2 = Δε e 2 + Δε p 2 = Δσ 2E + Δσ 2K 0 1 n 0 (1) Metals 2017, 7, 17; doi:10.3390/met7010017 www.mdpi.com/journal/metals
-
Upload
khangminh22 -
Category
Documents
-
view
2 -
download
0
Transcript of Evaluation of Methods for Estimation of Cyclic Stress-Strain ...
metals
Article
Evaluation of Methods for Estimation of CyclicStress-Strain Parameters from MonotonicProperties of Steels
Tea Marohnic *, Robert Basan and Marina Franulovic
Faculty of Engineering, University of Rijeka, Vukovarska 58, HR-51000 Rijeka, Croatia;[email protected] (R.B.); [email protected] (M.F.)* Correspondence: [email protected]; Tel.: +385-51-651-536
Academic Editor: Filippo BertoReceived: 11 November 2016; Accepted: 30 December 2016; Published: 7 January 2017
Abstract: Most existing methods for estimation of cyclic yield stress and cyclic Ramberg-Osgoodstress-strain parameters of steels from their monotonic properties were developed on relativelymodest number of material datasets and without considerations of the particularities of different steelsubgroups formed according to their chemical composition (unalloyed, low-alloy, and high-alloysteels) or delivery, i.e., testing condition. Furthermore, some methods were evaluated using thesame datasets that were used for their development. In this paper, a comprehensive statisticalanalysis and evaluation of existing estimation methods were performed using an independent setof experimental material data compriseding 116 steels. Results of performed statistical analysesreveal that statistically significant differences exist among unalloyed, low-alloy, and high-alloy steelsregarding their cyclic yield stress and cyclic Ramberg-Osgood stress-strain parameters. Therefore,estimation methods were evaluated separately for mentioned steel subgroups in order to moreprecisely determine their applicability for the estimation of cyclic behavior of steels belonging toindividual subgroups. Evaluations revealed that considering all steels as a single group resultsin averaging and that subgroups should be treated independently. Based on results of performedstatistical analysis, guidelines are provided for identification and selection of suitable methods to beapplied for the estimation of cyclic stress-strain parameters of steels.
Keywords: estimation methods; monotonic properties; cyclic stress-strain parameters; Ramberg-Osgood;steel grouping; statistical analysis
1. Introduction
Development of computer technology and CAE software solutions have enabled performingcomplex simulations of material and product behavior under cyclic loading and fatigue lifedetermination already during early stages of product development process. In recent years, rapidincreases in computing power and availability of distributed and cloud-based resources have been seen.Within short time frame, complex simulations can be run for multiple materials. An example of theseare strain-based, i.e., local strain-life fatigue, analyses which have been widely adopted in automotive,aeronautic, and power industry for fatigue life predictions of highly-loaded steel and aluminiumcomponents [1,2]. In order to perform these analyses, both cyclic stress-strain and strain-life fatiguecurves and parameters that define them must be known. Well-accepted and widely used representationof stress-strain response of the majority of metallic materials is the cyclic Ramberg-Osgood (R-O)equation [3,4]:
∆ε2
=∆εe
2+
∆εp
2=
∆σ2E
+
(∆σ2K′
) 1n′
(1)
Metals 2017, 7, 17; doi:10.3390/met7010017 www.mdpi.com/journal/metals
Metals 2017, 7, 17 2 of 15
For determination of lifetime in both low-cycle and high-cycle regime, Coffin-Manson-Basquin(C-M-B) [4,5] approach is applied:
∆ε2
=∆εe
2+
∆εp
2=σ′fE(2Nf)
b + ε′f(2Nf)c (2)
In Equations (1) and (2) ∆ε, ∆εe and ∆εp are true total, elastic and plastic strain ranges, respectively,∆σ is true stress range, E is Young’s modulus, K′ is cyclic strength coefficient, and n′ is cyclic strainhardening exponent. Furthermore, σf
′, εf′, b and c are fatigue strength and ductility parameters
obtained from fully reversed tension-compression fatigue tests.Cyclic R-O and C-M-B parameters obtained through material testing are most accurate, but are
very often unavailable due to long time and high costs associated with experimental characterization.Existing test results which are available in literature and materials databases often do not sufficientlycorrespond to the actual material under consideration. Hence, it has become common practiceto estimate cyclic R-O and C-M-B parameters of the material from its monotonic properties earlyduring product development. For estimation of C-M-B fatigue parameters from monotonic propertiesof materials, many methods have been developed [5–8] and evaluated in literature [9]. To thecontrary, for estimation of cyclic R-O parameters of materials, only a limited number of methodsare proposed [10–13]. For estimations of cyclic yield stress Re
′ and R-O parameters (K′ and n′) variousmonotonic properties and their combinations are used, with ultimate strength Rm and yield stress Re
being the most common since they are readily available. Detailed overview of monotonic propertiesused for estimation of cyclic parameters of metallic materials and systematic study of their relevancefor estimation purposes is provided in [14].
No independent and systematic evaluations of these methods can be found in the literature, theonly ones available being those performed in respective papers where methods were proposed.
The main aim of this paper is to provide detailed analysis and evaluation of existing methodsfor estimation of cyclic yield stress Re
′ and cyclic stress-strain parameters K′ and n′ from monotonicproperties. For this purpose, a large and independent set of material data was collected from relevantsources. Since previous investigations [15–17] confirmed that dividing steels into different subgroupsmight improve estimation accuracy, this will also be taken into consideration. One-way Analysis ofVariance (one-way ANOVA) and post hoc Tukey’s test will be performed in order to check whetherindividual steel groups are statistically different regarding their cyclic parameters Re
′, K′ and n′. If suchdifferences are confirmed to exist, in addition to evaluation of existing methods for all steels together,partial evaluations for each steel subgroup will be performed as well.
2. Overview of Existing Methods for Estimation of Cyclic Stress-Strain Parameters
2.1. Methods for Estimation of Cyclic Yield Stress Re′
Li et al. [11] originally proposed estimation of cyclic yield stress Re′ of steels from ultimate strength
Rm and reduction of area at fracture RA. Equation (3) was developed using monotonic and cyclicproperties of 27, mostly unalloyed and low-alloy steels:
R′e = (1 + RA)Rm
(− 0.002
ln(1− RA)
)0.16(3)
Evaluation of proposed expression is performed on the same data used for developing the method,and is reported that estimated values of Re
′ deviate at most 14% from their experimental counterparts.Lopez and Fatemi [12] developed a number of relationships between Brinell hardness (HB or
monotonic properties and cyclic yield stress Re′ of steels. These were developed and validated on
a relatively large number of steels consisting mostly of unalloyed and low-alloy steels, covering a widevariation of chemical composition and mechanical properties, with ultimate stress Rm ranging from279 to 2450 MPa and hardness from 80 to 595 HB. Materials were divided according to ultimate
Metals 2017, 7, 17 3 of 15
strength to yield stress ratio Rm/Re, since it was shown that such division improves the accuracy ofcyclic parameters estimation. Ratio Rm/Re was originally proposed by Smith et al. [18] to be used forprediction of cyclic behavior (hardening, softening, stable behavior) of materials. Correspondingly,authors proposed a number of separate expressions for estimation of Re
′ depending on value of Rm/Re
of which the most successful ones are:
R′e = 0.75Re + 82 for Rm/Re > 1.2 (4a)
R′e = 3.0× 10⁻⁴R2e − 0.15Re + 526 for Rm/Re ≤ 1.2 (4b)
Additionally, single expression for all steels, regardless of the value of Rm/Re is also proposed:
R′e = 8.0× 10⁻⁵R2m + 0.54Rm. (5)
Values of coefficient of determination R2 for expressions (4a), (4b) and (5) were 0.88, 0.99, and0.94 respectively. Evaluation was performed on a single dataset comprising data used for developingexpressions and additional data (all together 121 materials, mostly unalloyed and low-alloy steels).It was established that 84% of estimated values of Re
′ from yield stress Re (Equations (4a) and (4b))deviate up to ±20% from experimental values while 79% of values of Re
′ estimated from ultimatestrength Rm (Equation (5)) deviated up to ±20% from experimental values.
Motivated by findings from [12] that Equation (3) always underestimates cyclic yield stress Re′
when experimental value of Re′ exceeds 900 MPa, Li et al. [13] recently modified Equation (3) to:
R′e = 0.089(1 + RA)1.35Rm1.35 ×
(− 0.002
ln(1− RA)
)0.216+ 120 (6)
resulting in rather high coefficient of determination R2 = 0.961. Analysis was performed on the majorityof data used in [12]. For evaluation, data used for developing Equation (6) was complemented withadditional data. Results showed that most values of Re
′ estimated from Equation (6) deviate up to 20%from their experiment-based counterparts. It must be noted that [11] and [13] suggest that values oftrue fracture strength σf can be calculated using the expression:
σf = Rm(1 + RA) (7)
which is recognizable as first part of Equations (3) and (6). However, a well-known approximation of therelationship between ultimate strength Rm and true fracture stress σf, recommended by Manson [5,9] is:
σf = Rm(1 + εf) (8)
Therefore, caution is advised when applying expressions (3) and (6) for estimation of not onlycyclic yield stress Re
′, but also cyclic parameters K′ and n′ that will be discussed later in Section 2.2.
2.2. Methods for Estimation of Cyclic Parameters K′and n′
Zhang et al. [10] proposed several equations for estimation of K′ and n′ based on 22 steels,aluminium (Al), and titanium (Ti) alloys. For this purpose, materials were divided by value ofso-called new fracture ductility parameter α:
αf = RA× εf = −RA ln(1− RA) (9)
proposed in [19]. Expressions were proposed for estimation of K′ and n′, Equation (10) throughEquation (11c), when strength coefficient K and strain hardening exponent n are available:
K′ = 57K0.545 − 1220 (10)
Metals 2017, 7, 17 4 of 15
n′ = 1.06n(
1 + β∣∣∣∣1− Rm
Rp0.2
∣∣∣∣) for α < 5% or 10% ≤ α < 20% (11a)
n′ = 1.06n(
1 + β∣∣∣∣1− σf
Rm
∣∣∣∣) for 5% < α < 10% (11b)
n′ =Rp0.2
σf − Rmn for α > 20% (11c)
and Equation (12a) through Equation (13c) when K and n are not available:
K′ = 57
σfεf−
log (Rm2σf
3
Rp0.25 )
3 log(500εf)
0.545
− 1220 for α < 5% or 10% ≤ α < 20% (12a)
K′ = 57
σfRp0.2
Rmεf
−log (
σf2
Rp0.2Rm)
2 log(500εf)
0.545
− 1220 for 5% < α < 10% or α > 20% (12b)
n′ = 1.06(
1 + β∣∣∣∣1− Rm
Rp0.2
∣∣∣∣) log(
Rm2σf
3
Rp0.25
)3 log(500εf)
for α < 5% or 10% ≤ α < 20% (13a)
n′ = 1.06(
1 + β∣∣∣∣1− σf
Rm
∣∣∣∣) log(
σf2
Rp0.2Rm
)2 log(500εf)
for 5% < α < 10% (13b)
n′ =Rp0.2
σf − Rm
log(
σf2
Rp0.2Rm
)2 log(500εf)
for α > 20% (13c)
For both methods, parameter β = 1 for σf/Rp0.2 < 1.6 and β = −1 for σf/Rp0.2 > 1.6. As mostsuccessful expressions authors proposed estimation of K′ based on strength coefficient K (Equation (10))and estimation of n′ based on ultimate strength Rm, yield stress Re, true fracture stress σf and strainhardening exponent n (Equation (13a) through Equation (13c), depending on value of α). For steels,values of K′ and n′ estimated in such a way deviated up to 27% and 34%, respectively, from theirexperiment-based counterparts. Data tables with percentage deviation for aluminium and titaniumalloys suggest even larger deviations of estimates of n′ (up to 65%). They also suggested that, forstress amplitudes ∆σ/2 calculated from estimated values of K′ and n′, besides percentage deviation ofparticular parameter, sign of deviation is also significant. If sign of deviations of K′ and n′ is the same,calculated and experimental cyclic stress-strain curves are in good agreement.
In [12], besides expressions for estimation of Re′, Lopez and Fatemi developed several
relationships between Brinell hardness HB or monotonic properties and cyclic parameters K′ and n′
of steels. Steels are divided into two subgroups according to the value of the Rm/Re ratio (as wasthe case for estimation of cyclic yield stress Re
′) and different expressions are proposed accordingly.Equations (14a) and (14b) are denoted as most successful:
K′ = 1.16Rm + 593 for Rm/Re > 1.2 (14a)
K′ = 3.0 · 10−4R2m + 0.23Rm + 619 for Rm/Re ≤ 1.2 (14b)
n′ = −0.37 log(
0.75Re + 821.16Rm + 593
)for Rm/Re > 1.2 (15a)
n′ = −0.37 log(
3.0× 10⁻⁴R2e − 0.15Re + 526
3.0× 10⁻⁴R2m + 0.23Rm + 619
)for Rm/Re ≤ 1.2 (15b)
Metals 2017, 7, 17 5 of 15
Authors provided coefficients of determination R2 only for expressions (14a) and (14b). It is worthnoting that R2 of expressions proposed for estimation of K′ for steels with Rm/Re > 1.2 is 0.75 which issignificantly lower than 0.90 obtained for steels with Rm/Re ≤ 1.2. About 73% values of K′ estimatedusing Equations (14a) and (14b) deviate less than ±20% from their experimental values. As for n′,percentage of values estimated from Equations (15a) and (15b) that deviate less than ±20% from theirexperiment-based counterparts is around 60%.
Lopez and Fatemi [12] proposed additional expression for estimation of n′ valid for all steels:
n′ = −0.33(Re/Rm) + 0.40 (16)
for which R2 obtained was 0.79. Percentage of values of n′ estimated from Equation (16) that deviatedup to ±20% from experimental values was 68%.
Both methods proposed in [12] for estimation of n′ provide reasonably good results, so in furtherevaluations in this paper, both methods will be taken into account: first using Equation (14a) throughEquation (15b), and second using Equations (14a), (14b) and (16).
Li et al. [13] proposed expressions for estimation of cyclic parameters K′ and n′:
K′ = 500n′R′e (17)
n′ =log(K′)− log(R′e)
log 500(18)
where Re′ is estimated using Equation (6). However, Equations (17) and (18) can be used only when
either K′ or n′ are available, so in the same paper an alternative method for estimation of theseparameters was proposed. Cyclic strength coefficient K′ should be estimated using Equations (19a),(19b) or (19c) first, then cyclic strain hardening n′ exponent is calculated from estimated values of K′.
K′ = 2.16 · 10−4(Rm)2.1 + 738 for Rm/Re ≤ 1.2 (19a)
K′ = 3.63 · 10−4(Rm)2 + 0.68Rm + 570 for 1.2 < Rm/Re < 1.4 (19b)
K′ = 1.21Rm + 555 for Rm/Re ≥ 1.4 (19c)
Equation (19a) through Equation (19c), when used in combination with Equation (18), yieldedreasonable results with most of estimated values of K′ deviating up to ±20% from experimental values.Obtained coefficients of determination R2 for Equation (19a) through Equation (19c) decrease withhigher values of Rm/Re, which is in accordance with findings from [12]. R2 obtained for steels withRm/Re ≤ 1.2 is 0.921, while for steels with 1.2 < Rm/Re < 1.4 and Rm/Re ≥ 1.4 coefficients of determinationare R2 = 0.813 and R2 = 0.712, respectively. Again, caution is advised when using Equation (18) due tothe suggested way of estimating Re
′ that was already discussed at the end of Section 2.1.
2.3. Conclusions
A review of methods for estimation cyclic parameters shows that sets of material data onwhich most of them were developed and evaluated differ significantly regarding their size andmaterial groups included. In this sense, they can still be considered adequate with the exception ofexpressions for estimation of K′ and n′ proposed in [10] which were developed using a quite smalland heterogeneous set of material data (22 datasets for steels, aluminium and titanium alloys) andexpression for estimation of Re
′ proposed in [10] which was developed using only 27 steel datasets.In an attempt to further improve estimation accuracy, most methods address steels separately from
other kinds of metallic materials [11–13] and all methods divide materials into separate subgroupsusing different criteria [10,12,13]. For this purpose, Zhang et al. [10] used new fracture ductilityparameter α that was originally developed to predict materials’ cyclic behavior [10,19]. Lopez and
Metals 2017, 7, 17 6 of 15
Fatemi [12] and Li et al. [13] divided steels into two, i.e., three subgroups according to the ratio ofultimate strength to yield stress Rm/Re.
Lack of general consensus regarding the treatment of individual material subgroups as well asdifferent methodologies for evaluation of estimation methods implemented in their respective papersmakes comparison of their performance quite difficult. In order to determine which estimation methodis most suitable for estimation of cyclic parameters of steels, systematic and consistent evaluation ofpresented methods will be performed on an independent set of material data.
Different delivery, i.e., testing conditions of material, can be obtained for example through differentprocessing method or heat treatment and this can strongly impact both monotonic and cyclic/fatiguematerial properties and behavior [5,20]. This is an important aspect which none of the discussed methodstakes into account directly. One of the possible reasons is a multitude of conditions of steel materialswhich were used for development of these methods, particularly in [12,13]. For certain materials, suchinformation, even if available, was of a rather general nature (for example heat treated, modified, etc.).
In practice, steels are commonly divided according to the content of alloying elements intounalloyed, low-alloy and high-alloy steels. Already Baümel and Seeger [6] considered unalloyedand low-alloy steels separately from other metallic materials when they developed Uniform MaterialLaw for estimation of C-M-B parameters. Hatscher et al. [8] also mentioned the prospect of suchdivision for estimation of fatigue C-M-B parameters. Results of detailed analysis performed on a largenumber of material data done by Basan et al. [15] showed that there is statistically significant differenceamong individual C-M-B fatigue parameters as well as strain-life behavior (∆ε–2Nf relationships)of unalloyed, low-alloy and high-alloy steels. Also, preliminary investigations on cyclic parametersin [16,17] showed that dividing steels by alloying content could result in more accurate estimations ofcyclic parameters and hence, more accurate estimations of cyclic stress-strain curves of materials.
For that reason, statistical analysis of steel subgroups (unalloyed, low-alloy and high-alloysteels) will be performed in order to determine if their cyclic parameters differ significantly.If confirmed, individual steel subgroups will be taken into account during evaluation and comparisonof estimation methods.
3. Methods and Data
3.1. Methods for Statistical Analysis
To test whether statistically significant differences exist among experimental data for cyclic yieldstress Re
′ and cyclic stress-strain parameters K′ and n′ of unalloyed, low-alloy and high-alloy steels,one-way Analysis of Variance (one-way ANOVA) is performed. One-way ANOVA is a techniquethat provides a statistical test of whether or not means of several (typically three or more) groups areall equal. If results obtained by one-way ANOVA show that statistically significant difference existsbetween cyclic parameters of analyzed groups, post hoc analysis by Tukey’s multiple comparisonmethod will be performed in order to determine pairwise differences between groups. Significancelevel α for one-way ANOVA is set to 0.05, while overall significance (family error rate) in Tukey’smultiple comparison test is set to 0.05 to counter type I error for a series of comparisons. Procedurefor both one-way ANOVA and Tukey’s multiple comparison test are given in [21]. Statistical analyseswere performed in statistical package MINITAB [22].
To evaluate predictive accuracy of estimation methods and to facilitate their comparison,deviations of estimated values from their experimentally obtained counterparts were used as relevantindicators. Deviations up to ±10, ±20 and ±30% were used as in [12,13] to facilitate comparison withresults reported there. Instead of directly comparing estimated Ramberg-Osgood parameters K′ andn′ to their experiment-based counterparts as in [12,13], much more useful information regarding thepredictive accuracy of these methods can be obtained by comparing values of stress amplitudes ∆σ/2,i.e., points on cyclic stress-strain curves as in [10,16,17]. Therefore, values of stress amplitudes ∆σ/2
Metals 2017, 7, 17 7 of 15
were calculated using experimental values of K′ and n′ and their estimations for series of total strainamplitudes ∆ε/2: 0.1, 0.2, 1 and 2%.
3.2. Data to Be Analyzed
Experimental data for three representative groups of steels: unalloyed (UA), low-alloy (LA) andhigh-alloy (HA) steels from [6] and [23] were obtained through the MATDAT Materials PropertiesDatabase [24]. Only results of strain-controlled, fully reversed (R = −1) axial cyclic tests performed inthe air at room temperature were considered. Furthermore, only data for materials tested at more thanfour different strain amplitudes and at range of total strain amplitudes larger than 0.4% were used inthe analysis.
Only datasets that contained all experimental values of monotonic properties needed forestimation of cyclic parameters by each method were used. An exception was made with the high-alloysteel group. Since most datasets did not contain values of true fracture stress σf which is necessary forcalculation of parameters by Zhang et al. method [10], values were calculated by their relationshipbetween ultimate strength Rm and true fracture strain εf, according to Equation (8). Also, if a datasetcontained only reduction of area at fracture RA, true fracture strain εf was calculated by the relationshipbetween these two properties:
εf = − ln(1− RA) (20)
In total, 34 unalloyed steels, 47 low-alloy steels and 35 high-alloy steel datasets were availablefor analysis. Wide variety of conditions resulting from different processing and heat treatment werepresent in materials used for statistical analysis and evaluation of existing methods. This is consistentwith datasets used for development of methods in their respective papers.
Detailed material data are given in Appendix A in Tables A1–A3. Data used for statistical analysisin [14] were complemented with values of true fracture strain εf. Additionally, data for high-alloysteels were complemented with values of true fracture stress σf, strength coefficient K and strainhardening exponent n since those are required so that evaluations of particular existing methods couldbe performed.
4. Analysis and Results
4.1. Results of One-Way ANOVA and Tukey’s Multiple Comparison Test
Performing one-way ANOVA for three cyclic parameters (Re′, K′ and n′) of unalloyed, low-
and high-alloy steel subgroups showed that statistically significant differences exist between steelsubgroups regarding cyclic yield stress Re
′ (F(2, 113) = 32.25; p < 0.05), cyclic strength coefficient K′
(F(2, 113) = 22.61; p < 0.05), and cyclic strain hardening exponent n′ (F(2, 113) = 72.00; p < 0.05).Since steel subgroups were confirmed to be significantly different regarding their cyclic parameters
Re′, K′ and n′, post hoc Tukey’s test was performed to determine which subgroups are mutually
different. Results showed that unalloyed and low-alloy steels as well as low-alloy and high-alloy steelsdiffer significantly regarding the cyclic yield stress Re
′. No such difference was determined betweenunalloyed and high-alloy steels. Statistically significant difference was also found for cyclic strengthcoefficient K′ of unalloyed and high-alloy steels, as well as low-alloy and high-alloy steels, while nosuch difference was found between unalloyed and low-alloy steels. Cyclic strain hardening exponentn′ differs between pairs of all three groups.
4.2. Evaluation of Methods for Estimation of Cyclic Yield Stress Re′ and Ramberg-Osgood Parameters K′ and
n′ of Steels
Since unalloyed, low-alloy and high-alloy steels subgroups were proved to be significantlydifferent, steel subgroups will be considered separately for evaluation of estimation methods.Evaluation will also be made for all steels as a single group to check for differences between results of
Metals 2017, 7, 17 8 of 15
analyses performed on individual subgroups and to enable comparison and determination of potentialdiscrepancies with results reported in original papers.
Methods for estimation of cyclic yield stress Re′ and R-O parameters K′ and n′ of steels whose
predictive accuracy will be evaluated are listed in Table 1. For every material, expressions for estimationof cyclic yield stress Re
′ and R-O parameters K′ and n′ will be used according to ranges defining theapplicability of the models regarding criteria for grouping of materials in original papers (new fractureductility coefficient α, ultimate strength to yield stress ratio Rm/Re).
4.2.1. Evaluation of Methods for Estimation of Cyclic Yield Stress Re′
Percentages of values of Re′ estimated according to selected methods (Table 1) that deviate up to
10%, 20% and up to 30% from experiment-based values were calculated and are given in diagrams onFigure 1.
Table 1. Methods for estimation of Re′ and K′ and n′ which will be evaluated.
EvaluatedValue Method Estimated
Parameters Originally Proposed for EquationNumber
Re′
Lopez and Fatemi 1 [12] Re′ steels divided by Rm/Re (4a,b)
Lopez and Fatemi 2 [12] Re′ all steels (5)
Li et al. [13] Re′ all steels (6)
∆σ/2
Zhang et al. 1 [10](K and n available)
K′ steels, Al and Ti alloys (10)n′ steels, Al and Ti alloys divided by α (11a,b,c)
Zhang et al. 2 [10](K and n not available)
K′ steels, Al and Ti alloys divided by α (12a,b)n′ steels, Al and Ti alloys divided by α (13a,b,c)
Lopez and Fatemi 1 [12] K′ steels divided by Rm/Re (14a,b)n′ steels divided by Rm/Re (15a,b)
Lopez and Fatemi 2 [12] K′ steels divided by Rm/Re (14a,b)n′ all steels (16)
Li et al. [13]K′ steels divided by Rm/Re (19a,b,c)n′ steels divided by Rm/Re (18)
Metals 2017, 7, 17 8 of 15
estimation of cyclic yield stress Re′ and R-O parameters K′ and n′ will be used according to ranges
defining the applicability of the models regarding criteria for grouping of materials in original papers
(new fracture ductility coefficient α, ultimate strength to yield stress ratio Rm/Re).
4.2.1. Evaluation of Methods for Estimation of Cyclic Yield Stress Re′
Percentages of values of Re′ estimated according to selected methods (Table 1) that deviate up to
10%, 20% and up to 30% from experiment-based values were calculated and are given in diagrams
on Figure 1.
Table 1. Methods for estimation of Re′ and K′ and n′ which will be evaluated.
Evaluated
Value Method
Estimated
Parameters Originally Proposed for
Equation
Number
Re′
Lopez and Fatemi 1 [12] Re′ steels divided by Rm/Re (4a,b)
Lopez and Fatemi 2 [12] Re′ all steels (5)
Li et al. [13] Re′ all steels (6)
Δσ/2
Zhang et al. 1 [10]
(K and n available)
K′ steels, Al and Ti alloys (10)
n′ steels, Al and Ti alloys divided by α (11a,b,c)
Zhang et al. 2 [10]
(K and n not available)
K′ steels, Al and Ti alloys divided by α (12a,b)
n′ steels, Al and Ti alloys divided by α (13a,b,c)
Lopez and Fatemi 1 [12] K′ steels divided by Rm/Re (14a,b)
n′ steels divided by Rm/Re (15a,b)
Lopez and Fatemi 2 [12] K′ steels divided by Rm/Re (14a,b)
n′ all steels (16)
Li et al. [13] K′ steels divided by Rm/Re (19a,b,c)
n′ steels divided by Rm/Re (18)
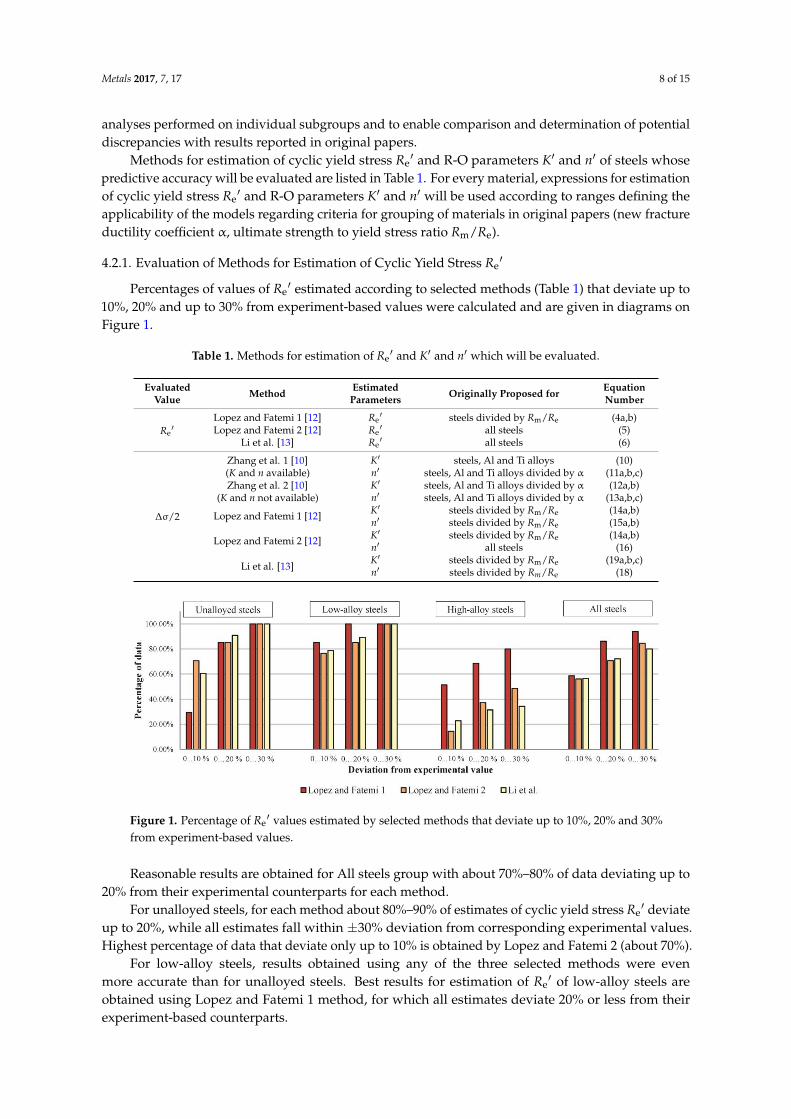
Figure 1. Percentage of Re′ values estimated by selected methods that deviate up to 10%, 20% and 30%
from experiment-based values.
Reasonable results are obtained for All steels group with about 70%–80% of data deviating up
to 20% from their experimental counterparts for each method.
For unalloyed steels, for each method about 80%–90% of estimates of cyclic yield stress Re′
deviate up to 20%, while all estimates fall within ±30% deviation from corresponding experimental
values. Highest percentage of data that deviate only up to 10% is obtained by Lopez and Fatemi 2
(about 70%).
For low-alloy steels, results obtained using any of the three selected methods were even more
accurate than for unalloyed steels. Best results for estimation of Re′ of low-alloy steels are obtained
using Lopez and Fatemi 1 method, for which all estimates deviate 20% or less from their experiment-
based counterparts.
Figure 1. Percentage of Re′ values estimated by selected methods that deviate up to 10%, 20% and 30%
from experiment-based values.
Reasonable results are obtained for All steels group with about 70%–80% of data deviating up to20% from their experimental counterparts for each method.
For unalloyed steels, for each method about 80%–90% of estimates of cyclic yield stress Re′ deviate
up to 20%, while all estimates fall within ±30% deviation from corresponding experimental values.Highest percentage of data that deviate only up to 10% is obtained by Lopez and Fatemi 2 (about 70%).
For low-alloy steels, results obtained using any of the three selected methods were evenmore accurate than for unalloyed steels. Best results for estimation of Re
′ of low-alloy steels areobtained using Lopez and Fatemi 1 method, for which all estimates deviate 20% or less from theirexperiment-based counterparts.
Metals 2017, 7, 17 9 of 15
As for high-alloy steels, no method proved to be sufficiently accurate. Lopez and Fatemi 1provides reasonable results with about 70% of estimated data deviating up to 20%, although 20% ofdata deviate more than 30% from experimental values. Estimations made by other two methods resultwith less than 50% of estimates deviating below 30% from experimental values (below 40% by Li et al.).
4.2.2. Evaluation of Methods for Estimation of Ramberg-Osgood Parameters K′ and n′ of Steels
As was explained in Section 3.1, accuracy of estimates of Ramberg-Osgood parameters K′ and n′
will be determined by evaluating values of stress amplitudes ∆σ/2 calculated using estimated K′ andn′ opposed to those obtained using experimental values of those parameters.
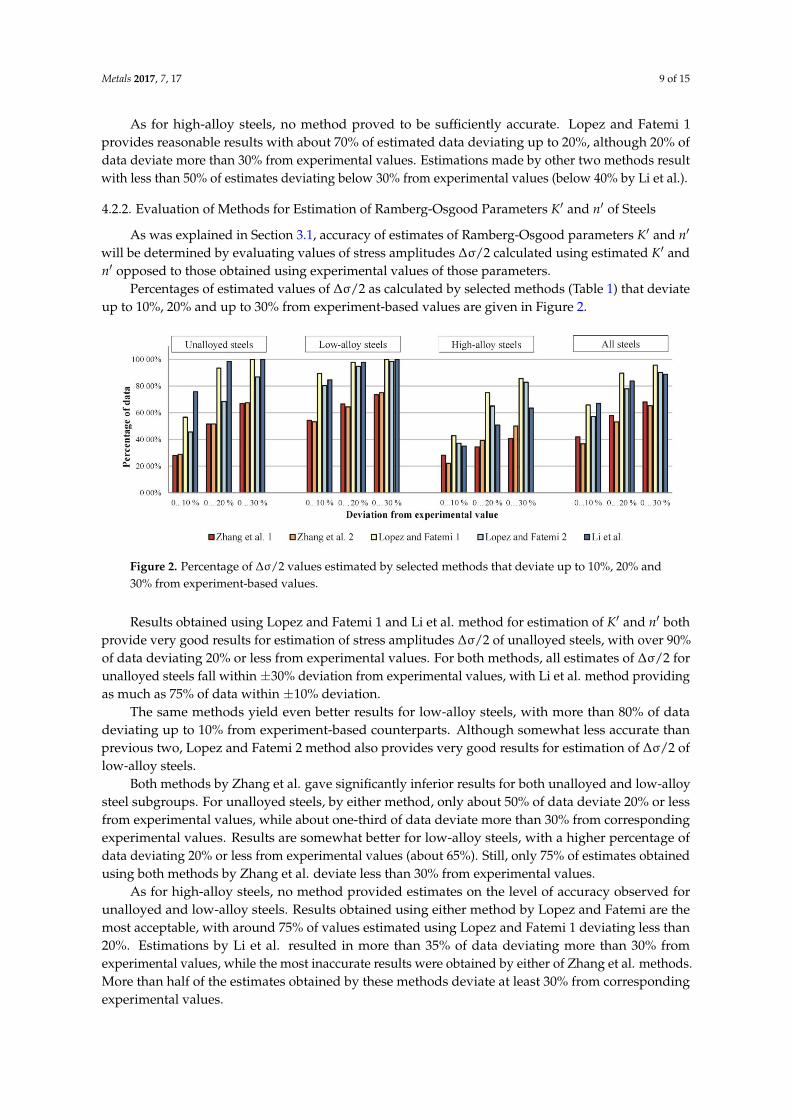
Percentages of estimated values of ∆σ/2 as calculated by selected methods (Table 1) that deviateup to 10%, 20% and up to 30% from experiment-based values are given in Figure 2.
Metals 2017, 7, 17 9 of 15
As for high-alloy steels, no method proved to be sufficiently accurate. Lopez and Fatemi 1
provides reasonable results with about 70% of estimated data deviating up to 20%, although 20% of
data deviate more than 30% from experimental values. Estimations made by other two methods
result with less than 50% of estimates deviating below 30% from experimental values (below 40% by
Li et al.).
4.2.2. Evaluation of Methods for Estimation of Ramberg-Osgood Parameters K′ and n′ of Steels
As was explained in Section 3.1, accuracy of estimates of Ramberg-Osgood parameters K′ and n′
will be determined by evaluating values of stress amplitudes Δσ/2 calculated using estimated K′ and
n′ opposed to those obtained using experimental values of those parameters.
Percentages of estimated values of Δσ/2 as calculated by selected methods (Table 1) that deviate
up to 10%, 20% and up to 30% from experiment-based values are given in Figure 2.
Figure 2. Percentage of Δσ/2 values estimated by selected methods that deviate up to 10%, 20% and
30% from experiment-based values.
Results obtained using Lopez and Fatemi 1 and Li et al. method for estimation of K′ and n′ both
provide very good results for estimation of stress amplitudes Δσ/2 of unalloyed steels, with over 90%
of data deviating 20% or less from experimental values. For both methods, all estimates of Δσ/2 for
unalloyed steels fall within ±30% deviation from experimental values, with Li et al. method providing
as much as 75% of data within ±10% deviation.
The same methods yield even better results for low-alloy steels, with more than 80% of data
deviating up to 10% from experiment-based counterparts. Although somewhat less accurate than
previous two, Lopez and Fatemi 2 method also provides very good results for estimation of Δσ/2 of
low-alloy steels.
Both methods by Zhang et al. gave significantly inferior results for both unalloyed and low-alloy
steel subgroups. For unalloyed steels, by either method, only about 50% of data deviate 20% or less
from experimental values, while about one-third of data deviate more than 30% from corresponding
experimental values. Results are somewhat better for low-alloy steels, with a higher percentage of
data deviating 20% or less from experimental values (about 65%). Still, only 75% of estimates obtained
using both methods by Zhang et al. deviate less than 30% from experimental values.
As for high-alloy steels, no method provided estimates on the level of accuracy observed for
unalloyed and low-alloy steels. Results obtained using either method by Lopez and Fatemi are the
most acceptable, with around 75% of values estimated using Lopez and Fatemi 1 deviating less than
20%. Estimations by Li et al. resulted in more than 35% of data deviating more than 30% from
experimental values, while the most inaccurate results were obtained by either of Zhang et al.
methods. More than half of the estimates obtained by these methods deviate at least 30% from
corresponding experimental values.
Figure 2. Percentage of ∆σ/2 values estimated by selected methods that deviate up to 10%, 20% and30% from experiment-based values.
Results obtained using Lopez and Fatemi 1 and Li et al. method for estimation of K′ and n′ bothprovide very good results for estimation of stress amplitudes ∆σ/2 of unalloyed steels, with over 90%of data deviating 20% or less from experimental values. For both methods, all estimates of ∆σ/2 forunalloyed steels fall within ±30% deviation from experimental values, with Li et al. method providingas much as 75% of data within ±10% deviation.
The same methods yield even better results for low-alloy steels, with more than 80% of datadeviating up to 10% from experiment-based counterparts. Although somewhat less accurate thanprevious two, Lopez and Fatemi 2 method also provides very good results for estimation of ∆σ/2 oflow-alloy steels.
Both methods by Zhang et al. gave significantly inferior results for both unalloyed and low-alloysteel subgroups. For unalloyed steels, by either method, only about 50% of data deviate 20% or lessfrom experimental values, while about one-third of data deviate more than 30% from correspondingexperimental values. Results are somewhat better for low-alloy steels, with a higher percentage ofdata deviating 20% or less from experimental values (about 65%). Still, only 75% of estimates obtainedusing both methods by Zhang et al. deviate less than 30% from experimental values.
As for high-alloy steels, no method provided estimates on the level of accuracy observed forunalloyed and low-alloy steels. Results obtained using either method by Lopez and Fatemi are themost acceptable, with around 75% of values estimated using Lopez and Fatemi 1 deviating less than20%. Estimations by Li et al. resulted in more than 35% of data deviating more than 30% fromexperimental values, while the most inaccurate results were obtained by either of Zhang et al. methods.More than half of the estimates obtained by these methods deviate at least 30% from correspondingexperimental values.
Metals 2017, 7, 17 10 of 15
Overall evaluation for all steels provided averaged results as was the case for estimates of Re′.
Lopez and Fatemi 1 method is the most accurate while both Zhang et al. methods are least successful,as was the case for individual steel subgroups.
5. Discussion
Estimation methods investigated in this paper were developed on datasets comprising allsteels [11–13], and even some other groups of metallic materials (steels, aluminium and titaniumalloys) [10]. However, in order to improve accuracy of estimations, most methods propose somecriterion for grouping of materials. In [12,13] authors divided steels by rather easily available Rm/Re
ratio. In [10], grouping criteria used was the new fracture ductility parameter α, which is cumbersometo use since true fracture stress εf or reduction of area RA needed for its calculation are often unavailable.
Much more usable, and often encountered in practice, is division of steels by their alloying contentinto unalloyed, low-alloy and high-alloy steels. It was shown in [6,8,15–17] that dividing steels in thismanner contributes to improvement of estimations of steel behavior from monotonic properties ofsteels. Results of analysis performed in Section 4.1 confirmed that statistically significant differencesexist between cyclic yield stress Re
′ and cyclic parameters K′ and n′ of mentioned group of steels.According to these findings, authors propose evaluation of existing methods for estimation of Re
′, K′
and n′ to be performed for each group individually, in addition to all steels together.For estimation of Re
′, K′ and n′ of both unalloyed and low-alloy steels, methods by Lopez andFatemi [12], and by Li et al. [13] provide very good results. However, estimations for high-alloy steelsare notably worse, especially those obtained using the Li et al. method which is not surprising since bothmethods are developed on the same set of data, consisting mostly of unalloyed and low-alloy steels.
Values of K′ and n′ estimated with two methods developed by Zhang et al. [10], are generallyunsatisfactory and provide poor results for all steel subgroups, especially high-alloy steels. This can beattributed to the fact that methods were developed on a modest number (22) of heterogeneous data(steels, aluminium and titanium alloys). Another drawback of methods proposed by Zhang et al. areintricate expressions requiring monotonic properties which are often unavailable, especially duringthe early stages of product development.
Evaluations of existing methods in original references are performed for all materials together.Also, in some cases, evaluation of existing methods is performed on the same sets of data that wereused for development of the method—a practice which can be considered less than objective.
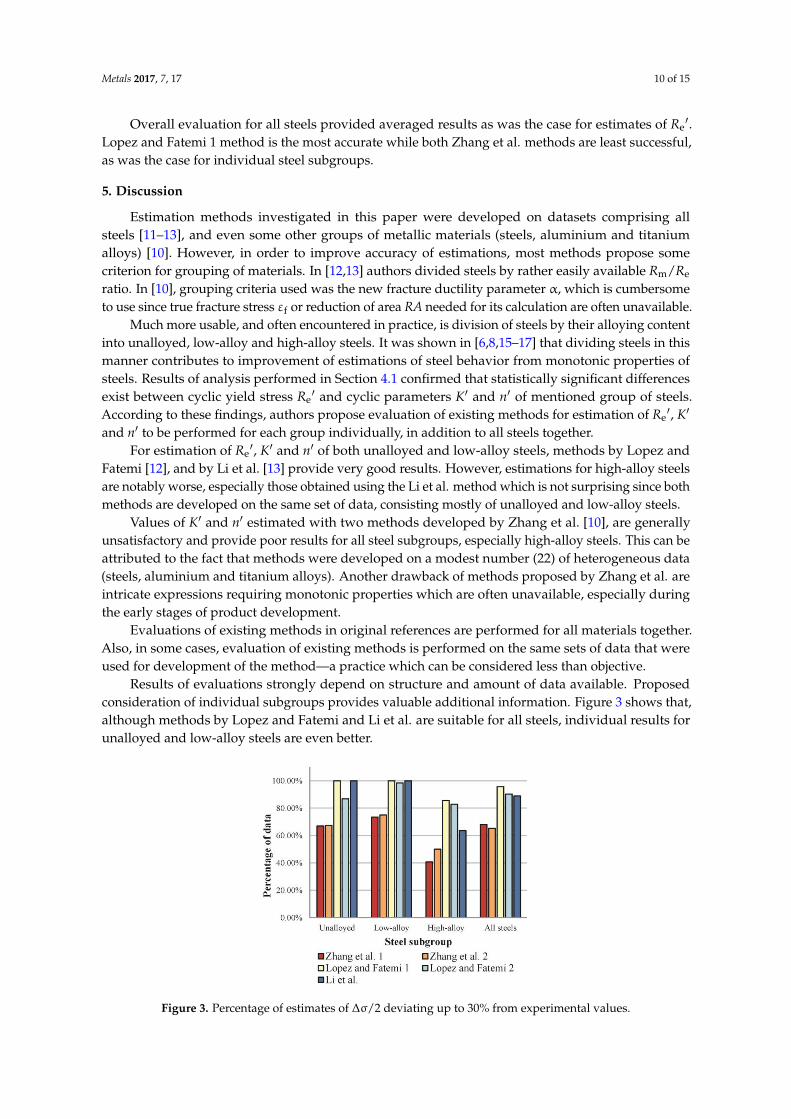
Results of evaluations strongly depend on structure and amount of data available. Proposedconsideration of individual subgroups provides valuable additional information. Figure 3 shows that,although methods by Lopez and Fatemi and Li et al. are suitable for all steels, individual results forunalloyed and low-alloy steels are even better.
Metals 2017, 7, 17 10 of 15
Overall evaluation for all steels provided averaged results as was the case for estimates of Re′.
Lopez and Fatemi 1 method is the most accurate while both Zhang et al. methods are least successful,
as was the case for individual steel subgroups.
5. Discussion
Estimation methods investigated in this paper were developed on datasets comprising all steels
[11–13], and even some other groups of metallic materials (steels, aluminium and titanium alloys)
[10]. However, in order to improve accuracy of estimations, most methods propose some criterion
for grouping of materials. In [12,13] authors divided steels by rather easily available Rm/Re ratio. In
[10], grouping criteria used was the new fracture ductility parameter α, which is cumbersome to use
since true fracture stress εf or reduction of area RA needed for its calculation are often unavailable.
Much more usable, and often encountered in practice, is division of steels by their alloying
content into unalloyed, low-alloy and high-alloy steels. It was shown in [6,8,15–17] that dividing
steels in this manner contributes to improvement of estimations of steel behavior from monotonic
properties of steels. Results of analysis performed in Section 4.1 confirmed that statistically significant
differences exist between cyclic yield stress Re′ and cyclic parameters K′ and n′ of mentioned group
of steels. According to these findings, authors propose evaluation of existing methods for estimation
of Re′, K′ and n′ to be performed for each group individually, in addition to all steels together.
For estimation of Re′, K′ and n′ of both unalloyed and low-alloy steels, methods by Lopez and
Fatemi [12], and by Li et al. [13] provide very good results. However, estimations for high-alloy steels
are notably worse, especially those obtained using the Li et al. method which is not surprising since
both methods are developed on the same set of data, consisting mostly of unalloyed and low-alloy
steels.
Values of K′ and n′ estimated with two methods developed by Zhang et al. [10], are generally
unsatisfactory and provide poor results for all steel subgroups, especially high-alloy steels. This can
be attributed to the fact that methods were developed on a modest number (22) of heterogeneous
data (steels, aluminium and titanium alloys). Another drawback of methods proposed by Zhang et
al. are intricate expressions requiring monotonic properties which are often unavailable, especially
during the early stages of product development.
Evaluations of existing methods in original references are performed for all materials together.
Also, in some cases, evaluation of existing methods is performed on the same sets of data that were
used for development of the method—a practice which can be considered less than objective.
Results of evaluations strongly depend on structure and amount of data available. Proposed
consideration of individual subgroups provides valuable additional information. Figure 3 shows
that, although methods by Lopez and Fatemi and Li et al. are suitable for all steels, individual results
for unalloyed and low-alloy steels are even better.
Figure 3. Percentage of estimates of Δσ/2 deviating up to 30% from experimental values. Figure 3. Percentage of estimates of ∆σ/2 deviating up to 30% from experimental values.
Metals 2017, 7, 17 11 of 15
As mentioned earlier, this was expected since the similar set of data, consisting of mostly unalloyedand low-alloy steels, was used in both papers. If only results for all steels group were observed,information about lower accuracy for high-alloy steels would go unnoticed, particularly for themethod by Li et al. This example shows how evaluations of estimation methods performed for allsteels together could be misinterpreted due to averaging.
Table 2 provides recommended methods for estimation of cyclic parameters of each groupof steels, noting that great care is advised when estimating cyclic parameters of high-alloy steels.Ordinal number preceding the method indicates suggested selection priority. In cases where multiplemethods are given without order simpler methods requiring a smaller number of monotonic properties(such as methods by Lopez and Fatemi) might be preferred.
Table 2. Recommended methods for estimation of cyclic yield stress Re′ and cyclic parameters K′ and
n′ of steels.
Steel Subgroup Estimation of Re′ Estimation of ∆σ/2 (K′, n′)
Unalloyed steels Li et al. 1. Li et al.Lopez and Fatemi 2 2. Lopez and Fatemi 1
Low-alloy steels1. Lopez and Fatemi 1 Lopez and Fatemi 1
2. Li et al. Lopez and Fatemi 23. Lopez and Fatemi 2 Li et al.
High-alloy steels Lopez and Fatemi 1 Lopez and Fatemi 1
6. Conclusions
Available methods for estimation of cyclic yield stress Re′ and cyclic stress-strain parameters K′
and n′ of steels and their applicability to individual steel subgroups and to steels as a general groupwere studied. A large, independent set of steel data was collected in order to perform the study asit was shown that number and type of materials used for development of estimation methods havesignificant influence on their performance and evaluation results.
Statistically significant differences were determined to exist among unalloyed, low-alloy andhigh-alloy steels regarding their cyclic stress-strain behavior and parameters. Such division of steelsbased on their content of alloying elements is also commonly encountered in practice, so it was usedfor performed evaluation of studied estimation methods.
Comparison of values of stress amplitudes ∆σ/2 calculated using experimental and estimatedcyclic parameters (K′ and n′) is proposed as a more suitable criterion for evaluation instead of directcomparison of corresponding individual cyclic parameters Re
′, K′ and n′.Having all steels in a single group for evaluation purposes causes significant averaging of the
results so unalloyed, low-alloy and high-alloy steels were treated separately. Considerable differenceswere determined in accuracy and applicability of different methods for different steel subgroups.
For estimations of Re′ of unalloyed and low-alloy steels methods proposed by Li et al. and
Lopez and Fatemi were found to provide very good results, while for high-alloy steels, only themethod dividing steels by Re/Rm ratio proposed by Lopez and Fatemi provides reasonably accurateestimates. The method for estimations of K′ and n′ of unalloyed steels proposed by Li et al. gives thebest estimates followed closely by the Lopez and Fatemi method which considers the Re/Rm ratio.For low-alloy steels, both methods by Lopez and Fatemi and the method by Li et al. provide excellentresults. Of all methods, only the method proposed by Lopez and Fatemi considering the Re/Rm ratiocan be considered for use with the high-alloy steels group.
Estimation accuracy of all studied methods for Re′, K′ and n′ was notably lower for high-alloy
steels in comparison to other two subgroups, which can be attributed to the fact that high-alloy steelswere found to be underrepresented in material datasets used for development of estimation methods.
Metals 2017, 7, 17 12 of 15
Acknowledgments: This work has been supported in part by the University of Rijeka (projects number 13.09.1.2.09and 13.09.2.2.18) and Croatian Science Foundation (scientific project number IP-2014-09-4982).
Author Contributions: R.B. and T.M. conceived and formulated the research; R.B., T.M. and M.F. acquired andsystematized the material data, T.M. systematized and reviewed the estimation methods; T.M. designed andperformed statistical analysis; T.M. and R.B., with the support of M.F., evaluated and interpreted estimationresults; T.M., with the support of R.B. and M.F., prepared the manuscript. All co-authors contributed to themanuscript proof and submission.
Conflicts of Interest: The authors declare no conflict of interest. The founding sponsors had no role in the designof the study; in the collection, analyses, or interpretation of data; in the writing of the manuscript, and in thedecision to publish the results.
Appendix A
Detailed material data used for analysis in this paper are given in Tables A1–A3.
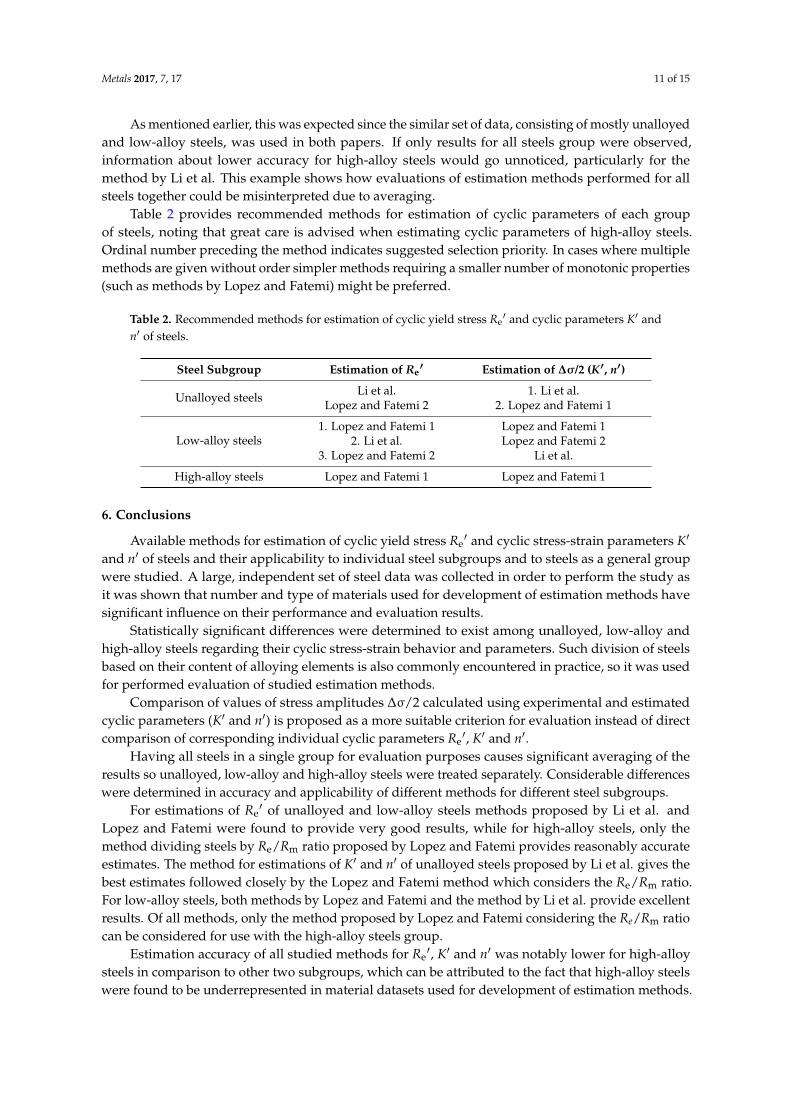
Table A1. Monotonic and cyclic properties for unalloyed steels [6,23,24].
Material Designation Monotonic Properties Cyclic Parameters
DIN or SAE/other
E(M
Pa)
Re
orR
p0.2
(MPa
)
Rm
(MPa
)
Rm
/Re
(-)
RA
(%)
K(M
Pa)
n(-
)
σf
(MPa
)
εf
(-)
Re′
(MPa
)
K′ (
MPa
)
n′(-
)
1038 (SAE) 207,000 347 610 1.758 55.5 511 0.071 956 0.590 332 1207 0.208Armco (other) 210,000 207 359 1.734 64 675 0.285 653 1.030 280 858 0.18
C 20 190,000 224 414 1.848 70 330 0.061 953 1.190 239 1050 0.238C 10 217,510 435 566 1.301 68 659 0.073 1205 1.130 463 1381 0.176
Ck 15 196,793 263 392 1.490 55 711 0.224 746 0.806 249 824 0.193Ck 15 204,500 320 434 1.356 67.5 394 0.067 848.7 1.126 269 813 0.178Ck 15 202,000 431.3 615.2 1.426 54 598 0.045 1011.7 0.776 492 1296 0.156Ck 15 203,000 660 828 1.255 2.6 863 0.042 850.5 0.026 687 1165 0.085Ck 25 210,000 346 507 1.465 63 926 0.264 1027 0.994 280 1345 0.252Ck 25 210,000 307 464 1.511 65 924 0.276 982 1.050 278 1111 0.223Ck 25 210,000 366 527 1.440 60 1033 0.264 997 0.916 303 1217 0.224Ck 35 210,000 414 617 1.490 58 1216 0.258 1150 0.868 328 1355 0.229Ck 35 210,000 394 593 1.505 62 1168 0.257 1169 0.968 333 1460 0.238Ck 35 210,000 396 565 1.427 63 1134 0.264 1134 0.994 316 1534 0.254Ck 35 210,000 587 780 1.329 67 1356 0.186 1514 1.109 463 1106 0.14Ck 35 210,000 480 656 1.367 74 1196 0.207 1468 1.347 393 1033 0.156Ck 35 210,000 596 733 1.230 71 1170 0.152 1541 1.238 447 1027 0.134Ck 35 210,000 542 730 1.347 68 1311 0.2 1473 1.139 430 1087 0.149Ck 35 210,000 513 669 1.304 70 1121 0.18 1417 1.204 387 1081 0.165Ck 45 206,000 540 790 1.463 60 730 0.047 1400 0.916 481 980 0.115Ck 45 210,500 531 790 1.488 60 1219 0.0151 1271 0.777 462 1078 0.133Ck 45 199,700 622 915 1.471 59 1606 0.18 1784 0.900 591 2407 0.226Ck 45 199,700 622 915 1.471 59 1606 0.18 1784 0.900 538 1762 0.191Ck 45 201,500 380 684 1.800 36.8 735 0.092 987 0.460 336 1414 0.231Ck 45 205,000 760 1018 1.339 0 1141 0.059 1018 0.000 722 2075 0.17Ck 45 199,000 466 737 1.582 54 1469 0.248 1296 0.777 368 1486 0.225Ck 45 207,000 462 672 1.455 61 1288 0.235 1298 0.942 354 1391 0.22Ck 45 208,000 588 730 1.241 70 1154 0.148 1540 1.204 420 1194 0.168Ck 45 207,000 551 774 1.405 68 1297 0.166 1559 1.139 464 1235 0.158Ck 45 206,000 728 844 1.159 64 1208 0.108 1582 1.022 516 1217 0.138Ck 45 210,000 652 787 1.207 68 1200 0.129 1568 1.139 472 1285 0.161Ck 45 204,000 702 863 1.229 66 1268 0.118 1651 1.079 526 1243 0.138St 37 210,000 295 435 1.475 64 829 0.275 835 1.020 273 988 0.207
St 52-3 210,000 400 597 1.493 63 1061 0.225 1083 0.980 389 1228 0.185
Note: Shaded values are calculated by Equation (20).
Metals 2017, 7, 17 13 of 15
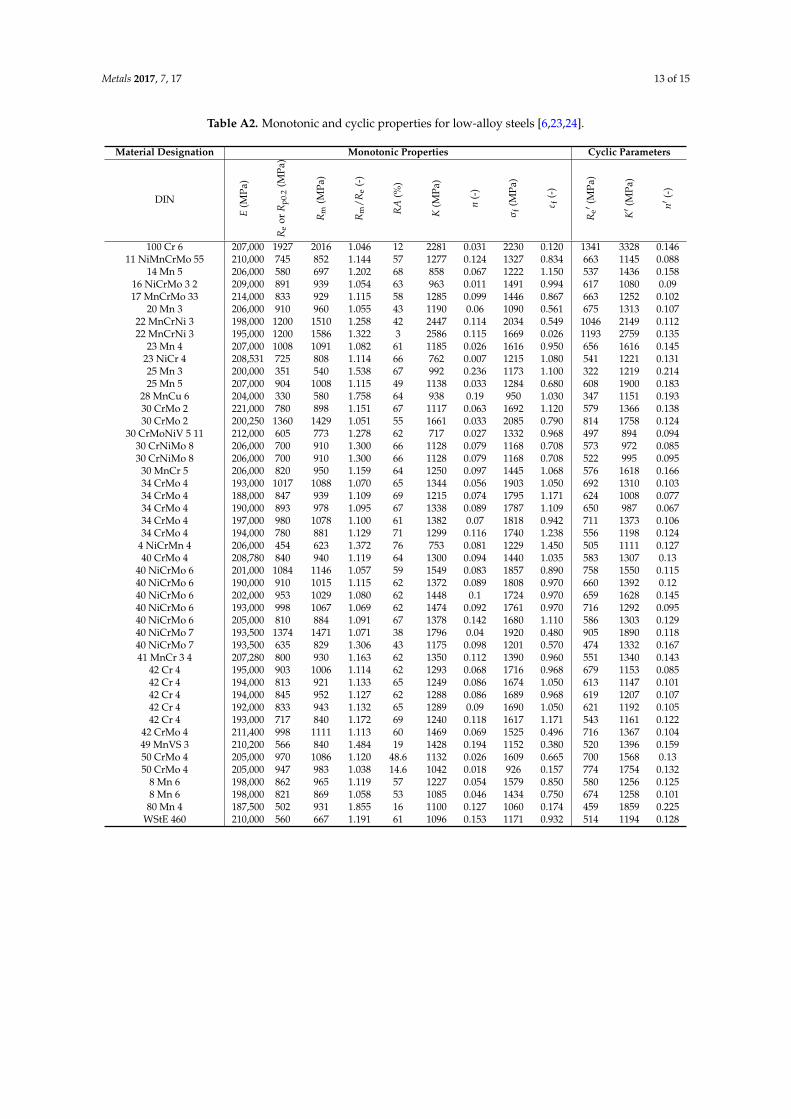
Table A2. Monotonic and cyclic properties for low-alloy steels [6,23,24].
Material Designation Monotonic Properties Cyclic Parameters
DIN
E(M
Pa)
Re
orR
p0.2
(MPa
)
Rm
(MPa
)
Rm
/Re
(-)
RA
(%)
K(M
Pa)
n(-
)
σf
(MPa
)
εf
(-)
Re′
(MPa
)
K′ (
MPa
)
n′(-
)
100 Cr 6 207,000 1927 2016 1.046 12 2281 0.031 2230 0.120 1341 3328 0.14611 NiMnCrMo 55 210,000 745 852 1.144 57 1277 0.124 1327 0.834 663 1145 0.088
14 Mn 5 206,000 580 697 1.202 68 858 0.067 1222 1.150 537 1436 0.15816 NiCrMo 3 2 209,000 891 939 1.054 63 963 0.011 1491 0.994 617 1080 0.0917 MnCrMo 33 214,000 833 929 1.115 58 1285 0.099 1446 0.867 663 1252 0.102
20 Mn 3 206,000 910 960 1.055 43 1190 0.06 1090 0.561 675 1313 0.10722 MnCrNi 3 198,000 1200 1510 1.258 42 2447 0.114 2034 0.549 1046 2149 0.11222 MnCrNi 3 195,000 1200 1586 1.322 3 2586 0.115 1669 0.026 1193 2759 0.135
23 Mn 4 207,000 1008 1091 1.082 61 1185 0.026 1616 0.950 656 1616 0.14523 NiCr 4 208,531 725 808 1.114 66 762 0.007 1215 1.080 541 1221 0.13125 Mn 3 200,000 351 540 1.538 67 992 0.236 1173 1.100 322 1219 0.21425 Mn 5 207,000 904 1008 1.115 49 1138 0.033 1284 0.680 608 1900 0.183
28 MnCu 6 204,000 330 580 1.758 64 938 0.19 950 1.030 347 1151 0.19330 CrMo 2 221,000 780 898 1.151 67 1117 0.063 1692 1.120 579 1366 0.13830 CrMo 2 200,250 1360 1429 1.051 55 1661 0.033 2085 0.790 814 1758 0.124
30 CrMoNiV 5 11 212,000 605 773 1.278 62 717 0.027 1332 0.968 497 894 0.09430 CrNiMo 8 206,000 700 910 1.300 66 1128 0.079 1168 0.708 573 972 0.08530 CrNiMo 8 206,000 700 910 1.300 66 1128 0.079 1168 0.708 522 995 0.095
30 MnCr 5 206,000 820 950 1.159 64 1250 0.097 1445 1.068 576 1618 0.16634 CrMo 4 193,000 1017 1088 1.070 65 1344 0.056 1903 1.050 692 1310 0.10334 CrMo 4 188,000 847 939 1.109 69 1215 0.074 1795 1.171 624 1008 0.07734 CrMo 4 190,000 893 978 1.095 67 1338 0.089 1787 1.109 650 987 0.06734 CrMo 4 197,000 980 1078 1.100 61 1382 0.07 1818 0.942 711 1373 0.10634 CrMo 4 194,000 780 881 1.129 71 1299 0.116 1740 1.238 556 1198 0.124
4 NiCrMn 4 206,000 454 623 1.372 76 753 0.081 1229 1.450 505 1111 0.12740 CrMo 4 208,780 840 940 1.119 64 1300 0.094 1440 1.035 583 1307 0.13
40 NiCrMo 6 201,000 1084 1146 1.057 59 1549 0.083 1857 0.890 758 1550 0.11540 NiCrMo 6 190,000 910 1015 1.115 62 1372 0.089 1808 0.970 660 1392 0.1240 NiCrMo 6 202,000 953 1029 1.080 62 1448 0.1 1724 0.970 659 1628 0.14540 NiCrMo 6 193,000 998 1067 1.069 62 1474 0.092 1761 0.970 716 1292 0.09540 NiCrMo 6 205,000 810 884 1.091 67 1378 0.142 1680 1.110 586 1303 0.12940 NiCrMo 7 193,500 1374 1471 1.071 38 1796 0.04 1920 0.480 905 1890 0.11840 NiCrMo 7 193,500 635 829 1.306 43 1175 0.098 1201 0.570 474 1332 0.16741 MnCr 3 4 207,280 800 930 1.163 62 1350 0.112 1390 0.960 551 1340 0.143
42 Cr 4 195,000 903 1006 1.114 62 1293 0.068 1716 0.968 679 1153 0.08542 Cr 4 194,000 813 921 1.133 65 1249 0.086 1674 1.050 613 1147 0.10142 Cr 4 194,000 845 952 1.127 62 1288 0.086 1689 0.968 619 1207 0.10742 Cr 4 192,000 833 943 1.132 65 1289 0.09 1690 1.050 621 1192 0.10542 Cr 4 193,000 717 840 1.172 69 1240 0.118 1617 1.171 543 1161 0.122
42 CrMo 4 211,400 998 1111 1.113 60 1469 0.069 1525 0.496 716 1367 0.10449 MnVS 3 210,200 566 840 1.484 19 1428 0.194 1152 0.380 520 1396 0.15950 CrMo 4 205,000 970 1086 1.120 48.6 1132 0.026 1609 0.665 700 1568 0.1350 CrMo 4 205,000 947 983 1.038 14.6 1042 0.018 926 0.157 774 1754 0.132
8 Mn 6 198,000 862 965 1.119 57 1227 0.054 1579 0.850 580 1256 0.1258 Mn 6 198,000 821 869 1.058 53 1085 0.046 1434 0.750 674 1258 0.10180 Mn 4 187,500 502 931 1.855 16 1100 0.127 1060 0.174 459 1859 0.225
WStE 460 210,000 560 667 1.191 61 1096 0.153 1171 0.932 514 1194 0.128
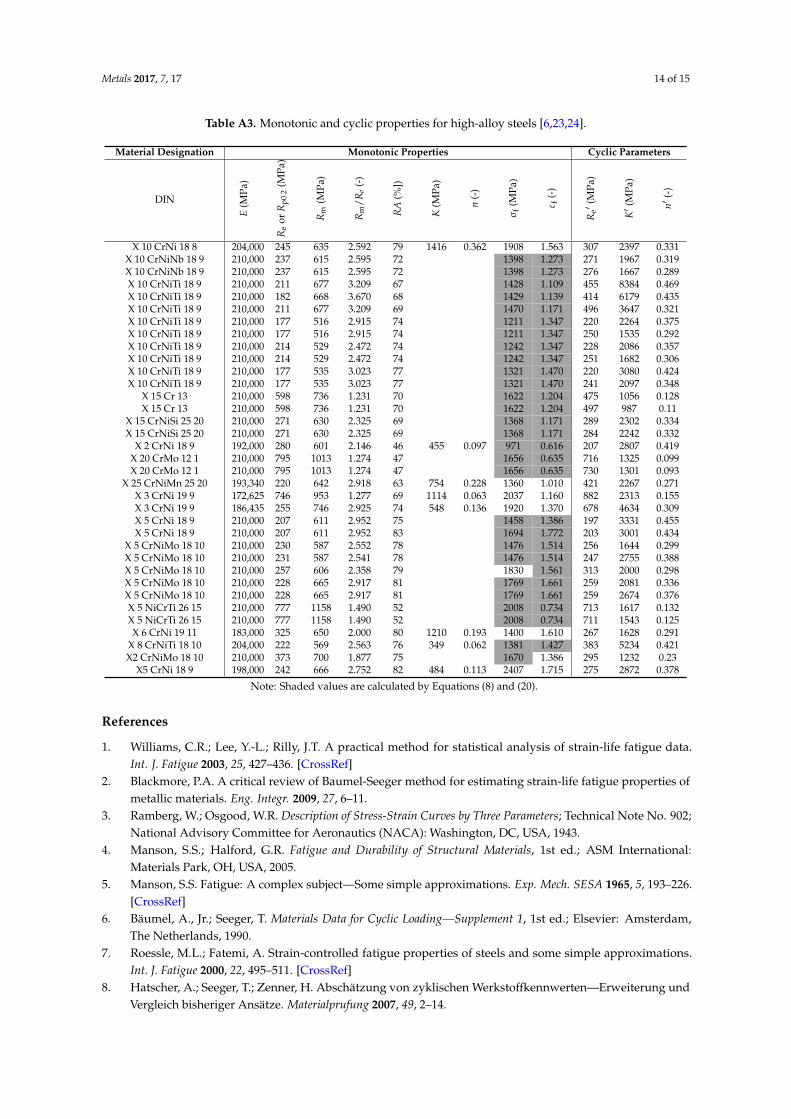
Metals 2017, 7, 17 14 of 15
Table A3. Monotonic and cyclic properties for high-alloy steels [6,23,24].
Material Designation Monotonic Properties Cyclic Parameters
DIN
E(M
Pa)
Re
orR
p0.2
(MPa
)
Rm
(MPa
)
Rm
/Re
(-)
RA
(%])
K(M
Pa)
n(-
)
σf
(MPa
)
εf
(-)
Re′
(MPa
)
K′ (
MPa
)
n′(-
)
X 10 CrNi 18 8 204,000 245 635 2.592 79 1416 0.362 1908 1.563 307 2397 0.331X 10 CrNiNb 18 9 210,000 237 615 2.595 72 1398 1.273 271 1967 0.319X 10 CrNiNb 18 9 210,000 237 615 2.595 72 1398 1.273 276 1667 0.289X 10 CrNiTi 18 9 210,000 211 677 3.209 67 1428 1.109 455 8384 0.469X 10 CrNiTi 18 9 210,000 182 668 3.670 68 1429 1.139 414 6179 0.435X 10 CrNiTi 18 9 210,000 211 677 3.209 69 1470 1.171 496 3647 0.321X 10 CrNiTi 18 9 210,000 177 516 2.915 74 1211 1.347 220 2264 0.375X 10 CrNiTi 18 9 210,000 177 516 2.915 74 1211 1.347 250 1535 0.292X 10 CrNiTi 18 9 210,000 214 529 2.472 74 1242 1.347 228 2086 0.357X 10 CrNiTi 18 9 210,000 214 529 2.472 74 1242 1.347 251 1682 0.306X 10 CrNiTi 18 9 210,000 177 535 3.023 77 1321 1.470 220 3080 0.424X 10 CrNiTi 18 9 210,000 177 535 3.023 77 1321 1.470 241 2097 0.348
X 15 Cr 13 210,000 598 736 1.231 70 1622 1.204 475 1056 0.128X 15 Cr 13 210,000 598 736 1.231 70 1622 1.204 497 987 0.11
X 15 CrNiSi 25 20 210,000 271 630 2.325 69 1368 1.171 289 2302 0.334X 15 CrNiSi 25 20 210,000 271 630 2.325 69 1368 1.171 284 2242 0.332
X 2 CrNi 18 9 192,000 280 601 2.146 46 455 0.097 971 0.616 207 2807 0.419X 20 CrMo 12 1 210,000 795 1013 1.274 47 1656 0.635 716 1325 0.099X 20 CrMo 12 1 210,000 795 1013 1.274 47 1656 0.635 730 1301 0.093
X 25 CrNiMn 25 20 193,340 220 642 2.918 63 754 0.228 1360 1.010 421 2267 0.271X 3 CrNi 19 9 172,625 746 953 1.277 69 1114 0.063 2037 1.160 882 2313 0.155X 3 CrNi 19 9 186,435 255 746 2.925 74 548 0.136 1920 1.370 678 4634 0.309X 5 CrNi 18 9 210,000 207 611 2.952 75 1458 1.386 197 3331 0.455X 5 CrNi 18 9 210,000 207 611 2.952 83 1694 1.772 203 3001 0.434
X 5 CrNiMo 18 10 210,000 230 587 2.552 78 1476 1.514 256 1644 0.299X 5 CrNiMo 18 10 210,000 231 587 2.541 78 1476 1.514 247 2755 0.388X 5 CrNiMo 18 10 210,000 257 606 2.358 79 1830 1.561 313 2000 0.298X 5 CrNiMo 18 10 210,000 228 665 2.917 81 1769 1.661 259 2081 0.336X 5 CrNiMo 18 10 210,000 228 665 2.917 81 1769 1.661 259 2674 0.376X 5 NiCrTi 26 15 210,000 777 1158 1.490 52 2008 0.734 713 1617 0.132X 5 NiCrTi 26 15 210,000 777 1158 1.490 52 2008 0.734 711 1543 0.125X 6 CrNi 19 11 183,000 325 650 2.000 80 1210 0.193 1400 1.610 267 1628 0.291
X 8 CrNiTi 18 10 204,000 222 569 2.563 76 349 0.062 1381 1.427 383 5234 0.421X2 CrNiMo 18 10 210,000 373 700 1.877 75 1670 1.386 295 1232 0.23
X5 CrNi 18 9 198,000 242 666 2.752 82 484 0.113 2407 1.715 275 2872 0.378
Note: Shaded values are calculated by Equations (8) and (20).
References
1. Williams, C.R.; Lee, Y.-L.; Rilly, J.T. A practical method for statistical analysis of strain-life fatigue data.Int. J. Fatigue 2003, 25, 427–436. [CrossRef]
2. Blackmore, P.A. A critical review of Baumel-Seeger method for estimating strain-life fatigue properties ofmetallic materials. Eng. Integr. 2009, 27, 6–11.
3. Ramberg, W.; Osgood, W.R. Description of Stress-Strain Curves by Three Parameters; Technical Note No. 902;National Advisory Committee for Aeronautics (NACA): Washington, DC, USA, 1943.
4. Manson, S.S.; Halford, G.R. Fatigue and Durability of Structural Materials, 1st ed.; ASM International:Materials Park, OH, USA, 2005.
5. Manson, S.S. Fatigue: A complex subject—Some simple approximations. Exp. Mech. SESA 1965, 5, 193–226.[CrossRef]
6. Bäumel, A., Jr.; Seeger, T. Materials Data for Cyclic Loading—Supplement 1, 1st ed.; Elsevier: Amsterdam,The Netherlands, 1990.
7. Roessle, M.L.; Fatemi, A. Strain-controlled fatigue properties of steels and some simple approximations.Int. J. Fatigue 2000, 22, 495–511. [CrossRef]
8. Hatscher, A.; Seeger, T.; Zenner, H. Abschätzung von zyklischen Werkstoffkennwerten—Erweiterung undVergleich bisheriger Ansätze. Materialprufung 2007, 49, 2–14.
Metals 2017, 7, 17 15 of 15
9. Park, J.H.; Song, J.H. Detailed evaluation of methods for estimation of fatigue properties. Int. J. Fatigue 1995,17, 365–373. [CrossRef]
10. Zhang, Z.; Qiao, Y.; Sun, Q.; Li, C.; Li, J. Theoretical estimation to the cyclic strength coefficient and the cyclicstrain-hardening exponent for metallic materials: Preliminary study. J. Mater. Eng. Perform. 2009, 18, 245–254.[CrossRef]
11. Li, J.; Sun, Q.; Zhang, Z.; Li, C.; Qiao, Y. Theoretical estimation to the cyclic yield strength and fatigue limitfor alloy steels. Mech. Res. Commun. 2009, 36, 316–321. [CrossRef]
12. Lopez, Z.; Fatemi, A. A method of predicting cyclic stress-strain curve from tensile properties for steels.Mater. Sci. Eng. A Struct. 2012, 556, 540–550. [CrossRef]
13. Li, J.; Zhang, Z.; Li, C. An improved method for estimation of Ramberg-Osgood curves of steels frommonotonic tensile properties. Fatigue Fract. Eng. Mater. Struct. 2016, 39, 412–426. [CrossRef]
14. Marohnic, T.; Basan, R. Study of Monotonic Properties’ Relevance for Estimation of Cyclic Yield Stress andRamberg–Osgood Parameters of Steels. J. Mater. Eng. Perform. 2016, 25, 4812–4823. [CrossRef]
15. Basan, R.; Franulovic, M.; Prebil, I.; Crnjaric-Žic, N. Analysis of strain-life fatigue parameters and behaviorof different groups of metallic materials. Int. J. Fatigue 2011, 33, 484–491. [CrossRef]
16. Basan, R.; Marohnic, T.; Prebil, I.; Franulovic, M. Preliminary investigation of the existence of correlationbetween cyclic Ramberg-Osgood parameters and monotonic properties of low-alloy steels. In Proceedingsof the 3rd International Conference Mechanical Technologies and Structural Materials MTSM 2013, Split,Croatia, 26–27 September 2013; Živkovic, D., Ed.; Croatian society for mechanical technologies: Split, Croatia, 2013.
17. Marohnic, T.; Basan, R.; Franulovic, M. Evaluation of the Possibility of Estimating Cyclic Stress-strainParameters and Curves from Monotonic Properties of Steels. Procedia Eng. 2015, 101, 277–284. [CrossRef]
18. Smith, R.W.; Hirschberg, M.H.; Manson, S.S. Fatigue Behavior of Materials under Strain Cycling in Low andIntermediate Life Range; Technical Note D-1574; National Aeronautics and Space Administration (NASA):Washington, DC, USA, 1963.
19. Zhang, Z.; Wu, W.; Chen, D.; Sun, Q.; Zhao, W. New Formula Relating the Yield Stress-Strain with theStrength Coefficient and the Strain-Hardening Exponent. J. Mater. Eng. Perform. 2004, 13, 509–512.
20. Landgraf, R.W.; Morrow, J.; Endo, T. Determination of cyclic stress-strain curve. J. Mater. 1969, 4, 176–188.21. Devore, J. Probability and Statistics for Engineering and the Sciences; Brooks/Cole Cengage Learning: Boston,
MA, USA, 2011.22. Minitab 17 Statistical Software, Product version 17.3.1; Computer Software; Minitab, Inc.: State College, PA,
USA, 2010.23. Boller, C.; Seeger, T. Materials Data for Cyclic Loading, Part A–D, 1st ed.; Elsevier: Amsterdam, The Netherlands, 1987.24. Basan, R. MATDAT Materials Properties Database, Version 1.1. 2011. Available online: http://www.matdat.com/
(accessed on 15 January 2016).
© 2017 by the authors; licensee MDPI, Basel, Switzerland. This article is an open accessarticle distributed under the terms and conditions of the Creative Commons Attribution(CC-BY) license (http://creativecommons.org/licenses/by/4.0/).