Morphological simplification in Asian Englishes - FreiDok plus
Upload
independentCategory
view
0download
0
Evaluation of Mesh Simplification Algorithms
using PolyMeCo: A Case Study
Samuel Silvaa, Frutuoso Silvab, Joaquim Madeiraa,c and Beatriz Sousa Santosa,c
a Institute of Electronics and Telematics Engineering of Aveiro, University of Aveiro,Aveiro, Portugal
b IT — Networks and Multimedia Group / Dep. of Computer Science and Engineering,University of Beira Interior, Covilha, Portugal
c Dep. of Electronics, Telecommunications and Informatics, University of Aveiro,Aveiro, Portugal
ABSTRACT
Polygonal meshes are used in many application scenarios. Often the generated meshes are too complex not al-lowing proper interaction, visualization or transmission through a network. To tackle this problem, simplificationmethods can be used to generate less complex versions of those meshes.
For this purpose many methods have been proposed in the literature and it is of paramount importance thateach new method be compared with its predecessors, thus allowing quality assessment of the solution it provides.This systematic evaluation of each new method requires tools which provide all the necessary features (rangingfrom quality measures to visualization methods) to help users gain greater insight into the data.
This article presents the comparison of two simplification algorithms, NSA and QSlim, using PolyMeCo, atool which enhances the way users perform mesh analysis and comparison, by providing an environment whereseveral visualization options are available and can be used in a coordinated way.
Keywords: Polygonal Meshes, Quality Evaluation, Visualization.
1. INTRODUCTION
Polygonal meshes are widely used in many application scenarios like CAD/CAM, video games, cultural heritage1
and physically-based modeling.2 In many of these applications the original meshes (obtained, e.g., using 3Dscanners) are very complex and do not allow proper visualization and interaction (e.g., in low resources systemslike PDAs) or their transmission through a network. In these cases the solution can be mesh simplification.
Many simplification algorithms have been proposed in the literature3 but only a few studies compare thosemethods with each other, helping the user choose the proper method for a specific application (examples are thoseof Cignoni et al.4 and Rogowitz et al.5). For the purpose of mesh comparison, some metrics (e.g., geometric andnormal deviations) and tools have been proposed in the literature. How these metrics estimate user perceivedquality is still an unanswered question, but some authors as Watson et al.6 and, more recently, Silva et al.7,8 andSantos et al.,9 who compare simplification methods using observer studies, aim to produce guidelines which helpusers understand not only the physical implications of a particular metric but how it can be used to estimateperceived quality.
Meanwhile, mesh comparison tools must also go a step forward, providing a user-friendly integrated environ-ment with several visualization options, focusing on turning mesh comparison into a systematic task availablenot only to researchers developing new algorithms but also to those who use them and wish to evaluate theirresults.
In this article the comparison of a recent simplification method developed by the second author, NSA,10 withthe widely used method QSlim11 is presented. This comparison is performed using PolyMeCo,12 a tool for mesh
Further author information: (Send correspondence to Samuel Silva.)E-mail: [email protected], Telephone: +351 234 370 500

analysis and comparison. The main goal is to assess if NSA provides better results than QSlim while exploringthe functionalities provided by PolyMeCo, thus illustrating a typical application for this kind of tool.
On the following sections a brief description of the used simplification algorithms and of mesh comparisontools previously presented in the literature is given. Then, the main features of PolyMeCo, the tool used toperform the comparison, are described. Afterwards, a case study is presented which shows the results obtainedfor the comparison between the simplification algorithms and how it was performed using PolyMeCo. Finally,some conclusions are presented.
2. SIMPLIFICATION ALGORITHMS: QSLIM AND NSA
There are several types of algorithms for polygonal mesh simplification (see Cignoni et al.,4 Puppo et al.13
and Luebke et al.3). We used the QSlim11 and NSA10 algorithms to evaluate the different quality criteria forgenerated meshes. QSlim is freeware and available from http://www.cs.cmu.edu/∼garland, which has allowedapplying both algorithms to the same models. Both algorithms simplify a mesh by iteratively collapsing edgesinto vertices, i.e., using the edge collapse operation.
The edge collapsing operation is standard. The main difference between the various edge collapsing-basedsimplification algorithms is the criterion used to choose the next edge to collapse. A different criterion impliesdifferent mesh quality, as well as a distinct processing time. Generally, all simplification algorithms make atrade-off between speed and the quality of the resulting mesh.
QSlim follows a geometric criterion that is based on the minimization of the error associated with each newvertex. This error is defined as the sum of the squared distances to the set of planes surrounding the pair of theoriginal collapsing vertices. Thus, this algorithm produces simplified meshes with a very good geometric qualitysince it minimizes the error associated with each new vertex.
On the other hand, the NSA algorithm follows a geometric criterion which implies that the region aroundthe collapsing edge be nearly coplanar. An edge is only collapsed if the variation of the face normals aroundthe target edge is within a given tolerance ε. The value of ε is the threshold for the angle between the currentnormal and the new normal after the edge collapsing operation.
NSA is faster than QSlim without degrading mesh quality too much.10 In general, it provides good resultsin terms of shape preservation, time performance, and mesh quality. Note that NSA was primarily developedfor time efficiency purposes and mesh quality was not a priority goal (but it is also achieved).
3. MESH COMPARISON TOOLS
Mesh comparison is usually carried out with the help of dedicated software tools providing the user with numericaldata (e.g., minimum, mean and maximum difference values) and visual information (e.g., coloring a modelaccording to the difference values measured at each vertex), allowing the user to choose among several differencemeasures. A few such tools, which allow polygonsl mesh feature evaluation and comparison, are described in theliterature.
Metro, developed by Cignoni et al.,14 allows both numerical and visual mesh comparison. Among the nu-merical values provided is data about the input mesh characteristics (number of vertices and faces, surface area,mesh volume, etc.), the minimum and maximum distances between two given meshes and their difference involume. It is also possible to view a model colored according to the results obtained. The Hausdorff distancebetween two meshes can also be computed.
The tool described by Zhou et al.15 introduces some additional measures (namely, surface curvature) and usesseveral visualization techniques, including side-by-side viewing of the compared models and difference results,box-glyphs and animations.
MESH, developed by Aspert et al.,16 uses the Hausdorff distance to measure the difference between twomesh models. It provides several numerical values, namely the main characteristics of the input meshes and theminimum, mean, maximum and RMS values of the computed difference measures. It is also possible to view amodel colored according to the obtained results.

Finally, Roy et al.17 describe a tool called MeshDev which allows the computation of geometric, normaland other mesh attribute deviations such as color or texture. Similarly to the other tools, it provides severalnumerical values characterizing the input meshes and the obtained results. It is also possible to view the modelscolored according to the computed deviations.
4. POLYMECO
Although a few mesh comparison tools have been proposed in the literature, they still lack some features whichwould allow the mesh evaluation process to become a more systematic task applied in a wider range of situations.For example, in an evaluation process it is often necessary to compare and evaluate many models. So, it isdesirable that the tool used to perform such an evaluation can be applied to all the models simultaneously,instead of evaluating each model at a time. This tool must also provide visualization options which allowusers to gain additional insight into the data obtained, thus freeing them from using other tools to perform thevisualization, which would make the evaluation process more time consuming.
Figure 1: PolyMeCo’s user interface.
PolyMeCo12 is a tool under development meant to provide an integrated environment where mesh analysisand comparison can be performed and the obtained results properly analysed (see figure 1), using differentvisualization options in a coordinated way. The main goal is not to provide new quality measures (although thistool seems an appropriate testbed) but a set of features which allow their usage in a systematic and efficient way.
4.1. Computational Measures
PolyMeCo provides several computational measures which support mesh analysis and comparison. Two types ofmeasures are provided: intrinsic properties and difference measures.
Intrinsic∗ properties allow the measurement of a particular property of a mesh. PolyMeCo provides thecomputation of: Mean and Gaussian Curvatures using the method proposed by Meyers et al.;18 Triangle Qualityby computing the minimum angle for each mesh face;19 Mesh Saliency, by using the method proposed by Lee et
∗Here used in the sense of a property which is directly computed from a model data, irrespective of any other referencemodel; not in the Differential Geometry sense as in “intrinsic curvature”.

al.;20 and Smoothness, by computing for each vertex its distance to the centroid of its direct neighbors (one-ringvertices).
Difference measures allow the comparison of properties between meshes. PolyMeCo provides the computationof: Geometric and Normal Deviations, using the method proposed by Roy et al.;17 Mean and Gaussian CurvatureDeviations; Visual Differences, using the method proposed by Karni et al.21 and enhancements proposed inSoerkine et al.22 and Composed Deviation, based on the results presented by Santos et al.9 and mixing thegeometric and normal deviations using a blending factor which depends on the simplification ratio.
Notice that, although it might be an unusual task, PolyMeCo does not impose any constraint on the com-parison between dissimilar models.
4.2. Representations
Data obtained by using any of the computational measures available in PolyMeCo can be presented to the userin several ways. The different representations provided can be grouped in three different categories: NumericalValues, 3D Representations and Statistical Representations.
Numerical Values
The easiest way to provide the user with feedback about the computed measures is by presenting some numericalvalues that characterize them (minimum, mean and maximum values, and variance) and/or the meshes for whichthey were computed (number of vertices, number of faces, bounding box diagonal and surface area).
3D Representations
The analysis and comparison of mesh properties can be performed with the help of 3D models: either by asimple geometric model representation or by the superposition of any computational measure distribution alonga model surface, i.e., the model is colored according to the value obtained for each vertex/face. This coloringcan be performed by mapping the values range to a particular color scale. Currently, PolyMeCo provides thefollowing color scales: rainbow (the most commonly used in the literature, but not always the better choice23),greyscale, linearized greyscale, blue to cyan, blue to yellow and linearized optimal.24 Another representationoption for mesh analysis and comparison can be that of model superposition. A first choice is to render bothmodels in a “solid” way, using different colors. This allows the perception of the areas where, for example, theprocessed model overlaps the reference model. A second alternative is to render the reference model with somedegree of transparency, in order to let the user perceive the differences in volume between the two superimposedmodels. Finally, both models can be rendered in wireframe.
Figure 2: Models used for the evaluation. From left to right : RockerArm, FanDisk, Flasche and BlockFS.

Statistical Representations
Although model coloring gives a good idea of the distribution of a computed measure values along a modelsurface, showing where they occur, a global idea of the distribution characteristics can be difficult to obtain, dueto the impossibility of viewing the whole surface simultaneously. Therefore, statistical representations may helpto better understand and compare distributions of computed measures.
On PolyMeCo, histograms and boxplots are available. While the first provide information complementaryto the one given by colored models (the user can, at a glance, get an idea of the global characteristics of thecomputed measure distribution), boxplots are very useful when comparing datasets, since they allow comparingand analysing the symmetries and ranges of the data, and detect the presence of outliers.
4.3. Visualization and Interaction
Visualization modes use the available representations in order to provide ways of better analysing and comparingmesh properties. Examples of visualization modes available in PolyMeCo are: Original vs Processed vs ColoredModel, which allows the simultaneous view of both models being compared and a model colored according to thedata obtained with a particular measure; Extended Results View, which shows a colored model, a histogram anda boxplot regarding some measure; and Features Comparison, which allows the visualization of data distributionsobtained with the same computational measure for several processed models, and can get very useful in situationswhere the purpose is to study different processing algorithms and compare the obtained results. In order to allowbetter comparison using colored models, PolyMeCo allows using a common color map for all compared models,i.e., instead of using a color mapping for each model (maximum value obtained for that model mapped to thehighest color) the maximum value obtained among all models is found and a common color map is used withthis value mapped to the highest color. A similar feature also applies to histogram ranges, i.e., all histogramsare drawn for the same value range.
5. CASE STUDY
For the evaluation of the QSlim and NSA simplification methods four polygonal models were chosen. Figure 2shows those models and table 1 some details about their complexity.
Table 1: Number of vertices and faces for each of the used models.
Models # Vertices # FacesFandisk 6,475 12,946RockerArm 40,177 80,354Flasche 42,762 85,524BlockFS 12,773 25,542
For each model and for three simplification levels (strong, moderate and light), a simplified model was createdusing QSlim and another using NSA. Figure 3 shows the complete set for the Fandisk model.
The following comparisons were carried out using PolyMeCo alpha version 0.0.5b†.
5.1. Preliminary Analysis
First, a preliminary analysis was performed regarding the bounding box features and the surface area of thesimplified models, comparing them with those of the original models. In particular, for the Fandisk andBlockFS models some important surface area differences were found for the models simplified using QSlim,which are related to some surface anomalies that will be analysed later.
A comparative visual analysis of volume was also performed by rendering the original model and each simpli-fied version simultaneously (i.e., superimposed). Figure 4 shows this for two simplified versions of RockerArm.The original model is rendered in red (with the option of changing its transparency level) and the simplified ver-sion in blue, thus allowing a perception of the areas where one of the models is over the other. For all simplifiedmodels no significant volume differences were found.

Figure 3: Simplified versions for the FanDisk model. Top, strongly, moderately and lightly simplified versionsobtained with NSA; bottom, the corresponding versions obtained with QSlim.
Figure 4: Comparative visual analysis of volume differences between the original model and the simplified versionsRockerArm 5908 NSA (left) and RockerArm 5908 QS (right). Red areas correspond to the RockerArm modeland blue areas to the simplified model.
Proper illumination can also help users analyse a particular mesh and this has been used in sophisticatedways in the automobile industry.25 As a first step towards this kind of analysis, PolyMeCo supports addingmore point light sources and changing their properties (position and color of components), thus allowing theexamination of surfaces in more detail. This kind of analysis is more effective when interactively repositioning thelight sources which can also be done in PolyMeCo (although with some limitations depending on the complexityof the viewed mesh). In figure 5 some of the obtained views are presented; notice, on the left, how severalartifacts are noticeable on the surface of the version simplified with QSlim and how, on the right, the surfacehighlights look better defined in the model simplified with QSlim.
5.2. Analysis and Comparison using Computational Measures
From the set of computational measures available in PolyMeCo the following were chosen for this case study:Geometric and Normal Deviations, Composed Deviation, Smoothness Analysis and Minimum Angle Analysis.In table 2 we present the mean values obtained for the different metrics when applied to the simplified versionsof the chosen meshes. Note that each mesh name includes the number of faces and the used simplification
†A version of PolyMeCo for test purposes is available in http://www.ieeta.pt/polymeco
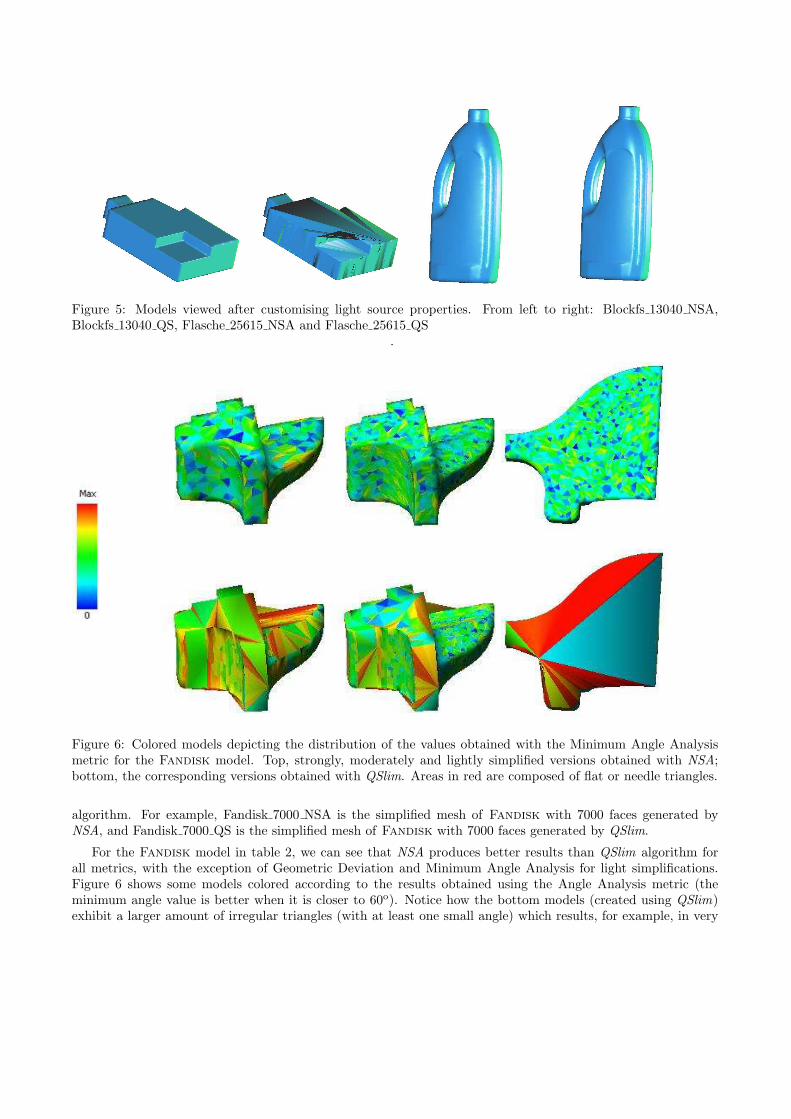
Figure 5: Models viewed after customising light source properties. From left to right: Blockfs 13040 NSA,Blockfs 13040 QS, Flasche 25615 NSA and Flasche 25615 QS
.
Figure 6: Colored models depicting the distribution of the values obtained with the Minimum Angle Analysismetric for the Fandisk model. Top, strongly, moderately and lightly simplified versions obtained with NSA;bottom, the corresponding versions obtained with QSlim. Areas in red are composed of flat or needle triangles.
algorithm. For example, Fandisk 7000 NSA is the simplified mesh of Fandisk with 7000 faces generated byNSA, and Fandisk 7000 QS is the simplified mesh of Fandisk with 7000 faces generated by QSlim.
For the Fandisk model in table 2, we can see that NSA produces better results than QSlim algorithm forall metrics, with the exception of Geometric Deviation and Minimum Angle Analysis for light simplifications.Figure 6 shows some models colored according to the results obtained using the Angle Analysis metric (theminimum angle value is better when it is closer to 60o). Notice how the bottom models (created using QSlim)exhibit a larger amount of irregular triangles (with at least one small angle) which results, for example, in very

Table 2: Evaluating the simplified models created by QSlim and NSA using different metrics; mean values arepresented.
Meshes Geom. Dev. Normal Dev. Comp. Dev. Smoothness Minimum Angle
Fandisk 7000 NSA 1.65E-4 3.44E-2 4.66E-2 1.47E-5 36.72Fandisk 7000 QS 8.32E-7 2.08E-1 9.74E-2 1.61E-3 38.88Fandisk 3872 NSA 3.65E-4 6.21E-2 5.59E-2 6.23E-5 34.81Fandisk 3872 QS 9.83E-6 2.60E-1 1.37E-1 2.51E-3 31.77Fandisk 1312 NSA 1.22E-3 1.28E-1 8.72E-2 1.61E-4 30.89Fandisk 1312 QS 4.75E-5 3.91E-1 9.50E-2 3.84E-3 20.78
RockerArm 40568 NSA 1.19E-2 2.95E-2 9.16E-2 2.84E-4 35.10RockerArm 40568 QS 1.93E-3 3.68E-1 6.99E-2 2.22E-4 36.60RockerArm 20742 NSA 2.35E-2 4.81E-2 1.03E-1 5.79E-4 30.70RockerArm 20742 QS 4.76E-3 2.81E-2 1.02E-1 5.15E-3 34.60RockerArm 5908 NSA 6.59E-2 1.00E-1 1.48E-1 3.81E-3 29.70RockerArm 5908 QS 1.12E-2 6.13E-2 1.05E-1 1.60E-3 28.10
Flasche 46444 NSA 3.41E-2 3.85E-2 1.03E-1 2.45E-3 37.63Flasche 46444 QS 8.18E-3 3.17E-2 5.63E-2 6.54E-4 38.67Flasche 25615 NSA 6.32E-2 6.05E-2 1.32E-1 4.66E-3 36.66Flasche 25615 QS 1.52E-2 4.65E-2 8.75E-2 1.06E-3 32.56Flasche 3094 NSA 3.70E-1 1.56E-1 1.25E-1 3.10E-2 32.19Flasche 3094 QS 4.61E-2 1.10E-1 8.94E-2 2.71E-2 24.72
BlockFS 13040 NSA 3.23E-4 3.50E-2 2.93E-2 2.40E-4 26.04BlockFS 13040 QS 0.00 2.19E-1 6.15E-2 9.01E-2 19.65BlockFS 7000 NSA 1.16E-3 6.05E-2 2.36E-2 5.10E-3 23.44BlockFS 7000 QS 1.00E-6 3.17E-1 5.31E-2 9.80E-2 16.31BlockFS 3684 NSA 2.75E-3 9.52E-2 2.66E-2 1.55E-3 24.99BlockFS 3684 QS 1.00E-6 3.41E-1 3.69E-2 1.65E-1 18.23
odd triangulations at the base of the model.
For the RockerArm model a different behavior is observed. QSlim produces better results than NSA for allthe metrics with the exception of Minimum Angle Analysis and Normal Deviation for light simplification. Figure7 shows some models colored according to the values obtained using the Geometric Deviation. It is clear thatthe model created using NSA exhibits larger deviation values. Histograms are an alternative way of looking atthese results. Figure 8 shows a detail of the RockerArm model when evaluated using the Composed Deviation.Once again the model created using NSA obtained poorer results.
QSlim also produces better results for the Flasche model (table 2) in all metrics except for the MinimumAngle Analysis regarding light simplification. Figure 9, on the left, shows two models colored according to thecomputed Normal Deviation. The model created with NSA exhibits a larger deviation towards the original; onthe right it is possible to verify a poorer triangle quality (smaller angles) in the model created with QSlim.
Finally, for the BlockFS model, NSA produces better results with the exception of those obtained usingGeometric Deviation. Figure 10 shows models colored (using a common color map) according to the NormalDeviation for all of the simplified models. It is clear that all models created with QSlim exhibit larger deviation,mainly due to some triangulation problems similar to those shown in figure 6 for the Fandisk model. Figure11 presents one of PolyMeCo´s visualization modes, Extended Results View, showing the results obtained formodel BlockFS 3684 QS using the Composed Deviation. By observing the boxplot, on the top right corner, it ispossible to verify the existence of several points (in blue) above the top whisker. These points represent outliersdetected on the data. The colorscale was adjusted (by using the sliders below the histogram) in order to excludethose values, which enables a better visualization of the results.

Figure 7: Colored models and histograms depicting the distribution obtained using the Geometric Deviation forthe RockerArm 5908 NSA (left) and RockerArm 5908 QS (right) models.
Figure 8: Composed Deviation results for the RockerArm model seen in greater detail. From left to right:original model, RockerArm 5908 NSA and deviation values, and RockerArm 5908 QS and deviation values.
6. CONCLUSIONS
From the analysis of the obtained results it is possible to conclude that QSlim always leads to simplified mesheswith a lower mean Geometric Deviation when compared with the original mesh.
For the other metrics results depend on the nature of the mesh. For example, when dealing with mesheswith planar regions (Fandisk and BlockFS) NSA produces better results than QSlim for all metrics exceptGeometric Deviation.
For models without planar regions QSlim produces, in general, better results for all metrics. However, for thesame meshes, NSA yields better Minimum Angle Analysis results, as for the RockerArm model. For modelswith planar regions QSlim creates some surface artifacts due to the existence of vertices with a large numberof incident edges, which explains why it normally yielded worst results for the Minimum Angle Analysis. Thisparticularity can be a problem for visualization purposes and for finite element simulations where triangle qualityis of extreme importance.
In fact, meshes created by QSlim have less geometric error than meshes created by NSA, but the visualquality of meshes created by QSlim is poorer when compared with the quality of the meshes created by NSA, inparticular for models with planar regions as shown in figure 12.
PolyMeCo provided the possibility of analysing several simplified meshes using a large range of metrics,which allowed a more precise evaluation of the simplification algorithms. The Features Comparison visualizationmode was particularly useful since it allowed comparisons (which is a harder task to perform when using justnumerical values) using colored models and histograms (with common color maps and value ranges). The

Figure 9: On the left, models colored using a blue-to-cyan colorscale according to the Normal Deviation valuescomputed for models Flasche 3094 NSA and Flasche 3094 QS. On the right, Minimum Angle Analysis resultsfor these same models.
Figure 10: Colored models depicting the results obtained for the simplified versions of BlockFS using theNormal Deviation metric. A common color map is used for all models thus allowing direct comparison using thecolored models. Top, strongly, moderately and lightly simplified models using NSA, bottom, the correspondingsimplified models using QSlim.
available visualization options allowed a clearer understanding of the meaning of numerical values as well as theproblems they are related to. A clear example is that of Angle Analysis values and the detection of odd triangles.
Having all models and data (from all the computed measures) simultaneously available in PolyMeCo alloweda more interactive analysis: it was possible to change between models and visualization modes while searchingfor the configurations which provided greater insight into the analysed data.
These features allowed a better understanding of the main characteristics of each algorithm. For instance,if the original model has a large number of planar regions, and visual quality is the most important criterion,QSlim might not be the algorithm of choice.

Figure 11: Extended results view for model BlockFS 3684 QS showing a colored model, a histogram and aboxplot for the results obtained with the Composed Deviation.
Figure 12: Fandisk mesh with 7000 faces created by NSA(left) and QSlim (right).
ACKNOWLEDGMENTS
The first author would like to thank research unit 127/94 IEETA of the University of Aveiro for the grant thatsupports his work.
The polygonal models used are courtesy of Cyberware, Stanford University and 3D Cafe.
REFERENCES
1. M. Levoy et al., “The digital Michelangelo project: 3D scanning of large statues,” in Proc. SIGGRAPH2000, pp. 131–144, 2000.
2. F. Losasso, I. Geoffrey, E. Guendelman, and R. Fedkiw, “Melting and burning solids into liquids and gases,”IEEE Transactions on Visualization and Computer Graphics 12(3), pp. 343–352, 2006.
3. D. P. Luebke, “A developer’s survey of polygonal simplification algorithms,” IEEE Computer Graphics andApplications 21(3), pp. 24–35, 2001.
4. P. Cignoni, C. Montani, and R. Scopigno, “A comparison of mesh simplification algorithms,” Computersand Graphics 22(1), pp. 37–54, 1998.

5. B. E. Rogowitz and H. E. Rushmeier, “Are image quality metrics adequate to evaluate the quality ofgeometric objects?,” in Proc. SPIE 2001 vol. 4299, Human Vision and Electronic Imaging VI, pp. 340–348,2001.
6. B. Watson, A. Friedman, and A. McGaffey, “Measuring and predicting visual fidelity,” in Proc. SIGGRAPH2001, pp. 213–220, 2001.
7. S. Silva, B. S. Santos, J. Madeira, and C. Ferreira, “Comparing three methods for simplifying mesh modelsof the lungs: an observer test to assess perceived quality,” in Proc. SPIE 2005 vol. 5749, Image Perception,Observer Performance, and Technology Assessment, pp. 99–110, 2005.
8. S. Silva, C. Ferreira, J. Madeira, and B. S. Santos, “Perceived quality of simplified polygonal meshes:Evaluation using observer studies,” in Proc. Ibero-American Symposium in Computer Graphics SIACG06,pp. 169–178, (Santiago de Compostela, Spain), 2006.
9. B. S. Santos, S. Silva, C. Ferreira, and J. Madeira, “Comparison of methods for the simplification of meshmodels of the lungs using quality indices and an observer study,” in 3rd International Conference on MedicalInformation Visualization - Biomedical Visualization (MediVis’05), pp. 15–21, IEEE CS Press, 2005.
10. F. G. M. Silva and A. J. P. Gomes, “Normal-based simplification algorithm for meshes,” in Proc. of Theoryand Practice of Computer Graphics (TPCG’04), pp. 211–218, IEEE CS Press, 2004.
11. M. Garland and P. S. Heckbert, “Surface simplification using quadric error metrics,” in Proc. SIGGRAPH1997, pp. 209–216, 1997.
12. S. Silva, J. Madeira, and B. S. Santos, “Polymeco - a polygonal mesh comparison tool,” in Proc. 9thInternational Conference on Information Visualization IV05, pp. 842–847, IEEE CS Press, 2005.
13. E. Puppo and R. Scopigno, “Simplification, LOD and multiresolution — principles and applications,” Eu-rographics Tutorial Notes , 1997.
14. P. Cignoni, C. Rocchini, and R. Scopigno, “Metro: measuring error on simplified surfaces,” ComputerGraphics Forum 17(2), pp. 167–174, 1998.
15. L. Zhou and A. Pang, “Metrics and visualization tools for surface mesh comparison,” in Proc. SPIE 2001vol 4302, Visual Data Exploration and Analysis VIII, pp. 99–110, 2001.
16. N. Aspert, D. Santa-Cruz, and T. Ebrahimi, “MESH: Measuring errors between surfaces using the hausdorffdistance,” in Proc. IEEE Int. Conf. in Multimedia and Expo 2002, 1, pp. 705–708, (Lausanne, Switzerland),2002.
17. M. Roy, S. Foufou, and F. Truchetet, “Mesh comparison using attribute deviation metric,” Int. Journal ofImage and Graphics 4(1), pp. 1–14, 2004.
18. M. Meyer, M. Desbrun, P. Schroder, and A. H. Barr, “Discrete differential-geometry operators for triangu-lated 2-manifolds,” Visualization and Mathematics 3, pp. 34–57, 2002.
19. P. P. Pebay and T. J. T. J. Baker, “Analysis of triangle quality measures,” Mathematics of Computa-tion 72(244), pp. 1817–1839, 2003.
20. C. H. Lee, A. Varshney, and D. W. Jacobs, “Mesh saliency,” in Proc. SIGGRAPH 2005, pp. 659–666, 2005.
21. Z. Karni and C. Gotsman, “Spectral compression of mesh geometry,” in Proc. SIGGRAPH 2000, pp. 279–286, 2000.
22. S. Sorkine, D. Cohen-Or, and S. Toledo, “High-pass quantization for mesh encoding,” in Proc. EurographicsSymposium on Geometry Processing, pp. 42–51, 2003.
23. L. Bergman, B. Rogowitz, and L. Treinish, “A rule-based tool for assisting colormap selection,” in 6th IEEEVisualization Conference, pp. 118–125, 1995.
24. H. Levkowitz and G. Herman, “Color scales for image data,” IEEE Computer Graphics and Applica-tions 12(1), pp. 72–80, 1992.
25. G. Sußner, G. Greiner, and S. Augustiniack, “Interactive examination of surface quality on car bodies,”Computer-Aided Design 36, pp. 425–436, 2004.
Copyright © 2022 FDOKUMEN