Effectiveness of impedance parameters for muscle quality ...
Upload
independentCategory
view
1download
0
Evaluation of different stimulation and measurement patterns based on internal electrode: application in
cardiac impedance tomography J. Nasehi Tehrani1, T.I. Oh2, C. Jin1, A. Thiagalingam3, A. McEwan1
1School of Electrical and Information Engineering, CARLAB The University of Sydney, NSW Australia 2Dept of Biomedical Engineering, Kyung Hee University, South Korea. 3Dept of Echocardiography, Westmead Hospital, NSW, Australia.
Abstract. The conductivity distribution around the thorax is altered during the cardiac cycle due to the blood perfusion, heart contraction and lung inflation. Previous studies showed that these bio-impedance changes are appropriate for non-invasive cardiac function imaging using Electrical Impedance Tomography (EIT) techniques. However, the spatial resolution is presently low. One of the main obstacles in cardiac imaging at the heart location is the large impedance variation of the lungs by respiration and muscles on the dorsal and posterior side of the body. In critical care units there is a potential to insert an internal electrode inside the oesophagus directly behind the heart in the same plane of the external electrodes. The aim of the present study is to evaluate different current stimulation and measurement patterns with both external and internal electrodes. Analysis is performed with planar arrangement of 16 electrodes for a simulated 3D cylindrical tank and pig thorax model. In our study we evaluated current injection patterns consisting of adjacent, diagonal, trigonometric, and radial to the internal electrode. The performance of these arrangements was assessed using quantitative methods based on distinguishability, sensitivity and GREIT (Graz consensus Reconstruction algorithm for Electrical Impedance Tomography). Our evaluation shows that an internal electrode configuration based on the trigonometric injection patterns has better performance and improves pixel intensity of the small conductivity changes related to heart near 1.7 times in reconstructed images and also shows more stability with different levels of added noise. For internal electrode when we combined radial or adjacent injection with trigonometric injection pattern we found an improvement in amplitude response. However, combination of diagonal with trigonometric injection pattern deteriorated the shape deformation (correlation coefficient 𝑟 = 0.344 ) more than combination of radial and trigonometric injection (correlation coefficient 𝑟 = 0.836) for the perturbations in the area close to the centre of the cylinder. We also find that trigonometric stimulation pattern performance is degraded in a realistic thorax model with anatomical asymmetry. For that reason we recommend using internal electrodes only for voltage measurements and as a reference electrode during trigonometric stimulation patterns in practical measurements. Keywords: electrical impedance tomography, finite element, measurement patterns, distinguishability, regularization, GREIT
1) Introduction For medical diagnostic purposes there is an increasing need for non-invasive or minimally invasive techniques for evaluating the functional status of the heart. The current gold standard techniques for measuring cardiac ejection fraction, such as MRI, CT and echocardiography, are expensive and do not offer continuous monitoring. Electrical Impedance Tomography (EIT) was presented in 1987 by Brown and Seagar [1, 2]. As a non-invasive technique, this method has the potential for real-time bed-side assessment of electrical impedance changes within the human body. One of the current medical
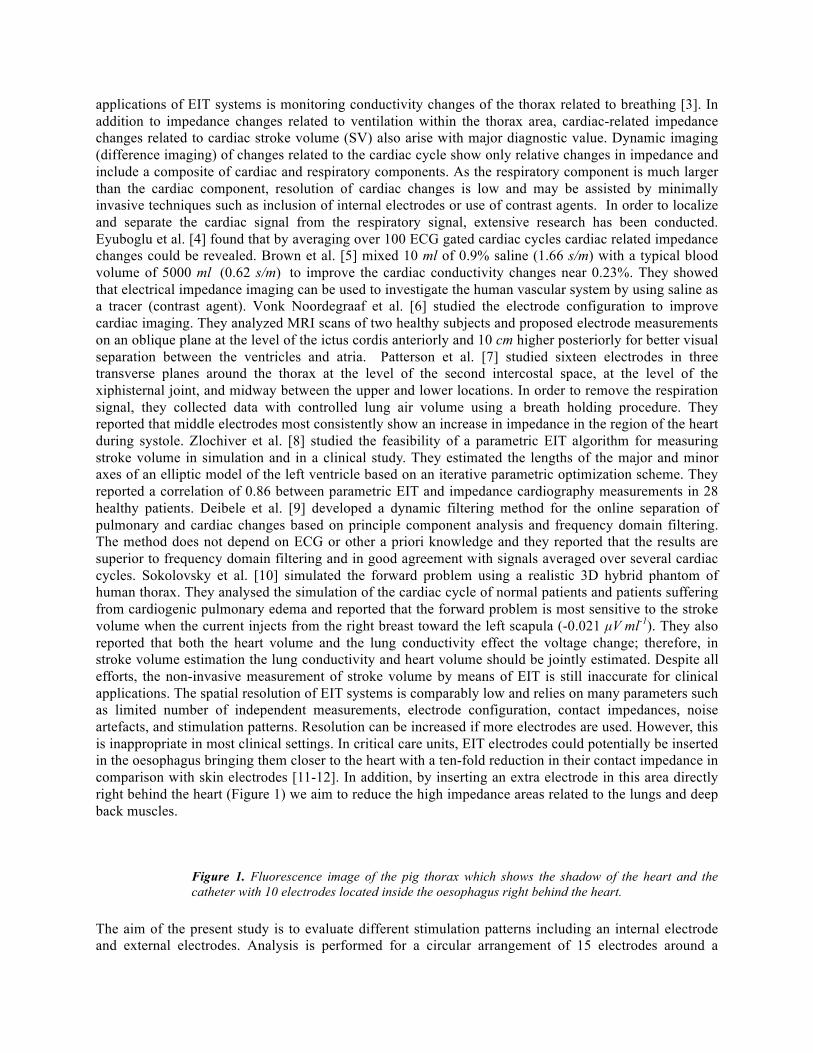
applications of EIT systems is monitoring conductivity changes of the thorax related to breathing [3]. In addition to impedance changes related to ventilation within the thorax area, cardiac-related impedance changes related to cardiac stroke volume (SV) also arise with major diagnostic value. Dynamic imaging (difference imaging) of changes related to the cardiac cycle show only relative changes in impedance and include a composite of cardiac and respiratory components. As the respiratory component is much larger than the cardiac component, resolution of cardiac changes is low and may be assisted by minimally invasive techniques such as inclusion of internal electrodes or use of contrast agents. In order to localize and separate the cardiac signal from the respiratory signal, extensive research has been conducted. Eyuboglu et al. [4] found that by averaging over 100 ECG gated cardiac cycles cardiac related impedance changes could be revealed. Brown et al. [5] mixed 10 ml of 0.9% saline (1.66 s/m) with a typical blood volume of 5000 ml (0.62 s/m) to improve the cardiac conductivity changes near 0.23%. They showed that electrical impedance imaging can be used to investigate the human vascular system by using saline as a tracer (contrast agent). Vonk Noordegraaf et al. [6] studied the electrode configuration to improve cardiac imaging. They analyzed MRI scans of two healthy subjects and proposed electrode measurements on an oblique plane at the level of the ictus cordis anteriorly and 10 cm higher posteriorly for better visual separation between the ventricles and atria. Patterson et al. [7] studied sixteen electrodes in three transverse planes around the thorax at the level of the second intercostal space, at the level of the xiphisternal joint, and midway between the upper and lower locations. In order to remove the respiration signal, they collected data with controlled lung air volume using a breath holding procedure. They reported that middle electrodes most consistently show an increase in impedance in the region of the heart during systole. Zlochiver et al. [8] studied the feasibility of a parametric EIT algorithm for measuring stroke volume in simulation and in a clinical study. They estimated the lengths of the major and minor axes of an elliptic model of the left ventricle based on an iterative parametric optimization scheme. They reported a correlation of 0.86 between parametric EIT and impedance cardiography measurements in 28 healthy patients. Deibele et al. [9] developed a dynamic filtering method for the online separation of pulmonary and cardiac changes based on principle component analysis and frequency domain filtering. The method does not depend on ECG or other a priori knowledge and they reported that the results are superior to frequency domain filtering and in good agreement with signals averaged over several cardiac cycles. Sokolovsky et al. [10] simulated the forward problem using a realistic 3D hybrid phantom of human thorax. They analysed the simulation of the cardiac cycle of normal patients and patients suffering from cardiogenic pulmonary edema and reported that the forward problem is most sensitive to the stroke volume when the current injects from the right breast toward the left scapula (-0.021 µV ml-1). They also reported that both the heart volume and the lung conductivity effect the voltage change; therefore, in stroke volume estimation the lung conductivity and heart volume should be jointly estimated. Despite all efforts, the non-invasive measurement of stroke volume by means of EIT is still inaccurate for clinical applications. The spatial resolution of EIT systems is comparably low and relies on many parameters such as limited number of independent measurements, electrode configuration, contact impedances, noise artefacts, and stimulation patterns. Resolution can be increased if more electrodes are used. However, this is inappropriate in most clinical settings. In critical care units, EIT electrodes could potentially be inserted in the oesophagus bringing them closer to the heart with a ten-fold reduction in their contact impedance in comparison with skin electrodes [11-12]. In addition, by inserting an extra electrode in this area directly right behind the heart (Figure 1) we aim to reduce the high impedance areas related to the lungs and deep back muscles.
Figure 1. Fluorescence image of the pig thorax which shows the shadow of the heart and the catheter with 10 electrodes located inside the oesophagus right behind the heart.
The aim of the present study is to evaluate different stimulation patterns including an internal electrode and external electrodes. Analysis is performed for a circular arrangement of 15 electrodes around a

simulated 3D tank and a pig thorax model with 1 internal electrode located at the center of the models [13]. The finite element models (FEM) were created by Netgen [14]. Simulations were performed with Electrical Impedance Tomography, Diffuse Optical Tomography Reconstruction Software (EIDORS) which is a linear finite element solver written in Matlab. This software was developed to promote collaboration between research groups working on EIT and diffusion based optical tomography, in medical and industrial settings [15]. For quantitative evaluation of the stimulation patterns, we implemented methods based on distinguishability [16], sensitivity [17], and the merit figures in GREIT (Graz consensus Reconstruction algorithm for EIT) [18]. GREIT is linear reconstruction algorithm which designed for EIT, since early discussions took place at the International Conference on Electrical Bioimpedance (ICEBI) 2007 in Graz, Austria. The aim of GREIT is to develop standard evaluation parameters which have broad agreement from experts in the mathematical, engineering, physiological and clinical EIT communities. This paper is organized as follows: first, we describe the simulation and illustration of voltage and current distribution with the internal electrode. Second, we describe the evaluation of a cylindrical tank model with a small perturbation for characterizing detectability, and GREIT parameters for different stimulation patterns. Third, we provide an analysis of the sensitivity of stimulation patterns in the pig thorax model, considering lungs, spinal cord, and small changes related to the heart conductivity. Finally, the effect of changes in lung conductivity in these images is evaluated.
2) Simulated FEM with internal electrode Our simulation is based on the conventional arrangement of 16 surface electrodes encircling the medium in a single plane (z=1). For an internal catheter electrode, we removed the surface electrode located at the furthest point from the heart, and placed this internally. The left image in Figure 2 shows a CT scan of the pig thorax. This was segmented and meshed to develop the 3D FEM mesh model (right image in Figure 2). The FEM includes regions relating to the heart, lungs (green), spinal cord (large, posterior, white cylinder) and small regions of the heart for modelling conductivity changes. The red cylinders show the location of the surface electrodes including electrode 9 (most anterior) which was moved internally. The small empty cylindrical area with 0.1 unit diameter in the middle of the lungs is the location of this internal electrode (electrode 9). The perturbation of interest was a small variation of conductivity within the heart region, represented by the small blue 0.05 unit diameter cylinder (inner area of the heart). The simulated conductivities are given in table 1. In order to make the simulations more realistic we add zero mean Gaussian noise with an SNR equal to 3. SNR is defined in terms of power SNR = ||signal||/||noise ||. We simulate the measured difference voltage between homogenous voltages (vh) (background) and inhomogeneous voltages (vi) caused by a 10% change in the small perturbations of interest related to the heart. We included lung conductivity changes of (0.1%, 1%, 10%, and 20 %) to represent different breathing conditions from apnoeic to free breathing as a realistic physiological error source through which we seek to measure the cardiac conductivity change.
Figure 2. Left image shows the CT scan of pig thorax and the right image shows the areas of different conductivities in the pig thorax model.
Two meshes were simulated as shown in Figure 3. The first was a uniform cylindrical tank of 2 units’ diameter and 2 units’ height. An internal catheter of the same diameter as the external electrodes, 0.05 units was included (Figure 3 left). For the cylindrical tank the internal electrode was located in the middle of the simulated tank. The second mesh was based on the pig thorax model, (Figure 3, right), the internal electrode was located in approximately the centre at the location of the oesophagus in the CT scan (-2.5,-1.99,1.05). In both models use of the internal electrode left an empty electrode location on the boundary between electrodes numbered 8 and 10. The spacing of the electrodes was not adjusted to account for this. For the pig thorax model the diameter of the catheter was increased to 0.15 units to

account for the larger size of the boundary and in line with oesophagus area in CT image Figure 2 (left). As has been demonstrated in figure 3, for both models the internal electrode was raised (to z=1.05) slightly above the plane of the external electrodes so that its inclusion did not alter the electric field dramatically. In the pig thorax model, right, the contrasting region in red is the small simulated conductivity changes of the heart region.
Figure 3. Shows finite element models used for simulation of the internal electrode. For the cylindrical tank, left, the internal electrode was located in the middle of the simulated tank. For the pig thorax model, right, the internal electrode was located in approximately the centre at the location of the oesophagus in the CT scan (-2.5,-1.99,1.05).
We adopted widely used values for the conductivity of the blood oesophagus, spinal cord, and the inflated lungs at a frequency of 50 kHz (http://niremf.ifac.cnr.it/tissprop/) (Table 1) [20].
The cylindrical tank forward model mesh consisted of 54144 elements and 11973 nodes and the pig thorax forward model mesh consisted of 114521 elements, and 21918 nodes. Avoiding the so called ‘‘inverse crime’’ [22] the meshes with less elements were used for the inverse. Figure 4 left shows electrode numbering and location of the internal electrodes on the 2D model of the thorax. Figure 4 right shows the voltage distribution and current distributions for current injection between electrodes 9 and 8 for a 2D slice of the forward model at z= 1.5.
Figure 4. Left Mesh used for the inverse image reconstruction of the pig thorax simulation with electrode numbering and location of the internal electrodes. The internal electrode was electrode number 9 located at (-2.5,-1.99). Figure right shows voltage distribution in red and blue color and current distribution with black arrows for stimulation between electrode 9 in oesophagus and 8 in a slice at z= 1.5.
3) Distinguishability The concept of distinguishability was introduced by Isaacson in 1986 [23]. The distinguishability factor expresses how well EIT can distinguish a pattern of clinical interest from a benign one. The probability of distinguishability can be computed by the z-score [19]:
where ∆m =(m1) -(m2) is the difference between the means of a distribution of measurements in the region of interest (ROI), and sm is the standard deviation. As Z increases, the probability of error decreases corresponding to the increasing capability of imaging, for that reason Z in some studies is interpreted as a measure of image Signal to Noise Ratio (SNR). Measurements and current stimulation patterns play an equivalent role in the calculation of distinguishability. In order to evaluate the different stimulations patterns a distinguishability test was performed on the cylindrical tank with seven small spheres arranged horizontally inside the cylinder [19] (figure 5 shows the cylinder from two different views). Each sphere was simulated as an individual conductivity change. The mesh elements of all spheres were included in each simulation to ensure that the mesh was identical.

Figure 5. Distinguishability simulations of a small sphere moved across the tank in line between the external positions of electrode number 9 and electrode number 1. Electrode number 9 was the internal electrode located in the middle of the tank. The left image shows the x view with an empty space on the boundary where electrode 9 was previously positioned. The right image shows the y view with 7 spheres located at z=1.5.
4) Stimulation and voltage measurement pattern Mathematically the sensitivity matrix used to reconstruct the EIT images is computed using Geselowitz’s [24] sensitivity theorem:
This matrix characterizes the variations in the impedance of the body R (composed of uniform conductivities σm ) which are produce by the small conductivity changes δσm in volume elements dv. Is is the current injected from the source electrodes and ∇u(Is ) is electric field produced by this current. ∇u(Im ) is the reciprocal electric field that would be produced by the measuring electrodes in the original medium if they injected current Im. Reciprocity is a useful method of assessing the measurement setup as it indicates well this assumption will hold in the reconstruction. In order to evaluate stimulation patterns related to the internal electrode, we changed the conductivity of the cylindrical perturbation with diameter of 0.05 units (10% variation in conductivity [17]) and calculated the sensitivity matrix with different stimulation patterns. Current stimulation patterns evaluated in our study were adjacent, diagonal, trigonometric and radial to the internal electrode. The adjacent and diagonal patterns are widely used as they are sensitive to boundary and central changes respectively when external electrodes are used. The trigonometric stimulation pattern has been shown to provide the greatest distinguishability for circular boundaries and perturbations. In a sense this preserves reciprocity but in practice trigonometric voltage sensing would be limited by SNR. The stimulation pattern based on radial injection is shown in Figure 6 and Table 2. For the radial injection pattern the positive terminal of the current source is connected to electrode 9, and then the negative current terminal is multiplexed to electrode 16 then electrode 1 (as shown here), electrode 2 and so on until electrode 15 as described in Table 2. Figure 4, and 6 show the electrode numbering and electrode locations. For all current stimulation patterns the voltage measurement patterns are in the adjacent format starting from electrode 16 and electrode 1, then electrodes 1-2, 2-3, 3-4 and so on until electrodes 15-16.
Figure 6. The radial injection pattern with the positive terminal of the current source connected to electrode 9 and the negative terminal of the current source connected to electrode number 2. Other electrodes used for measuring adjacent voltages around the medium.
5. Results
5.1. Simulated tank Figure 7 shows the distinguishability (Z) of different stimulation patterns on the cylindrical model. The horizontal axes are the location of the activated sphere inside the cylinder (the space between adjacent spheres is 0.25). In all the graphs the curve in red relates to the trigonometric stimulation pattern, the green curve relates to the diagonal stimulation pattern, the black curve relates to the radial stimulation pattern and the blue curve shows the parameters related to the adjacent stimulation. In Figure 8 we
focused on demonstrating the GREIT parameters related to the perturbation introduced to the inner area of the cylinder (0.1 to 0.5 units from the center with 0.02 units step movement of perturbation). In this study we did not consider perturbations located close to the boundaries, as firstly we were interested in changes in the heart region and secondly as voltage measurement patterns for all stimulations are adjacent. These are known to show very similar effects when the object is located close to the boundaries [19]. Figure 9a shows the reconstruction result using the trigonometric injection pattern using internal electrode and circular arrangement of electrode (External electrodes). In the third column value of x shows the distance of perturbation from centre. Figure 9b shows the density curves of the resolution related to the internal and external electrodes for perturbations located 0.1 to 0.5 units from the centre. Table 3 also shows the mean and the bandwidth of each distribution.
Figure 7. Distinguishability (Z) of a sphere shape conductivity at various center positions from y= -0.75 to y=0.75. Zero is the center of the cylinder.
Figure 8. The GREIT parameters calculated for the spherical perturbation located at the height of 0.5 units with the diameter 0.05 units. (A) Amplitude response (AR), (B) position error (PE) (C) resolution (RES), (D) shape deformation (SD) and (E) ringing effects (RNG).
Figure 9a. Comparison of external and internal electrode with the trigonometric pattern. The first column shows the result of reconstruction by the trigonometric stimulation pattern with all electrodes located externally. The second row shows the trigonometric stimulation pattern using one internal electrode. The spherical perturbation with 0.05 units diameter was moved from location 0.1 to 0.45 units from the center of the cylinder from first row to the last row as shown in the third column.
Figure 9b. Density curves of resolution for external and internal electrode with the trigonometric stimulation pattern. The red curve shows density curve for resolution of the spherical perturbation with 0.05 units diameter located from 0.1 to 0.5 units from the centre (The number of samples are 100). The regularization parameter is 𝜆 =0.005.
5.2. Pig thorax model In order to further study stimulation patterns using internal electrodes we evaluated the sensitivity matrix for the cylinder and the pig thorax FEM model. In figure 10 we plot the 45 most sensitive voltage measurements for different current patterns. These were extracted from the sensitivity matrices and sorted. The simulation was of a 10% conductivity change with a diameter 0.1 units located in the pig thorax model between the lungs and close to the internal electrode. Figure 10 shows that the trigonometric injection pattern has many higher sensitivity measurements to such a perturbation. For both cylindrical and the pig thorax model, we found that these higher sensitivities are related to the electrodes located on the front plane (anterior). The highest sensitivities for the radial injection were from the measurements with injection pattern between electrode 9 (internal electrode) and electrode 1 when the voltage was measured between electrode 2, and 3 or 15 and 16. The mean sensitivity of the 45 highest values of the trigonometric patterns is over two times the adjacent stimulation pattern.

Figure 10. Plot of the 45 the highest voltage sensitivity measured for different method of injection in decreasing order.
5.2.1. Combination of stimulation patterns
The GREIT parameters in section 5.1, and 5.2 showed that the amplitude response and sensitivity curves of diagonal injection pattern are better than radial injection. However, Figure 8D shows that the shape deformation curve for diagonal injection pattern has unexpected results for area between 0.1 to 0.3 units from the centre. In this section the combination of trigonometric pattern with radial and diagonal stimulation patterns (The number of measurements increased up to 496) were investigated. We evaluated 100 perturbations where located from 0.1 to 0.3 units distance from the centre of the cylinder. Amplitude response and shape deformation curves were calculated for both combinations (Figure 11a). The scatter plots, the kernel density plots and also statistical evaluation for both combinations have been shown in Figure 11b, and Table 4.
Figure 11a. GREIT parameters for combination of the stimulation patterns. The red curves show the trigonometric stimulation stand alone, the green curves show the combination of the trigonometric and diagonal injection, and the black curves are for the trigonometric and radial stimulation. Although the combination of the trigonometric and diagonal shows better amplitude response , shape deformation of the combination of trigonometric and diagonal stimulation increased for inner areas (from 0.1 to 0.3). This related to the shadowing of internal electrode and previously has been shown in figure 8D.
Figure 11b. The first row shows the scatter plots of the amplitude response between trigonometric pattern and the combination of this method with diagonal and Radial injection patterns. The second row shows the scatter plots of the shape deformation between trigonometric pattern and the combination of this method with diagonal and Radial injection patterns. The sample size is 100 points and related to the locations between 0.1 to 0.3 units from the center. The third row shows the kernal density plots of AR, and SD distributiosn for three methods.
The reconstructed images, Figures 12 and 13 are cross-sections at z=1 with 500×500 pixels, here the corresponding locations of the internal electrode was (250,199). Figure 12 shows an example of reconstruction when using the internal electrode 9 as an active electrode and the internal electrode 9 only for voltage measurement under the same conditions in the trigonometric pattern (0.1% changes to the lung conductivity). The perturbation typically located near the boundary area (250, 100)). There is clearly a large degree of distortion in Figure 12 left (with internal active electrode) which we hypothesized was due to the asymmetry of the pig thorax model. The trigonometric stimulation pattern was designed for circular boundaries with circular anomalies in a homogenous medium. Our realistic pig mesh departs from this assumption and therefore we suspect that the trigonometric basis function is not ideal in this scenario. In Figure 12 right, there is clearly less distortion so we adopted this stimulation pattern in subsequent simulations, (trigonometric with the internal electrode only used for voltage measurement). The conversion of trigonometric current patterns to adjacent voltage measurements as adopted in previous works is only valid for circular boundaries. When using the internal electrode as a voltage sensing electrode it is acting in a similar way to the reference electrode, imposing additional boundary conditions to allow one to determine more unique solution.

Figure 13 shows the result when different percentage changes in lung conductivities (0.1%, 1%, 10%, and 20%) were simulated to represent physiological noise and the target conductivity change was 10% related to the heart center at pixel number (250,150). We consider small lung conductivity changes with SNR of signal equal to 3 as in critical care unit, specialists have access to the esophageal area through catheters for the internal electrode and the ventilation can be controlled to decrease lung conductivity changes to less than 10% [12]. For lung conductivity changes up to 20% the qualitative position error of the reconstructed signal and normalized pixel intensities related to the heart area also shown in a horizontal profile in Figure 14. The profiles in the Figure 14 are related to the horizontal conductivity changes (across the x-axis) with y=150. The amplitude response and position error can be inferred from these plots as GREIT parameters are not defined for irregular shapes. The normalized value of the heart pixel intensities related to the Figure 14 is shown in Table 5.
Figure 12. (a) Trigonometric stimulation with electrode 9 used for stimulation and measurement. (b)Trigonometric stimulation with electrode 9 only used for voltage measurement. The noise artefact is 0.1% and perturbation centered at the pixel corresponding to (250,100). Where the images are displayed in 500×500 pixels.
Figure 13. The perturbation centred at the pixel corresponding to (250,150) in the inner area of the heart. From left to right the conductivity of lung changes 0.1%, 1%, 10%, and 20%. For first row we used trigonometric stimulation with electrode 9 in oesophagus only used for voltage measurement. For second row we used trigonometric stimulation with encircled electrodes around thorax without internal electrode.
Figure 14. Profiles of conductivity changes were demonstrated across the x-axis. The upper plot shows the profile of the trigonometric stimulation pattern using internal electrode and the lower plot shows the trigonometric stimulation pattern on circular arrangement of electrodes.The dotted line shows the correct location of small changes in heart perturbation in each graph. The lung regions are between pixel numbers (120-170) and (320-380). The perturbation was located at (250,150), the red graph shows 0.1% change, Green shows 1% change, blue shows 10% change, and light cyan shows 20% change in luns conductivity. The conductivity of the lung region follows the simulated changes. To aid comparison, The intensities of pixels were normalized by the maximum intensity of the internal electrode profile.
6. Discussion and conclusion In this paper, we evaluated the use of an internal electrode using different stimulation and measurement patterns to find the optimum configuration for EIT cardiac functional imaging. We implement recent image processing techniques in EIT such as: ability of methods to distinguish perturbations, sensitivity of patterns on a realistic pig thorax model, and GREIT parameters. This study was performed in Matlab and the partial differential equations related to the forward and inverse problems were solved using EIDORS. As expected from previous studies for external arrangement of electrodes [19], our results confirms that the trigonometric stimulation is better than other stimulation patterns in most aspects for models with the internal electrode.
Figure 7 shows that for the cylindrical model, the distinguishability is greater for the locations close to the boundary compared to locations in the middle of the cylinder (between -0.25 to 0.25). The trigonometric stimulation pattern was 1.5 to 3 times better in distinguishability than all other patterns with the adjacent pattern the worst performer. Figure 8 (A, B, and C) shows that amplitude response (AR), position error (PE) and resolution (RES) improved for internal electrode with the trigonometric injection pattern in comparison with other injection patterns with internal electrodes. These advantages decreased with distance from the centre and the trigonometric pattern approached the values of the other stimulation patterns. Figure 8C shows that the diagonal injection pattern has the worst resolution among other injection patterns. The diagonal injection pattern caused the size of the perturbation near the internal electrode to become larger than the expected size of the real perturbation and this issue can easily be seen in the unexpected curve for shape deformation (from 0.1 to 0.3) Figure 8D and the unexpected ringing effect Figure 8E for diagonal injection. This is somewhat expected with use of the internal electrode, modelled here with a non-conducting core in the cylinder. The adjacent stimulation pattern gave lower ringing effect (RNG) and lower shape deformation (SD) than the other patterns (figure 8 (D, and E)). However this method has the lowest amplitude response among the methods. Figure 10 shows that the trigonometric stimulation pattern has higher sensitivity measurements to a small conductivity changes. The lowest sensitivity is related to the radial and adjacent stimulation pattern. Although the radial injection pattern has lower sensitivity in comparison with diagonal injection pattern (Figure 10), Figure 8C, and D show that the curves for resolution, shape deformation and ringing effects were comparable to the results for the adjacent stimulation patterns. For AR, PE (figure 8 (A, B)) this method shows a response close to diagonal pattern. Although the radial injection pattern does not have the high sensitivity of the diagonal injection pattern, Figure 8C, and D show that the curves for resolution, shape deformation and ringing effects were comparable to the results for the adjacent stimulation patterns. In Figure 9a also the reconstructions with trigonometric stimulation pattern with circular arrangement was compared with trigonometric stimulation using internal electrode. The comparison shows that the reconstructed perturbation is less circular, with better resolution, and also less ringing effect on the side of perturbation which is located toward the internal electrode in comparison with the opposite side. In effect the angle of view from internal electrode causes shadowing and increased ringing asymmetrically. Figure 9b shows the resolution kernel density curve for 100 evaluation points (from 0.1 to 0.5 units from the centre) for spherical perturbation with 0.05 units diameter. The mean and the bandwidth of the resolution density curve have been improved by using internal electrode (Table 3). In order to evaluate the effect of combining diagonal and radial stimulation patterns with the trigonometric pattern, we used GREIT parameters in Figure 11a. The results show that the trigonometric stimulation pattern combined with diagonal and radial stimulation pattern improves the amplitude response and resolution for inner areas (0.1 to 0.3 units from the centre). The AR, and RES related to the combination of the trigonometric stimulation pattern with diagonal stimulation is up to 1.3 times better than the combination of trigonometric and radial injection. However based on the scatter plots (Figure 11b first and second row) combination of diagonal with trigonometric injection pattern deteriorated the shape deformation of the object for the area close to the centre of the cylinder with correlation of 0.344 in comparison with the combination of radial and trigonometric injection with correlation of 0.836 (Table 4). This issue expected from previous study which has been shown in Figure 8D (Stand alone diagonal stimulation pattern). Figure 11b the third row shows the AR and SD kernel density plots for each combination (the p-value is less than 0.0075). Overall the combination of trigonometric and radial injection pattern shows improvement in all the aspects except shape deformation which remains is comparable with trigonometric stimulation.

However, using the trigonometric stimulation pattern for the model of the pig thorax causes image distortion as shown in figure 12. This is in agreement with previous work on external electrodes that trigonometric current injection patterns are optimal when the unknown conductivities are radially symmetric [23]. While, the pig mesh is asymmetric in comparison with the cylinder (e.g. the lungs are asymmetric; the oesophagus is not located in the middle of the boundary). For that reason, for the pig mesh we only used the internal electrode for voltage measurement in trigonometric stimulation pattern. Related to this issue, future work will concentrate on improving the trigonometric stimulation pattern by developing the eigenfunctions that provide best distinguishability for non-cylindrical shapes (such as the pig thorax mesh). Using this modified trigonometric stimulation pattern we can detect the small changes related to the heart in the inner area of the lungs with up to 20% change in the conductivity of the lungs (figure 13 first row). This detection is not possible for encircled trigonometric pattern without internal electrode as has been demonstrated in figure 13 second row. The result in figure 13 also shows that using internal electrodes can improve distinguishability of the left and right lungs. Increasing the lung conductivity increases the position error of the small perturbation related to the heart conductivity changes which has been demonstrated in the horizontal slice cut with y=150 (Figure 14). Table 5 also shows that the maximum pixel intensities related to the heart conductivity changes improves with the trigonometric stimulation pattern with internal electrode and deteriorates with increasing the level of the noise. Overall this evaluation demonstrated an improvement in the results with internal electrodes and trigonometric stimulation patterns of low spatial frequency for these reasons; we recommend further exploration of trigonometric functions with internal electrode for cardiac function imaging.
References 1. D.C. Barber and A.D. Seagar ,” Fast reconstruction of resistance images”, Clin. Phys. Physiol. Meas.vol.8,
pp.47–54, 1987. 2. B.H. Brown and A.D. Seagar,” The Sheffield data collection system”, Clin. Phys. Physiol. Meas. vol.8, pp.
91–7, 1987. 3. A. Adler, R. Amyot, R. Guardo , et al. ,“Monitoring changes in lung air and liquid volumes with electrical
impedance tomography”.J Appl. Phys.; vol.83, pp.1762–1767, 1997. 4. B.M. Eyuboglu , B.H. Brown, D.C. Barber, “In vivo imaging of cardiac related impedance changes”, IEEE
Eng Med Biol Mag. vol. 8 ,no.1, pp.39-45, 1989. 5. B. H. Brown, A. Leathard, A. Sinton, F. J. McArdle, R. W. M. Smith, D. C. Barber, ”Blood flow imaging
using electrical impedance tomography”, Clin. Phys. Physiol. vol.13, suppl. A, pp.175-179, 1992. 6. A. V. Noordegraaf, T.J.C. Faes, A. Janse, J.T. Marcus, “Improvement of cardiac imaging in electrical
impedance tomography by means of a new electrode configuration”, Phys. Meas. Vol.17,pp.179-188, 1996. 7. R. P. Patterson, J. Zhang, L. I. Mason, and M. Jerosch-Herold, “Variability in the cardiac EIT image as a
function of electrode position, lung volume and body position,” Phys. Meas., vol.22, pp. 159-166, 2001. 8. S. Zlochiver, D. Freimark, M. Arad, “Parametric EIT for monitoring cardiac stroke volume”, Phys. Meas.
vol. 27, pp.139-146, 2006. 9. J.M. Deibele, H. Luepschen, and S. Leonhardt,” Dynamic separation of pulmonary and cardiac changes in
electrical impedance tomography”, Phys.Meas. vol.29, pp.1-14, 2008. 10. R.E. Sokolovsky, S.Zlochiver, and S. Abboud,” Stroke volume estimation in heart failure patients using
bioimpedance: a realistic simulation of the forward problem”, phys. Meas. vol.29, pp.139-149, 2008.

11. S. Gabriel, R.W. Lau, and C. Gabriel, “The dielectric properties of biological tissues: II. Measurements in the frequency range 10 Hz to 20 GHz,” Phys. Med. Biol., vol.41, no.11, pp. 2251-69, 1996.
12. J. Nasehi Tehrani, C. Jin, A. L. McEwan, “Modelling of an oesophageal electrode for cardiac function tomography”, Comp. Math. Meth. Med. Vol.2012, doi:10.1155/2012/585786.
13. I. Frerichs, G. Hahn, T. Schröder, G. Hellige,”Electrical impedance tomography in monitoring experimental lung injury” Intensive Care Med. Vol.24, pp.829-836, 1998.
14. J. Schöberl, “Netgen an advancing front 2D/3D mesh generator based on abstract rules “,Comput. Vis. Sci. vol.1, pp.41-52, 1997.
15. A. Adler, W.R.B. Lionheart, “Uses and abuses of EIDORS: an extensible software base for EIT,” Phys. Meas., vol.27, pp. 25-42, 2006.
16. Y. Maimaitijiang, Stephan Böhm, Obaydah Jaber, Andy Adler, “A phantom based system to evaluate EIT performance,” Int. Conf. Electrical Bio-Impedance & Electrical Impedance Tomography Gainsville, Fl, USA, 4-8 April 2010.
17. A.Borsic, R. Halter, Y. Wan, A. Hartov, and K. D. Paulsen, “Sensitivity study and optimization of a 3D electric impedance tomography prostate probe”, phys. Meas. Vol.30, pp.1-18, 2009.
18. A. Adler, J. H. Arnold, R. Bayford, A. Borsic, B. Brown, P. Dixon, T. J. C. Faes, I. Frerichs, H. Gagnon, Y. Gärber, B. Grychtol, G. Hahn, W. R. B. Lionheart, A. Malik, R. P. Patterson, J. Stocks, A. Tizzard, N. Weiler and G. K. Wolf, “GREIT: a unified approach to 2D linear EIT reconstruction of lung images,” Phys. Meas., vol.30, pp. 35-55, 2009.
19. A.Adler, P. O. Gaggero, and Y. Maimaitijiang, “Adjacent stimulation and measurement patterns considered harmful”, Phys. Meas. Vol. 32, pp.731-744, 2011.
20. C. Gabriel, S. Gabriel and E. Corthout, “The dielectric properties of biological tissues: Literature survey,” Phys. Med. Biol., vol.41, pp. 2231-2249, 1996.
21. A. Adler, R. Guardo, and Y. Berthiaume,”Impedance imaging of lung ventilation: do we need to account for chest expansion”, IEEE Trans. Biomed. Eng. Vol.43, pp.414-421, 1996.
22. W. R. B. Lionheart, “EIT reconstruction algorithms: pitfalls, challenges and recent developments,” Phys. Meas., vol.25, no.1, pp. 125-142, 2004.
23. D. Isaacson, "Distinguishability of conductivities by electric current computed tomography", IEEE Trans. Med.Imaging, vol.5 pp.91–95, 1986.
24. D. B. Geselowitz, "An application of electrocardiographic lead theory to impedance plethysmography", IEEE Trans. Biomed. Eng. Vol.18, pp.38–41, 1971.
Copyright © 2022 FDOKUMEN