Evaluation of C-band SAR data for wetlands mapping
18
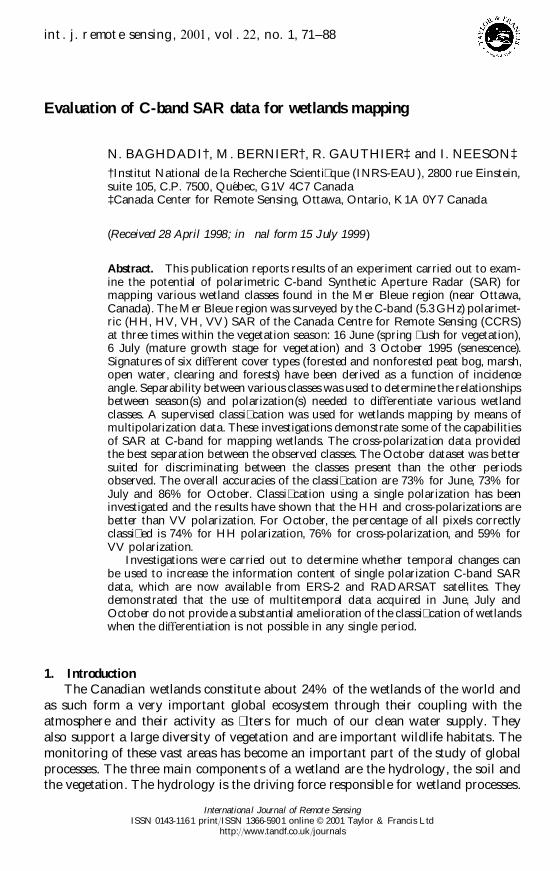
int. j. remote sensing, 2001 , vol. 22, no. 1, 71–88 Evaluation of C-band SAR data for wetlands mapping N. BAGHDADI†, M. BERNIER†, R. GAUTHIER‡ and I. NEESON‡ †Institut National de la Recherche Scienti que (INRS-EAU), 2800 rue Einstein, suite 105, C.P. 7500, Que ´bec, G1V 4C7 Canada ‡Canada Center for Remote Sensing, Ottawa, Ontario, K1A 0Y7 Canada (Received 28 April 1998; in nal form 15 July 1999 ) Abstract. This publication reports results of an experiment carried out to exam- ine the potential of polarimetric C-band Synthetic Aperture Radar (SAR) for mapping various wetland classes found in the Mer Bleue region (near Ottawa, Canada). The Mer Bleue region was surveyed by the C-band (5.3 GHz) polarimet- ric (HH, HV, VH, VV) SAR of the Canada Centre for Remote Sensing (CCRS) at three times within the vegetation season: 16 June (spring ush for vegetation), 6 July (mature growth stage for vegetation) and 3 October 1995 (senescence). Signatures of six diŒ erent cover types (forested and nonforested peat bog, marsh, open water, clearing and forests) have been derived as a function of incidence angle. Separability between various classes was used to determine the relationships between season(s) and polarization(s) needed to diŒ erentiate various wetland classes. A supervised classi cation was used for wetlands mapping by means of multipolarization data. These investigations demonstrate some of the capabilities of SAR at C-band for mapping wetlands. The cross-polarization data provided the best separation between the observed classes. The October dataset was better suited for discriminating between the classes present than the other periods observed. The overall accuracies of the classi cation are 73% for June, 73% for July and 86% for October. Classi cation using a single polarization has been investigated and the results have shown that the HH and cross-polarizations are better than VV polarization. For October, the percentage of all pixels correctly classi ed is 74% for HH polarization, 76% for cross-polarization, and 59% for VV polarization. Investigations were carried out to determine whether temporal changes can be used to increase the information content of single polarization C-band SAR data, which are now available from ERS-2 and RADARSAT satellites. They demonstrated that the use of multitemporal data acquired in June, July and October do not provide a substantial amelioration of the classi cation of wetlands when the diŒ erentiation is not possible in any single period. 1. Introduction The Canadian wetlands constitute about 24% of the wetlands of the world and as such form a very important global ecosystem through their coupling with the atmosphere and their activity as lters for much of our clean water supply. They also support a large diversity of vegetation and are important wildlife habitats. The monitoring of these vast areas has become an important part of the study of global processes. The three main components of a wetland are the hydrology, the soil and the vegetation. The hydrology is the driving force responsible for wetland processes. International Journal of Remote Sensing ISSN 0143-1161 print/ISSN 1366-5901 online © 2001 Taylor & Francis Ltd http://www.tandf.co.uk/journals
-
Upload
independent -
Category
Documents
-
view
0 -
download
0
Transcript of Evaluation of C-band SAR data for wetlands mapping
int. j. remote sensing, 2001, vol. 22, no. 1, 71–88
Evaluation of C-band SAR data for wetlands mapping
N. BAGHDADI†, M. BERNIER†, R. GAUTHIER‡ and I. NEESON‡
†Institut National de la Recherche Scienti� que (INRS-EAU), 2800 rue Einstein,suite 105, C.P. 7500, Quebec, G1V 4C7 Canada‡Canada Center for Remote Sensing, Ottawa, Ontario, K1A 0Y7 Canada
(Received 28 April 1998; in � nal form 15 July 1999 )
Abstract. This publication reports results of an experiment carried out to exam-ine the potential of polarimetric C-band Synthetic Aperture Radar (SAR) formapping various wetland classes found in the Mer Bleue region (near Ottawa,Canada). The Mer Bleue region was surveyed by the C-band (5.3 GHz) polarimet-ric (HH, HV, VH, VV) SAR of the Canada Centre for Remote Sensing (CCRS)at three times within the vegetation season: 16 June (spring � ush for vegetation),6 July (mature growth stage for vegetation) and 3 October 1995 (senescence).Signatures of six diŒerent cover types (forested and nonforested peat bog, marsh,open water, clearing and forests) have been derived as a function of incidenceangle. Separability between various classes was used to determine the relationshipsbetween season(s) and polarization(s) needed to diŒerentiate various wetlandclasses. A supervised classi� cation was used for wetlands mapping by means ofmultipolarization data. These investigations demonstrate some of the capabilitiesof SAR at C-band for mapping wetlands. The cross-polarization data providedthe best separation between the observed classes. The October dataset was bettersuited for discriminating between the classes present than the other periodsobserved. The overall accuracies of the classi� cation are 73% for June, 73% forJuly and 86% for October. Classi� cation using a single polarization has beeninvestigated and the results have shown that the HH and cross-polarizations arebetter than VV polarization. For October, the percentage of all pixels correctlyclassi� ed is 74% for HH polarization, 76% for cross-polarization, and 59% forVV polarization.
Investigations were carried out to determine whether temporal changes canbe used to increase the information content of single polarization C-band SARdata, which are now available from ERS-2 and RADARSAT satellites. Theydemonstrated that the use of multitemporal data acquired in June, July andOctober do not provide a substantial amelioration of the classi� cation of wetlandswhen the diŒerentiation is not possible in any single period.
1. IntroductionThe Canadian wetlands constitute about 24% of the wetlands of the world and
as such form a very important global ecosystem through their coupling with theatmosphere and their activity as � lters for much of our clean water supply. Theyalso support a large diversity of vegetation and are important wildlife habitats. Themonitoring of these vast areas has become an important part of the study of globalprocesses. The three main components of a wetland are the hydrology, the soil andthe vegetation. The hydrology is the driving force responsible for wetland processes.
Internationa l Journal of Remote SensingISSN 0143-1161 print/ISSN 1366-5901 online © 2001 Taylor & Francis Ltd
http://www.tandf.co.uk/journals

N. Baghdadi et al.72
Speci� cally, the exchange of the greenhouse gases carbon dioxide and methane is ofincreasing interest in the study of global climate change (Mortsch 1990). It is alsoknown that wetlands play a signi� cant role in the mobilization of heavy metals insurface waters (Jones et al. 1986). The value of wetlands includes the reduction andprevention of erosion. The water storage capability of a wetland is one of the primaryinformation needs of wetland resource management.
There is a great need for radar systems in ecological studies because groundaccess is often di� cult and frequent cloud cover limit the use of optical sensors(SPOT, Landsat). The strengths of Synthetic Aperture Radar (SAR) as an appropriatetool reside in the sensitivity of radar backscatter to the moisture content of terrainmedia and the sensitivity of the radar cross-sections to the geometry of the vegetationgrowing on the terrain surface. The potential of SAR for detecting changes in surfacesoil moisture conditions has been demonstrated in the past (Ulaby et al. 1986 ). Itsuse in monitoring changes in wetlands moisture increased recently. Hess et al. (1995 )studied the use of multifrequency (C and L bands) and polarimetric radar backscatter-ing features to map � ooding and vegetation on a tropical � oodplain. They suggestedfrom their � ndings that multifrequency polarimetric SAR can accurately map theextent of inundation on forested � oodplains. Kasischke et al. (1995, 1997) demon-strated that ERS-1 C-band SAR imagery could be used to discriminate betweenwetland and non-wetland vegetation. However, most of the remote sensing work onwetlands has been done with aerial photography, and the optical satellites Landsatand SPOT (Enslin and Sullivan 1974, Hathout and Simpson, 1982, Mackey andJensen 1988, Johnston and Barson 1990, Seuthe and Buteau 1994). In northernAlaska, for example, cloud cover and infrequent repeat cycles have limited theacquisition of optical satellite data to a total of two scenes for the last 20 years. Bycomparison, close to 50 scenes of ERS-1 SAR data have been acquired over a 2-yearperiod, and RADARSAT provides daily access (Evans 1995).
Observations at three times over part of the annual hydrological cycle of theMer Bleue bog (near Ottawa, Canada) have been acquired by an airborne C-bandQuad Pol SAR. Part of the area covered by the SAR system is depicted in � gure 1.The radar data were acquired, processed and calibrated by the Canada Centre forRemote Sensing (CCRS). In the analysis of SAR data, we consider the backscatteringcoe� cients in both co- and cross-polarizations . The objective of this study was toexamine the potential of standard classi� cation methods applied to SAR radarimagery for mapping wetland regions and to develop an operational methodologyfor monitoring them. The separability of wetland areas and other surface cover types(forests and clearing) has been evaluated with respect to detection and discriminationof various wetlands categories. The optimum period for the best classi� cation ofcover types present at the study area has been determined, and the potential of eachpolarization studied. This paper is structured in � ve sections. The next sectiondescribes the SAR data and the study area. The processing of SAR data is presentedin §3, and in §4, a classi� cation procedure including the multipolarization data isshown. The � nal section of the paper summarizes the results and presents someconclusions.
2. SAR data and study siteThe study area is the Mer Bleue bog situated some 20 km east of Ottawa, Canada
(45 ß 24 ¾ N, 75 ß 36 ¾ W). It was surveyed by the airborne C-band (5.3 GHz) Quad PolSAR of the Canada Centre for Remote Sensing at three times within the vegetation

Evaluation of C-band SAR data 73
Figure 1. Geographical location of the study area (the Mer Bleue).
season: 16 June (spring � ush for vegetation) , 6 July (mature growth stage for vegeta-tion) and 3 October 1995 (senescence). The site was imaged in both nadir and narrowswath modes. Only nadir mode images were selected with incidence angles rangingfrom 0 ß to 74 ß (Livingstone et al. 1995). For each date, a swath of about 22 kmwidth and 14 km long was acquired along the same line. Image geometry was similarin each pass (direction of � ights, look direction of radar) . The site is very � at,minimizing geometric distortions in the image. Main parameters of the SAR duringthe missions are shown in table 1. Image quality was excellent except for the rangebetween 0 ß and 10 ß where blurring and banding, caused by a nadir ambiguity andby uncertainties in the range antenna patterns at these extreme incidence angles,were apparent. The SAR data were acquired, processed and calibrated at CCRS.The processed scene covered about 10 km Ö 12 km corresponding to incidence anglesbetween 10 ß and 60 ß . The images were smoothed with a 5 Ö 5 median � lter to reduceimage speckle.
The study site includes peat bog, marshes, open water, clearing and forest stands.The bog soils consist in general of the remains of dead or decomposing plants. Theyare rarely aŒected by the mineral-enriched ground waters from surrounding soils,the waters in these systems being derived mainly from precipitation. The water table
Table 1. C-SAR (SAR-580) polarimetric radar characteristics.
Frequency 5.3 GHz (C-band)Wavelength 5.66 cmPolarizations HH, HV, VH, VVMean � ight altitude 6200 mIncidence angle 0 ß to 74 ß (mode nadir)Image swath width 22 km (mode nadir)Image resolution 5.7 m Ö 5.7 mPixel dimension 4 m Ö 4 mLocal time of � ight 14:27 in June, 15:54 in July, 17:09 in October

N. Baghdadi et al.74
is generally near the surface and the surface materials are acidic and slightly ormoderately decomposed. A part of the Mer Bleue peat bog is forested (forested bog)with scattered spruce, tamarack, aspen, poplar and some species of pine and lowbushes. Other parts are nonforested (nonforested bog) and mainly covered withgrasses and herbaceous. Marshes usually have mineral soils and are periodically� ooded. Vegetation consists of hygrophilous herbs (cattails). Marshes are borderedby bands of trees and shrubs. Shallow open waters consist of areas which are coveredwith standing and � owing water, and include shallow lakes, and channels located inthe middle of marshes. Forests contain mixed species (pine, spruce and deciduoustrees). Clearings primarily consist of pasture, a range of agricultural crops andvirtually no bare soil at the times of images acquisition.
Within the area during the SAR survey, aerial and ground photographs weretaken to facilitate the identi� cation of wetlands and other surface types. Climato-logical data were available from the nearest meteorological station including dailymaximum and minimum temperature, and total rainfall (� gure 2). The last signi� cantrainfalls before the surveys of 16 June, 6 July and 3 October were 11.4 mm on13 June, 13.8 mm on 3 July and 7.8 mm on 2 October. The water table and the soilmoisture was higher in October than in June and July. Soil was not frozen.
3. Data analysis3.1. Image interpretation
A segment of the SAR data used in this study is shown in � gure 3, which showspolarization colour composite images of the June, July and October scenes. HH isdisplayed as red, cross as green, and VV as blue. The diŒerence in backscatterbetween the various surface types is well pronounced at various times. The brightsignature of the marsh due to strong returns at all three bands is attributed to cornerre� ection eŒects between stems and the underlying water surface and multiple scat-tering interactions in the case of the cross terms. Open water behaves as a specularsurface at C-band, and thus appears as a very dark tone on the image. Nonforestedbogs, which scatter strongly at HH- and VV-polarizations relative to cross-polarization, appear reddish and are distinguishable from other types. Forest, forestedbog and clearing targets are also identi� able on the imagery, although their signaturessometimes overlap. Roads on the upper right side of the image can also be wellidenti� ed on the imagery. A simple photointerpretation of these composite imagesshows that the various land surface categories are well diŒerentiated.
3.2. Signature studiesImage analysis was carried out to study the behaviour of various surface types
present at the study site (forested bog, nonforested bog, marsh, open water, clearingand forests) and to investigate information extracted from SAR data in order todiscriminate the observed classes. For each surface type, several training sites andtest sites based on � eld observations were selected for incidence angles from 20 ß to60 ß . The sites are of homogeneous areas of 20 by 20 pixels or greater to reducespeckle-related � uctuations in the data and to generate reliable radar return statistics.In the analysis of SAR data, we have investigated the backscattering coe� cients foreach training site in both co- and cross-polarizations : s ß
HH , s ßVV , and s ß
cross (mean ofHV and VH). Figure 4 shows the backscattering coe� cients at various times, foreach polarization and for various surface categories as functions of incidence angle

Evaluation of C-band SAR data 75
16 May to 6 July 3 Sep to 3 Oct
16 May to 6 July 3 Sep to 3 Oct
Figure 2. Meteorological data recorded close to the Mer Bleue bog coincident with SARacquisitions.
(h). Each value represents the mean backscattering coe� cient of a training site givenby averaging the values of all the pixels belonging to the site. The standard deviation(SD) of s ß is < 1.5 dB for all surface types except for open water where SD is 3.5 dB(for open water, most training sites were only a few pixels).
To reduce the eŒect of the incidence angle, the backscattering coe� cients arenormalized by a function F(h) which represents the mean angular dependence for a

N. Baghdadi et al.76
(1) : Nonforested bog
(2) : Marsh
(3) : Forest
(4) : Forested bog
(5) : Clearing
(6) : Open water

Evaluation of C-band SAR data 77
Incidence angle (°) Incidence angle (°) Incidence angle (°)
Incidence angle (°) Incidence angle (°) Incidence angle (°)
Incidence angle (°) Incidence angle (°) Incidence angle (°)
HH
in
(d
B)
CR
OS
S i
n (
dB
)
W i
n (
dB
)
HH
in
(d
B)
CR
OS
S i
n (
dB
)
W i
n (
dB
)
HH
in
(d
B)
CR
OS
S i
n (
dB
)
W i
n (
dB
)
Figure 4. Backscattering coe� cient s ß for various surface types as a function of incidenceangle h. Each point represents the mean value of a training area. F, forest;NFB, nonforested bog; FB, forested bog; M, marsh; OW, open water; C, clearing.
given date and for a given polarization. The normalized backscattering coe� cient isde� ned as:
s ßn
5s ß (h
i)
F (hi)
(1)
where s ß (hi) is the backscattering coe� cient at the incidence angle h
i.
Figure 3. Polarization colour composite images of the Mer Bleue bog for June, July and October.HH, cross and VV are respectively coded in red, green and blue. The imaged area isapproximately 5.8 km (horizontal dimension) by 10 km (vertical dimension). The incidenceangles range from 100 at the left side to 500 at the right side of the images. Note that theimages have been averaged over a 5 Ö 5 window to reduce the image speckle.

N. Baghdadi et al.78
Table 2. The mean angular dependence at diŒerent polarizations and for each date.
HH Cross VV
16 June 1995 cos2.5 h cos1.7 h cos2.1 h6 July 1995 cos2.5 h cos2.2 h cos2.8 h13 October 1995 cos2.4 h cos1.4 h cos2.1 h
No
rma
lize
d H
H i
n (
dB
)
No
rma
lize
d C
RO
SS
in
(d
B)
No
rma
lize
d W
in
(d
B)
No
rma
lize
d H
H i
n (
dB
)
No
rma
lize
d C
RO
SS
in
(d
B)
No
rma
lize
d W
in
(d
B)
No
rma
lize
d H
H i
n (
dB
)
No
rma
lize
d C
RO
SS
in
(d
B)
No
rmal
ize
d W
in
(d
B)
Figure 5. Normalized backscattering coe� cient s ßn for various cover types. NFB, nonforested
bog; M, marsh; F, forest; FB, forested bog; C, clearing; OW, open water.
In linear units, s ß (h) is given approximately by the relation b cosah (Ulaby et al.1982, Beauchemin et al. 1995). Thus, F (h) is of the form cosah and the normalizedbackscattering coe� cient (b) is then given by s ß (h
i)/cosah
i. The coe� cient b is related
to the target backscattering properties and a depending on the dominant scatteringmechanism and sensor condition (Shi et al. 1994). It can be seen that a cosine-basedcurve will be represented by a straight line of slope a in a s ß (dB) versus 10 log[cos(h)]plot. The parameter a is computed for each surface type, each polarization,and for each date. Next, a mean a is computed for each polarization and each date:

Evaluation of C-band SAR data 79
the mean a is the mean of a calculated for each surface type. In table 2 the meanangular dependence is listed for various dates and polarizations. The coe� cient ofdetermination R2 was greater than 0.9.
Statistical analyses of normalized backscattering coe� cient s ßn
at HH, cross- andVV polarizations for various cover types and for the three dates are shown in � gure 5.We observed that the cross-polarization signature was lower than the HH and VVpolarization signatures. The measurements show also that the backscatteringcoe� cients at VV polarization are greater than those at HH polarization except formarsh where s ß
VVand s ß
HHare similar. (The diŒerences smaller than 1 dB are not
statistically signi� cant because the calibration errors of the SAR data are of sameorder.)
Forest targets will be least aŒected by the ground cover eŒects. For C-band,scattering by the crown layer is found to dominate s ß for all mature forest types andat all polarizations (Dobson et al. 1992, Le Toan et al. 1992, Beauchemin et al.1995). The conifer species (excluding tamarack) will be least aŒected by the changesin tree foliage because foliage remains all year. The backscatter of deciduous trees(including tamarack) is aŒected by the seasonal change in foliage. Deciduous treeshave higher backscatter without leaves than with leaves (Ahern et al. 1993). For theOctober mission the leaves were fully grown and still on the trees. The observedchanges in multitemporal data are most likely related to changes in the dielectricconstant of the woody and foliar parts of the trees. The backscattering coe� cientwas similar in July and October for the HH, cross- and VV polarizations; it was2 dB greater in July than June for the HH and VV polarizations but similar forthe cross-polarization. The VV polarization was greater than the HH polarizationby 3.5 dB in June and July and 2.5 dB in October; it was also greater than thecross-polarization.
The backscattering coe� cient from nonforested bog is almost wholly determinedby surface properties and thus should be very sensitive to near-surface soil moisture.The backscattering coe� cient for nonforested bog was approximately 1 dB greaterin July than June. It is similar in July and October.
The backscattering coe� cient from forested bog with low density of trees includesdirect backscatter from the crown volume, direct backscatter from the ground,specular scatter at the ground interacting with the crown layer, and multiple specularscattering from the ground and trunks or stems. For forested bog with a high densityof trees, the backscatter should be dominated by direct crown scattering as for foresttargets. At HH polarization, the backscattering coe� cient was 1.5 dB greater in Julythan June and similar in July and October; at VV and cross-polarizations , it wassimilar for the three dates. Forested bog scatters strongly at VV polarization relativelyto HH and cross-polarizations . The forested bog, nonforested bog, and forest targetsare clearly distinguishable at cross-polarization; the diŒerence is greater in October(forest was 4.5 dB greater than forested bog and 9 dB greater than nonforested bog).
The brightest radar returns are from marshes, caused by the double-bouncescattering between the water surface and the vertical stems and leaves of the vegeta-tion. The highest returns from marshes were in October because the water table washighest; returns for June and July were similar. The diŒerence between marsh andother areas was greatest at HH polarization.
The smooth surfaces of open water produce the lowest backscatter for allpolarizations and times. The lowest backscattering was in June, increasing to Julyand October. Open water is very well separable from other surface types for anypolarization and period.

N. Baghdadi et al.80
The backscattering coe� cient from clearings is governed by the scattering proper-ties of the vegetation elements and the soil surface, as well as by the interactionbetween the vegetation volume and the soil surface in the form of multiple scattering.The strongest radar backscattering from clearing sites (the agricultural area) wasobserved in October. The diŒerences in SAR image intensity between June, July andOctober are primary due to the highest soil moisture observed in October. However,the results show that the diŒerence between clearing and other classes was greatestin June and at VV polarization.
3.3. Separability between classesThe separability between the six classes has been studied for all images in order
to identify the best con� guration period and polarization to discriminate the diŒerentsurface types. Because the backscatter coe� cient depends strongly on incidenceangle, it is unlikely to be reliable for discrimination between diŒerent classes unlessthe incidence angle is included in the classi� cation procedure. The angular depend-ence of the backscattering coe� cient can be reduced if we normalize the measuredbackscattering coe� cients (equation (1)).
According to the concept of feature separation (Cumming and Van Zyl 1989, Shiet al. 1994), features are said to be well separated if the distance between the classmean values is large compared to the standard deviations. Separation values S
i,jbelow 0.8 are not large enough to be useful in distinguishing class i from class j. Inthis case, not much more than 50% of class pair pixels are correctly separated. Forvalues of S
i,jbetween 0.8 and 1.5, the quality of the separation between classes i and
j is average. Values of Si,j
above 2.0 provide almost complete separation of classpairs. The separability between classes i and j is de� ned by:
Si,j
5|m
iÕ m
j|
si1 s
j(2)
where m and s are mean values and standard deviations of the features. We haveevaluated the separabilities between diŒerent class pairs from training sites, to deter-mine the best combinations of measurements for classi� cation. All polarizationmeasurements were tested (s ß
HH, s ß
VVand s ß
cross). Table 3 shows separabilities between
class-pairs for the nine datasets (three dates and three polarizations) .The period and polarization which provides good separation for most class pairs
is October and the cross-polarization. With the cross-polarization, we have confusiononly between forest and marsh, and between forested bog and clearing. The s ß
HHand s ß
VVfeatures provide good separation for half of the class pairs; for the rest the
separation is moderate except between nonforested bog and forested bog, andbetween nonforested bog and clearing, where the separation is poor. The HHpolarization is slightly better than the VV polarization.
The discrimination between classes in June is comparable to that in July.Open water can be easily diŒerentiated from the other surface types. Marsh is
well distinguishable from the other classes except from forest where the separationis poor at cross-and VV polarizations and average at HH polarization. The separationbetween forest and nonforested bog or forested bog or clearing is good at cross-polarization and moderate at HH and VV polarizations. Nonforested bog is poorlydistinguishable from forested bog and clearing at co-polarizations; at cross-polarization the separation between these class-pairs is good. Finally, the separation

Evaluation of C-band SAR data 81
Table 3. Separability between pairs of classes for each polarization and each date.
June July October
HH Cross VV HH Cross VV HH Cross VV
Forest/Nonforested bog 0.94 3.03 0.86 1.33 2.65 1.13 1.50 3.48 1.26Forest/Forested bog 0.67 0.79 0.82 1.01 1.43 1.13 1.03 2.20 1.16Forest/Marsh 1.63 0.01 0.59 1.48 0.32 0.43 1.72 0.16 0.59Forest/Open water 2.61 4.03 3.62 3.50 3.31 2.38 2.77 4.07 2.45Forest/Clearing 1.25 2.16 2.16 1.92 2.00 1.77 1.53 2.52 1.49Nonforested bog/Forested bog 0.55 2.27 0.31 0.64 3.00 0.26 0.73 2.68 0.31Nonforested bog/Marsh 2.55 2.15 1.71 2.94 1.92 0.85 2.78 3.03 2.29Nonforested bog/Open water 3.00 3.51 2.83 3.41 3.79 2.76 3.33 2.73 3.38Nonforested bog/Clearing 0.44 1.37 1.42 0.66 1.79 1.19 0.08 2.14 0.58Forested bog/Marsh 2.44 0.64 1.90 2.75 0.86 0.81 2.52 2.03 2.20Forested bog/Open water 4.43 3.46 5.81 5.11 5.32 4.70 3.44 4.43 4.20Forested bog/Clearing 1.10 1.34 2.63 1.57 1.23 1.96 0.8 0.58 0.91Marsh/Open water 3.64 2.77 5.33 4.90 2.50 2.75 3.34 3.47 3.78Marsh/Clearing 2.78 1.60 3.58 3.56 1.36 1.76 2.79 2.29 2.53Open water/Clearing 2.90 3.76 2.17 4.02 4.57 2.03 3.25 4.04 2.36
between forested bog and clearing is, in general, poor. The separation between thenonforested and forested areas was greatest in October.
For a given polarization, we do not observe substantial amelioration of theseparability between the classes with this speci� c multitemporal dataset comparedwith results obtained with a single date dataset.
4. Classi� cation including polarimetric parametersThe statistical analyses of normalized backscattering coe� cient at HH, cross-
and VV polarizations (� gure 4) show that open water is easily discriminated fromthe other categories by its low returns. Forested bog and nonforested bog can bereadily separated at cross-polarization (though there is some overlap in June andJuly). Forest was best separated from marsh at HH polarization. Maximum diŒerencein backscatter between forested bog and clearing was observed at VV polarization(2.0 dB in October, 3.5 dB in July and 5.0 dB in June). The distributions of s ß
n shownin � gure 5 demonstrate the di� culty of wetlands classi� cation using a single polariza-tion. At VV polarization, nonforested bog is not separable of forested bog andclearing; there is a great overlap between the forested bog and clearing and betweenforest and marsh. At HH polarization, forested bog and nonforested bog, forestedbog and clearing, and nonforested bog and clearing cannot be readily distinguished.The � ndings of this study are most relevant to RADARSAT (C-HH) and ERS-2(C-VV) dataset.
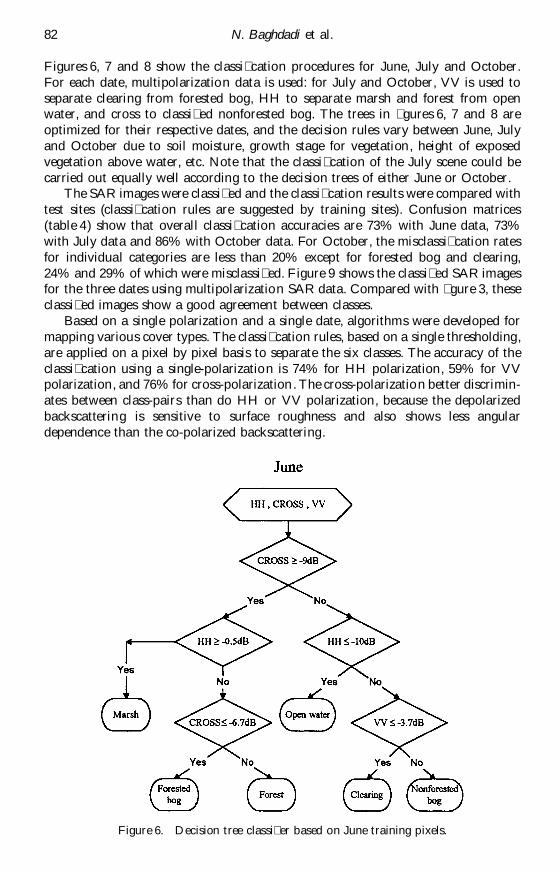
The measurements of backscattering signatures of wetlands indicate good capabil-ities for mapping wetlands areas at C-band frequencies. Using multipolarization data(HH, cross, VV), a decision tree model was used to classify a wetland region (Hesset al. 1995). A pixel by pixel classi� er separated the three scenes into six categories:forest, open water, marsh, forested bog, nonforested bog and clearing. Based ontraining data, a decision tree model was used to determine classi� cation rules. HH,cross and VV normalized backscattering coe� cients (dB) are the three variablesinput to the decision tree model; the output variable was one of the six cover types.
N. Baghdadi et al.82
Figures 6, 7 and 8 show the classi� cation procedures for June, July and October.For each date, multipolarization data is used: for July and October, VV is used toseparate clearing from forested bog, HH to separate marsh and forest from openwater, and cross to classi� ed nonforested bog. The trees in � gures 6, 7 and 8 areoptimized for their respective dates, and the decision rules vary between June, Julyand October due to soil moisture, growth stage for vegetation, height of exposedvegetation above water, etc. Note that the classi� cation of the July scene could becarried out equally well according to the decision trees of either June or October.
The SAR images were classi� ed and the classi� cation results were compared withtest sites (classi� cation rules are suggested by training sites). Confusion matrices(table 4) show that overall classi� cation accuracies are 73% with June data, 73%with July data and 86% with October data. For October, the misclassi� cation ratesfor individual categories are less than 20% except for forested bog and clearing,24% and 29% of which were misclassi� ed. Figure 9 shows the classi� ed SAR imagesfor the three dates using multipolarization SAR data. Compared with � gure 3, theseclassi� ed images show a good agreement between classes.
Based on a single polarization and a single date, algorithms were developed formapping various cover types. The classi� cation rules, based on a single thresholding,are applied on a pixel by pixel basis to separate the six classes. The accuracy of theclassi� cation using a single-polarization is 74% for HH polarization, 59% for VVpolarization, and 76% for cross-polarization. The cross-polarization better discrimin-ates between class-pairs than do HH or VV polarization, because the depolarizedbackscattering is sensitive to surface roughness and also shows less angulardependence than the co-polarized backscattering.
Figure 6. Decision tree classi� er based on June training pixels.

Evaluation of C-band SAR data 83
Figure 7. Decision tree classi� er based on July training pixels.
5. Conclusions and future workC-band polarimetric measurements have been carried out with the CCRS airborne
SAR at three periods of the year, over a landscape of wetland areas, agricultural� elds and forest sites. Microwave signatures of various surface types have beenstudied as a function of incidence angle. A clear ability to discriminate between thediŒerent classes was found. This study has demonstrated that multipolarization SARoperating at 5.3 GHz (C-band) can accurately discriminate forest, forested bog,nonforested bog, open water, marsh, and clearing by appropriate selection of theseason. Statistical analysis of signatures indicate that multipolarization data arenecessary for accurate classi� cation of cover types present at the study area. Theseparation between classes was greatest with the cross-polarization and Octoberproved more suitable for discriminating between the classes present than the twoother periods studied (June and July).
The overall accuracies of the classi� cation are 73% for June, 73% for July and86% for October. Classi� cation using a single-polarization has been investigatedand the results have shown that HH and cross-polarizations are better than VVpolarization. The accuracy of classi� cation with a single polarization is 10–30%lower than with multipolarization data. For October, the percentage of all pixelscorrectly classi� ed is 74% for HH polarization alone, 76% for cross-polarizationalone and 59% for VV polarization alone.
Two spaceborne SAR systems of particular interest should provide data until theend of this century. These systems are the European Remote sensing Satellite ERS-2(C-VV) and the Canadian satellite RADARSAT (C-HH). Current SAR satellites are

N. Baghdadi et al.84
Figure 8. Decision tree classi� er based on October training pixels.
all single-frequency and single-polarization. Since HH polarization is better than VVpolarization for discriminating between classes observed, we expect that RADARSATwill prove to be a better tool than the ERS SARs for discriminating between openwater, marsh, bog, forest and clearing. The next stage is the evaluation of satelliteSAR data for wetland monitoring which involves analysis of ERS-2 and RADARSATimagery of the Mer Bleue bog and other wetland regions.
The analysis of images acquired at other times of the year (mid-winter with drysnow condition, late winter with wet snow condition or spring with height watertable) should also be very useful. However, in winter season, the soil is covered withdry snow, the open water and the marsh are frozen. The separability between forest,forested bog, nonforested bog, clearing, open water and marsh should be lower thanthose observed in June, July and October. So, this season should not provide asubstantial amelioration of the classi� cation of wetlands. In wet snow condition,clearing and nonforested bog will remain inseparable because both will be coveredwith wet snow. Then, the classi� cation will not be improved comparatively to resultsof June, July and October. On the other hand, open areas (clearing and nonforestedbog) will become well separable with forest areas: the mean diŒerence between the

Evaluation of C-band SAR data 85
Table 4. Confusion matrices for June, July and October.
June
Nonforested Forested OpenCategory Forest bog bog Marsh water Clearing Total
Forest 61.3 1.8 34.8 0.2 0.6 1.3 100Nonforested 0 70.9 0.2 0 1.3 27.6 100
bogForested bog 2.9 30.1 66.6 0 0 0.4 100Marsh 10.5 2.3 12.4 74.5 0 0.3 100Open water 0.5 1.9 0.5 1.9 95.2 0 100Clearing 1.6 6.4 19.7 0 4.1 68.2 100
July
Nonforested Forested OpenCategory Forest bog bog Marsh water Clearing Total
Forest 73.3 0.3 18.8 0.8 0 6.8 100Nonforested 0 98.8 0.8 0 0 0.4 100
bogForested bog 13.6 2.3 74.5 0 0 9.6 100Marsh 14.7 0.9 13.2 62.7 0 8.5 100Open water 0.5 20.1 3.8 1 74.3 0.3 100Clearing 3.2 29.6 12.2 0.1 0.5 54.5 100
October
Nonforested Forested OpenCategory Forest bog bog Marsh water Clearing Total
Forest 80.7 0 14.5 0 0 4.8 100Nonforested 0.3 96.2 1.6 0 0 1.9 100
bogForested bog 4.8 1.4 76.1 0 0 17.7 100Marsh 8 0 1.9 90.1 0 0 100Open water 0 0.4 0 0 99.6 0 100Clearing 0.2 14.2 14.2 0 0.1 71.3 100
backscattering coe� cients of wet snow areas and dry snow or snow-free areas, atthe beginning of the snow melt period, is of the order of 3 dB (Rott and Nagler 1995,Baghdadi et al. 1997); for forested areas, the diŒerence between backscatteringcoe� cients in wet snow and dry snow conditions or in wet snow and snow-freeconditions is not signi� cant in densely forested areas (Koskinen et al. 1997 ). Animage acquired in wet snow condition (late winter) would be very important for abetter discrimination between clearing and forest areas or between nonforested bogand forest areas. In addition, the separability between forested bog and forest willbe better in wet snow conditions than that in June, July or October because thecontribution of soil (covered with wet snow) is more important in forested bog thanin forest (the forested bog is less dense than the forest). Finally, a spring image takenwhen the water table is high should give classi� cation results comparable with theOctober data.

N. Baghdadi et al.86
Figure 9. Results of classi� cation based on multipolarization data for June, July and October.Image dimension is 5.8 km (horizontal dimension) by 10 km (vertical dimension).

Evaluation of C-band SAR data 87
AcknowledgmentsThe authors would like to thank the CCRS Airborne Operations Section and
the crew of C-GRSC for their eŒort in the planning and execution of the polarimetricSAR � ight used in this study. The data acquisition � ight and the processing of the
SAR dataset were funded by the Canada Centre for Remote Sensing. Also, we thankINRS (Institut National de la Recherche Scienti� que) for the postdoctoral fellowship
to Dr Nehme Baghdadi.
References
Ahern, F. J., Leckie, D. J., and Drieman, J. A., 1993 , Seasonal changes in relative c-bandbackscatter of northern forest cover types. IEEE T ransactions on Geoscience andRemote Sensing, 31, 668–680.
Baghdadi, N., Gauthier, Y., and Bernier, M., 1997, Capability of multi-temporal ERS-1SAR data for wet snow mapping. Remote Sensing of Environment, 60, 174–186.
Beauchemin, M., Thomson, K., and Edwards, G., 1995, Modelling forest stands withMIMICS: implications for calibration. Canadian Journal of Remote Sensing, 21,518–526.
Cumming, I. G., and Van Zyl, J. J., 1989, Feature utility in polarimetric radar imageclassi� cation. In Procedings of IGARSS’89 (Piscataway, NJ: IEEE), pp. 1841–1846.
Dobson, M. C., Pierce, L., Sarabandi, K., Ulaby, F. T., and Sharik, T., 1992, Preliminaryanalysis of ERS-1 SAR for forest ecosystem studies. IEEE T ransactions on Geoscienceand Remote Sensing, 30, 203–211.
Enslin, W. R., and Sullivan, M. C., 1974, T he Use of Color Infrared Photography forWetlands Assessment. Conference on Earth Resources Observation, 3, Michigan StateUniversity.
Evans, D. L. (ed.), 1995, Spaceborne synthetic aperture radar: current status and futur direc-tions. A Report to the Committee on Earth Sciences, Space Studies Board, NationalResearch Council, NASA Technical Memorandum 4679, April 1995.
Hathout, S., and Simpson, J., 1982, A vegetation survey of Netley Marsh using color andcolor infrared imagery. Journal of Environmental Management, 15, 25–34.
Hess, L. L., Melack, J. M., Filoso, S., and Wang, Y., 1995, Delineation of inundated areaand vegetation along the Amazon � oodplain with the SIR-C Synthetic Aperture Radar.IEEE T ransactions on Geoscience and Remote Sensing, 33, 896–903.
Johnston, R. M., and Barson, M. M., 1990, Use of multitemporal Landsat Thematic Mapperimagery for mapping and monitoring of wetlands. Fiftieth Australasian Remote SensingConference, October 8–12, Perth, Western Australia, pp. 1125–1128.
Jones, M. L., Marmorek, D. R., Reuber, B. S., McNamee, P. J., and Rattie, L. P., 1986,Brown waters: relative importance of external and internal sources of acidi� cation oncatchment biota. LRTAP Workshop Report No. 5 prepared for EnvironmentCanada, 85 pp.
Kasischke, E. S., and Bourgeau-Chavez, L. L., 1997, Monitoring South Florida wetlandsusing ERS-1 SAR imagery. Photogrammetric Engineering and Remote Sensing, 63,281–291.
Kasischke, E. S., Morrissey, L., Way, J., French, N. H. F., Bourgeau, L. L., Rignot, E.,Stearn, J. A., and Livingston, G. P., 1995, Monitoring seasonal variations in borealecosystems using multi-temporal spaceborne SAR data. Canadian Journal of RemoteSensing, 21, 96–109.
Koskinen, J. T., Pulliainen, J. T., and Hallikainen, M. T., 1997. The use of ERS-1 SARdata in snow melt monitoring. IEEE T ransactions on Geoscience and Remote Sensing,35, 601–610.
Le Toan, T., Beaudoin, A., Riom, J., and Guyon, D., 1992, Relating forest biomass to SARdata. IEEE T ransactions on Geoscience and Remote Sensing, 30, 403–411.
Livingstone, C. E., Gray, A. L., Hawkins, R. K., Vachon P., Lukowski, T. I., and LalondeM., 1995, The CCRS airborne SAR Systems: radar for remote sensing research.Canadian Journal of Remote Sensing, 21, 468–491.

Evaluation of C-band SAR data88
Mackey, H. E., and Jensen, J. R., 1988, Remote sensing of wetlands applications overview.First Workshop on Videography, 19–20 May, Terre Haute, Indiana, pp. 32–34.
Mortsch, L. (ed.), 1990, Eastern Canadian boreal and sub-arctic wetlands: a resource docu-ment. Environment Canada, Climatological Studies, Report no. 42, 169 pp.
SeutheÁ , C., and Buteau, P., 1994, Les Tourbieres au Quebec: une Ressource Importante areconna tre et a proteger. Teledetection de l’Environnement dans l’EspaveFrancophone. Publie aux Presses de l’Universite du Quebec, pp. 101–113.
Rott, E., and Nagler, T., 1995, Monitoring temporal dynamics of snowmelt with ERS-1SAR. Proceedings of the International Geoscience and Remote Sensing Symposium(IGARSS’95), Firenze, Italy, July 10–14 (Piscataway, NJ: IEEE), IEEE cataloguenumber: 95CH35770, pp. 1747–1749.
Shi, J., Dozier, J., and Rott, H., 1994, Snow mapping in Alpine regions with SyntheticAperture Radar. IEEE T ransactions on Geoscience and Remote Sensing, 32, 152–158.
Ulaby, F. T., Moore, R. K., and Fung, A. K., 1982, Microwave Remote Sensing, Active andPassive, 2, Radar Remote Sensing and Surface Scattering and Emission T heory (NewYork: Addison-Wesley).
Ulaby, F. T., Moore, R. K., and Fung, A. K., 1986, Microwave Remote Sensing, Active andPassive, 3, From T heory to Applications (New York: Addison-Wesley).