Evaluation of arterial propagation velocity based on the automated analysis of the Pulse Wave Shape
11
Evaluation of arterial propagation velocity based on the automated analysis of the Pulse Wave Shape This article has been downloaded from IOPscience. Please scroll down to see the full text article. 2011 J. Phys.: Conf. Ser. 332 012014 (http://iopscience.iop.org/1742-6596/332/1/012014) Download details: IP Address: 200.0.182.38 The article was downloaded on 30/03/2012 at 23:13 Please note that terms and conditions apply. View the table of contents for this issue, or go to the journal homepage for more Home Search Collections Journals About Contact us My IOPscience
Transcript of Evaluation of arterial propagation velocity based on the automated analysis of the Pulse Wave Shape

Evaluation of arterial propagation velocity based on the automated analysis of the Pulse Wave
Shape
This article has been downloaded from IOPscience. Please scroll down to see the full text article.
2011 J. Phys.: Conf. Ser. 332 012014
(http://iopscience.iop.org/1742-6596/332/1/012014)
Download details:
IP Address: 200.0.182.38
The article was downloaded on 30/03/2012 at 23:13
Please note that terms and conditions apply.
View the table of contents for this issue, or go to the journal homepage for more
Home Search Collections Journals About Contact us My IOPscience

Evaluation of arterial propagation velocity based on the automated analysis of the Pulse Wave Shape
F M Clara1, A G Scandurra1, G J Meschino1 and L I Passoni1 1 Laboratorio de Bioingeniería, Departamento de Electrónica Facultad de Ingeniería, Universidad Nacional de Mar del Plata Juan B. Justo 4302, Mar del Plata, Argentina E-mail: [email protected] Abstract. This paper proposes the automatic estimation of the arterial propagation velocity from the pulse wave raw records measured in the region of the radial artery. A fully automatic process is proposed to select and analyze typical pulse cycles from the raw data. An adaptive neuro-fuzzy inference system, together with a heuristic search is used to find a functional approximation of the pulse wave. The estimation of the propagation velocity is carried out via the analysis of the functional approximation obtained with the fuzzy model. The analysis of the pulse wave records with the proposed methodology showed small differences compared with the method used so far, based on a strong interaction with the user. To evaluate the proposed methodology, we estimated the propagation velocity in a population of healthy men from a wide range of ages. It has been found in these studies that propagation velocity increases linearly with age and it presents a considerable dispersion of values in healthy individuals. We conclude that this process could be used to evaluate indirectly the propagation velocity of the aorta, which is related to physiological age in healthy individuals and with the expectation of life in cardiovascular patients.
1. Introduction The analysis of the pulse waveforms (PW) measured at the wrist is a well known method in assessing arterial stiffness, as shown in bibliography [1]. The pulse wave shape is determined by the interaction of incident waves generated by the heart and a reflected wave travelling back toward the heart and, possibly, one or more reflected waves travelling in either direction [2]. Hence, pulse wave can also supply an assessment of arterial wave reflection, which is closely related to cardiovascular condition [3].
The shape of pulse wave measured using a non invasive method at the radial artery of an adult healthy male is shown in Figure 1. To facilitate the analysis, the wave amplitude is normalized, corresponding to 100% for systolic pressure and 0% for diastolic pressure, so that the amplitudes are expressed as percentages [4]. It can be observed the systolic wave (SW), the diastolic wave (DW) and between them, the reflected wave (RW). The RW is caused by a reflection of the aortic pressure wave at the abdominal area [5]. The analysis of the RW provides information on the vasoconstrictor tone of the arterial tree and also from the propagation velocity through the aortic region. Also it is shown the Reflected Wave Arrival Time (RWAT), estimated between the maximum of SW and the beginning of the RW.
SABI 2011 IOP PublishingJournal of Physics: Conference Series 332 (2011) 012014 doi:10.1088/1742-6596/332/1/012014
Published under licence by IOP Publishing Ltd 1
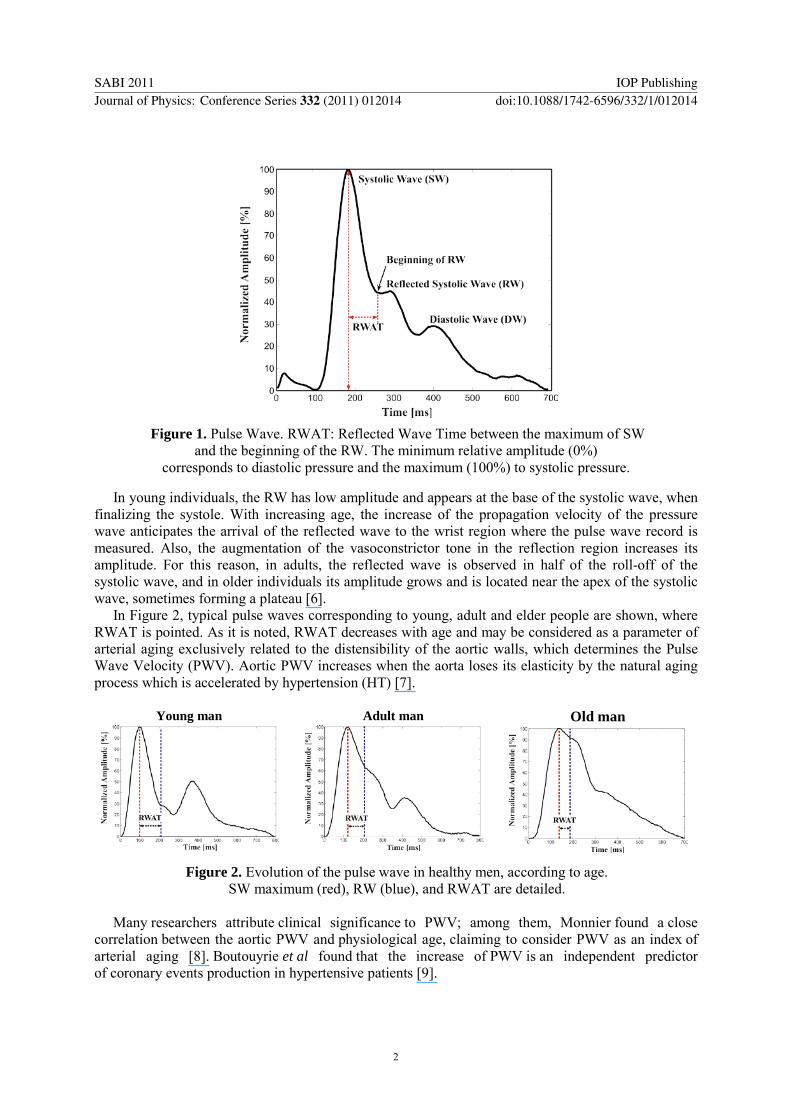
Figure 1. Pulse Wave. RWAT: Reflected Wave Time between the maximum of SW
and the beginning of the RW. The minimum relative amplitude (0%) corresponds to diastolic pressure and the maximum (100%) to systolic pressure.
In young individuals, the RW has low amplitude and appears at the base of the systolic wave, when finalizing the systole. With increasing age, the increase of the propagation velocity of the pressure wave anticipates the arrival of the reflected wave to the wrist region where the pulse wave record is measured. Also, the augmentation of the vasoconstrictor tone in the reflection region increases its amplitude. For this reason, in adults, the reflected wave is observed in half of the roll-off of the systolic wave, and in older individuals its amplitude grows and is located near the apex of the systolic wave, sometimes forming a plateau [6].
In Figure 2, typical pulse waves corresponding to young, adult and elder people are shown, where RWAT is pointed. As it is noted, RWAT decreases with age and may be considered as a parameter of arterial aging exclusively related to the distensibility of the aortic walls, which determines the Pulse Wave Velocity (PWV). Aortic PWV increases when the aorta loses its elasticity by the natural aging process which is accelerated by hypertension (HT) [7].
Young man
Adult man
Old man
Figure 2. Evolution of the pulse wave in healthy men, according to age. SW maximum (red), RW (blue), and RWAT are detailed.
Many researchers attribute clinical significance to PWV; among them, Monnier found a close
correlation between the aortic PWV and physiological age, claiming to consider PWV as an index of arterial aging [8]. Boutouyrie et al found that the increase of PWV is an independent predictor of coronary events production in hypertensive patients [9].
SABI 2011 IOP PublishingJournal of Physics: Conference Series 332 (2011) 012014 doi:10.1088/1742-6596/332/1/012014
2

This paper proposes the automatic estimation of RWAT from PW raw records measured in the region of the radial artery. In order to avoid miscalculations in the RWAT, a functional approximation is obtained using a first order Takagi-Sugeno Fuzzy Inference System. The work of Ying [10] has shown that general SISO (Single Input – Single Output) Takagi-Sugeno Fuzzy Systems with linear rule consequent are universal approximators. In this process the parameters of the Fuzzy Inference System (FIS) are adapted using an Adaptive Neural Fuzzy Inference System (ANFIS) to optimize its performance. A similar approach has been used to process volumetric capnography records, to estimate derived variables of interest for the study of respiratory physiology [11, 12].
To evaluate the proposed methodology, we measured the RWAT and estimated PWV of PW records in a population of men from a wide range of ages. It has been found in these studies that PWV increases linearly with age and it presents a considerable dispersion of values in healthy individuals. We conclude that this automatic process of the PW records could be used to evaluate indirectly the aortic propagation velocity, which is related to physiological age in healthy individuals and with the expectation of life in cardiovascular patients.
2. Materials and Methods
2.1. Pulse Wave Acquisition The acquisition system of the PW is based on a capacitive motion sensor, consisting of a small, rectangular insulated metal plate, (~2 cm2), which is softly supported on the radial pulse zone without making any pressure. By connecting the patient to ground potential, a capacitor is formed between him and the metal plate. The pressure variations during the cardiac cycle causes variations in the radial artery diameter, transmitted to the surface of the skin, they generate the plate motion and, consequently, variations of its capacity. These capacity changes are used to generate a FM signal which is detected by the transducer and transformed into voltage variations, yielding a record of PW with morphological features similar to the radial pressure records obtained by applanation tonometry.
The transducer output is digitized and acquired in a conventional PC (5 ms, sampling period), for storage and processing.
PW recordings were obtained in a set of 201 healthy normotensive male volunteers aged between 2nd and 8th decade, according to bioethical procedures suggested by the Bioethics Committee of the National University of Mar del Plata.
2.2. The Pulse Wave Typical Cycle (PWTC) The recorded raw sequence of PW contains many cycles of pulse waves. To estimate the RWAT, a pulse wave typical cycle (PWTC), which represents the entire sequence, must be selected. To perform this task a series of steps are carried out. The first one is the detection of each PW cycle: this process begins by estimating an approximate period using the Fourier transform; then the first maximum within the first period is localized. Thereafter, successive maximums are obtained considering each period. Once the maximums are obtained, the minimums are computed via the first derivative. Each PW cycle is neatly defined between consecutive minimums. Consequently a set of PW cycles, are overlapped to compute the statistical mode of the amplitude in each sample (PWM).
The PW cycle selected as typical (PWTC), is the one presenting the minimum Root Mean Square Error (RMSE) against the PWM.
2.3. Automated estimation of the RWAT The RWAT ought to be computed, over the PWTC, as the lapse between the maximum of the systolic wave and the arrival of the reflected wave, identified by a slope change after the systolic peak. Given that requirement, this point must be precisely located; the PWTC must be smooth, free of noise, but it also must retain the information about the slopes changes. This property is clearly not found in the digitalized register without any smoothing process.
SABI 2011 IOP PublishingJournal of Physics: Conference Series 332 (2011) 012014 doi:10.1088/1742-6596/332/1/012014
3

To ensure a precise location of the RWAT, we propose the use of a Takagi-Sugeno Fuzzy Inference System (FIS) as a data-driven model to get an analytic function of each PWTC. Hence, for each record, the estimation of the RWAT was automated, using a functional approximation of the PW.
A heuristic based on the change in the number of rules searches the best ANFIS model that approximates the PWTC, as follows:
(Step 1) Given a PWTC and the initial number of fuzzy rules n0, obtain a FIS model using grid partition. • Use ANFIS to optimize the parameters of the membership functions and the linear
functions coefficients of the consequent of the FIS model. • Compute the fitness function (FF) as a weighted linear combination of ANFIS RMSE
and the range of the second derivative. (Step 2) 1 1i in n −= + (Step 3) Use ANFIS model to optimize the parameters as in step 1. (Step 4) Compute the fitness function (FFi) as in step 1. (Step 5) If 1i iFF FF −≥ , then stop and select the actual ANFIS model as the final one. Otherwise
repeat steps 2 to 5.
To train the ANFIS model, the PWTC is sub-sampled at half alternately. Half of the data is selected for training and the other half is used for validation test. Hence, the ANFIS model is that which presents the minimum validation error, which avoids overtraining, and maximizes the generalization ability of the model.
The iterative process ends when the FF grows beyond the first local minimum which ensures an effective model with the minimum number of rules (parsimonious principle).
Once a PWTC good approximation is obtained with the ANFIS model, this analytical function (smooth and retaining its peak locations) is used to compute the RWAT. This parameter is computed as the lapse between the maximum of the systolic wave and the maximum of the second derivative.
Undoubtedly, RWAT depends on the height of the individual, because the path of the reflected wave increases with it. To become independent of it, Velocity Index [VI, m/s] is defined as an estimator of the aortic propagation velocity:
[ ][ ]
height mmVIs RWAT s
= .
3. Results In Figure 3, a raw sequence of PW is shown. In red is pointed the beginning of each PW and in green the systolic peak.
Figure 3. Typical raw PW record.
2600 2700 2800 2900 3000 3100 3200 3300 3400
-50
0
50
100
Time [samples]
Ampl
itude
SABI 2011 IOP PublishingJournal of Physics: Conference Series 332 (2011) 012014 doi:10.1088/1742-6596/332/1/012014
4

Figure 4 shows the set of overlapped PW cycles (blue) and the selected cycle (PWTC) according to the RSME criterion, is plotted in red.
Figure 4. Set of overlapped PW cycles and the best cycle chosen automatically.
The result of the best ANFIS model, selected by the heuristic search, is shown in Figure 5: ANFIS output: in blue, PWTC in red. Figure 5 (a) and (b) show the PWTC of an adult and the PWTC of a young male, respectively.
(a)
(b)
Figure 5. Examples of ANFIS models (blue) and raw data (red).
Figure 6 shows the beginning of the RW and the second derivatives (black) computed of the ANFIS output (blue). The beginning of the RW, found as the first maximum of the second derivative after the systolic peak, is shown as a red line.
(a)
(b)
Figure 6. ANFIS models (blue), second derivatives (out of scale) computed from the model (black) and beginning of Reflected Waves (RW) detected automatically (red).
In Figure 7, RWAT values are plotted against age of individuals between 2nd and 8th decades of life.
0 170 340 510 680 850-100
-50
0
50
100
150
Time [ms]
Ampl
itud
0 80 160 240 320 400 480 560 640 720 8000
0.25
0.5
0.75
1
Time [ms]
Nor
mal
ized
Am
plitu
de
0 85 170 255 340 425 510 595 680 765 8500
0.13
0.25
0.38
0.5
0.63
0.75
0.88
1
Time [ms]
Nor
mal
ized
Am
plitu
de
0 80 160 240 320 400 480 560 640 720 800-0.25
0
0.25
0.5
0.75
1
Time [ms]
Norm
aliz
ed A
mpl
itude
0 80 160 240 320 400 480 560 640 720 800
-0.25
0
0.25
0.5
0.75
1
Time [ms]
Nor
mal
ized
Am
plitu
de
SABI 2011 IOP PublishingJournal of Physics: Conference Series 332 (2011) 012014 doi:10.1088/1742-6596/332/1/012014
5

Figure 7. RWAT values related to age in a population of healthy men.
Figure 8 shows the VI values corresponding to the RWAT in Figure 7. It was found that the
average value in normotensive VI increased reasonably linearly with age, a trend-line between the VI and normotensive age was r = 0.57, p <0.05.
Figure 8. Velocity Index (VI) related to age of healthy men.
Table 1 shows the characteristics of the study population (mean values ± SD), and the index for each decade of life, highlighting their similar characteristics with regard to weight, heart rate and levels blood pressure. The low number of cases in the last two decades is due to the difficulty of finding healthy, non-medicated individuals, and clinically certified as such advanced ages.
In Figure 9, the Bland Altman [13] plot shows results of the comparison between the Velocity Index computed in the experimental case set with the proposed method and those obtained with the interactive process used so far. In the latter, the VI is computed on a set of pulse waves selected manually by the user, averaged and filtered with a FIR filter. As can be seen, the bias and the dispersion of the difference are mainly between the limits of agreement (bias ± 1.96 SD).
SABI 2011 IOP PublishingJournal of Physics: Conference Series 332 (2011) 012014 doi:10.1088/1742-6596/332/1/012014
6

Table 1. Characteristics of the study population (Mean values ± SD)
Age Decade
Nº of Cases
Systolic Pressure [mmHg]
Diastolic Pressure [mmHg]
Body Mass Index
[kg/m2]
Cardiac Frequency
[bpm]
Velocity Index [m/s]
2ª 28 123 ± 27 75 ± 17 23 ± 2 73 ± 12 18,5 ± 2,7 3ª 36 118 ± 21 78 ± 7 24 ± 3 73 ± 12 21,2 ± 3,5 4ª 49 122 ± 21 82± 15 27 ± 3 72 ± 11 23,0 ± 4,6 5ª 46 123 ± 13 83 ± 9 26 ± 3 73 ± 11 24,6 ± 5,1 6ª 27 128 ± 14 85 ± 8 27 ± 3 71 ± 12 27,6 ± 6,2 7ª 12 133 ± 88 88 ± 7 27 ± 3 68 ± 10 31,1 ± 7,6 8ª 3 143 ± 3 85 ± 0 28 ± 3 75 ± 12 30,3 ± 3.3
Figure 9. Bland-Altmann plot for Velocity Index (VI) measures.
4. Discussion
4.1. Methodological considerations The proposed method to compute the RWAT is based on the requirements of a smooth pulse wave well tuned for each digitized register, providing low signal-to-noise ratio, while keeping the morphology of the PW.
While it is widely known that one of the most used filters for data smoothing and differentiation is the Savitzky-Golay method, it requires specifications of both, filter length and polynomial degree [14]. Results of the smoothing operation are therefore dependent on a priori choices. Unlike carrying out a heuristic search on the filter parameters, an adaptive neuro-fuzzy model is proposed to obtain an analytic function.
4.2. Physiological considerations The distensibility of the wall of an artery depends on the amount, rate and state of its elastin fibers, collagen and vascular smooth muscle. Then an estimation of the propagation velocity provides an estimate of the state of the aortic walls, closely related to the functioning of the endothelium, which can be extrapolated to the rest of the arterial system [15].
10 15 20 25 30 35 40 45-1
-0.5
0
0.5
1
Mean of two VI measures [m/s]
Diff
eren
ce b
etw
een
two
VI m
easu
res [
m/s
]
SABI 2011 IOP PublishingJournal of Physics: Conference Series 332 (2011) 012014 doi:10.1088/1742-6596/332/1/012014
7

In addition, during the course of aging are accumulating in collagen glycation end products and advanced glycation of proteins that generate cross-links between collagen or elastin fibers of the arterial wall, contributing to reduce their compliance [16, 17].
The elastic fibers begin to break down at early ages; until in old age have their influence on the properties of the aortic walls. Broken elastic fibers stretched to yield and be contained by the collagen fibers, much less distensible. This causes a gradual increase in diameter and decreased distensibility of the walls [18, 19].
The fragmentation progressive phenomena of elastic fibers impact disproportionately on the area of the ascending aorta, which has a relationship elastin/collagen= 3/1. In the abdominal aorta that relationship falls to 0.8 and the effect is less noticeable and more distant muscular arteries are hardly affected [20].
Meanwhile, other phenomena such as calcification alter the structure of the arterial walls in response to a multitude of interconnected causes such as dyslipidemia, hypertension, diabetes, smoking and oxidative stress, causing endothelial cell dysfunction [21, 22].
The above phenomena reduce the distensibility of the aortic walls and decrease the compliance of the artery, increasing the pulsatile component of blood pressure and ventricular afterload. These changes are highlighted by the increase in aortic velocity of propagation. High velocity of propagation implies high ventricular afterload and high pulse pressure, conditions that lead to the development of ventricular hypertrophy and to accelerated deterioration of elastic fibers by mechanical stress [23, 24].
In view of the above, it is explained that the decrease of the delay of arrival of the reflected wave, plotted in Figure 8, is due to increased propagation velocity of the aorta caused by natural aging. A wider delay corresponds to a healthy aorta, a situation typical of adolescents and youth. If it is pretended to compare the aortic state between different individuals, it should be noted that it also depends on the length of the path of the reflected wave, which is proportional to their height. The exact length of this route is uncertain, not only because the path is not straight but because the reflection does not originate from a particular point, but in various parts of the circulatory system, mainly in the area of the iliac bifurcation, affirming even that it would be a diffuse area and not a precise point [25, 26].
If we knew the exact length of the path of the reflected wave between the birth of the subclavian artery and the starting point for reflection, dividing twice that length by the time spent on the trajectory, we could get directly the value of the average propagation velocity in that area. This is currently not feasible, given the impossibility of accurately measuring the above mentioned circuit. For these reasons it is preferred to use the height of the individual to calculate the velocity, obtaining a velocity index with dimensions based on the identification of events in the radial pulse wave, which depends on the velocity of propagation in the aorta. The results shown in Figure 8 show that although there is wide variation in healthy individuals, its average value increases with age in a linear trend at least within the age range studied.
5. Conclusions This paper proposes the automatic estimation of the arterial propagation velocity from the pulse wave raw records measured in the region of the radial artery. A fully automatic process is proposed to select and analyze typical pulse cycles from the raw data. An adaptive neuro-fuzzy inference system, together with a heuristic search is used to find a functional approximation of the PW.
The estimation of the pulse wave velocity is carried out via the analysis of the functional approximation obtained with the fuzzy model. The analysis of the fuzzy inference output was performed to compute the RWAT, and the aortic PWV was estimated with the height of the individuals.
The analysis of the PW records with the proposed methodology showed small differences compared with the method used so far, based on a strong interaction with the user. The automated process has a good performance also in those cases where the RW surpasses the level of the systolic peak, as in hypertensive patients.
SABI 2011 IOP PublishingJournal of Physics: Conference Series 332 (2011) 012014 doi:10.1088/1742-6596/332/1/012014
8

The PW morphology gives information on the vasoconstrictor tone of the arterial tree and the propagation velocity through the aortic region. PW analysis also provides relevant information on the PWV. The PWV is useful to estimate the condition of the aortic walls, closely related to the functioning of the endothelium, which can be extrapolated to the rest of the arterial system.
The computed RWAT characterizes the arterial status, so a high delay corresponds to a healthy aorta, a situation typical of adolescents and youth. When comparing aortic differences between individuals, it should be noted that it also depends on the length of the path of the reflected wave, which is proportional to the individual height. There is a wide variation in healthy individuals, but its average value increases with age in a linear trend, at least within the age range studied. Such dispersion is not due to the inaccuracy of the measurement methods, but the variety of arterial anatomical features observed in practice. The aortic PWV assesses impairment of arterial walls in the area, but it is also an independent predictor of coronary events, which is currently providing a growing interest.
We conclude that the presented methodology shows encouraging results to indirectly evaluate the aortic propagation velocity, which is related to physiological age in healthy individuals and with the expectation of life in cardiovascular patients.
References
[1] Hsien-Tsai Wu, Chun-Ho Lee, An-Bang Liu, Wei-Sheng Chung, Chieh-Ju Tang, Cheuk-Kwan Sun, Hon-Kan Yip 2011 Arterial Stiffness Using Radial Arterial Waveforms Measured at the Wrist as an Indicator of Diabetic Control in the Elderly. Biomedical Engineering, IEEE Transactions on . 58:2 243 – 252
[2] Greenwald S E, Carter AC, Berry C L 1990 Circulation 82 114-122 [3] Xu L, Meng M, Qi X, Wang K 2010 Morphology Variability Analysis of Wrist Pulse
Waveform for Assessment of Arteriosclerosis Status Journal of Medical Systems 34: 3 331-339 [4] Clara F M, Cayrol M, Scandurra A, Meschino G, Garzillo M, Moyano E, Introzzi A 2005 La
técnica de análisis de onda de pulso en la determinación del riesgo cardiovascular. Rev Fed Arg Cardiol; 34: 213-220.
[5] Dart A, Kingwell B 2000 Pulse pressure. A review of mechanisms and clinical relevance. JACC; 37: 975-984.
[6] Nichols WW 2005 Clinical measurement of arterial stiffness obtained from noninvasive pressure waveforms. Am J Hypertens; 18:3 S-10S.
[7] Futterman L, Lemberg L. 2003 The effects of aging on arteries. Am J Crit Care.;12 472-475 [8] Monnier M 1987 Changes in pulse wave velocity with age in man: A longitudinal series over
20 years. Experientia; 43: 378–81. [9] Boutouyrie P, Tropeano AI, Asmar R et al. 2002 Aortic stiffness is an independent predictor of
primary coronary events in hypertensive patients: A longitudinal study. Hypertension; 39: 10–15.
[10] Ying, H. 1998 General SISO Takagi–Sugeno Fuzzy Systems with Linear Rule Consequent Are Universal Approximators. IEEE Transactions On Fuzzy Systems 6 582-587
[11] Scandurra A, Maldonado E, Dai Pra A, Tusman G, Passoni L 2008 Modelo Híbrido para la aproximación funcional de registros de Capnografía Volumétrica In Annals of XIV Congreso Latino Ibero Americano de Investigación de Operaciones pp: 69.
[12] Tusman G, Scandurra A, Böhm S, Suarez-Sipmann F, Clara F 2009 Model fitting of volumetric capnograms improves calculations of airway dead space and slope of phase III Journal of Clinical Monitoring and Computing 23 197-206.
[13] Bland JM, Altman DG 1986 Statistical methods for assessing agreement between two methods of clinical measurement Lancet 327(8476): 307–10.
[14] Savitzky A, Golay M J 1964 Smoothing and Differentiation of Data by Simplified Least Squares Procedures Anal. Chem., 36 (8), 1627–1639
SABI 2011 IOP PublishingJournal of Physics: Conference Series 332 (2011) 012014 doi:10.1088/1742-6596/332/1/012014
9

[15] Anderson TJ. 2006 Arterial stiffness or endothelial dysfunction as a surrogate marker of vascular risk Can J Cardiol; 22:72 B-80B.
[16] McVeigh GE, Bank AJ, Cohn JN. 2007Arterial Compliance. En: Cardiovascular Medicine. London: Springer, Cap. 8, p. 1811-1831.
[17] Zieman SJ, Melenovsky V, Kass DA. 2005Mechanisms, Pathophysiology, and Therapy of Arterial Stiffness Arterioscler Thromb Vasc Biol 25: 932-943.
[18] Safar ME, Blacher J, Mourad JJ, London GM. 2000 Stiffness of carotid artery wall material and blood pressure in humans: application to antihypertensive therapy and stroke prevention Stroke; 31(3):782-90.
[19] McVeigh GE, Bratteli CW, Morgan DJ, et al. 1999Age-Related Abnormalities in Arterial Compliance Identified by Pressure Pulse Contour Analysis Hypertension; 33:1392-1398
[20] Rogers WJ. 2001Age-associated changes in regional aortic pulse wave velocity. J Am Coll Cardiol; 38:1123-1129.
[21] McEniery CM, McDonnell BJ, Aitken S, et al. 2009 Aortic Calcification Is Associated With Aortic Stiffness and Isolated Systolic Hypertension in Healthy Individuals; Hypertension; 53(3):524-31.
[22] Fassett RG, D'Intini V, Healy H, Gowardman J, Gan JS, Sharman JE, Coombes JS. 2009Assessment of arterial stiffness, oxidative stress and inflammation in acute kidney injury. BMC Nephrol; 10:15.
[23] Viazzi F, Leoncini G, Parodi D, et al. 2002 Pulse pressure and subclinical cardiovascular damage in primary hypertension. Nephrol Dial Transplant; 17: 1779 -1785.
[24] James M, Watt P, Potter J, Thurston H, Swales J 1995Pulse Pressure and Resistance Artery Structure in the Elderly. Hypertension; 26: 301-306.
[25] Nichols W, O'Rourke M 2009 Aortic Pulse Wave Velocity, Reflection Site Distance, and Augmentation Index. Hypertension; 53: e9.
[26] Pythoud F, Stergiopulos N, Westerhof N , 1996Meister J. Method for determining distribution of reflection sites in the arterial system. Am J Physiol Heart Circ Physiol 40 (5):1807- 1813
SABI 2011 IOP PublishingJournal of Physics: Conference Series 332 (2011) 012014 doi:10.1088/1742-6596/332/1/012014
10