Reference values of aortic pulse wave velocity in a large healthy population aged between 3 and 18...
8
Copyright © Lippincott Williams & Wilkins. Unauthorized reproduction of this article is prohibited. Reference values of aortic pulse wave velocity in a large healthy population aged between 3 and 18 years Erzse ´bet Vale ´ ria Hidve ´gi a , Miklo ´ s Illye ´s a , Be ´ la Benczu ´r a , Rena ´ta M. Bo ¨ cskei a , La ´ szlo ´ Ra ´tge ´ber b , Zso ´ fia Lenkey a , Ferenc T. Molna ´r c , and Attila Czira ´ki a Objective: The measurement of aortic pulse wave velocity (PWV ao ) is an accepted marker in stratifying individual cardiovascular risk in adults. There is an increasing volume of evidence concerning impaired vascular function in different diseases in paediatric populations, but, unfortunately, only a few studies are available on the measurement of normal PWV ao values in children. The aim of our study was to determine the reference values of PWV ao in a large healthy population using a newly developed technique. Methods: Three thousand, three hundred and seventy- four healthy individuals (1802 boys) aged 3–18 years were examined by an invasively validated, occlusive, oscillometric device. Results: The mean PWV ao values increased from 5.5 0.3 to 6.5 0.3 m/s (P < 0.05) in boys and from 5.6 0.3 to 6.4 0.3 m/s (P < 0.05) in girls. The increase, however, was not constant, and the values exhibited a flat period between the ages of 3 and 8 years in both sexes. The first pronounced increase occurred at the age of 12.1 years in boys and 10.4 years in girls. Moreover, between the ages of 3 and 8 years, the brachial SBP and mean blood pressures increased continuously and gradually, whereas the PWV ao remained unchanged. By contrast, beyond the age of 9 years, blood pressure and aortic stiffness trends basically moved together. Conclusion: Our study provides the largest database to date concerning arterial stiffness in healthy children and adolescents between the ages of 3 and 18 years, and the technology adopted proved easy to use in large paediatric populations, even at a very young age. Keywords: aorta, Arteriograph, blood pressure, children and adolescents, pulse wave velocity Abbreviations: CCA, common carotid artery; HR, heart rate; MAP, mean arterial pressure; PWV ao , aortic pulse wave velocity; RCA, right carotid artery; SSN, suprasternal notch; TEM, technical errors of measurement INTRODUCTION T he measurement of arterial stiffness, that is, aortic pulse wave velocity (PWV ao ), is an accepted marker for detecting organ damage and for stratifying individual cardiovascular risk in adults [1]. Moreover, we have an increasing volume of evidence concerning impaired vascular function in different diseases in paedi- atric populations: early atherosclerosis [2], obesity [3], extreme prematurity [4], familial hypercholesterolemia [5,6], type I diabetes mellitus [7,8], juvenile hypertension [9], different congenital heart diseases [10,11], end-stage renal disease [12], HIV infection [13], Kawasaki disease [14], neurofibromatosis [15], vasculitis [16], intrauterine growth restriction patients [17] and primary snoring [18]. These diseases might well influence aortic stiffness, and so the measurement of PWV ao may provide useful infor- mation, even in a paediatric population. However, to be able to assess the measured PWV ao values in different conditions and, further, to assess age-related dynamic changes of PWV ao in children and adolescents – especially in younger populations of less than 6 years – a precise determination of reference values between the third and 97th percentile is extremely important. Unfortunately, few studies are available which detail the normal values of PWV ao in paediatric populations. To date, in fact, a total of 1514 healthy individuals have been studied in six articles [19–24] (Table 1). In the majority of these studies, relatively small populations (n < 140) were measured to provide control groups to the diseased populations studied, and it is also worth mentioning that these healthy control groups were remarkably imbalanced in terms of age distribution. Only one study [24] comprised a larger population (1008 indi- viduals, 6–20 years), but even in this study the age distribution of the population was poorly balanced, as a substantial majority (68.1%) of the individuals studied were from the 15–20 years age group. On the contrary, these studies used ultrasound and applanation tonometry to determine PWV ao , techniques which are limited in use Journal of Hypertension 2012, 30:2314–2321 a Heart Institute, Faculty of Medicine, University of Pe ´ cs, b Faculty of Health Sciences, Institute of Public Health and Health Promotion, University of Pe ´ cs, Pe ´ cs and c Department of Hydrodynamic Systems, Budapest University of Technology and Economics, Budapest, Hungary Correspondence to Erzse ´ bet Vale ´ ria Hidve ´ gi, MD, Heart Institute, Faculty of Medicine, University of Pe ´ cs, 13 Ifju ´ sa ´ g str., H-7624 Pe ´ cs, Hungary. Tel/fax: +36 56 522 301; e-mail: [email protected] Received 15 January 2012 Revised 24 May 2012 Accepted 14 August 2012 J Hypertens 30:2314–2321 ß 2012 Wolters Kluwer Health | Lippincott Williams & Wilkins. DOI:10.1097/HJH.0b013e328359562c 2314 www.jhypertension.com Volume 30 Number 12 December 2012 Original Article
-
Upload
independent -
Category
Documents
-
view
2 -
download
0
Transcript of Reference values of aortic pulse wave velocity in a large healthy population aged between 3 and 18...
Original Article
Reference values of aortic pulse wave velocity in alarge healthy population agedbetween 3 and18 years
Erzsebet Valeria Hidvegia, Miklos Illyesa, Bela Benczura, Renata M. Bocskeia, Laszlo Ratgeberb,Zsofia Lenkeya, Ferenc T. Molnarc, and Attila Czirakia
Journal of Hypertension 2012, 30:2314–2321aHeart Institute, Faculty of Medicine, University of Pecs, bFaculty of Health Sciences,Institute of Public Health and Health Promotion, University of Pecs, Pecs andcDepartment of Hydrodynamic Systems, Budapest University of Technology and
Objective: The measurement of aortic pulse wave velocity(PWVao) is an accepted marker in stratifying individualcardiovascular risk in adults. There is an increasing volumeof evidence concerning impaired vascular function indifferent diseases in paediatric populations, but,unfortunately, only a few studies are available on themeasurement of normal PWVao values in children. The aimof our study was to determine the reference values ofPWVao in a large healthy population using a newlydeveloped technique.
Methods: Three thousand, three hundred and seventy-four healthy individuals (1802 boys) aged 3–18 years wereexamined by an invasively validated, occlusive, oscillometricdevice.
Results: The mean PWVao values increased from 5.5�0.3to 6.5�0.3 m/s (P<0.05) in boys and from 5.6� 0.3 to6.4�0.3 m/s (P< 0.05) in girls. The increase, however, wasnot constant, and the values exhibited a flat periodbetween the ages of 3 and 8 years in both sexes. The firstpronounced increase occurred at the age of 12.1 years inboys and 10.4 years in girls. Moreover, between the agesof 3 and 8 years, the brachial SBP and mean bloodpressures increased continuously and gradually, whereasthe PWVao remained unchanged. By contrast, beyond theage of 9 years, blood pressure and aortic stiffness trendsbasically moved together.
Conclusion: Our study provides the largest database todate concerning arterial stiffness in healthy children andadolescents between the ages of 3 and 18 years, and thetechnology adopted proved easy to use in large paediatricpopulations, even at a very young age.
Keywords: aorta, Arteriograph, blood pressure, childrenand adolescents, pulse wave velocity
Abbreviations: CCA, common carotid artery; HR, heartrate; MAP, mean arterial pressure; PWVao, aortic pulsewave velocity; RCA, right carotid artery; SSN, suprasternalnotch; TEM, technical errors of measurement
Economics, Budapest, Hungary
Correspondence to Erzsebet Valeria Hidvegi, MD, Heart Institute, Faculty of Medicine,University of Pecs, 13 Ifjusag str., H-7624 Pecs, Hungary. Tel/fax: +36 56 522 301;e-mail: [email protected]
INTRODUCTION Received 15 January 2012 Revised 24 May 2012 Accepted 14 August 2012J Hypertens 30:2314–2321 � 2012 Wolters Kluwer Health | Lippincott Williams &Wilkins.
DOI:10.1097/HJH.0b013e328359562c
The measurement of arterial stiffness, that is, aorticpulse wave velocity (PWVao), is an accepted markerfor detecting organ damage and for stratifyingCopyright © Lippincott Williams & Wilkins. Unauth2314 www.jhypertension.com
individual cardiovascular risk in adults [1]. Moreover, wehave an increasing volume of evidence concerningimpaired vascular function in different diseases in paedi-atric populations: early atherosclerosis [2], obesity [3],extreme prematurity [4], familial hypercholesterolemia[5,6], type I diabetes mellitus [7,8], juvenile hypertension[9], different congenital heart diseases [10,11], end-stagerenal disease [12], HIV infection [13], Kawasaki disease[14], neurofibromatosis [15], vasculitis [16], intrauterinegrowth restriction patients [17] and primary snoring [18].
These diseases might well influence aortic stiffness, andso the measurement of PWVao may provide useful infor-mation, even in a paediatric population. However, to beable to assess the measured PWVao values in differentconditions and, further, to assess age-related dynamicchanges of PWVao in children and adolescents – especiallyin younger populations of less than 6 years – a precisedetermination of reference values between the third and97th percentile is extremely important.
Unfortunately, few studies are available which detailthe normal values of PWVao in paediatric populations.To date, in fact, a total of 1514 healthy individuals havebeen studied in six articles [19–24] (Table 1). In themajority of these studies, relatively small populations(n< 140) were measured to provide control groups tothe diseased populations studied, and it is also worthmentioning that these healthy control groups wereremarkably imbalanced in terms of age distribution. Onlyone study [24] comprised a larger population (1008 indi-viduals, 6–20 years), but even in this study the agedistribution of the population was poorly balanced, asa substantial majority (68.1%) of the individuals studiedwere from the 15–20 years age group. On the contrary,these studies used ultrasound and applanation tonometryto determine PWVao, techniques which are limited in use
orized reproduction of this article is prohibited.Volume 30 � Number 12 � December 2012
TABLE 1. Published normal paediatric aorta pulse wave velocity values
Age, yearsNumber ofparticipants Method
Distancemeasurement PWVao, m/s Reference
11 30 Pressure transducers CCA�a. fem. 6.5�1.2 Tedesco et al. [19]
12.9�0.2 110 Applanation tonometry RCA�right a. fem 4.1–8.2 Ahimastos et al. [20]
0.2–20 125 Doppler ultrasound CCA�a. fem. 4.4–7.9 Avolio et al. [21]
3–20 108 Doppler ultrasound CCA�a. fem.; MS�a. fem 6.2–10.2 Avolio et al. [22]
6–23 133 Applanation tonometry CCA�SSNþSSN�a. fem 5.02�0.89 Kis et al. [23]
6–20 495 male; 513 female Applanation tonometry CCA�SSN –SSN�a. fem Male 4.34–5.71;female 4.34–5.50
Reusz et al. [24]
a.fem, femoral artery; CCA, common carotid artery; MS, manubrium sterni; RCA, right carotid artery; SSN, suprasternal notch.
Reference values of PWVao in children
to the noninvasive clinical evaluation of aortic stiffness inpaediatric patients [25].
The aim of our study, therefore, was to determine thereference values of the PWVao in a large healthy populationwhich showed a fair balance in terms of age. We intendedto apply a newly developed, invasively validated and easy-to-use oscillometric technique which allowed us to expandmeasurement even into a very young (<6 years) populationand within a daily clinical routine.
METHODS
ParticipantsThree thousand, three hundred and seventy-four appa-rently healthy white individuals without any medicationand/or blood pressure-affecting drugs from Hungary (1802boys and 1572 girls) aged 3–18 years, having BMI and SBPand DBP within the third and 97th percentiles, as estab-lished by the relevant guidelines [26,27], were recruitedfrom nursery, elementary and secondary schools. Writtenconsent for the measurements to be taken was given by theparents. The protocol of this clinical study was reviewedand approved by the local Institutional Ethics Committee ofthe University of Pecs, Pecs, Hungary.
MethodsA noninvasive, occlusive, oscillometric device (Arterio-graph; TensioMed Ltd, Budapest, Hungary) was used forthe PWVao measurements, for which the operating pro-cedure did not, in practice, differ from a standard digitalblood pressure measurement. The method and its vali-dations have been detailed previously [28,29]. Briefly, themethod is based on the physiological fact that the early (P1)systolic pulse pressure wave of the aorta, generated by theleft ventricle ejection, travels along the aorta and is reflected(P2) from the area of the aortic bifurcation. Occluding thebrachial artery by pressurizing the cuff 35–40 mmHg abovethe actual SBP creates easily distinguished, pronounced
Copyright © Lippincott Williams & Wilkins. Unauth
TABLE 2. Intraobserver and interobserver errors
Intraobserver
Physician(s) 1 2 3 4 5 1–2 1–3
TEM (cm) 0.23 0.31 0.26 0.28 0.20 0.27 0.27
Relative TEM (%) 0.5 0.7 0.5 0.6 0.4 0.6 0.6
TEM, technical error of measurement.
Journal of Hypertension
pressure peaks in the cuff. Separated in this way, earlyand late systolic waves can be recorded. The time lapsesbetween the peaks of P1 and P2 are equal to the travel timeof the aortic pressure wave from the aortic root to thebifurcation and back. By halving this time and measuringthe sternal notch – pubic bone distance (which is ratherclose to the true aortic length [30]), the PWVao can becalculated (PWVao¼ jugulum–symphysis distance/transittime). The PWVao measurements were taken with theparticipant in a calm, supine position after several minutesof rest.
The interobserver and intraobserver errors of the dis-tance (sternal notch–pubic bone) measurements wereexpressed as absolute and relative technical errors ofmeasurement (TEM) [31] and proved to be well withinacceptable limits (Table 2).
Data analysis and statisticsData are reported as mean and SD for continuous data. Fordata comparison, a Student’s t-test was used after checkingthat the assumption of normality was met. A significancelevel of 0.05 was used for statistical tests. Statistical analysiswas performed with the SPSS 15.0 statistical package (SPSSInc., Chicago, Illinois, USA).
Reference percentile curves were obtained with theuse of the LMS method [32], specifically with the LMSChartmaker software [33]. The method summarizes thedistribution of a variable by its skewness (expressed asBox–Cox power, L), its median (M) and its coefficient ofvariation (S). The age-dependent changes in theseparameters are smoothed by fitting cubic splines withappropriately selected smoothing parameters, usingpenalized likelihood.
RESULTSThe characteristics of the subjects investigated are summar-ized in Tables 3 and 4. Both the boys and the girls are fairly
orized reproduction of this article is prohibited.
Interobserver
1–4 1–5 2–3 2–4 2–5 3–4 3–5 4–5
0.34 0.30 0.30 0.32 0.32 0.32 0.27 0.30
0.7 0.6 0.6 0.7 0.7 0.7 0.6 0.6
www.jhypertension.com 2315

TABLE 3. Characteristics of boys
Age(years) n
Height(cm)
Weight(kg)
BSA(m2)
BMI(%)
SBPbrach
(mmHg)DBPbrach
(mmHg)MAP
(mmHg)HR
(beats/min)JUG-SY
(cm)
03 044 104.4�6.7 16.2�02.5 0.7�0.1 14.8�1.9 103.0�5.5 61.8�7.3 76.5�7.5 98.7�11.1 32.0�2.5
04 053 108.6�7.6 17.5�02.7 0.7�0.1 14.8�1.6 104.1�7.7 61.5�7.5 76.9�8.5 92.5�13.0 33.1�2.9
05 080 115.5�6.8 19.7�02.9 0.8�0.1 14.8�1.7 106.4�7.2 62.7�6.3 78.3�7.8 91.5�13.4 35.0�2.2
06 120 123.2�6.2 22.4�03.5 0.9�0.1 14.7�1.6 104.5�6.8 62.0�6.3 76.3�6.4 86.6�11.5 37.2�2.7
07 085 127.8�6.8 25.2�04.2 0.9�0.1 15.4�1.8 107.8�7.2 63.8�6.3 78.8�6.7 83.7�13.1 39.0�2.7
08 074 132.9�8.0 27.9�04.7 1.0�0.1 15.8�1.8 106.9�7.1 62.8�5.3 77.4�5.4 79.9�13.2 40.0�2.9
09 092 138.5�7.4 31.2�05.9 1.1�0.1 16.1�1.9 109.3�6.9 64.8�6.8 79.2�6.1 79.7�13.5 42.0�3.3
10 081 144.5�6.6 36.1�06.5 1.2�0.1 17.2�2.2 111.2�7.3 64.7�5.5 80.5�5.7 78.7�12.3 44.0�3.4
11 080 148.4�8.2 38.9�07.8 1.3�0.2 17.5�2.4 111.5�7.5 65.2�5.7 80.7�5.9 73.7�11.5 44.3�3.3
12 101 155.3�9.6 44.3�09.3 1.4�0.2 18.2�2.5 115.0�7.5 65.3�6.3 82.1�6.1 77.5�13.8 47.2�4.2
13 169 163.1�9.5 50.8�09.3 1.5�0.2 19.0�2.3 117.2�7.8 64.8�6.3 82.3�6.1 76.3�12.6 49.2�3.7
14 187 169.0�9.8 55.5�09.8 1.6�0.2 19.3�2.4 119.5�7.4 65.7�5.4 83.7�5.2 76.2�13.2 51.0�3.4
15 171 174.1�7.6 59.9�09.2 1.7�0.2 19.7�2.4 121.1�8.0 67.5�6.2 85.4�6.0 71.3�12.8 51.8�3.4
16 162 175.9�7.1 64.3�11.2 1.8�0.2 20.7�2.8 124.5�8.5 68.6�6.2 87.3�6.2 72.5�14.3 53.1�3.3
17 197 178.0�7.2 67.5�10.2 1.8�0.2 21.3�2.7 126.3�8.6 68.8�6.5 88.0�6.2 69.9�11.9 54.5�3.4
18 106 179.6�6.9 69.6�08.7 1.9�0.1 21.6�2.4 128.2�8.3 67.4�7.3 87.7�6.4 70.3�13.2 55.3�3.5
Data are shown as mean� SD. DBPbrach, brachial DBP; HR, heart rate; JUG-SY, distance between sternal notch (jugulum) and upper part of the pubic bone (symphysis); MAP, meanarterial pressure; SBPbrach, brachial SBP.
Hidvegi et al.
well balanced in termsof age,whereas 15%of thepopulationwas recruited from very young age groups (3–6 years).
All of the parameters measured showed a markedincrease with age, except for the heart rate – whichdecreased, as physiologically expected.
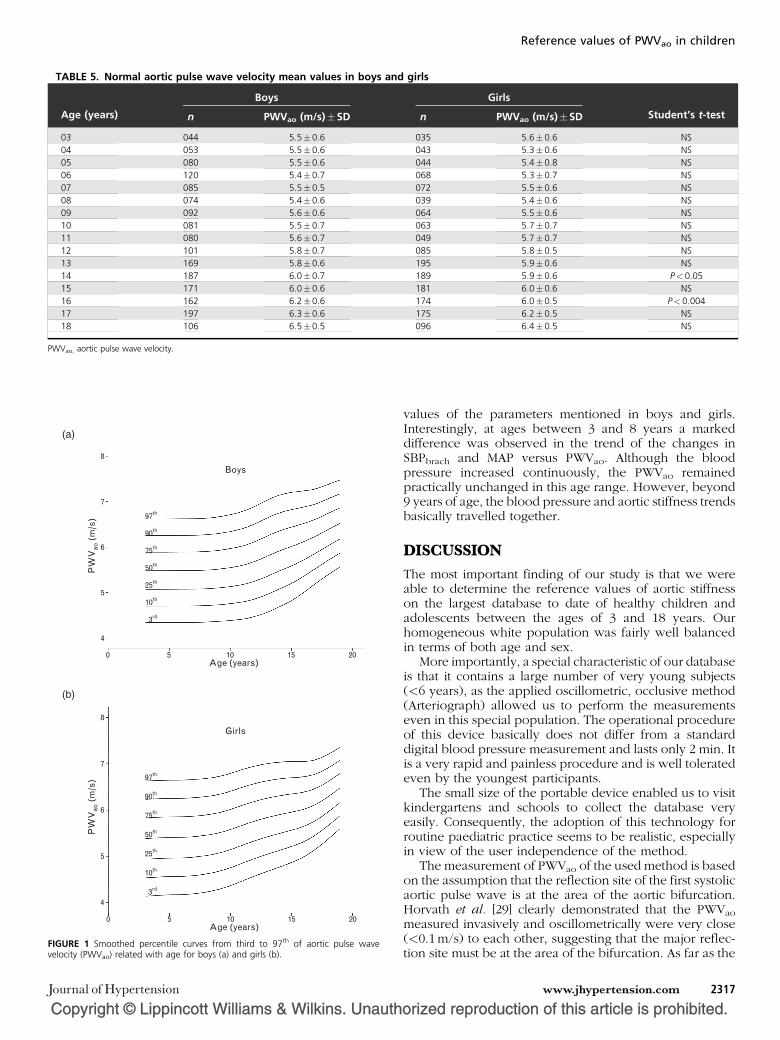
Table 5 summarizes the PWVao changes. The increase ofmean PWVao values turned out to be roughly 1m/s in bothsexes from the age of 3 to 18 years, as this parameterincreased from 5.5� 0.3 to 6.5� 0.3 m/s (P< 0.05) in boysand from 5.6� 0.3 to 6.4� 0.3 m/s (P< 0.05) in girls. Whencomparing the mean PWVao values in each year betweenboys and girls, noticeable differences were found in the 14-year and 16-year age groups. However, these differencesare merely 0.1 and 0.2 m/s, respectively, and so cannot beconsidered as clinically significant.
Smoothed percentile curves of PWVao from the third tothe 97th are shown for boys and girls in Fig. 1, and the
Copyright © Lippincott Williams & Wilkins. Unauth
TABLE 4. Characteristics of girls
Age(years) n
Height(cm)
Weight(kg)
BSA(m2)
BMI(%)
03 035 102.2�06.3 15.5�2.4 0.7�0.1 14.8�1.2
04 043 107.1�06.4 17.1�2.9 0.7�0.1 14.8�1.8
05 044 114.5�07.4 18.8�3.3 0.8�0.1 14.3�1.7
06 068 123.0�06.6 22.2�4.0 0.9�0.1 14.6�1.7
07 072 128.6�10.3 25.2�7.1 0.9�0.2 15.0�2.3
08 039 133.9�07.1 28.1�5.7 1.0�0.1 15.6�2.4
09 064 138.6�08.1 31.9�6.5 1.1�0.1 16.5�2.3
10 063 144.0�07.1 34.4�6.6 1.2�0.1 16.5�2.3
11 049 150.8�09.8 39.5�8.4 1.3�0.2 17.2�2.5
12 085 156.8�07.8 44.6�8.8 1.4�0.2 18.0�2.5
13 195 160.8�07.7 49.6�7.9 1.5�0.1 19.1�2.6
14 189 163.7�06.5 52.3�8.3 1.5�0.1 19.5�2.6
15 181 164.8�08.0 54.8�9.3 1.6�0.2 20.1�2.7
16 174 164.9�06.7 55.8�8.5 1.6�0.1 20.5�2.7
17 175 165.9�06.3 56.2�9.3 1.6�0.1 20.4�2.9
18 096 166.3�06.6 57.5�8.4 1.6�0.1 20.8�2.8
Data are shown as mean� SD. Data are shown as mean� SD. DBPbrach, brachial DBP; HR, hearbone (symphysis); MAP, mean arterial pressure; SBPbrach, brachial SBP.
2316 www.jhypertension.com
corresponding values of PWVao can be seen in Tables 6and 7.
Analysing the curves of the median values of PWVao inboys and girls, it became clear that the increase was notconstant with age, but had more complex dynamics (Fig. 1).In both sexes, the PWVao values exhibit a flat periodbetween 3 and 8 years, with a steeper increase thereafter.The first derivative of the smoothed median curve of PWVao
showed that the first pronounced increase occurred at theage of 12.1 years in boys and 10.4 years in girls (Fig. 2).
To study causal relationships between PWVao and othervariables, graphical analyses were used, as multivariatelinear regression cannot be applied due to the high multi-collinearity among age, anthropometric and hemodynamicparameters. In Fig. 3, we demonstrate the relationshipbetween PWVao, mean arterial pressure (MAP) and brachialSBP (SBPbrach), featuring the median of the standardized
orized reproduction of this article is prohibited.
SBPbrach
(mmHg)DBPbrach
(mmHg)MAP
(mmHg)HR
(beats/min)JUG-SY
(cm)
102.5�5.1 61.1�9.4 75.4�8.1 101.1�14.4 30.9�1.9
103.3�5.2 60.0�5.2 75.2�4.9 092.4�11.6 31.8�2.8
103.7�6.3 61.7�7.2 76.1�6.9 093.7�11.7 33.4�2.1
105.0�6.9 62.1�5.8 76.8�6.7 087.3�13.3 35.9�2.4
106.4�7.3 63.2�5.6 77.7�6.0 086.5�12.5 38.2�3.3
107.6�7.3 63.6�4.6 78.3�5.0 083.2�11.1 39.2�2.3
109.6�6.4 64.8�5.8 79.3�5.4 084.9�11.7 40.8�3.1
111.1�7.3 64.8�5.5 80.2�5.5 082.5�09.4 42.4�3.2
112.1�6.8 65.4�5.0 81.0�5.0 080.1�09.4 44.2�3.7
113.4�7.5 65.6�5.4 81.5�5.6 079.5�12.8 46.2�3.5
115.1�7.6 65.4�6.2 82.0�5.9 078.6�13.8 47.8�3.0
117.6�8.2 67.0�6.2 83.8�6.3 077.7�14.2 48.7�2.8
117.2�7.6 68.5�5.8 84.7�5.9 077.1�12.3 48.6�3.4
117.8�7.4 69.2�5.4 85.4�5.5 074.4�11.7 49.1�3.2
117.7�8.0 68.0�6.0 84.5�6.1 074.7�10.2 49.8�3.1
118.8�8.6 68.2�6.0 85.1�6.3 077.0�11.0 51.2�2.8
t rate; JUG-SY, distance between sternal notch (jugulum) and upper part of the pubic
Volume 30 � Number 12 � December 2012
Copyright © Lippincott Williams & Wilkins. Unauth
TABLE 5. Normal aortic pulse wave velocity mean values in boys and girls
Age (years)
Boys Girls
Student’s t-testn PWVao (m/s)�SD n PWVao (m/s)�SD
03 044 5.5�0.6 035 5.6�0.6 NS
04 053 5.5�0.6 043 5.3�0.6 NS
05 080 5.5�0.6 044 5.4�0.8 NS
06 120 5.4�0.7 068 5.3�0.7 NS
07 085 5.5�0.5 072 5.5�0.6 NS
08 074 5.4�0.6 039 5.4�0.6 NS
09 092 5.6�0.6 064 5.5�0.6 NS
10 081 5.5�0.7 063 5.7�0.7 NS
11 080 5.6�0.7 049 5.7�0.7 NS
12 101 5.8�0.7 085 5.8�0.5 NS
13 169 5.8�0.6 195 5.9�0.6 NS
14 187 6.0�0.7 189 5.9�0.6 P<0.05
15 171 6.0�0.6 181 6.0�0.6 NS
16 162 6.2�0.6 174 6.0�0.5 P<0.004
17 197 6.3�0.6 175 6.2�0.5 NS
18 106 6.5�0.5 096 6.4�0.5 NS
PWVao, aortic pulse wave velocity.
Boys
Age (years)
PW
Vao
(m
/s)
0
4
5
6
7
8
5
3rd
10th
25th
50th
75th
90th
97th
10 15 20
Girls
Age (years)
PW
Vao
(m
/s)
0
4
5
6
7
8
5
3rd
10th
25th
50th
75th
90th
97th
10 15 20
(a)
(b)
FIGURE 1 Smoothed percentile curves from third to 97th of aortic pulse wavevelocity (PWVao) related with age for boys (a) and girls (b).
Reference values of PWVao in children
Journal of Hypertension
values of the parameters mentioned in boys and girls.Interestingly, at ages between 3 and 8 years a markeddifference was observed in the trend of the changes inSBPbrach and MAP versus PWVao. Although the bloodpressure increased continuously, the PWVao remainedpractically unchanged in this age range. However, beyond9 years of age, the blood pressure and aortic stiffness trendsbasically travelled together.
DISCUSSIONThe most important finding of our study is that we wereable to determine the reference values of aortic stiffnesson the largest database to date of healthy children andadolescents between the ages of 3 and 18 years. Ourhomogeneous white population was fairly well balancedin terms of both age and sex.
More importantly, a special characteristic of our databaseis that it contains a large number of very young subjects(<6 years), as the applied oscillometric, occlusive method(Arteriograph) allowed us to perform the measurementseven in this special population. The operational procedureof this device basically does not differ from a standarddigital blood pressure measurement and lasts only 2 min. Itis a very rapid and painless procedure and is well toleratedeven by the youngest participants.
The small size of the portable device enabled us to visitkindergartens and schools to collect the database veryeasily. Consequently, the adoption of this technology forroutine paediatric practice seems to be realistic, especiallyin view of the user independence of the method.
The measurement of PWVao of the used method is basedon the assumption that the reflection site of the first systolicaortic pulse wave is at the area of the aortic bifurcation.Horvath et al. [29] clearly demonstrated that the PWVao
measured invasively and oscillometrically were very close(<0.1 m/s) to each other, suggesting that the major reflec-tion site must be at the area of the bifurcation. As far as the
orized reproduction of this article is prohibited.www.jhypertension.com 2317

Copyright © Lippincott Williams & Wilkins. Unauthorized reproduction of this article is prohibited.
TA
BLE
6.
Ao
rtic
pu
lse
wave
velo
city
perc
en
tile
data
for
bo
ys
Ag
e(y
ears
)3
45
67
89
10
11
12
13
14
15
16
17
18
n44
53
80
120
85
74
92
81
80
101
168
187
171
162
197
106
PWV
ao
per
centile
dat
aL
11
11
11
11
11
11
11
11
M5.4
77
5.4
78
5.4
79
5.4
82
5.4
83
5.4
92
5.5
14
5.5
49
5.5
99
5.6
83
5.7
96
5.9
11
6.0
10
6.1
16
6.2
40
6.3
82
S0.1
10
0.1
10
0.1
10
0.1
10
0.1
10
0.1
11
0.1
11
0.1
11
0.1
12
0.1
13
0.1
13
0.1
10
0.1
05
0.0
97
0.0
89
0.0
83
97
th6.6
96.6
96.6
96.6
96.6
96.7
16.7
46.7
96.8
66.9
77.1
17.2
27.2
87.3
17.3
57.4
4
90
th6.2
86.2
96.2
96.2
96.2
96.3
06.3
36.3
76.4
46.5
46.6
76.7
86.8
56.9
16.9
87.0
9
75
th5.8
85.8
85.8
85.8
95.8
95.9
05.9
25.9
66.0
26.1
16.2
36.3
56.4
36.5
16.6
16.7
3
50
th5.4
85.4
85.4
85.4
85.4
85.4
95.5
15.5
55.6
05.6
85.8
05.9
16.0
16.1
26.2
46.3
8
25
th5.0
75.0
85.0
85.0
85.0
85.0
95.1
15.1
45.1
85.2
55.3
65.4
85.5
95.7
25.8
76.0
3
10
th4.6
74.6
74.6
74.6
74.6
84.6
84.7
04.7
24.7
64.8
24.9
25.0
45.1
75.3
25.5
05.6
8
3rd
4.2
74.2
74.2
74.2
74.2
74.2
84.2
94.3
14.3
44.4
04.4
94.6
14.7
44.9
35.1
35.3
2
Hei
ght
(cm
)104.4
108.6
115.5
123.2
127.8
132.9
138.5
144.5
148.4
155.3
163.1
169.0
174.1
175.9
178.1
179.6
Wei
ght
(kg)
16.2
17.5
19.7
22.4
25.2
27.9
31.2
36.1
38.9
44.3
50.8
55.5
59.9
64.3
67.6
69.6
PWV
ao,ao
rtic
puls
ew
ave
velo
city
.
TA
BLE
7.
Ao
rtic
pu
lse
wave
velo
city
perc
en
tile
data
for
gir
ls
Ag
e(y
ears
)3
45
67
89
10
11
12
13
14
15
16
17
18
n35
43
44
68
72
39
64
63
49
85
196
189
181
174
175
96
PWV
ao
per
centile
dat
aL
11
11
11
11
11
11
11
11
M5.3
84
5.3
98
5.4
07
5.4
11
5.4
26
5.4
56
5.5
06
5.5
81
5.6
75
5.7
63
5.8
38
5.9
01
5.9
57
6.0
19
6.1
26
6.2
90
S0.1
23
0.1
22
0.1
22
0.1
22
0.1
21
0.1
20
0.1
18
0.1
15
0.1
13
0.1
09
0.1
06
0.1
02
0.0
97
0.0
91
0.0
84
0.0
77
97
th6.7
16.7
26.7
26.7
36.7
46.7
66.8
06.8
76.9
57.0
27.0
87.1
17.1
27.1
17.1
57.2
6
90
th6.2
76.2
86.2
96.2
96.3
06.3
36.3
76.4
46.5
36.6
06.6
66.7
06.7
36.7
56.8
16.9
4
75
th5.8
35.8
45.8
55.8
55.8
65.8
95.9
46.0
16.1
06.1
86.2
56.3
06.3
46.3
86.4
76.6
1
50
th5.3
85.4
05.4
15.4
15.4
35.4
65.5
15.5
85.6
85.7
65.8
45.9
05.9
66.0
26.1
36.2
9
25
th4.9
44.9
64.9
74.9
74.9
95.0
25.0
75.1
55.2
55.3
45.4
35.5
05.5
75.6
55.7
85.9
7
10
th4.5
04.5
24.5
34.5
34.5
54.5
94.6
44.7
24.8
24.9
25.0
15.1
05.1
85.2
95.4
45.6
4
3rd
4.0
64.0
84.0
94.0
94.1
14.1
54.2
14.2
94.4
04.5
04.6
04.7
04.8
04.9
25.1
05.3
2
Hei
ght
(cm
)102.2
107.1
114.5
123.0
128.6
133.9
138.6
144.0
150.8
156.8
160.8
163.7
164.8
164.9
165.9
166.3
Wei
ght
(kg)
15.5
17.1
18.8
22.2
25.2
28.1
31.9
34.4
39.5
44.6
49.5
52.3
54.8
55.8
56.2
57.5
PWV
ao,ao
rtic
puls
ew
ave
velo
city
.
Hidvegi et al.
2318 www.jhypertension.com Volume 30 � Number 12 � December 2012

Boys
Age (years)0
5.40 0.00
0.05
0.10
0.15
5.60
5.80
6.00
6.20
6.40
5 10 15 20
Sm
oo
thed
med
ian
cu
rve
of P
WV
ao (
m/s
)
First d
erivative of th
e med
ian cu
rveo
f PW
Vao (m
/s)
Girls
Age (years)0
5.40
5.20 0.00
0.05
0.10
0.15
0.20
5.60
5.80
6.00
6.20
6.40
5 10 15 20
Sm
oo
thed
med
ian
cu
rve
of P
WV
ao (
m/s
)
First d
erivative of th
e med
ian cu
rveo
f PW
Vao (m
/s)
(a)
(b)
FIGURE 2 Smoothed median curve (grey curve) and first derivative of smoothedmedian curve of aortic pulse wave velocity (PWVao; black curve) related to age forboys (a) and girls (b).
Age (years)
Med
ian
val
ue
0–1.5
–1.0
–0.5
0.0
0.5
1.0
1.5
5
stand. PWVstand. MAPstand. Sys
10 15 20
Boys
Age (years)
Med
ian
val
ue
0
–1.5
–1.0
–0.5
0.0
0.5
1.0
5
stand. PWVstand. MAPstand. Sys
10 15 20
Girls
(a)
(b)
FIGURE 3 Standardized median curves of aortic pulse wave velocity (PWVao),mean arterial pressure (MAP) and brachial SBP related to age for boys (a) andgirls (b).
Reference values of PWVao in children
potential change of the position of the aortic bifurcationduring growth is concerned, on the basis of our literaturesearch we could not find any data about the change of theposition of the aortic bifurcation related to its vertebralposition during growing between ages of 3 and 18 years. Inthe available anatomical textbooks the length and theposition of aortic parts (thoracic, abdominal) are deter-mined in the relationship with vertebral number (thoracicor abdominal). Minor changes in the position of the aorticbifurcation, related to its vertebral position during growingcannot be excluded theoretically. Furthermore, this kind ofpotential bias due to the growing may exist if the measure-ment of the aortic PWV would be performed by carotid–femoral method.
The overall increase with age of mean PWVao values wasidentical in both sexes, only biologically insignificant differ-ences were observed between them. These findingssuggest that no significant structural difference existsbetween sexes in this age range.
Regarding the augmentation index, Ayer et al. measuredcarotid augmentation index (AIx) in 8-year-old children toexamine the influences of sex, height and arterial stiffnesson central arterial pulse wave augmentation [34]. Theyfound that carotid AIx was significantly higher in girls thanboys and it was independent of height, carotid arterydiameter and stiffness. In contrast in our study we focusedon the PWV and proved that the PWVao does not increase
Copyright © Lippincott Williams & Wilkins. UnauthJournal of Hypertension
constantly with age. In the very young age groups (between3 and 8 years), the median PWVao values are practicallyconstant for both sexes.
The second original finding was that we observed a veryimportant (previously not described) characteristic of thesmoothed percentile curves of PWVao values.
During a detailed and careful analysis when the firstderivatives of the smoothed median curve of PWVao wereapplied, it emerged that the steepest increase differs interms of time between boys and girls, that is it occurs at12.1 years in boys and at 10.4 years in girls. We canhypothesize that this newly observed phenomenon mightbe explained by the differing onset of adolescence in boysand girls.
When we compared the age-related changes of themedian of the standardized values of PWVao, MAP andSBPbrach, a further new and interesting feature appeared.We observed marked differences between the ages of 3 and8 years in the trends of PWVao, MAP and SBPbrach. Interest-ingly, the PWVao remained practically unchanged, whereasthe blood pressure trend constantly increased. This raisesseveral physiological questions. We might suppose that,
orized reproduction of this article is prohibited.www.jhypertension.com 2319
Hidvegi et al.
at a very young age, the aortic wall is so elastic thatan increase in blood pressure does not cause anyconsequential stiffening in the aortic wall, but, clearly,further, specifically designed studies would be needed toconfirm this hypothesis. Similarly the practically identicalincrease of the standardized PWVao and peripheral bloodpressure at the later ages of 10–18 years might be due to agradual loss of aortic elastic properties.
Several authors have provided evidence about thechanges in the structure and composition of the aortic wallat an early age, specifically that ageing causes a loss inelastic properties [35–39]. It is possible that the continu-ously increasing blood pressure which occurs between theages of 3 and 18 years may lead to a simultaneous increasein lateral tension in the aortic wall. Then beyond the age of10–12 years, this load cannot be compensated for assuccessfully as was the case between 3 and 8 years. Hence,the rise in pressure will inevitably be accompanied by a risein aortic stiffness.
Whether the abnormally steep increase of PWVao (e.g. anindividual’s increase in PWVao from the 25th to 90th per-centile within a few years) might have pathological value inassessing cardiovascular risk characterized by the acceler-ated stiffening of the aortic wall is something which remainsto be clarified by further, preferably longitudinal exami-nation.
Assessing our age-related mean PWVao values in the lightof earlier studies, the observed absolute values and theirchanges in relation to age seem to be very similar,suggesting that the PWVao values provided by the oscillo-metric method fall strictly within the range found by otherexaminers (Table 1). Unfortunately, a more detailed com-parison of the observed mean PWVao values betweenstudies cannot be undertaken, as neither the values ofthe measured distances nor the transit times of the pulsepressure waves between the observational points are givenby the cited authors.
In this respect, our measured mean PWVao values(5.5–6.5 m/s in boys and 5.6–6.4 m/s in girls) are closestto the results of Reusz et al. published recently, although theupper age of their participants was 20 years [24]. Theirapplied distance measurement [(femoral site�jugularnotch) � (carotid site�jugular notch)] and our distance[Jug-Sy, the distance between the sternal notch (jugulum)and upper part of the pubic bone (symphysis)] differsmarkedly. To be able to judge the difference in distanceand to be able to compare the results more precisely, wecarried out a small sub-study on our population involving56 subjects aged between 6 and 18 (quite well distributed interms of age). We measured the distances in the samesubject by both methods and found a difference of4.6 cm, i.e. the Jug-Sy distance was 4.6 cm longer on averagethan the [(femoral site�jugular notch) � (carotid site�jugular notch)] distance. Consequently, the PWVao differ-ences between the data of Reusz et al.[24] and of ourselves(roughly 1m/s) originated basically from the differentmethods which were used.
To summarize our study, we provided PWVao referencevalues for 3374 healthy whites, reasonably balanced interms of age from 3 to 18 years, using a valid and reliabletechnique which can be used even at very young ages. We
Copyright © Lippincott Williams & Wilkins. Unauth2320 www.jhypertension.com
first detailed the specific characteristics of the changes ofPWVao – namely that the PWVao remains unchanged in thevery young (despite increasing blood pressure), and wefound the gradual increase of PWVao in adolescence –which is proportionate to the increase in blood pressure.
Study limitationsOur data are collected only in white population with no anyethnic or race mixture. Data collection in other populationmay be the issue of future researches.
ACKNOWLEDGEMENTSThe authors thank Janos Hubert, Gyorgyi Jakli, IlonaKelemen, Hajnalka Klemencz (data collection) and GaborERSEK (data analysis) for their contribution to this work.
This study was supported by the Hungarian NationalResearch Foundation (OTKA) No.78480.
Conflicts of interestM.I. owns shares in TensioMed Ltd., the company whichmanufactures the Arteriograph and other devices formeasuring vascular stiffness. F.T.M. is employed at Ten-sioMed Ltd. The other authors have declared no conflictsof interest.
REFERENCES1. Mancia G, De Backer G, Dominiczak A, Cifkova R, Fagard R, Germano
G, et al. 2007 ESH-ESC practice guidelines for the management ofarterial hypertension: ESH-ESC Task Force on the Management ofArterial Hypertension. J Hypertens 2007; 25:1751–1762.
2. Celermajer DS, Sorensen KE, Gooch VM, Spiegelhalter DJ, Miller OI,Sullivan ID, et al. Noninvasive detection of endothelial dysfunction inchildren and adults at risk of atherosclerosis. Lancet 1992; 340:1111–1115.
3. Meyer AA, Kundt G, Steiner M, Schuff-Werner P, Kienast W. Impairedflow-mediated vasodilation, carotid artery intima-media thickening,and elevated endothelial plasma markers in obese children: the impactof cardiovascular risk factors. Pediatrics 2006; 117:1560–1567.
4. McEniery CM, Bolton CE, Fawke J, Hennessy E, Stocks J, Wilkinson IB,et al. Cardiovascular consequences of extreme prematurity: theEPICure study. J Hypertens 2011; 29:1367–1373.
5. Wiegman A, de Groot E, Hutten BA, Rodenburg J, Gort J, Bakker HD,et al. Arterial intima-media thickness in children heterozygous forfamilial hypercholesterolaemia. Lancet 2004; 363:369–370.
6. Riggio S, Mandraffino G, Sardo MA, Iudicello R, Camarda N, ImbalzanoE, et al. Pulse wave velocity and augmentation index, but not intima-media thickness, are early indicators of vascular damage in hyper-cholesterolemic children. Eur J Clin Invest 2010; 40:250–257.
7. Singh TP, Groehn H, Kazmers A. Vascular function and carotid intimal-medial thickness in children with insulin-dependent diabetes mellitus.J Am Coll Cardiol 2003; 41:661–665.
8. Jarvisalo MJ, Raitakari M, Toikka JO, Putto-Laurila A, Rontu R, Laine S,et al. Endothelial dysfunction and increased arterial intima-mediathickness in children with type 1 diabetes. Circulation 2004; 109:1750–1755.
9. Litwin M, Trelewicz J, Wawer Z, Antoniewicz J, Wierzbicka A, Rajszys P,et al. Intima-media thickness and arterial elasticity in hypertensivechildren: controlled study. Pediatr Nephrol 2004; 19:767–774.
10. de Divitiis M, Pilla C, Kattenhorn M, Donald A, Zadinello M, Wallace S,et al. Ambulatory blood pressure, left ventricular mass, and conduitartery function late after successful repair of coarctation of the aorta.J Am Coll Cardiol 2003; 41:2259–2265.
11. Ou P, Celermajer DS, Raisky O, Jolivet O, Buyens F, Herment A, et al.Angular (Gothic) aortic arch leads to enhanced systolic wave reflection,central aortic stiffness, and increased left ventricular mass late afteraortic coarctation repair: evaluation with magnetic resonance flowmapping. J Thorac Cardiovasc Surg 2008; 135:62–68.
orized reproduction of this article is prohibited.Volume 30 � Number 12 � December 2012
Reference values of PWVao in children
12. Sheth RD, Perez MD, Goldstein SL. Cardiovascular calcifications inpaediatric patients receiving maintenance dialysis. Pediatr Nephrol2003; 18:810–813.
13. Charakida M, Donald AE, Green H, Storry C, Clapson M, Caslake M,et al. Early structural and functional changes of the vasculature in HIV-infected children: impact of disease and antiretroviral therapy. Circu-lation 2005; 112:103–109.
14. Noto N, Okada T, Yamasuge M, Taniguchi K, Karasawa K, Ayusawa M,et al. Noninvasive assessment of the early progression of atherosclero-sis in adolescents with Kawasaki disease and coronary artery lesions.Pediatrics 2001; 107:1095–1099.
15. Tedesco MA, Di Salvo G, Ratti G, Natale F, Calabrese E, Grassia C, et al.Arterial distensibility and ambulatory blood pressure monitoring inyoung patients with neuro-fibromatosis type 1. Am J Hyperten 2001;14:559–566.
16. Cheung YF, Brogan PA, Pilla CB, Dillon MJ, Redington AN. Arterialdistensibility in children and teenagers: normal evolution and the effectof childhood vasculitis. Arch Dis Child 2002; 87:348–351.
17. Tauzin L, Rossi P, Giusano B, Gaudart J, Boussuges A, Fraisse A, et al.Characteristics of arterial stiffness in very low birth weight prematureinfants. Pediatr Res 2006; 60:592–596.
18. Kwok KL, Ng DK, Cheung YF. BP and arterial distensibility in childrenwith primary snoring. Chest 2003; 123:1561–1566.
19. Tedesco MA, Ratti G, Di Salvo G, Martiniello AR, Limongelli G, GriecoM, et al. Noninvasive evaluation of arterial abnormalities in youngpatients with neuro-fibromatosis type 1. Angiology 2000; 51:733–741.
20. Ahimastos AA, Formosa M, Dart AM, Kingwell BA. Gender differencesin large artery stiffness pre and postpuberty. J Clin Endocrinol Metab2003; 88:5375–5380.
21. Avolio AP, Deng FQ, Li WQ, Luo YF, Huang ZD, Xing LF, et al. Effectsof aging on arterial distensibility in populations with high and lowprevalence of hypertension: comparison between urban and ruralcommunities in China. Circulation 1985; 71:202–210.
22. Avolio AP, Chen SG, Wang RP, Zhang CL, Li MF, O’Rourke MF. Effectsof aging on changing arterial compliance and left ventricular load in anorthern Chinese urban community. Circulation 1983; 68:50–58.
23. Kis E, Cseprekal O, Horvath Z, Katona G, Fekete BC, Hrapka E, et al.Pulse wave velocity in end-stage renal disease: influence of age andbody dimensions. Pediatr Res 2008; 63:95–98.
24. Reusz GS, Cseprekal O, Temmar M, Kis E, Cherif AB, Thaleb A, et al.Reference values of pulse wave velocity in healthy children andteenagers. Hypertension 2010; 56:217–224.
25. Urbina E, Williams R, Alpert BS, Collins RT, Daniels SR, Hayman L,et al., on behalf of the American Heart Association Atherosclerosis,Hypertension, and Obesity in Youth Committee of the Council onCardiovascular Disease in the Young Noninvasive Assessment ofSubclinical Atherosclerosis in Children and Adolescents. Recommen-dations for standard assessment for clinical research: a scientific state-ment from the American Heart Association. Hypertension 2009;54:919–951.
Copyright © Lippincott Williams & Wilkins. UnauthJournal of Hypertension
26. Rosario AS, Kurth BM, Stolzenberg H, Ellert U, Neuhauser H. Bodymass index percentiles for children and adolescents in Germany basedon a nationally representative sample (KiGGS 2003–2006). Eur J ClinNutr 2010; 64:341–349.
27. National High Blood Pressure Education Program Working Groupon High Blood Pressure in Children and Adolescents. The fourthreport on the diagnosis, evaluation, and treatment of high bloodpressure in children and adolescents. Pediatrics 2004; 114 (2 Suppl 4):555–576.
28. Baulmann J, Schillings U, Rickert S, Uen S, Dusing R, Illyes M, et al.A new oscillometric method for assessment of arterial stiffness: com-parison with tonometric and piezo-electronic methods. J Hypertens2008; 26:523–528.
29. Horvath IG, Nemeth A, Lenkey Z, Alessandri N, Tufano F, Kis P, et al.Invasive validation of a new oscillometric device (Arteriograph) formeasuring augmentation index, central blood pressure and aorticpulse wave velocity. J Hypertens 2010; 28:2068–2075.
30. Sugawara J, Hayashi K, Yokoi T, Tanaka H. Age-associated elongationof the ascending aorta in adults. J Am Coll Cardiol Cardiovasc Imag2008; 1:739–748.
31. Mueller WH, Martorell R. Reliability and accuracy of measurement. In:Lohman TG, Roche AF, Martorell R, editors. Anthropometric standard-ization reference manual. Champaign, Illinois: Human KineticsBooks; 1988. pp. 83–86
32. Pan H, Cole TJ. LMS Chartmaker, a programme to construct growthreferences using the LMS method. 2010. Version 2.43. http://www.healthforallchildren.co.uk/.
33. Cole TJ, Green PJ. Smoothing reference centile curves: the LMS methodand penalised likelihood. Stat Med 1992; 11:1305–1319.
34. Ayer JG, Harmer JA, Marks GB, Avolio A, Celermajer DS. Central arterialpulse wave augmentation is greater in girls than boys, independent ofheight. J Hypertens 2010; 28:306–313.
35. Martyn CN, Greenwald SE. Impaired synthesis of elastin in walls ofaorta and large conduit arteries during early development as aninitiating event in pathogenesis of systemic hypertension. Lancet1997; 350:953–955.
36. Glukhova MA, Frid MG, Koteliansky VE. Phenotypic changes of humanaortic smooth muscle cells during development and in the adult vessel.Am J Physiol 1991; 261 (4 Suppl):78–80.
37. Van Meurs-Van Woezik H, Klein HW, Markus-Silvis L, Krediet P.Comparison of the growth of the tunica media of the ascending aorta,aorta isthmus and descending aorta in infants and children. J Anat1983; 136:273–281.
38. Senzaki H, Akagi M, Hishi T, Ishizawa A, Yanagisawa M, Masutani S,et al. Age-associated changes in arterial elastic properties in children.Eur J Pediatr 2002; 161:547–551.
39. Niwa K, Perloff JK, Bhuta SM, Laks H, Drinkwater DC, Child JS, et al.Structural abnormalities of great arterial walls in congenital heartdisease: light and electron microscopic analyses. Circulation 2001;103:393–400.
Reviewers’ Summary Evaluations
Reviewer 1Aortic pulse wave velocity (aPWV) has been determined inone of the largest investigations undertaken in children ofages 3 to 18 years. aPWV is constant in the first decade(average of 5.55m/s) but increases by 16% by age 18.However, this occurs some 2 years earlier in girls (10.4 years)compared with boys (12.1 years). This is consistent withstudies showing girls having a higher carotid augmentation
index compared with boys at the same age of 8 years. One ofthe caveats of the study is that aPWV was not measured, butestimated from brachial cuff suprasystolic waves.
Reviewer 2This article provides reference ranges for PWV in veryyoung children. The data are of interest and adds to theliterature on the progression of PWV with age but with thenovelty of a detailed study in very young children.
orized reproduction of this article is prohibited.www.jhypertension.com 2321