Evaluation of Antimicrobial Activity of New Mastoparan Derivatives Using QSAR and Computational...
11
Evaluation of Antimicrobial Activity of New Mastoparan Derivatives Using QSAR and Computational Mutagenesis Speranta Avram • Daniel Duda-Seiman • Florin Borcan • Beatrice Radu • Corina Duda-Seiman • Dan Mihailescu Accepted: 13 December 2010 / Published online: 25 December 2010 Ó Springer Science+Business Media, LLC 2010 Abstract Antimicrobial peptides, also called body defense peptides, are used against a wide range of pathogens, such as negative- and positive-gram bacteria, mycobacteria, fungi, viruses, etc. Contrary to antibiotics, antimicrobial peptides do not develop resistance. Their wide antimicrobial spec- trum situates them as important and attractive targets in research and pharmaceutical industry in order to obtain new structures using modern drug design techniques. We present here eleven QSAR models in which antimicrobial activity expressed as minimal inhibitory concentration values at Bacillus subtilis of 37 mastoparan analogs was correlated with different physicochemical parameters like: number of hydrophobic centers, molecular area and volume, internal dipole moment, refractivity, RPCG (relative positive char- ges) and number of donor and acceptor atoms generating by use of the computational software Sybyl. Significant R 2 (0.68–0.72) correlation coefficients and standard error of prediction SEE (0.199–0.230) were obtained, indicating that the established equations can be used. Thus, these linear models allowed us to create a library of 19 derivatives of mastoparan analogs obtained through computational muta- genesis. We propose this library of compounds as a source of possible derivatives with a more potent antimicrobial activity. Keywords QSAR Á Antimicrobial peptides Á Computational mutagenesis Introduction Antimicrobial peptides (AMPs) have been demonstrated to act against Gram negative and positive bacteria, myco- bacteria, enveloped viruses or fungi. It was also proven that, unlike the majority of conventional antibiotics, anti- microbial peptides may also have the ability to enhance immunity by functioning as immunomodulators. Antimi- crobial peptides provide potential templates for a new generation of antimicrobials, as they kill microorganisms rapidly and directly, and in some cases, activate host innate immunity. Moreover, some seem to counteract harmful inflammatory/septic responses induced by bacterial endo- toxines (Brandenburg et al. 2010), which is extremely important (Bowdish and Hancock 2005; Periti and Mazzei 1999). AMPs are effective components in innate host defense mechanisms against infectious pathogens (Zhu et al. 2007; Zanetti et al. 2002; Zasloff 2002), which do not target specific receptors of the pathogens, but instead interact and modulate the permeability of microbial membranes (Zasloff 2002). AMPs are able to combat the increasing emergence of drug-resistant bacteria (Hancock S. Avram (&) Á B. Radu Á D. Mihailescu Department of Anatomy, Animal Physiology and Biophysics, Faculty of Biology, University Bucharest, Splaiul Independentei 91-95, 076201 Bucharest, Romania e-mail: [email protected] D. Duda-Seiman Clinic of Preventive Cardiology and Cardiovascular Rehabilitation, University of Medicine and Pharmacy ‘‘Victor Babes’’ Timisoara, 49th Loga Bvd, 300020 Timisoara, Romania F. Borcan Biochemistry Department, University of Medicine and Pharmacy ‘‘Victor Babes’’ Timisoara, 2nd E. Murgu Sq., 300041 Timisoara, Romania C. Duda-Seiman Chemistry Department, Faculty of Chemistry, Biology and Geography, West University Timisoara, 16th Pestalozzi Str., 300115 Timisoara, Romania 123 Int J Pept Res Ther (2011) 17:7–17 DOI 10.1007/s10989-010-9235-7
Transcript of Evaluation of Antimicrobial Activity of New Mastoparan Derivatives Using QSAR and Computational...

Evaluation of Antimicrobial Activity of New MastoparanDerivatives Using QSAR and Computational Mutagenesis
Speranta Avram • Daniel Duda-Seiman •
Florin Borcan • Beatrice Radu •
Corina Duda-Seiman • Dan Mihailescu
Accepted: 13 December 2010 / Published online: 25 December 2010
� Springer Science+Business Media, LLC 2010
Abstract Antimicrobial peptides, also called body defense
peptides, are used against a wide range of pathogens, such as
negative- and positive-gram bacteria, mycobacteria, fungi,
viruses, etc. Contrary to antibiotics, antimicrobial peptides
do not develop resistance. Their wide antimicrobial spec-
trum situates them as important and attractive targets in
research and pharmaceutical industry in order to obtain new
structures using modern drug design techniques. We present
here eleven QSAR models in which antimicrobial activity
expressed as minimal inhibitory concentration values at
Bacillus subtilis of 37 mastoparan analogs was correlated
with different physicochemical parameters like: number of
hydrophobic centers, molecular area and volume, internal
dipole moment, refractivity, RPCG (relative positive char-
ges) and number of donor and acceptor atoms generating by
use of the computational software Sybyl. Significant R2
(0.68–0.72) correlation coefficients and standard error of
prediction SEE (0.199–0.230) were obtained, indicating that
the established equations can be used. Thus, these linear
models allowed us to create a library of 19 derivatives of
mastoparan analogs obtained through computational muta-
genesis. We propose this library of compounds as a source of
possible derivatives with a more potent antimicrobial
activity.
Keywords QSAR � Antimicrobial peptides �Computational mutagenesis
Introduction
Antimicrobial peptides (AMPs) have been demonstrated to
act against Gram negative and positive bacteria, myco-
bacteria, enveloped viruses or fungi. It was also proven
that, unlike the majority of conventional antibiotics, anti-
microbial peptides may also have the ability to enhance
immunity by functioning as immunomodulators. Antimi-
crobial peptides provide potential templates for a new
generation of antimicrobials, as they kill microorganisms
rapidly and directly, and in some cases, activate host innate
immunity. Moreover, some seem to counteract harmful
inflammatory/septic responses induced by bacterial endo-
toxines (Brandenburg et al. 2010), which is extremely
important (Bowdish and Hancock 2005; Periti and Mazzei
1999). AMPs are effective components in innate host
defense mechanisms against infectious pathogens (Zhu
et al. 2007; Zanetti et al. 2002; Zasloff 2002), which do not
target specific receptors of the pathogens, but instead
interact and modulate the permeability of microbial
membranes (Zasloff 2002). AMPs are able to combat the
increasing emergence of drug-resistant bacteria (Hancock
S. Avram (&) � B. Radu � D. Mihailescu
Department of Anatomy, Animal Physiology and Biophysics,
Faculty of Biology, University Bucharest, Splaiul Independentei
91-95, 076201 Bucharest, Romania
e-mail: [email protected]
D. Duda-Seiman
Clinic of Preventive Cardiology and Cardiovascular
Rehabilitation, University of Medicine and Pharmacy ‘‘Victor
Babes’’ Timisoara, 49th Loga Bvd, 300020 Timisoara, Romania
F. Borcan
Biochemistry Department, University of Medicine and
Pharmacy ‘‘Victor Babes’’ Timisoara, 2nd E. Murgu Sq.,
300041 Timisoara, Romania
C. Duda-Seiman
Chemistry Department, Faculty of Chemistry,
Biology and Geography, West University Timisoara,
16th Pestalozzi Str., 300115 Timisoara, Romania
123
Int J Pept Res Ther (2011) 17:7–17
DOI 10.1007/s10989-010-9235-7

and Scott 2000). Many therapeutic applications to date
have focused on infections of epithelial and topical barri-
ers; however, more recently, pharmaceutical companies are
developing peptides of greater potential for systemic
infections (Maher and McClean 2006).
The peptides can be classified into two types considering
their cell selectivity: those that are toxic for bacterial cells
but not for mammalian cells (e.g. magainins and cecropins),
and those that are toxic to both bacterial and mammalian
cells (e.g. melittin and pardaxin) (Mahalka and Kinnunen
2009; Subasinghage et al. 2010). It is considered that length,
net electric charge, and hydrophobicity of AMPs appear to
be responsible for their selectivity for bacterial and mam-
malian cells. In addition, the self-association of AMPs in
an aqueous environment is also known to be important
to control their selectivity for specific targets (Chen et al.
2005).
Stinging hymenoptera such as honeybees, wasps, bum-
blebees and ants have venom reservoirs that contain venom
consisting of a complex mixture of enzymes, neurotoxins,
low molecular mass compounds and a whole series of
peptides (Mahalka and Kinnunen 2009; Harris et al. 2009).
The main function of the venom is to protect against pre-
dators and to defend nests against intruders. Among the
peptides that have such characteristics, the mastoparan
family of peptides (INLKALAALAKALL, from wasp
venom; INLKALAALAKKIL, from vespula; VDWK
KIGQHILSVL, from Polistes jadwagae) forms an impor-
tant group (Hancock and Scott 2000; Davison et al. 2009).
Antimicrobial peptides selected in this study were identi-
fied as cationic peptides with amphipathic a-helical con-
formation and this feature permits them to interact with the
anionic components of the bacterial membranes. There are
studies which confirmed the superior pharmacological
effects of mastoparan analogs (Cerovsky et al. 2008;
Mendes et al. 2004; dos Santos Cabrera et al. 2008). Their
antimicrobial potency was tested against Bacillus subtilis,
Staphylococcus aureus, Escherichia coli and Pseudomonas
aeruginosa. Minimal inhibitory concentration (MIC) val-
ues for studied bactericidal and fungicidal effects of mas-
toparan analogs are in the micromolar range. All these
peptides have been proved to be quite effective antimi-
crobial agents in the drop diffusion test, which in general
indicates higher potency against B. subtilis than E. coli.
However, the obtained MIC values show that the peptides
have different selectivity towards these bacteria. PDD-A,
as well as PMM, showed negligible hemolytic activity
(50% hemolysis at 100 mM higher concentration), while
PDDB was slightly more hemolytic (Cerovsky et al. 2008).
An objective of this study was to use 2D-QSAR models
to predict the effect of molecular descriptors like molecu-
lar volume and area (Ebalunode et al. 2011), electronic
(Zuo et al. 2005; Snyder and Hendry 2005) and also the
descriptors derived directly from amino acids sequence
(number of hydrophobic centers (Zhao et al. 2010), number
of acceptor and donor atoms (Raevsky and Skvortsov
2005)) on antimicrobial activity of peptides of the mas-
toparan family, characterized recently in the venom of
three wasps Polistes major major, Polistes dorsalis
dorsalis and Mischocyttarus phthisicus, in order to gain
new insights into drug-design models.
Basically, all QSAR methods consider that macroscopic
properties are induced by the molecular structure and every
change into molecular structure leads to modification of
these properties (Akamatsu 2002; Frederic et al. 2005).
A QSAR generally takes the form of a linear equa-
tion: Biological Activity = const ? (c1 * p1) ? (c2 * p2) ?
(c3 * p3) ?…, where the parameters p1 through pn are:
molecular volume, dipole moment, etc. and the coefficients
c1 through cn are calculated by fitting variations in the
parameters and the biological activity.
There are few QSAR studies which correlated the anti-
microbial activity with different macroscopic descriptors
like isoelectric point and hydrophobicity (Mikut 2010),
weighted holistic invariant molecular index (WHIM) of
amino acids (Tong et al. 2008), the contact energy between
neighboring amino acids (Jenssen et al. 2008). Also, the
isotropic surface area (ISA) and electronic charge index
(ECI), reflecting steric character of side chains and local
dipole of amino acids, were successfully used to establish a
series of QSAR models (Collantes and Dunn 1995).
Materials and Methods
Dataset for Analysis
The antimicrobial activity expressed as the Minimum
Inhibitory Concentrations (MIC) of 37 antimicrobial drugs
like mastoparan analogs were compiled from literature
(Cerovsky et al. 2008). MIC activity originally determined
in micromolar values was converted to a pMIC value by
taking Log (1/MIC). The pMIC values were used as the
dependent variable in all QSAR models subsequently
developed in this study. This data set was selected
according to following criteria: (i) range of observed
antimicrobial activities (MIC from 4 to 100 micromolar),
(ii) important variety of amino acids in structure of anti-
microbial peptide, (iii) various bacterial lines that these
peptides do inhibit (e.g. E. coli, B. subtilis). This study
evaluated the antimicrobial activity of mastoparan analogs
at E. coli and B. subtilis lines. Results showed that while
PDD-B and MP analogs are selective for B. subtilis, PMM
analogs are more active on E. coli line. Analysis of toxicity
of these analogs showed that PDD-A have a low hemolytic
activity compared with derivatives PDD-B and MP.
8 Int J Pept Res Ther (2011) 17:7–17
123

The name and amino acids sequence of mastoparan
analogs and also their corresponding observed antimicro-
bial activity values are given in Table 1.
Molecular Modeling of Antimicrobial Peptides Analogs
and Minimum Energy Strategy
Three dimensional structures of studied compounds were
obtained using the Biopolymer module from Sybyl 7
software package (Tripos Inc., St. Louis, USA). In the first
step, 2D structures of mastoparan analogs were obtained
from the template structures (mastoparan) using the module
Mutate Monomers from Sybyl and the additive hydrogen
atoms were performed. Afterwards, secondary structures
were obtained using Biopolymer/Conformation/Find Sec-
ondary structure by garnier_osguthorpe_robson method
(Persson 2000) and than automatically switched to 3D
structures of the antimicrobial peptides, which were saved in
mol2. Sybyl specific files.
In our study, the conformation with minimum potential
energy of the peptide analogs was established using, con-
jugate gradient method routine in Sybyl 7, with Kollman
force-field (Cornell et al. 1995), conjugate-gradient algo-
rithm and convergence 0.05. After energy minimization,
Kollman partial charges of the compounds were loaded on
the chemical structures from the Sybyl 7 dictionary.
Design of New Derivatives of PDD-A and PMM-12
Mastoparan Analogs with Possible Superior
Antimicrobial Activity and Minimum Energy Strategy
An important objective of the study was to determine the
pharmacological characteristics of new derivatives of
mastoparan analogs, obtained by computational mutagen-
esis, starting from the PDD-A and PMM-12 mastoparan
analogs. In our attempt to obtain new antimicrobial pep-
tides, some general rules have been accepted; first, we
generated more positive electrostatic contacts by adding of
positive amino acids and second, we enhanced the number
of hydrophobic contacts of mastoparan analogs PDD-A and
PMM-12 by specific amino acids (see Table 2). We have
chosen to design new PDD-A derivatives because it was
proven that none of these amino acid residue replacements
substantially increase the hemolytic activity of these pep-
tides (EC50 [ 100 mM) and antimicrobial activity of
obtained PDD-A analogs was not improved compared to
that of PDD-A. Also, in our study we have designed PMM-
12 derivatives started from the Cerovsky’s considerations
that the PMM-12 analog presents a good antimicrobial
activity.
Molecular modeling of new 19 PDD-A and PMM-12
derivatives was performed under the above described
protocol. The antimicrobial peptide derivatives were gen-
erated by adding atoms and amino acids from Sybyl data
base. The minimum potential energy for antimicrobial
peptide derivatives was established using the Maxim 2
minimization routine in Sybyl 7, with Kollman force-field,
conjugate-gradient algorithm and convergence 0.05. Dur-
ing energy minimization, the specific amino acids were
allowed free movements. After energy minimization, the
partial charges of the compounds were loaded on the
chemical structures from the Sybyl 7 dictionary. The name
Table 1 Sequence of mastoparan analogs and their observed mini-
mal inhibitory concentration at B. subtilis
Derivative Sequence MIC B. subtilis (lM)
PDD-A INWKKIFQKVKNLV 11.8
PDD-A-1 INWKKIFEKVKNLV 45
PDD-A-2 INWKKIFEKVKDLV 5
PDD-A-3 IDWKKIFEKVKNLV 8.5
PDD-A-4 IDWKKIFEKVKDLV 17.5
PDD-A-5 INWSKIFEKVKNLV 17
PDD-A-6 INWSSIFEKVKNLV 40
PDD-A-7 INWSSIFESVKNLV 87.5
PDD-A-8 INWSSIFESVSNLV 100
PDD-A-9 INWKKIFEKVSNLV 22.5
PDD-A-10 INWKKIFESVKNLV 10
PDD-A-11 INWKSIFEKVKNLV 15
PDD-A-12 NIWKKIFEKVKNLV 20
PDD-B INWLKLGKKILGAL 15.5
PDD-B-1 INWLKLGKKILGAI 25
PDD-B-2 INWLRLGRRILGAL 17.5
PDD-B-3 INFLKLGKKILGAL 22.5
PDD-B-4 INWKKLGKKILGAL 15.5
PDD-B-5 INSLKLGKKILGAL 100
MP INWLKLGKKMMSAL 9
MP-2 INWLKLGKKLLSAL 25
MP-5 INWLKLGKKMMSAI 35
MP-6 SNWLKLGKKMMSAL 40
PMM INWKKIASIGKEVLKAL 25.8
PMM-1 INWKKIASIGKEVLKAI 27.2
PMM-2 NWKKIASIGKEVLKAL 46
PMM-3 WKKIASIGKEVLKAL 125
PMM-4 KKIASIGKEVLKAL 75
PMM-5 KIASIGKEVLKAL 100
PMM-6 INWKKIASIGKEVLKA 70
PMM-7 INWKKIASIGKEVLK 100
PMM-8 INWKKIASIGKEVL 100
PMM-9 INWKKIASIGKEV 100
PMM-10 IWNKIAKSIGKVLEKAL 35
PMM-12 NIWKKIASIAKEVLKAL 10
PMM-13 KNWKKIASIGKEVLKAL 60
PMM-14 SNWKKIASIGKEVLKAL 30
Int J Pept Res Ther (2011) 17:7–17 9
123

and amino acids sequence of derivatives of mastoparan
analogs PDD-A and PMM-12 obtained by computational
mutagenesis are given in Table 2 (in bold are presented the
amino acid mutations).
Descriptors Calculations
Afterwards all compounds were introduced in Sybyl 7 and the
calculations of molecular descriptors of the antimicrobial
peptides were performed. In this study the descriptors were:
van der Walls volume (VOL) and area (AREA), relative
positive charge (RPCG), internal dipole moment (dipole),
refractivity and descriptors derived directly from amino acids
sequence: number of hydrophobic centers (Hyd), number of
donor and acceptor atoms (donor/acceptor).
In Sybyl software descriptors are evaluated in the fol-
lowing manner: (i) descriptors based on dipole moment are
calculated in four columns, containing the total dipole
moment and its X, Y, and Z components, for each of the
molecules referenced by the table as stored in the database;
(ii) the number of hydrophobic, donor and acceptor atoms
are defined in the file sln3d_macros.def. If 3D coordinates
are not supplied, sln_property uses ‘‘pseudo 3D coordi-
nates’’; (iii) van der Walls volume and area are calculated
considering the probe_radius of 1.4 A; (iii) relative posi-
tive charge is computed as QMPA/(P
(?Qi)), QMPA, the
charge on the most positive atom; ?Qi, the charge on the
ith positive atom).
2D-QSAR Methodology
Initially in the 2D-QSAR models, the descriptors included
in this study were considered as individual independent
variable or in various combinations of them to predict the
antimicrobial activity. To avoid the redundancy of inde-
pendent variables and to ensure the absence of chance
correlation, the inter-correlation of the independent vari-
ables matrix were performed follow Pearson correlation
method (Table 3). For the final statistical analysis were
kept only those who met criteria of non-redundancy, but in
a large enough number of descriptors to allow an accurate
validation of QSAR model (R2 higher than 0.65, standard
error of prediction SEE less than 0.20).
In this respect, in our study the relevant QSAR equa-
tions from statistical point of view included:
(i) pMIC = constant ? c1 * Hyd
(ii) pMIC = constant ? c2 * Hyd ? c3 * volume
(iii) pMIC = constant ? c4 * Hyd ? c5 * area
(iv) pMIC = constant ? c6 * Hyd ? c7 * dipole
moment
(v) pMIC = constant ? c8 * Hyd ? c9 * refractivity
(vi) pMIC = constant ? c10 * Hyd ? c11 * acceptor
(vii) pMIC = constant ? c12 * Hyd ? c13 * donor
Table 2 Sequence of design mastoparan derivatives
Derivative Primary structure
PDD-A-derivative 1 INWKKIFEKVKNIV
PDD-A-derivative 2 INWKKIFEKVKNFV
PDD-A-derivtive 3 INWKKIFEKVKNWV
PDD-A-derivative 4 FNWKKIFEKVKNLV
PDD-A-derivative 5 FNWKKFFEKVKNLV
PDD-A-derivative 6 WNWKKIFEKVKNLV
PDD-A-derivative 7 INWKKIFRKVKNLV
PDD-A-derivative 8 INWKKIFHKVKNLV
PDD-A-derivative 9 INWKKIFFKVKNLV
PDD-A-derivative 10 INWKKIFKKVKNLV
PMM-12-derivative 1 NIWKKIASIAKEVIKAL
PMM-12-derivative 2 NIWKKIASIAKEVIKAI
PMM-12-derivative 3 NIWKKIASIAKEVFKAF
PMM-12-derivative 4 NIWKKIASIAKEVWKAW
PMM-12-derivative 5 NFWKKFASFAKEVLKAL
PMM-12-derivative 6 NIWKKIASIAKRVLKAL
PMM-12-derivative 7 NIWKKIASIAKKVLKAL
PMM-12-derivative 8 NIWKKIASIAKHVLKAL
PMM-12-derivative 9 NIWKKIWSIWKEVLKWL
Table 3 The correlation matrix of independent variables
Hyd VOL AREA RPCG Dipole Refractivity Acceptor Donor
Hyd 1.000
VOL 0.636 1.000
AREA 0.402 0.940 1.000
RPCG -0.476 -0.196 -0.019 1.000
Dipole moment -0.066 0.073 0.171 0.095 1.000
Refractivity 0.664 0.677 0.538 -0.142 0.001 1.000
Acceptor 0.128 0.550 0.455 -0.251 -0.385 0.338 1.000
Donor 0.446 0.829 0.728 -0.253 -0.036 0.665 0.725 1.000
10 Int J Pept Res Ther (2011) 17:7–17
123

(viii) pMIC = constant ? c14 * Hyd ? c15 * RPCG ?
c16 * refractivity
(ix) pMIC = constant ? c17 * Hyd ? c18 * RPCG ?
c19 * area
(x) pMIC = constant ? c20 * Hyd ? c21 * RPCG ?
c22 * volume
(xi) pMIC = constant ? c23 * Hyd ? c24 * RPCG ?
c25 * dipole moment
Statistical Calculations
Multiple linear regression analysis (MLRA) was used in
order to generate the correlation models that relate the
structural features to the MIC values and also to calculate
the correlation coefficient R2, standard error of estimate
SEE and Fisher value. A reliable equation for structure
activity relationship should possess a high correlation
coefficient, low standard error of estimate (SEE) and the
least possible number of variables.
Training and Testing Sets
The generation of consistent statistical models depends on
the quality of both training and test sets in terms of struc-
tural diversity and property values distribution. From the
original data set of 37 mastoparan analogs 29 compounds
were selected as members of the training set for model
construction and the other 8 compounds (PDD-A-1, PDD-
B-2, PMM-10, PMM-13, PMM-3, PMM-6, PMM-7, PMM-
9) as members of the test set for external model validation
(Table 6). Prior to divides the mastoparan analogs into two
sets, all compounds were included into the training set and
non-significant statistic parameters (correlation coefficient
R2, standard error of estimate SEE and Fisher value) were
obtained. Consequently, the compounds of the training and
test sets were carefully selected in order to ensure the best
2D-QSAR models on the basis of statistical parameters
mentioned before (correlation coefficient R2 higher 0.66,
standard error of estimate SEE less than 0.20) and to cov-
erage on the entire range of pMIC values. The composition
of both sets was kept unchanged in all 2D-QSAR models.
A statistical cluster analysis confirmed that the composition
of both training and test sets is chose in a representative
manner for whole data set (Table 6).
Results and Discussion
Descriptors Evaluation
The initial stage of our results study was represented by the
evaluation of molecular descriptors presented above.
Mastoparan analogs already tested as antimicrobial agents
and their derivatives obtained by computational mutagen-
esis (Table 4) were evaluated by means of the series of
molecular descriptors.
The analysis of variation of molecular descriptors belong-
ing to the considered mastoparan series showed that: (i)
molecular volume varies significantly with ranges between
the values 3577.62 A´ 3 (PDD-A-8) and 5574.02 A
´ 3 (PMM-
12-derivative 9); (ii) area has also recorded large fluctua-
tions, ranging from 1625.885 A´ 2 (PDD-A-8) to 2391.176 A
´ 2
(PMM-12-derivative 9); (iii) refractivity varies between
max = 582.39 (PMM-12-derivative 9) and min = 332.12
(PMM-5). A large variation of values was recorded in the
internal dipole moment from maximum value 101.85 D
(PMM-13) to minimum value 20.64 D (PDD-A-11). Also, a
large fluctuation between minimum and maximum values of
molecular descriptors derived directly from the peptide
sequence was recorded, (Hyd (8 \ Hyd \ 18); number of
donor atoms (17 \ donor \ 27); number of acceptor atoms
(16 \ acceptor \ 23)). The same observation can not be
done when variation of RPCG (0.3 \ RPCG \ 0.4) descrip-
tor of the mastoparan series was considered.
Statistic Evaluation
In our study we have generated eleven QSAR models, each
of them containing the same number and type of mastoparan
analogs. In Table 5 are presented the statistic parameters
computed from training set (correlation coefficient R2,
standard error of estimate SEE, as well as ANOVA results,
the Fisher F and QSAR regression coefficients).
R2 correlation coefficients and standard errors of pre-
dictions were most statistically significant when following
conditions are simultaneously met: (i) number of hydro-
phobic centers, volume and relative positive charge
(R2 = 0.720, SEE = 0.203); (ii) number of hydrophobic
centers and volume (R2 = 0.719, SEE = 0.199); (iii)
number of hydrophobic centers, area and positive relative
charge (R2 = 0.714, SEE = 0.205);(iv) number of hydro-
phobic centers and donor atoms (R2 = 0.705, SEE =
0.204); (v) number of hydrophobic centers, refractivity and
relative positive charge (R2 = 0.700, SEE = 0.219) were
considered.
The external predictive ability of the 2D-QSAR models
derived using the 29 training set molecules was assessed by
predicting pMIC values for 8 test set molecules which were
not included in the training set for model generation. The
values for predicted pMIC of the mastoparan analogs
belonging to training and test sets and also the residual values
(the differences between pMICobserved and pMICpredicted) just
for three most significant QSAR models were presented
(Table 6).
Int J Pept Res Ther (2011) 17:7–17 11
123

Table 4 Descriptors of mastoparan analogs and their derivatives obtained by computational mutagenesis
Mastoparan analogs and derivatives Hyd VOL (A´ 3) AREA (A
´ 2) Dipole (D) RPCG Refractivity Acceptor Donor
MP 11 3974.45 1755.28 70.55 0.03 409.82 17 20
MP-2 11 3942.52 1761.13 71.42 0.03 402.50 17 20
MP-5 11 3913.54 1724.99 69.57 0.03 409.74 17 20
MP-6 10 3824.70 1692.42 68.65 0.03 397.76 18 21
PDD-A 12 4143.15 1830.55 37.31 0.03 441.18 18 22
PDD-A-1 12 4149.89 1787.19 38.55 0.03 436.89 19 21
PDD-A-10 11 4067.01 1761.28 53.39 0.03 422.95 20 21
PDD-A-11 11 4033.47 1785.92 20.64 0.03 422.95 20 21
PDD-A-12 12 4099.29 1813.93 41.48 0.03 436.89 19 21
PDD-A-2 12 4131.01 1784.19 60.17 0.03 432.62 20 20
PDD-A-3 12 4127.58 1807.82 23.05 0.02 432.61 20 20
PDD-A-4 12 4116.06 1760.84 27.79 0.03 428.34 21 19
PDD-A-5 11 3987.39 1751.27 70.31 0.03 422.02 19 21
PDD-A-6 10 3906.46 1710.80 37.29 0.03 409.00 21 21
PDD-A-7 9 3731.77 1658.89 33.73 0.03 395.05 22 21
PDD-A-8 8 3577.62 1625.89 36.82 0.03 381.11 23 21
PDD-A-9 11 4026.53 1780.69 92.44 0.02 422.92 20 21
PDD-A-derivative 1 12 4147.29 1820.87 44.74 0.03 436.82 19 21
PDD-A-derivative 10 13 4297.09 1914.64 42.61 0.03 444.92 17 22
PDD-A-derivative 2 12 4186.99 1825.13 45.8 0.03 447.84 19 21
PDD-A-derivative 3 13 4248.24 1859.38 42.47 0.03 458.94 19 22
PDD-A-derivative 4 12 4154.07 1833.24 46.06 0.03 459.30 19 21
PDD-A-derivative 5 12 4172.23 1813.51 45.52 0.03 456.07 19 21
PDD-A-derivative 6 13 4247.79 1831.11 47.76 0.03 448.63 19 22
PDD-A-derivative 7 12 4220.89 1853.44 57.78 0.03 454.05 17 24
PDD-A-derivative 8 13 4170.05 1835.43 44.12 0.03 396.38 19 23
PDD-A-derivative 9 13 4217.95 1862.29 42.89 0.03 396.05 17 21
PDD-B 11 3887.07 1755.94 69.53 0.03 429.82 16 19
PDD-B-1 11 3867.53 1738.69 68.92 0.03 384.99 16 19
PDD-B-2 8 4025.77 1729.38 64.55 0.03 398.20 16 25
PDD-B-3 10 3829.11 1744.16 69.43 0.03 361.92 16 18
PDD-B-4 11 3954.41 1825.28 76.63 0.03 469.89 16 20
PDD-B-5 9 3738.25 1740.35 70.36 0.04 469.81 17 19
PMM 12 4943.09 2240.78 68.79 0.03 469.89 22 24
PMM-1 12 4929.18 2235.27 66.65 0.03 469.81 22 24
PMM-10 12 4922.71 2218.64 83.06 0.03 469.89 22 24
PMM-12 12 4833.69 2236.73 60.99 0.03 474.38 22 24
PMM-12-derivative 1 12 4862.89 2221.73 60.68 0.03 474.30 22 24
PMM-12-derivative 9 18 5574.03 2391.18 58.13 0.02 582.39 22 27
PMM-12-derivative 2 12 4843.11 2220.31 60.69 0.03 474.23 22 24
PMM-12-derivative 3 12 5018.47 2275.36 58.72 0.03 496.27 22 24
PMM-12-derivative 4 14 5201.25 2330.50 61.62 0.03 519.04 22 26
PMM-12-derivative 5 12 5021.75 2305.53 68.16 0.03 507.45 22 24
PMM-12-derivative 6 12 4988.44 2253.55 57.09 0.03 493.56 20 27
PMM-12-derivative 7 13 4940.17 2262.68 62.22 0.03 482.41 20 25
PMM-12-derivative 8 13 4899.63 2279.31 51.3 0.03 486.21 22 26
PMM-13 12 4941.25 2276.02 101.85 0.03 471.78 22 25
PMM-14 11 4812.52 2207.10 64.72 0.03 457.83 23 25
12 Int J Pept Res Ther (2011) 17:7–17
123

Table 4 continued
Mastoparan analogs and derivatives Hyd VOL (A´ 3) AREA (A
´ 2) Dipole (D) RPCG Refractivity Acceptor Donor
PMM-2 11 4627.27 2164.31 64.88 0.03 439.86 21 23
PMM-3 11 4387.48 2100.72 59.81 0.03 416.45 19 21
PMM-4 9 4007.00 1976.66 60.67 0.03 364.03 18 19
PMM-5 8 3640.91 1810.29 64.13 0.04 332.12 17 17
PMM-6 11 4551.67 2047.86 65.66 0.03 439.80 21 23
PMM-7 11 4299.16 1952.26 66.10 0.03 423.36 20 22
PMM-8 10 3926.06 1777.26 92.70 0.03 391.45 19 20
PMM-9 9 3582.14 1672.89 91.38 0.03 361.35 18 19
Table 5 Statistic results of the 2D-QSAR models
Descriptors R2 SEE ANOVA results QSAR coefficients
Hyd 0.655 0.217 df SS MS F Constant = 1.946
Regression 1 2.411 2.553 51.317
Residual 27 1.268 0.047 c1 = 0.246
Total 28 3.679 2.600
Hyd volume 0.719 0.199 df SS MS F
Regression 2 2.635 1.317 33.315 Constant = 2.583
Residual 26 1.028 0.040 c2 = 0.310
Total 28 3.663 1.357 c3 = -0.001
Hyd area 0.714 0.201 df SS MS F
Regression 2 2.614 1.307 32.392 Constant = 2.576
Residual 26 1.049 0.040 c4 = 0.278
Total 28 3.663 1.347 c5 = -0.001
Hyd dipole moment 0.663 0.218 df SS MS F
Regression 2 2.430 1.215 25.614 Constant = 2.092
Residual 26 1.233 0.047 c6 = 0.243
Total 28 3.663 1.262 c7 = -0.002
Hyd refractivity 0.673 0.215 df SS MS F
Regression 2 2.465 1.233 26.758 Constant = 2.355
Residual 26 1.198 0.046 c8 = 0.284
Total 28 3.663 1.279 c9 = -0.002
Hyd acceptor 0.680 0.213 df SS MS F
Regression 2 2.502 1.251 27.649 Constant = 2.370
Residual 26 1.177 0.045 c10 = 0.252
Total 28 3.679 1.296 c11 = -0.026
Hyd donor 0.705 0.204 df SS MS F
Regression 2 2.595 1.298 31.142 Constant = 2.589
Residual 26 1.083 0.042 c12 = 0.280
Total 28 3.678 1.340 c13 = -0.049
Hyd RPCG refractivity 0.700 0.219 df SS MS F Constant = 2.377
Regression 2 2.465 0.822 17.154 c14 = 0.283
Residual 26 1.198 0.048 c15 = -0.377
Total 28 3.663 0.870 c16= -0.002
Int J Pept Res Ther (2011) 17:7–17 13
123
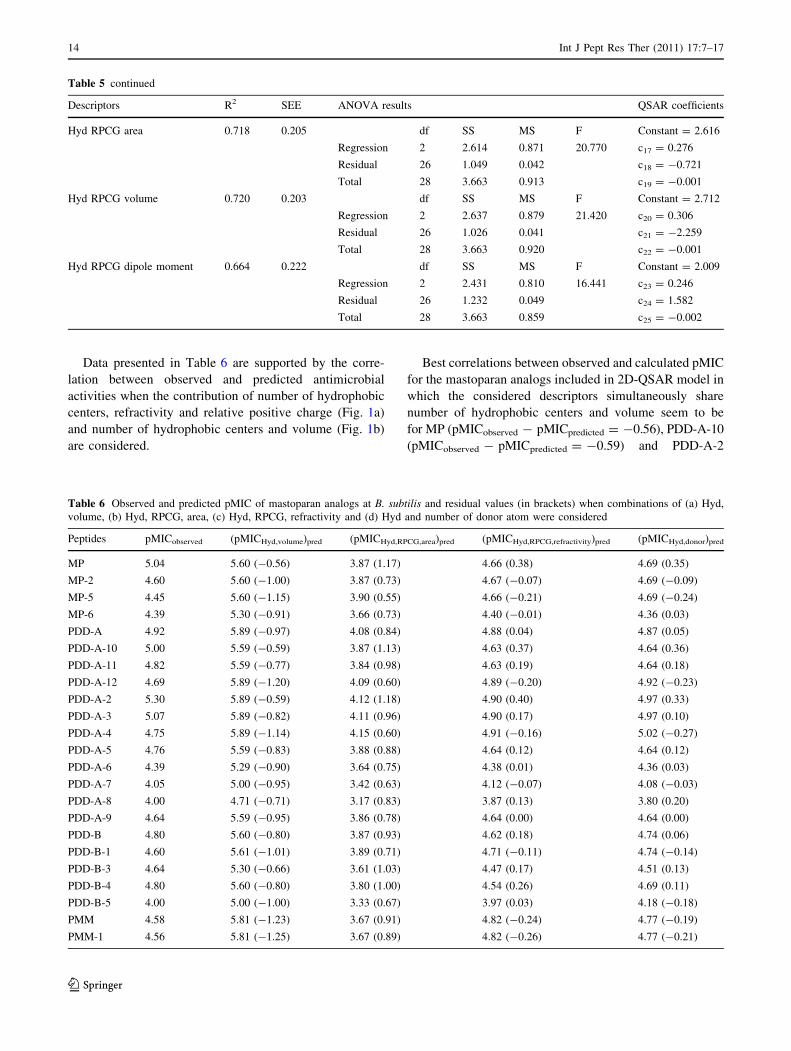
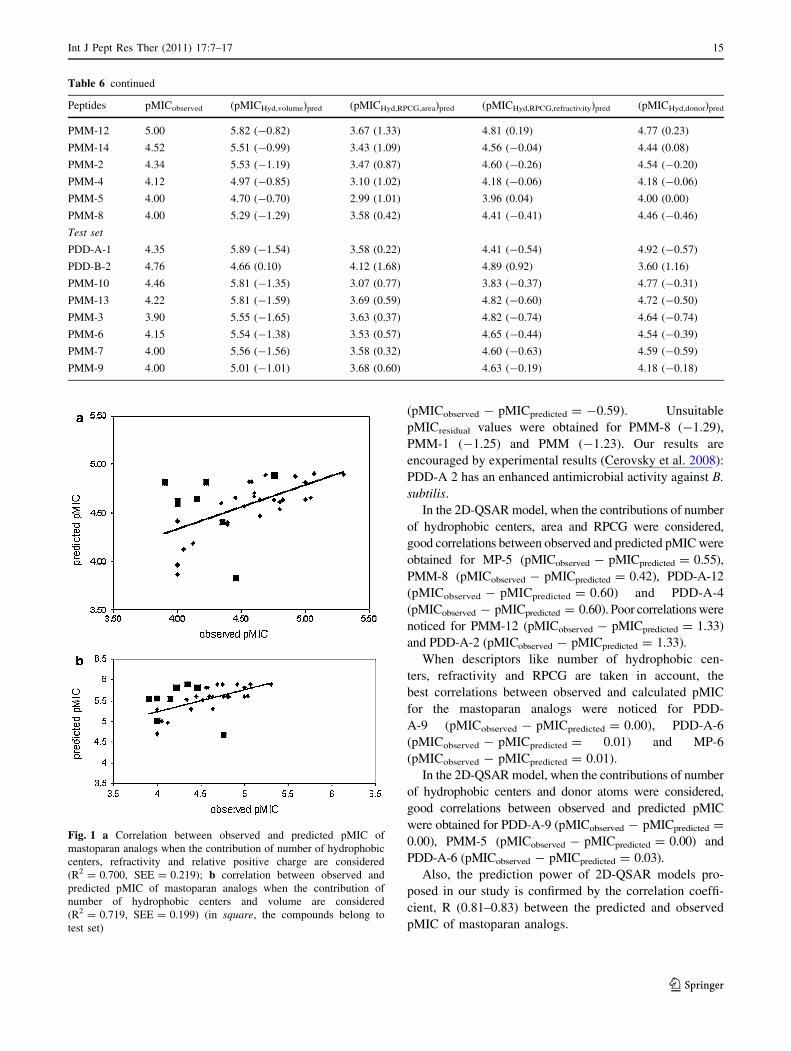
Data presented in Table 6 are supported by the corre-
lation between observed and predicted antimicrobial
activities when the contribution of number of hydrophobic
centers, refractivity and relative positive charge (Fig. 1a)
and number of hydrophobic centers and volume (Fig. 1b)
are considered.
Best correlations between observed and calculated pMIC
for the mastoparan analogs included in 2D-QSAR model in
which the considered descriptors simultaneously share
number of hydrophobic centers and volume seem to be
for MP (pMICobserved - pMICpredicted = -0.56), PDD-A-10
(pMICobserved - pMICpredicted = -0.59) and PDD-A-2
Table 5 continued
Descriptors R2 SEE ANOVA results QSAR coefficients
Hyd RPCG area 0.718 0.205 df SS MS F Constant = 2.616
Regression 2 2.614 0.871 20.770 c17 = 0.276
Residual 26 1.049 0.042 c18 = -0.721
Total 28 3.663 0.913 c19 = -0.001
Hyd RPCG volume 0.720 0.203 df SS MS F Constant = 2.712
Regression 2 2.637 0.879 21.420 c20 = 0.306
Residual 26 1.026 0.041 c21 = -2.259
Total 28 3.663 0.920 c22 = -0.001
Hyd RPCG dipole moment 0.664 0.222 df SS MS F Constant = 2.009
Regression 2 2.431 0.810 16.441 c23 = 0.246
Residual 26 1.232 0.049 c24 = 1.582
Total 28 3.663 0.859 c25 = -0.002
Table 6 Observed and predicted pMIC of mastoparan analogs at B. subtilis and residual values (in brackets) when combinations of (a) Hyd,
volume, (b) Hyd, RPCG, area, (c) Hyd, RPCG, refractivity and (d) Hyd and number of donor atom were considered
Peptides pMICobserved (pMICHyd,volume)pred (pMICHyd,RPCG,area)pred (pMICHyd,RPCG,refractivity)pred (pMICHyd,donor)pred
MP 5.04 5.60 (-0.56) 3.87 (1.17) 4.66 (0.38) 4.69 (0.35)
MP-2 4.60 5.60 (-1.00) 3.87 (0.73) 4.67 (-0.07) 4.69 (-0.09)
MP-5 4.45 5.60 (-1.15) 3.90 (0.55) 4.66 (-0.21) 4.69 (-0.24)
MP-6 4.39 5.30 (-0.91) 3.66 (0.73) 4.40 (-0.01) 4.36 (0.03)
PDD-A 4.92 5.89 (-0.97) 4.08 (0.84) 4.88 (0.04) 4.87 (0.05)
PDD-A-10 5.00 5.59 (-0.59) 3.87 (1.13) 4.63 (0.37) 4.64 (0.36)
PDD-A-11 4.82 5.59 (-0.77) 3.84 (0.98) 4.63 (0.19) 4.64 (0.18)
PDD-A-12 4.69 5.89 (-1.20) 4.09 (0.60) 4.89 (-0.20) 4.92 (-0.23)
PDD-A-2 5.30 5.89 (-0.59) 4.12 (1.18) 4.90 (0.40) 4.97 (0.33)
PDD-A-3 5.07 5.89 (-0.82) 4.11 (0.96) 4.90 (0.17) 4.97 (0.10)
PDD-A-4 4.75 5.89 (-1.14) 4.15 (0.60) 4.91 (-0.16) 5.02 (-0.27)
PDD-A-5 4.76 5.59 (-0.83) 3.88 (0.88) 4.64 (0.12) 4.64 (0.12)
PDD-A-6 4.39 5.29 (-0.90) 3.64 (0.75) 4.38 (0.01) 4.36 (0.03)
PDD-A-7 4.05 5.00 (-0.95) 3.42 (0.63) 4.12 (-0.07) 4.08 (-0.03)
PDD-A-8 4.00 4.71 (-0.71) 3.17 (0.83) 3.87 (0.13) 3.80 (0.20)
PDD-A-9 4.64 5.59 (-0.95) 3.86 (0.78) 4.64 (0.00) 4.64 (0.00)
PDD-B 4.80 5.60 (-0.80) 3.87 (0.93) 4.62 (0.18) 4.74 (0.06)
PDD-B-1 4.60 5.61 (-1.01) 3.89 (0.71) 4.71 (-0.11) 4.74 (-0.14)
PDD-B-3 4.64 5.30 (-0.66) 3.61 (1.03) 4.47 (0.17) 4.51 (0.13)
PDD-B-4 4.80 5.60 (-0.80) 3.80 (1.00) 4.54 (0.26) 4.69 (0.11)
PDD-B-5 4.00 5.00 (-1.00) 3.33 (0.67) 3.97 (0.03) 4.18 (-0.18)
PMM 4.58 5.81 (-1.23) 3.67 (0.91) 4.82 (-0.24) 4.77 (-0.19)
PMM-1 4.56 5.81 (-1.25) 3.67 (0.89) 4.82 (-0.26) 4.77 (-0.21)
14 Int J Pept Res Ther (2011) 17:7–17
123
(pMICobserved - pMICpredicted = -0.59). Unsuitable
pMICresidual values were obtained for PMM-8 (-1.29),
PMM-1 (-1.25) and PMM (-1.23). Our results are
encouraged by experimental results (Cerovsky et al. 2008):
PDD-A 2 has an enhanced antimicrobial activity against B.
subtilis.
In the 2D-QSAR model, when the contributions of number
of hydrophobic centers, area and RPCG were considered,
good correlations between observed and predicted pMIC were
obtained for MP-5 (pMICobserved - pMICpredicted = 0.55),
PMM-8 (pMICobserved - pMICpredicted = 0.42), PDD-A-12
(pMICobserved - pMICpredicted = 0.60) and PDD-A-4
(pMICobserved - pMICpredicted = 0.60). Poor correlations were
noticed for PMM-12 (pMICobserved - pMICpredicted = 1.33)
and PDD-A-2 (pMICobserved - pMICpredicted = 1.33).
When descriptors like number of hydrophobic cen-
ters, refractivity and RPCG are taken in account, the
best correlations between observed and calculated pMIC
for the mastoparan analogs were noticed for PDD-
A-9 (pMICobserved - pMICpredicted = 0.00), PDD-A-6
(pMICobserved - pMICpredicted = 0.01) and MP-6
(pMICobserved - pMICpredicted = 0.01).
In the 2D-QSAR model, when the contributions of number
of hydrophobic centers and donor atoms were considered,
good correlations between observed and predicted pMIC
were obtained for PDD-A-9 (pMICobserved - pMICpredicted =
0.00), PMM-5 (pMICobserved - pMICpredicted = 0.00) and
PDD-A-6 (pMICobserved - pMICpredicted = 0.03).
Also, the prediction power of 2D-QSAR models pro-
posed in our study is confirmed by the correlation coeffi-
cient, R (0.81–0.83) between the predicted and observed
pMIC of mastoparan analogs.
Table 6 continued
Peptides pMICobserved (pMICHyd,volume)pred (pMICHyd,RPCG,area)pred (pMICHyd,RPCG,refractivity)pred (pMICHyd,donor)pred
PMM-12 5.00 5.82 (-0.82) 3.67 (1.33) 4.81 (0.19) 4.77 (0.23)
PMM-14 4.52 5.51 (-0.99) 3.43 (1.09) 4.56 (-0.04) 4.44 (0.08)
PMM-2 4.34 5.53 (-1.19) 3.47 (0.87) 4.60 (-0.26) 4.54 (-0.20)
PMM-4 4.12 4.97 (-0.85) 3.10 (1.02) 4.18 (-0.06) 4.18 (-0.06)
PMM-5 4.00 4.70 (-0.70) 2.99 (1.01) 3.96 (0.04) 4.00 (0.00)
PMM-8 4.00 5.29 (-1.29) 3.58 (0.42) 4.41 (-0.41) 4.46 (-0.46)
Test set
PDD-A-1 4.35 5.89 (-1.54) 3.58 (0.22) 4.41 (-0.54) 4.92 (-0.57)
PDD-B-2 4.76 4.66 (0.10) 4.12 (1.68) 4.89 (0.92) 3.60 (1.16)
PMM-10 4.46 5.81 (-1.35) 3.07 (0.77) 3.83 (-0.37) 4.77 (-0.31)
PMM-13 4.22 5.81 (-1.59) 3.69 (0.59) 4.82 (-0.60) 4.72 (-0.50)
PMM-3 3.90 5.55 (-1.65) 3.63 (0.37) 4.82 (-0.74) 4.64 (-0.74)
PMM-6 4.15 5.54 (-1.38) 3.53 (0.57) 4.65 (-0.44) 4.54 (-0.39)
PMM-7 4.00 5.56 (-1.56) 3.58 (0.32) 4.60 (-0.63) 4.59 (-0.59)
PMM-9 4.00 5.01 (-1.01) 3.68 (0.60) 4.63 (-0.19) 4.18 (-0.18)
Fig. 1 a Correlation between observed and predicted pMIC of
mastoparan analogs when the contribution of number of hydrophobic
centers, refractivity and relative positive charge are considered
(R2 = 0.700, SEE = 0.219); b correlation between observed and
predicted pMIC of mastoparan analogs when the contribution of
number of hydrophobic centers and volume are considered
(R2 = 0.719, SEE = 0.199) (in square, the compounds belong to
test set)
Int J Pept Res Ther (2011) 17:7–17 15
123

Due to the before-mentioned high importance of mas-
toparan analogs as antimicrobial peptides, a set of new 19
derivatives of PDD-A and PMM-12 mastoparan analogs
was created in order to predict a higher pMIC. The pre-
dictive ability of the 2D-QSAR models presented in
Table 5 was used to evaluate the predicted antimicrobial
activity of these new derivatives of PDD-A and PMM-12
mastoparan analogs and also, the residual values (the dif-
ference predicted pMIC derivative vs. observed pMIC of
parent analogs). In Table 7 there are presented the pre-
dicted pMIC of new of PDD-A and PMM-12 derivatives
when descriptors Hyd, volume, area, refractivity and
RPCG are considered.
Following our design strategy presented in the
‘‘2D-QSAR Methodology’’ section, when simultaneously
number of hydrophobic centers and volume are considered,
three derivatives of the PDD-A analog (PDD-A-derivative 3
(INWKKIFEKVKNWV, residual value = 1.27); PDD-
A-derivative 6 (WNWKKIFEKVKNLV, residual value =
1.27) and PDD-A-derivative 8 (INWKKIFHKVKNLV,
residual value = 1.28) recorded a pMIC values in accord
with our intention. In the same QSAR model, four deriv-
atives of the PMM-12 analog (PMM-12-derivative 9
(NIWKKIWSIWKEVLKWL, residual value = 2.91), PMM-
12-derivative 4 (NIWKKIASIAKEVWKAW, residual
value = 1.70), PMM-12-derivative 7 (NIWKKIASIAKKV
LKAL, residual value = 1.42) and PMM-12-derivative 8
(NIWKKIASIAKHVLKAL residual value = 1.42) had a
good outcome. In contrast, not significant increases of pMIC
in PDD-A and PMM-12 derivatives of mastoparan analogs
were recorded in the second 2D-QSAR model (number of
hydrophobic centers, area and RPCG descriptors taken in
account). In the last 2D-QSAR model discussed in our study
(number of hydrophobic centers, refractivity and RPCG
descriptors taken in account), two derivatives of PDD-A
analog (PDD-A-derivative 8, residual value = 0.33 and
PDD-A-derivative 9, residual value = 0.33) were recorded
to show a slightly increased antimicrobial activity. In the
PMM-12 derivatives series, only PMM-12-derivative 9,
residual value = 1.60 has an increased pMIC value. We
notice that double or triple mutations in tryptophan residues
could possibly induce an increased antimicrobial potency in
PMM-12 analog series, if the number of hydrophobic cen-
ters and molecular volume are considered.
Concluding Remarks
Here we have reported 2D-QSAR studies upon a series of
37 mastoparan analogs already tested as antimicrobial
peptides at B. subtilis and also upon 19 new derivatives of
mastoparan analogs. Mastoparan analogs were used to
elucidate the most important physicochemical properties
which might be responsible for the antimicrobial activity.
Table 7 Predicted pMIC of PDD-A and PMM-12 derivatives and their residual values (the difference predicted pMIC vs. observed pMIC of
parent analogs (in bracket)) obtained when descriptors are in combinations: (a) Hyd, volume; (b) Hyd, RPCG, area; (c) Hyd, RPCG, refractivity
Derivatives of mastoparan analogs
obtained by computational mutagenesis
(pMICHyd,volume)pred (pMICHyd,RPCG,area)pred (pMICHyd,RPCG,refractivity)pred
PDD-A-derivative 1 5.89 (0.97) 4.09 (-0.83) 4.89 (-0.03)
PDD-A-derivative 10 6.18 (1.26) 4.27 (-0.65) 5.16 (0.24)
PDD-A-derivative 2 5.88 (0.96) 4.08 (-0.84) 4.87 (-0.05)
PDD-A-derivative 3 6.19 (1.27) 4.32 (-0.60) 5.13 (0.21)
PDD-A-derivative 4 5.89 (0.97) 4.07 (-0.85) 4.84 (-0.08)
PDD-A-derivative 5 5.89 (0.97) 4.10 (-0.82) 4.85 (-0.07)
PDD-A-derivative 6 6.19 (1.27) 4.35 (-0.57) 5.15 (0.23)
PDD-A-derivative 7 5.88 (0.96) 4.06 (-0.86) 4.85 (-0.07)
PDD-A-derivative 8 6.20 (1.28) 4.35 (-0.57) 5.25 (0.33)
PDD-A-derivative 9 6.19 (1.27) 4.32 (-0.60) 5.25 (0.33)
PMM-12-derivative 1 5.82 (1.12) 3.69 (-1.01) 4.81 (0.11)
PMM-12-derivative 9 7.61 (2.91) 5.18 (0.48) 6.30 (1.60)
PMM-12-derivative 2 5.82 (1.12) 3.69 (-1.01) 4.81 (0.11)
PMM-12-derivative 3 5.80 (1.10) 3.63 (-1.07) 4.77 (0.07)
PMM-12-derivative 4 6.40 (1.70) 4.13 (-0.57) 5.29 (0.59)
PMM-12-derivative 5 5.80 (1.10) 3.60 (-1.10) 4.75 (0.05)
PMM-12-derivative 6 5.80 (1.10) 3.66 (-1.04) 4.78 (0.08)
PMM-12-derivative 7 6.12 (1.42) 3.92 (-0.78) 5.08 (0.38)
PMM-12-derivative 8 6.12 (1.42) 4.09 (-0.83) 4.89 (-0.03)
16 Int J Pept Res Ther (2011) 17:7–17
123
In our study number of hydrophobic centers, donor and
acceptor atoms, RPCG supplied by molecular area and
volume, dipole moment and refractivity were considered.
Significant correlation coefficients R2 and standard error of
prediction results were obtained for simultaneous presence
of: (i) number of hydrophobic centers and volume; (ii)
number of hydrophobic centers, volume and RPCG; (iii)
number of hydrophobic centers, area and RPCG;
(iv) number of hydrophobic centers and donor atoms; (v)
number of hydrophobic centers, refractivity and RPCG.
The judicious modulation of physicochemical properties
may be useful in designing new antimicrobial peptide
antibiotic drugs. Considering the established QSAR equa-
tions obtained in this study, a set of 19 new derivatives of
mastoparan analogs was proposed and used to predict the
antimicrobial activity. It was noticed that the single or
multiple mutations with tryptophan residue and also the
presence of lysine and histidine significantly increase the
predicted pMIC of antimicrobial peptide derivatives.
Acknowledgments We acknowledge the financial support of
CNMP PNII 61-016/2007 and CNMP PNII 62-061/2008.
References
Akamatsu M (2002) Current state and perspectives of 3D-QSAR.
Curr Top Med Chem 2:1381–1394
Bowdish DM, Hancock RE (2005) Anti-endotoxin properties of
cationic host defence peptides and proteins. J Endotoxin Res
11:230–236
Brandenburg K, Schromm AB, Gutsmann T (2010) Endotoxins:
relationship between structure, function and activity. Subcell
Biochem 53:53–67
Cerovsky V, Slaninova J, Fucik V, Hulacova H, Borovickova L,
Jezek R, Bednarova L (2008) New potent antimicrobial peptides
from the venom of Polistinae wasps and their analogs. Peptides
29:992–1003
Chen Y, Mant CT, Farmer SW, Hancock RE, Vasil ML, Hodges RS
(2005) Rational design of a-helical antimicrobial peptides with
enhanced activities and specificity/therapeutic index. J Biol
Chem 280:12316–12329
Collantes ER, Dunn WJ (1995) Amino acid side chain descriptors for
quantitative structure activity relationship studies of peptide
analogues. J Med Chem 38:2705–2713
Cornell WD, Cieplak P, Bayly CI, Gould IR, Merz KM, Ferguson DM,
Spellmeyer DC, Fox T, Caldwell JW, Kollman PA (1995) A
second generation force field for the simulation of proteins, nucleic
acids, and organic molecules. J Am Chem Soc 117:5179–5197
Davison G, Allgrove J, Gleeson M (2009) Salivary antimicrobial
peptides (LL-37 and alpha-defensins HNP1-3), antimicrobial and
IgA responses to prolonged exercise. Eur J Appl Physiol 106:
277–284
dos Santos Cabrera MP, Costa ST, de Souza BM, Palma MS, Ruggiero
JR, Ruggiero Neto J (2008) Selectivity in the mechanism of
action of antimicrobial mastoparan peptide Polybia-MP1. Eur
Biophys J 37:879–891
Ebalunode JO, Zheng W, Tropsha A (2011) Application of QSAR and
shape pharmacophore modeling approaches for targeted chem-
ical library design. Methods Mol Biol 685:111–133
Frederic C, Cristine AC, Erwan A, David A, Cecile D, Michael F,
Jean-Francois H, Martinez J, Solveig LJ, Philippe M, Andrea P,
Agnes P, Christopher P, Philippe R, Peter SG, Sherwin W (2005)
JLK inhibitors: isocoumarin compounds as putative probes to
selectively target the gamma-secretase pathway. Curr Alzheimer
Res 2:327–334
Hancock EW, Scott MG (2000) The role of antimicrobial peptides in
animal defenses. Proc Natl Acad Sci USA 97:8856–8861
Harris F, Dennison SR, Phoenix DA (2009) Anionic antimicrobial
peptides from eukaryotic organisms. Curr Protein Pept Sci 10:
585–606
Jenssen H, Fjell CD, Cherkasov A, Hancock RE (2008) QSAR
modeling and computer-aided design of antimicrobial peptides.
J Pept Sci 14:110–114
Mahalka AK, Kinnunen PK (2009) Binding of amphipathic alpha-
helical antimicrobial peptides to lipid membranes: lessons from
temporins B and L. Biochim Biophys Acta 1788:1600–1609
Maher S, McClean S (2006) Investigation of the cytotoxicity of
eukaryotic and prokaryotic antimicrobial peptides in intestinal
epithelial cells in vitro. Biochem Pharmacol 71:1289–1298
Mendes MA, De Sousa BM, Marques MR, Palma MS (2004)
Structural and biological characterization of two novel peptides
from the venom of the neotropical social wasp Agelaia pallipespalipes. Toxicon 44:67–74
Mikut R (2010) Computer-based analysis, visualization, and inter-
pretation of antimicrobial peptide activities. Methods Mol Biol
618:287–299
Periti P, Mazzei T (1999) New criteria for selecting the proper
antimicrobial chemotherapy for severe sepsis and septic shock.
Int J Antimicrob Agents 12:97–105
Persson B (2000) Bioinformatics in protein analysis. EXS 88:215–231
Raevsky OA, Skvortsov VS (2005) Quantifying hydrogen bonding in
QSAR and molecular modeling. SAR QSAR Environ Res 16:
287–300
Snyder RD, Hendry LB (2005) Toward a greater appreciation of
noncovalent chemical/DNA interactions: application of biolog-
ical and computational approaches. Environ Mol Mutagen 45:
100–105
Subasinghage AP, Conlon JM, Hewage CM (2010) Development of
potent anti-infective agents from Silurana tropicalis: conforma-
tional analysis of the amphipathic, alpha-helical antimicrobial
peptide XT-7 and its non-haemolytic analogue [G4K]XT-7.
Biochim Biophys Acta 1804:1020–1028
Tong J, Liu S, Zhou P, Wu B, Li Z (2008) A novel descriptor of
amino acids and its application in peptide. QSAR Theor Biol
253:90–97
Zanetti M, Gennaro R, Skerlavaj B, Tomasinsig L, Circo R (2002)
Cathelicidin peptides as candidates for a novel class of
antimicrobials. Curr Pharm Des 8:779–793
Zasloff M (2002) Antimicrobial peptides of multicellular organisms.
N Engl J Med 347:1199–1200
Zhao X, Yuan M, Huang B, Ji H, Zhu L (2010) Ligand-based
pharmacophore model of N-aryl and n-heteroaryl piperazine
alpha(1A)-adrenoceptors antagonists using GALAHAD. J Mol
Graph Model 29:126–136
Zhu WL, Song YM, Park Y, Park KH, Yang ST, Kim JI, Park IS, Hahm
KS, Shin SY (2007) Substitution of the leucine zipper sequence
in melittin with peptoid residues affects self-association, cell
selectivity and mode of action. Biochim Biophys Acta 1768:
1506–1517
Zuo Z, Luo X, Zhu W, Shen J, Shen X, Jiang H, Chen K (2005)
Molecular docking and 3D-QSAR studies on the binding
mechanism of statine-based peptidomimetics with beta-secretase.
Bioorg Med Chem 13:2121–2131
Int J Pept Res Ther (2011) 17:7–17 17
123