Evaluation of anin vitro model of androgen ablation and identification of the androgen responsive...
17
RESEARCH ARTICLE Evaluation of an in vitro model of androgen ablation and identification of the androgen responsive proteome in LNCaP cells John G. Rowland 1 , Joanne L. Robson 2 , William J. Simon 2 , Hing Y. Leung 1 and Antoni R. Slabas 2 1 Northern Institute for Cancer Research, University of Newcastle, Newcastle-upon-Tyne, UK 2 School of Biological and Biomedical Sciences, University of Durham, Durham, UK Proteins responsive to androgen and anti-androgen may be involved in the development and progression of prostate cancer and the ultimate failure of androgen-ablation therapy. These pro- teins represent potential diagnostic and therapeutic targets for improved management of pros- tate cancer. We have investigated the effect of androgen (R1881) and anti-androgen (bicalut- amide) on the androgen-responsive prostate cancer LNCaP cell line using a quantitative gel- based proteomic approach. Prior to analysis, the in vitro system was evaluated for reproducibility and validated by appropriate molecular responses to treatment. Six replicate samples were inde- pendently generated and analysed by 2-D DIGE. According to strict statistical criteria, 197 spots were differentially expressed, of which we have successfully identified 165 spots corresponding to 125 distinct proteins. Following androgen supplementation, 108 spots (68 proteins) were increased and 57 spots (39 proteins) were decreased. Essentially no difference was observed be- tween control and anti-androgen-treated samples, confirming the absence of “off-target” effects of bicalutamide. Identified proteins were involved in diverse processes including the stress re- sponse and intracellular signalling. The potential contribution to disease of these processes and identified constituent proteins are discussed. This rigorous, statistically supported study of androgen responses has provided a number of potential candidates for development as diagnos- tic/prognostic markers and drug targets. Received: September 15, 2006 Accepted: October 4, 2006 Keywords: Androgen / Cancer / Prostate / Quantitative Proteomics 2007, 7, 47–63 47 1 Introduction Prostate cancer is the most commonly diagnosed cancer and the second most common cause of cancer death among men in the developed world [1, 2]. Like the prostate itself, most tumours are initially dependent on androgen for growth and, while early surgical intervention for localised disease is effective, men presenting with locally advanced or metastatic disease are usually treated by androgen ablation. This treat- ment leads to transient tumour regression via apoptotic mechanisms [3] with most patients developing hormone- refractory disease within 2–3 years as assessed by elevated serum levels of the classical androgen-regulated prostate- specific antigen (PSA). There is currently no long-term effective therapy for this form of the disease. The develop- ment of hormone-refractory disease is characterised by re- expression of androgen-regulated proteins, suggesting reac- tivation of androgen receptor (AR) signalling. However, the mechanisms by which tumours acquire androgen indepen- Correspondence: Dr. Antoni R. Slabas, School of Biological and Biomedical Sciences, University of Durham, South Road, Dur- ham DH1 3LE, UK E-mail: [email protected] Fax: 144-191-3341295 Abbreviations: AR, Androgen receptor; FM, full medium; OS, oxidative stress; PSA, prostate-specific antigen; S-D, steroid- depleted DOI 10.1002/pmic.200600697 © 2007 WILEY-VCH Verlag GmbH & Co. KGaA, Weinheim www.proteomics-journal.com
Transcript of Evaluation of anin vitro model of androgen ablation and identification of the androgen responsive...

RESEARCH ARTICLE
Evaluation of an in vitro model of androgen ablation
and identification of the androgen responsive
proteome in LNCaP cells
John G. Rowland1, Joanne L. Robson2, William J. Simon2, Hing Y. Leung1
and Antoni R. Slabas2
1 Northern Institute for Cancer Research, University of Newcastle, Newcastle-upon-Tyne, UK2 School of Biological and Biomedical Sciences, University of Durham, Durham, UK
Proteins responsive to androgen and anti-androgen may be involved in the development andprogression of prostate cancer and the ultimate failure of androgen-ablation therapy. These pro-teins represent potential diagnostic and therapeutic targets for improved management of pros-tate cancer. We have investigated the effect of androgen (R1881) and anti-androgen (bicalut-amide) on the androgen-responsive prostate cancer LNCaP cell line using a quantitative gel-based proteomic approach. Prior to analysis, the in vitro system was evaluated for reproducibilityand validated by appropriate molecular responses to treatment. Six replicate samples were inde-pendently generated and analysed by 2-D DIGE. According to strict statistical criteria, 197 spotswere differentially expressed, of which we have successfully identified 165 spots correspondingto 125 distinct proteins. Following androgen supplementation, 108 spots (68 proteins) wereincreased and 57 spots (39 proteins) were decreased. Essentially no difference was observed be-tween control and anti-androgen-treated samples, confirming the absence of “off-target” effectsof bicalutamide. Identified proteins were involved in diverse processes including the stress re-sponse and intracellular signalling. The potential contribution to disease of these processes andidentified constituent proteins are discussed. This rigorous, statistically supported study ofandrogen responses has provided a number of potential candidates for development as diagnos-tic/prognostic markers and drug targets.
Received: September 15, 2006Accepted: October 4, 2006
Keywords:
Androgen / Cancer / Prostate / Quantitative
Proteomics 2007, 7, 47–63 47
1 Introduction
Prostate cancer is the most commonly diagnosed cancer andthe second most common cause of cancer death among menin the developed world [1, 2]. Like the prostate itself, most
tumours are initially dependent on androgen for growth and,while early surgical intervention for localised disease iseffective, men presenting with locally advanced or metastaticdisease are usually treated by androgen ablation. This treat-ment leads to transient tumour regression via apoptoticmechanisms [3] with most patients developing hormone-refractory disease within 2–3 years as assessed by elevatedserum levels of the classical androgen-regulated prostate-specific antigen (PSA). There is currently no long-termeffective therapy for this form of the disease. The develop-ment of hormone-refractory disease is characterised by re-expression of androgen-regulated proteins, suggesting reac-tivation of androgen receptor (AR) signalling. However, themechanisms by which tumours acquire androgen indepen-
Correspondence: Dr. Antoni R. Slabas, School of Biological andBiomedical Sciences, University of Durham, South Road, Dur-ham DH1 3LE, UKE-mail: [email protected]: 144-191-3341295
Abbreviations: AR, Androgen receptor; FM, full medium; OS,oxidative stress; PSA, prostate-specific antigen; S-D, steroid-depleted
DOI 10.1002/pmic.200600697
© 2007 WILEY-VCH Verlag GmbH & Co. KGaA, Weinheim www.proteomics-journal.com

48 J. G. Rowland et al. Proteomics 2007, 7, 47–63
dence remain unclear and must be addressed before effectivetreatment strategies can be developed. There is a require-ment for the identification of additional biomarkers for dis-ease diagnosis and classification. Given the importance ofandrogen-regulated proteins in disease development andprogression, it is hoped that the characterisation of theandrogen response may provide such biomarkers and allow amore complete understanding of the molecular events lead-ing to androgen independence.
While extensive transcriptomic studies have been per-formed in prostate cancer research (for example [4–7]), thesestudies yield little information on the functional state of cellsas changes in transcript levels are not always reflected at theprotein level [8–12]. Assessment of the functional state ofcells is, therefore, only possible by employing a proteomicapproach. Of the many proteomic technologies now avail-able, 2-DE remains the most accessible platform for simul-taneously resolving thousands of proteins from multiplesamples. Advances in differential dye labelling and theadvent of 2-D DIGE [13] offers an attractive methodology forthe analysis of multiple biological replicates, resolution andseparation of proteins and the quantitative and statisticalanalysis of differences in protein profiles. To date, while sev-eral studies concerning prostate cancer exist utilising gel-based approaches, these were largely performed at a timewhen 2-D DIGE was not available, which as a consequencelimited the nature of the analyses performed [14–20].
In this study, we have utilised 2-D DIGE for the evalua-tion of an in vitro model of androgen ablation and analysis ofthe response of this model to both a re-activated AR and theanti-androgen, bicalutamide, commonly used in diseasemanagement. Analysis of six independently generated bio-logical replicates, validated for PSA expression status, pro-vided the opportunity for rigorous statistical reporting. Thishas allowed us to identify novel components downstream ofthe activated AR signalling cascade and may provide addi-tional targets for the development of novel therapeuticagents for the treatment of hormone-refractory disease andbiomarkers to aid in diagnosis and disease stratification.
2 Materials and methods
2.1 Cell culture
Androgen-responsive LNCaP cells [21] were purchased fromAmerican Type Culture Collection (ATCC, Rockville, MD,USA) and routinely cultured in full medium [FM; RPMI1640 medium, 25 mM HEPES buffer, 20 mM L-glutamine,10% heat-inactivated foetal calf serum (FCS), penicillin(100 U/mL) and streptomycin (100 mg/mL)] in 90-mm petridishes at 377C in a humidified atmosphere containing 5%carbon dioxide. A steroid-depleted (S-D) variant of FM con-tained S-D FCS purchased from HyClone (Logan, UT, USA)in place of heat-inactivated FCS.
2.2 Proliferation assay
Proliferation was assessed using Cell Proliferation reagentWST-1 {4-[3-(4-iodophenyl)-2-(4-nitrophenyl)-2H-5-tetrazolio]-1,3-benzene disulfonate; Roche, UK} according to the manu-facturer’s instructions. Briefly, cells were cultured in 96-welltissue culture plates in a final volume of 100 mL/well growthmedium. WST-1 reagent was added to 10% per well, the cellsincubated for 2–4 h and absorbance at 450 nm was recordeddirectly. Proliferation was calculated as the relative increase inabsorbance resulting from treatment.
2.3 Sample generation and validation
LNCaP cells were seeded in 90-mm dishes at a density of26105 cells per dish and allowed to plate down overnight inFM. Cells were then washed in PBS and transferred to S-Dmedium for 72 h. Cell cultures were then washed in PBS andtreatments consisting of 10 nM synthetic androgen R1881,1 mM bicalutamide or vehicle control (ethanol) added for afurther 72 h. This experimental setup was performed for sixindependent biological replicates from different parentalcultures. Cultures were washed twice in low-salt buffer(25 mM Tris-HCl, pH 7.5) and directly lysed in SDS samplebuffer (125 mM Tris-HCl pH 6.8, 2% SDS, 10% glycerol,0.01% bromophenol blue) containing 5 mM DTT. Theandrogen-response status of samples was validated byimmunoblot for expression of PSA.
2.4 Protein extraction and concentration
Protein was extracted from SDS sample buffer by acetoneprecipitation at –207C overnight, washed in ice-cold 80% ac-etone, air dried, and resuspended in IEF sample buffer (9 Murea, 2 M thiourea, 4% CHAPS). Further sample clean-upwas achieved using the Ettan 2-D Clean-up kit (AmershamBiosciences, UK) according to the manufacturer’s recom-mended protocol, followed by resolubilisation in IEF samplebuffer containing 50 mM Tris-HCl at pH 8.5.
Protein concentration was assessed using a modifiedBradford assay [22], which is not susceptible to interferencefrom components in the IEF sample buffer, using BSA as astandard. Briefly, 2 mL of each protein sample and standardwas mixed with 20% Bradford reagent (Bio-Rad, USA) con-taining 0.1 mM HCl in a final volume of 1 mL. Absorbanceat 595 nm was measured in duplicate for each sample andstandard using a Pharmacia LKB UltrospecIII spectro-photometer (Amersham Biosciences).
2.5 Fluorescent labelling with CyDyes
CyDye labelling reagents were obtained from AmershamBiosciences. Aliquots of 50 mg of each protein sample werelabelled with 400 pmol of either Cy3 or Cy5. A pooled inter-nal standard containing 450 mg protein was labelled with3600 pmol of Cy2. This pooled standard consisted of equal
© 2007 WILEY-VCH Verlag GmbH & Co. KGaA, Weinheim www.proteomics-journal.com
Proteomics 2007, 7, 47–63 Cell Biology 49
proportions of all samples being analysed. Labelling wasperformed for 30 min, on ice in the dark, and the reactionwas terminated by the addition of 1 mL 10 mM L-lysine for10 min on ice in the dark. Aliquots of 20 mg of each samplewere then appropriately mixed for analysis and an equal vol-ume of IEF sample buffer containing 2% DTT and 4% pH4–7 ampholytes (Amersham Biosciences) added.
2.6 IEF and SDS-PAGE
Mixed samples containing a total load of 60 mg protein in100 mL were applied to rehydrated 18-cm linear pH 4–7 IPGstrips by anodic cup-loading and IEF was performed for atotal of 70 000 Vh on an IPGphor system (Amersham Bio-sciences). Focused strips were then equilibrated for 15 minin a buffer (6 M urea, 30% glycerol, 10% SDS, 50 mM Tris-HCl, pH 8.8) containing 1% DTTand for a further 15 min inthe same buffer containing 4.8% iodoacetamide. Equili-brated strips were then loaded onto large-format(260620061 mm) 12% polyacrylamide gels for resolutionin the second dimension performed using the Ettan DALTtwelve system (Amersham Biosciences). Low-fluorescenceglass cassettes were employed and all gels were concurrentlyelectrophoresed at 5 W/gel for 30 min followed by 17 W/geluntil completion, as assessed by monitoring the bromophe-nol blue dye-front.
2.7 Gel imaging
Gels were imaged for each of the three dyes immediatelyupon completion of second-dimension electrophoresis. Im-aging was performed using a Typhoon 9400 variable modelaser imager (Amersham Biosciences) in fluorescenceacquisition mode at normal sensitivity and a resolution of100 mm. The three fluors were imaged at excitation/emissionwavelengths of 488/520 nm, 532/580 nm and 633/670 nmfor Cy2, Cy3 and Cy5, respectively. Imaging was performedusing parameters selected to prevent pixel saturation.
2.8 DIGE analysis
Comparison of abundance changes across all six replicatesfor each treatment was performed using Decyder softwareversion 5.0 (Amersham Biosciences) in batch processingmode. Spot detection was performed based on an estimatedspot number of 3000 spots per gel and spot volumes, nor-malisation and spot matching between gels performed usingthe biological variation module. Spots present in all gels witha fold change of .1.2 and a p value of ,0.05 from a Student’st-test were considered as significantly differentially expressedspots of interest. The validity of these changes and accuracyof spot matching was confirmed by manual inspection of thegels.
2.9 Spot excision and in-gel tryptic digestion
Proteins of interest were excised from multiple pick gelscontaining 500 mg unlabelled protein from each treatment.Electrophoretic conditions used were identical to those usedfor DIGE analytical gels, with pick gels being run on1.5-mm-thick gels silane bonded to one half of each glasscassette. Gels were fixed in 40% methanol, 10% acetic acidovernight followed by a second fix for at least 2 h prior toovernight staining in Sypro Ruby Red (Molecular Probes,USA) in the dark. Images were acquired using the Typhoonimager and an excitation/emission wavelength of 532/610 nm and re-imaged following spot excision to confirmsuccessful gel plug removal. Spots of interest were pickedusing a Genomic Solutions ProPic robot and digested usingan automated long trypsin digestion method on a ProGestdigestion robot (Genomic Solutions, UK) as described pre-viously [23].
2.10 MS
Peptide samples were analysed directly by MALDI-TOF PMFusing a Voyager-DE™ STR BioSpectrometry™ Workstation(Applied Biosystems) and a thin-film target-spotting meth-odology [24] essentially as described previously [23]. Dataacquisition and analysis was performed in fully automatedmode. Online data analysis was performed using AppliedBiosystems Data Explorer software for peak detection, noisereduction and peak de-isotoping.
Calibrated peak lists of peptide masses for each samplewere generated and used in a MASCOT (www.ma-trixscience.com) MS database search query of all availableentries in the NCBInr database (www.ncbi.nlm.nih.gov),allowing for single missed cleavages, oxidised methioninesand carboxylmethyl cysteines as potential modifications.Data was required to match at better than 50-ppm massaccuracy. Returned matches are ranked based on theMOWSE score [25], with the highest ranked human matchhaving a score of .76 considered as the successful identifi-cation of the protein.
2.11 Immunoblot analysis
Cell lysates in SDS sample buffer were separated on 12%Tris-glycine 1-DE gels and then transferred to NC mem-branes. Blots were blocked in 5% non-fat milk powder inTBS (20 mM Tris-HCl, 500 mM NaCl, pH 7.5) for at least1 h and washed twice for 10 min each in 0.1% Tween-20 inTBS (TTBS). Blots were then incubated with various anti-bodies for 1 h with constant agitation and washed twice inTTBS for 5 min each. A further 1-h incubation in the ap-propriate horseradish peroxidise-conjugated secondary anti-body solution was then performed, after which anyunbound secondary antibodies were removed by two 10-minwashes in TTBS, followed by a single wash in TBS for10 min. Antibody binding was detected using the ECL
© 2007 WILEY-VCH Verlag GmbH & Co. KGaA, Weinheim www.proteomics-journal.com

50 J. G. Rowland et al. Proteomics 2007, 7, 47–63
detection system (Amersham Biosciences). Protein loadswere normalized based on immunoblot analysis of a-tubu-lin expression levels.
2.12 Bioinformatics
All identified proteins with an associated official nameannotation were assigned to one or more cellular processcategories, if applicable, based on level 4 annotation in theGene Ontology [26]. Non-annotated proteins were assignedto the category described as “unknown process”. Repre-sentation analysis was performed using the hypergeometrictest with the entire human genome as a reference dataset.This test enables identification of significantly over- or under-represented processes present within the dataset based ontheir relative abundance within the genome as a whole. Pro-cesses with a p value of ,0.05 were designated as signifi-cantly different from expected.
3 Results and discussion
3.1 The use of S-D serum effectively models the
clinical setting
In the clinical setting, androgen ablation is achieved viasuppression of androgen synthesis by the testes and theadministration of anti-androgens to prevent the action ofadrenally produced residual androgen. The ultimate failureof androgen ablation therapy is indicated by the reactivationof AR signalling and consequent re-expression of androgen-regulated gene products such as PSA. As a result, the pri-mary focus of prostate cancer research has been on the roleof androgen-regulated genes and proteins in disease pro-gression and escape from hormonal control.
Heterogeneity of disease, difficulties in procuring suffi-cient quantities of human tissue and sample preparationissues currently compromise conclusions that can bereached from proteomic analysis of tissue samples. Conse-quently, more reproducible and accessible in vitro modelsrepresent highly attractive systems for the study of the mo-lecular basis of androgen-independent growth.
In this study we have evaluated the LNCaP prostate can-cer cell line as a model for the proteomic study of androgenablation. This cell line is one of the few in vitro prostate celllines that possess a functional AR, with responses to andro-gen treatment characterised by increased cellular prolifera-tion and the induction of high levels of PSA mRNA and cor-responding protein [27]. We investigated the reproducibilityand dynamics of these responses to androgen and, con-versely, anti-androgen, factors that are critical to the design ofsuccessful proteomic studies.
Reduction in proliferation of LNCaP cells was observedfor cultures grown in FM supplemented with 1 mM bicalut-amide and also for cultures grown in S-D medium, with S-Dmedium providing a near total inhibition of proliferation
Figure 1. Steroid deprivation inhibits proliferation of LNCaPcells. LNCaP cells were cultured in FM, FM supplemented with1 mM bicalutamide or vehicle, and S-D medium. Proliferationover a 96-h period was assessed using WST-1 reagent. Datashown are the average of six replicates. Error bars repre-sent 6 1 SD.
(Fig. 1). Addition of bicalutamide to S-D medium did notreduce proliferation any further than that achieved with S-Dmedium alone (data not shown). There is relatively littlechange in proliferation in either culture (FM 1 bicalut-amide, S-D) from 72 to 96 h following treatment, althoughcells remain fully viable.
Analysis of PSA protein levels in similarly treated cul-tures indicated that both treatments are equally effective atabrogating AR signalling, with PSA levels declining by ap-proximately 80% after 24 h, remaining at this low levelthereafter (Fig. 2). Reactivation of AR signalling in theseandrogen-deprived cells resulted in maximal expression ofPSA after 72 h of treatment (Fig. 3A). Cellular proliferationalso increased over this time, stabilising after 72 h of treat-ment (Fig. 3B).
The reproducible complete removal of detectable andro-gen action after 3-day incubation in S-D medium, and thesubsequent re-expression of maximal levels of PSA after afurther 3-day treatment with the synthetic androgen, R1881,identify these conditions as optimal for identification ofandrogen-regulated proteins.
Using these conditions, PSA expression status follow-ing treatment with androgen (R1881), anti-androgen (bica-lutamide) or vehicle control was assessed in triplicate byimmunoblot and clearly shows that acute steroid depriva-tion in S-D medium alone is sufficient to achieve a level ofinhibition of PSA expression comparable to treatment withbicalutamide. Expression of PSA is fully restored in re-sponse to reactivation of AR. This assessment also indi-cated a high degree of reproducibility between independentbiological replicates. Typical results of this analysis areshown in Fig. 4. Simple characterisation of this in vitromodel has provided a solid foundation for the study ofandrogen ablation and the consequences of a reactivatedAR.
© 2007 WILEY-VCH Verlag GmbH & Co. KGaA, Weinheim www.proteomics-journal.com

Proteomics 2007, 7, 47–63 Cell Biology 51
Figure 2. Steroid deprivation dra-matically reduces PSA proteinexpression. LNCaP cells were cul-tured for between 0 and 72 h in FM,FM supplemented with bicaluta-mide and S-D medium. Total celllysates were analysed by immuno-blot (A) and relative PSA expressionlevels assessed by densitometry (B).
Figure 3. Reactivated AR enhances proliferation and restoresPSA expression. LNCaP cells were treated with 10 nM R1881 fol-lowing acute steroid deprivation for 72 h in S-D medium. (A) Totalcell lysates were produced at various time points and analysedby immunoblot. (B) Proliferation over a 72-h period was assessedusing WST-1 reagent. Data shown are the average of six repli-cates and are shown relative to untreated control cultures. Errorbars represent 6 1 SD.
Figure 4. PSA expression by an in vitro model of androgen abla-tion. Supplementation of S-D medium with the anti-androgenbicalutamide gives no further reduction in PSA levels over S-Dmedium alone. PSA expression is restored by addition of thesynthetic androgen R1881. Image is representative of analysisperformed in triplicate.
The evaluation of the model described above has clearlyshown that the responses observed mimic those found in theclinical setting and are also in full agreement with otherpublished findings. Androgen ablation of cell cultures usinga commercial S-D serum was found to be at least as effectiveat reducing PSA levels and cellular proliferation as treatmentwith anti-androgen. It is notable that this effect was fullyreversible upon treatment with androgen. This form ofandrogen-ablation affords greater control of the cellularmicroenvironment compared with pharmaceutical andro-gen-ablative methods as the steroid deprivation stress can becompletely and immediately removed. Pharmaceutical
© 2007 WILEY-VCH Verlag GmbH & Co. KGaA, Weinheim www.proteomics-journal.com

52 J. G. Rowland et al. Proteomics 2007, 7, 47–63
androgen ablation may result in the continued presence oftrace amounts of therapeutic compound in the medium,affecting the outcome of subsequent treatments to anunknown and variable extent. By employing S-D medium forandrogen ablation, we can identify both responses to sub-sequent reactivation of AR signalling and also responses totreatment with anti-androgen.
3.2 The androgen response following acute steroid
deprivation
Using the model described above, we have assessed the pro-teomic consequences of reactivation of the AR followingandrogen removal. At the same time, we have also assessedthe proteomic responses induced by the therapeutic anti-androgen bicalutamide following non-pharmaceuticalandrogen removal using S-D medium.
Six independent biological replicate samples were gen-erated by a 3-day steroid deprivation in S-D medium followedby treatment with either 10 nM androgen (R1881), 1 mManti-androgen (bicalutamide) or vehicle control (ethanol) fora further 3 days. All samples were assessed for a validandrogen response by immunoblotting for PSA protein.
Protein from these samples was then extracted, resolu-bilised in 2-D DIGE compatible buffer and fluorescentlylabelled with CyDyes as described in Materials and methods.
Labelled samples were then appropriately multiplexed,incorporating a pooled internal reference sample and ana-lysed following 2-DE.
Only spots with a .1.2-fold change and a p value ,0.05that were present in all analytical gels were considered sig-nificant. All spots of interest were independently confirmedto ensure spot matching was accurate, which we view as anessential step in the analysis pipeline.
The locations of all spots of interest are shown in Fig. 5,with spot number annotations for up-regulated proteinsshown in Fig. 6 and down-regulated proteins shown in Fig. 7.
The anti-androgen response of this model was found tobe almost identical to that of the non-treated androgen-ablated reference condition, confirming at a proteomic levelthat incubation in S-D medium alone effectively creates anenvironment of complete androgen ablation. Only a singleunidentified protein feature at the extreme periphery of theresolvable gel space was found to be differentially expressedbetween these two conditions. This finding further demon-strates that androgen ablation using commercial S-D serumas a component of the culture medium induces a molecularresponse that remains virtually unaltered by the administra-tion of anti-androgen, implying that bicalutamide acts in anidentical manner to achieve androgen ablation and that it hasno effect on the proteome of LNCaP cells beyond its role inblocking AR function.
Figure 5. Proteins differentiallyexpressed in response to hor-monal manipulation. Differ-ential protein expression in amodel of androgen ablation wasassessed by 2-D DIGE. Mastergel image (Cy2 pooled sample)shows spots that are up-regu-lated (red) and down-regulated(green) as a consequence ofreactivation of AR.
© 2007 WILEY-VCH Verlag GmbH & Co. KGaA, Weinheim www.proteomics-journal.com

Proteomics 2007, 7, 47–63 Cell Biology 53
Figure 6. Up-regulated spotssuccessfully identified byMALDI-TOF MS. Differentiallyexpressed spots were selectedand excised from a high protein-load pick gel and identified byMALDI-TOF MS. Spots areannotated with their corre-sponding master spot number(Cy2 pooled sample) for cross-referencing with Table 1.
Figure 7. Down-regulated spotssuccessfully identified byMALDI-TOF MS. Differentiallyexpressed spots were selectedand excised from a high protein-load pick gel and identified byMALDI-TOF MS. Spots areannotated with their corre-sponding master spot number(Cy2 pooled sample) for cross-referencing with Table 2.
© 2007 WILEY-VCH Verlag GmbH & Co. KGaA, Weinheim www.proteomics-journal.com

54 J. G. Rowland et al. Proteomics 2007, 7, 47–63
Of the total 197 spots of interest, those that could be con-fidently located on high loading pick gels stained with SyproRuby Red were selected for identification by MALDI-TOFMS. The identities of these spots are shown in Tables 1 and 2and are cross-referenced to the gel annotations. Successfulidentifications were obtained for 165 of the spots, with a hitrate of approximately 84% and corresponding to 125 distinctproteins. We believe that the identities of these proteins donot require further verification by MS/MS as, in our experi-ence with other studies, protein identities based on PMF withsuch high probabilities have also proved correct when ana-lysed by MS/MS (unpublished data). We have shown that theandrogen response elevates the level of 140 protein spots, ofwhich we have successfully identified 108, corresponding to68 distinct proteins (Table 1). Reduction in the level of proteinwas found for 57 spots, of which 53 have been identified cor-responding to 39 distinct proteins (Table 2). The greatest foldchange was observed for protein disulphide isomerase-relatedprotein, which was up-regulated by androgen treatment. Thegreatest down-regulation of expression was observed formitochondrial serine protease HTRA2.
The predicted and observed pI/Mr of spots were suffi-ciently similar in most cases to support the protein identity.However, some spots identified as KRT1 or KRT10 (Table 2,spots 44 and 46) exhibited a large degree of disparity betweenpredicted and observed values both for their pI and Mr. Inaddition, high molecular weight protein spots are con-sistently observed to migrate at apparently lower molecularweights than predicted. This is most likely due to extrapola-tion beyond the range of the markers employed during cali-bration of the gels. A small number of spots (IDI1, WARS,HIBADH) exhibited large (.1.0) differences between theirobserved and predicted pI, indicating that these proteins maybe post-translationally modified. A single protein, FKBP8was found to be represented by a spot that differed frompredicted values with respect to both its pI and Mr .
Differential expression of a small group of selected pro-teins was confirmed by semi-quantitative immunoblot anal-ysis (Fig. 8). In all cases, the direction of change in expres-sion identified by 2-D DIGE was confirmed, although thesemi-quantitative nature of this analysis precludes con-firmation of the magnitude of change. The identification ofmultiple spots for some distinct proteins may represent thepresence of isoforms, possibly resulting from differentialPTM of the initial gene product. This is supported byimmunoblot analysis specific for FASN.
3.3 Comparisons with other gel-based studies
Prior to this report, the most comprehensive gel-based pro-teomic study of the androgen response in LNCaP cells hadbeen performed by Waghray et al. in 2001 [18], with theidentification of 32 up-regulated and 12 down-regulated pro-teins after 3-day treatment with the androgen dihy-drotestosterone. In common with the Waghray report, wehave identified up-regulation of creatine kinase B chain and
Figure 8. Validation of selected proteins. Selected proteins wereanalysed by immunoblotting for confirmation of differentialexpression.
cytokeratin 8, and down-regulation of selenium bindingprotein 1, although we have not identified any other proteinsin common between the datasets. Discrepancies between thetwo datasets are, at least in part, due to the use of differentpH ranges in the first dimension separation. In addition tothis, it should be noted that Waghray performed the analysisusing only duplicate samples, with a mass accuracy for pro-tein identification of 400 ppm, as compared with our six in-dependent replicates and a mass accuracy of 50 ppm.
Three additional gel-based studies on the androgen re-sponse in LNCaP cells are also present in the literature, al-though these have resulted in very few protein identifica-tions. Indeed, Ornstein et al. 2000 [19] do not report on anyidentities, preferring to comment simply on the comparisonbetween proteomic profiles of LNCaP cells and clinicalmaterial. Two further reports identify a single protein each;Nelson et al. 2000 [28] identified up-regulation of the metas-tasis suppressor NDKA/nm23 after 24-h exposure to andro-gen and Gamble et al. 2004 [20] report on the androgen-de-pendent down-regulation of prohibitin. The limited numberof reported differentially expressed spots by these studiesmay be due in part to their reliance on silver staining forvisualisation of protein, a technique prone to wide variation.
We have confirmed down-regulation of prohibitin in re-sponse to androgen, finding it to be decreased 1.34-fold. Wecould not confirm differential expression of NDKA/nm23 inresponse to androgen as the corresponding low molecularweight spot was not present within the resolving area of ourgels. Some of the proteins we have identified have been pre-viously shown to be androgen responsive, including, but notlimited to, prohibitin, selenium binding protein 1, brain-
© 2007 WILEY-VCH Verlag GmbH & Co. KGaA, Weinheim www.proteomics-journal.com

Proteomics 2007, 7, 47–63 Cell Biology 55
Table 1. List of identified proteins up-regulated by addition of androgen
SpotNumber
Protein Name OfficialNamea)
Accession Fold-change
MOWSE SequenceCoverage(%)
PeptidesMatched
Predicted Observed
pI kDa pI kDa
1 Oxygen regulated protein HYOU1 gi)5453832 1.36 243 50 52 5.16 111.5 5.04 .752 Oxygen regulated protein HYOU1 gi)5453832 1.55 210 41 47 5.16 111.5 5.07 .753 Fatty acid synthase FASN gi)38648667 2.48 287 36 74 5.99 275.9 6.11 .754 Fatty acid synthase FASN gi)38648667 2.41 188 26 51 5.99 275.9 6.16 .755 Fatty acid synthase FASN gi)41872631 1.86 239 34 68 6.01 275.9 6.20 .756 Fatty acid synthase FASN gi)38648667 2.07 143 27 54 5.99 275.9 6.25 .757 Vinculin VCL gi)7669550 1.38 150 38 36 5.50 124.3 6.20 .758 MOP-4 FLJ10808 gi)11990422 1.86 180 51 39 5.76 119.2 6.07 .759 Vinculin VCL gi)24657579 1.99 142 27 21 5.83 117.2 6.25 .75
10 Vinculin VCL gi)7669550 2.17 302 57 77 5.50 124.3 6.16 .7511 Insulysin IDE gi)4826770 1.84 185 38 35 6.30 118.7 6.18 .7512 Insulysin IDE gi)4826770 1.57 185 36 34 6.30 118.7 6.24 .7513 Glucosidase II GANAB gi)2274968 1.28 127 35 30 5.71 107.3 5.99 .7514 alpha-glucosidase II GANAB gi)2274968 1.99 115 39 35 5.71 107.3 6.07 .7515 Fatty acid synthase FASN gi)41584442 2.29 127 26 54 5.97 275.9 6.14 .7516 Fatty acid synthase FASN gi)41584442 2.58 137 23 45 5.97 275.9 6.21 .7517 Glucosidase II GANAB gi)2274968 1.25 244 49 50 5.82 109.4 6.04 .7518 Elongation factor 2 EEF2 gi)4503483 2.70 86 39 28 6.41 96.2 6.75 74.019 Phosphoglycerate dehydrogenase PHGDH gi)23308577 3.33 88 31 15 6.29 57.4 6.79 74.020 Elongation factor 2 EEF2 gi)4503483 2.45 185 44 38 6.41 96.2 6.90 74.021 Elongation factor 2 EEF2 gi)4503483 1.92 105 42 32 6.41 96.2 6.87 73.822 VCP VCP gi)48257098 1.26 223 61 40 4.94 71.5 4.97 73.323 VCP VCP gi)48257098 1.27 168 62 37 4.94 71.5 5.07 72.924 VCP VCP gi)55662798 1.25 178 59 39 4.94 71.5 5.16 72.825 VCP VCP gi)48257098 1.31 220 67 46 4.94 71.5 5.11 72.826 Elongation factor 2 EEF2 gi)4503483 1.46 130 33 25 6.41 96.2 6.82 72.327 Proteasome 26S ATPase subunit 2 PSMD2 gi)25777602 1.29 332 67 57 5.08 100.9 4.97 72.128 55.11 protein homolog PSMD2 gi)2134674 1.30 171 51 40 5.14 100.0 5.01 71.929 Unnamed protein UNR gi)10433969 1.26 141 32 22 5.90 86.4 6.12 71.530 VCP VCP gi)48257098 1.22 264 67 51 4.94 71.5 5.08 71.231 VCP VCP gi)48257098 1.28 141 47 27 4.94 71.5 5.19 71.132 VCP VCP gi)48257098 1.24 141 47 27 4.94 71.5 5.23 71.033 GSPT1 protein GSPT1 gi)33874734 1.27 120 46 28 5.22 69.3 5.28 69.834 Mitoch. elongation factor G1 GFM1 gi)18390331 1.52 151 45 33 6.58 84.1 6.46 69.535 VCP VCP gi)6005942 1.38 140 54 26 4.94 71.5 5.16 69.536 KIAA0251 KIAA0251 gi)39930345 1.32 210 53 44 5.19 87.6 5.19 69.437 Pantothenate kinase PANK4 gi)10241706 1.32 127 38 27 5.93 86.1 6.16 69.038 Elongation factor G GFM1 gi)14285174 1.66 106 32 26 6.58 84.2 6.26 69.039 Elongation factor G1 GFM1 gi)18390331 1.78 204 45 40 6.58 84.1 6.36 69.240 Motor protein IMMT gi)516764 1.30 182 32 24 5.71 79.8 6.20 68.641 Pantothenate kinase PANK4 gi)10241706 1.31 127 38 27 5.93 86.1 6.11 68.642 Hypothetical protein XPNPEP1 gi)21734051 1.39 87 30 18 5.87 73.7 5.73 66.943 HSP70 HSPA5 gi)16507237 1.26 249 60 45 5.07 72.4 4.81 66.244 Neurolysin NLN gi)14149738 1.38 235 54 34 6.21 81.3 6.12 64.145 Phosphoglucomutase 2 PGM2 gi)12052930 1.31 257 63 39 6.28 68.8 6.45 63.246 Nuclear protein localisation 4 NPL4 gi)19683967 1.30 167 47 34 5.94 69.0 6.31 63.147 Leukotriene A4 hydrolase LTA4H gi)29726225 3.14 74 30 15 5.87 69.7 6.02 60.848 Hypothetical protein ARCN1 gi)34365146 1.25 101 39 21 5.63 62.1 6.28 59.449 Stress-induced phosphoprotein 1 STIP1 gi)54696884 1.24 203 60 38 6.40 63.2 6.68 58.050 Agx1 UAP1 gi)23200208 1.82 243 74 45 5.96 57.4 6.22 57.051 Proteasome 26S ATPase subunit 1 PSMC1 gi)16741033 1.45 175 58 26 5.92 49.3 5.96 56.852 Agx1 UAP1 gi)7717462 1.83 160 44 24 5.96 57.4 6.09 56.653 Epoxide hydrolase 2 EPHX2 gi)30582609 1.38 164 54 29 5.91 63.3 6.24 56.254 Protein disulphide isomerase PDIA3 gi)7437388 1.22 256 57 36 5.98 57.2 5.80 54.355 Protein disulphide isomerase PDIA3 gi)7437388 1.22 231 59 35 5.98 57.2 5.68 54.2
© 2007 WILEY-VCH Verlag GmbH & Co. KGaA, Weinheim www.proteomics-journal.com

56 J. G. Rowland et al. Proteomics 2007, 7, 47–63
Table 1. Continued
SpotNumber
Protein Name OfficialNamea)
Accession Fold-change
MOWSE SequenceCoverage(%)
PeptidesMatched
Predicted Observed
pI kDa pI kDa
56 ER-60 protein PDIA3 gi)2245365 1.30 215 58 35 5.88 57.1 5.72 54.257 Tryptophanyl-tRNA synthetase WARS gi)50513261 1.48 161 70 27 7.12 43.6 6.12 54.258 Unnamed protein product HMGCS1 gi)21754758 1.79 139 49 24 5.22 56.7 5.21 53.959 Protein disulphide isomerase PDIA3 gi)7437388 11.86 129 43 24 5.98 57.2 5.75 53.360 CNDP dipeptidase 2 CNDP2 gi)13112005 3.94 128 46 19 5.66 53.2 5.63 52.962 FKBP54 FKBP5 gi)1145816 3.12 215 72 45 5.80 50.9 6.04 53.063 SIL1 SIL1 gi)22760180 1.88 171 40 25 5.18 52.3 5.24 52.564 Cytokeratin 8 KRT8 gi)181573 2.91 215 60 35 5.52 53.5 5.29 51.765 Cytokeratin 8 KRT8 gi)181573 4.07 235 62 47 5.52 53.5 5.38 51.866 Cytokeratin 8 KRT8 gi)39645331 1.36 235 63 49 5.62 55.9 5.71 51.767 Protein disulphide isomerase related
protein 5PDIA6 gi)1710248 1.41 147 59 21 4.95 46.5 4.92 51.1
68 Mixture: Cytokeratin 8 KRT8 gi)181573 1.53 99 44 22 5.52 53.5 5.62 49.8Glutathione synthetase GSS gi)4504169 98 47 17 5.67 52.5
69 Rho GTPase activating protein 1 ARHGAP1 gi)30584949 1.39 195 72 27 5.85 50.6 5.83 50.070 PSMC3 PSMC3 gi)48145579 2.11 178 71 34 5.39 45.5 5.05 48.471 Mixture: Adipocyte plasma C20orf3 gi)24308201 1.23 180 64 30 5.82 46.6 5.99 48.4
membrane associatedproteinAldehyde dehydrogenase ALDH9A1 gi)7427715 109 49 24 6.01 54.4
72 HNRNPF protein HNRPF gi)16876910 1.37 156 61 25 5.38 46.0 5.24 47.973 5’ nucleotidase NT5C2L1 gi)38570156 1.22 177 58 25 5.94 52.4 6.22 47.874 Lactate dehydrogenase LDHD gi)37595756 1.29 236 65 31 6.03 52.9 6.07 47.875 Mixture: Cytokeratin 18 KRT18 gi)30311 1.45 148 54 26 5.27 47.3 5.08 46.6
Mannose-6-P receptor M6PRBP1 gi)16306789 144 59 22 5.30 47.2binding protein
76 Cytokeratin 18 KRT18 gi)30311 1.95 181 62 31 5.27 47.3 5.17 46.677 Cytokeratin 18 KRT18 gi)30311 1.49 117 50 23 5.27 47.3 5.13 46.378 Creatine kinase CKB gi)180570 3.35 177 64 30 5.34 42.9 5.37 46.279 Creatine kinase CKB gi)180570 1.23 202 68 29 5.34 42.9 5.55 45.780 Cytokeratin 18 KRT18 gi)30311 1.30 340 80 47 5.27 47.3 5.33 45.881 Thioredoxin domain containing 4 TXNDC4 gi)13529224 1.24 192 54 27 5.09 47.3 4.93 45.682 NADP-dependent isocitrate
dehydrogenaseIDH1 gi)3641398 1.32 199 63 30 6.34 46.9 6.79 45.6
83 NADP-dependent isocitratedehydrogenase
IDH1 gi)3641398 1.26 207 78 34 6.34 46.9 7.00 45.5
84 KIAA0158 SEPT2 gi)40788885 1.76 79 35 10 6.05 42.3 6.35 45.585 GLUL protein GLUL gi)22749655 1.30 144 42 19 6.43 42.7 6.56 45.486 Succinyl-CoA synthetase SUCLA2 gi)3766197 1.22 179 62 26 5.84 46.7 5.90 45.287 Beta actin ACTB gi)14250401 1.35 195 91 30 5.56 41.3 5.16 45.288 LOC51035 LOC51035 gi)25303960 1.82 139 61 21 5.23 33.4 5.10 44.289 Actin, gamma 1 propeptide ACTG1 gi)4501887 1.74 142 63 20 5.31 42.1 5.98 43.590 Spermine synthase SMS gi)1082797 4.64 98 58 18 4.87 41.9 4.66 43.491 Spermine synthase SMS gi)21264341 3.31 199 80 27 4.87 41.7 4.59 43.392 Laminin receptor 1 RPSA gi)44890755 1.31 185 66 19 4.83 32.9 4.38 42.993 Laminin receptor 1 RPSA gi)44890755 1.42 137 61 21 4.83 32.9 4.48 42.994 Tubulin-specific chaperone c TBCC gi)30582843 1.32 74 29 10 5.55 39.7 5.50 40.995 Aldehyde Reductase AKR1A1 gi)1633300 1.28 80 31 10 6.34 36.8 6.76 40.796 N-acetylneuraminic acid phosphate
synthaseNANS gi)17939512 1.32 196 67 25 6.29 40.7 6.93 40.6
97 Biliverdin reductase A BLVRA gi)47117734 1.24 277 81 32 6.06 33.7 6.41 40.298 CAPZA1 protein CAPZA1 gi)54695598 1.24 148 73 18 5.45 33.1 5.44 37.099 Alpha-SNAP NAPA gi)47933379 1.27 209 81 24 5.23 33.7 5.09 34.1
100 Creatine kinase CKB gi)180555 1.28 96 44 16 5.34 42.7 6.30 33.7
© 2007 WILEY-VCH Verlag GmbH & Co. KGaA, Weinheim www.proteomics-journal.com

Proteomics 2007, 7, 47–63 Cell Biology 57
Table 1. Continued
SpotNumber
Protein Name OfficialNamea)
Accession Fold-change
MOWSE SequenceCoverage(%)
PeptidesMatched
Predicted Observed
pI kDa pI kDa
101 Protein PP4-X ANXA4 gi)189617 1.36 234 72 31 5.65 36.3 5.81 32.4102 F-actin capping protein beta subunit CAPZB gi)13124696 1.27 160 63 22 5.36 31.6 5.66 30.7103 Isopentenyl-diphosphate delta-
isomeraseIDI1 gi)40018633 1.86 124 48 15 8.05 33.0 6.43 27.7
104 Peroxiredoxin 6 PRDX6 gi)4758638 1.74 109 50 12 6.00 25.1 6.55 27.4105 Peroxiredoxin 6 PRDX6 gi)4758638 1.60 197 75 19 6.00 25.1 5.69 27.4106 HSP27 HSPB1 gi)54696638 1.51 124 75 17 5.98 22.8 6.11 27.4107 Peroxiredoxin 6 PRDX6 gi)4758638 1.35 111 56 12 6.00 25.1 6.59 27.4108 Oncogene DJ-1 PARK7 gi)31543380 1.28 279 92 23 6.33 20.1 6.33 24.0
a) Entries in italics are for proteins with no Official Name/Gene Symbol currently assigned.
specific creatine kinase, glucosidase II and fatty acid syn-thase, the identification of which validates our analysis.However, for the majority of proteins identified, we believethis is the first report to provide empirical evidence of theirresponsiveness to androgen.
3.4 Functional classification of androgen and
anti-androgen responsive proteins
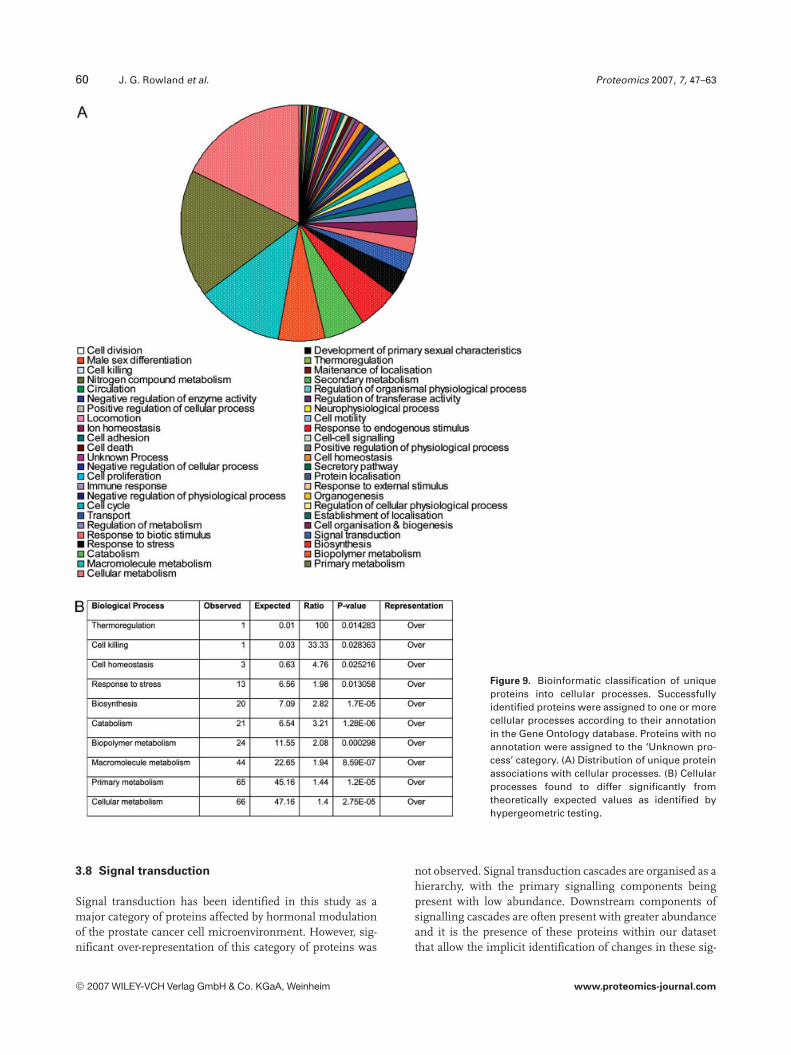
To assist in the interpretation of this large dataset and toallow the development of new hypotheses for subsequentexperimentation we have employed a bioinformaticapproach to objectively assign identified proteins into func-tional groups based on their annotation at level 4 of the GeneOntology (Fig. 9).
The majority of proteins were associated with meta-bolic processes (cellular metabolism 62.2%, primary me-tabolism 61.3%, macromolecule metabolism 41.5%), withonly two proteins assigned to the “Unknown process”category.
Aside from cellular metabolic processes, the most com-mon processes associated with identified proteins were thestress response and signal transduction. Hypergeometricanalysis revealed that the stress response was approximatelytwofold over-represented and that this was significant (pvalue = 0.013058, Fig. 9B).
3.5 Stress response
The cellular response to various stressors is criticallyimportant for the protection and maintenance of cellularphysiology and commonly involves molecular chaperonessuch as the heat shock proteins. The stress response pro-vides a mechanism for protecting the cellular machineryuntil the cell can mobilise components required to eithermitigate or tolerate the stress. A dysfunctional stress re-sponse in cancer cells may, therefore, result in additionalabnormal responses in multiple cellular processes provid-
ing a survival advantage. The stress response may, there-fore, represent an attractive target for the development ofnovel therapeutics.
Proteins identified in this study that are involved in thecellular response to stress included epoxide hydrolase 2(EPHX2), glutathione synthetase (GSS), high-mobility groupbox 1 (HMGB1), heat shock 27-kDa protein 1 (HSPB1),hypoxia up-regulated 1 (HYOU1), leukotriene A4 hydrolase(LTA4H), peroxiredoxin 6 (PRDX6), serine protease 25(HTRA2), stress-induced-phosphoprotein 1 (STIP1), thior-edoxin domain containing 4 (TXNDC4), thioredoxin reduc-tase (TXNRD1), valosin-containing protein (VCP), Ku 80-kDa autoantigen (XRCC5) and N-acetylneuraminic acid syn-thase (NANS). Proteins in this group are associated with twomain stress types, oxidative stress (OS) and ER stress, withsome proteins in common between these two stress types.
3.6 Oxidative stress
OS is involved in the regulation of a wide range of cellularprocesses, including proliferation and survival, and isbelieved to be important in the molecular pathobiology ofprostate cancer (reviewed in [29–31]). All proteins identifiedin this group (EPHX2, GSS, HSPB1, LTA4H, NANS,PRDX6, TXNRD1) were up-regulated by androgen, with theexception of TXNRD1, an essential component of redoxcontrol. The down-regulation of TXNRD1 by androgen seenin this study could have a high level of biological signifi-cance. Since androgen down-regulates it, the level ofTXNRD1 is elevated in the absence of androgen. One has toconsider the consequence of this in cases where androgen-responsive genes are elevated in the absence of androgen,which is the case in hormone-refractory prostate cancer. Onecould rationalise a mechanism for this based on levels of theTXNRD1 protein and its known interactive partners, whichultimately could have effects on the AR. TXNRD1 is knownto enhance the DNA-binding activity of the AP-1 complex, atranscriptional regulatory complex that is known to be
© 2007 WILEY-VCH Verlag GmbH & Co. KGaA, Weinheim www.proteomics-journal.com

58 J. G. Rowland et al. Proteomics 2007, 7, 47–63
Table 2. List of identified proteins down-regulated by addition of androgen
SpotNumber
Protein Name OfficialName
Accession Fold-change
MOWSE SequenceCoverage(%)
PeptidesMatched
Predicted Observed
pI kDa pI kDa
1 TRIM28 TRIM28 gi)31544959 21.26 164 35 28 5.67 80.6 5.19 .752 Ts11 cell cycle control protein ASNS gi)339987 21.63 88 29 13 6.71 62.7 6.86 72.23 HP95 PDCD6IP gi)13375569 21.56 297 62 46 6.13 96.6 6.43 72.24 Folate hydrolase FOLH1 gi)4758398 21.62 102 47 27 6.50 84.5 6.56 70.75 ATP-dependent DNA helicase II XRCC5 gi)10863945 21.22 201 30 24 5.55 83.2 5.77 69.06 Mitotic checkpoint protein isoform
MAD1aMAD1L1 gi)4580767 21.21 97 34 23 5.63 83.3 5.78 67.2
7 Lamin A/C isoform 1 LMNA gi)27436946 21.24 166 50 38 6.57 74.4 6.58 64.68 HNRPK protein HNRPK gi)55958544 21.24 109 46 20 5.46 47.8 5.16 59.49 HNRPK protein HNRPK gi)55958544 21.23 152 53 20 5.46 47.8 5.24 59.1
10 HNRPK protein HNRPK gi)55958544 21.21 183 59 27 5.46 47.8 5.12 59.111 Transformation upregulated nuclear
proteinHNRPK gi)460789 21.21 152 38 19 5.13 51.3 5.44 59.1
12 P21-activated kinase 2 PAK2 gi)47482156 21.69 102 40 19 5.78 58.4 5.99 56.013 Thioredoxin reductase TXNRD1 gi)1184537 21.27 200 71 27 6.07 55.1 6.29 55.914 FKBP8 protein FKBP8 gi)14602950 21.48 100 56 17 7.60 38.8 4.68 54.115 Phosphoglycerate dehydrogenase PHGDH gi)23308577 21.24 170 49 28 6.29 57.4 6.57 54.516 Glucose-6-phosphate dehydrogenase G6PD gi)21614520 21.24 280 68 41 6.27 59.7 6.93 54.417 Selenium binding protein 1 SELENBP1 gi)16306550 21.26 181 68 28 5.93 52.9 6.31 52.618 HNRPH2 HNRPH2 gi)9624998 21.30 143 64 34 5.89 49.5 6.03 52.219 Protein phosphatase 2 PPP2R2A gi)4506019 21.83 152 50 24 5.82 52.2 6.09 52.320 Selenium binding protein 1 SELENBP1 gi)16306550 21.43 144 63 23 5.93 52.9 6.18 52.421 Beta-5-tubulin TUBB gi)18088719 21.26 162 49 24 4.75 50.1 4.69 52.422 Beta-5-tubulin TUBB gi)18088719 21.40 92 34 17 4.75 50.1 4.68 48.623 Enolase 2 ENO2 gi)5803011 21.21 121 55 20 4.91 47.6 4.63 48.624 TAR DNA binding protein TARDBP gi)6678271 21.30 87 42 15 5.85 45.1 6.04 43.325 C6orf55 C6orf55 gi)48146531 21.20 88 51 16 5.87 34.1 4.83 42.126 HNRPC protein HNRPC gi)13097279 21.31 84 32 11 4.94 32.4 4.77 42.027 Acyl-CoA dehydrogenase ACADSB gi)30268183 21.30 158 62 24 6.83 47.3 5.8 41.928 Acyl-CoA dehydrogenase ACADSB gi)30268183 21.25 191 55 23 6.83 47.3 6.01 41.929 Ovalbumin SERPINB5 gi)4505789 21.39 87 50 14 5.72 42.6 5.87 41.930 Cytokeratin 1 KRT1 gi)17318569 22.22 186 50 32 8.16 66.2 3.89 41.531 C6orf55 C6orf55 gi)48146531 21.33 88 51 16 5.87 34.1 6.11 40.232 HNRPC protein HNRPC gi)13097279 21.31 92 38 17 4.94 32.4 4.76 40.033 HNRPC protein HNRPC gi)13097279 21.31 120 58 21 4.94 32.4 4.82 40.134 Transaldolase 1 TALDO1 gi)48257056 21.30 127 51 18 6.35 37.6 6.14 38.635 Heterogeneous nuclear
ribonucleoprotein H3 isoform bHNRPH3 gi)14141159 21.27 78 35 11 6.36 35.3 6.5 38.1
36 Ubiquitin fusion degradationprotein 1 homolog
UFD1L gi)12644464 21.34 194 62 22 5.96 39.1 6.74 37.4
37 Aryl hydrocarbon receptorinteracting protein
AIP gi)4502009 21.27 155 59 18 6.09 38.1 6.44 36.3
38 Mitoch. serine protease Htra2 HTRA2 gi)21466051 22.23 121 51 19 6.13 34.9 6.45 35.339 Pyridoxal kinase PDXK gi)4505701 21.35 100 44 13 5.75 35.3 5.9 34.740 PSME3 PSME3 gi)49456449 21.36 97 42 10 5.69 29.7 6.05 33.541 C17orf25 C17orf25 gi)16198390 21.25 124 39 13 5.40 33.5 5.39 33.542 Phosphoribosyl pyrophosphate syn-
thetase 2PRPS2 gi)4506129 21.22 103 55 15 6.15 35.1 6.72 33.2
43 3-Hydroxyisobutyrate dehydrogenase HIBADH gi)51094970 21.46 128 53 18 8.38 35.7 5.73 31.644 Cytokeratin 10 KRT10 gi)40354192 21.31 82 31 14 5.09 59.0 5.73 29.945 Cathepsin D CTSD gi)30582659 21.30 166 40 20 6.10 45.0 5.31 29.846 Cytokeratin 1 KRT1 gi)17318569 21.51 125 44 26 8.16 66.2 5.72 29.247 Cathepsin D CTSD gi)54697170 21.55 128 31 13 6.10 45.0 5.3 29.048 Prohibitin PHB gi)46360168 21.32 234 64 17 5.57 29.9 5.3 28.349 RP42 RP42 gi)48257187 21.25 88 35 9 4.99 29.7 4.97 28.0
© 2007 WILEY-VCH Verlag GmbH & Co. KGaA, Weinheim www.proteomics-journal.com

Proteomics 2007, 7, 47–63 Cell Biology 59
Table 2. Continued
SpotNumber
Protein Name OfficialName
Accession Fold-change
MOWSE SequenceCoverage(%)
PeptidesMatched
Predicted Observed
pI kDa pI kDa
50 High-mobility group box 1 HMGB1 gi)55958715 21.64 100 63 15 9.61 22.2 6.51 25.651 Cathepsin B CTSB gi)741376 21.61 84 43 6 5.44 17.4 5.02 24.152 C7orf24 C7orf24 gi)51105868 21.27 77 35 6 5.07 21.2 4.99 21.253 Unknown (protein for MGC 87457) FTH1 gi)42490866 21.37 137 42 11 5.12 21.4 5.02 19.0
constitutively active in androgen-independent prostate can-cer cells, probably via redox-sensitive cysteine residues [32,33]. The TXNRD1 gene contains a probable AP-1 binding site[34] that could result in AP-1 further amplifying theTXNRD1 effect on AP-1 activity. As AP-1 is known to trans-activate the AR, this could result in a much more sensitiveresponse of cells to the presence of trace quantities ofandrogen or allow for signalling cascades to occur in theabsence of androgen.
Two androgen-induced components of the OS re-sponse, PRDX6 and LTA4H, have not been previouslyreported as androgen regulated. However, they are clearlyelevated at the proteomic level following androgen treat-ment. PRDX6 has also not been associated with any can-cer, although expression of the related protein PRDX5 isknown to alter in response to androgen [35]. PRDX6 isresponsible for detoxification of specific hydroperoxides,while LTA4H catalyses the hydrolysis of leukotriene A4(LTA4) to leukotriene B4 (LTB4) and has been shown to beoverexpressed in oesophageal adenocarcinoma [36]. This isthe first report of LTA4H involvement in the androgen re-sponse of prostate cancer cells, providing a mechanism forLTB4-mediated autocrine growth stimulation of prostateepithelial cells [37].
The expression of GSS and EPHX2 has been previouslyshown to respond to androgen [35, 38] and will not be dis-cussed here. The involvement of NANS in biological pro-cesses is unclear except that it functions to synthesise sialicacids for incorporation into glycoprotein and lipopoly-saccharide molecules and as such may have a role to play inalmost all processes. However, it may be associated withmetastasis via its role in glycoprotein production thatenhances cellular adhesion to vascular endothelium [39].Increased sialic acid concentrations in the blood have alsobeen associated with cervical cancer and have been success-fully used in the monitoring of this disease [40, 41].
3.7 ER stress
Two out of the seven proteins associated with ER stressresponses (HSPB1, HYOU1, HTRA2, STIP1, TXNDC4,VCP, XRCC5) were down-regulated by androgen, although
their importance and precise roles within this context areunclear. HTRA2 is a mitochondrial serine protease contain-ing a Reaper domain, through which it may promote apop-tosis by binding to ’inhibitor of apoptosis’ proteins [42]. Thisis the first report of the involvement of this protein inandrogen signalling and prostate cancer research. XRCC5 isinvolved in DNA repair and transcriptional recycling withandrogen-dependent promoters [43]. Loss of nuclear XRCC5results from oxidative stress, indicating that the decrease inXRCC5 levels observed in this study may be due to thedocumented androgen-induced increases in reactive oxygenspecies [44].
Two of the proteins whose expression increased follow-ing androgen exposure are not well described in the litera-ture and this is the first description of their regulation byandrogen. TXNDC4 is a recently identified ER-folding assis-tant of the thioredoxin family and STIP1 is involved in coor-dination of Hsp70/90 assembly of steroid receptors.
Expression of the Hsp70-family member HYOU1 isassociated with tumour invasiveness and is up-regulated inbreast cancer [45]. Increased expression of this protein alsoenhances angiogenesis via increased secretion of VEGF [46,47]. Therefore, it is possible that this protein contributes tothe cancer phenotype, encouraging metastasis of androgen-independent prostate cancer [48].
Expression of VCP, a component of the 26S proteasomeresponsible for degradation of polyubiquitinated proteins inthe unfolded protein response, has been associated with poorprognosis, rate of recurrence and increased metastaticpotential in a variety of cancers including prostate cancer[49]. The targeting of polyubiquitinated proteins to VCP andthe proteasome is achieved via SAKS1, which, when acti-vated by phosphorylation by stress-activated protein kinases(SAPKs), can bind VCP [50]. This effectively links SAPKswith regulation of the unfolded protein response in responseto a variety of potential stimuli that may be of relevance todisease initiation and progression.
The links between signal transduction pathways and thestress response are further reinforced by the last two proteinsinvolved in stress response, HMGB1 and HSPB1. Due to theextent of their involvement in signalling, these proteins willbe discussed within the context of signal transduction.
© 2007 WILEY-VCH Verlag GmbH & Co. KGaA, Weinheim www.proteomics-journal.com
60 J. G. Rowland et al. Proteomics 2007, 7, 47–63
Figure 9. Bioinformatic classification of uniqueproteins into cellular processes. Successfullyidentified proteins were assigned to one or morecellular processes according to their annotationin the Gene Ontology database. Proteins with noannotation were assigned to the ‘Unknown pro-cess’ category. (A) Distribution of unique proteinassociations with cellular processes. (B) Cellularprocesses found to differ significantly fromtheoretically expected values as identified byhypergeometric testing.
3.8 Signal transduction
Signal transduction has been identified in this study as amajor category of proteins affected by hormonal modulationof the prostate cancer cell microenvironment. However, sig-nificant over-representation of this category of proteins was
not observed. Signal transduction cascades are organised as ahierarchy, with the primary signalling components beingpresent with low abundance. Downstream components ofsignalling cascades are often present with greater abundanceand it is the presence of these proteins within our datasetthat allow the implicit identification of changes in these sig-
© 2007 WILEY-VCH Verlag GmbH & Co. KGaA, Weinheim www.proteomics-journal.com

Proteomics 2007, 7, 47–63 Cell Biology 61
nalling cascades following treatment. Due to their lowabundance, primary signalling cascade proteins are notreadily identifiable using gel-based proteomics and thereforewould be absent in the dataset even if their expression levelsare changing. This suggests that this category of proteinsmay indeed still be significantly associated with androgentreatment.
Signal transduction pathways identified include thePI3K/Akt, p38 MAPK, JAK/STAT and, as described above,JNK/SAPK signalling cascades. In addition, the specificevents identified included, among others, Rho- and insulin-mediated signalling.
The JAK/STAT pathway is implicated by the identifica-tion of PDIA3, PARK7 and HSPB1. PDIA3 is an importantcomponent of the DNA-bound STAT3 complex [51] and wasfound to be the most differentially expressed protein in ourstudy, with an androgen-induced up-regulation of approxi-mately 12-fold. It is often overexpressed in transformed cellsand plays a role in calcium homeostasis and calcium-modu-lated apoptosis. PARK7 is also up-regulated by androgen andis known to protect against apoptosis caused by OS and ERstress, as well as having the capacity for oncogenic transfor-mation in cooperation with ras [52, 53]. It is also a bindingpartner for protein inhibitor of STAT (PIAS), positively reg-ulating AR transcriptional activity by sequestering the in-hibitory PIAS away from the AR complex [54, 55]. Thisbinding of PIAS may also allow enhanced STAT activity in asimilar manner. HSPB1 is associated with aggressive pros-tate tumours and poor prognosis. Expression has beenreported as being oestrogen inducible in breast cancer and,in prostate cancer, is associated with oestrogen receptoralpha mRNA-positive tumours in patients with hormone-refractory disease [56, 57]. However, as oestrogen was notpresent in our experimental setup, it is likely that expressionof this protein is a secondary response to the presence ofhormone. This may be achieved via STAT signalling, asHSPB1 has been shown to be up-regulated by a con-stitutively active STAT3 [58]. The identification of HSPB1also has implications for the activity of the PI3K/Akt signal-ling pathway, as HSPB1 can bind to and activate Akt, leadingto enhanced cellular survival, while phosphorylated HSPB1does not bind Akt and leads to enhanced rates of apoptosis.Elevated expression of HSPB1 may result in decreased che-motherapeutic efficacy due to its involvement in detoxifica-tion of reactive oxygen species.
The increased activity of Rho signalling following andro-gen ablation is implicit in the reduced levels of the GTPase-activating protein, ARHGAP1. In this study we have alsoshown that levels of PAK2 are reduced in response to andro-gen and this protein is, therefore, present in greater quan-tities in the absence of androgen. This may be biologicallysignificant as PAK2 is known to be activated by the Rhofamily and has been shown to play an important role inbreast cancer [59]. A mechanism could be rationalised basedon the activity of PAK2, its known interacting partners andtheir effects on cellular apoptotic potential. Activated PAK2
has been shown to phosphorylate and thereby inhibit Myc, atranscriptional regulator central to cellular processes such asgrowth and proliferation, resulting in the loss of ability toundergo apoptosis in response to serum withdrawal [60].Assuming that activity of PAK2 correlates with its expressionlevel, the absence of androgen would result in increasedPAK2 activity and the subsequent inhibition of Myc, allow-ing the cells to survive androgen deprivation by blockingentry to apoptosis. Further work, based on assays of cellsoverexpressing PAK2, is required to demonstrate whetheraltered PAK2 expression levels correlate with changes in ac-tivity in this system.
Signalling via advanced glycation end product-specificreceptor (AGER) due to HMGB1 is another event that maybe of great importance to prostate cancer research. This sig-nalling pathway has been associated with tumour growthand metastasis [61–63] and the identification by us ofrepression of the ligand, HMGB1, by androgen in LNCaPcells is in agreement with clinical evaluations of receptor-ligand status in patient material [62, 64]. It is important tonote that activation of AGER leads to development of neuriteoutgrowths, a feature characteristic of neuroendocrine cells,paralleled in vitro by the documented development of a neu-roendocrine phenotype in LNCaP cells in steroid-deprivedsera. The differentiation of LNCaP cells in response to ster-oid-deprivation is also evident from increased expression ofthe neuroendocrine marker, ENO2, identified in our study.The ability of AGER-HMGB1 to directly modulate multiplefeatures of prostate cancer progression to metastatic andhormone-refractory disease indicates that this may be avaluable target for the development of novel therapeuticagents, and a detailed dissection of the downstream signal-ling cascade may yield further information pertinent toprostate cancer management.
Signalling mediated by neuropeptides is also affected byhormonal modulation in LNCaP cells. The proteins IDE,XPNPEP1 and NLN have all been implicated in bioactivepeptide processing, a process associated with neuroendo-crine-type signalling. The identification of IDE, known to bean accessory factor for both AR and glucocorticoid receptor,provides a potential means of facilitating cross-talk betweeninsulin or bioactive peptide signalling and other signallingcascades of relevance to prostate cancer. It should also benoted here that FASN, while not directly involved in thissignalling system, contains an insulin-response elementwithin its gene [65]. This may allow insulin signalling tomodulate the activity of the HER2 oncogene via FASNexpression levels [66].
3.9 Other processes
Additional proteins identified in this study include TRIM28,PPP2R2A, RPSA, VCL, FKBP8 and PDCD6IP with rolesincluding adhesion and apoptosis. TRIM28 is a transcrip-tional co-repressor and has been reported to be present incomplex with the tumour suppressor VHL and may be
© 2007 WILEY-VCH Verlag GmbH & Co. KGaA, Weinheim www.proteomics-journal.com

62 J. G. Rowland et al. Proteomics 2007, 7, 47–63
involved in transcriptional repression of HIF1A, expressionof which has been found to correlate with prostate cancerdisease occurrence and severity [67, 68]. The down-regula-tion of TRIM28 by androgen identified in this study supportsthe involvement of this process in prostate cancer. PPP2R2Ais involved in regulation of many cellular processes and dis-plays tumour suppressor activity [69, 70]. The precise func-tion of this protein in the context of prostate cancer thereforerequires further characterisation. VCL and RPSA play rolesin cellular adhesion, with up-regulation of RPSA correlatingwith the invasive and metastatic phenotype of colorectal andlung cancer [71, 72]. The finding that both these proteins arealso positively androgen responsive suggests they mayrepresent potential prognostic or therapeutic targets formetastatic disease [73, 74]. Both FKBP8 and PDCD6IP werefound to be down-regulated by androgen in LNCaP cells.Both these proteins are linked to apoptosis as potentialnegative regulators. FKBP8 functions by binding to and reg-ulating phosphorylation of Bcl-2 at the mitochondrial mem-brane [75]. Overexpression of PDCD6IP has been found inmice to block apoptosis [76]. These two proteins may there-fore function to prevent apoptotic death of LNCaP cells dur-ing androgen ablation, when expression levels are compara-tively high.
4 Concluding remarks
In this study we have successfully identified numerouscomponents of the androgen response program in prostatecancer cells. Identification of known components demon-strates the validity of this approach and has revealed manyadditional components not previously identified. Thesenovel components may have application in the developmentof novel therapeutic agents for the treatment of advanced andhormone-refractory prostate cancer and will thereforerequire further characterisation.
Using advantages available with DIGE technology andmultiple biological replicates we have been able to performan in depth, comprehensive study adding significantly to theknowledgebase of components of the androgen responseprogram in LNCaP cells.
Utilising a bioinformatics approach, we have also high-lighted the involvement of a number of cellular processes inthe androgen response, potentially providing additionalavenues for drug development by targeting proteins withinthese processes that are more amenable to pharmaceuticalintervention. Analysis of the cellular processes associatedwith differentially expressed proteins has highlighted theimportance of metabolic processes, particularly energy pro-duction, and processes involved in signalling and neurogen-esis in the molecular response to androgen and androgen-ablation.
This study has clearly demonstrated the ability of gel-based proteomics investigations to identify multiple factorscontributing to the ultimate functional cellular state. 2-D
DIGE may be complemented by non-gel-based techniquesthat have proved to be exceptionally valuable for the analysisof large numbers of samples [77, 78]. Taken together withother published data, our results may have significantimplications for disease management, and we speculate thatandrogen ablation may be directly responsible for the devel-opment of more aggressive disease.
Clearly, new potential targets have been revealed asandrogen-responsive elements that could be potential candi-dates for the development of new strategies for prostate can-cer disease management.
This work was funded by the Harker Foundation, NewcastleUniversity and a pump-priming award from the ProMPT Group.
5 References
[1] Greenlee, R., Murray, T., Bolden, S., Wingo, P., CA Cancer J.Clin. 2000. 50, 7–33.
[2] Shibata, A., Ma, J., Whittemore, A., J. Natl. Cancer Inst. 1998.90, 1230–1231.
[3] Denmeade, S. R., Lin, X. S., Isaacs, J. T., Prostate 1996. 28,251–265.
[4] Ernst, T., Hergenhahn, M., Kenzelmann, M., Cohen, C. D. etal., Am. J. Pathol. 2002. 160, 2169–2180.
[5] Chaib, H., Cockrell, E. K., Rubin, M. A., Macoska, J. A., Neo-plasia 2001. 3, 43–52.
[6] Balaji, K. C., Rao, P. S., Smith, D. J., Louis, S. et al., Urol.Oncol. 2004. 22, 313–320.
[7] Vaarala, M. H., Porvari, K., Kyllonen, A., Vihko, P., Lab. Invest.2000. 80, 1259–1268.
[8] Anderson, L., Seilhamer, J., Electrophoresis 1997. 18, 533–537.
[9] Haynes, P. A., Gygi, S. P., Figeys, D., Aebersold, R., Electro-phoresis 1998. 19, 1862–1871.
[10] Gygi, S. P., Rist, B., Gerber, S. A., Turecek, F. et al., Nat. Bio-technol. 1999. 17, 994–999.
[11] Gygi, S. P., Rochon, Y., Franza, B. R., Aebersold, R., Mol. Cell.Biol. 1999. 19, 1720–1730.
[12] Pennington, S. R., Dunn, M. J., The Role of Proteomics inMeeting the Post-Genome Challenge in Proteomics: FromProtein Sequence to Function. BIOS Scientific PublishersLtd. Oxford, UK 2001 pp. xvii–xxii.
[13] Tonge, R., Shaw, J., Middleton, B., Rowlinson, R. et al., Pro-teomics 2001. 1, 377–396.
[14] Nelson, W. G., De Marzo, A. M., Deweese, T. L., Lin, X. et al.,Ann. N. Y. Acad. Sci. 2001. 952, 135–144.
[15] Meehan, K. L., Holland, J. W., Dawkins, H. J., Prostate 2002.50, 54–63.
[16] Ahram, M., Best, C. J., Flaig, M. J., Gillespie, J. W. et al., Mol.Carcinog 2002. 33, 9–15.
[17] Alaiya, A. A., Oppermann, M., Langridge, J., Roblick, U. etal., Cell. Mol. Life Sci. 2001. 58, 307–311.
[18] Waghray, A., Feroze, F., Schober, M. S., Yao, F. et al., Prote-omics 2001. 1, 1327–1338.
© 2007 WILEY-VCH Verlag GmbH & Co. KGaA, Weinheim www.proteomics-journal.com
Proteomics 2007, 7, 47–63 Cell Biology 63
[19] Ornstein, D. K., Gillespie, J. W., Paweletz, C. P., Duray, P. H. etal., Electrophoresis 2000. 21, 2235–2242.
[20] Gamble, S. C., Odontiadis, M., Waxman, J., Westbrook, J. A.et al., Oncogene 2004. 23, 2996–3004.
[21] Horoszewicz, J. S., Leong, S. S., Kawinski, E., Karr, J. P. et al.,Cancer Res. 1983. 43, 1809–1818.
[22] Ramagli, L. S., Capetillo, S., Becker, F. F., Rodriguez, L. V.,Carcinogenesis 1985. 6, 367–375.
[23] Chivasa, S., Ndimba, B., Simon, J., Robertson, D. et al.,Electrophoresis 2002. 23, 1754–1765.
[24] Vorm, O., Roepstorff, P., Biol. Mass Spectrom. 1994. 23, 734–740.
[25] Pappin, D. J., Hojrup, P., Bleasby, A. J., Curr. Biol. 1993. 3,327–332.
[26] Ashburner, M., Ball, C. A., Blake, J. A., Botstein, D. et al., Nat.Genet 2000. 25, 25–29.
[27] Wolf, D. A., Schulz, P., Fittler, F., Mol. Endocrinol. 1992. 6,753–762.
[28] Nelson, P. S., Han, D., Rochon, Y., Corthals, G. L. et al., Elec-trophoresis 2000. 21, 1823–1831.
[29] Sikka, S. C., Curr. Med. Chem. 2003. 10, 2679–2692.
[30] Chen, J. Z., Kadlubar, F. F., J. Environ. Sci. Health C Environ.Carcinog. Ecotoxicol. Rev. 2004. 22, 1–12.
[31] Pathak, S. K., Sharma, R. A., Steward, W. P., Mellon, J. K. etal., Eur. J. Cancer 2005. 41, 61–70.
[32] Zerbini, L. F., Wang, Y., Cho, J. Y., Libermann, T. A., CancerRes. 2003. 63, 2206–2215.
[33] Karimpour, S., Lou, J., Lin, L. L., Rene, L. M. et al., Oncogene2002. 21, 6317–6327.
[34] Osborne, S. A., Tonissen, K. F., BMC Genomics 2001. 2, 10.
[35] Tam, N. N., Gao, Y., Leung, Y. K., Ho, S. M., Am. J. Pathol.2003. 163, 2513–2522.
[36] Chen, X., Li, N., Wang, S., Wu, N. et al., J. Natl. Cancer Inst.2003. 95, 1053–1061.
[37] Chen, X., Wang, S., Wu, N., Yang, C. S., Curr. Cancer DrugTargets 2004. 4, 267–283.
[38] Pang, S. T., Dillner, K., Wu, X., Pousette, A. et al., Endocri-nology 2002. 143, 4897–4906.
[39] Fieger, C. B., Emig-Vollmer, S., Petri, T., Grafe, M. et al., Bio-chim. Biophys. Acta 2001. 1524, 75–85.
[40] Patel, P. S., Rawal, G. N., Balar, D. B., Gynecol. Oncol. 1993.50, 294–299.
[41] Lagana, A., Martinez, B. P., Marino, A., Fago, G., Bizzarri, M.,Anticancer Res. 1995. 15, 2341–2346.
[42] Martins, L. M., Iaccarino, I., Tenev, T., Gschmeissner, S. et al.,J. Biol. Chem. 2002. 277, 439–444.
[43] Mayeur, G. L., Kung, W. J., Martinez, A., Izumiya, C. et al., J.Biol. Chem. 2005. 280, 10827–10833.
[44] Song, J. Y., Lim, J. W., Kim, H., Morio, T., Kim, K. H., J. Biol.Chem. 2003. 278, 36676–36687.
[45] Tsukamoto, Y., Kuwabara, K., Hirota, S., Kawano, K. et al.,Lab. Invest. 1998. 78, 699–706.
[46] Ozawa, K., Kondo, T., Hori, O., Kitao, Y. et al., J. Clin. Invest.2001. 108, 41–50.
[47] Ozawa, K., Tsukamoto, Y., Hori, O., Kitao, Y. et al., CancerRes. 2001. 61, 4206–4213.
[48] Miyagi, T., Hori, O., Koshida, K., Egawa, M. et al., Int. J. Urol.2002. 9, 577–585.
[49] Tsujimoto, Y., Tomita, Y., Hoshida, Y., Kono, T. et al., Clin.Cancer Res. 2004. 10, 3007–3012.
[50] McNeill, H., Knebel, A., Arthur, J. S., Cuenda, A., Cohen, P.,Biochem. J. 2004. 384, 391–400.
[51] Eufemi, M., Coppari, S., Altieri, F., Grillo, C. et al., Biochem.Biophys. Res. Commun. 2004. 323, 1306–1312.
[52] Nagakubo, D., Taira, T., Kitaura, H., Ikeda, M. et al., Biochem.Biophys. Res. Commun. 1997. 231, 509–513.
[53] Ooe, H., Taira, T., Iguchi-Ariga, S. M., Ariga, H., Toxicol. Sci.2005. 88, 114–126.
[54] Takahashi, K., Taira, T., Niki, T., Seino, C. et al., J. Biol. Chem.2001. 276, 37556–37563.
[55] Niki, T., Takahashi-Niki, K., Taira, T., Iguchi-Ariga, S. M.,Ariga, H., Mol. Cancer Res. 2003. 1, 247–261.
[56] Bonkhoff, H., Fixemer, T., Hunsicker, I., Remberger, K., Pros-tate 2000. 45, 36–41.
[57] Rocchi, P., So, A., Kojima, S., Signaevsky, M. et al., CancerRes. 2004. 64, 6595–6602.
[58] Song, H., Ethier, S. P., Dziubinski, M. L., Lin, J., Biochem.Biophys. Res. Commun. 2004. 314, 143–150.
[59] Stofega, M. R., Sanders, L. C., Gardiner, E. M., Bokoch, G. M.,Mol. Biol. Cell 2004. 15, 2965–2977.
[60] Huang, Z., Traugh, J. A., Bishop, J. M., Mol. Cell. Biol. 2004.24, 1582–1594.
[61] Taguchi, A., Blood, D. C., del Toro, G., Canet, A. et al., Nature2000. 405, 354–360.
[62] Ishiguro, H., Nakaigawa, N., Miyoshi, Y., Fujinami, K. et al.,Prostate 2005. 64, 92–100.
[63] Sasahira, T., Akama, Y., Fujii, K., Kuniyasu, H., VirchowsArch. 2005. 446, 411–415.
[64] Kuniyasu, H., Chihara, Y., Takahashi, T., Oncol. Rep. 2003. 10,445–448.
[65] Moustaid, N., Beyer, R. S., Sul, H. S., J. Biol. Chem. 1994.269, 5629–5634.
[66] Menendez, J. A., Vellon, L., Mehmi, I., Oza, B. P. et al., Proc.Natl. Acad. Sci. USA 2004. 101, 10715–10720.
[67] Li, Z., Wang, D., Na, X., Schoen, S. R. et al., EMBO J. 2003. 22,1857–1867.
[68] Hao, P., Chen, X., Geng, H., Gu, L. et al., J. Huazhong Univ.Sci. Technol. Med. Sci. 2004. 24, 593–595.
[69] Janssens, V., Goris, J., Van Hoof, C., Curr. Opin. Genet. Dev.2005. 15, 34–41.
[70] Zolnierowicz, S., Bollen, M., EMBO J. 2000. 19, 483–488.
[71] Stallmach, A., Orzechowski, H. D., Feldmann, P., Riecken, E.O. et al., Am. J. Gastroenterol. 1999. 94, 3341–3347.
[72] Fontanini, G., Vignati, S., Chine, S., Lucchi, M. et al., Clin.Cancer Res. 1997. 3, 227–231.
[73] Waltregny, D., de Leval, L., Menard, S., de Leval, J., Cas-tronovo, V., J. Natl. Cancer Inst. 1997. 89, 1224–1227.
[74] Waltregny, D., de Leval, L., Coppens, L., Youssef, E. et al.,Eur. Urol. 2001. 40, 495–503.
[75] Kang, C. B., Tai, J., Chia, J., Yoon, H. S., FEBS Lett. 2005. 579,1469–1476.
[76] Chatellard-Causse, C., Blot, B., Cristina, N., Torch, S. et al., J.Biol. Chem. 2002. 277, 29108–29115.
[77] Wright, M. E., Eng, J., Sherman, J., Hockenbery, D. M. et al.,Genome Biol. 2003. 5, R4.
[78] Martin, D. B., Gifford, D. R., Wright, M. E., Keller, A. et al.,Cancer Res. 2004. 64, 347–355.
© 2007 WILEY-VCH Verlag GmbH & Co. KGaA, Weinheim www.proteomics-journal.com