Who is Hispanic? Hispanic Identity among African Americans, Asian Americans, Others, and Whites
Upload
independentCategory
view
0download
0
Litman et al: Serum androgen levels in Black, Hispanic and White men
Page 1 of 39
Date: August 3, 2006
Serum androgen levels in Black, Hispanic and White men
Heather J. Litman1, Shalender Bhasin
2, Carol L. Link
1, Andre B. Araujo
1, John B.
McKinlay1 for the BACH Survey Investigators
1New England Research Institutes, Watertown, MA
2Section of Endocrinology, Diabetes, and Nutrition, Boston University, School of
Medicine, Boston Medical Center
HL, CL, AA and JM have nothing to declare. SB is receiving grant support from Solvay.
This is an un-copyedited author manuscript copyrighted by The Endocrine Society. This
may not be duplicated or reproduced, other than for personal use or within the rule of
“Fair Use of Copyrighted Materials” (section 107, Title 17, U.S. Code) without
permission of the copyright owner, The Endocrine Society. From the time of acceptance
following peer review, the full text of this manuscript is made freely available by The
Endocrine Society at http://www.endojournals.org/. The final copy edited article can be
found at http://www.endojournals.org/. The Endocrine Society disclaims any
responsibility or liability for errors or omissions in this version of the manuscript or in
any version derived from it by the National Institutes of Health or other parties. The
citation of this article must include the following information: author(s), article title,
journal title, year of publication and DOI.
Word count: 3699 words
Number of references, tables, figures: 61 references, 6 tables, 1 figure
Abbreviated title: Serum androgen levels in Black, Hispanic and White men
Key words: testosterone, bioavailable testosterone, dihydrotestosterone (DHT), sex
hormone-binding globulin (SHBG), dehydroepiandrosterone sulfate (DHEAS), prostate
cancer, bone loss
J Clin Endocrin Metab. First published ahead of print August 15, 2006 as doi:10.1210/jc.2006-0037
Copyright (C) 2006 by The Endocrine Society
Litman et al: Serum androgen levels in Black, Hispanic and White men
Page 2 of 39
Correspondence and requests for reprints should be addressed to:
Heather J. Litman
Research Scientist
New England Research Institutes
9 Galen Street
Watertown, MA 02472
Phone: 617 923 7747 x297
Fax: 617 926 8246
Email: [email protected]
Abstract
Context: Racial/ethnic differences in androgen levels could account for differences in
prostate cancer risk, body composition, and bone loss.
Objective: To investigate racial/ethnic variations in testosterone, bioavailable
testosterone, dihydrotestosterone (DHT), sex hormone-binding globulin (SHBG) and
dehydroepiandrosterone sulfate (DHEAS) levels.
Design: The Boston Area Community Health (BACH) Survey was a multistage stratified
cluster random sample, recruiting from 2002-2005.
Setting: Community-based sample of Boston.
Participants: Black, Hispanic or White, aged 30-79 years, competent to sign informed
consent and literate in English/Spanish. Of 2301 men recruited, 1899 provided blood
samples (538 Black, 651 Hispanic, 710 White).
Intervention: Data obtained during in-person at-home interview, conducted by bilingual
phlebotomist/interviewer.
Main Outcome Measure(s): Testosterone, bioavailable testosterone, DHT,
DHT/testosterone ratio, SHBG, DHEAS.

Litman et al: Serum androgen levels in Black, Hispanic and White men
Page 3 of 39
Results: With or without adjustment for covariates, there were no significant differences
in testosterone, bioavailable testosterone or SHBG levels by race/ethnicity. DHEAS
levels differed by race/ethnicity before covariate adjustment; after adjustment this
difference was attenuated. Before adjustment, DHT and DHT/testosterone ratios did not
significantly differ by racial/ethnic group. After adjustment, there was evidence of
racial/ethnic differences in DHT (p = 0.047) and DHT/testosterone (p = 0.038) levels;
Black men had higher DHT levels and DHT/testosterone ratios than White and Hispanic
men.
Conclusions: As there are no racial/ethnic differences in testosterone levels, normative
ranges need not be adjusted by race/ethnicity for androgen deficiency diagnosis for men
aged 30-79. Further investigation is needed to determine whether differences in DHT
levels and DHT/testosterone ratio can help explain racial/ethnic variations in prostate
cancer incidence, body composition, and bone mass.
Introduction
Although racial/ethnic differences in circulating total testosterone (T) levels have been
examined previously (1-9) the results of the published studies are not in agreement. Some
studies reported higher unadjusted testosterone levels among Blacks than Whites (3, 4, 8,
9); others found no differences in circulating (1, 2, 6, 7) or tissue (5) total testosterone
concentrations. Some studies (1, 2, 5, 6) reported no racial/ethnic differences in 5-α-
dihydrotestosterone (DHT) and one study (9) found statistically significantly higher DHT
levels in Blacks compared to Whites. Most studies included relatively older men (average
age > 50 years). A study of young men reported higher unadjusted total testosterone

Litman et al: Serum androgen levels in Black, Hispanic and White men
Page 4 of 39
levels in Blacks compared to Whites (4); however, after adjusting for waist
circumference, there were no significant racial/ethnic differences. Most studies (1, 2, 5-
8), with some exceptions (3, 4) included small numbers of Blacks and none had
significant representation of Hispanics.
Racial/ethnic differences in androgen levels could have clinical implications for
the diagnosis of androgen deficiency syndromes, and for explaining racial/ethnic
differences in the prevalence of clinical prostate cancer, body composition and bone loss
in men. We do not know whether normative ranges for testosterone levels, crucial for
making the diagnosis of androgen deficiency in men, should be adjusted for
race/ethnicity. Androgens, particularly testosterone and DHT (10, 11), regulate prostate
epithelial growth and promote growth of metastatic prostate cancer. Prostate cancer is the
most prevalent cancer among men living in the United States (12) and a significant
contributor to morbidity and mortality in older men (13, 14). Even after adjustment for
age, the incidence rate of prostate cancer among Blacks is 1.5 times higher than among
Whites and over two times higher than among Hispanics (6, 14). Differences in
testosterone and/or DHT levels have been hypothesized to explain racial/ethnic
differences in androgen-related disorders (15, 16). Androgens are also important
determinants of body composition and skeletal mass; racial/ethnic differences in
androgen levels may help explain the observed differences in body composition (17)
including higher muscle mass and strength (18), bone mineral density (19) and lower
rates of age-related bone loss (20) and fracture incidence (18, 21-35) in Blacks compared
to other racial/ethnic groups.
Litman et al: Serum androgen levels in Black, Hispanic and White men
Page 5 of 39
The Boston Area Community Health (BACH) Survey of community dwelling
adult men allowed us to investigate racial/ethnic variations in testosterone and
dehydroepiandrosterone sulfate (DHEAS) levels, the two most abundant androgens in
circulation and DHT, a metabolite of testosterone that is formed by the action of steroid
5-α-reductase. As differences in body composition, particularly body mass index, could
affect SHBG levels and thereby influence total testosterone levels, we also measured
SHBG levels (10). Bioavailable testosterone levels were calculated; they provide an
SHBG-independent measure of circulating testosterone. The ratio of DHT to testosterone
was also investigated, as it provides an indirect measure of steroid 5-α-reductase activity
(9).
In contrast to previous studies, the BACH Survey included men over a wide age
range (13) with approximately equal numbers of Blacks, Whites and Hispanics, the three
major racial/ethnic groups in the United States. As circulating androgen concentrations
are affected significantly by anthropometric measures, age and comorbid conditions, we
included these covariates in the analyses.
Methods
The protocols and informed consent procedures were approved by NERI’s Institutional
Review Board. All participants provided written, informed consent.
Overall Design
The BACH Survey is a population-based epidemiologic survey of a broad range of
urologic symptoms among randomly chosen people. Individuals from selected census
Litman et al: Serum androgen levels in Black, Hispanic and White men
Page 6 of 39
blocks were chosen to achieve the goal of approximately equal numbers of Black, White,
and Hispanic men and women in four age categories: 30-39, 40-49, 50-59, and 60-79
years. Sampling proceeded in five batches, each a random sub-sample of the overall
BACH Survey. Eligibility rules varied by batch and were randomly assigned to selected
households based on household demographics at the start of each batch. BACH
eligibility criteria included: screened eligible from selected household, competent to sign
informed consent, and able to speak English or Spanish well enough to complete the
survey. The BACH sample (n=5506) was recruited from April 2002 through June 2005;
this manuscript considers men only. Because of design requirements, the BACH subjects
had unequal probabilities of selection into the study. To be representative of the city of
Boston, observations were weighted inversely proportional to their probability of
selection into the study (36).
Data Collection
Data were obtained during a 2-hour interview, conducted by a bilingual
phlebotomist/interviewer, generally in the subject’s home (37). Following written
informed consent, a venous blood sample (20 ml) and height, weight, hip and waist
circumference were measured, along with self reported information on medical and
reproductive history, major comorbidities, prescription and over-the-counter medications,
lifestyles, psychosocial factors, medical care utilization and symptoms of urogynecologic
conditions. Blood samples were collected close to waking time (median time since
awakening 3 hours 38 minutes).
Race/Ethnicity

Litman et al: Serum androgen levels in Black, Hispanic and White men
Page 7 of 39
Race/ethnicity involved a two step self identification process. Each subject was first
asked: “Do you consider yourself to be Spanish, Hispanic or Latino?” If the respondent
answered “yes”, they were asked to specify their Hispanic origin. Subjects were then
asked “What race do you consider yourself to be?” with the option of choosing any or all
of the following categories: American Indian/Alaska Native, Asian, Black/African
American, Native Hawaiian/other Pacific Islander, White/Caucasian or other. Men were
categorized as Hispanic if they responded “yes” to the Hispanic question. Non-Hispanic
respondents were categorized as Black if they stated they were Black/African American,
regardless of whether they checked more than one race. Men were classified as White if
they stated they were White/Caucasian provided they were not already classified as
Hispanic or Black.
Hormones
Testosterone, SHBG and DHEAS levels were measured by competitive
electrochemiluminescence immunoassays on the 2010 Elecsys system (Roche
Diagnostics, Indianapolis, IN); DHT was measured by a radioimmunometric assay
(Diagnostic Systems Laboratories, Webster, TX). All assays were approved previously
by the Food and Drug Administration for clinical use. The lower limits of detection for
testosterone, DHT, SHBG and DHEAS assays were 2 ng/dL (0.07 nmol/L), 0.4 ng/dL
(0.014 nmol/L), 3 nmol/L and 0.001 ug/mL (0.0027 umol/L), respectively. The inter-
assay coefficients of variation (CV) for testosterone at concentrations of 24 (0.83), 275
(9.54) and 701 (24.31) ng/dL (nmol/L) were 7.4, 2.2 and 1.7%, respectively; intra-assay
CVs were 4.6, 1.4 and 1.1% at the same concentrations. The inter-assay CVs for DHT at

Litman et al: Serum androgen levels in Black, Hispanic and White men
Page 8 of 39
concentrations 10.6 (0.37), 31.1 (1.08) and 71.1 (2.47) ng/dL (nmol/L) were 8.5, 2.3 and
8.4%, respectively; intra-assay CVs were 6.2, 4.5 and 3.1% at concentrations 9.7 (0.34),
29.0 (1.00), 68.5 (2.38) ng/dL (nmol/L). The cross-reactivity of testosterone and DHEA
in the DHT assay were 0.02% and non-detectable, respectively. To establish accuracy,
known amounts of DHT, ranging from 23 to 85 ng/dL were added to charcoal-stripped
plasma; the recovery ranged from 90% to 117% (mean 105%). At 25, 64 and 95 nmol/L,
inter-assay CVs were 2.4, 2.2 and 2.7%; at 14, 44 and 204 nmol/L, intra-assay CVs were
2.1, 2.4 and 2.7% for SHBG. For DHEAS, at 117 (3.18), 395 (10.72) and 984 (26.71)
ug/dL (umol/L), inter-assay CVs were 3.6, 4.7 and 2.4%; at the same concentrations,
intra-assay CVs were 2.8, 2.4 and 1.7%.
Bioavailable testosterone was calculated from total testosterone and SHBG
concentrations using published equations (38) assuming an albumin concentration of 4.3
g/dL, association constants of SHBG for T 1.0 x 10⁹ /mol and of albumin for T 3.6 x 10
4
/mol (39). Calculated free testosterone was not considered because it is a linear function
of calculated bioavailable testosterone; thus, linear models on free testosterone will
produce identical results to those on bioavailable testosterone.
Covariates
Categorical covariates included body mass index (BMI) defined as measured weight in
kilograms divided by measured height in meters squared categorized as <25 (reference),
25-29, 30 + kg/m2; waist-to-hip ratio (WHR) calculated as the ratio of waist to hip
measurements, divided into quartiles; smoking status: current, previous, never
(reference); alcohol (including beer, wine and hard liquor) consumed per day (none
Litman et al: Serum androgen levels in Black, Hispanic and White men
Page 9 of 39
(reference), <1, 1-2, 3 or more drinks per day); comorbidities including diabetes, cancer,
heart conditions, high cholesterol, high blood pressure, vascular conditions, prior urinary
tract infections, asthma, and arthritis; and depressive symptoms based on reporting five or
more symptoms on the abbreviated CES-D scale (40).
Continuous covariates included age (years), physical activity as measured by the
Physical Activity Scale for the Elderly (PASE) (41) and the physical and mental health
component scores (PCS12, MCS12) based on the SF-12 quality of life assessment (42).
The SF-12 consisted of questions regarding physical and mental health; the PCS12 was
constructed by weighting physical health questions higher and conversely for the MCS12
scale. Also considered was socioeconomic status (SES), created as a function of
standardized income and education variables for the Northeast region (43). Because of
the diurnal variation in hormone values, analyses controlled for the number of hours
between waking and subjects’ blood draws.
Statistical Analysis
Hormone variables were log-base 10 transformed because their distributions were
skewed. The median and the interquartile range (IQR) were calculated; means are also
presented. Seven men with low testosterone, <20 ng/dL (0.69 nmol/L), and low DHT,
<6.0 ng/dL (0.21 nmol/L), values were excluded from the analyses; all reported having
cancer (prostate cancer (4), testicular cancer (1), colon cancer and prostate surgery (1),
skin cancer (1)). Another man with a testosterone value of 3710 ng/dL (128.64 nmol/L)
and an undetectable luteinizing hormone value as well as two men with DHT values
greater than 500 ng/dL (17.34 nmol/L) were also excluded. Results were similar with and
Litman et al: Serum androgen levels in Black, Hispanic and White men
Page 10 of 39
without the ten extreme values (not presented). Weighted analyses were conducted in
SAS/SUDAAN (44) and plots on the log scale were created using S-PLUS (45). A
multiple imputation technique was used to impute missing covariate values (46). The
largest amount of missingness was in reporting socioeconomic status (SES), which was
missing for 102 (5%) of the 1899 men.
The testosterone, bioavailable testosterone, DHT, DHT:testosterone ratio, SHBG
and DHEAS values were treated as dependent variables and modeled adjusting for age
using multivariate linear regression. Because observations in the BACH Survey must be
weighted inversely proportional to the probability of selection, a standard forward
selection procedure (as in SAS) was not available. The following manual forward
selection procedure was followed using SUDAAN. First, the relationship between each
covariate and the hormone considered was found (Tables 2, 3). Variables with individual
p-values less than 0.5 were considered as possible covariates for the final model. In order
of significance level based on Wald F tests for each covariate (smallest p-value first),
models with an increasing number of covariates were fit until only covariates with Wald
F test p < 0.05 adjusting for the other variables were kept; this was deemed the
“parsimonious model”. Age and hours blood taken from awakening were left in all
multivariate models regardless of significance level. This technique does not account for
multiple comparisons. Residual plots were constructed to check appropriate model fit; in
addition, continuous covariates were considered as categorical ones with varying
categories to assess the sensitivity of test statistics.
Results

Litman et al: Serum androgen levels in Black, Hispanic and White men
Page 11 of 39
In total 5506 people (2301 men, 3205 women) aged 30-79 were recruited to the BACH
Survey. We consider only men; 1899 provided blood samples, including 538 (28%)
Blacks, 651 (34%) Hispanics and 710 (38%) Whites. The distribution of age was nearly
equivalent with 511 (27%) aged 30-39 (127 Black, 209 Hispanic, 175 White), 555 (29%)
aged 40-49 (174 Black, 195 Hispanic, 186 White), 437 (23%) aged 50-59 (130 Black,
139 Hispanic, 168 White) and 396 (21%) aged 60-79 (107 Black, 108 Hispanic, 181
White). Testosterone, SHBG and DHEAS levels were obtained for 1892 participants;
DHT levels were obtained for 1891. One testosterone, three DHT and two SHBG and
DHEAS values were not calculated due to insufficient serum quantity. After also deleting
the ten aforementioned outliers, analyses for testosterone involved 1881, for DHT 1878
and for SHBG and DHEAS 1880 participants.
The distributions of covariates such as age, PCS12, SES, WHR, smoking status
and drinks per day differed significantly by racial/ethnic group (Table 1). Serum total
testosterone levels were highly correlated with SHBG, bioavailable testosterone and DHT
levels (Table 2). Bioavailable testosterone levels were not correlated significantly with
SHBG, consistent with the notion that bioavailable testosterone provides an SHBG-
independent measure of circulating testosterone. These correlations remained similar
when considered by racial/ethnic group (not presented). Correlations between continuous
covariates and hormone levels are presented in Table 2 and univariate relationships
between categorical covariates and hormone levels in Table 3.
Unadjusted testosterone values did not vary by racial/ethnic group (Table 4);
testosterone values across age also did not vary by racial/ethnic group (Figure 1a). These

Litman et al: Serum androgen levels in Black, Hispanic and White men
Page 12 of 39
findings were confirmed by a linear regression analysis where the p-value for the
racial/ethnic difference was 0.942 after adjusting for age. The most parsimonious model
to describe testosterone levels included age, BMI, WHR, smoking status, PCS12 and
hours blood taken from awakening. After covariate adjustment, BMI and WHR had
inverse relationships with testosterone levels while smoking and PCS12 were positively
related to testosterone. In the adjusted model, no significant difference in testosterone
levels by race/ethnicity was found (p = 0.900).
Bioavailable testosterone levels did not differ significantly across racial/ethnic
groups in unadjusted analysis (Table 4) or across age (Figure 1b); the linear regression
model accounting only for age (p = 0.992) confirms this. In a multivariate model to
describe bioavailable testosterone levels including age, BMI, PCS12, smoking status,
SES and hours blood taken from awakening, bioavailable testosterone levels did not
differ by race/ethnicity (p = 0.543). Controlling for other variables, age and BMI were
associated with lower bioavailable testosterone levels, while PCS12, smoking status and
higher SES were associated with higher bioavailable testosterone levels.
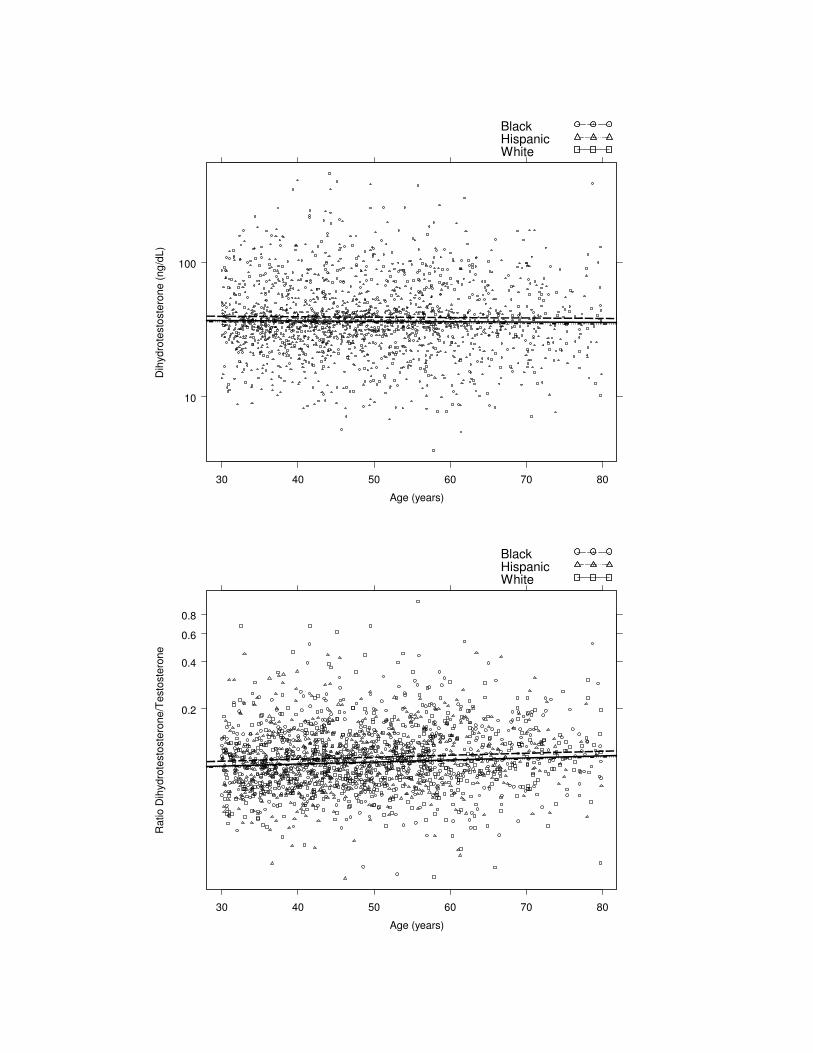
Although unadjusted analysis (Table 4) and a linear regression model adjusting
for age did not find differences in DHT levels by racial/ethnic group (p = 0.119) (Figure
1c), after adjusting additionally for BMI and hours blood taken from awakening (Table
5), the racial/ethnic differences were statistically significant (p = 0.047). Blacks had
significantly higher DHT levels compared to Hispanics (p = 0.034) and Whites (p =
0.031); DHT levels for Hispanics and Whites did not differ (p = 0.829). Based on the
multivariate model, the mean DHT level of a 40 year old Black whose blood was drawn

Litman et al: Serum androgen levels in Black, Hispanic and White men
Page 13 of 39
two hours from awakening with BMI < 25 kg/m2
would be approximately 51.2 ng/dL
(1.78 nmol/L) whereas the level for a White would be 46.7 ng/dL (1.62 nmol/L) and for a
Hispanic 46.2 ng/dL (1.60 nmol/L). Yusuf et al. (47) has suggested WHR rather than
BMI as a better measure of adiposity (regarding myocardial infarction risk). The
race/ethnicity coefficients comparing models with BMI and/or WHR are presented in
Table 6. When considering both BMI and WHR as covariates, BMI was found to be more
predictive of DHT levels.
In unadjusted analysis, a marginal racial/ethnic difference in DHT:testosterone
ratio was found (Table 4 where p = 0.051) and a small difference in the ratio by
race/ethnicity was seen (Figure 1d). Adjusting only for age, there was marginal evidence
of a relationship between racial/ethnic group and DHT:testosterone levels (p = 0.077).
The best model to describe DHT:testosterone ratios adjusted for age, PASE and hours
blood taken from awakening; race/ethnicity had a significant effect in this model (p =
0.038). PASE had a negative relationship with DHT:testosterone and similar to before
covariate adjustment, Blacks had higher DHT:testosterone ratios compared with Whites
(p = 0.047) and Hispanics (p = 0.016); no difference was found between Hispanics and
Whites (p = 0.584).
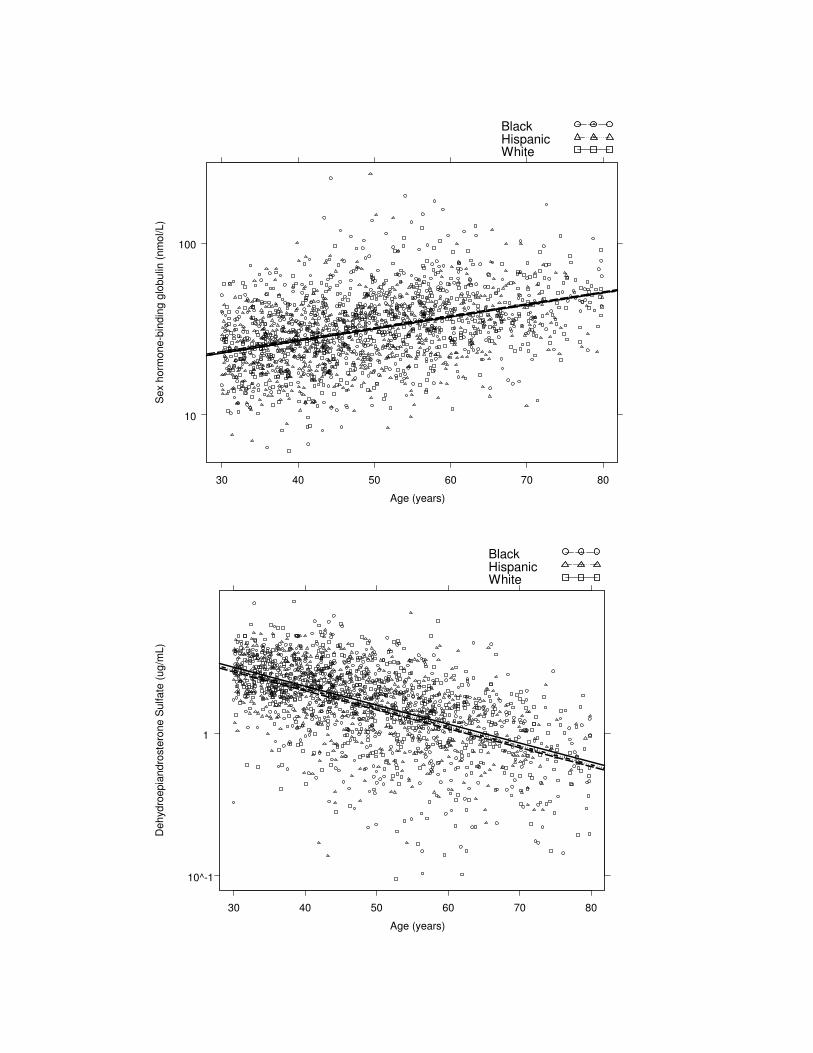
Unadjusted SHBG levels did not differ by race/ethnicity (Table 4) and in a model
to predict SHBG values adjusting for age, the p-value for the race/ethnicity covariate was
0.901 (Figure 1e). After fitting the best multivariate model including age, WHR, BMI,
smoking status and time blood taken from awakening, the p-value for the effect of
Litman et al: Serum androgen levels in Black, Hispanic and White men
Page 14 of 39
racial/ethnic differences was 0.981; age and smoking were positively associated while
BMI and WHR were negatively associated with SHBG levels.
In unadjusted analysis, DHEAS values differed by racial/ethnic group (Table 4
where p = 0.027); however, in a model to predict DHEAS values adjusting for age, the p-
value for the race/ethnicity covariate was 0.121 (Figure 1f). In a multivariate model
including PCS12, drinking status, SES and hours blood taken from awakening, there was
no evidence of a racial/ethnic difference in DHEAS (p = 0.586). Age had a significant
negative effect on DHEAS, while PCS12 and alcoholic drinking were positively
associated with DHEAS levels.
Discussion
After adjusting for covariates such as age, anthropometric measures and comorbid
conditions that affect sex steroid levels, no statistically significant racial/ethnic
differences in testosterone, bioavailable testosterone, SHBG or DHEAS levels are found.
However, there is some evidence of racial/ethnic differences in DHT levels and
DHT:testosterone ratios after covariate adjustment. Men who describe themselves as
Blacks have the highest DHT levels and DHT:testosterone ratios compared to those who
describe themselves as Hispanics or Whites. The significant correlations between total
testosterone and bioavailable testosterone levels, total testosterone and SHBG
concentrations, and bioavailable testosterone and age provide evidence of internal
consistency as well as biological plausibility of these data (48-50). In addition,
bioavailable testosterone concentrations are not significantly correlated with SHBG,
providing a valid, SHBG-independent marker of circulating testosterone.
Litman et al: Serum androgen levels in Black, Hispanic and White men
Page 15 of 39
Our findings have several clinical implications. As total and bioavailable
testosterone concentrations do not differ among men of different racial/ethnic groups, the
normative ranges for total testosterone and bioavailable testosterone concentrations need
not be adjusted for race/ethnicity when establishing the diagnosis of androgen deficiency
syndromes in men aged 30-79. Although polymorphisms in the testosterone biosynthetic
pathway have been postulated (51), especially in the CYP17 gene, our data do not
support the hypothesis that genetic differences in pathways that contribute to circulating
testosterone levels could explain racial/ethnic disparities in prostate cancer incidence
rates.
We found higher DHT levels and DHT:testosterone ratios in Black men than in
Hispanics and Whites. We do not know whether these small but significant differences in
DHT levels and DHT:testosterone ratios can account for the observed racial/ethnic
variations in prostate cancer incidence and mortality rates. Others (9, 15, 16) have
examined racial/ethnic differences in the DHT:testosterone ratio or testosterone
conversion rates as indirect markers for racial/ethnic differences in the steroid 5-α-
reductase activity; these studies have generally reported lower steroid 5-α-reductase
activity in Chinese (16) and Japanese (7) men than White and Black men. Testosterone’s
effects on the prostate are mediated through its conversion to DHT by the action of
steroid 5-α-reductase type II (SRD5A2). Polymorphisms in SRD5A2 have been
associated with benign prostatic hyperplasia (BPH) and prostate cancer (52, 53); these
polymorphisms might alter tissue levels of DHT and could increase prostate cancer risk.
Further research is needed to determine whether higher DHT levels and
DHT:testosterone ratios in Black men are due to polymorphisms in SRD5A2 gene and
Litman et al: Serum androgen levels in Black, Hispanic and White men
Page 16 of 39
whether these small differences can explain the racial disparities in prostate cancer
incidence and prevalence rates.
Blacks have a greater propensity to form keloids (54), another disorder in which
androgens have been invoked. Some testosterone effects on the skin are mediated through
its conversion to DHT (55). However, it is not clear whether steroid 5-α-reduction of
testosterone is obligatory for mediating its effects on the skeletal muscle and bone. The
SRD5A2 gene is expressed at a low level in the human skeletal muscle and bone. 46, XY
individuals with congenital mutations of the SRD5A2 gene undergo normal muscular and
bone development at puberty (55). Furthermore, men treated with SRD5A2 inhibitors for
the treatment of BPH do not experience loss of skeletal muscle mass or bone mineral
density, suggesting that 5-α-reduction of testosterone to DHT is not obligatory for
mediating its anabolic effects on the muscle and the bone (56). Additional mechanisms,
other than small differences in DHT levels, may need to be invoked to explain the
racial/ethnic differences in body composition and fracture rates.
Racial/ethnic differences in tissue androgen concentrations might exist because of
variations in tissue metabolism of testosterone (57). Differences in androgen signaling
pathways that may affect tissue specific effects of testosterone have been suggested to
contribute to racial/ethnic differences in prostate cancer risk. For instance, the androgen
receptor expression is higher in the prostatectomy samples of Black men with and
without prostate cancer in comparison to those from White men (58). Polymorphisms in
the signaling cascades downstream of androgen receptors have not been studied. The
Litman et al: Serum androgen levels in Black, Hispanic and White men
Page 17 of 39
BACH Survey was not designed to evaluate tissue androgen metabolism or signal
transduction pathways.
To our knowledge, this is the first survey of racial/ethnic variations in androgen
levels that included many men of Hispanic origin. However, significant dietary and
cultural differences within each racial/ethnic group across different geographic regions
may exist. This is especially true of Hispanics in the Boston area who differ from those in
the Southeastern and Western states in their countries of origin, and socio-cultural and
dietary patterns (59). A recent study of older men (60) demonstrated racial/ethnic
differences in total testosterone (adjusting for BMI, age) with significantly lower levels in
Asian men compared to White, Black and Hispanic men. Subjects were recruited through
six US academic medical centers; therefore, this Hispanic population may differ from
Boston Hispanics. Our racial/ethnic categories are defined by an individual’s self
selection, a widely accepted and used method (61), but the effects of race/ethnicity might
be diluted due to inter-racial marriage, cultural assimilation, and other factors. Finally, we
recognize that genetic factors that contribute to the observed differences in body
composition, bone mass and susceptibility to disease (18, 35) may interact with multiple
environmental and host factors, most of them poorly understood and not studied in the
BACH Survey.
In summary, our data do not demonstrate significant differences in total
testosterone, bioavailable testosterone, SHBG or DHEAS levels among White, Black,
and Hispanic men in a large, community-based sample of Boston men after adjusting for
age, anthropometric measures and comorbid conditions. We however found small but
Litman et al: Serum androgen levels in Black, Hispanic and White men
Page 18 of 39
significant differences in DHT levels and DHT:testosterone ratios after covariate
adjustment. Our data suggest that the normative ranges for total testosterone and
bioavailable testosterone concentrations need not be adjusted for race/ethnicity when
establishing the diagnosis of androgen deficiency syndromes in men aged 30-79. The
genetic basis and clinical significance of the higher DHT levels and DHT:testosterone
ratios among Blacks compared with Whites and Hispanics should be further explored to
ascertain whether they can explain racial/ethnic differences in androgen-related clinical
disorders, body composition and bone density.
Acknowledgements
Funding for the BACH study was provided by NIDDK (NIH) DK 56842.
Litman et al: Serum androgen levels in Black, Hispanic and White men
Page 19 of 39
References
1. Abdelrahaman E, Raghavan S, Baker L, Weinrich M, Winters SJ 2005
Racial difference in circulating sex hormone-binding globulin levels in
prepubertal boys. Metabolism 54:91-6
2. Asbell SO, Raimane KC, Montesano AT, Zeitzer KL, Asbell MD,
Vijayakumar S 2000 Prostate-specific antigen and androgens in African-
American and white normal subjects and prostate cancer patients. J Natl Med
Assoc 92:445-9
3. Ellis L, Nyborg H 1992 Racial/ethnic variations in male testosterone levels: a
probable contributor to group differences in health. Steroids 57:72-5
4. Gapstur SM, Gann PH, Kopp P, Colangelo L, Longcope C, Liu K 2002
Serum androgen concentrations in young men: a longitudinal analysis of
associations with age, obesity, and race. The CARDIA male hormone study.
Cancer Epidemiol Biomarkers Prev 11:1041-7
5. Mohler JL, Gaston KE, Moore DT, Schell MJ, Cohen BL, Weaver C, Petrusz
P 2004 Racial differences in prostate androgen levels in men with clinically
localized prostate cancer. J Urol 171:2277-80
6. Platz EA, Rimm EB, Willett WC, Kantoff PW, Giovannucci E 2000 Racial
variation in prostate cancer incidence and in hormonal system markers among
male health professionals. J Natl Cancer Inst 92:2009-17
7. Ross R, Bernstein L, Judd H, Hanisch R, Pike M, Henderson B 1986 Serum
testosterone levels in healthy young black and white men. J Natl Cancer Inst
76:45-8
Litman et al: Serum androgen levels in Black, Hispanic and White men
Page 20 of 39
8. Winters SJ, Brufsky A, Weissfeld J, Trump DL, Dyky MA, Hadeed V 2001
Testosterone, sex hormone-binding globulin, and body composition in young
adult African American and Caucasian men. Metabolism 50:1242-7
9. Wu AH, Whittemore AS, Kolonel LN, John EM, Gallagher RP, West DW,
Hankin J, Teh CZ, Dreon DM, Paffenbarger RSJ 1995 Serum androgens and
sex hormone-binding globulins in relation to lifestyle factors in older African-
American, white, and Asian men in the United States and Canada. Cancer
Epidemiol Biomarkers Prev 4:735-41
10. Gann PH, Hennekens CH, Ma J, Longcope C, Stampfer MJ 1996 Prospective
study of sex hormone levels and risk of prostate cancer. J Natl Cancer Inst
88:1118-26
11. Makridakis NM, Reichardt JK 2001 Molecular epidemiology of hormone-
metabolic loci in prostate cancer. Epidemiol Rev 23:24-9
12. Edwards BK, Brown ML, Wingo PA, Howe HL, Ward E, Ries LA, Schrag D,
Jamison PM, Jemal A, Wu XC, Friedman C, Harlan L, Warren J, Anderson
RN, Pickle LW 2005 Annual report to the nation on the status of cancer, 1975-
2002, featuring population-based trends in cancer treatment. J Natl Cancer Inst
97:1407-27
13. Hsing AW, Devesa SS 1994 Prostate cancer mortality in the United States by
cohort year of birth, 1865-1940. Cancer Epidemiol Biomarkers Prev 3:527-30
14. Greenlee RT, Hill-Harmon MB, Murray T, Thun M 2001 Cancer statistics,
2001. CA Cancer J Clin 51:15-36
Litman et al: Serum androgen levels in Black, Hispanic and White men
Page 21 of 39
15. Santner SJ, Albertson B, Zhang GY, Zhang GH, Santulli M, Wang C,
Demers LM, Shackleton C, Santen RJ 1998 Comparative rates of androgen
production and metabolism in Caucasian and Chinese subjects. J Clin Endocrinol
Metab 83:2104-9
16. Anderson RA, Wallace AM, Wu FC 1996 Comparison between testosterone
enanthate-induced azoospermia and oligozoospermia in a male contraceptive
study. III. Higher 5 alpha-reductase activity in oligozoospermic men administered
supraphysiological doses of testosterone. J Clin Endocrinol Metab 81:902-8
17. Gallagher D, Kuznia P, Heshka S, Albu J, Heymsfield SB, Goodpaster B,
Visser M, Harris TB 2005 Adipose tissue in muscle: a novel depot similar in
size to visceral adipose tissue. Am J Clin Nutr 81:903-10
18. Nguyen TV, Howard GM, Kelly PJ, Eisman JA 1998 Bone mass, lean mass,
and fat mass: same genes or same environments? Am J Epidemiol 147:3-16
19. Looker AC, Wahner HW, Dunn WL, Calvo MS, Harris TB, Heyse SP,
Johnston CC, Jr., Lindsay R 1998 Updated data on proximal femur bone
mineral levels of US adults. Osteoporos Int 8:468-89
20. Tracy JK, Meyer WA, Flores RH, Wilson PD, Hochberg MC 2005 Racial
differences in rate of decline in bone mass in older men: the Baltimore men's
osteoporosis study. J Bone Miner Res 20:1228-34
21. Baron JA, Barrett J, Malenka D, Fisher E, Kniffin W, Bubolz T, Tosteson T
1994 Racial differences in fracture risk. Epidemiology 5:42-7
22. Kellie SE, Brody JA 1990 Sex-specific and race-specific hip fracture rates. Am J
Public Health 80:326-8

Litman et al: Serum androgen levels in Black, Hispanic and White men
Page 22 of 39
23. Edelstein SL, Barrett-Connor E 1993 Relation between body size and bone
mineral density in elderly men and women. Am J Epidemiol 138:160-9
24. Nguyen TV, Kelly PJ, Sambrook PN, Gilbert C, Pocock NA, Eisman JA 1994
Lifestyle factors and bone density in the elderly: implications for osteoporosis
prevention. J Bone Miner Res 9:1339-46
25. Hughes VA, Frontera WR, Dallal GE, Lutz KJ, Fisher EC, Evans WJ 1995
Muscle strength and body composition: associations with bone density in older
subjects. Med Sci Sports Exerc 27:967-74
26. Baumgartner RN, Stauber PM, Koehler KM, Romero L, Garry PJ 1996
Associations of fat and muscle masses with bone mineral in elderly men and
women. Am J Clin Nutr 63:365-72
27. Visser M, Kiel DP, Langlois J, Hannan MT, Felson DT, Wilson PW, Harris
TB 1998 Muscle mass and fat mass in relation to bone mineral density in very old
men and women: the Framingham Heart Study. Appl Radiat Isot 49:745-7
28. Silverman SL, Madison RE 1988 Decreased incidence of hip fracture in
Hispanics, Asians, and blacks: California Hospital Discharge Data. Am J Public
Health 78:1482-3
29. Griffin MR, Ray WA, Fought RL, Melton LJ, 3rd 1992 Black-white
differences in fracture rates. Am J Epidemiol 136:1378-85
30. Bell NH, Gordon L, Stevens J, Shary JR 1995 Demonstration that bone mineral
density of the lumbar spine, trochanter, and femoral neck is higher in black than
in white young men. Calcif Tissue Int 56:11-3
Litman et al: Serum androgen levels in Black, Hispanic and White men
Page 23 of 39
31. Wright NM, Renault J, Willi S, Veldhuis JD, Pandey JP, Gordon L, Key LL,
Bell NH 1995 Greater secretion of growth hormone in black than in white men:
possible factor in greater bone mineral density--a clinical research center study. J
Clin Endocrinol Metab 80:2291-7
32. Barondess DA, Nelson DA, Schlaen SE 1997 Whole body bone, fat, and lean
mass in black and white men. J Bone Miner Res 12:967-71
33. DeSimone DP, Stevens J, Edwards J, Shary J, Gordon L, Bell NH 1989
Influence of body habitus and race on bone mineral density of the midradius, hip,
and spine in aging women. J Bone Miner Res 4:827-30
34. Luckey MM, Meier DE, Mandeli JP, DaCosta MC, Hubbard ML, Goldsmith
SJ 1989 Radial and vertebral bone density in white and black women: evidence
for racial differences in premenopausal bone homeostasis. J Clin Endocrinol
Metab 69:762-70
35. Seeman E, Hopper JL, Young NR, Formica C, Goss P, Tsalamandris C 1996
Do genetic factors explain associations between muscle strength, lean mass, and
bone density? A twin study. Am J Physiol 270:E320-7
36. Cochran W 1977 Sampling Techniques, 3rd ed. John Wiley and Sons, New
York, NY
37. McKinlay SM, Kipp DM, Johnson P, Downey K, Carleton R A field approach
for obtaining physiological measures in surveys of general populations: response
rates, reliability, and costs. Fourth Conference on Health Survey Research
Methods, Washington, DC, 1982; pp 195-204,1984
Litman et al: Serum androgen levels in Black, Hispanic and White men
Page 24 of 39
38. Sodergard R, Backstrom T, Shanbhag V, Carstensen H 1982 Calculation of
free and bound fractions of testosterone and estradiol-17 beta to human plasma
proteins at body temperature. J Steroid Biochem 16:801-10
39. Vermeulen A, Verdonck L, Kaufman JM 1999 A critical evaluation of simple
methods for the estimation of free testosterone in serum. J Clin Endocrinol Metab
84:3666-72
40. Kohout FJ, Berkman LF, Evans DA, Cornoni-Huntley J 1993 Two shorter
forms of the CES-D (Center for Epidemiological Studies Depression) depression
symptoms index. J Aging Health 5:179-93
41. Washburn RA, Smith KW, Jette AM, Janney CA 1993 The Physical Activity
Scale for the Elderly (PASE): development and evaluation. J Clin Epidemiol
46:153-62
42. Ware J, Jr., Kosinski M, Keller SD 1996 A 12-Item Short-Form Health Survey:
construction of scales and preliminary tests of reliability and validity. Med Care
34:220-33
43. Green LW 1970 Manual for scoring socioeconomic status for research on health
behavior. Public Health Rep 85:815-27
44. Research Triangle Institute 2004 SUDAAN Language Manual Release
9.0.Research Triangle Park, NC
45. Insightful Corp 2005 S-Plus 7.0 for Windows User's Guide.Seattle, WA
46. Schafer JL 1997 Analysis of incomplete multivariate data. Chapman and Hall,
London
Litman et al: Serum androgen levels in Black, Hispanic and White men
Page 25 of 39
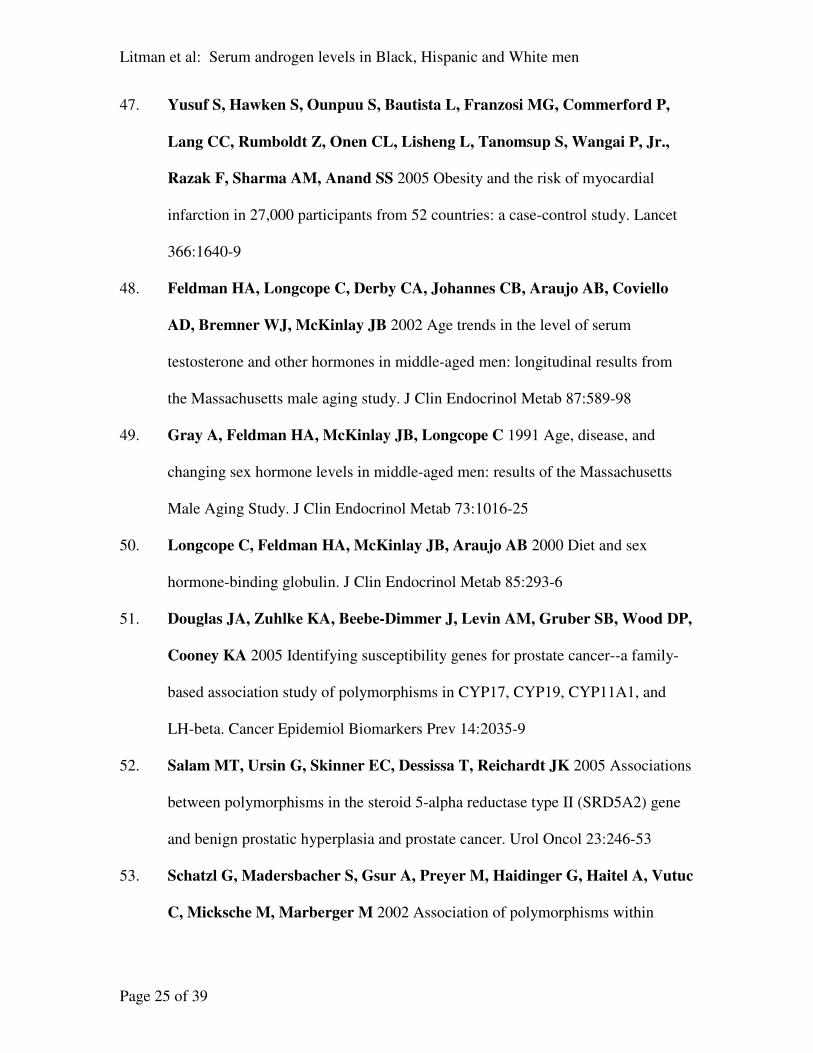
47. Yusuf S, Hawken S, Ounpuu S, Bautista L, Franzosi MG, Commerford P,
Lang CC, Rumboldt Z, Onen CL, Lisheng L, Tanomsup S, Wangai P, Jr.,
Razak F, Sharma AM, Anand SS 2005 Obesity and the risk of myocardial
infarction in 27,000 participants from 52 countries: a case-control study. Lancet
366:1640-9
48. Feldman HA, Longcope C, Derby CA, Johannes CB, Araujo AB, Coviello
AD, Bremner WJ, McKinlay JB 2002 Age trends in the level of serum
testosterone and other hormones in middle-aged men: longitudinal results from
the Massachusetts male aging study. J Clin Endocrinol Metab 87:589-98
49. Gray A, Feldman HA, McKinlay JB, Longcope C 1991 Age, disease, and
changing sex hormone levels in middle-aged men: results of the Massachusetts
Male Aging Study. J Clin Endocrinol Metab 73:1016-25
50. Longcope C, Feldman HA, McKinlay JB, Araujo AB 2000 Diet and sex
hormone-binding globulin. J Clin Endocrinol Metab 85:293-6
51. Douglas JA, Zuhlke KA, Beebe-Dimmer J, Levin AM, Gruber SB, Wood DP,
Cooney KA 2005 Identifying susceptibility genes for prostate cancer--a family-
based association study of polymorphisms in CYP17, CYP19, CYP11A1, and
LH-beta. Cancer Epidemiol Biomarkers Prev 14:2035-9
52. Salam MT, Ursin G, Skinner EC, Dessissa T, Reichardt JK 2005 Associations
between polymorphisms in the steroid 5-alpha reductase type II (SRD5A2) gene
and benign prostatic hyperplasia and prostate cancer. Urol Oncol 23:246-53
53. Schatzl G, Madersbacher S, Gsur A, Preyer M, Haidinger G, Haitel A, Vutuc
C, Micksche M, Marberger M 2002 Association of polymorphisms within

Litman et al: Serum androgen levels in Black, Hispanic and White men
Page 26 of 39
androgen receptor, 5alpha-reductase, and PSA genes with prostate volume,
clinical parameters, and endocrine status in elderly men. Prostate 52:130-8
54. Schierle HP, Scholz D, Lemperle G 1997 Elevated levels of testosterone
receptors in keloid tissue: an experimental investigation. Plast Reconstr Surg
100:390-5; discussion 396
55. Wilson JD, Griffin JE, Russell DW 1993 Steroid 5 alpha-reductase 2 deficiency.
Endocr Rev 14:577-93
56. Tollin SR, Rosen HN, Zurowski K, Saltzman B, Zeind AJ, Berg S,
Greenspan SL 1996 Finasteride therapy does not alter bone turnover in men with
benign prostatic hyperplasia--a Clinical Research Center study. J Clin Endocrinol
Metab 81:1031-4
57. Cicek MS, Conti DV, Curran A, Neville PJ, Paris PL, Casey G, Witte JS
2004 Association of prostate cancer risk and aggressiveness to androgen pathway
genes: SRD5A2, CYP17, and the AR. Prostate 59:69-76
58. Gaston KE, Kim D, Singh S, Ford OH, 3rd, Mohler JL 2003 Racial
differences in androgen receptor protein expression in men with clinically
localized prostate cancer. J Urol 170:990-3
59. Office of Minority Health 2005 www.omhrc.gov
60. Orwoll E, Lambert LC, Marshall LM, Phipps K, Blank J, Barrett-Connor E,
Cauley J, Ensrud K, Cummings S 2005 Testosterone and estradiol among older
men. J Clin Endocrinol Metab 2005 Dec 20; [Epub ahead of print]
61. Wallman K 1997 Data on race and ethnicity: Revising the federal standard. Am
Stat:31-35
Litman et al: Serum androgen levels in Black, Hispanic and White men
Page 27 of 39
Figures
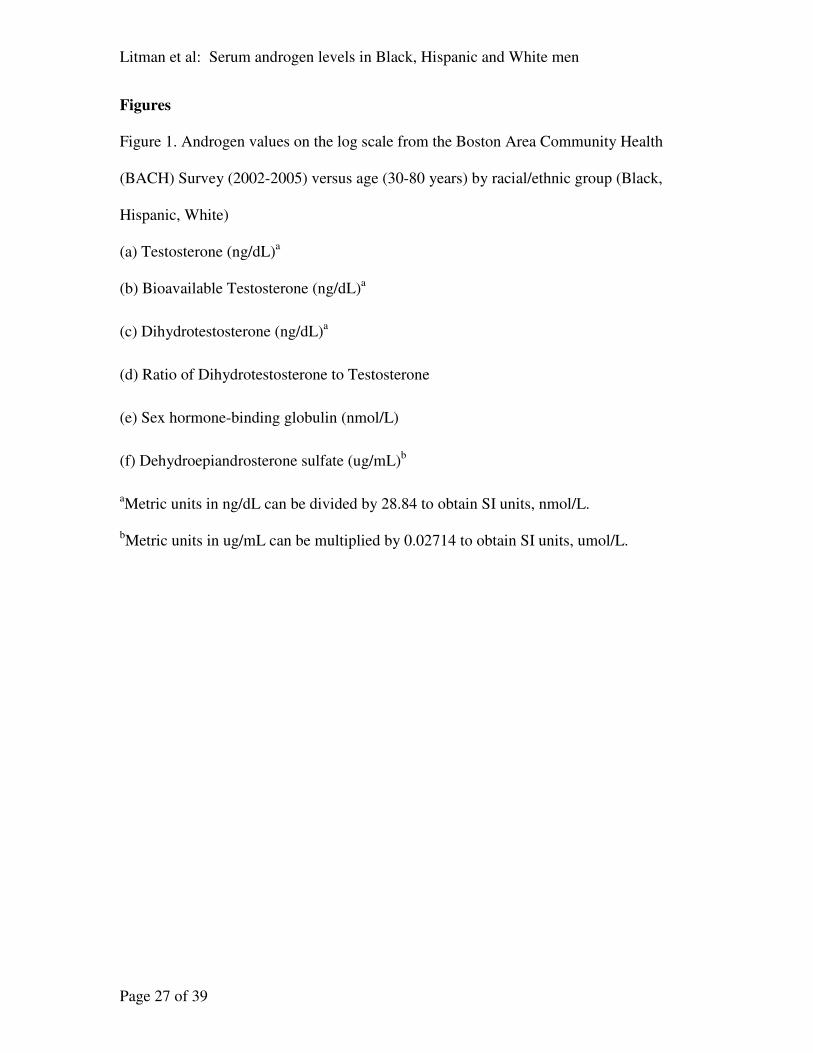
Figure 1. Androgen values on the log scale from the Boston Area Community Health
(BACH) Survey (2002-2005) versus age (30-80 years) by racial/ethnic group (Black,
Hispanic, White)
(a) Testosterone (ng/dL)a
(b) Bioavailable Testosterone (ng/dL)a
(c) Dihydrotestosterone (ng/dL)a
(d) Ratio of Dihydrotestosterone to Testosterone
(e) Sex hormone-binding globulin (nmol/L)
(f) Dehydroepiandrosterone sulfate (ug/mL)b
aMetric units in ng/dL can be divided by 28.84 to obtain SI units, nmol/L.
bMetric units in ug/mL can be multiplied by 0.02714 to obtain SI units, umol/L.

Litman et al: Serum androgen levels in Black, Hispanic and White men
Page 28 of 39
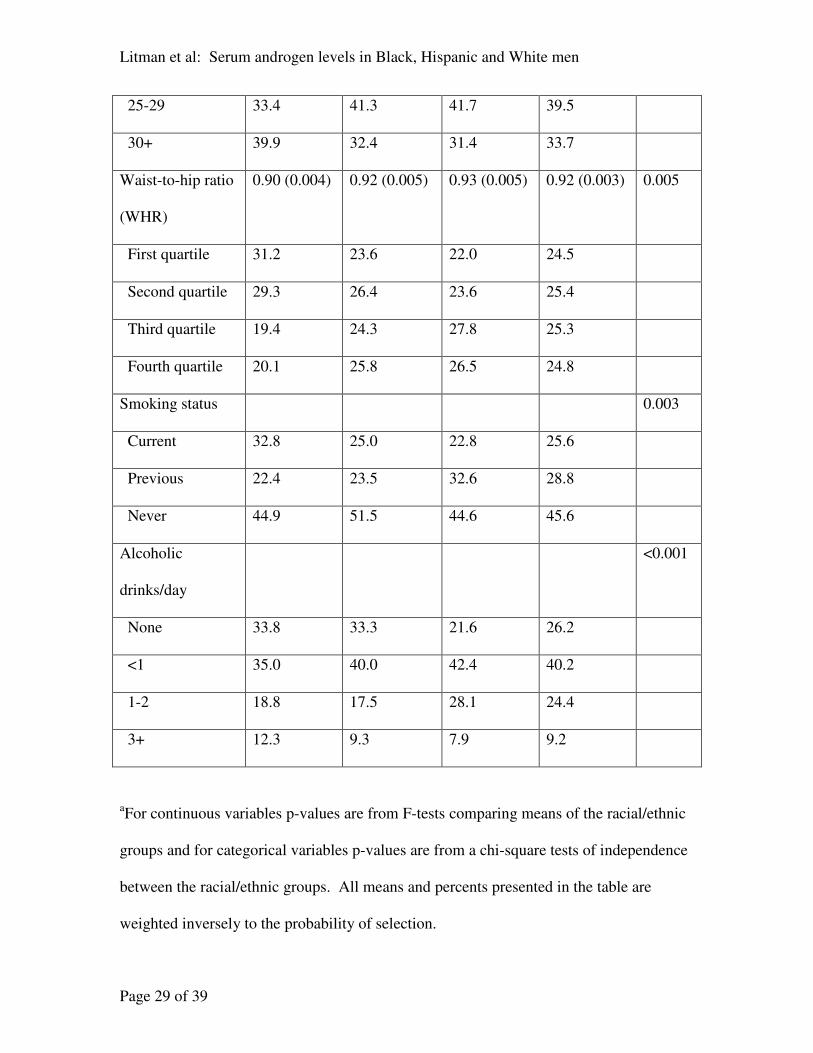
Table 1. Distributions of covariates potentially related to androgen levels from the BACH
Survey overall and by racial/ethnic group; mean (standard error) for continuous variables
and percent in each category for categorical variables.
Variable Black Hispanic White Total p-
valuea
N 538 651 710 1899
Age (years) 47.67 (0.75) 44.24 (0.53) 48.19 (0.70) 47.45 (0.48) <0.001
Physical Activity
Scale for the
Elderly (PASE)
197.52
(6.50)
189.43
(7.12)
181.17
(6.45)
186.34
(4.46)
0.182
Physical health
component score
(PCS12)
48.93 (0.55) 50.75 (0.43) 50.89 (0.51) 50.38 (0.34) 0.017
Mental health
component score
(MCS12)
49.66 (0.67) 51.38 (0.49) 50.34 (0.56) 50.31 (0.40) 0.066
Socioeconomic
status (SES)
53.30 (0.54) 48.97 (0.78) 61.77 (0.53) 57.98 (0.42) <0.001
Hours blood taken
from awakening
4.41 (0.19) 4.74 (0.18) 4.43 (0.15) 4.47 (0.11) 0.369
Body mass index
(BMI) (kg/m2)
29.25 (0.36) 28.53 (0.29) 28.43 (0.42) 28.65 (0.28) 0.121
<25 26.8 26.3 26.8 26.8
Litman et al: Serum androgen levels in Black, Hispanic and White men
Page 29 of 39
25-29 33.4 41.3 41.7 39.5
30+ 39.9 32.4 31.4 33.7
Waist-to-hip ratio
(WHR)
0.90 (0.004) 0.92 (0.005) 0.93 (0.005) 0.92 (0.003) 0.005
First quartile 31.2 23.6 22.0 24.5
Second quartile 29.3 26.4 23.6 25.4
Third quartile 19.4 24.3 27.8 25.3
Fourth quartile 20.1 25.8 26.5 24.8
Smoking status 0.003
Current 32.8 25.0 22.8 25.6
Previous 22.4 23.5 32.6 28.8
Never 44.9 51.5 44.6 45.6
Alcoholic
drinks/day
<0.001
None 33.8 33.3 21.6 26.2
<1 35.0 40.0 42.4 40.2
1-2 18.8 17.5 28.1 24.4
3+ 12.3 9.3 7.9 9.2
aFor continuous variables p-values are from F-tests comparing means of the racial/ethnic
groups and for categorical variables p-values are from a chi-square tests of independence
between the racial/ethnic groups. All means and percents presented in the table are
weighted inversely to the probability of selection.
Litman et al: Serum androgen levels in Black, Hispanic and White men
Page 30 of 39
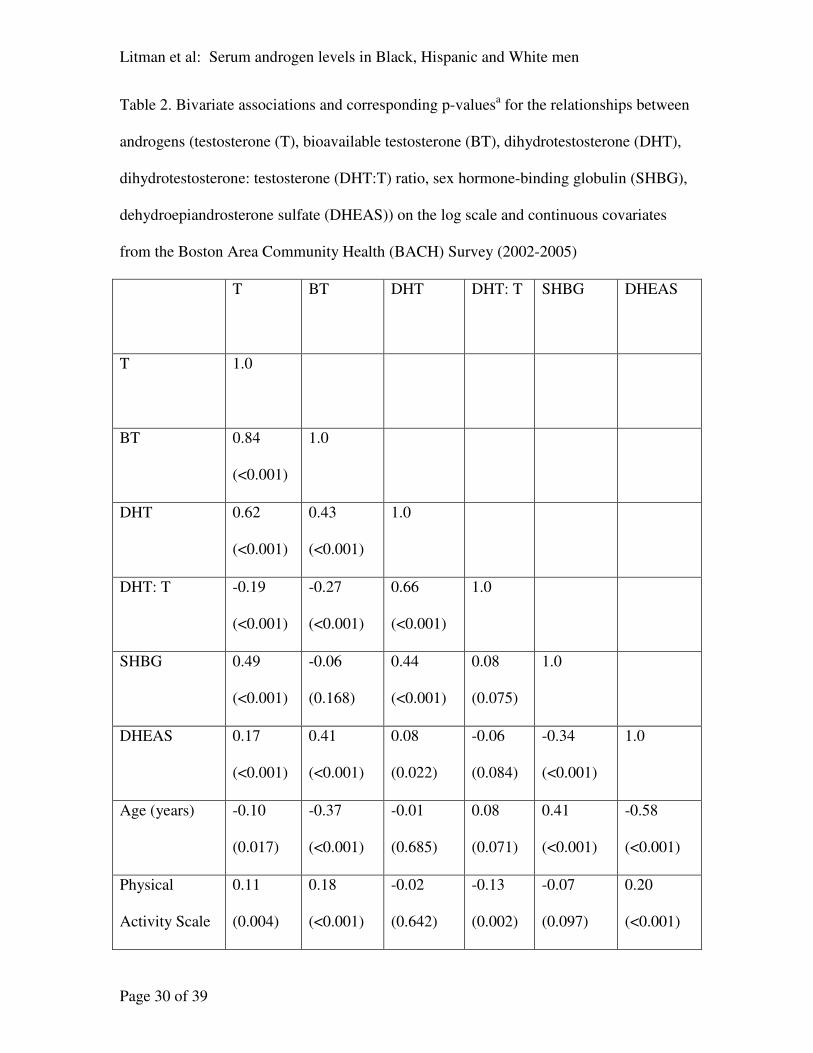
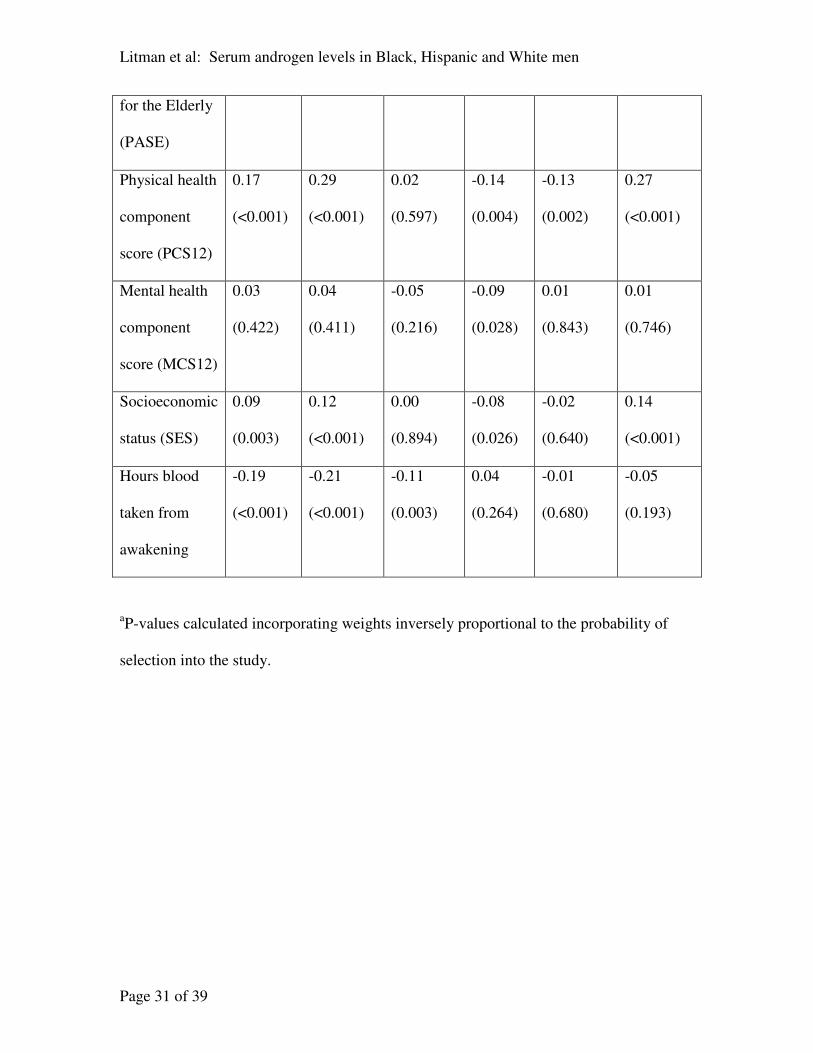
Table 2. Bivariate associations and corresponding p-valuesa for the relationships between
androgens (testosterone (T), bioavailable testosterone (BT), dihydrotestosterone (DHT),
dihydrotestosterone: testosterone (DHT:T) ratio, sex hormone-binding globulin (SHBG),
dehydroepiandrosterone sulfate (DHEAS)) on the log scale and continuous covariates
from the Boston Area Community Health (BACH) Survey (2002-2005)
T BT DHT DHT: T SHBG DHEAS
T 1.0
BT 0.84
(<0.001)
1.0
DHT 0.62
(<0.001)
0.43
(<0.001)
1.0
DHT: T -0.19
(<0.001)
-0.27
(<0.001)
0.66
(<0.001)
1.0
SHBG 0.49
(<0.001)
-0.06
(0.168)
0.44
(<0.001)
0.08
(0.075)
1.0
DHEAS 0.17
(<0.001)
0.41
(<0.001)
0.08
(0.022)
-0.06
(0.084)
-0.34
(<0.001)
1.0
Age (years) -0.10
(0.017)
-0.37
(<0.001)
-0.01
(0.685)
0.08
(0.071)
0.41
(<0.001)
-0.58
(<0.001)
Physical
Activity Scale
0.11
(0.004)
0.18
(<0.001)
-0.02
(0.642)
-0.13
(0.002)
-0.07
(0.097)
0.20
(<0.001)
Litman et al: Serum androgen levels in Black, Hispanic and White men
Page 31 of 39
for the Elderly
(PASE)
Physical health
component
score (PCS12)
0.17
(<0.001)
0.29
(<0.001)
0.02
(0.597)
-0.14
(0.004)
-0.13
(0.002)
0.27
(<0.001)
Mental health
component
score (MCS12)
0.03
(0.422)
0.04
(0.411)
-0.05
(0.216)
-0.09
(0.028)
0.01
(0.843)
0.01
(0.746)
Socioeconomic
status (SES)
0.09
(0.003)
0.12
(<0.001)
0.00
(0.894)
-0.08
(0.026)
-0.02
(0.640)
0.14
(<0.001)
Hours blood
taken from
awakening
-0.19
(<0.001)
-0.21
(<0.001)
-0.11
(0.003)
0.04
(0.264)
-0.01
(0.680)
-0.05
(0.193)
aP-values calculated incorporating weights inversely proportional to the probability of
selection into the study.
Litman et al: Serum androgen levels in Black, Hispanic and White men
Page 32 of 39
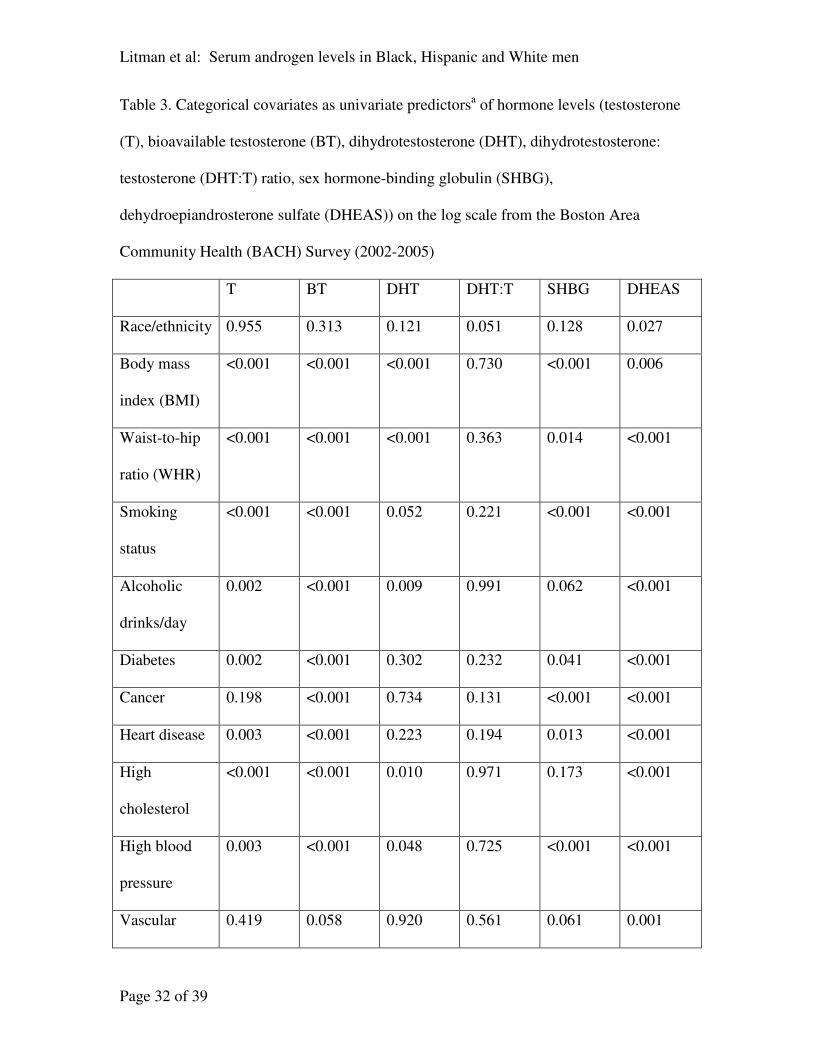
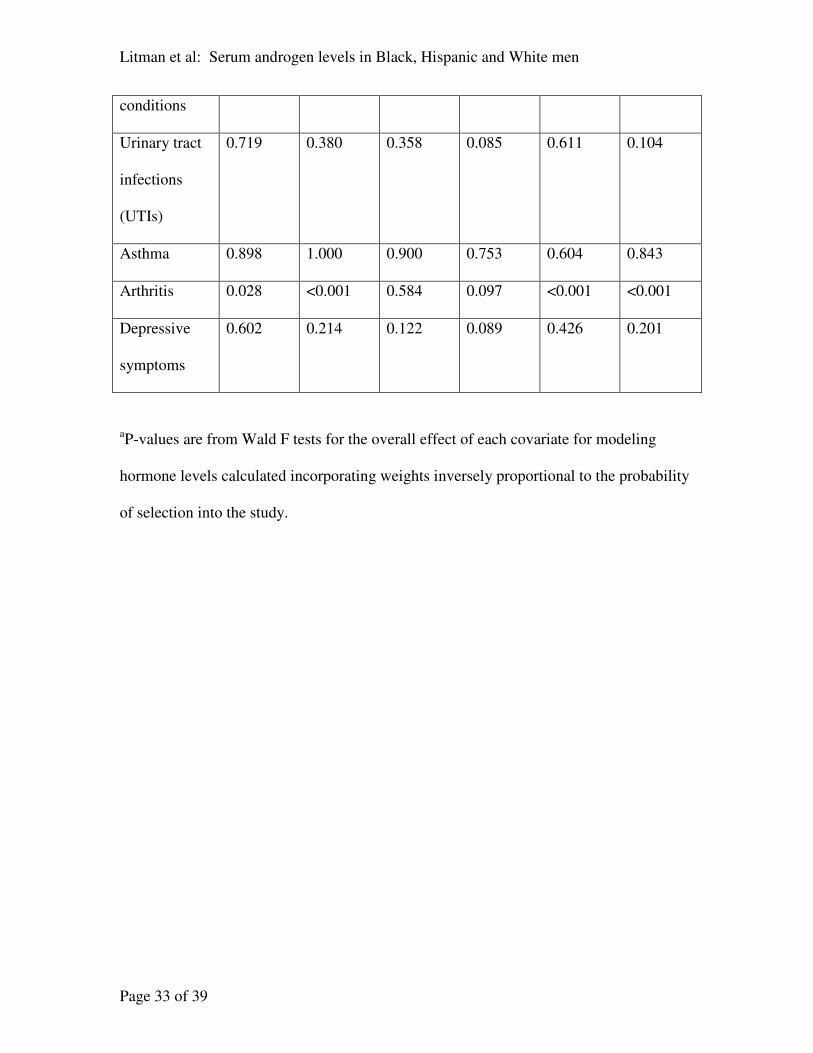
Table 3. Categorical covariates as univariate predictorsa of hormone levels (testosterone
(T), bioavailable testosterone (BT), dihydrotestosterone (DHT), dihydrotestosterone:
testosterone (DHT:T) ratio, sex hormone-binding globulin (SHBG),
dehydroepiandrosterone sulfate (DHEAS)) on the log scale from the Boston Area
Community Health (BACH) Survey (2002-2005)
T BT DHT DHT:T SHBG DHEAS
Race/ethnicity 0.955 0.313 0.121 0.051 0.128 0.027
Body mass
index (BMI)
<0.001 <0.001 <0.001 0.730 <0.001 0.006
Waist-to-hip
ratio (WHR)
<0.001 <0.001 <0.001 0.363 0.014 <0.001
Smoking
status
<0.001 <0.001 0.052 0.221 <0.001 <0.001
Alcoholic
drinks/day
0.002 <0.001 0.009 0.991 0.062 <0.001
Diabetes 0.002 <0.001 0.302 0.232 0.041 <0.001
Cancer 0.198 <0.001 0.734 0.131 <0.001 <0.001
Heart disease 0.003 <0.001 0.223 0.194 0.013 <0.001
High
cholesterol
<0.001 <0.001 0.010 0.971 0.173 <0.001
High blood
pressure
0.003 <0.001 0.048 0.725 <0.001 <0.001
Vascular 0.419 0.058 0.920 0.561 0.061 0.001
Litman et al: Serum androgen levels in Black, Hispanic and White men
Page 33 of 39
conditions
Urinary tract
infections
(UTIs)
0.719 0.380 0.358 0.085 0.611 0.104
Asthma 0.898 1.000 0.900 0.753 0.604 0.843
Arthritis 0.028 <0.001 0.584 0.097 <0.001 <0.001
Depressive
symptoms
0.602 0.214 0.122 0.089 0.426 0.201
aP-values are from Wald F tests for the overall effect of each covariate for modeling
hormone levels calculated incorporating weights inversely proportional to the probability
of selection into the study.
Litman et al: Serum androgen levels in Black, Hispanic and White men
Page 34 of 39
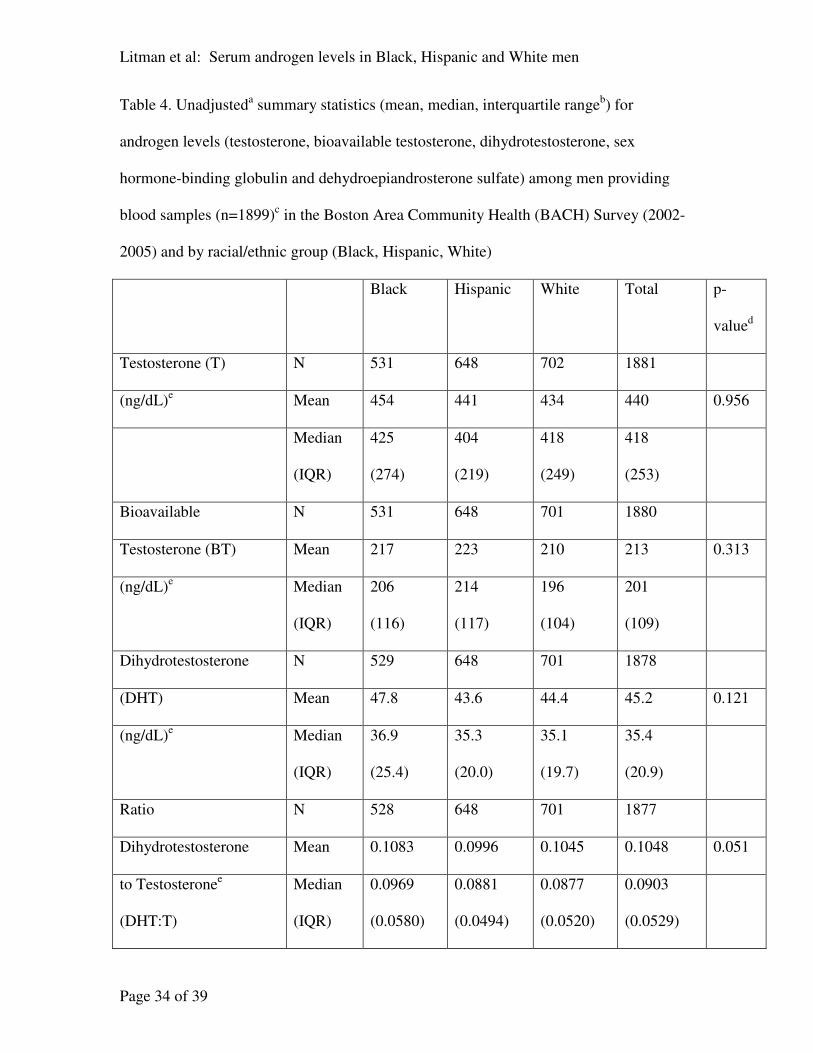
Table 4. Unadjusteda summary statistics (mean, median, interquartile range
b) for
androgen levels (testosterone, bioavailable testosterone, dihydrotestosterone, sex
hormone-binding globulin and dehydroepiandrosterone sulfate) among men providing
blood samples (n=1899)c in the Boston Area Community Health (BACH) Survey (2002-
2005) and by racial/ethnic group (Black, Hispanic, White)
Black Hispanic White Total p-
valued
Testosterone (T) N 531 648 702 1881
(ng/dL)e Mean 454 441 434 440 0.956
Median
(IQR)
425
(274)
404
(219)
418
(249)
418
(253)
Bioavailable N 531 648 701 1880
Testosterone (BT) Mean 217 223 210 213 0.313
(ng/dL)e Median
(IQR)
206
(116)
214
(117)
196
(104)
201
(109)
Dihydrotestosterone N 529 648 701 1878
(DHT) Mean 47.8 43.6 44.4 45.2 0.121
(ng/dL)e Median
(IQR)
36.9
(25.4)
35.3
(20.0)
35.1
(19.7)
35.4
(20.9)
Ratio N 528 648 701 1877
Dihydrotestosterone Mean 0.1083 0.0996 0.1045 0.1048 0.051
to Testosteronee
(DHT:T)
Median
(IQR)
0.0969
(0.0580)
0.0881
(0.0494)
0.0877
(0.0520)
0.0903
(0.0529)

Litman et al: Serum androgen levels in Black, Hispanic and White men
Page 35 of 39
Sex hormone-binding N 531 648 701 1880
globulin (SHBG) Mean 36.0 32.0 34.2 34.3 0.128
(nmol/L) Median
(IQR)
30.6
(20.2)
27.5 (17.9) 30.3
(19.5)
30.3
(19.2)
Dehydroepiandrosterone N 531 648 701 1880
Sulfate (DHEAS)
Mean 1.93 2.10 2.04 2.02 0.027
(ug/mL)f Median
(IQR)
1.80
(1.67)
1.97 (1.38) 1.90
(1.44)
1.88
(1.50)
aSummary statistics were not adjusted for the effects of age or other covariates, but
because of the design of the BACH Survey, summary statistics were based on
observations weighted unequally according to probabilities of selection into the study.
bInterquartile range (IQR) was calculated as the difference of the 25
th and 75
th percentiles
and provides a robust measure of variation for skewed data, such as hormone values.
cOf the 1899 men providing blood samples, seven did not have hormone values; in
addition, one did not have a DHT value. One testosterone, three DHT and two SHBG,
DHEAS values were not calculated due to insufficient quantity. Ten subjects with
extreme testosterone and dihydrotestosterone values were also excluded; seven had
testosterone < 20 ng/dL (0.69 nmol/L) and dihydrotestosterone < 6.0 ng/dL (0.21
nmol/L), one had a testosterone value of 3710 ng/dL (128.64 nmol/L) and two had
dihydrotestosterone values > 500 ng/dL (17.34 nmol/L).
dP-value for difference in means on the log scale between the racial/ethnic groups.
eMetric units in ng/dL can be divided by 28.84 to obtain SI units, nmol/L.

Litman et al: Serum androgen levels in Black, Hispanic and White men
Page 36 of 39
fMetric units in ug/dL can be multiplied by 0.02714 to obtain SI units, umol/L.
Litman et al: Serum androgen levels in Black, Hispanic and White men
Page 37 of 39
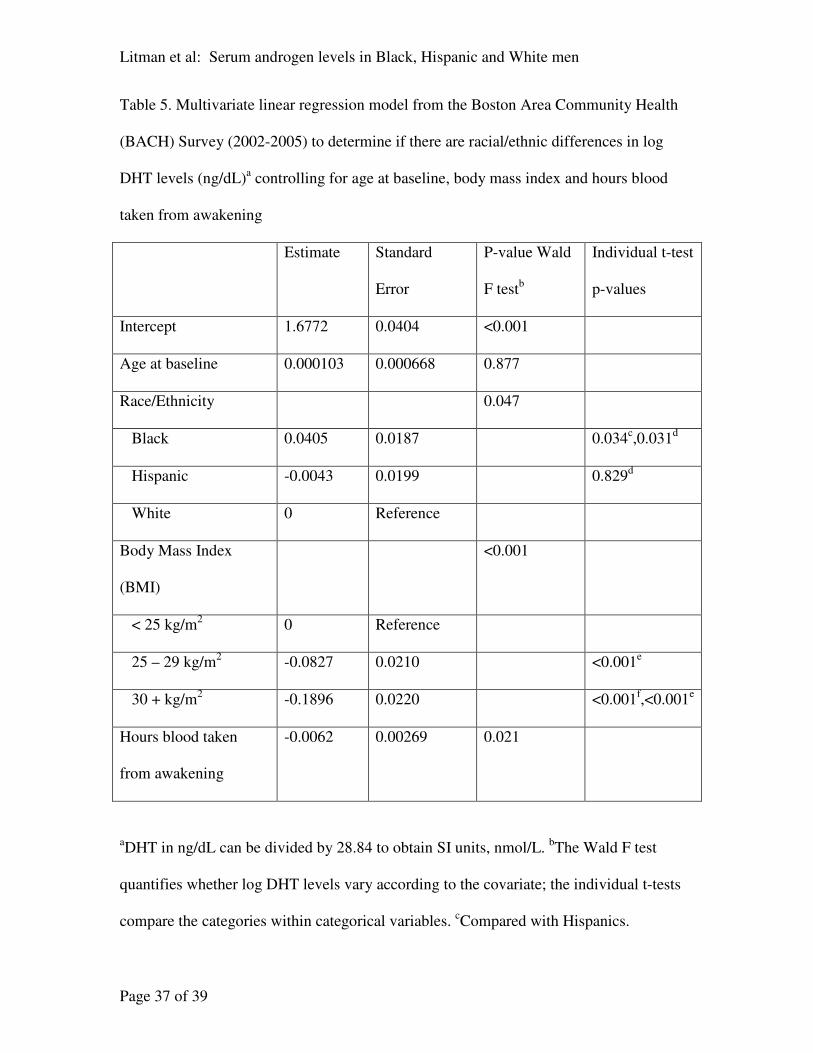
Table 5. Multivariate linear regression model from the Boston Area Community Health
(BACH) Survey (2002-2005) to determine if there are racial/ethnic differences in log
DHT levels (ng/dL)a controlling for age at baseline, body mass index and hours blood
taken from awakening
Estimate Standard
Error
P-value Wald
F testb
Individual t-test
p-values
Intercept 1.6772 0.0404 <0.001
Age at baseline 0.000103 0.000668 0.877
Race/Ethnicity 0.047
Black 0.0405 0.0187 0.034c,0.031
d
Hispanic -0.0043 0.0199 0.829d
White 0 Reference
Body Mass Index
(BMI)
<0.001
< 25 kg/m2 0 Reference
25 – 29 kg/m2 -0.0827 0.0210 <0.001
e
30 + kg/m2 -0.1896 0.0220 <0.001
f,<0.001
e
Hours blood taken
from awakening
-0.0062 0.00269 0.021
aDHT in ng/dL can be divided by 28.84 to obtain SI units, nmol/L.
bThe Wald F test
quantifies whether log DHT levels vary according to the covariate; the individual t-tests
compare the categories within categorical variables. cCompared with Hispanics.

Litman et al: Serum androgen levels in Black, Hispanic and White men
Page 38 of 39
dCompared with Whites.
eCompared with BMI < 25 kg/m
2.
fCompared with BMI 25-29
kg/m2.

Litman et al: Serum androgen levels in Black, Hispanic and White men
Page 39 of 39
Table 6. Comparison of linear regression models from the Boston Area Community
Health (BACH) Survey (2002-2005) to determine if there are racial/ethnic differences in
log DHT levels (ng/dL)a
Variables in the model Race/ethnicity
coefficient
(standard error)
for Black men
Race/ethnicity
coefficient
(standard error)
for Hispanic men
P-value Wald
F testb
Race/ethnicity only 0.0319 (0.0194) -0.0080 (0.0201) 0.121
Race/ethnicity, age 0.0318 (0.0194) -0.0093 (0.0206) 0.119
Race/ethnicity, age, hours from
waking
0.0319 (0.0192) -0.0060 (0.0207) 0.143
Race/ethnicity, age, hours from
waking, waist-to-hip ratio
0.0144 (0.0190) -0.0051 (0.0201) 0.628
Race/ethnicity, age, hours from
waking, body mass indexc
0.0405 (0.0187) -0.0043 (0.0199) 0.047
Race/ethnicity, age, hours from
waking, waist-to-hip ratio, body
mass index
0.0313 (0.0189) -0.0046 (0.0199) 0.160
aDHT in ng/dL can be divided by 28.84 to obtain SI units, nmol/L.
bThe Wald F test quantifies whether log DHT levels vary according to race/ethnicity.
White men are considered the reference category with a race/ethnicity coefficient of 0.
cThis model was deemed the best model and is presented in full in Table 5.

100
1000
30 40 50 60 70 80
BlackHispanicWhite
Age (years)
Te
sto
ste
ron
e (
ng
/dL
)
100
200
300
400
500
600700
30 40 50 60 70 80
BlackHispanicWhite
Age (years)
Bio
ava
ilab
le T
esto
ste
ron
e (
ng
/dL
)
10
100
30 40 50 60 70 80
BlackHispanicWhite
Age (years)
Dih
yd
rote
sto
ste
ron
e (
ng
/dL
)
0.2
0.4
0.6
0.8
30 40 50 60 70 80
BlackHispanicWhite
Age (years)
Ra
tio
Dih
yd
rote
sto
ste
ron
e/T
esto
ste
ron
e
10
100
30 40 50 60 70 80
BlackHispanicWhite
Age (years)
Sex h
orm
one-b
indin
g g
lobulin
(nm
ol/L)
10^-1
1
30 40 50 60 70 80
BlackHispanicWhite
Age (years)
Dehydro
epia
ndro
ste
rone S
ulfate
(ug/m
L)
Copyright © 2022 FDOKUMEN