Evaluation and Performance of a Tannin-based Polymer as a ...
286
1 Evaluation and Performance of a Tannin-based Polymer as a Coagulant in Water Treatment by GANG FANG B.Sc. (Hons), M.Sc. Imperial College London Department of Civil and Environmental Engineering, Thesis Submitted for the Degree of Doctor of Philosophy November 2007
-
Upload
khangminh22 -
Category
Documents
-
view
3 -
download
0
Transcript of Evaluation and Performance of a Tannin-based Polymer as a ...

1
Evaluation and Performance of a Tannin-based Polymer
as a Coagulant in Water Treatment
by
GANG FANG
B.Sc. (Hons), M.Sc.
Imperial College London
Department of Civil and Environmental Engineering,
Thesis Submitted for the Degree of Doctor of Philosophy
November 2007

2
ABSTRACT
In drinking water treatment, there is growing interest in the application
of natural cationic polymers that provide an alternate means to achieve enhanced
coagulation. A review of the relevant literature concerning the coagulation
mechanisms and action of polymer is presented with particular reference to the
polymer character, such as polymer type, charge density and molecular weight. In
addition, basic knowledge of a novel coagulant, a tannin-based modified polymer,
is described.
A full characterization of the tannin-based polymer (TBP) has been
undertaken to provide an unambiguous description of the polymer, or monomer,
structure. Some specialised newer analytical techniques in combination with
several old classical techniques for polymer examination have been used to
determine the chemical nature of the TBP, including its dissociation and
precipitation behaviour, molecular weight, charge density, charge variability with
pH, elemental content, functional group and chemical bonding, etc. The overall
assessment of TBP indicated that it can be classified as a medium molecular
weight polymer with a non-quaternized amine group and a charge density that
varies with pH and time.
The fundamental coagulation mechanisms and stoichiometry of
suspended solid/dissolved organic matter with TBP have been investigated
through laboratory experiments. Suspensions of kaolin clay and humic acid have
been flocculated in a Gator jar using TBP as a sole primary coagulant. Using
online analysis by Photometric Dispersion Analyzer (PDA), the relative floc size
was indicated by a Flocculation Index (FI) during the coagulation process and the
optimal concentration of coagulants was determined in overall terms by NPDOC,
turbidity, colour, UV/Vis absorbance and Floc volume. Under given conditions
the optimum dose of TBP corresponded to that required for maximum a

3
Flocculation Index (FI). The optimum dose of TBP was found to depend on the
charge density of TBP and hence on the pH values of the solution. At neutral and
acid condition, quantitative evidence of a stoichiometric relationship between
TBP dosages with the concentrations of model impurity was illustrated.
Complicating effects were present at higher pH values. The coagulation
behaviour of TBP was generally in agreement with the coagulation mechanisms
widely observed, and typical, of cationic polymers. It was evident that the
coagulation performance and kinetics of TBP was also influenced by other factors,
such as the velocity gradient, ageing of polyelectrolyte and reactor design. For
comparative purposes, alum and a commonly used synthetic cationic polymer
(polyDADMAC) were also assessed in this study as coagulants.
The potential benefits to improving coagulation performance through the
combination of TBP with alum as a dual primary coagulant have been
investigated. Coagulation experiments using different model waters were carried
out under conditions designed to optimize the maximization of flocculation. A
full matrix of coagulation tests demonstrated that a unique optimal dosage of
combined alum and cationic TBP exists at a given pH and component
concentration. In this case, a significant reduction of alum with an improvement
of coagulation efficiency was achieved. An approach to minimize the residual
soluble TBP in treated waters and increase the floc settling by attaching the TBP
to an inert solid (fine sand) has been attempted. The coagulation performance
using this particle suspension (‘solid bound TBP’) as coagulant was found to be
inferior with a high shear rate in accordance with the floc strength interpretations
of TBP. Additional tests with raw waters were carried out to confirm the validity
of the findings from the model water experiments using TBP and the alum/TBP
combinations as primary coagulants.
In the light of these studies, the relative importance of TBP’s chemical
properties, especially molecular weight, charge density and solubility, as crucial

4
parameters of coagulation mechanism is discussed. Furthermore, approaches to
improve flocculation performance with either partial replacement of inorganic
coagulant or the combination with microsand are suggested and analysed.

5
DECLARATION
The work presented in this thesis is my own except where otherwise
acknowledged.
------------------- Gang Fang

6
ACKNOWLEDGEMENTS
I am entirely grateful to my supervisor, Professor Nigel Graham, for
giving me the opportunity to start on this PhD project, and for his continued
guidance, support and help throughout the whole course of this research. Without
these none of this project would have been possible.
Special thanks must be made to Dr. Geoff Fowler from Department of
Civil and Environmental Engineering of Imperial College London and Mr. Mark
Watts from WRc, for their valuable advice, assistance and encouragement during
these years. Both of them devoted a great deal of their time in discussing the
progress of my work. Thanks also to Dr. Alan Herod and Mr. Trevor Morgan
from Department of Chemical Engineering and Chemical Technology of Imperial
College London, and Dr. Joachim Steinke and Mr. Chris Drake from Department
of Chemistry of Imperial College London with regard to the study of the
molecular weight of TBP.
Many thanks to some of my friends at Imperial College London, Mr.
John Hughes, Mr. Bo Ning, Mr. Xingwei Zhu, Mr. Hao Wang, Dr. Karl Smith and
Mr. Andrew Ireson, for their assistance with the writing of this thesis. And also
thanks to Mr. Khoi Tran for his assistance with some of picture and diagrams in
this thesis.
My deep gratitude must go to my dear and beautiful wife Ting Miao,
for her fully support, understanding and confidence in me. Thank you very much
for everything.
I specially thank my parents and my wife’s parents for their unlimited
support for my studying and taking care of my little son when I am absent.

7
Finally, the financial support of Tanac SA, Brazil, and the Universities
UK Overseas Research Students Award Scheme are most gratefully
acknowledged.

8
CONTENTS
ABSTRACT..................................................................................................................2
DECLARATION..........................................................................................................5
ACKNOWLEDGEMENTS ........................................................................................6
CONTENTS..................................................................................................................8
LIST OF TABLES......................................................................................................12
LIST OF FIGURES ...................................................................................................16
LIST OF PRINCIPAL SYMBOLS AND ABBREVIATIONS ...............................23
1. OVERVIEW...........................................................................................................25
2. INTRODUCTION..................................................................................................28
2.1 Introduction .....................................................................................................................28
2.2 Characterisation of Cationic Polymer as Coagulant....................................................29
2.2.1 Molecular Weight and Charge Density of Cationic Polymer .................................30
2.2.2 Types and Structure of Cationic Polymer...............................................................33
2.2.2.1 Synthetic Polymer .......................................................................................33
2.2.2.2 Natural Polymer ..........................................................................................36
2.3 Coagulation Action of Cationic Polymer.......................................................................38
2.3.1 Colloid Stability .....................................................................................................39
2.3.2 Coagulation Mechanisms of Cationic Polymer......................................................40
2.3.2.1 Charge Neutralization .................................................................................41
2.3.2.2 Polymer Bridging ........................................................................................43
2.4 Flocculation Behaviour of Cationic Polymer ................................................................47
2.4.1 Polymer Selection ..................................................................................................47
2.4.2 Coagulation Performance.......................................................................................48
2.4.3 Interaction with Dissolved Organic Matter ............................................................52
2.4.4 Monitoring System.................................................................................................54
2.5 Application of Cationic Polymer in Water Treatment .................................................58
2.5.1 Primary Coagulant Used in Drinking Water Treatment .........................................59
2.5.2 Polymer Toxicity and Residual Polymer................................................................64
2.5.3 Costs.......................................................................................................................66
2.6 Modified Tannin-based Polymer (TBP) as Coagulant .................................................67
2.7 Summary..........................................................................................................................70
3. OBJECTIVES OF STUDY ...................................................................................73
4. MATERIALS AND METHODS...........................................................................76
4.1 Introduction .....................................................................................................................76
4.2 Cogulants .........................................................................................................................77
4.2.1 Tannin-based Polymer............................................................................................77
4.2.2 PolyDADMAC.......................................................................................................78
4.2.3 Alum.......................................................................................................................79
4.2.4 Tanfloc SL..............................................................................................................79
4.3 Reagents and Chemicals .................................................................................................79
4.4 Model Water and Surface Water Sample......................................................................81
9
4.4.1 Model Water with Kaolin Suspension....................................................................81
4.4.2 Model Water with Humic Acid ..............................................................................82
4.4.3 Simulated Water with Kaolin Suspension and Humic Acid ...................................83
4.4.4 Raw Surface Water.................................................................................................84
4.5 Analysis Methods.............................................................................................................85
4.5.1 Polymer Characterisation .......................................................................................85
4.5.1.1 Dissociation, Precipitation and UV Absorbance Analysis...........................85
4.5.1.2 Charge Density Analysis .............................................................................86
4.5.1.3 Functional Group and Chemical Bond Analysis .........................................87
4.5.1.4 Element Content Analysis ...........................................................................89
4.5.1.5 Molecular Weight Analysis .........................................................................91
4.5.2 Coagulation Experiments .......................................................................................92
4.5.2.1 Photometric Dispersion Analyser................................................................92
4.5.2.2 Gator Jar......................................................................................................93
4.5.2.3 Coagulation Process ....................................................................................94
4.5.2.4 Analysis of Water Quality ...........................................................................98
4.5.3 Residual Tannin Measurement .............................................................................100
5. RESULTS: CHARACTERISATION OF TBP..................................................104
5.1 Introduction ...................................................................................................................104
5.2 Characterisations of TBP .............................................................................................105
5.2.1 Dissociation, Precipitation and UV Absorbance of TBP......................................105
5.2.1.1 Dissociation of TBP in Solution................................................................106
5.2.1.2 Solubility of TBP in Solution ....................................................................107
5.2.1.3 UV/visible Light Absorbance....................................................................108
5.2.2 Variation of Charge Density with pH and Time ...................................................110
5.2.3 Elemental Content Analysis .................................................................................112
5.2.4 Chemical Functional Group/Bond Analysis.........................................................112
5.2.4.1 Analysis of FT-IR Spectra .........................................................................113
5.2.4.2 Analysis of 1H NMR Spectra ....................................................................114
5.2.5 Analysis of Molecular Weight..............................................................................116
5.2.5.1 Molecular Weight Determined by SEC.....................................................116
5.2.5.2 Molecular Weight Determined by Light Scattering ..................................117
5.3 Discussion.......................................................................................................................118
6. RESULTS: COAGULATION ACTION OF TBP IN MODEL WATER.........122
6.1 Introduction ...................................................................................................................122
6.2 Coagulation Mechanisms Using TBP as Sole Coagulant ...........................................124
6.2.1 Coagulation of Kaolin Suspensions .....................................................................124
6.2.2 TBP Precipitation Measured by PDA...................................................................129
6.2.3 Coagulation of Humic Acid Solutions .................................................................130
6.3 Coagulation Stoichiometry using TBP as Sole Coagulant .........................................137
6.3.1 Coagulation Stoichiometry in Kaolin Suspension................................................137
6.3.2 Coagulation Stoichiometry with Humic Acid Solution........................................144
6.4 Influence of Conditions on Coagulation Performance...............................................147
6.4.1 Variation of Coagulation with Ageing Time of TBP ............................................147

10
6.4.2 Variation of Coagulation with Mixing Speed.......................................................152
6.4.3 Variation of Coagulation with Reactor.................................................................153
6.5 Coagulation Effectiveness in Comparison with Other Coagulant ............................154
6.6 Floc Strength of TBP.....................................................................................................158
6.6.1 The Effect of Rapid Mixing on Floc Re-formation..............................................158
6.6.2 Floc Strength of TBP in Comparison with Other Coagulants ..............................162
6.7 Discussion.......................................................................................................................166
7. RESULTS: IMPROVEMENT OF TBP COAGULATION PERFORMANCE
USING DUAL COAGULANTS OF TBP WITH ALUM IN MODEL WATER.169
7.1 Introduction ...................................................................................................................169
7.2 Coagulation Action of Dual Coagulant in 50 mg l-1 Kaolin Suspension ...................170
7.2.1 Effect of Solution pH and Optimum Dosage of Alum .........................................170
7.2.2 Optimum Alum-TBP Combination at pH 7..........................................................174
7.2.3 Optimum Alum-TBP Combination at pH 5..........................................................179
7.3 Coagulation Action of Dual Coagulant in Humic Acid Solution at pH6 ..................184
7.3.1 Optimum Alum-TBP Combinations in 15 mg l-1 HA Solution ............................184
7.3.2 Optimum Alum-TBP Combinations in 30 mg l-1 HA Solution ............................194
7.3.3 Locii of the Optimal Alum-TBP Dosage Combinations ......................................202
7.4 Discussion.......................................................................................................................204
8. RESULTS: IMPROVEMENT OF TBP COAGULATION PERFORMANCE
USING SOLID BOUND TBP WITH MICROSAND IN MODEL WATER.......207
8.1 Introduction ...................................................................................................................207
8.2 Adsorption of TBP on Sand..........................................................................................208
8.2.1 Preparation of a Solid Bound TBP.......................................................................208
8.2.2 The Effect of Mixing Time to Solid Bound TBP .................................................212
8.3 Coagulation Action of Solid Bound TBP in HA Solution ...........................................213
8.3.1 Coagulation Performance of Solid Bound TBP at pH 4.......................................213
8.3.2 Coagulation Performance of Solid Bound TBP at pH 6.......................................215
8.4 Discussion.......................................................................................................................217
9. RESULTS: COAGULATION EXPERIMENTS OF RAW WATER...............219
9.1 Introduction ...................................................................................................................219
9.2 Coagulation Performance of TBP in Simulated Water ..............................................220
9.3 Coagulation Performance of Different Coagulants with Raw Water .......................221
9.3.1 Coagulation Tests of Raw Water without pH Adjustment....................................221
9.3.2 Coagulation Tests of Raw Water with pH Adjustment at pH 6 ............................223
9.3.2.1 Coagulation Performance of Alum............................................................223
9.3.2.2 Coagulation Performance of TBP .............................................................224
9.3.2.3 Coagulation Performance of Alum/TBP Combination..............................226
9.3.2.4 Floc Strength of Alum-TBP Combination.................................................232
9.4 Discussion.......................................................................................................................233
10. GENERAL DISCUSSION.................................................................................235
11. CONCLUSIONS ................................................................................................251
12. SUGGESTED FUTURE WORK......................................................................256
13. REFERENCES...................................................................................................258
11
14. APPENDIX .........................................................................................................283
APPENDIX I: Laboratory G Curve for Flat Paddle in 2L Gator Jar (143)...........................283
APPENDIX II: The specific refractive index increment (dn/dc) of TBP..............................284
APPENDIX III: Laser Scattering Zimm Plot for TBP………………………………………285
12
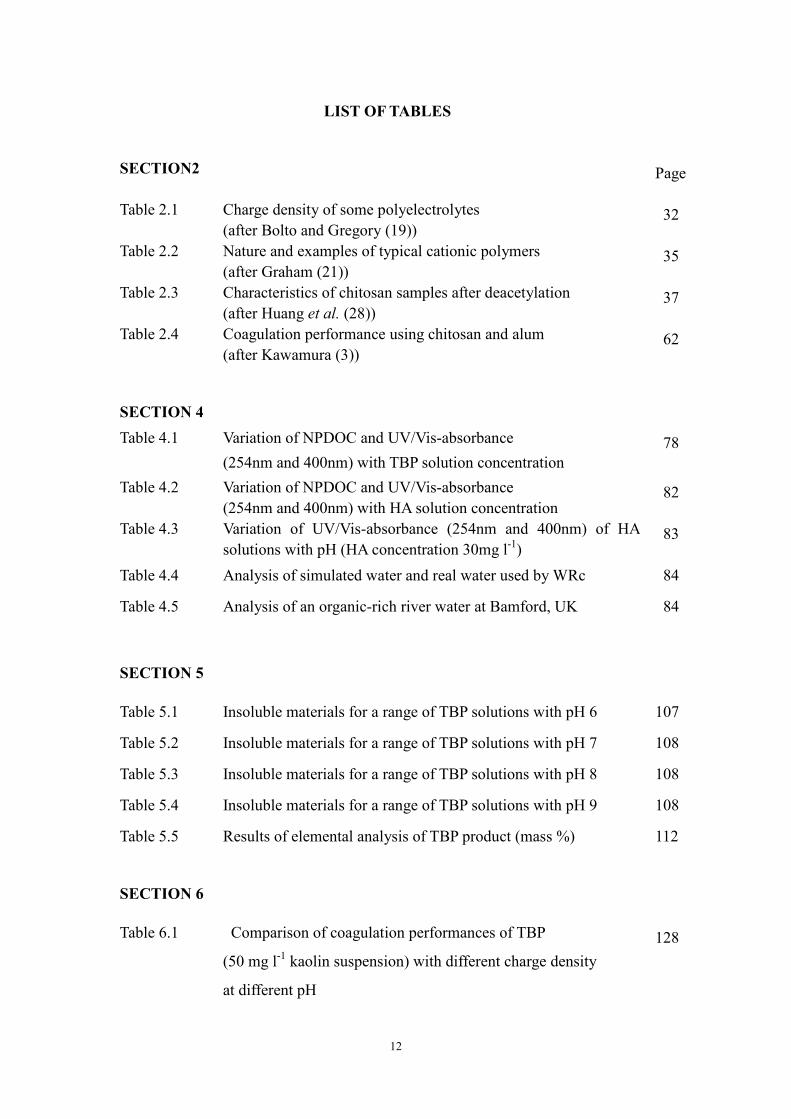
LIST OF TABLES
SECTION2
Page
Table 2.1 Charge density of some polyelectrolytes (after Bolto and Gregory (19))
32
Table 2.2 Nature and examples of typical cationic polymers (after Graham (21))
35
Table 2.3 Characteristics of chitosan samples after deacetylation (after Huang et al. (28))
37
Table 2.4 Coagulation performance using chitosan and alum (after Kawamura (3))
62
SECTION 4
Table 4.1 Variation of NPDOC and UV/Vis-absorbance
(254nm and 400nm) with TBP solution concentration 78
Table 4.2 Variation of NPDOC and UV/Vis-absorbance (254nm and 400nm) with HA solution concentration
82
Table 4.3 Variation of UV/Vis-absorbance (254nm and 400nm) of HA solutions with pH (HA concentration 30mg l-1)
83
Table 4.4 Analysis of simulated water and real water used by WRc 84
Table 4.5 Analysis of an organic-rich river water at Bamford, UK 84
SECTION 5
Table 5.1 Insoluble materials for a range of TBP solutions with pH 6 107
Table 5.2 Insoluble materials for a range of TBP solutions with pH 7 108
Table 5.3 Insoluble materials for a range of TBP solutions with pH 8 108
Table 5.4 Insoluble materials for a range of TBP solutions with pH 9 108
Table 5.5 Results of elemental analysis of TBP product (mass %) 112
SECTION 6
Table 6.1 Comparison of coagulation performances of TBP
(50 mg l-1 kaolin suspension) with different charge density
at different pH
128

13
Page
Table 6.2 NPDOC before and after coagulation with TBP dosage at pH 4 (30 mg l-1 HA)
132
Table 6.3 Absorbance at 254nm and 400nm before and after coagulation with TBP dosage at pH 4 (30 mg l-1 HA)
132
Table 6.4 NPDOC before and after coagulation with TBP dosage at pH 7 (30 mg l-1 HA)
133
Table 6.5 Absorbance at 254nm and 400nm before and after coagulation with TBP dosage at pH7 (30 mg l-1 HA)
134
Table 6.6 NPDOC before and after coagulation with TBP dosage
at pH 9 (10 mg l-1 HA)
135
Table 6.7 Absorbance at 254nm and 400nm before and after
coagulation with TBP dosage at pH 9 (10 mg l-1 HA)
135
Table 6.8 Variation in optimum TBP dose and coagulation performance (HA solutions) with pH
136
Table 6.9 Optimum dosage of TBP with different Kaolin concentrations at pH 4, and the corresponding peak flocculation index and
turbidity reduction
139
Table 6.10 Optimum dosage of TBP with different Kaolin concentrations at pH 7, and the corresponding peak flocculation index and
turbidity reduction
140
Table 6.11 Optimum dosage of TBP with different HA concentrations at
pH 4, and the corresponding peak flocculation index
and reduction in NPDOC and colour
145
Table 6.12 Optimum dosage of TBP with different HA concentrations at
pH 7, and the corresponding peak flocculation index
and reduction in NPDOC and colour
147
Table 6.13 Optimum dose of coagulants at pH 7, and NPDOC reduction (30 mg l-1 HA)
157
Table 6.14 Strength and recovery factors obtained for different coagulants (floc breakage at 300 rpm and 60 s) at pH 7
(50 mg l-1kaolin suspension)
164
Table 6.15 Strength and recovery factors obtained for different coagulants(floc breakage at 300 rpm and 300 s) at pH 7
(50 mg l-1 kaolin suspension)
164

14
SECTION 7 Page
Table 7.1 Coagulation performance for the optimum dosage of TBP at each alum dose (in terms of maximum flocculation index, residual turbidity and aluminium, and Floc volume) at pH7 (50mg l-1 kaolin suspension)
179
Table 7.2 Coagulation performances for the optimum dosage of TBP at each alum dose (in terms of maximum flocculation index, residual turbidity and aluminium, and Floc volume) at pH 5 (50 mg l-1 kaolin suspension)
183
Table 7.3 Coagulation performance for the different dosage of alum
at pH6 (15 mg l-1 HA)
186
Table 7.4 Coagulation performance for the optimum TBP dosage with
different alum doses at pH6 (15 mg l-1 HA)
192
Table 7.5 Coagulation performance for the optimum dosage of TBP with different alum dose at pH6 (30 mg l-1 HA)
200
SECTION 8
Table 8.1 Residual TBP in solution after 2 min mixing with sand
(20% H2O2 solution washed, 30mg l-1 TBP)
209
Table 8.2 Residual TBP in solution after 2 min mixing with sand
(5% Decon solution washed, 30mg l-1 TBP)
210
Table 8.3 Residual NPDOC in solution after 2 min mixing with sand
(5% Decon solution washed, 30mg l-1 TBP)
210
Table 8.4 Residual TBP in solution after 2 min mixing with sand
(5% Decon solution washed; 60mg l-1 TBP)
211
Table 8.5 Residual TBP in solution with different mixing time
(5% Decon solution washed; 60 mg l-1 TBP)
212
Table 8.6 NPDOC and UV-visible light absorbance at 254nm and
400nm in filtered water at pH4(30 mg l-1 HA)
215
Table 8.7 NPDOC and UV-visible light absorbance at 254nm and
400nm in filtered water at pH6 (30mg l-1 HA)
216

15
SECTION 9 Page
Table 9.1 Coagulation results for the artificial water using 15 mg l-1 TBP 221
Table 9.2 Coagulation results for the real water using 15 mg l-1 TBP 221
Table 9.3 Variation of coagulation performance with TBP dosage for
Bamford raw water without pH adjustment
222
Table 9.4 Variation of coagulation performance with alum dosage at pH6 (Bamford raw water)
224
Table 9.5 Variation of coagulation performance with TBP dosage at pH6 (Bamford raw water)
225
Table 9.6 Coagulation performance for the combination of TBP/Alum
at pH6 (Bamford raw water)
230
Table 9.7 Variation of coagulation performance with TBP and alum doses at pH6 (Bamford raw water)
231
Table 9.8 Strength and recovery factors obtained for different coagulants(floc breakage at 300rpm for 60s) at pH6 (Bamford raw water)
233
SECTION 10
Table10.1 Characteristics and coagulation behaviours of TBP with kaolin 241
Table 10.2 Optimum dose of coagulants and treatment effectiveness from real water and model water
247

16
LIST OF FIGURES
SECTION 2 Page Figure 2.1 Synthesis of (a) linear polyamine and (b) branched
polyamine (after Choi et al. (23)) 34
Figure 2.2 Basic structure of chitosan (deacetylation degree 100%) (after Bolto and Gregory (19))
37
Figure 2.3 The net interaction energy curve ( after Ravina (42)) 39 Figure 2.4 “Electrostatic patch” model for flocculation of negative
particles by cationic polyelectrolytes (after Bolto and Gregory, (19) )
43
Figure 2.5 Model of an adsorbed polymer chain (after Bolto and Gregory (19))
44
Figure 2.6 Chemical structure of condense-tannin 68
SECTION 4 Figure 4.1 Schematic of coagulation apparatus
94
Figure 4.2 Apparatus of coagulation tests 98 Figure 4.3 Absorbance at 700nm with low tannin acid concentration 102 Figure 4.4 Absorbance at 700nm with high tannin acid concentration 102 Figure 4.5 Absorbance at 700nm (10mm cell path) with whole range of
tannin acid concentration 103
SECTION 5
Figure 5.1 TBP solution titration curve: 100ml Tannin (0.03g l-1) titrated with 0.001mol l-1 NaOH
106
Figure 5.2 UV-Vis scan of TBP solution with a series of TBP concentrations
109
Figure 5.3 Variation of absorbance at 210nm (10mm cell path) with TBP concentrations (pH = 4, 6 and 8)
110
Figure 5.4 Charge density of TBP as a function of pH 111 Figure 5.5 Temporal variation of charge density of TBP at different pH 112 Figure 5.6 FT-IR spectra of TBP 114 Figure 5.7 FT-IR spectra of tannin extract 114 Figure 5.8 1H NMR spectra of TBP 115 Figure 5.9 Elution curve of TBP by size exclusion chromatography 117 Figure 5.10 The proposed basic repeating unit in TBP 120
SECTION 6 Figure 6.1 Flocculation index response with TBP dose at pH4
(50 mg l-1 kaolin suspension) 125

17
Page
Figure 6.2 Flocculation index response with TBP dose at pH7 (50 mg l-1 kaolin suspension)
125
Figure 6.3 Flocculation index response with TBP dose at pH9 (50 mg l-1 kaolin suspension)
126
Figure 6.4 Residual turbidities before and after coagulation using TBP at pH 4 (50 mg l-1 kaolin suspension)
126
Figure 6.5 Residual turbidities before and after coagulation using TBP
at pH 7 (50 mg l-1 kaolin suspension)
127
Figure 6.6 Residual turbidities before and after coagulation using TBP
at pH 9 (50 mg l-1 kaolin suspension)
127
Figure 6.7 Comparison of the FI response between TBP precipitation
in blank water and coagulation in kaolin suspension
at pH 7 and pH 9
130
Figure 6.8 Flocculation index response with TBP dose at pH 4
(30 mg l-1 HA)
131
Figure 6.9 Flocculation index response with TBP dose at pH 7
(30 mg l-1 HA)
133
Figure 6.10 Flocculation index response with TBP dose at pH 9
(10 mg l-1 HA)
134
Figure 6.11 Flocculation index response with TBP dose at pH4
(25 mg l-1 kaolin suspension)
138
Figure 6.12 Flocculation index response with TBP dose at pH4
(100 mg l-1 kaolin suspension)
138
Figure 6.13 Flocculation index response with TBP dose at pH7
(25 mg l-1 kaolin suspension)
139
Figure 6.14 Flocculation index response with TBP dose at pH7 (100 mg l-1 kaolin suspension)
140
Figure 6.15 Flocculation index response with TBP dose at pH9 (50 mg l-1 kaolin suspension)
142
Figure 6.16 Flocculation index response with TBP dose at pH9 (25 mg l-1 kaolin suspension)
143
Figure 6.17 Flocculation index response with TBP dose at pH9 (12.5 mg l-1 kaolin suspension)
143
Figure 6.18 Flocculation index response with TBP dose at pH4 (15 mg l-1 HA)
144

18
Page Figure 6.19 Flocculation index response with TBP dose at pH4
(50 mg l-1 HA) 145
Figure 6.20 Flocculation index response with TBP dose at pH7 (15 mg l-1 HA)
146
Figure 6.21 Flocculation index response with TBP dose at pH7 (50 mg l-1 HA)
146
Figure 6.22 Flocculation index response for different aging periods at pH 4 (50mg l-1 kaolin suspension)
148
Figure 6.23 Flocculation index response for different aging periods at pH 7 (50mg l-1 kaolin suspension)
149
Figure 6.24 Flocculation index response for different aging periods at pH 9 (50mg l-1 kaolin suspension)
149
Figure 6.25 Flocculation index response for different aging periods at pH 4 (30 mg l-1 HA)
150
Figure 6.26 Flocculation index response for different aging periods at pH 7 (30 mg l-1 HA)
151
Figure 6.27 Flocculation index response for different aging periods at pH 9 (10 mg l-1 HA)
151
Figure 6.28 Flocculation index response for different mixing intensities at pH 4 (50mg l-1 kaolin suspension)
152
Figure 6.29 Flocculation index response for different reactors at pH 9 (50mg l-1 kaolin suspension)
153
Figure 6.30 Flocculation index response for different reactors at pH 7 (50mg l-1 kaolin suspension)
154
Figure 6.31 Flocculation index response with different coagulants at pH 7, and TBP at pH9 (50 mg l-1 kaolin suspension)
155
Figure 6.32 Residual turbidity before and after coagulation with different coagulants at pH 7 (50 mg l-1 kaolin suspension)
155
Figure 6.33 Flocculation index response with different coagulants at pH 7 (30 mg l-1 HA)
157
Figure 6.34 Monitoring of floc formation at 50 rpm (48 s-1), with varying breakage speed (200 rpm (350 s-1) to 400 rpm (950 s-1) ) and re-formation at 50 rpm (48 s-1) (50 mg l-1 kaolin suspension at pH7)
159
Figure 6.35 Variation of residual turbidity before breakage and after re-formation, with velocity gradient at pH7 (50 mg l-1 kaolin suspension)
160
Figure 6.36 Monitoring of floc formation at 50 rpm (48 s-1), breakage
at 300 rpm (600 s-1)for different periods and re-formation
at 50 rpm (48 s-1) at pH7 (50 mg l-1 kaolin suspension)
161

19
Page
Figure 6.37 Variation of residual turbidity before breakage and after
re-formation, with breakage period at pH 7
(50 mg l-1 kaolin suspension)
162
Figure 6.38 Monitoring of floc formation at 50 rpm, breakage at 300 rpm for 60 s and re-formation at 50 rpm using different coagulants at pH 7 (50 mg l-1 kaolin suspension)
163
Figure 6.39 Monitoring of floc formation at 50 rpm, breakage at 300 rpm for 300 s and re-formation at 50 rpm using different coagulantsat pH 7 (50 mg l-1 kaolin suspension)
164
Figure 6.40 Monitoring of floc formation, and re-formation at pH9
using TBP (50 mg l-1 kaolin suspension)
166
SECTION 7
Figure 7.1 Dynamic monitoring of kaolin coagulation (50 mg l-1) at pH4 using different dosages of alum
171
Figure 7.2 Dynamic monitoring of kaolin coagulation (50 mg l-1) at pH5 using different dosage of alum
172
Figure 7.3 Dynamic monitoring of kaolin coagulation (50 mg l-1) at pH7 using different dosage of alum
173
Figure 7.4 Flocculation index response with TBP dose and 3.4 mg l-1 Al3+ at pH7 (50 mg l-1 kaolin suspension)
174
Figure 7.5 Flocculation index response with TBP dose and 3.0 mg l-1 Al3+ at pH7 (50 mg l-1 kaolin suspension)
175
Figure 7. 6 Flocculation index response with TBP dose and 2.5 mg l-1 Al3+ at pH7 (50 mg l-1 kaolin suspension)
175
Figure 7.7 Flocculation index response with TBP dose and 2.0 mg l-1 Al3+ at pH7 (50 mg l-1 kaolin suspension)
176
Figure 7.8 Flocculation index response with TBP dose and 1.5 mg l-1 Al3+ at pH7 (50 mg l-1 kaolin suspension)
176
Figure 7.9 Flocculation index response with TBP dose and 1.0 mg l-1 Al3+ at pH7 (50 mg l-1 kaolin suspension)
177
Figure 7.10 Variation of Flocculation index with alum and TBP doses at pH7 (50 mg l-1 kaolin suspension)
178
Figure 7. 11 Flocculation index response with TBP dose and 0.05 mg l-1 Al3+at pH5 (50 mg l-1 kaolin suspension)
180
Figure 7.12 Flocculation index response with TBP dose and 0.1 mg l-1 Al3+ at pH5 (50 mg l-1 kaolin suspension)
180
Figure 7.13 Flocculation index response with TBP dose and 0.15 mg l-1 Al3+ at pH5 (50 mg l-1 kaolin suspension)
181

20
Page
Figure 7.14 Flocculation index response with TBP dose and 0.2 mg l-1 Al3+ at pH5 (50 mg l-1 kaolin suspension)
181
Figure7. 15 Flocculation index with alum and TBP doses at pH 5 (50 mg l-1 kaolin suspension)
182
Figure 7.16 Locus of alum-polymer dosage combinations for 50 mg l-1 kaolin at pH5
183
Figure 7.17 Dynamic monitoring of 15 mg l-1 HA at pH 6 using different dosages of alum
185
Figure 7.18 Flocculation index response with TBP dose at pH 6 (15 mg l-1 HA)
187
Figure 7.19 Flocculation index response with Tanfloc SL dose at pH 6 (15 mg l-1 HA)
187
Figure 7.20 Flocculation index response with 1.35 mg l-1 as Al3+ and different TBP dosages at pH 6 (15 mg l-1 HA)
188
Figure 7.21 Flocculation index response with 0.81 mg l-1 as Al3+ and different TBP dosages at pH 6 (15 mg l-1 HA)
189
Figure 7.22 Flocculation index response with 0.135 mg l-1 as Al3+ and different TBP dosages at pH 6 (15 mg l-1 HA)
189
Figure 7.23 Flocculation index response with TBP dose and different Al concentrations at pH 6 (15 mg l-1 HA)
190
Figure 7.24 Flocculation index response with different optimum
coagulants at pH6 (15 mg l-1 HA)
193
Figure 7.25 Dynamic monitoring of 30 mg l-1 HA at pH 6 using different dosages of alum
195
Figure 7.26 Flocculation index response with TBP dose at pH 6 (30 mg l-1 HA)
195
Figure 7.27 Flocculation index response with Tanfloc SL dose at pH 6 (30 mg l-1 HA)
196
Figure 7.28 Flocculation index response with 2.7 mg l-1 as Al3+ and different TBP doses at pH 6 (30 mg l-1 HA)
197
Figure 7.29 Flocculation index response with 1.35 mg l-1 as Al3+ and
different TBP doses at pH6 (30 mg l-1 HA)
197
Figure 7.30 Flocculation index response with 0.81 mg l-1 as Al3+ and
different TBP doses at pH6(30 mg l-1 HA)
198
Figure 7.31 Flocculation index response with 0.405 mg l-1 as Al3+
and different TBP doses at pH6 (30 mg l-1 HA)
198
Figure 7.32 Flocculation index response with TBP dose and different Al
concentrations at pH6 (30 mg l-1 HA)
199

21
Page
Figure 7.33 Flocculation index response with different optimum coagulants at pH6 (30 mg l-1 HA)
201
Figure 7.34 Locii of alum-TBP dosage combinations for optimal
coagulation performance at pH6
202
Figure 7.35 Variation of Flocculation Index and colour removal along coagulant dosage locus for 15 mg l-1 HA at pH6
203
Figure 7.36 Variation of Flocculation Index and colour removal along coagulant dosage locus for 30 mg l-1 HA at pH6
204
SECTION 8 Figure 8.1 Variation of the residual TBP with TBP/Sand Ratio 211 Figure 8.2 Flocculation index response with the solid bound TBP at
pH4 (30 mg l-1 HA) 213
Figure 8.3 Flocculation index response with the solid bound TBP at pH6 (30mg l-1 HA)
216
SECTION 9 Figure 9.1 Flocculation index response with TBP dose for artificial
water 220
Figure 9.2 Dynamic monitoring of raw water (Bamford, UK)using different dosage of TBP without pH adjustment
222
Figure 9.3 Dynamic monitoring of raw water at pH 6 using different doses of alum (Bamford raw water, UK)
223
Figure 9.4 Dynamic monitoring of raw water at pH 6 using different doses of TBP (Bamford raw water, UK)
225
Figure 9.5 Flocculation index response with 25 mg l-1 TBP and different Alum doses at pH6 (Bamford raw water, UK)
226
Figure 9.6 Flocculation index response with 20 mg l-1 TBP and different Alum doses at pH6 (Bamford raw water, UK)
227
Figure 9.7 Flocculation index response with 30 mg l-1 TBP and different Alum doses at pH6 (Bamford raw water, UK)
227
Figure 9.8 Locus of alum-TBP dosage combinations for optimal
coagulation performance at pH6 (Bamford raw water, UK)
228
Figure 9.9 Variation of Flocculation Index and colour removal along locus line of coagulant dosage at pH6 (Bamford raw water, UK)
229
Figure 9.10 Flocculation index response with 10 mg l-1 TBP and
different Alum doses at pH6 (Bamford raw water, UK)
231

22
Page
Figure 9.11 Monitoring of floc formation at 50 rpm, breakage at 300 rpm for 60s and re-formation at 50 rpm using different coagulants at pH6 (Bamford raw water, UK)
232
SECTION 10
Figure 10.1 Proposed model structure for TBP 236
Figure 10.2 Locii of alum-TBP dose combinations for FImax (optimum) and 0.75 FImax with HA at two concentrations at pH6
245

23
LIST OF PRINCIPAL SYMBOLS AND ABBREVIATIONS
A Titrant volume for sample
Abs Absorbance units
aC Fluctuating component
B Titrant used for blank
C Floc strength co-efficient
CD Charge density
cm Centimetre
CPAM Cationic polyacrylamide
d Floc dimeter
DBPs Disinfection by-products
dc Average transmitted light intensity
DD Deacetylation degree
dg Drain dimeter
DL Detection limit
DMA Dimethylamine
DMAEMA Dimethylaminoethyl methacrylate
dn/dc Refractive index/Polymer concentration
DOC Dissolved organic carbon
DOM Dissolved organic matter
DS Degrees of substitution
ECH Epichlorohydrin
FI Flocculation index
G Velocity gradient
g Gram
h Hour
l Litre
m Metre
meq Milli-equivalent weight

24
mV Millivolt
ml Millilitre
mg Milligram
min Minute
µm Micrometre
µg Microgram
mol Mole
M Molarity of silver nitrate
MW Molecular weight
<M>w Average molecular weight
NOM Natural organic matter
NPDOC Non-purgeable dissolved organic carbon
NTU Nephelometric turbidity unit
nm Nanometer
PDA Photometric Dispersion Analyser
PDADMAC Polydiallyldimethyl-ammonium chloride
PEO Polyethylene oxide
ppm Part per million
rms Root mean square
rpm Revolutions per minute
s Second
SUVA Specific UV-absorbance
T Retention time
TBP Tannin based polymer
TOC Total organic carbon
UV- Ultra-violet
Vis- Visible
w/w Weight per Weight
λ Wave length
ZP Zeta potential
25
1. OVERVIEW
Water production normally involves physicochemical procedures, which
include processes such as the coagulation and flocculation of suspended solids
and colloids, the adsorption of soluble materials on solid substrates and
ion-exchange resins, oxidation to destroy organic impurities and membrane
technologies (1). The primary method for the coagulation/flocculation of
suspension particles and dissolved organic matter is commonly carried out with a
metal salt such as alum (aluminium sulphate), or a synthetic polymer such as
polyDADMAC, and much has already been done in water and wastewater
treatment to optimize this process.
Employing hydrolysable metal salts (aluminium or iron salts) for
coagulation is a long-standing technology, because the high valency metal ions
undergoing hydrolysis reactions in aqueous solution have a higher positive charge
that interacts specifically with negative colloids (clay particles and natural
organic materials) and neutralize their charge, giving destabilization and
coagulation. In most practical water treatment operations, metal coagulants are
added at high dosages and extensive precipitation occurs. The enmeshment of
particles by the precipitate is generally thought of as “sweep coagulation”.
However, this method of coagulation produces large amounts of sludge (2).
Organic polymers can be used as primary coagulants in the more traditional
flocculation step of binding already formed small flocs into larger and stronger
flocs which can tolerate the high shear forces encountered in the filtration stages
(3). The larger particles formed in this way also give accelerated rates of
sedimentation because the volume of sludge produced is more than halved (1).
However, the long-term effects of these polymers on human health are not well
understood (4).
In water treatment, cationic polymers and inorganic metal salts appear to

26
have complementary roles as coagulants (5). The combined use of hydrolysable
metal salts (aluminium or iron salts) with polyelectrolytes is intended to
maximize the benefits of both coagulants through the reduction of the inorganic
coagulant dosage and the production of larger and stronger flocs. The increased
use of synthetic cationic polymers (polyamine and polyDADMAC) as
coagulation aids has led to a few studies (6, 7) on the effectiveness of dual
coagulants. However, there is relatively little published information on
coagulation performance using optimal combinations of metal salts with natural
polymers in water treatment, or further on the relationship between the character
of natural polymers and treatment effectiveness. Thus, there is much opportunity
for improved dual coagulants that are tailor made for particular processes.
To date, the use of natural tannin-based polymers (TBP) as coagulants in
water and wastewater treatment is assumed to be commercially attractive; taking
into account their proven low cost and basic information of their chemistry
properties from their modification process, which includes Mannich reaction and
polymerization (8). However, adequate investigation has not yet been undertaken
on the characterization of TBP. As a result of the incomplete understanding of the
chemical structure and functional group of this polymer, classic coagulation
theories may not allow prediction of the mechanism and behaviour of the TBP in
either model water or raw water, hence failure to achieving improved flocculation
performance.
The emphasis here is on the application of a soluble tannin-based polymer
in coagulation/flocculation processes, which are followed by a separation step in
the form of sedimentation or flotation, with a final polishing by filtration. Due to
a lack of available information, the characterization of the modified tannin
polymer has to be assessed. The originality of this thesis is to design a broad
scheme for undertaking a full characterization of TBP by qualitative or/and
quantitative analysis using some modern analytical techniques and older classical

27
techniques, hence providing an unambiguous description of the polymer,
monomer, structure and other chemical properties.
The other ambition in this research is to evaluate the coagulation
performance of the TBP based on clearly unveiling the relationship between the
chemical properties and coagulation mechanisms of the TBP. This should yield a
much clearer understanding of the reaction action between this polymer and the
particle suspensions or/and dissolved organic matter during the water treatment
process. When the TBP is used as a primary coagulant to partially replace alum, it
is desirable to be able to determine a unique optimal dosage combination of the
metal salt and the polymer. But, achieving improved performance with the
reduced alum dosage and a low concentration of the residual tannin in final water
is a challenge in its practical application.
In summary, this study has attempted, through laboratory investigations,
to provide the basic chemistry properties of the TBP, to evaluate their relative
contribution to the various coagulation mechanisms and to improve its
coagulation performance in model water and surface real water.

28
2. INTRODUCTION
2.1 Introduction
In water purification and wastewater treatment, coagulation/flocculation is
the most conventional technique in conjunction with sedimentation and filtration
to remove dissolved organic matter (DOM) and suspended particles. The primary
method for making colloids aggregate, coagulation, is normally carried out with
metal salts such as aluminum and iron salts, and much has already been done to
optimize this process. The interest in the use of polymers to partially or
completely replace inorganic coagulants as primary coagulants in water industry
arises from the significant inherent advantages of polymers. This is mainly based
on their high treatment efficiency, small coagulant dosage requirements, the
reduced voluminous sludge, facilitation of filtration, and reduced level of
aluminum in treated water (1, 9). In colloid chemistry, it is common to restrict the
term ‘coagulation’ to cases where the aggregates tend to be small and dense;
‘flocculation’ is then restricted to the cases where aggregates tend to be larger and
more open in structure. However, in the water industry, ‘coagulation’ is used to
describe the chemical destabilizing process instigated by the addition of some
reagent to the colloidal system, whilst ‘flocculation’ describes the process
whereby the destabilized particles join together to form large agglomerates (10).
Polymers are broadly divided into three categories based on their ionic
nature: cationic, anionic and non-ionic. Principally cationic polymers are used as
primary coagulants for water treatment; anionic and nonionic polymers have
gained wide acceptance as flocculant aids. The water-soluble polymers with
many repeating units (or monomers), usually referred to as polyelectrolytes, are
either synthetic organic compounds, meaning man-made and starting from small
molecules, or natural organic materials as original extracts from certain plants or
animal life, or as modified derivatives by subsequent reactions.

29
It is well documented that both natural and synthetic cationic polymers
can be used as primary coagulants in water treatment (3, 11). A number of
published studies on the chemical characterization, coagulation mechanism and
flocculation performance of synthetic cationic polyelectrolytes for water
treatment have been carried out over the years. However, health and
environmental issues of synthetic polymers still require attention (4). Possible
negative consequences could arise from the reaction of synthetic polymers with
other water treatment chemicals such as chlorine for example, increasing the level
of disinfection by-products (1). In marked contrast, although some investigations
related to the coagulation kinetics of natural polymers in model water and the use
of natural polymers in the wastewater industry have been carried out, very little is
currently clearly known of the fundamental mechanism of natural polymers in the
coagulation process and their application in drinking water treatment. The focus
in this review is on the use of cationic polyelectrolytes in the coagulation and
flocculation processes. Most of classic coagulation theories are found from the
studies of synthetic polyelectrolytes as coagulants. These theories provide a
reference for the mechanisms of coagulation with the tannin-based polymer in
later research.
2.2 Characterisation of Cationic Polymer as Coagulant
Knowledge about a polymer’s molecular weight and charge density, the
chemical structure of the monomer, and the active groups in the product would be
a significant step toward developing a scientific method for polymer selection in
water treatment. However, the chemistry of cationic polymers is more complex
than that of anionic species, because there are more variable reactions for the
preparation of cationic polymers, which involve free-radical addition
polymerization, epoxide addition reaction, condensation reaction, and a variety of
reactions on existing polymer backbones, including Mannich reactions, Hofman
degradations and nucleophilic displacements (12). Cationic polymers, as

30
coagulants in water treatment, must be water soluble and can vary in structure
(linear versus branched), composition, molecular weight and amount of charge.
2.2.1 Molecular Weight and Charge Density of Cationic Polymer
A polymer’s molecular weight (MW) and charge density (CD) are the
crucial parameters governing its coagulation performance. Both of these
properties can be quantified and are believed to readily relate with the two
well-known coagulation mechanisms, charge neutralisation and polymer bridging.
Both of these will be discussed later.
The molecular weight of the polymer ranges from a few thousands to
millions of grams per mole. It is widely understood that if the polymer molecular
weight is sufficient, the “polymer bridging” model should apply during the
flocculation process (12). By virtue of their different uses, polymers can be
conveniently divided into three classes: low (<105), medium (105-106) and high
molecular weight (>106) (12). It has previously been stated that polymers in
aqueous solution always present a random coil configuration. Generally, for
polymers, the size of the coil is nearly proportional to the square root of the MW
(13). The molecular weight is considered to be closely associated with
rheological, osmotic, and light scattering properties by some straightforward
equations (14). Both light scattering and viscosity are most commonly used to
determine the molecular weight based on measuring the intensity of scattering
light and intrinsic viscosity of polymers in solution. However, unlike small
molecules, the molecular weight of a polymer is not unique. Rather, a given
polymer will have a distribution of molecular weights. The MW distribution will
depend on the way that the polymer is produced. It is more proper to use the term
“average molecular weight” to indicate the polymer mass. Dentel et al.(15) cited
a simple viscosimetric method to determine the average molecular weight of
acrylamide-based polymers for water treatment. Light-scattering technology has

31
been also undertaken by Ghosh et al. (16) to measure the average molecular
weight of various commercial polymers used as flocculants.
The charge density of a polyelectrolyte is another important polymer
property, and should be indicative of the amount of polymer charge available to
affect particle destabilization via the “charge neutralisation” mechanism, hence
greatly influencing the effectiveness of the coagulant. The charge density of the
polymer is dependent upon the degree of ionization of the functional groups, the
degree of copolymerization and the amount of substituted groups in the polymer
structure (17). It is usually found that the polymer coil can be significantly
expanded for polymers with high CD values, due to the appreciable repulsion
between polymer segments. The CD of a polymer in solution can be determined
by a procedure known as colloid titration (18), which has been presented in a
procedure manual (15). Charge density can be expressed in terms of
milliequivalents per gram (meq g-1) if the homogeneous segments of polymers are
strongly ionic and fully charged. However, for a copolymer of non-ionic and
cationic monomeric species, the charge density is commonly expressed as mole
per cent of charge groups. In this case, polyelectrolytes can be regarded as having,
low, medium or high CD values, corresponding to the mol% of ionic groups
around: 10%, 25%, and 50-100%, respectively (19). The charge density of some
cationic polyelectrolytes has been determined and summarized in Table 2.1.

32
TABLE 2.1 Charge density of some cationic polyelectrolytes (after Bolto and
Gregory (19))
Polymer Molecular
formula
CD
( mol%)
CD
( meq g-1)
PDADMAC
Poly (Diallyldimethyl
ammonium Chloride)
C8H16N Cl 100 6.2
ECH/DMA
(Epichlorohydrin/Dimethylamine)C5H12ON Cl 100 7.3
CPAM
(cationic polyacrylamide) C8H16O2N Cl 100 5.2
CPAM (C8H16O2NCl)0.5
(C3H5ON)0.5 50 3.8
CPAM (C8H16O2NCl)0.25
(C3H5ON)0.75 25 2.5
CPAM (C8H16O2NCl)0.1
(C3H5ON)0.9 10 1.2
Chitosan C6H11O4N·HCl 100 5.2

33
2.2.2 Types and Structure of Cationic Polymer
2.2.2.1 Synthetic Polymer
There are typically two routes for the synthesis of cationic polymers, in
water treatment practice, by homopolymerization with a single repeating cationic
unit, and by copolymerization with a proportion of non-ionic and cationic
monomers. In general, the most prominent of synthetic cationic polymers
available for water treatment contains quaternary ammonium groups that have a
formal positive charge irrespective of pH (19). However, there have also been
commercial polyelectrolytes which consist of polyamines containing primary,
secondary or tertiary amino groups, or mixtures of them. The charge density of
these non-quaternary amine groups varies with pH values of solution (20). Table
2.2 details these different forms of polymers (21). The properties of polymers are
obviously affected by their synthesis processes. For example, in the preparation
of polyacrylamide, heterogeneous polymers are typically formed by
co-polymerizing nonionic acrylamide with a particular cationic monomer, giving
cationic polymers of high molecular weight (105-107 g mol-1). However, the
nonionic polyacrylamide can be post-reacted with formaldehyde and
dimethylamine, a secondary amine, to give the aminomethylated polyacrylamide
as a flocculant via the Mannich reaction (22). In this case, the corresponding
unquaternized amine is only cationic at low or moderate pH values due to its
deprotonation at increasing pH. The preparation of cationic polyamine has been
thoroughly reviewed by Chio et al. (23). They found that the reaction of
epichlorohydrin with a secondary amine such as dimethylamine produces either
linear polyamine or branched polyamine with a modifier. The synthesis process is
shown in Figure 2.1.
In general, quaternary ammonium polymers have a widely commercial
application as flocculants, in the protonated form after the quaternization of
tertiary nitrogen. Polyamine, polyacrylamide and polyDADMAC are commonly

34
used as primary coagulants in the total/partial replacement of conventional
inorganic coagulants such as FeCl3 and Al2 (SO4)3 (24). Mangravite (25) stated
that both polyDADMAC and polyamine which contain quarternary amine groups
are pH-independent in their charge density. Mangravite also found that the typical
polymer dose of primary coagulants for most applications is 0.5 to 10 mg l-1 and
0.1 to 1.0 mg l-1 when applied as coagulant aids. In the UK, polyamines are more
frequently used in potable water treatment than poly DADMAC (19).
Figure 2.1 The synthesis of (a) linear polyamine and (b) branched polyamine
(after Choi et al. (23))

35
TABLE 2.2 Nature and examples of typical cationic polymers (after Graham (21))
Structure Type Functional Group Example CD
1. Tertiary Amine
N
H
R 2
R 1
n
C H2
C H2
N H2
n
P o l y e t h y l e n e i m i n e
V a r i a b l e w i t h p H
++
2. Quaternary Amine
N
R 3
R 2
R 1
n
N
C H2
C H2
C CC H2
C H2
H
C H3
C H3
H
n
P o l y d i a l l y l d i m e t h y l - a m m o n i u m
c h l o r i d e ( P o l y D A D M A C )
++
6 .2 m e q /g
3. Co-Polymerized Acrylamide/Cationic Monomer
CC H2
C
H
N H2
O
C
C H3
C H2
C
O O C H2
C H2N
C H3
C H3
C H3
C l
A c r y l a m id e Q u a r t e r n is e d D im e t h y l a m in o e t h y l m e t h a c r y l a t e
( D M A E M A )
( ) ( )X Y
C O C O
N H2
O
N
C H3
C H3
C H3
e .g .
+
+
+
2 .8C o p o lym e r o f a c ry la m id e a n d d im e th y la m in o e th y l a c ry la te w i th 3 0 m o l% o f th e c a tio n ic c o m p o n e n e t m e q /g
R1, R2, R3 — Organic groups

36
2.2.2.2 Natural Polymer
There are several natural cationic polymers, which can either be extracted
from certain kinds of plants and animals and have inherent cationic properties, or
can be modified to yield cationic polyelectrolytes. Since natural polymers are
potentially low cost and believed to be biodegradable and non-toxic, they are
workable alternatives to synthetic polyelectrolytes in water and wastewater
treatment (26). The most prominent of them is chitosan, a high molecular-weight
linear cationic polymer with a MW value of up to 106 g mol-1. The
physico-chemical properties of chitosan are related to the presence of amine
functions (acid-base properties and cationicity) which make chitosan very
efficient for interacting with anionic elements in acidic solutions (4).
Chitosan is a deacetylated chitin which is considered as a 1:4 random
copolymer of N-acetyl-α-D-glucosamine and α-D-glucosamine (27). Chitin with
a deacetylation degree (DD) more than 50% is usually referred as chitosan.
Figure 2.2 shows the composition and structure of chitosan. The molecular
weight of chitosan samples is correlated with the preparative condition adopted.
Table 2.3 shows the properties of chitosan samples after deacetylation (28). An
important feature of chitosan is that the charge density and solubility of this
material are pH-dependent. For chitosan with a degree of deacetylation above
70%, the dissociation constant pKa can be approximately fixed to 6.3-6.4. Hence,
at pH of below 5, most of the amine groups are protonated, therefore having
increased charge density and can more easily attract particle anions (29). At pH6,
the charge density of chitosan is found to be about 4.5 meq g-1 (30).
Very good coagulation effectiveness of chitosan for high-alkalinity water
at high turbidity was reported by Kawamura (3). Bolto et al. (31) also found that
it is quite effective at natural organic matter (NOM) removal using chitosan as a
coagulant, even though it would be slightly charged (17 mol %) at neutral pH

37
levels. In this case, Bolto believed that hydrogen bonding is dominant through the
free amino groups on the polymer and hydroxyl groups on the NOM. Divakaran
and Pillai (32) have studied the mechanism of kaolinite and titanium dioxide
flocculation using chitosan, and observed that chitosan solution started to
precipitate at pH values close to neutral.
O
O
NH2
OHO
O
NH2
OH
CH OH2
CH OH2
n
Figure 2.2 Basic structure of chitosan (DD 100%, after Bolto and Gregory (19))
TABLE 2.3 Characteristics of chitosan after deacetylation (after Huang et al. (28))
Sample No. Concentration of NaOH (%) Reaction time (min) DD (%) MW (106)
1 45 20 48 --
2 45 60 68 1.7
3 45 120 73 1.6
4 45 300 77 1.6
5 45 720 78 1.7
6 60 300 86 4.7
* DD—Deacetylation Degree
Natural starch is composed of α-D-glucose units. Cationic starch derivates
with potential use as flocculants in wastewater treatment are made from the
primary OH group in alkali treated starch with N-(3-chloro-2-hydroxypropyl)
trimethylammonium chloride to form the polymer, where the cationic site is
attached via an ether link to the polymer chain (19). It has reported that starch
derivate has a medium MW and the CD can be low or medium (1). There are two
other routes to modify starch, which are the copolymerization of starch with

38
either 2-hydroxy-3-methacryloyloxypropyltrimethylammonium chloride or the
mixture of acrylamide and the nitric acid salt of dimethylaminoethyl methacrylate
(DMAEMA·HNO3) (33), but whose products have seen limited use for water
treatment, probably because of economic reasons(12). Cationically modified
starch has been tested for clarifying particles (34). In the majority of systems the
degrees of substitution (DS) for cationic starches are very low (< 0.1), and the
aggregation of solid particles with cationic starches is believed to be a result of
polymer adsorption (35). Sableviciene et al. (36) have concluded that the
flocculation efficiency of cationic starch derivatives was dependent on the amino
group types and followed the order: quarternary > tertiary > secondary > primary.
Further observation has found that the flocculation efficiency increased on
increasing the nitrogen content and decreasing the molecular weight of cationic
starches.
Other natural polymers with cationic charge have also been studied in
wastewater treatment. These include the modified natural polysaccharides, for
example, grafting synthetic polymers onto amylopectin, guar gum and glycogen
(37), and the modified lignin based polymer prepared by the Mannich reaction
(38). The aqueous extract from macerated seeds of the horseradish tree Moringa
oleifera has proved to be effective at removing suspended materials and generate
reduced sludge volumes in comparison to alum (39). However, all of these
technologies have not yet been adopted on treatment plants for sustained use.
2.3 Coagulation Action of Cationic Polymer
In addition to a fundamental understanding of the chemical properties of
cationic polymers as coagulants, the other key factor to optimizing the
coagulation and flocculation process is an understanding of how the individual
colloids interact with each other, along with the coagulants. Therefore, in this
section, the aspects of colloidal stability and destabilization, and coagulation

39
mechanisms of cationic polymers are reviewed.
2.3.1 Colloid Stability
The small turbidity particles in the size range from 0.01 to 5 microns
present the real challenge to settle or filter since their stability or resistance to
coagulation is quite strong (1). The charge carried by these colloidal particles,
which are always anionic at the natural water pH, causes adjacent particles to
repel each other and prevents effective agglomeration and flocculation. As a
result, charged colloids tend to remain discrete and dispersed in suspension.
According to the classic DLVO Theory (40, 41), the stability of colloidal particles
is dominated by the balance between two opposing forces: electrostatic repulsion
and van der Waals attraction when particles approach each other. The DLVO
theory quantifies particle stability in terms of energy change when particles
approach one other. The net interaction energy is determined by the summation of
the van der Waals attraction and the electrostatic repulsion energies in terms of
interparticle distance, and is shown in Figure 2.3. In order for aggregation to
occur, two particles on a collision course must have sufficient kinetic energy (due
to their speed and mass) to overcome the energy barrier.
Figure 2.3 The net interaction energy curve (after Ravina (42))

40
For really effective coagulation, the energy barrier can be lowered or
completely removed by either increasing the ionic strength, which compresses the
double layer of particles, or reducing the surface charge of the particles hence
reducing the repulsive energy. The destabilization and stabilization of negative
particles by cationic polymers occur when the electrophoretic mobility of
particles at the optimum flocculant concentration is close to zero (43). Therefore,
the energy barrier is lowered to the point where the particle velocity from mixing
allows the colloids to overwhelm it.
2.3.2 Coagulation Mechanisms of Cationic Polymer
The removal of colloidal and dissolved impurities during water treatment
involves interacting with impurities and forming a stabilized dispersion. Bolto (1)
stated that for the adsorption of polymers on the particle surface there must be
some favourable interactions between the polymer segments and the particle
surface. If the particles and the polymer have opposite charge, i.e., negative
colloidal particles and a cationic polymer, then strong interaction and complete
adsorption of the polymer will occur as a result of an electrostatic interaction.
However, if the particles and polymer are of the same charge or if the polymer is
non-ionic then there needs to be some specific interactions responsible for
binding of polymer segments to the particle surfaces. These interactions can
include hydrophobic bonding, hydrogen bonding or as a result of dipole crystal
field effects.
Cationic polymers have been widely reported as significantly influencing
the aggregation of anionic suspensions. Three principal mechanisms of cationic
polymer-induced colloidal aggregation have been proposed: charge neutralization,
polymer bridging and depletion flocculation. In comparison with polymer
bridging and charge neutralization, which depend on the adsorption of polymer
on particle surfaces, depletion flocculation occurs in systems where the polymer

41
has a very low adsorption affinity and a fairly high concentration. Due to the high
operating and capital costs, depletion flocculation is not recommended in water
treatment practice (12) and will not be considered here. However, in very many
practical cases, it is generally difficult to distinguish between charge
neutralization and polymer bridging, particularly, in a system containing colloids
and cationic polyelectrolytes with high MW, where both mechanisms may lead to
destabilization (19).
2.3.2.1 Charge Neutralization
Charge neutralization by the adsorption of the destabilizing chemical to
the colloid is a key mechanism for optimizing removal of suspension particles
from water. Inorganic coagulants (such as alum) and cationic polymers often
work through charge neutralization due to the negative charge of impurity
particles in natural water. Gregory (45) found that cationic polymers always
interact strongly with surfaces of negative charge and are quantitatively adsorbed.
From the results of coagulation for aqueous silica suspension, he has indicated
that the destabilization and restabilization of negative particles by cationic
polymers of moderate molecular weight occurred primarily by charge
neutralisation and charge reversal (43). There is the possibility that flocculation
could occur as a result of the reduced surface charge of the particles and hence a
decreased electrical repulsion between them. Thus, it is practical to lower the
DLVO energy barrier and form flocs (46). Gregory’s findings have been
supported by the results of Zhang et al (47). They reported that rapid aggregation
of hematite particles induced by polyacrylic acid (PAA) occurred only in the
particle region with low surface charge. In other studies (43), polyelectrolytes
with high CD have been found to be more effective for charge neutralisation due
to more charge delivered to the particle surfaces. It is believed that a
stoichiometry exists between the dose of the coagulant and the surface area of the
colloidal phase where charge neutralisation is the dominant aggregation
42
mechanism (48). Nevertheless, restabilization of particles can occur by
overdosing the cationic polymer. In this case, the charge of colloid changes from
negative to positive. The stoichiometric relationship between an optimal polymer
dose and a solid concentration has been studied by determining the amount of
opposite charge needed to neutralize the negative charge of particles. For design
purposes, in order to estimate the optimum polymer dosage, different techniques
have been undertaken to measure the surface potential and charge of particles,
which include the measurement of zeta potential (or electrophoretic mobility)
(46), colloid titration (18) and streaming current (49) techniques. Recently, an
on-line photometric dispersion analysis technique has been developed and used
successfully for sensitive monitoring of the state of aggregation (50). A brief
description, application and comparison of each method are discussed later in
Section 2.4.4.
The concept of “electrostatic patch” was first introduced by Gregory (51)
for the coagulation of low charge density latex particles by polyelectrolytes with
high charge density. In his later study on the flocculation of clay with cationic
polymers, Gregory (52) stated that the positively charged adsorbed species might
form small positively charged patches on the negatively charged surfaces of the
particle. As a result, attractive forces could develop between positive patches and
oppositely charged surface areas as particles collide during coagulation. In the
electrostatic patch model, it is assumed that the cationic polymer has a high
charge density and the particles have a relatively low surface charge density. Even
though the polymer adsorbs where there are domains of opposite charge, there are
still areas of negative charge on the surface of the particles as well as excess
positive charge on the polymer. The simple reason for this is that the average
distance between charged polymer segments is smaller than that between surface
sites of particles. The “patchwise” model is shown schematically in Fig. 2.4.

43
Figure 2.4 “Electrostatic patch” model for flocculation of negative particles by
cationic polyelectrolytes (after Bolto and Gregory, (19))
For application in practice, the effectiveness of “electrostatic patch”
mechanism probably depends on the ability of the polymer to form an uneven
charge distribution on the surface of the particle. Ghosh (16) believed that for a
given mass dosage of a polymer, the number of macromolecules adsorbed per
colloid was lower for a high MW polymer than for a low MW polymer, therefore,
the high MW polymer would form a more uneven charge distribution,
encouraging better flocculation. Kozlova and Santore (53) using cationic
polyDMAEMA of low MW (around 31,000), with silica particles, proved that
only a few patches might be involved in the attachment of individual particles
from adsorption experiments.
2.3.2.2 Polymer Bridging
“Polymer bridging” in flocculation by polyelectrolytes describes the
destabilization mechanism by which the molecules of the added polymer attach
onto two or more particles, causing aggregation. This concept was first proposed
by Ruehrwein and Ward (54) from an experiment on the formation of clay
aggregate. Graham (21) speculated the process of polymer bridging as follows: as
a long-chain polymer comes into contact with a colloidal particle, some of its
active groups adsorb onto the particle surface, while the rest of the segment of the

44
macromolecule stretches out from the surface into the solution phase as “loops”
and “tails”. The widely accepted model of an adsorbed polymer chain is shown in
Figure 2.5. If a second particle with vacant adsorption sites comes into contact
with these extended segments a particle-polymer-particle arrangement may occur
with the polymer acting as a bridge. In order for the bridging to work, the
distance between the particles must be small enough for the loops and tails to
connect two particles together (20).
Figure 2.5 Model of an adsorbed polymer chain (after Bolto and Gregory (19))
It is generally found (55) that polymer bridging is favoured when linear
chain polymers of high MW (up to several million), which do not have a high
level of charge, are used in the flocculation process. Bolto and Gregory (19)
reported that some degree of charge is beneficial since repulsion between charged
segments gives expansion of the chain, thus enhancing the bridging effect. In
contrast, the situation becomes more complex in the systems containing colloids
and polyelectrolytes of highly opposite charge. In some studies (56), electron
paramagnetic resonance has been applied to high cationic polymer-clay particle
systems to determine the polyelectrolyte configuration on colloidal surfaces. It
was found that segments of polymer adsorbed primarily in trains, rather than in
the loop configuration. However, it is impossible for particle attachment to occur
without a sufficient number of loops extending into the solution phase so that
encounters with other particles can take place, based on polymer bridging. In this
case, the positive polymer is assumed to be a flat configuration on the colloidal

45
surface, rather than a configuration with many segments extending into the
solution. It can be well explained by the charge neutralization mechanism that
when the polyelectrolyte has a high concentration of positive charge, it will
adsorb onto the negatively charged particles in a rather flat configuration because
of the strong ionic interaction, leading to high-intensity patches, then the direct
electrostatic attraction between the particles results in agglomeration. The work
of Yu et al. (57) appears to support this view by their study of the aggregation
kinetics of kaolin particles using one high cationic polyDADMAC with low
molecular weight, and one low cationic polyacrylamide with high molecular
weight, although some of their assumptions are questionable. However, Ferretti et
al. (58) noticed that the simple charge neutralization mechanism can not readily
explain the following phenomena: (a) the breadth of flocculation zone with
greater polymer molecular weight; (b) the higher flocculation rate than that with
metal salts; (c) the zeta potential differing from zero at the optimal dosage; (d) the
optimum dosage occurring at a lower concentration for larger polymers. The
implication of these results is that charge neutralisation by cationic polymers may
not be of great practical significance only. Gregory (51) studied the flocculation
of latex particles by cationic polymers and recognized that both bridging and
charge neutralization play important roles simultaneously for a high molecular
weight polymer but a polymer of lower molecular weight appears effective
entirely by virtue of its positive charge.
There are very few research publications concerned with the coagulation
mechanisms of natural polymers. Some evidence has been found by Chen et al.
(59) to support a bridging mechanism for coagulation of particles by chitosan.
They observed an increasing removal of bentonite with increasing MW of
chitosan. In contrast, Roussy et al. (60) have found that when a chitosan with
MW exceeded 100,000 g mol-1 was used as a primary coagulant for bentonite
suspensions at pH5, the effective concentration of chitosan (0.17 meq l-1) was
much lower than that required for complete neutralization of the negative charge

46
on the bentonite particles (1-2 meq l-1), indicating that both charge neutralization
and bridging mechanisms have been involved with the destabilization of
bentonite.
For the case in which the amount of polymer and adsorption sites of the
particle are in equilibrium, there should be an optimum dosage of the polymer for
bridging flocculation, since bridging can no longer take place if the particle
surface is highly covered by an overdosed polymer; so that there are insufficient
adsorption sites available, and the suspension is re-stabilized by steric repulsion
between adsorbed polymer chains. La Mer and Healy (61) found for bridging
flocculation, the optimum dosage occurs at the “half surface coverage”. For
practical design purposes, it is unfeasible to quantitatively define “surface
coverage”. It is postulated by Bolto and Gregory (19) that the optimum dosage is
directly proportional to the total particle surface area and hence to the particle
concentration. However, Runkana et al. (62) found that theories of bridging
flocculation assuming equilibrium conditions were of limited use in practice.
Therefore, bridging interactions gave the possibility of non-equilibrium
flocculation. Typical optimum results found by Bolto and Gregory (19) in
practical systems, are of the order of 1 mg polymer g-1 of suspended solids or less.
Generally, it is well known that high MW cationic polymers have diverse
effects on the stability of a colloidal suspension. At certain concentrations, the
adsorbed polymer reduces the inter-particle repulsion and provides attractive
forces though bridging, “charge patch” or charge neutralization mechanisms.
Although high molecular weight is often mentioned as a requirement for bridging
flocculation, controversies still exist between the bridging and neutralization
mechanisms, which concern their relative importance in the systems containing
colloids and polymers of opposite charge. Very little is currently known about the
quantitative comparison of these effects in flocculation processes.

47
2.4 Flocculation Behaviour of Cationic Polymer
2.4.1 Polymer Selection
As so many different types of cationic polymers are now used for water
treatment, it is indicated that, apart from charge density and molecular weight, the
monomer type used and other aspects of polymer product should be taken into
account for the flocculation performance. There is a complex interrelationship
involving monomer type, polymer structure, functional group, CD, MW and dose
of polymer, and the amount and type of impurity in water (52, 63). The varieties
available offer great flexibility in solving specific coagulation problems, but
make selecting the right polymer more complicated. It has been reviewed
previously that the mechanisms of coagulation are strongly correlated with the
CD and MW of polymers. Thus, the coagulation performance is undoubtedly
influenced by these properties. It is well known that when a charge neutralisation
mechanism is dominant, the optimum dose of a polyelectrolyte depends on the
CD. The study by Graham (64), who investigated the orthokinetic flocculation
rates for amorphous silica microspheres with cationic polyelectrolytes, found that
the rate of polymer flocculation and the optimal dosage depend on the polymer
charge density and molecular weight. In general, ‘screening’ the optimal polymer
type and determining the optimum dose of the polymer are commonly undertaken
by jar tests, as is done for alum or ferric salts (15).
As discussed in section. 2.2.1.1, the chemical properties, e.g. the
chemical structure of the polymer and the polymer chain, varies according to the
polymer preparation. Basic acrylamide monomer yields varying polyacrylamides
with different amines through co-polymerisation or Mannich reaction. For the
polyacrylamides containing quaternary ammonium groups, the charge density is
irrespective of pH, and hence more popularly used in water treatment, in
comparison with the polyacrylamides with un-quaternary amine groups.
Incidentally, linear polyamines or branched polyamines can be synthesized with

48
or without additives. It has been indicated previously that the polymer
configuration is important in the flocculation process, particularly for cationic
polymers. Ideally, this information should be supplied by the polymer
manufacturer. Considering the complexity of natural polymers, the identification
of these unknown polymers is necessary. A broad scheme for the examination of
polymers involves qualitative and possibly quantitative elemental analysis and
functional group analysis. Very useful information is often provided by running
an infra-red or NMR spectrum on the sample and comparing the output with
outputs obtained from a library of standard polymers under the same or similar
experimental conditions. Other polymer physical properties and polymer
microstructure can be an additional means of identifying the polymer (65).
2.4.2 Coagulation Performance
One of the present studies of particle aggregation in the flocculation
process is based on the flocculation rate. Fleer (66) has used a stopped-flow
technique to measure the flocculation rate of a silver iodide sol by a polyvinyl
alcohol with MW of 15,000, and found that the flocculation rate of the polymer
appeared to be about twice that with a metal salt. However, Gregory (51) reported
that in practice the method of mixing and the influence of different metal ions on
the flocculation rate made the interpretation of this view difficult. At the moment
of addition of the polymer into a suspension of particles, several rate processes
are initiated: (a) mixing of polymer molecules among the particles; (b) attachment
of polymer chains to particles (adsorption); (c) rearrangement of adsorbed chain
to give an equilibrium configuration; (d) collisions between coated particles to
flocculation (19). Rapid mixing is an important process in which the polymer
becomes evenly distributed throughout the suspension, and hence giving uniform
adsorption. Gregory (67) observed that the polymer adsorption rate under certain
conditions can be considerably slower than the particle collision rate in this
process. In the process of adsorption, according to Smoluchowski kinetics (68),

49
Gregory (69) found that the adsorption rate of polymer chains attaching to
particles depended on their concentrations. An increasing particle concentration,
generally corresponding with a higher optimum polymer dosage, would increase
the adsorption rate remarkably due to a second-order adsorption rate process.
Bolto and Gregory (19) have suggested that with a low particle concentration, as
in low turbidity water, the time required for adsorption of polymer may be of the
order of minutes, whereas for a high solid concentration the adsorption time can
be less than a second. Although the time required for rearrangement (or
reconformation) of adsorbed chains is not well understood, Pelssers et al. (70)
have studied the degree of flocculation in polystyrene dispersions by high
molecular weight polyethylene oxide (PEO) and reported that for these high MW
polymers, several seconds may be needed. When the adsorbed polymer is in an
equilibrium conformation, collision step (d) results in the formation of aggregates,
either by bridging or for electrostatic reasons. The flocculation is thought of as a
second order rate process, so that the rate depends on the square of the particle
concentration (19). At high solid concentrations, flocculation rates become very
high. Schwoyer (12) suggested that the greater the particle concentration, the
shorter the inter-particle distance, which leads to increased collision frequency.
Although there is very little information available about the influence of pH
values on suspension flocculation by cationic polyelectrolytes of high MW, Gill
and Herrington (71) concluded that the effect of pH on the chain length of
cationic polyacrylamides correlated with the largest flocs occurring at pH 5 to 9,
since the configuration of the polymer molecule may depend on pH, and the
viscosity data in their study showed polyacrylamides were in the most uncoiled
state between pH 5-7.
Apart from the particle concentration and pH, the kinetic aspects of
polymer adsorption and flocculation are considered partly in the optimal design
of the mixing processes. The type and intensity of agitation are very important
parameters for collision efficiency. In practice, turbulent mixing, characterized by

50
high velocity gradients (G), is desirable in order to provide sufficient energy for
inter-particle collisions. It is well established that when a cationic polyelectrolyte
is used as a primary coagulant, a G-value range of 300 s-1-700 s-1 is more
appropriate. Nevertheless, Graham (21) indicated that the conventional rapid mix
design parameters, G=300 s-1, T=10 to 30 s, may not complete particle
destabilisation. Morrow and Rausch (72) have suggested that satisfactory
performances of polymers as primary coagulants were obtained using velocity
gradients in excess of 400 s-1. By increasing the mean velocity gradient, they
observed that the polymer dose and time of agitation could be decreased.
However, there is an upper limit for the mixing intensity because high shear
conditions can break up microflocs and delay or prevent visible floc formation.
They concluded that rapid mixing must be completed within 2 min at G = 400 s-1
to prevent aggregate shearing.
It is evident from many studies that with polyelectrolytes, larger flocs
often grow to full size significantly more rapidly and are less fragile than flocs of
inorganic coagulants. However, at the end of its growth phase, flocs do not
continue growing and reach a uniform size for a given shear condition. A
comparative investigation has been undertaken by Li et al. (73), of the size,
strength and structure of flocs formed by alum and cationic polyacrylamide with
kaolin suspension using light scattering. They found that the floc strength varied
with coagulation mechanisms and followed the hierarchy: bridging particle flocs
> charge neutralized particle flocs > complexation flocs (charge sweep).
Therefore, aggregates formed by polymer flocculants appeared to be significantly
more resistant to breakage (74). Theoretically, floc strength is dependent on the
inter-particle bonds between the components of the aggregate. An individual floc
will break if the stress applied at its surface is larger than the bonding strength
within the floc (75). Parker et al. (76) treated the rate of aggregation as a balance
between floc formation and floc breakage. Based on the relationship between the
velocity gradient in the flocculating vessel and aggregates size, they suggested an

51
empirical expression (2.1) for the stable floc size as:
d = CG-r --------------- (2.1)
Where d is the floc diameter, C is the floc strength co-efficent that strongly
depends on the method used for particle size measurement; G is the average
velocity gradient and γ is the stable floc size exponent. Furthermore, the
correlation between floc size with the average velocity gradient, in log-log form,
is given as:
log d =logC-γ logG ---------------- (2.2)
Therefore, from equation 2.2, the steeper the slope, γ, the greater the reduction in
the floc size with increasing G.
There are no straightforward techniques to experimentally characterize
floc strength without destroying the flocs. However, a very important
consequence of the nature of aggregates is that their density increases appreciably
as the size decreases. Gregory (77) stated that a greater floc compaction by a
higher velocity gradient, G, may increase the number of bonds holding the
aggregate together, thus, leading to greater floc strength. According to equation
2.2, a decreased floc size is associated with the increasing average velocity
gradient G. In this case, flocs at higher G value were smaller but with higher
strength (78). As can be seen, in order to compare different flocs, the floc strength
may be observed by following changes in floc size over a range of shear rates.
In comparison to the small number of studies of the coagulation
mechanism by chitosan, relatively comprehensive investigations of the
coagulation performance of chitosan have been carried out in suspension waters.
It is well known that the characteristics of chitosan are dependent on the
preparative conditions such as concentrations of acetic acid and hydrochloric acid
and the degree of alkali treatment. Therefore, Huang (28) evaluated the
coagulation efficiency of modified chitosan prepared under different conditions,
and recommended that the optimal pre-treatment condition is deacetylation by
52
45% alkali for 60min and dissolution by 0.1% hydrochloric acid. Chitosan that
was initially dissolved in acid media can precipitate when diluted into alkaline
solutions. Guibal and Roussy (29) found for a given initial pH value the optimum
dosage of chitosan correlated well with the initial concentration of colloidal
particles. Decreasing in initial pH values resulted in a decrease of the dosage
required for efficient coagulation. It has been stated (60) that the molecular
weight of chitosan presented an important effect on its coagulation performance.
Ten chitosan preparations with different MW have been tested for the coagulation
of bentonite suspensions at pH5 and pH7 in the study by Roussy et al. (60), and
the results showed that the removal of turbidity was best for the highest MW
chitosans at both pH values. Pan et al. (79) have demonstrated how the mixing
speed can affect the coagulation performance of bentonite, kaolinite and clay by
chitosan in the settling rate, floc diameter and residual turbidity. He concluded
that the increased speed during rapid mixing can reduce the amount of optimum
dosage.
In summary, both experimental and theoretical analysis show that the
flocculation rate and the size and strength of flocs are dependent on the molecular
weight and charge density of polyelectrolytes, particle concentrations, pH and
mixing conditions (velocity gradient). There is much opportunity for improved
polymer flocculation performances by selecting the right polymer and optimizing
the design of the mixing process.
2.4.3 Interaction with Dissolved Organic Matter
All of the above reviews involving coagulation mechanism and
performance of the polyelectrolytes are in terms of particle removal processes.
Actually, in water treatment, coagulation with cationic polymers is also important
in removing natural organic matter (NOM).

53
In natural water, humic substances are by far the largest constituent of
natural organic matter, which can cause odour, taste, colour, and bacterial
re-growth problems, and furthermore, lead to the formation of disinfection
by-products (DBPs) as well as increasing the chlorine demand in the disinfection
process. Thurman and Morgan (80) have reported that dissolved humic
substances generally comprise of approximately 30-50% of the dissolved organic
carbon (DOC) in surface water. Studies to provide comprehensive insights into
humic substance characterisation have been carried out by some researchers.
Newcombe (81) has defined humic substances (humic and fulvic acid) as organic
molecules with an approximate size of 500-250,000 Daltons, with heterogeneous
structures composed of aromatic and aliphatic units and various functional groups.
It is commonly recognized that humic substances are anionic in character at
natural water pH values, which is partly responsible for their solubility in water.
Thus, humic substances can be precipitated from water, if the charge is reduced
by lowering the pH value (82).
The removal of NOM from drinking water is necessary to meet the
quality regulations of drinking water. When using cationic polyelectrolytes as
coagulants in water treatment, charge neutralisation of aquatic humic substances
is thought to be the predominant mechanism of coagulation (83). These
conclusions have been confirmed by Kvinnesland and Odegaard (30), who used
different cationic polymers, including polyDADMAC, polyacrylamide and
polyamine as coagulants to remove humic matter. In this case they found that the
optimum dose corresponded closely with charge neutralisation and there was a
clear stoichiometry between anionic charge of the humic substances and cationic
charge carried by the added polyelectrolytes. Their recommendation is in
agreement with the results from Bolto et al (63). In Bolto and co-worker’s study,
they compared the efficiencies of cationic polyacrylamide copolymer (CPAAM),
polyDADMAC, polyethyleneimine (PEI) and chitosan in experiments on
reconstituted humic water at pH6, and found that the effectiveness of
54
polyelectrolytes as coagulants for NOM increased with increasing charge
densities. Incidentally, the coagulation behaviour using the natural polymer,
chitosan, to treat natural organic materials seemed to be consistent with a charge
neutralization mechanism, since a stoichiometry was observed between the
concentration of humic materials and the required dose of chitosan (84).
Unless the raw water has a low total organic carbon (TOC) concentration,
the coagulant dosages of polymers are determined by the content of NOM in raw
water rather than by turbidity (85). Generally, the NOM removal performance by
polymers was less pH dependent and there was a lower level of dissolved ions in
the product water, in comparison to metal coagulants (86). The effect of polymer
molecular weight on the removal of humic substances by cationic
polyelectrolytes has also been investigated by Kam and Gregory (18), who
compared a range of cationic polyacrylamide copolymers with MW from 0.05 to
15 million, and found that MW had no effect on coagulation kinetics or colour
removal, indicating that ‘polymer bridging’ was not a pronounced mechanism.
However, observations by Bolto et al. (63) recently concluded that higher MW
polymers were more effective for NOM removing from water, and the effect of
increasing MW was more important for colour removal than increasing charge
density.
2.4.4 Monitoring System
There are a number of different methods to determine the optimum
dosage and flocculation performance of polyelectrolytes. The most familiar and
widely used coagulation test employed by those acquainted with water and
wastewater treatment is the ‘jar test’. Essentially, a jar test is a series of equal
volume, identical samples that are exposed to a controlled variety of treatment
conditions. Observation of the degree of clarification can be obtained by a
complete laboratory analysis of resulting sample quality. The protocol of jar tests

55
has been commonly accepted to confirm the optimum type and dose of inorganic
coagulants such as alum or iron salts (87). Recently, Bolto et al. (6) found a good
result from jar test in NOM removal using comparative primary coagulants of
synthetic cationic polyelectrolytes and alum. In bench-scale tests, the jar test was
also employed to evaluate the effectiveness of natural chitosan as a coagulant by
Kawamura (3). Although jar tests are particularly useful and remain popular for
controlling coagulation-sedimentation and precipitation-sedimentation processes,
these methods are limited in terms of their sensitivity and practical convenience
since they are less suited to the control of direct filtration or in-line coagulation
processes. Yeh (88) has demonstrated that alum and polymer doses required for
direct filtration were lower than found from jar test results.
Zeta potential (ZP) is a measure of the electrostatic charge on the surface
of particles suspended in water and is commonly related to the stability of the
colloidal materials under any given set of water characteristics. The technique of
measuring zeta potential has been successfully used to optimize the coagulant
dose for metal salts (89). In natural water, colloidal suspensions are commonly
found to possess ZPs of 20-30mV and are negatively charged (12). In order to
achieve coagulation in suspension systems, the ZP must be reduced in value to
less than 10mV (preferably to less than 5mV) (90). It has been reported that in a
bentonite particle system, the optimum doses of natural chitosan resulted in a
very negative zeta potential (~-15mV) (28). Previous attempts (91) to link the
coagulation of NOM to ZP have found that optimum doses of alum occurred at a
range of zeta potentials between -8 and +8 mV depending on the water source
and pH values of coagulation. Theoretically, an optimum dose of the
polyelectrolyte can be found to occur at or near the point of zero ZP. Graham (21)
observed that the applicability of ZP measurement was largely dependent on
whether the coagulation and flocculation mechanisms are predominantly due to
Coulombic interactions. Therefore ZP dose not necessarily provide a proportional
indication of the amount of coagulants required for destabilization. Many

56
researchers (92, 47) have used ZP measurement technique to evaluate the
coagulation mechanism and flocculation rate of high MW cationic
polyelectrolytes. However, the results from these studies cannot provide data for
estimating the optimal dose in the flocculation process due to a complexity of
interaction mechanisms of polymers. Although this method has several
advantages such as its speed, relative ease of operation and on-line control, there
is still a concern that in practice, the measurement of ZP is normally based on a
small number of particles, and may not always be representative of the
suspension at actual conditions (93).
The streaming current measurement has been recognized as an on-line,
reliable way to monitor the coagulation state by charge neutralization. The
streaming current is caused by the movement of counter ions beyond the shear
plane of surfaces within a detector (94). Unlike the zeta potential measurement,
this method does not directly measure the surface potential on individual particles.
Rather, it measures a flow of electrical current that is statistically proportional to
the average surface charge on the particles. Hence, it is possible to select the
optimum dose of a coagulant, according to the reduction of the negative surface
charge on the particles in the water. The mechanism of charge neutralization of
clay particles has been examined by Barron et al. (95), who used a streaming
current director to automatically control the coagulation performance of
electrolytes for a drinking water product. Furthermore, Kam and Gregory (18)
compared the streaming current detection with other monitoring methods in the
interaction of humic substances with cationic polyelectrolytes (over a range from
0.05 to 15 million), and found that the non-stoichiometric interaction between the
anionic sites of humic substances and the cationic charge of polyelectrolytes was
indicated by the streaming current technique. In general, the literature suggests
that most of the investigations related to the use of these methods are carried out
to study the electrokinetic properties of polymers using model water (49). Very
little attention has been given to both zeta potential and streaming current

57
techniques in selecting a particular polymer type or determining the polymer dose
in practical water treatment. Of particular concern for streaming current detection
is either sample pre-treatment such as large dilution of the sample in order to
avoid coincidence effects of particles, or metal ions in water such as calcium ions,
which affect the current and the coagulation process (96).
The laser light diffraction method has been advocated to measure the
floc size distribution, thus optimising flocculation (97). However, Gregory and
Nelson (50) found that light scattering is difficult to interpret unambiguously in
terms of the aggregate size distribution, except under special conditions. In
addition, detailed particle size distributions are not really necessary for
monitoring of industrial suspensions and the control of process conditions.
The photometric dispersion analysis (PDA) instrument provides a
valuable and convenient technique of assessing coagulation by means of a
sensitive and rapid response to fluctuations in the intensity of light transmitted
through a flowing suspension. Gregory and Nelson (50) proposed that a simple
index by this technique, which is in correspondence with the state of aggregation
of the particles, would be sufficient to give an insight to fit many experimental
and industrial observations, since this could be conveniently derived from on-line
measurements. By a photometric dispersion analysis monitor, the aggregation or
disaggregation in the suspension can be quantified with respect to the ratio of
Vrms to dc by measuring the root mean square (rms) values of the fluctuation
signal (Vrms) and the average transmitted light intensity (dc). In this case, the ratio
of Vrms to dc is called the Flocculation Index (FI). This ratio can give immediate
information on the state of aggregation of particle suspension over the entire
period of coagulation. Huang and Liu (98) demonstrated that the PDA monitor
with a designed control system could be successfully applied to the on-line
control of coagulation dosing, by studying the coagulation of bentonite powder
with alum. More definitely, Kam and Gregory (18) have shown that the optimum

58
dose for humic substance removal was easily achievable by the observation of the
Flocculation Index when polymers are used as primary coagulants. In the
flocculation process, FI is regarded as a representation of floc size, which is
closely associated with floc strength, the other important parameter of the
flocculation performance. Some researchers (99, 100) proposed that the FI values
might be considered as a way of quantifying floc strength by changing the
velocity gradient after the floc has formed. The effect of shear on the formation
and break-up of flocs generated using alum and two cationic polyelectrolytes has
been thoroughly investigated using a PDA by Yukselen and Gregory (101).
In summary, the ideal monitoring technique should be suited to on-line
application and require no sample pre-treatment (such as dilution). Few available
techniques satisfy these requirements in specific applications. The difficulties
encountered in using either visual (semi-quantitative) or electrical technologies in
practice to predict coagulant dose are that the actual treatment situation can vary
outside the set of parameters for which dose relationships were established in
routine experimentation. Thus, the use of the photometric dispersion analysis
method in monitoring polymer feed during operation of a water treatment process
has been found in many respects to be advantageous. This novel method has been
successfully applied to study the dynamics and mechanisms of coagulation in
dilute and concentrated suspensions with polymeric coagulants.
2.5 Application of Cationic Polymer in Water Treatment
All of the above discussions about the mechanisms and action of
polymeric coagulants have been in terms of model water processes, involving
either particles or dissolved organic matter. Actually, cationic polyelectrolytes
have been widely used as the sole primary coagulants instead of conventional
inorganic salts (alum, iron salts or lime), or flocculation aids in the drinking water
industry.

59
2.5.1 Primary Coagulant Used in Drinking Water Treatment
In surface water, the principal contaminants include particulate matter,
color, hardness, toxic organic, metal element (iron and manganese) and water
borne pathogens. The typical purifying process consisting of
coagulation/flocculation followed by settling or flotation, filtration and
disinfection is used to produce water that is biologically and chemically safe for
human consumption and also aesthetically pleasing in terms of odour, appearance
and taste. Recently, increasing attention has been paid by the water industry to
removal of natural organic matter in light of the potential for carcinogenic
disinfection-by-product (DBP) to form during the disinfection process if organic
carbon is insufficiently removed in the coagulation process.
Aluminium and iron salts are the most frequently used coagulants in
drinking water treatment and their proven efficacy in the removal of turbidity,
color, NOM and algae is achieved through their pH-dependent mechanisms,
which are either the adsorption of soluble hydrolysis products or/and the
reduction in particle charge. Under certain conditions, the hydroxide precipitate is
formed and hence “sweep coagulation” could be regarded as “bridging” and
enmeshing particles together. Amirtharajah (2) stated that the coagulation
performance of humic substances, which are correlated to NOM and color, was
best at pH values of about 5 to 6 with alum, and at pH values of 4.5 to 5.5 with
iron. Previous studies have pointed out several serious drawbacks of using metal
salts, for example, the coagulation performance is pH dependent; a higher dose of
coagulant is applied, in proportion to the turbidity; and extra solids in the form of
metal hydroxide arise adding to the burden of the separation process.
In the production of drinking water, cationic polyelectrolytes with high
MW can be added as either primary coagulants or coagulant aids to partially
replace inorganic coagulants (e.g., alum). In the last twenty years a world-wide
major emphasis has been given to enhance the coagulation technique by

60
polyelectrolytes in removing turbidity and organic matter from surface water. A
low dosage requirement of polyelectrolytes used as primary coagulants for raw
water from river “Ganga”, India, has been proved in the study of Rout et al (102).
In their study, with the maximum turbidity level of 1200NTU, the alum dose
requirement was 75 mg l-1 against the polyDADMAC dose of 1.5 mg l-1. As
compared to alum, the sludge generated during the polyelectrolyte treatment was
40-60% less in volume than that formed by alum. The coagulation properties of
different synthetic polyelectrolytes combined with metal salts or polyelectrolytes
alone used in surface water treatment to remove DOC have been investigated by
Lindqvist (103). For comparison, cationic polyDADMAC, aluminium and ferric
salts were included as coagulants in his study. Lindqvist observed from laboratory
scale jar tests that as a primary coagulant, polyDADMAC achieved an inferior
DOM removal (33%) from Lake Roine, Finland, in comparison to that of
aluminium salt (55%) and ferric salt (65%). Moreover, when polyDADMAC was
applied as a coagulant aid, which is added to raw water with a metal coagulant
simultaneously, an increasing removal of DOC was found of about 70%,
indicating cationic polyelectrolytes with high CD may be used to reduce the
amount of metal salts in the coagulation process. In contrast, Bolto and
co-workers (6) studied the removal of NOM with cationic polyDADMAC and
polyacrylamide, by means of jar tests on reconstituted waters containing aquatic
NOM obtained by reverse osmosis treatment of water from Moorabool River,
Australia. It was found that organic polymers were as effective as alum for colour
removal, and took out up to 85% of the UV absorbance removed by alum.
However, an alum/polymer combination was the most attractive treatment option
for natural organic matter. When they used a series of polyDADMAC polymers
with different molecular weight and charge density as coagulants in jar tests,
Bolto and co-workers observed that the performance of cationic polymers used as
sole coagulants improved significantly with increasing charge density and
molecular weight. Their results were confirmed by other studies. Chang et al.
(104) found an effective removal of UV absorbance when they used

61
polyDADMAC as a coagulant for drinking water treatment. They also observed
that a polymer with higher CD was more effective in reducing UV absorbance
than that with low CD.
It is evident that the application of a polymer in conjunction with a metal
salt as a primary coagulant has become increasingly of interest for the treatment
of natural organic matter in surface water. Apart from the evidence from
Lindqvist (103) and Bolto (6), experimental results obtained from bench-scale,
pilot-scale and real scale tests by Filho et al. (105) have also shown that algae
removal and turbidity removal were much better when a cationic polymer was
added with ferric sulphate (compared to ferric sulphate alone) to treat raw water
from Guarapiranga Reservoir, Brazil. Lee et al. (106) has also demonstrated that
both cationic polyamine and polyDADMAC combined with metal salts were
effective as coagulants to treat Nak-dong river water, Korea, and the addition of 1
mg l-1 of organic polymers enabled a reduction of 50% of the consumption of
inorganic coagulants.
As a natural polymer, chitosan has been applied as a primary coagulant
to replace or partially replace alum in water treatment. In 1981, the United States
Environmental Protection Agency (USEPA) approved chitosan’s use in a drinking
water treatment application up to a 10mg l-1 dose. The effectiveness of turbidity
removal by chitosan appeared to involve the alkalinity of different surface waters
in Kawamura’s study (3). When chitosan was used as filtration aid in the direct
filtration process at pH 8.4 and temperature 14 ºC, for raw waters with high
alkalinity (200 mg l-1 as CaCO3), it was demonstrated that about 0.2 mg l-1
chitosan improved the flocculation and sedimentation performance. In contrast, as
sole coagulants, for low alkalinity water (~30-40 mg l-1 as CaCO3), chitosan
presented a greater effectiveness in producing a settled-water turbidity of about 1
NTU with approximately 5 mg l-1 of dosage compared to approximately 30 mg l-1
of alum at pH 7.1 and temperature 10 ºC. Even though the coagulation

62
mechanism of chitosan is still not fully understood, Kawamura indicated that the
effectiveness of chitosan was especially significant for the high-turbidity water.
This observation has also been shown in another study (107). Divakaran and
Sivasankara (108) reported that chitosan as a primary coagulant at a dosage of 0.5
mg l-1 achieved over 80% turbidity removal from an initial raw water of 10NTU.
The combination of chitosan and alum as a primary coagulant has been
considered for water treatment. A pilot filter investigation by Kawamura (3) has
shown that the combination of chitosan and alum is more effective than the
synthetic polymer-alum combination tested for turbidity removal from Colorado
water, USA. The effectiveness of chitosan as a primary coagulant and a coagulant
aid for different turbidity raw waters has been summarised in Table 2.4. However,
the typical formula of alum in this study was not mentioned.
TABLE 2.4 Coagulation performance using chitosan and alum (after Kawamura (3))
Raw Water
Turbidity
(NTU)
Alum
(mg l-1)
Residual
Turbidity
(NTU)
Chitosan as
Primary
Coagulant
(mg l-1)
Residual
Turbidity
(NTU)
Chitosan as
Coagulant
Aid (mg l-1)
Residual
Turbidity
(NTU)
3200 300 90 1.00 10 0.15 + 20 mg l-1
alum
4
1400 100 10 1.00 10 0.1 + 20 mg l-1
alum
3
500 30 5 0.25 25 0.1 + 5 mg l-1
alum
5
70 10 14 0.25 18 0.05 + 8 mg l-1
alum
10
Moreover, chitosan has been shown to be an effective coagulant for the
removal of humic substances from drinking water. From comparative

63
experiments using chitosan as a sole coagulant or combined with ferric salts to
treat the river water from Glomma, Norway, Vogelsang et al. (109) found that 2
mg l-1 chitosan and 2 mg l-1 as Fe3+ at pH 5 led to 96% colour removal and 60%
TOC removal, with an improvement from respectively 93% and 47% for chitosan
alone. In contrast, iron salt used as a primary coagulant alone gave no significant
removal of organic matter. A fractionation based on the molecular size of humic
substances was measured by high-performance size exclusion chromatography
(HPSEC) in this study, and the results indicated that by adding small amounts of
iron salt together with chitosan, a substantially improved removal of the medium
molecular weight fraction of the humic substances was obtained with a
significantly reduced addition of chitosan.
Cationic polyelectrolytes have a distinct advantage over metal salts used
in the direct filtration process due to an absence of the formation of additional
solids in the form of a metal hydroxide precipitate. The uses of direct filtration
preceded by polymeric coagulants to remove humic substances have been
investigated by some researchers. An effective performance of colour removal
from synthetic (humic acid solution) and natural colored waters using a
bench-scale pilot filter with a 14-cm filter bed has been reported by Scheuch and
Edzwald, (110) who used a chlorine-resistant cationic polymer (polyquaternary
amine) with molecular weight about 50,000 as a coagulant. Furthermore,
Edzwald et al. (111) employed a large-scale pilot dual-media filter and two
natural colored waters to study the coagulation performance of three cationic
polyelectrolytes (polyquaternary amine), and found an effective improvement in
treatment and water quality were obtained in all cases. To minimize some of the
drawbacks arising from the accumulation of polymers in the equipment of
filtration and limited permissible-dosage range, Graham (112) used a
low-to-moderate MW polymer based on polyamine to investigate the possibility
of improved treatment by partially replacing alum with the polymer and noticed
that there was less color removal using the combination of a polymer with alum

64
than alum alone by direct filtration; this study employed a pilot filter with 50-cm
filter bed and humic extract from colored, upland water in the United Kingdom.
2.5.2 Polymer Toxicity and Residual Polymer
Although any relationship between aluminum and Alzheimer's disease is
too tentative to justify changes in the use of aluminum compounds in water
treatment, there is still a strict regulatory limit on the residual aluminum
concentration of 0.2 mg l-1 in drinking water in the UK (113). The application of
synthetic organic polymeric coagulants such as polyacrylamide or polyamine is
also potentially problematic since there may be toxicity concerns under certain
circumstances. These concerns have led to a ban on the use of polyelectrolytes in
drinking water treatment in Switzerland and Japan (114), while other counties
such as the United Kingdom, Germany and France have established stringent
limits on the doses of polymeric coagulants.
For drinking water production, the maximum allowable dosage of
commercial polymers in the source water at the treatment plant is recommended
in the USA by the National Sanitation Foundation (115), the limits are generally
<50 mg l-1 for polyDADMAC, <20 mg l-1 for ECH/DMA polymers and <1 mg l-1
for PAAs. The maximum authorised dose of polyacrylamide used as the
coagulant in drinking water treatment is 1 mg l-1. National Sanitation Foundation
further restricts the application of polyDADMAC to not exceed 25 mg l-1, which
is based on a maximum carryover of the polymer into the product water of 50 ug
l-1 (116).
In fact, even though cationic polymers are of high toxicity generally, it is
well known that a monomer is likely to be more toxic than a polymer in drinking
water (117). Some frequently used polymer coagulants such as polyDADMAC,
polyacrylamide and epichlorohydrin-based polymers may release the unreacted

65
monomers acrylamide and epichlorohydrin in drinking water. Accordingly, limits
on the level of monomer are strictly controlled. Especially, in the UK, for
polyDADMAC the maximum allowed monomer content is 0.5% , and maximum
residue in reservoirs is 500 µg l-1 (118); for polyacrylamide, as a general rule,
the monomer content limit of free acrylamide is 0.025%, and the residual in
drinking water is 0.1 µg l-1 (113); polyethyleneimines are generally not used in
potable water treatment (119).
It is essential to determine the ultimate fate of polymers used in the
coagulation process to see what quantities are present in the final water. A number
of promising approaches have been explored for measuring polymer residuals in
the last thirty years. Parazak et al. (120) were able to analyse residual polymers
by colloid titration against a polyelectrolyte of opposite charge, using dyes as
indicators. The method is not especially sensitive since the results (0.5 -1 mg l-1)
were found to be near the limits of detection. Other researchers have used
fluorescence spectroscopy (121), size exclusion chromatography (122), 14C-mark
polymer (123), NMR spectroscopy (124) and fluorescent tagged polymer (125).
Detection limits below 1mg l-1 have been claimed for methods based on colloid
titration (500-1000 µg l-1); fluorescence spectroscopy (<50 µg l-1); size exclusion
chromatography (10-20 µg l-1); fluorescent tagged polymer (10-40 µg l-1) and
NMR spectroscopy (<500 µg l-1). However, the more extreme of these claims has
been disputed or simply not reproduced by other researchers (126).
In summary, published methods for determining residual polymers
generally have low sensitivities and may require a pre-concentration process. To
date, there is still no accepted method to effectively measure the accurate amount
of residual polymers in treated water. Consequently, the regulation of these
published methods is arbitrary and inconsistent. It is felt that there should be
more effort by polymer manufacturers to develop suitable methods.

66
2.5.3 Costs
Apart from the significant treatment effectiveness, economics should be
considered as another merit of the complete or partial replacement of metal salts
by polyelectrolytes as primary coagulants. The estimated costs of $2-4 per kg
(£1-2 per kg) for the polymer is consistent with the current market value in USA
for organic flocculants in water treatment of approximately $130 million per year
(124). The market price of aluminium coagulant (8% w/w Al2O3) is
approximately £80 per tonne, which is equal to £ 1.89 per kg Al. Accordingly, an
approximate alum (9.1% w/w) cost can be estimated as £171 per tonne (£0.171
per kg). Mangravite (25) has found that the typical dose of primary coagulants for
most polymers is 0.5 to 10 mg l-1. From the previous reviews, the dose of alum
for the surface water treatment is in the range of 30 mg l-1 to 75 mg l-1. Therefore,
the cost of polymers varied from £0.00075/m3 to £0.015/m3, and the cost of alum
is speculated as £0.00513/m3 to £0.0128/m3. It was found that ferric chloride,
ferric sulphate and aluminum sulphate are very similar in cost. In addition, there
is a major upward pressure on metal coagulant prices due to heavy usage of
phosphate. Considering the reduced filter loading and volume of backwash water,
and further convenient sludge deposit due to a lower amount of solids production,
organic polymers give a greater cost benefit than inorganic coagulants. One
experience from a water plant in South Africa on changing the coagulant from
alum to a polymer demonstrated a 30% decrease in the cost over a three-year
period (127).
Chitosan works well over a large pH and dosage range. However, a
major drawback is its price, which is about $18-20 per kg (£9-10 per kg) dry
weight (109). Hence, dosage optimisation is of high priority. In Kawamura’s
study of different surface waters (3), the optimum dose of chitosan varied from
0.2 mg l-1 to 5 mg l-1, therefore, the cost of chitosan in water treatment was
estimated from £0.002/m3 to £ 0.05/m3. This unrealistically high cost of chitosan

67
presents an opportunity to find cheaper natural polyelectrolytes to produce
cleaner and safer water.
2.6 Modified Tannin-based Polymer (TBP) as Coagulant
One of the modified natural products, the tannin-base polymer (TBP),
has been proposed as a flocculant for use in wastewater treatment in certain parts
of the world due to its reasonable cost and biodegradability. In the USA, the
National Sanitation Foundation (116) has restricted the maximum dose of
tannin-based products as 3 mg l-1 in raw water.
Tannin is a plant extract mainly from bark and wood which can be
subdivided into two groups, hydrolysable and condensed, based on their
structures (128). In this study, the natural tannin extract is obtained from a tree
called Black Wattle, which grows in Brazil. The type of tannin present in wattle
extract is condensed tannin which consists of a molecular gradation of
poly-flavinoids. Before the application of a Mannich type reaction and
polymerisation, the original aqueous extract is composed of approximately
67-77% polyphenolic tannins and 25% non-tannins, which are mostly simple
sugars and polymeric carbohydrates (hydrocolloid gums); the latter constitute 2%
of the extract and heavily contribute to the extract viscosity (information from the
supplier). The average molecular weight of tannin can range typically from about
300 to about 3000, dependent on the number of flavinoids (129). The structure of
the main flavinoid unit present in condensed tannin has been published by
Hemingway (130) (see Figure 2.6).

68
Figure 2.6 Chemical structure of condensed-tannin: flavan-3-ol unit of
condensed-tannins (to A-ring: R1=OH, R2=H, phloroglucinolic; R1=R2=H, resorcinolic;
R1=H, R2=OH, pyrogallolic; to B-ring: R3=H, catecholic; R3=OH, pyrogallolic) (after
Hemingway (130))
The preparation process of the modified tannin-based polymer (TBP) is
proprietary information, but is believed to involve two chemical steps: Mannich
reaction and polymerization. In the Mannich reaction an aldehyde is condensed
with an amino compound and an active hydrogen is supplied by the polyphenolic
tannin. The common reaction procedure is: Aqueous formaldehyde and
ammonium chloride solid are mixed and heated to give a mixture of (mainly)
primary and secondary amines. Then the amine mixture reacts with the aromatic
tannin chains (also under acid catalysis). The nitrogen in the resultant
non-polymerized product protonates under acidic pH conditions to give an
“ammonium tannate monomer” with positive charge. Consequently, the monomer
polymerizes while the viscosity of the reacting mixture is monitored at low pH.
Some investigations related to the use of natural condensed anionic
tannin as a coagulant aid for particle removal have been carried out by Özacar
and co-workers (131). In their studies, jar tests were performed at pH 6 to 11,
using kaolin clay to adjust the turbidity of the synthetic water. When tannin was
used as a flocculant aid combined with alum, a very low tannin concentration of 1

69
mg l-1 was found to effectively reduce the residual turbidity and the amount of
required alum. However, the literature suggests that more attention has been
given to the use of the modified cationic tannin polyelectrolyte instead of anionic
natural tannin as a coagulant or flocculant aid in the waste water treatment field
and its preparation method has been explored. In 1962, Fife (132) first disclosed
the new application of the reaction product between tannin, formaldehyde and an
amino compound for the flocculation of suspensions such as sewage and
industrial waste. He found that clear supernatant water was obtained using 12 mg
l-1 Mannich reaction product as a coagulant, for an artificially turbid water of 100
mg l-1 solid. The disclosed advantage of using this flocculant is believed that it
does not affect the pH of the suspension solution and also the flocculant does not
affect the dissolved inorganic contents of the final water. On the basis of this
previous invention, Reed et al. (8) synthesized an alkylated Mannich polymer,
which is prepared from a condensed tannin, amine, and formaldehyde, with an
alkylating agent within a wide range of pH between 5 and 14. This polymer was
proved to effectively remove color from waste water effluent streams.
A comprehensive study of the application of TBP in drinking water
treatment and the relative merits of partial or complete replacement of alum by
TBP as a primary coagulant in water treatment has not been undertaken so far;
previous work with TBP has been related to wastewater treatment. The early
work has been done on the assumed chemical structure of condensed-tannin. To
date, there is little information available of the structure or functional groups of
TBP, or how these vary with the preparation conditions (pH, viscosity). Thus it is
not possible to predict the chemical properties of the final TBP product, and in
particular the nature of the “ammonium tannate monomer”. There is virtually
no prior literature about the fundamental mechanisms of coagulation using TBP
as a primary coagulant for aqueous suspensions or/and dissolved organic matter,
and therefore no clear understanding of the interrelationship between polymer
chemical structure, polymer molecular weight and charge density with the

70
coagulation mechanism of TBP. Some information is available concerning the
various manufacturing methods and basic flocculation performance of the
tannin-based polymer in wastewater treatment, from published patents (8,129).
Knowledge of the polymer’s characterisation would be a significant step towards
understanding the mechanisms, and hence flocculation ability when using TBP as
a coagulant.
Since adequate attention has not yet been given to the use of TBP as a
primary coagulant in surface water treatment, there is much opportunity to
validate the coagulation effectiveness of TBP in this field of application and
investigate ways of improving its performance by optimizing the mixing process
and selecting the right combination with metal salts or mico-sands to either
reduce the dose of inorganic coagulants or lower the residual TBP in final water.
In addition, this investigation presents a broad challenge on the optimal
monitoring of coagulation process and the accurate measurement of residual
tannin in treated water.
2.7 Summary
The application of synthetic or natural cationic polymers in the
production of drinking water has been reviewed, with emphasis on the type and
characterisation of polymers commonly available, dominant mechanisms of
coagulation, the coagulation behaviour of model waters, and the application in
practical treatment with particular attention of residual polymers, and polymer
cost assessment. A preliminary introduction of a novel and potential modified
natural coagulant--- tannin-based polymer (TBP) has been included here.
The main concepts detailed in this chapter of the thesis can be summarized as
follows:

71
a) The role of polymeric coagulants in water treatment is well established, with
examples of benefits in conventional sedimentation and filtration, or in direct
filtration, mostly due to the low solid volume production, and in particular the
low cost of using a natural polymer.
b). Polymer bridging and charge neutralization have been recognized as the two
most important mechanisms of coagulation by polymers. Theoretically, high MW,
linear polymers are more preferable in bridging flocculation. In contrast,
polymers with high CD are more effective in charge neutralisation. In fact, it is a
matter of controversy and speculation between these two mechanisms,
concerning their relative importance, when cationic polymers with high MW are
used as primary coagulants.
c) It is often assumed that the polymer’s type, molecular weight and charge
density are the crucial parameters governing the mechanism and performance of
coagulation in terms of the removal of particles or dissolved organic matter. The
coagulation behaviour of polymers also depends on the particle concentrations in
solution, the pH, and the mixing conditions. In practice, the presence of residual
polymers and monomers in the product water are of particular health and
environmental concern in drinking water treatment. To date, there is not yet a
sufficiently sensitive and practical analytical technique available to determine the
residual polymer concentration in treated water.
d). In comparison to synthetic cationic polymers, the number of investigations
concerned with natural cationic polymers for drinking water treatment are
relatively small and most of them were of the use of chitosan in water and
wastewater treatment. Very little is currently known of the fundamental
coagulation behaviour by natural polymers, and in particular, of the importance of
the nature of these polymers.

72
e). A modified tannin-based polymer (TBP) is proposed as an alternative to
synthetic organic polymers because of its availability from a renewable source
material, giving rise to environmental benefits and potential cost advantages.
Given its preparation via the Mannich reaction and polymerization, it is believed
that TBP is a high molecular weight polymer possessing positive charge. While
there has been some use of TBP in wastewater treatment, very little attention has
been given to characterizing its fundamental properties and investigating in detail
the use of TBP as a primary coagulant in surface water treatment.

73
3. OBJECTIVES OF STUDY
From the previous discussion it is clear that the chemical structure of
TBP and the interrelationship between the chemical properties of TBP and
coagulation mechanisms have not yet been investigated. Furthermore, the
understanding of the coagulation performance using TBP as a primary coagulant
to partially or completely replace metal salts in water treatment is still very poorly
developed. To illustrate the potential in this regard, this study of its significance
set out to achieve three broad aims:
(1) to provide a description of the polymer structure and physical properties , by
qualitative functional group analysis in conjunction with quantitative methods,
thereby characterizing the tannin-based polymer (TBP).
(2) to qualitatively assess the existence, significance and relative appropriateness
of two well established coagulation mechanisms using TBP as a primary
coagulant alone.
(3) to evaluate the coagulation performance of TBP alone and TBP combined
with metal salts, and microsand, in both model water and raw water systems, in
comparison with the effectiveness of inorganic and synthetic organic coagulants.
Considering the possibility of differences in the coagulation action of
TBP using model systems containing either particle suspensions or dissolved
organic matter, both of the systems were included in this study. Furthermore, the
performance of TBP with raw surface water samples is investigated. It is
emphasized that the objectives of this research fall into particular sections of the
thesis. In the following discussion, section 5 is relative to objective (1), section 6
to objective (2), part of section 6 and sections 7, 8 and 9 to objective (3). The
structure of the thesis is as follows:

74
Section 4: describes all experimental materials and the analysis methods used
throughout this research. Although the research purposes of Sections 6, 7, 8 and 9
are different, the coagulants and equipment used in these sections are mostly the
same. By concentrating the materials and methods in one section simplifies the
structure of this thesis.
Section 5: outlines the experimental characterisation of the TBP using different
techniques. A variety of quantitative analysis methods, including charge density,
molecular weight and elemental identification, were undertaken, in conjunction
with a number of qualitative analysis methods on functional groups and chemical
bonds.
Section 6: evaluates the fundamental coagulation mechanisms of TBP in particle
suspension and dissolved organic matter systems through an on-line measurement
of Flocculation Index. The variation of optimum dosage of TBP and final floc
size and strength were studied as indicators to determine the preference between
polymer bridging and charge neutralisation. The preliminary coagulation
stoichiometry and the influences of coagulation conditions on coagulation
performance of TBP were considered.
Section 7: describes an experimental investigation of the coagulation performance
and mechanisms using alum and cationic TBP as combined primary coagulants
(partial alum replacement). Under a given set of conditions, coagulation matrix
tests were studied for a full range of alum-TBP combinations to determine
whether or not there is a unique optimal dosage combination of alum and TBP.
Section 8: The tentative application of TBP bonded to microsand was investigated
in order to reduce the residual tannin in final water. Preliminary adsorption tests
were carried out to determine the ratio of surface attachment between TBP and
sand.

75
Section 9: to confirm the coagulation behaviour of TBP observed in tests with
model waters, raw water from an organic-rich river source located in the UK was
tested using TBP alone and TBP-alum as primary coagulants. Subsequently, the
coagulation efficiency was compared experimentally with other coagulants under
equivalent operational conditions.

76
4. MATERIALS AND METHODS
4.1 Introduction
All the materials and methods of analysis described here were used in
either the characterisation or coagulation experiments through the whole
investigation. Consequently, all the details are described in this section only.
In order to evaluate and compare the coagulant behaviour, four different
coagulant chemicals were employed in this study. These can be classified as:
modified natural polymer -- TBP, synthetic organic polymer -- polyDADMAC,
inorganic metal coagulant – alum, and commercial product – TSL. The adsorption
of polyelectrolyte on solid/liquid interface (clays, oxides and silica) has been
largely investigated because significant modifications of surface properties within
the adsorbed layer were observed (133), however, it is believed that the
coagulation action by polymer in the dissolved organic matter system may be
relatively complex since hydrophobic and hydrophilic fractions of NOM play
different roles, which affect the coagulation mechanism (63). Therefore, two
kinds of model water including kaolin particles and humic substances,
respectively, were applied in assessing the coagulation performance in this
research.
The methods used for TBP in this research fall into two categories:
characterization experiments and coagulation experiments. In the TBP
characterization experiments, some standard methods, such as Argentometric
titration for element determination, and a number of new or modified techniques,
such as size exclusion chromatography for MW measurement, were used.
Accordingly, the details of the methods and apparatus/equipments are included in
this section. In the coagulation experiments, a specially built reactor to control the
velocity gradient, G, and on-line monitoring system were employed. In order to
determine the quality of final water, a variety of measurements in terms of TOC,

77
turbidity, colour, UV, floc strength, residual Al and residual tannin were
undertaken.
4.2 Cogulants
4.2.1 Tannin-based Polymer
Tannin based polymer (TBP) in this study was obtained from TANAC
Ltd, Brazil. The TBP was supplied as a brown solid and was prepared in high
purity water (de-ionised, 18.2mΩ) as a 0.3% w/v (3g l-1), which was used as the
stock solution for subsequent tests. The preparation involved agitating the
solution (by magnetic stirrer) for one hour and then filtering through Whatman
No.42 filter paper (pore size ~2.5µm). Considering the aging effect, all TBP
solutions were used within 3 hours, except the samples used for ageing tests.
After further filtering by a Gelman 0.45µM membrane filter, the Non-purgeable
dissolved organic content (NPDOC) of working TBP solutions at different
concentrations was measured by a TOC analyzer (discussed in Section 4.4.2.3).
Colour and UV absorbance values were measured in terms of absorbance at 400
nm and 254 nm respectively, using a scanning UV-visible spectrophotometer
(discussed in Section 4.4.2.6). The analysis results are shown in Table 4.1.
The results in Table 4.1 indicate that there a linear relationship between
NPDOC /absorbance values at 254nm with TBP concentrations in accordance
with Beer’s Law theory. Although there is a linear relationship between
absorbance values at 400nm (indication of colour) and TBP concentrations, the
relationship does not go through origin, which was not expected. Although the
reason for this is unclear, it may be caused by the complex nature of the raw
tannin material.

78
TABLE 4.1 Variation of NPDOC and UV/Vis-absorbance (254nm and 400nm)
with TBP solution concentration
TBP concentration
(mg l-1)
NPDOC
(mg l-1)
Abs (254nm)
(cm-1)
Abs (400nm)
(cm-1)
25 11.73 0.25 0.030
30 16.41 0.299 0.033
35 18.04 0.343 0.035
40 22.41 0.386 0.037
45 24.65 0.429 0.039
50 27.14 0.472 0.041
55 29.79 0.508 0.043
58 30.99 0.532 0.044
60 32.50 0.547 0.045
65 35.53 0.592 0.046
70 38.36 0.634 0.048
4.2.2 PolyDADMAC
Quantities of a commercial cationic polyDADMAC, Flobeads DB 45 SH,
with 90% active content in weight, were kindly provided by SNF Ltd (UK). This
synthetic polyDADMAC (poly diallyldimethylammonium chloride) has a
molecular weight of approximately 6101× g mol-1, which is quoted by the
manufacturer. Information concerning charge density of this product was not
available by the manufacturer but a previous study (19) strongly supported the
assumption that polyDADMAC has a high CD of about 6.2 meq g-1, which was
believed to be insensitive to pH due to the quaternary ammonium,R1R2R3R4N+
cationic group. The product was supplied in solid form and diluted in high purity
water (de-ionised, 18.2mΩ) to give a stock solution of 2g l-1. Continuous gentle
stirring was required to achieve complete solution of the granular polymers in the
preparation of stock solutions.

79
4.2.3 Alum
Aluminium and iron salts are still widely used as coagulants in the water
and wastewater industry. For comparative purposes, aluminum sulphate hydrate
(Al2 (SO4)3·14H2O; Aldrich, UK), ‘alum’, was applied as a primary coagulant in
this study. Several mechanisms such as charge neutralisation or sweep
flocculation have been postulated for the coagulation of humic substances and
turbidity particles by aluminium ions. The relative importance of these
mechanisms depends on factors such as pH and coagulant dosage (134). It is well
established that the optimal pH level is about 5.5 ~6 for aluminium sulphate and
slightly lower for ferric salts, in the coagulation process (2). Stock alum solutions
were prepared at a concentration of 0.1 mol l-1. These were prepared weekly and
kept at 4ºC in the refrigerator.
4.2.4 Tanfloc SL
Tanfloc SL (TANAC Ltd, Brazil) is a solid mixture of TBP and Alum.
Tanfloc SL solution does not jellify within the stated 3 month shelf-life. The
composition of Tanfloc SL was given by the manufacturer, as solids (w/w): 8.4%
aluminium sulphate and the rest as TBP. However, 1 g l-1 TSL solution was
measured by an ICP Analyser (FISONS ARL 3580B), and gave a result of 8.8
310−× g l-1 as Al3+, which is equal to 5.6% Al2 (SO4)3 without water of hydration
in TSL mixtures. This lower figure of Al content was used in comparative
coagulation tests, because the higher weight value of aluminium sulphate salt
(8.4%) given by the manufacturer is likely to be based on inclusion of some water
of hydration.
4.3 Reagents and Chemicals
The other reagents or chemicals in preparation of the working buffer or

80
titration solution, except noted otherwise, were supplied by BDH (BDH,
Dagenham, Essex, UK) and were all analytical reagent grade. They were used
without further purification. High purity water (de-ionised, 18.2mΩ) was used in
all experiments. To investigate the effect of pH values, two distinct buffer
systems in the measurement of charge density and coagulation performance were
adopted respectively. These categories can be described under the following
headings:
( i ) Characterisation tests: 1 mmol l-1 buffer solutions were used to control the pH
value of solution directly. The buffers that were used were: CH3COOH/
CH3COONa for pH 3-5, NaH2PO4/Na2HPO4 for pH 6-7 and NH4OH/NH4Cl for
pH 8-10.
( ii ) Coagulation tests: 0.1 mol l-1 NaHCO3 solution was used as a buffer and the
pH of model waters was maintained by adding 0.1mol l-1 NaOH or HCl solution.
There were two types of standard titration analysis used in this study.
These were colloid titration to measure the CD values and Argentometric titration
(135) to determine the chloride content. The preparation of titration solutions are
discussed below:
( i ) Colloid titration: PPVS was obtained from Aldrich Chemicals, UK. The
solution was prepared by dissolving 180 mg PPVS chemical in 1L of water. The
charge density of PPVS solution used as anionic titrant was standardized with the
cationic surfactant, cetyltrimethylammonium bromide (CTAB) which was
prepared as a 1 meq l-1 solution. Ortho-toluidine blue (o-Tb) was prepared as a
0.01% (v/v) aqueous solution, which was used as colour indicator in the colloid
titration process.
( ii ) Argentometric titration: Potassium chromate K2CrO4 (Aldrich Chemicals,

81
UK) was prepared as 50 g l-1 to indicate the end point of the silver nitrate titration
of chloride in a neutral or slightly alkaline solution. Standard silver nitrate,
AgNO3 was obtained from Aldrich Chemicals, UK, and prepared as 0.0141 mol
l-1 titrant as the standard method defined. Silver chloride is precipitated
quantitatively before silver chromate is formed. Sample pH was adjusted by 0.1
mol l-1 H2SO4 or NaOH to the range from 7 to 10.
4.4 Model Water and Surface Water Sample
4.4.1 Model Water with Kaolin Suspension
Kaolin clay (Fisher Chemical, UK) was prepared as a model suspension.
The particle size was analysed by Laser Diffraction Particle Size Analyser
(Coulter LS Series, Beckman coulter Ltd., UK) and the geometric mean size of
the particles in the suspension was 4.85µm. A working solution, normally 50 mg
l-1 of concentration, was prepared by dispersing 100mg of kaolin clay in 2L of
de-ionised water. To obtain full dispersion it was necessary to raise the pH of the
suspension to about 7.5 (136), and blend at high rotational speed, which was
achieved by adding 5 ml of 0.1 mol l-1 NaOH and vigorously stirring at 2000 rpm
for 2 hours to obtain a solution with a turbidity value of 40 NTU±1%, determined
by HACH turbidimeter (discussed in Section 4.4.2.4). It was observed that the
light kaolin clay showed good dispersion and stability in the solution. Surface
potentials were not determined but previous study indicated that kaolin has a net
negative charge in natural water. Duan and Gregory (136) determined that the
Electrophoretic Mobility values of kaolin particles range from about -0.8 at pH 3
to -2.5 at pH10 (µm s-1 v-1 cm). In this case several pH values were investigated,
using 0.1 mol l-1 NaHCO3 as an appropriate buffer solution.

82
4.4.2 Model Water with Humic Acid
Humic acid (Aldrich Chemical Company, UK. Sodium salts, 42.2%
Carbon content) was obtained as a commercial reagent grade solid. Stock
solutions were prepared from 5g of dry humic acid product dissolved into 1L
de-ionised water to give a HA concentration of approximately 5g l-1, after
filtering by Whatman No.42 filter paper (pore size ~2.5µm). Working solutions of
10mg l-1 and 30 mg l-1 concentration were prepared by diluting the HA stock
solution with de-ionized water and adjusting the pH using 0.1 mol l-1 NaOH or
HCl solution. 0.1 mol l-1 NaHCO3 was used as the buffer solution to allow
convenient adjustment of pH. The solution was then further filtered under
vacuum through a 0.45µM membrane filter (Gelman Sciences). The
Non-purgeable dissolved organic carbon (NPDOC) and UV/Vis-absorbance
values of HA in pure de-ionised water at 10 mg l-1 and 30 mg l-1 concentrations
were measured by TOC analyser and the UV Probe Ultraviolet
Spectrophotometer. These are shown in Table 4.2.
TABLE 4.2 Variation of NPDOC and UV/Vis-absorbance (at 254nm and 400nm)
with HA solution concentration
Concentration
(mg l-1)
pH NPDOC
(mg l-1)
Abs (254nm)
(cm-1)
Abs (400nm)
(cm-1)
SUVA*
m-1/mg l-1
10 8.45 2.672 0.285 0.090 10.7
30 8.60 9.957 0.748 0.227 7.5
*SUVA=UV 254/NPDOC; indicative of aromaticity
It has been shown that the UV/Vis-absorbance values of humic solution
increased with increasing pH (89). This was confirmed by measuring the
UV/Vis-absorbance values of 30mg l-1 HA solution at different pH values (after
filtration) and the results are shown in Table 4.3. The UV/Vis- absorbance values

83
of 10mg l-1 HA solution at pH 9 are 0.293 and 0.096.
TABLE 4.3 Variation of UV/Vis-absorbance (at 254nm and 400nm) of HA
solutions with pH (HA concentration 30mg l-1)
pH Abs (254nm)
(cm-1)
Abs (400nm)
(cm-1)
3 0.653 0.160
4 0.685 0.172
5 0.709 0.188
6 0.719 0.197
7 0.737 0.210
8 0.743 0.212
9 0.752 0.232
10 0.770 0.250
Considering the complications caused by the very rapid interaction of
humic acid with TBP, especially at a high pH value, it was infeasible to determine
the initial UV-visible absorbance of the combined HA and TBP at the beginning
of the coagulation process. Hence, it is assumed that the initial absorbance value
(at 254nm and 400nm) was the sum of the individual absorbance values of TBP
and HA (values shown in Tables 4.1 and 4.3).
4.4.3 Simulated Water with Kaolin Suspension and Humic Acid
The tests involving model waters containing both suspended material
and humic substances were undertaken to compare the TBP performance with
that investigated previously by WRc using real water (River Thames water,
Egham (137)). The model water was 2L de-ionised water (18.2mΩ) with 70mg of

84
kaolin clay and 2ml of humic acid solution (2g l-1); to achieve the same pH (7.9)
10ml of 0.1mol l-1 HCl was added. The relevant quality parameters of the model
water and real river water are shown in Table 4.4.
TABLE 4.4 Analysis of simulated water and real water used by WRc (137)
Colour
(Hazen)
NPDOC
( mg l-1 )
Turbidity
(NTU)
pH
Model water 32.0 (8.51)* 27 7.9
River water
(WRc study)
32.8 5.73 27 7.9
* This value is unexpectedly high (see Table 4.2) and therefore believed to be incorrect
4.4.4 Raw Surface Water
Raw water samples were received from an organic-rich river source at
Bamford, UK (located in the north of England). A preliminary analysis of the
water quality was undertaken before commencing the coagulation experiments.
The results of the tests are given in Table 4.5. All parameters were measured after
filtration by 0.45 µm paper, apart from the Turbidity. To achieve the pH value at 6
in the samples, 0.1 mol l-1 HCl solution was pre-determined and added to 2L raw
water in these coagulation tests. The high colour and SUVA values indicate a
highly aromatic, humic type organic content.
TABLE 4.5 Analysis of an organic-rich river water at Bamford, UK
pH NPDOC
(mg l-1)
Colour
(H°)
UV254nm*
(cm-1)
UV400nm*
(cm-1)
Turbidity**
(NTU)
Raw
water
7.9 3.66 70 0.248 0.039 1.5
* 1cm cell **No filtration
85
4.5 Analysis Methods
4.5.1 Polymer Characterisation
4.5.1.1 Dissociation, Precipitation and UV Absorbance Analysis
Simple chemistry analysis falls into three categories:
(1) pH Titration Analysis
A pH titration was performed by adding standard base (0.001 mol l-1
NaOH solution) to 100ml TBP solution (0.03g l-1). For comparison, the titration
of the distilled water was also carried out with the standard base (0.001 mol l-1
NaOH solution). To avoid the influence of air effects, the solutions were
contained within a desiccator and soda lime was used in the desiccator to absorb
carbon dioxide and water during the titration. The beaker with TBP solution was
placed in the desiccator, then 1ml of 0.001 mol l-1 NaOH was added carefully,
until the pH value was stable. The pH was measured by pH electrode (Hydrus
300, Fisher, UK). Based on the TBP—base titration curve, the dissociation
constant pKa of TBP was estimated.
(2) Solubility Analysis
Using 1m mol l-1 pH buffers to dilute the 1g l-1 stock (initially filtered)
TBP solution, a series of solutions with concentrations from 0.02g l-1 to 0.1g l-1
over the pH range of 3-9 were prepared. All of these solutions after standing for 6
hours in the bench were subsequently filtered through Whatman No.42 filter
paper (pore size ~2.5µm) to determine the TBP solubility. In each case, clean
filter paper was transferred to a crucible and dried at 50-55ºC for 12 hours, then
placed in a desiccator to cool and equilibrate to ambient temperature before
weighing the paper. This cycle of drying, cooling, desiccating and weighing was
repeated until a constant weight was obtained or until the weight change was less
than 4%. After filtration, the filter paper was dried and weighed using the same

86
procedure, and the final weight of filter paper was taken to calculate the m/v
concentration of the polymer. It should be noted that the (un-buffered) solutions
had a pH<6.
(3) UV/visible Light Absorbance Analysis
The UV-visible light absorbance of the TBP was determined
spectrophotometrically. TBP water solution with different concentrations in the
range of 0.02g l-1---0.1g l-1 were firstly scanned using the UV Probe Ultraviolet
Spectrophotometer (Shimadzo, Japan; wavelength range from 190nm to 800nm,
10 mm quartz cell path) to determine the maximum absorbance wavelength. At
this maximum wavelength, TBP solutions with different concentrations (from
0.02g l-1 to 0.1g l-1) were analyzed over a range of pH from 4 to 9 by employing a
10mm quartz cell path. All tannin solutions were allowed to stand for 6 hours and
then filtered to test. Blank buffer solutions were used as the reference solution in
the instrument to exclude absorbance due to the buffer alone.
4.5.1.2 Charge Density Analysis
The charge density of the TBP was evaluated by colloid titration using
PPVS (poly-potassium vinyl sulphate) as anionic titrant (18). The method is
based on the stoichiometric reaction in the sense of 1:1 charge compensation
between oppositely charged polyelectrolytes. The end point is determined by the
interaction of the cationic indicator, o-toluidine blue (o-Tb,
3-amino-7-dimethylamino-2-methyl-phenothiazin-5-ium chloride) with anionic
PPVS, which leads to a hypsochromic shift in the absorption spectrum of o-Tb
and thus to a visible colour change. The charge density of PPVS solution was
preliminary standardised with the cationic surfactant, cetyltrimethylammonium
bromide (CTAB). Both visual titration and spectrophotometry were used to

87
determine the titration end point in order to compare the methods. The charge
densities of the TBP and the polyDADMAC were evaluated for a range of
solution pH values from 3 to 9 in this study. Results are expressed as the mean
value of three replicate samples. To determine the TBP charge density at pH≥6,
the titrant (PPVS) concentration was diluted to 1×10⁻⁵ mol l-1.
(1) Visual titration (procedure 1)
To determine the charge density of the cationic polymer by titration with
the anionic polyelectrolyte PPVS, the charge density of PPVS should be
determined. The PPVS solution was firstly standardised with CTAB; this
involved 3 ml of CTAB (1 meq l-1) solution with three drops of o-Tb solution
titrated with PPVS until the colour of the solution changed from blue to red-violet.
Then, the titration procedure was repeated for the filtered solutions of TBP (10 ml
of 0.08 g l-1) and polyDADMAC (10 ml of 0.05 g l-1) at various pH values, using
PPVS of a pre-determined charge density according to the above procedure.
(2) Spectrophotometry (procedure 2)
The titration procedure was the same as indicated for procedure 1.
However, at the end point, the solution was tested by spectrophotometry, where
the binding of o-Tb blue to PPVS produces a distinct colour shift from blue
(absorption maximum at 635 nm) to red-violet (530 nm).
4.5.1.3 Functional Group and Chemical Bond Analysis
(1) FT-IR Analysis
One common method for investigating the chemical structure of organic
molecules is by the use of FT-IR (Fourier Transform Infrared) Spectroscopy. In
this case, a preliminary assessment of the chemical structure of the TBP was

88
determined by the use of a Magna-IR 560 Spectrometer (Nicolet Instrument
Corporation, USA). The spectrometer was equipped with a Globar IR source CsI
beam splitter, and a DTGS CsI detector. For comparative purposes, study was
made of tannin extract (gel, non-Mannich reaction and non-polymerization) after
freeze drying. Approximately 35g tannin extract (gel) was weighed and then
placed in a conical flask in a low temperature refrigerator at -18ºC. Freeze drying
was carried out overnight in a laboratory freeze dryer (Birchover Instruments Ltd,
UK) with a vacuum of 100 mT or less. With great care, the solid powder of TBP
or solid tannin extract was further dehydrated at 60°C in an oven, was blended
with dried KBr (1/40 w/w) and then studied by FTIR spectroscopy. For each
spectrum 200 scans were taken in the range from 400 to 4000 cm-1 with the
resolution of 8 cm-1.The resulting FTIR spectral patterns were analyzed and the
results were compared with known signatures of identified materials in the FTIR
library.
(2) 1H NMR Analysis
The arrangement of functional groups in TBP was measured by 1H NMR
(Nuclear Magnetic Resonance) Spectroscopy. A TBP sample was placed in a
strong magnetic field of 5,000 to 23,000 gauss and irradiated by the radio
frequency (RF), the value of which is dependent on the nuclei of interest.
Absorption of the radio frequency occurs, corresponding to the energy required to
bring the nuclear magnets (1H) into specific orientations with respect to the
magnetic field. The 1H NMR analysis of the TBP samples was undertaken using a
600MHz instrument (Bruker Spectrospin AV600, USA). The TBP solid was
dissolved in the solvent comprising 95% water: 5% D2O, and water suppression
was used to remove the water effects to the spectra generated. It had been the
intention to use 13C NMR, but due to the low solubility of the tannin and the low
sensitivity of carbon to NMR, no signals were observed, hence the use of 1H as
the atomic species to study.

89
4.5.1.4 Element Content Analysis
(1) ICP Analysis
A polymer will contain several elements in addition to carbon, which
need to be identified during a characterization process. A metal elemental analysis
test was carried out by use of an ICP Analyser (FISONS ARL 3580B, UK). 100
mg l-1 TBP solution and certified standard solutions (Merck, UK) were acidified
with 1% (w/w) HNO3 solution to the same pH. Results are expressed as the mean
value of three replicate samples. Using ICP, the percentage content of prominent
trace (mainly metal) elements of TBP (with dissolution in strong acid solution)
was analysed.
(2) CHN Analysis
An elemental analysis test for carbon, hydrogen and nitrogen was carried
out by a CHN elemental analyzer (Perkin-Elmer, USA) involving the catalysed
combustion of a 10 mg accurately weighted TBP solid sample at high temperature
(above 1800°C) in a stream of oxygen. After combustion, the generated CO2,
NOx and H2O flowed through a series of thermal conductivity cells (the detector)
and then were measured to determine the C, N and H percentages, respectively.
(3) TOC Analysis
The organic carbon content analysis was carried out by a total organic
carbon analyser, TOC-Vws (Shimadzo, Japan). Organic carbon in highly pure
water (de-ionised, 18.2mΩ), and in 100 mg l-1 TBP solution were measured to
determine the organic carbon content of the TBP sample. For the TBP solution,
samples were initially filtered by 0.45 µM membrane filter (Whatman,UK). The
filtered solution was acidified with ortho-phosphoric acid and sparged with high
purity (zero-grade) oxygen in a TOC analyzer prior to analysis. The solution was

90
then analyzed three times with mean results being quoted.
(4) Kjeldahl Nitrogen Analysis
The Kjeldahl method can be undertaken to determine ammonia nitrogen
and organic nitrogen (138). In this study, a Skalar’s SANplus analyzer (Skalar
Analytical Ltd., Netherlands) was used for the nitrogen analysis in 1g l-1 liquid
TBP samples after digesting the sample with concentred sulphuric acid, H2SO4,
5% (w/w) and a Kjeldahl catalyst. This result was adopted to validate the data
from the CHN analysis.
(5) Argentometric Titration Analysis
An Argentometric titration method (135) was used to measure the
chloride content of the TBP (counterion to the cationic charge). In a neutral or
slightly alkaline solution, potassium chromate can indicate the end point of the
silver nitrate titration of chloride. Silver chloride is precipitated quantitatively
before red silver chromate is formed. To get the concentration of chloride in a
sample, the following formula was used:
nncentratioChlorideCo
mL
LmL
mmol
mgCl
mL
mmolMmLBA
L
mgCl
1000
125
5.35)(
∗
∗∗−
=
----------------- (4.1)
Where:
A = mL titrant used for sample
B = mL titrant used for blank
M =molarity of silver nitrate

91
4.5.1.5 Molecular Weight Analysis
(1) Size Exclusion Chromatography (SEC) Analysis
SEC has been used to determine the molecular mass distribution of both
natural and synthetic polymers (139). In SEC, elution time data of samples can be
conveniently translated into molecular mass through a calibration curve. In this
study, information concerning the molecular mass distribution of TBP was
obtained by size exclusion chromatography with 1-methyl-2-pyrrolidinone (NMP)
as the polymer solvent and chromatographic eluent (139). This work was carried
out by colleagues in the Department of Chemical Engineering. Two appropriate
SEC columns (300mm; 7.5mm i.d. packed with polystyrene/polydivinylbenzene
beads) were selected in this study to fractionate the TBP sample at a temperature
of 85°C and flow rate of 2ml min-1. The SEC columns of different porosity
ranges (Mixed-D and Mixed-A; Polymer Labs,UK) were used with detection by
an evaporative light scattering detector (ELS) as well as Perkin-Elmer LC 290
UV-absorbance detector set at 280, 300 and 350nm. The method involves the use
of a calibration curve obtained by plotting the logarithms of known molecular
masses of standard polystyrenes or polysaccharides against their elution time.
TBP concentrations at 1g l-1 were used in this study. Although the solubility of
polymer samples in NMP solvent was assumed, this needs to be confirmed in any
future studies.
(2) Light Scattering Analysis
The amount of light scattered is directly proportional to the product of
the weight-average molar mass and the macromolecule (solute) concentration
(140). Light scattering method is widely used but it is valid only when the
refractive index (specifically the refractive index—concentration gradient, dn/dc)
of solution is known. In this study, the average molecular weight, <M>w, of the
TBP was determined by a Wyatt DAWN EOS Light Scattering Photometer

92
(Wyatt Technology Ltd. UK) at 633 nm and 25ºC. A known molar mass
polystyrene (200,000 g mol-1) dissolved in toluene was used as a standard sample.
The stock solution with TBP concentration of 1 g l-1 was prepared in 0.05 M
NaCl solution and filtered through a 0.2 µm syringe filter to remove fine dust
particles. To construct a Zimm plot, five dilutions at relative concentrations of
approximately 80%, 60%, 40%, 20% and 10% of the stock concentration were
introduced to the DAWN photometer in a batch mode by a syringe pump and the
scattered light was measured as a function of angle for each concentration. From
a single Zimm plot the molar mass M, rms radius rg and the second virial
coefficient A2 can be determined (140). The refractive index of TBP solution
was determined by Wyatt Technology UK Ltd.
4.5.2 Coagulation Experiments
4.5.2.1 Photometric Dispersion Analyser
Conventional jar test methods are limited in terms of their sensitivity and
practical convenience, although they sometimes do provide a useful visual and
semi-quantitative simulation of full-scale performance. In this study a
photometric dispersion analyser (PDA 2000, Rank Brothers, Cambridge, UK)
was used in a modified jar test procedure. This is a relatively new approach to
evaluating coagulation performance which has been found to provide a sensitive
and rapid response to the state of aggregation of colloidal suspensions. In the tests
a constant flow from the stirred reactor to the PDA optical sensor was maintained
by the use of tubing and a peristaltic pump (Matson 505S, UK) operating at about
25ml min-1; the flow passes through the optical sensor where it is illuminated by a
narrow light beam (850nm wavelength). In regard to the output of the PDA, the
ratio of the root mean square (rms) value of the fluctuating component to the
average transmitted light intensity (dc value) is called as the Flocculation Index
(FI).The optical data was recorded every second and the results were logged by
computer for subsequent spreadsheet analysis. Although inherently qualitative, it

93
is believed that the FI value is correlated with floc size and always increases as
flocs grow larger (141). Therefore, this ratio can give immediate information on
the state of aggregation of particle suspension over the entire period of
coagulation.
The principle of this optical technique has been described by Gregory
(142). A briefly description of this technique is illustrated as follows: a flowing
suspension through the transparent tube is illuminated by a narrow light beam
from a luminous light source. The transmitted light intensity passing through the
suspension fluctuates randomly about some mean value, which can be converted
to an electrical signal by a photometric detector. The output from detector
consists of a steady (dc) signal and a fluctuating (ac) component. The dc value is
a measure of the average transmitted light intensity and depends on the turbidity
of the suspension. The fluctuating (ac) component is a result of random variation
in the number of particles in the illuminated volume. Gregory concluded that the
root mean square (RMS) value of the fluctuating (ac) signal is related to the
average number concentration and the size of the suspended particles. In practice,
it is convenient to divide the RMS value by the steady dc value to give a
dimensionless term R= RMS/ dc. Although the ratio R is qualitative information
on aggregate size in nature, the relative change in the R value is a useful indicator
of the degree of coagulation.
4.5.2.2 Gator Jar
A 2L square, acrylic reactor vessel of 21cm height and 11.5cm width was
used in the coagulation tests as an alternative to standard glass beakers. This was
partly because the glass beakers created a large amount of vortexing, which
limited the attainable power input to the water, and partly to carry out tests where
it is useful to quantify the prevailing mean velocity gradient (commonly referred
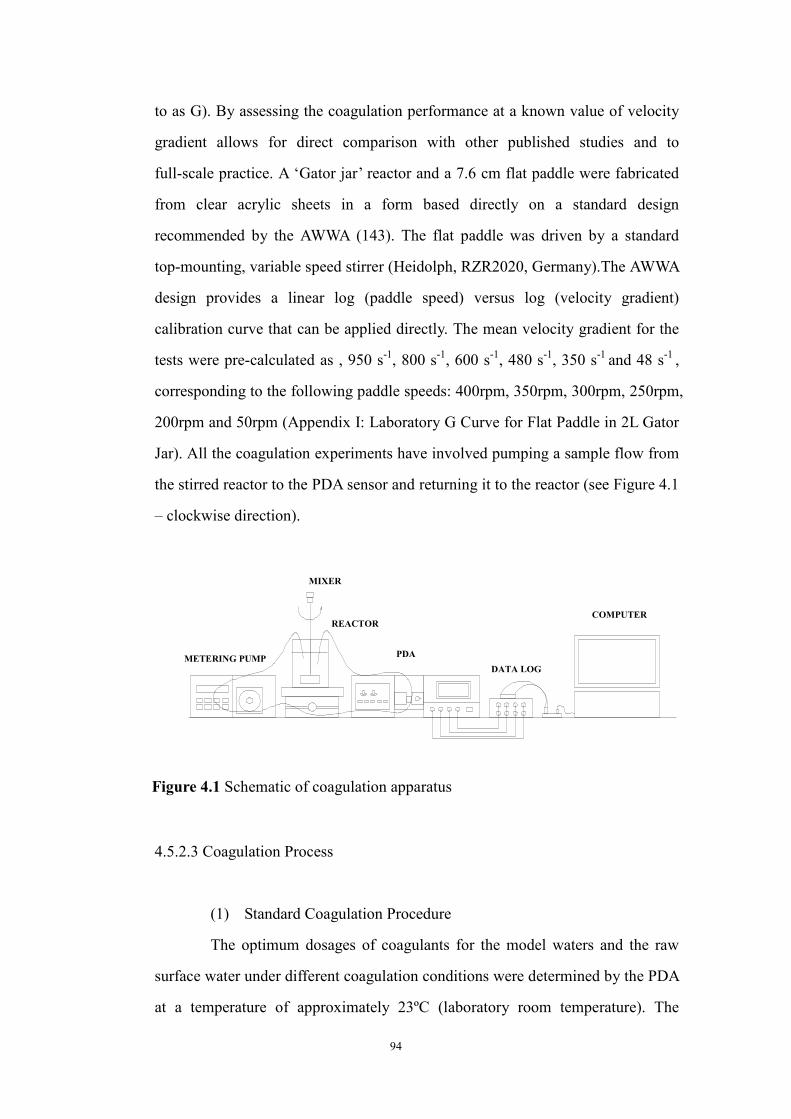
94
PDA
COMPUTER
METERING PUMPDATA LOG
REACTOR
MIXER
to as G). By assessing the coagulation performance at a known value of velocity
gradient allows for direct comparison with other published studies and to
full-scale practice. A ‘Gator jar’ reactor and a 7.6 cm flat paddle were fabricated
from clear acrylic sheets in a form based directly on a standard design
recommended by the AWWA (143). The flat paddle was driven by a standard
top-mounting, variable speed stirrer (Heidolph, RZR2020, Germany).The AWWA
design provides a linear log (paddle speed) versus log (velocity gradient)
calibration curve that can be applied directly. The mean velocity gradient for the
tests were pre-calculated as , 950 s-1, 800 s-1, 600 s-1, 480 s-1, 350 s-1 and 48 s-1 ,
corresponding to the following paddle speeds: 400rpm, 350rpm, 300rpm, 250rpm,
200rpm and 50rpm (Appendix I: Laboratory G Curve for Flat Paddle in 2L Gator
Jar). All the coagulation experiments have involved pumping a sample flow from
the stirred reactor to the PDA sensor and returning it to the reactor (see Figure 4.1
– clockwise direction).
Figure 4.1 Schematic of coagulation apparatus
4.5.2.3 Coagulation Process
(1) Standard Coagulation Procedure
The optimum dosages of coagulants for the model waters and the raw
surface water under different coagulation conditions were determined by the PDA
at a temperature of approximately 23ºC (laboratory room temperature). The

95
dynamic coagulation tests followed a standard approach: solution samples were
pumped from a 2L gator jar at about 25 ml min-1 through the tubing and the
average (dc) and fluctuating (rms) components of the transmitted light intensity
were monitored by the PDA instrument. After allowing 1 minute for steady state
readings to be established, coagulants at the required dosage were pipetted into
the suspension and the suspension was stirred at a high mixing speed, generally
with a G-value range of 300 s-1-700 s-1, for 30 seconds. It was observed that alum
and TBP were acidic and lowered the pH of model water. Therefore, to reach the
desired pH, a pre-determined amount of 0.1 mol l-1 NaOH or HCl solution was
added. The basic function of rapid mixing was to achieve complete mixing of the
polymer in the water in as short a time as possible, thereby causing efficient
destabilization. The stirring speed was subsequently reduced to a lower speed of
50 rpm (48 s-1) and held at this value for a chosen time period (10-60 mins),
which was determined as that required to obtain a steady FI, indicating flocs do
not continue growing and have reached a stead-state size. The fundamental
purpose of slow mixing was to promote collisions between destabilized particles
so that flocs were formed. The speed of 50 rpm is believed to be the optimal
stirring speed, which maintained the aggregates in suspension but without
excessive breakage in solution. However, in some cases there was still fluctuation
of the FI index at this speed in the stable phase of flocs, since large flocs were
observed to accumulate on the bottom of the jar and were intermittently
re-suspended.
(2) Procedure for the Study of Floc Strength
The formation, breakage and re-formation of flocs using TBP as
coagulant were investigated by studying the FI response to different values in
mean velocity gradient. Using a 2L gator jar, an indication of relative floc
strength can be obtained by applying a sudden increase in shear rate to the formed
aggregates and relating velocity gradient applied to the maximum ‘floc size’ (FI)

96
resulting. The procedure used is described as follows: after the coagulant at the
required dosage was pipetted into the suspension, the suspension was stirred at
200 rpm (350 s-1) for 30s, followed by slow stirring at 50 rpm for 10-30min (to
achieve steady state with no significant change in the FI value and so no further
floc growth). In order to study the floc strength, a series of tests were carried out
in which the stirring speed was increased suddenly to either 200 rpm (350 s-1),
250 rpm (480 s-1), 300 rpm (600 s-1), 350 rpm (800 s-1), and 400 rpm (950 s-1) for
60 seconds and then reducing the stirring speed back to 50rpm. A second series of
tests of floc breakage and re-formation was carried out in which a sudden
increase in stirring speed to 300 rpm was maintained for different time periods,
ranging from 5 to 300 seconds, and then the speed was reduced back to 50 rpm.
For each coagulant the flocculation indexes before floc breakage, and before and
after the floc re-formation due to increasing mixing speeds, were measured.
(3) Procedure for the Study of Coagulation Performance of Dual
Coagulant
A coagulation performance matrix was produced for a full range of
alum-polymer combinations at different pH values. Initially, a series of
coagulation tests using alum as the sole coagulant were carried out to determine
the optimal alum dosage. From this specific value the alum dosage was
systematically reduced, and at each dosage coagulation tests were carried out
with a range of polymer dosages. The dynamic coagulation tests for this study
were conducted in a 2 L gator jar and measured by the PDA, using a standard
approach as described previously; in summary this was: after allowing 1 minute
for steady state readings to be established, the required dosages of alum and TBP
were pipetted into the solution simultaneously and the solution was stirred at 200
rpm (350 s-1) for 30 seconds. The stirring speed was then reduced to a speed of 50
rpm ( 48 s-1) and held at this value for the required time (30min).

97
(4) Procedure for the Study of Coagulation Performance of Solid Bound
TBP
The sand used in this study was supplied by Universal Mineral Supplies
Ltd, UK. Considering the organic contaminant on the surface of microsand, the
received sand was first washed by either 20% (v/v) H2O2 or 5 % (v/v) Decon
solution (Decon Laboratories Ltd, UK), then rinsed by de-ionised water for three
times and finally dried in an oven at an appropriate temperature (105ºC). After
this pre-washing of the sand, the adsorption tests at pH4 were undertaken. Initial
adsorption tests were carried out at pH 4 using 30 mg l-1 TBP with different
amounts of sand. A 2L gator jar with a high mixing speed of 300 rpm (600 s-1) for
2 minutes was used in this test, and the final solution was filtered by 0.45µM
filter paper. It was found that the maximum UV absorbance wavelength for TBP
solution is 210nm, therefore the UV210 absorbance of filtered solutions was
measured to indicate the residual TBP in solution. Further, the absorption ratio of
TBP and sand can be determined.
The modified method of applying TBP/sand mixture as a coagulant for
HA solution treatment was investigated. In this case, the pH of solution was kept
at a value of 4 and the coagulation test procedure of solid bound TBP was as
follows: the solid bound TBP was prepared as described previously during 2
minutes rapid mixing of washed sand and soluble TBP in the correct
concentrations; the suspension was settled for 15 minutes; as much supernatant
solution was carefully decanted away without disturbing or losing the settled sand
from the bottom of the gator jar; approximately 2 L humic acid solution at 30mg
l-1 was poured to the jar, with an amount of pre-determined HCl/NaOH solution
to keep pH at 4; the contents of the gator jar were then rapidly mixed at 260 rpm
(500 s-1) to resuspend the sand and maintain uniform conditions for flocculation.
In general, all the bench-scale coagulation experiments have involved

98
pumping a sample flow from the stirred reactor to the PDA sensor and returning it
to the reactor. Figure 4.1 shows the PDA and Gator jar equipped with a peristaltic
pump and motorized stirrer for the coagulation tests.
Figure 4.2 Apparatus of coagulation tests
4.5.2.4 Analysis of Water Quality
Following a 30 min settling period after stirring, supernatant liquid was
withdrawn by pipette in order to measure the quality parameters in terms of
NPDOC, turbidity, colour, UV absorbance, floc volume and residual Al
99
concentration. All the analyses were carried out in accordance with standard
methods (135).
The concentrations of non-purgeable dissolved organic carbon (NPDOC)
in water were determined by a total organic carbon analyser, TOC-Vws
(Shimadzo, Japan). The treated water was initially filtered by 0.45µM membrane
filter (Whatman,UK) and then the filtered solution was acidified with
ortho-phosphoricacid and sparged with high purity (zero-grade) oxygen in a TOC
analyzer prior to analysis. The solution was analyzed three times with mean
results being quoted.
Turbidity was measured by a turbidity meter (Model 2100A, Hach, UK),
which was calibrated with standard solutions of 1 NTU, 10NTU or 100NTU.
50ml supernatant of final water was measured without filtration.
The Hazen colour values of the final water were measured by a
Lovibond Nessleriser (BDH Chemicals Ltd, UK) after filtering through a
Whatman 0.45 µM membrane filter. The color was determined by visually
matching a column of sample in a Nessler cylinder with pre-calibrated colored
glass standards, which are stable-colored and not affected by UV light or extreme
environmental conditions.
The absorption of light at ultra-violet wavelengths, such as 254nm, is
believed to be caused by aromatic compounds and other organic substances with
conjugated double bonds. Specific visible light absorbance at 400nm was used to
represent true colour in the solution. In this case, UV-Vis measurements were
recorded for filtered water by 0.45µM membrane filter (Whatman,UK) at 254nm
(UV) and 400nm (colour), using the UV Probe Ultraviolet Spectrophotometer
(Shimadzo, Japan; 10 mm quartz cell path).

100
Floc volume was measured by Imhoff cones after 1 hour settling. 2 L
treated water is added to a pair of one-liter cone-shaped plastic containers. After
settling for 45 min, the sample solution was gently agitated near the sides of the
cone with a rod. Following a further 15 min settling period, the floc volume was
recorded in milliliters, from graduations marked near the bottom of the cone.
The solution was further centrifuged at 2000 rpm for 30 min by
centrifuge (Gallenkamp, UK), and then 20 ml of the solution was filtered through
a 0.45 µM membrane filter (Whatman, UK). In order to determine the residual
aluminum concentration, the filtrate was acidified with 2 ml of concentrated
HNO3 solution (0.2% w/w), and measured by a graphite furnace atomic
absorption spectrometer (Perkin-elmer AAnalyst 800, USA).
4.5.3 Residual Tannin Measurement
(1) Determination Limit of Standard Method for Tannin Measurement
A standard method (144) was undertaken to determine the concentration
of free tannin in final water. This colorimetric method measures the light
absorbance at 700nm using the UV Probe Ultraviolet Spectrophotometer
(Shimadzo, Japan; 10 mm quartz cell path) following progressive additions of a
standard solution of Folin phenol reagent (tungstophosphoric and
molybdophosphoric acids) and carbonate-tartrate reagent that participate in an
association reaction with tannin in solution to form a blue color. According to the
procedure describe in Section 5550B of Standard Methods (144), the minimum
detectable concentration is approximately 0.025 mg l-1 for phenol and tannin acid
with as 1-cm-path-length spectrophotometer. However, the detection limit of this
method was determined in a preliminary study. For this purpose, seven
replicates of 0.025 mg l-1 standard tannin acid solution were analyzed with a

101
1-cm-path length spectrophotometer. The Detection Limit (DL) for tannin acid
and phenol was evaluated by use of the equation: DL=S t (n-1, 1-α=0.99) , where S =
standard deviation of the replicate analyses, and t (n-1, 1-α=0.99) =3.143, where 3.14
is the Student’s t value for 7 degrees of freedom at 99% confidence level. Using a
set of seven tannin samples in aqueous solution, and quantifying the light
absorbance at 700nm, the DL in this method was found to be 0.018 mg l-1 for
tannin acid. The method illustrated that in a single laboratory analyzing seven
replicates for phenol at 0.1mg l-1 the precision was ± 7% and recovery was 107%.
(2) Standard Calibration Curve for Colorimetric Method
A calibration curve has been established by measuring the absorbance of
Folin phenol reagent with different concentrations of standard tannin at 700nm.
The calibration curves for low concentrations (0.025 mg l-1 to 0.5 mg l-1) and
relatively high concentrations (0.4 mg l-1 to 10 mg l-1) of tannin acid are given in
Figure 4.2 and Figure 4.3. It can be seen that although the linear relationship
between absorbance and reagent concentration is less consistent at low
concentration, compared with high concentration of reagent, the trend is still
sufficiently linear for both concentration ranges. Figure 4.4 shows the calibration
curve with the combined reagent concentration (i.e. from 0.025 mg l-1 to 10 mg l-1;
the combination of the Figures 4.2 and 4.3), and the resulting overall equation:
0043.00943.0 −= XY ------- (4.2), was used subsequently for the final
calculation of residual TBP concentration. Having derived the calibration curve
for tannin acid, it was used to estimate the concentration of residual TBP in
various coagulation tests.

102
y = 0.0672x - 0.0021
R2 = 0.9876
0
0.005
0.01
0.015
0.02
0.025
0.03
0.035
0 0.1 0.2 0.3 0.4 0.5 0.6
Low concentration of Tannin acid (mg l-1)
Abs (cm
-1)
Figure 4.3 Absorbance at 700nm with low tannin acid concentration
y = 0.0924x + 0.0078
R2 = 0.9975
0
0.1
0.2
0.3
0.4
0.5
0.6
0.7
0.8
0.9
1
0 2 4 6 8 10 12
High concentration of Tannin acid (mg l-1)
Abs (cm
-1)
Figure 4.4 Absorbance at 700nm with high tannin acid concentration

103
y = 0.0943x - 0.0045
R2 = 0.9983
0
0.1
0.2
0.3
0.4
0.5
0.6
0.7
0.8
0.9
1
0 2 4 6 8 10 12
Concentration of Tannin acid (mg l-1)
Abs (cm
-1)
Figure 4.5 Absorbance at 700nm (10mm cell path) with whole range of tannin
acid concentration

104
5. RESULTS: CHARACTERISATION OF TBP
5.1 Introduction
It is generally accepted that the molecular weight and charge density of
polymers play important roles in coagulation mechanisms and should be taken
into account for the coagulation performance. Dentel et al. (22) proposed that the
monomer types and actual chemical structures of polymers were evidently related
to their coagulation behaviors in water and wastewater treatment processes.
However, sufficient attention has not been given to the improvement of the
coagulation performance by optimizing the polymer structure for particular
applications. To date, the theories on the coagulation mechanism of natural
polymers are still at the broad and exploring stage, with, unfortunately, much of
the early work having been done on poorly characterized natural polymers.
Studies (27, 146) on the characterisation of modified chitosan by different
techniques have been undertaken in some areas, for example, biomedicine, food
packaging, and the cosmetics industry, but no attempt has been made to link the
structure of these natural polymers with the coagulation mechanism and their
application in water treatment.
The principal aim of this study was to determine the important
parameters such as charge density and molecular weight, which is believed to
affect the coagulation mechanism of TBP. Furthermore, working on an assumed
tannin structure, shown in Figure 2.6, the other objective of this phase of the
experimental work was to identify more clearly the chemical structure and
functional group of TBP through the application of different techniques.
Identification of TBP was carried out by a series of standard and modified
analysis methods. The experimental steps are described briefly below:
(a) Some preliminary tests were carried out, for example, on the polymer
solubility, UV absorbance and pH titration. These simple tests do not provide
conclusive information about the polymer structure, but provide useful

105
supporting information.
(b) The charge density of TBP was determined under varying conditions. The
results provide an assumption of the amine type in the TBP monomer and
information concerning the structure of condensed-tannin and the
modification process.
(c) Identification of TBP functional groups was attempted by involving FTIR and
NMR methods. The useful output is compared with outputs obtained for a
library of standard polymers obtained under similar experimental conditions.
(d) Qualitative and quantitative elemental analysis was employed to provide
confirmatory evidence regarding the assumption by previous steps, and
further information about the structure of the monomer of TBP.
(e) Examination of the molecular weight of TBP was obtained in the final set of
tests.
Overall, the intention was to assess the monomer type and functional
groups of TBP, and to estimate two important parameters, charge density and
molecular weight. It was considered therefore that by employing standard or
modified test methods would advance the possibility to describe the chemical
properties and structure of TBP.
5.2 Characterisations of TBP
5.2.1 Dissociation, Precipitation and UV Absorbance of TBP
In order to fully identify the polymer, it is first necessary to be familiar
with the basic chemical properties of TBP in solution, such as its dissociation
behaviour, solubility and UV/Vis absorbance.

106
5.2.1.1 Dissociation of TBP in Solution
Modified tannin-based polymer was observed to be water soluble and
present a low initial pH value in de-ionised water. Since the relative strength of
weak acids can be found by comparing their acid dissociation constant pKa, a pH
titration was initially carried out by adding standard base (NaOH solution) to TBP
solution. A titration curve contains a relatively vertical section which represents a
change of pH with a small volume of standard solution. The midpoint of the
titration curve corresponds to the equivalence point for the reaction. Based on the
TBP—base titration curve (Figure 5.1), the value of an approximate dissociation
constant (pKa) was determined.
Figure 5.1 TBP solution titration curve: 100ml Tannin (0.03g l-1) titrated with
0.001mol l-1 NaOH
From the pH titration curve, it can be seen that the titration curve of TBP
solution is different from a strong acid- strong base titration curve. For a strong
acid-strong base titration curve, the change in pH near the equilibrium point is
sharper, so it is easier to locate the equivalence point with good precision.
However, as can be seen from Figure 5.1, the pH titration curve is not indicative
of the end point, which occurs when the acid and base in solution are
stoichiometrically equivalent. Therefore, assuming the equivalence point is
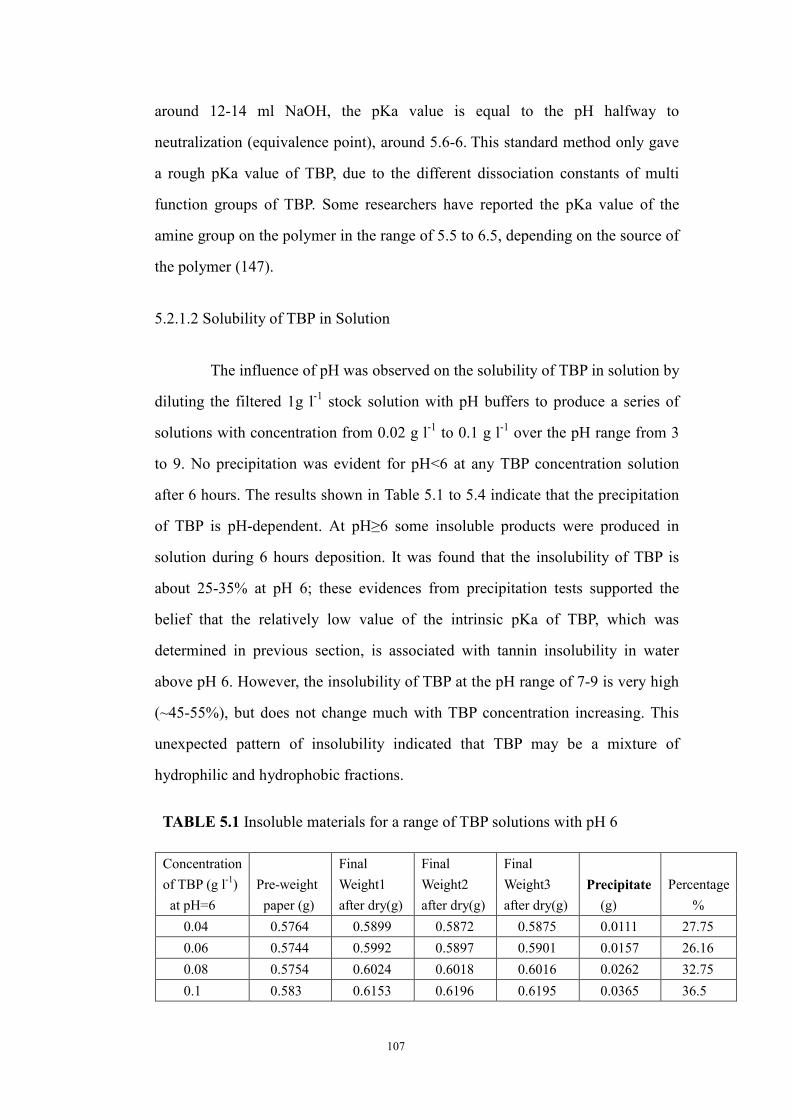
107
around 12-14 ml NaOH, the pKa value is equal to the pH halfway to
neutralization (equivalence point), around 5.6-6. This standard method only gave
a rough pKa value of TBP, due to the different dissociation constants of multi
function groups of TBP. Some researchers have reported the pKa value of the
amine group on the polymer in the range of 5.5 to 6.5, depending on the source of
the polymer (147).
5.2.1.2 Solubility of TBP in Solution
The influence of pH was observed on the solubility of TBP in solution by
diluting the filtered 1g l-1 stock solution with pH buffers to produce a series of
solutions with concentration from 0.02 g l-1 to 0.1 g l-1 over the pH range from 3
to 9. No precipitation was evident for pH<6 at any TBP concentration solution
after 6 hours. The results shown in Table 5.1 to 5.4 indicate that the precipitation
of TBP is pH-dependent. At pH≥6 some insoluble products were produced in
solution during 6 hours deposition. It was found that the insolubility of TBP is
about 25-35% at pH 6; these evidences from precipitation tests supported the
belief that the relatively low value of the intrinsic pKa of TBP, which was
determined in previous section, is associated with tannin insolubility in water
above pH 6. However, the insolubility of TBP at the pH range of 7-9 is very high
(~45-55%), but does not change much with TBP concentration increasing. This
unexpected pattern of insolubility indicated that TBP may be a mixture of
hydrophilic and hydrophobic fractions.
TABLE 5.1 Insoluble materials for a range of TBP solutions with pH 6
Concentration
of TBP (g l-1) Pre-weight
Final
Weight1
Final
Weight2
Final
Weight3 Precipitate Percentage
at pH=6 paper (g) after dry(g) after dry(g) after dry(g) (g) %
0.04 0.5764 0.5899 0.5872 0.5875 0.0111 27.75
0.06 0.5744 0.5992 0.5897 0.5901 0.0157 26.16
0.08 0.5754 0.6024 0.6018 0.6016 0.0262 32.75
0.1 0.583 0.6153 0.6196 0.6195 0.0365 36.5

108
TABLE 5.2 Insoluble materials for a range of TBP solutions with pH 7
Concentration
of TBP (g l-1) Pre-weight Weight1 Weight2 Weight3 Precipitate Percentage
at pH=7 paper (g) after dry(g) after dry(g) after dry(g) (g) %
0.04 0.5762 0.5962 0.5944 0.5944 0.0182 45.50
0.06 0.5761 0.6094 0.6055 0.6052 0.0291 48.50
0.08 0.5767 0.6162 0.6133 0.613 0.0363 45.37
0.1 0.5704 0.6162 0.614 0.6138 0.0434 43.40
TABLE 5.3 Insoluble materials for a range of TBP solutions with pH 8 Concentration
of TBP (g l-1) Pre-weight Weight1 Weight2 Weight3 Precipitate Percentage
at pH=8 paper (g) after dry(g) after dry(g) after dry(g) (g) %
0.02 0.5647 0.5754 0.5742 0.5738 0.0091 45.50
0.04 0.5678 0.5856 0.5838 0.5839 0.0161 40.25
0.06 0.5644 0.5983 0.5957 0.5954 0.031 51.60
0.08 0.5768 0.6199 0.619 0.6189 0.0421 52.60
0.1 0.5619 0.6091 0.6083 0.6078 0.0459 45.90
TABLE 5.4 Insoluble materials for a range of TBP solutions with pH 9 Concentration
of TBP (g l-1) Pre-weight Weight1 Weight2 Weight3 Precipitate Percentage
at pH=9 paper (g) after dry(g) after dry(g) after dry(g) (g) %
0.02 0.5667 0.5791 0.5766 0.5765 0.0098 49
0.04 0.5843 0.6064 0.604 0.6036 0.0193 48.25
0.06 0.5696 0.6049 0.603 0.6028 0.0332 55.34
0.08 0.5864 0.6478 0.6299 0.6295 0.0431 53.85
0.1 0.5722 0.6294 0.6218 0.6215 0.0493 49.30
5.2.1.3 UV/visible Light Absorbance
UV/visible light absorbance tests were carried out using an Ultraviolet
Spectrophotometer (10mm quartz cell path; wavelength range from 190nm to
800nm) for 0.02g l-1, 0.05g l-1 and 0.1g l-1 TBP solutions (no buffer). Figure 5.2
shows two absorbance peaks at wavelengths of 210±2nm and 280±5nm were
found for TBP solutions with a range of concentrations, and the maximum
absorption occurred at 210nm. These two distinct absorbance peaks at two
wavelengths indicated the complex nature of TBP.

109
Figure 5.2 UV-Vis scan of TBP solution with a series of TBP concentrations
The results in Figure 5.3 clearly demonstrate the influence of pH upon
the UV absorbance of TBP solution. For the TBP solutions at pH 4, 6 and 8, after
6 hours and filtration, there is an approximate linear relationship between UV
absorbance (at 210nm) and TBP concentration in accordance with Beer’s Law;
that is, UV absorbance of solution increased directly with TBP concentration
(148). However, the values of absorbance at 210nm decreased with the pH
increasing, indicating the loss of precipitated polymer at pH≥6. It was observed
that at pH 9, there was a non-linear relationship between UV absorption and TBP
concentration, indicating a significant change in the chemical properties of the
TBP. Therefore, UV absorbance measurement is infeasible to give a quantitative
analysis for the content of TBP solution at different pH values.

110
0
0.5
1
1.5
2
2.5
3
3.5
4
4.5
0 0.02 0.04 0.06 0.08 0.1 0.12
TBP concentration (mg l-1)
Abs cm-1
Abs pH=4
Abs pH=6
Abs pH=8
Figure 5.3 Variation of absorbance at 210nm (10mm cell path) with TBP
concentrations (pH = 4, 6 and 8)
5.2.2 Variation of Charge Density with pH and Time
Colloid titrations with TBP solutions at a constant concentration of 0.05
g l-1 were carried out to determine the variation of charge density with pH using
PPVS of pre-determined charge density (0. 512×10-3 meq l-1). The titration
end-point was measured by visual and spectrophotometric methods. For
comparative purposes, a study was made of a quaternary ammonium polymer,
polyDADMAC (DB 45 SH). In this case, the charge density is expressed as the
milliequivalents of positive charge per gram of polymer. Through confirming the
charge density of polyDADMAC, it was found that the spectrophotometric
method (procedure 2) was more accurate than the visual method because the
repeatability error was much smaller. Figure 5.4 shows the charge densities of
TBP and polyDADMAC prepared in buffer solutions for 3 hours in the pH range
from 4 to 9 and measured by spectrophotometry. It is clearly seen that the charge
density values of polyDADMAC are in the range of 6.1 to 6.2 meq g-1, and the
value is not pH sensitive over a wide range of solution pH. This result agrees with
the observations of Bolto and Gregory (19), that the charge density of

111
polyDADMAC is generally about 6.2 meq g-1 and unaffected by changes in pH.
In contrast, the charge density of TBP was found to be pH–dependent as indicated
in Figure 5.4. The results show that the charge density decreased from 3.07 meq
g-1 to 0.2 meq g-1 with increasing pH values from 4 to 9.
0
1
2
3
4
5
6
7
3 4 5 6 7 8 9 10
pH
Charg
e D
ensity (m
eq g
-1)
TBP
poly DADMAC
Figure 5.4 Charge density of TBP as a function of pH
In addition to the influence of pH, the charge density of TBP is also
observed to be subject to an ‘ageing’ effect. Figure 5.5 represents the temporal
variation of charge density of TBP at different pH. In this case, the initial charge
density of 0.05 g l-1 TBP solution was colloid titrated within 2 standing hours,
which give a higher value, compared with the results in Figure 5.4. Inspection of
the varied curves of charge density revealed that with TBP storage time
increasing, the charge density significantly decreased at all pH values. However,
it is evident that even after 48 hours, the charge density was still significant at pH
< 7. These phenomena are clearly related to the previous observations concerning
the TBP solubility, and dissociation chemistry.

112
0
1
2
3
4
0 10 20 30 40 50 60
Time (hrs)
Charg
e d
ensity (m
eq g
-1)
pH=4
pH=5
pH=6pH=7
pH=8
pH=9
Figure 5.5 Temporal variation of charge density of TBP at different pH
5.2.3 Elemental Content Analysis
The elemental content of TBP was measured by several methods, namely:
ICP for the metal elements; CHN for carbon, hydrogen and oxygen; and
Argentometric titration for chlorine. The carbon content was validated by TOC
analysis, and the nitrogen was validated by the Kjeldahl method. The results are
shown in Table 5.5. These provide useful information in interpreting the repeating
structure of TBP by considering the ratio of the elements. It is reasonable to
assume that remaining content (~ 29%) of the polymer is oxygen.
TABLE 5.5 Results of elemental analysis of TBP product (mass %)
TBP
Element
C H N Metal
(Sum)
Cl Total
Mass % 42.77 5.88 7.16 1.6 13.4 70.81
5.2.4 Chemical Functional Group/Bond Analysis
Two major spectroscopic methods, Fourier Transform Infrared (FTIR)

113
and Nuclear magnetic resonance (NMR), were used to qualitatively study the
chemical groups and bond types of TBP in this study.
5.2.4.1 Analysis of FT-IR Spectra
The absorbance of infrared rays plotted separately against wave number
for TBP and tannin extract is displayed in Figure 5.6 and Figure 5.7. Based on the
region of the absorption peaks and the notional structure of the TBP it is possible
to speculate on the nature of some of the functional groups. Comparing the
spectra in Figure 5.6 and 5.7, it can be seen that most of the functional groups in
TBP are present in the spectra of tannin extract. In both spectra, the 1040-1150
cm –1 absorption band is attributed to C-O stretching; the 1370-1470 cm–1
absorption band belongs to the –CH3 group; and the 700-900 cm –1 absorption
band is characterised by adjacent or isolated H and aromatic H. The 2360 cm–1
absorption band is from the small CO2 doublets, which appears in many spectra
due to inequalities in path length. The 3600-3850 cm –1 absorption band is caused
by sharp O-H stretching. It is also clear that the similar appearances of absorption
peaks in Figure 5.6 and Figure 5.7 indicated that the absorbance bond between
1550 and 1600 cm-1 belonged to a benzene group rather than an amine group
(148).
The distinct absorbance peak between 3300 and 3600 cm-1 in the FTIR
spectrum of TBP is thought to be attributable to amine groups, for example,
>N-H, -NH2 and –NH +
3. This absorbance peak is not shown in Figure 5.7 by the
FTIR analysis of tannin extract, which was assumed not to have any significant
nitrogen in the structure. This conclusion is consistent with the results of the
Kjeldahl method which showed that for TBP, the organic-N content was found to
be approximately 6.5% and inorganic ammonia-N content was approximately 1%,
compared with a neglectable N content in tannin extract by the Kjeldahl method.

114
Figure 5.6 FT-IR spectra of TBP
Figure 5.7 FT-IR spectra of tannin extract
5.2.4.2 Analysis of 1H NMR Spectra
The resulting spectrum from the 1H NMR analysis of the TBP solution is
presented in Figure 5.8. Although 1H NMR is a very versatile structural
elucidation technique for hydrogen-containing compounds, the interaction
between neighbouring hydrogens makes the resulting spectrum very complex, as
can be observed from inspection of Figure 5.8 in the 2.5-4.4 ppm region. An
0.3
0.4
0.5
0.6
0.7
0.8
0.9
1.0
1.1
1.2
1.3
1.4
1.5
1.6
Absorb
ance
500 1000 1500 2000 2500 3000 3500 4000
Wavenumbers (cm-1)

115
initial analysis of the spectrum has resulted in the breakdown of the data into
three distinct regions: signals due to alkane protons (2.5-4.4 ppm); alkene protons
(4.5-5.5 ppm) and aromatic protons (6.5-8.5 ppm). Several of the signals in the
1-4 ppm region could also be attributed to the numerous magnetically different
O-H groups around the basic TBP structure. In addition, one of the signals in
the 6.5-8.5 ppm region may also be tentatively attributable to the presence of an
amine salt.
Figure 5.8 1H NMR spectra of TBP

116
5.2.5 Analysis of Molecular Weight
5.2.5.1 Molecular Weight Determined by SEC
The molecular weight of TBP can be defined experimentally by size
exclusion chromatography (SEC). However, the precision is dependent upon the
adequacy of reference polymers for calibration. The results from the SEC in
Figure 5.9 show a narrow range of MW distribution for the TBP, with a mean
MW differing widely from a possible 15 million (from calibration with
polystyrenes) to 800,000 (from calibration with polysaccharides). Since the
oxygen content deduced by the element analysis is approximately 30% by weight,
the standard polysaccharides (highly oxygenated polysaccharides) were
considered more appropriate to create the calibration curve to measure MWs in
this case (139). The elution time for TBP was lower than 14 min, which is beyond
the standard calibration curve (elution time range: 14min to 20min for standard
polysaccharides). This indicated that the molecular weight was greater than
800,000 in comparisons with polysaccharide. Some additional information was
provided by SEC, which is that another peak occurred at the elution time of 24
min, with a mean MW of 2-300. Even though the elution time is out of the
standard calibration range, the result from the SEC showed that the TBP sample
is a mixture of high molecular weight polymers (>800,000) and some low
molecular weight components (<200-300), probably non-polymerized monomer.
Through the SEC study, the full dissolubility of TBP in NMP solvent
was concerned. Therefore, further MW measurement by light scattering was
taken.

117
0
50
100
150
200
250
5 10 15 20 25 30
ELS
UV-absorbance
300 nm
280 nm
350 nm
Molecular weight around
2-300 at peak,
Molecular weight in
comparison with
polystyrenes, >15
mill ion;
in comparison with
polysaccharides,
about 800,000
at peak
Elution time
(min)
Intensity
Figure 5.9 Elution curve of TBP by size exclusion chromatography
Note: ELS is the absorbance by evaporative light scattering detection.
5.2.5.2 Molecular Weight Determined by Light Scattering
Light scattering is alternatively used to determine the molecular weight
of polymers in solution. In order to calculate the molecular weight by the Zimm
plot technique, it is necessary to know the refractive index/polymer concentration
ratio (dn/dc) (149). The dn/dc value of TBP at 633nm and 25ºc was determined to
be 0.1846 ml g -1 (Determined by Wyatt Technology UK Ltd, see Appendix II).
The construction of the Zimm plot of TBP was carried out by a Wyatt DAWN
EOS Light Scattering Photometer and the plot is shown in Appendix III. In the
Zimm plot, each combination of TBP concentration and scattering angle is
represented by a solid circle, therefore, the molecular mass for tannin based
polymer was determined as 5.7× (±2.8)105 g mol-1, and the root mean square (rms)
radius, or “radius of gyration” was 78.4 (±19.3) nm.
118
5.3 Discussion
A series of analytical methods have been undertaken to fully understand
the character and properties of TBP. A preliminary investigation by some standard
methods showed that TBP solution exhibits a buffer behaviour and gives a
dissociation constant pKa of 5.6-6. This assertion is further supported by the
range of general pKa values for an amine group on the polymer, which is from
5.5 to 6.5 (150). The relatively low value of the intrinsic pKa of its amino
functions may be linked to TBP’s relative insolubility in water above pH 6. It was
found that at pH≥6 the degree of insolubility increased dramatically with pH
value (insolubility: ~25-35% at pH 6; ~40-55% at pH 7, 8 and 9). This strongly
favours the conclusion that the solubility of amines increases with decreasing pH,
as long as the solubility product of the protonated amine and the particular
counter ion are not yet reached (151). These results point out the competition
between protonation and complexation of the amino groups in relation with their
pKa, around 6.0. The weak interactions observed at pH>6 reflected the small
percentage of free amino groups available under these conditions. The
comparable UV spectroscopic results of TBP solution at acid and alkali
conditions showed the maximum absorbance value at high pH is inferior and
unstable, probably due to a change in the chemical properties of the TBP.
Incidentally, the existence of two prominent UV/vis absorbance peaks indicated
the complex form of components, probably, related to the polymeric TBP and
non-polymerization monomer, when TBP solid dissolved in water.
Although TBP is classed as a cationic polymer, the charge density
appeared to be strongly pH-dependent and subject to “ageing” effects. Increasing
the pH value from 4 to 9 decreased the charge density from 3.07 meq g-1 to 0.2
meq g-1 for a 3 hours TBP solution sample. The sharp change of charge density
occurred at pH7, where the net charge on TBP was less than 1 meq g-1. The
reason for this is that as a Mannich-reaction polymer, the cationic monomer of

119
TBP is non-quaternized. Thus, the cationic TBP is likely to be associated with a
tertiary amine group, R3NH+, which deprotonates at high pH, so variations in
solution pH will affect the charge density. The mechanism of solubility and
charge density can be described as:
N
CH3
Tan
CH3
H N
CH3
CH3
Tan HOH N
CH3
Tan
CH3
HOH OH+
+ ++high pH low pH
increasing
solubility
decreasing
+
More specifically, phenolic hydroxyl groups present on TBP have weak
tendencies to lose the H+ ion, thereby increasing the anionicity. This slow process
of deprotonation at the hydroxide sites of TBP could be used to explain the
diminished trend of charge density with time (at pH4, the charge density
decreased from 3.07 meq g-1 to 2.04 meq g-1 after 24h).
The amine group on the TBP was further characterized by 1H NMR and
FT-IR measurement in comparison with the results of tannin extract in this study.
Both the NMR and FTIR analyses qualitatively and consistently identified the
presence of the main functional groups, for example, aromatic rings; NH stretch;
C-O stretching; O-H stretching; –CH3 and amine salts, therefore aiding the
evaluation of the structure of TBP.
The proposed monomer structure of TBP outlined in Figure 5.11 was
derived from the experimental results and the information from the Mannich
reaction of condensed tannin.

120
ROOH
OH
OH
OH
CHR
N
H
R1
R2+
Figure 5.10 The proposed basic repeating unit of TBP
In Figure 5.11 it is believed that the CHR is the remainder of the aldehyde
compound after the carbonyl oxygen has left. R1 and R2 are hydrogen or other
organic moieties that were part of the original amino compound.
From the mass proportions, an approximate elemental ratio for the
polymer can be deduced as: N: O: C: H = 1: 3.6: 7: 11.5. Clearly, there are some
inconsistencies between the experimental results and the structure hypothesised.
With the assumption that there are 16 carbon atoms per monomer group, there
appear to be more nitrogen atoms present to account for the observed atomic ratio
of 1:7 (N:C). From theory, in the Mannich reaction the molar ratio of the primary
amine to the tannin monomer (assumed to contain 16 carbon atoms) is about
2.3:1. However, some studies (129) indicated that the preferred molar ratio of the
primary amine, which was generated from the first reaction of an aldehyde and an
amino compound, to the tannin repeating unit is in the range of about 1.5:1 to
3.0:1, which is consistent with the above theory. The less active secondary and
tertiary amines were formed following the first reaction. In view of this, it can be

121
speculated that the solid TBP product contains additional nitrogen/amine mass
which is not bound within the TBP monomer. Therefore a high amount of
nitrogen was over estimated in the element content of TBP.
The molecular weight of TBP (5.7 (±2.8) × 105 g mol-1) determined by
light scattering indicated that TBP is a medium-to- high MW polymer in the
range of 105-106 g mol-1 and with a radius of gyration of 78.4 (±19.3) nm. In
solution, polymers adopt a random coil configuration with much smaller
dimensions (usually less than 1 µm (145). It is evident that the molecular weight
of TBP determined in this study is broadly consistent with the US Patent (152),
which disclosed that the average molecular weight of the tannin derived product
after polymerization is generally within the range of 5,000 to 500,000.

122
6. RESULTS: COAGULATION ACTION OF TBP IN MODEL WATER
6.1 Introduction
The coagulation mechanisms of cationic polymers are believed to be a
combination of charge neutralisation and polymer bridging. Even though it is still
not clear which of these two mechanisms is predominant in the flocculation
process, some investigations (153,154) have found that, for a given polymer,
there was an optimum concentration, beyond which poorer flocculation
performance was found. When charge neutralisation played the main role in the
coagulation process, the optimal polymer concentration corresponded to the
concentration required for zero particle surface charge. In the same way, when
polymer bridging was the principal mechanism of coagulation, the optimum
dosages should be directly proportional to the total particle surface area and
hence to the particle concentration (19). Charge neutralisation of dissolved humic
substances is thought to be the dominant mechanism of coagulation, specifically
with cationic polyelectrolytes. There is a lot of evidence that the optimum dosage
corresponds closely with charge neutralisation and that a stoichiometric
relationship exists between the anionic charge carried by the humics and the
cationic charge of the added polyelectrolyte (30).
In considering the kinetic processes of polymer flocculation for
suspension particles, various types of interaction condition can be envisaged. It
was well established that the rate of flocculation process depended on the
concentration of polymer molecules and suspended particles, the intensity of
agitation and the pH value of solution (145). These parameters are believed to
greatly influence the flocculation effectiveness. In addition, ageing of polymer
solutions is considered to have an important effect on their flocculation
performance (19, 21). This is supported by the results of Owen et al. (155) who
showed that polyacrylamide stock solutions, aged between 1 and 6 days, gave
optimal flocculation after 72 h. Several ‘screening’ researches using different

123
polymers (16) to account for the influence of molecular weight on the
flocculation effectiveness have been carried out, and there are some experimental
results which can be cited as giving qualitative or quantitative evidence of their
relationship (6, 31).
The strength of flocs formed during coagulation depends on many
factors, such as the type and amount of coagulants, the nature and quantity of
interacting contaminants and the hydrodynamic conditions prevailing during floc
formation. An individual floc will break if the stress applied at its surface is larger
than the bonding strength within the floc. Thus, increased floc compaction is
believed to increase floc strength due to an increase in the number of bonds
holding the aggregate together (78). The aggregates (flocs) formed by polymer
bridging are considered to be much stronger than those formed by metal salts (19).
Gregory (156) has stated that when comparing different flocs formed by the same
coagulant, the size of the floc (or indirectly, the flocculation index) for a given
shear rate indicates floc strength. It is believed that the density of aggregates
increases as their size decreases (157), and increased floc density leads to greater
floc strength (77). Floc size in a sheared suspension is limited by floc strength.
In general, the literature suggests that the coagulation performance of
TBP has as yet only been investigated superficially, and very little attention has
been given to the coagulation mechanism, stoichiometry, influences on
performance and floc strength. A much clearer understanding of the reaction
mechanism is required to optimize the application of TBP. In this study, to fully
evaluate the fundamental mechanism of coagulation with the TBP, the
coagulation performance of TBP was conducted by laboratory tests using,
separately, clay suspensions (kaolin powder) and humic acid (HA) solutions as
model water. Through the use of a 2 L Gator jar test reactor and PDA
measurements, the optimal dosages of TBP in the pH range of 4-9 were

124
determined; this was to assess the relative importance of different coagulation
mechanisms of TBP. Furthermore, the stoichiometry and the effect of TBP ageing
phenomena and initial mixing speed were investigated. The results collected from
the measurement of the turbidity reduction in clay suspensions, and the removal
of UV-Visible absorbance and non-purgeable dissolved organic carbon (NPDOC)
in HA solutions, in conjunction with the observation of floc strength formed by
TBP were compared with the data obtained from the study of polyDADMAC and
alum as coagulants.
6.2 Coagulation Mechanisms Using TBP as Sole Coagulant
6.2.1 Coagulation of Kaolin Suspensions
Using the PDA test method, the coagulation of 50 mg l-1 kaolin
suspension for a given pH in the range of 4-9, was conducted to determine the
optimum dosage of TBP. In addition, at the end of the PDA monitoring period,
the residual turbidity after settling for 30 mins was measured to further confirm
the performance of the TBP. The results of flocculation tests in terms of the FI
response and residual turbidity with different TBP dosages at pH4, 7 and 9 are
shown in Figures 6.1-6.6.

125
Figure 6.1 Flocculation index response with TBP dose at pH4 (50 mg l-1 kaolin
suspension)
Figure 6.2 Flocculation index response with TBP dose at pH7 (50 mg l-1 kaolin
suspension)

126
Figure 6.3 Flocculation index response with TBP dose at pH9 (50 mg l-1 kaolin
suspension)
0
5
10
15
20
25
30
35
40
45
0.1 0.125 0.15 0.2 0.3
TBP dose (mg l-1)
Turb
idity (N
TU
)
After coagulation(NTU) Before coagulation(NTU)
Figure 6.4 Residual turbidities before and after coagulation using TBP at pH 4
(50 mg l-1 kaolin suspension)

127
0
5
10
15
20
25
30
35
40
45
0.2 0.3 0.4 0.5 0.8
TBP dose (mg l-1)
Turb
idity
(N
TU
)
After coagulation (NTU) Before coagulation (NTU)
Figure 6.5 Residual turbidities before and after coagulation using TBP at pH 7
(50 mg l-1 kaolin suspension)
0
5
10
15
20
25
30
35
40
45
5 8 12 14 15
TBP dose (mg l-1)
Turb
idity (N
TU
)
After coagulation(NTU) Before coagulation(NTU)
Figure 6.6 Residual turbidities before and after coagulation using TBP at pH 9
(50 mg l-1 kaolin suspension)

128
The results given in Figures 6.1, 6.2, and 6.3 show that, near the
optimum TBP dosage, the flocculation index rises rapidly with time and reaches a
steady maximum value. At lower and higher dosages, less steep rises and lower
maximum values are found, which indicate a poorer flocculation. At excess TBP
concentrations, the negative particle (clay particle) surfaces become saturated
with adsorbed polymer and the particles are re-stabilized. The optimum dosages
are taken as those giving the steepest increase in FI value and agree well with
those obtained by the measurement of residual turbidity, which can be seen in
Figures 6.4, 6.5 and 6.6. The optimum dosage for TBP in the pH range from 4 to
9 was determined, and the results of the flocculation index and residual turbidity
and residual tannin are summarised in Table 6.1. The reason for the declining FI
values after the maximum value is reached, at pH 9 (Fig 6.3), is that the large
sized flocs can not be kept uniformly dispersed in solution at the slow speed
(50rpm; 48 s-1), since large flocs were observed to accumulate on the bottom of
the jar and are intermittently re-suspended.
TABLE 6.1 Comparison of coagulation performances of TBP (50 mg l-1 kaolin
suspension) with different charge density at different pH
pH
Charge Density
(meq g-1)
Optimum Dosage
(mg l-1) FI
Residual Turbidity
(NTU)
Residual Tannin
(mg l-1)
4 3.07 0.15 0.25 14.5 0.088
5 2.66 0.25 0.32 18.5 0.090
6 2.05 0.25 0.35 17 0.097
7 0.67 0.3 0.52 13 0.099
8 0.26 12.5 1.6-1.8 12 0.421
9 0.21 14 2.3-2.5 11 0.449
From Table 6.1, it can be seen that with pH increasing from 4 to 9, the
optimum dosage of TBP increased from 0.15 mg l-1 to 14 mg l-1, with an

129
increasing residual tannin matter in final water. The most significant increase of
the optimum dose occurred at pH 8 and 9. In addition, the residual tannin matter
in the final treated water was very low (less than 1 mg l-1), due to the very small
amount of initial TBP used as coagulant at low pH, and the good coagulation
effectiveness at high pH. Also, at pH 8 and pH 9, the size of flocs (indicated by
the FI) was distinctly larger than the size of flocs at pH 7 and below. These results
seemed to be consistent with the observation that with increasing pH value, the
charge density of TBP decreased, thus more TBP was needed to neutralize the
negative particles in the model water. At high pH (8 and 9), the charge density of
TBP was very low, close to zero, and precipitation occurred, therefore, the
performance of flocculation suggested that polymer bridging and/or adsorption on
to precipitating TBP (“sweep” coagulation) is considered as the dominant
aggregation mechanism.
6.2.2 TBP Precipitation Measured by PDA
The previously observed TBP precipitation phenomenon in blank water
at pH 7 and 9 was investigated using the PDA in order to get quantitative
information of the precipitation kinetics. Using the optimum dose of TBP for each
pH condition (0.3 mg l-1 at pH7; 14 mg l-1 at pH9), the precipitation response was
determined and the results can be used as a reference for the coagulation tests.
From the results shown in Figure 6.7 it is clear that at pH 9 the TBP precipitation
was detectable by the PDA, giving a FI value about 0.25, but this response was
small and unimportant compared to the FI value of kaolin coagulation with TBP
at pH9. In contrast, the precipitation of TBP at pH 7 was not detectable by the
PDA, probably because of the very small TBP dose (0.3mg l-1) that was added;
clearly, under these conditions TBP precipitation is completely unimportant as a
complicating factor in the coagulation measurements.

130
Figure 6.7 Comparison of the FI response between TBP precipitation in blank
water and coagulation in kaolin suspension at pH 7 and pH 9
6.2.3 Coagulation of Humic Acid Solutions
At pH9, the model water had a lower humic acid concentration, 10 mg l-1,
compared to 30 mg l-1 at pH4 and 7; this was necessary for experimental
convenience bearing in mind the much higher dosage of TBP needed at pH9. The
optimum TBP dosages for the selected pH conditions were determined by the FI
response of PDA and the changes in the solution NPDOC and UV-Vis
absorbance.
It is commonly believed that the absorption of light at ultra-violet
wavelengths is caused by aromatic compounds and other organic substances with
conjugated double bonds. Although UV absorbance is a good measure of the
required dose of metal coagulants, the complications caused by the very rapid

131
interaction of humic acid with TBP, especially at a high pH value, made it
infeasible to determine the initial UV-visible absorbance (combined HA and TBP)
at the beginning of the coagulation process. Hence, the initial absorbance value at
254nm and 400nm (Section 4.2.1 and 4.4.2) was assumed as the sum of the
individual absorbance values of TBP and HA. By this means it was possible to
evaluate approximately the coagulation performance of TBP by comparing the
final absorbance value with the calculated initial value.
From the results shown in Figure 6.8, Table 6.2 and Table 6.3, the
optimum dose of TBP at pH 4 appeared to be 30 mg l-1 ( equivalent to a TBP:HA
ratio of 1:1), which gave a maximum NPDOC reduction of 83.5%.
Figure 6.8 Flocculation index response with TBP dose at pH 4 (30 mg l-1 HA)

132
TABLE 6.2 NPDOC before and after coagulation with TBP dosage at pH 4
(30 mg l-1 HA)
TBP
dosage
NPDOC
30mg l-1 HA
NPDOC-TBP SUM NPDOC
before coagulation
NPDOC
after coagulation
NPDOC
Reduction
(mg l-1) (mg l-1) (mg l-1) (mg l-1) (mg l-1) %
25 9.957 11.73 21.687 5.914 72.7
27 9.957 14.60 24.557 4.675 81.0
30 9.957 16.41 26.367 4.353 83.5
32 9.957 17.45 27.407 6.626 75.8
TABLE 6.3 Absorbance at 254nm and 400nm before and after coagulation with
TBP dosage at pH 4 (30 mg l-1 HA)
TBP
dosage
(mg l-1)
Abs 254nm
Before
coagulation
Abs 254nm
After
coagulation
Abs 254 nm
Reduction
%
Abs 400nm
Before
coagulation
Abs 400nm
After
coagulation
Abs 400 nm
Reduction
%
25 0.935 0.059 93.7 0.202 0.009 95.5
27 0.958 0.051 94.7 0.203 0.006 97.0
30 0.984 0.076 92.3 0.205 0.016 92.2
32 0.9997 0.097 90.3 0.206 0.016 92.2
From the results shown in Figure 6.9, Table 6.4 and Table 6.5, the
optimum dose of TBP at pH 7 appeared to be 58 mg l-1 (equivalent to a TBP:HA
ratio of ~2:1), which gave a maximum NPDOC reduction of 83.3%.
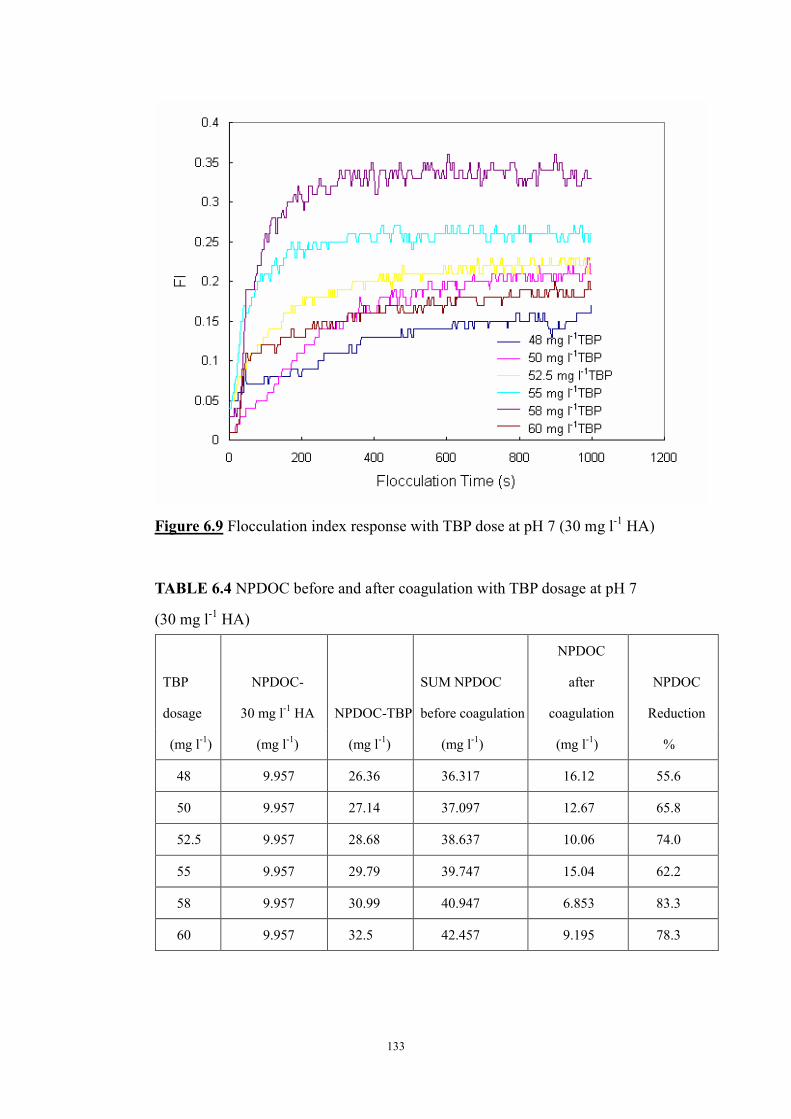
133
Figure 6.9 Flocculation index response with TBP dose at pH 7 (30 mg l-1 HA)
TABLE 6.4 NPDOC before and after coagulation with TBP dosage at pH 7
(30 mg l-1 HA)
TBP
dosage
NPDOC-
30 mg l-1 HA NPDOC-TBP
SUM NPDOC
before coagulation
NPDOC
after
coagulation
NPDOC
Reduction
(mg l-1) (mg l-1) (mg l-1) (mg l-1) (mg l-1) %
48 9.957 26.36 36.317 16.12 55.6
50 9.957 27.14 37.097 12.67 65.8
52.5 9.957 28.68 38.637 10.06 74.0
55 9.957 29.79 39.747 15.04 62.2
58 9.957 30.99 40.947 6.853 83.3
60 9.957 32.5 42.457 9.195 78.3
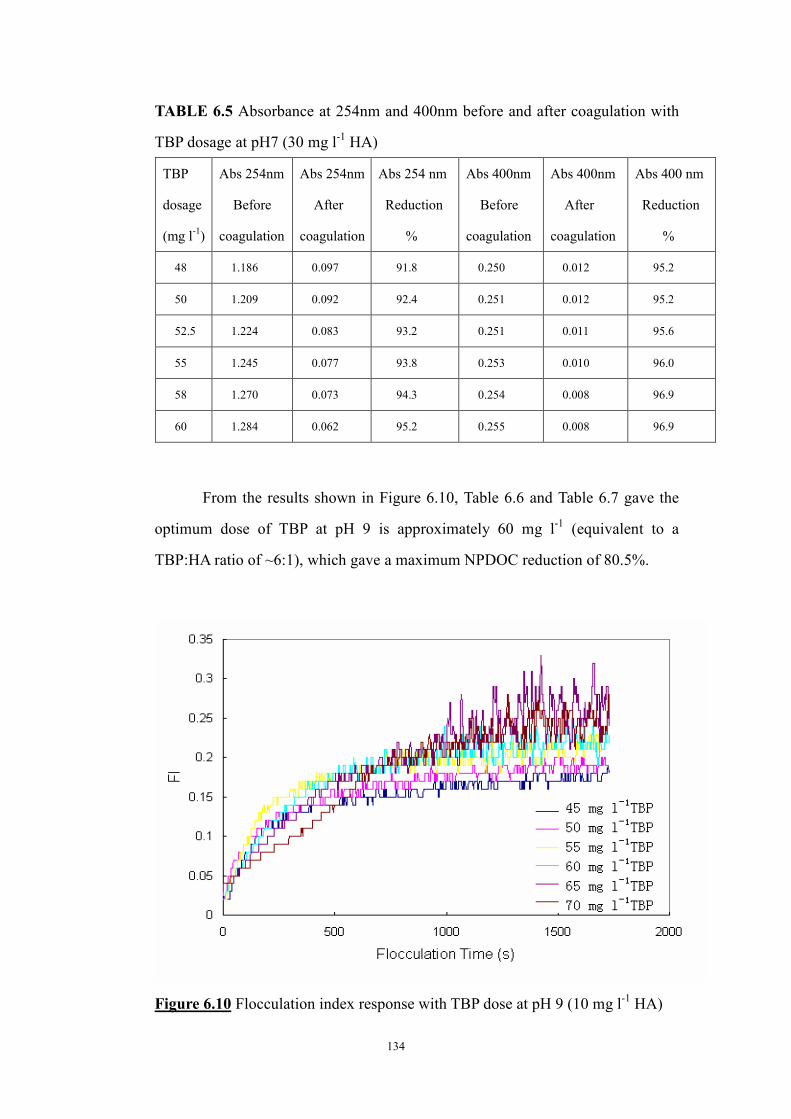
134
TABLE 6.5 Absorbance at 254nm and 400nm before and after coagulation with
TBP dosage at pH7 (30 mg l-1 HA)
TBP
dosage
(mg l-1)
Abs 254nm
Before
coagulation
Abs 254nm
After
coagulation
Abs 254 nm
Reduction
%
Abs 400nm
Before
coagulation
Abs 400nm
After
coagulation
Abs 400 nm
Reduction
%
48 1.186 0.097 91.8 0.250 0.012 95.2
50 1.209 0.092 92.4 0.251 0.012 95.2
52.5 1.224 0.083 93.2 0.251 0.011 95.6
55 1.245 0.077 93.8 0.253 0.010 96.0
58 1.270 0.073 94.3 0.254 0.008 96.9
60 1.284 0.062 95.2 0.255 0.008 96.9
From the results shown in Figure 6.10, Table 6.6 and Table 6.7 gave the
optimum dose of TBP at pH 9 is approximately 60 mg l-1 (equivalent to a
TBP:HA ratio of ~6:1), which gave a maximum NPDOC reduction of 80.5%.
Figure 6.10 Flocculation index response with TBP dose at pH 9 (10 mg l-1 HA)

135
TABLE 6.6 NPDOC before and after coagulation with TBP dosage at pH 9
(10 mg l-1 HA)
TBP
dosage
NPDOC-
10 mg l-1 HA NPDOC-TBP
SUM NPDOC
before coagulation
NPDOC
after
coagulation
NPDOC
Reduction
(mg l-1) (mg l-1) (mg l-1) (mg l-1) (mg l-1) %
45 2.672 24.65 27.322 16.97 37.9
50 2.672 27.14 29.812 15.47 48.1
55 2.672 29.79 32.462 15.04 53.7
60 2.672 32.50 35.172 6.853 80.5
65 2.672 35.53 38.202 9.195 75.9
70 2.672 38.36 41.032 8.564 79.1
TABLE 6.7 Absorbance at 254nm and 400nm before and after coagulation with
TBP dosage at pH 9 (10 mg l-1 HA)
TBP
dosage
(mg l-1)
Abs 254nm
Before
coagulation
Abs 254nm
After
coagulation
Abs 254 nm
Reduction
%
Abs 400nm
Before
coagulation
Abs 400nm
After
coagulation
Abs 400 nm
Reduction
%
45 0.722 0.070 90.3 0.135 0.011 91.9
50 0.765 0.060 92.2 0.137 0.009 93.4
55 0.801 0.067 91.6 0.139 0.009 93.5
60 0.840 0.070 91.7 0.141 0.009 93.6
65 0.885 0.078 91.2 0.142 0.010 92.9
70 0.927 0.083 91.0 0.144 0.011 92.4

136
In these experiments with HA, the onset of flocculation occurred rapidly
and a very short time (~6 min) was needed to attain the maximum FI value at pH
4 and 7. It was noted that at higher pH, say pH 9, the floc size was much smaller
(as indicated by a small FI value) than the corresponding flocs (at optimum TBP
dose) made by flocculation of the clay suspension. As with the clay suspension,
there was a clear trend of increasing optimal TBP dose with increasing pH value
for HA solution (Table 6.8). This may be explained by both the loss of TBP
charge density, and increasing deprotonation of the humic acid (thus, increasing
electronegativity), with pH increasing. Form Table 6.8, it can be seen that for the
model water with humic acid solution at low pH (≤7), the residual tannin matter
was still lower than 1mg l-1, indicated by a high removal of NPDOC. It is also
noted that at pH9 the residual tannin matter in final water was higher than that at
lower pH. It is mostly caused by a higher amount of TBP used as a coagulant at
pH9.
TABLE 6.8 Variation in optimum TBP dose and coagulation performance (HA
solutions) with pH
Optimum Dosage
NPDOC
Reduction
%
Residual
Tannin
(mg l-1) pH
Charge Density
(meq g-1)
mg l-1 (TBP:HA)
FI
4 3.07 30 1 0.33 83.50 0.396
7 0.67 58 2 0.34 83.26 0.618
9 0.20 60 6 0.32 80.51 1.318
The slight lack of agreement in the value of the optimal TBP indicated
by the UV-Visible absorbance measurements, compared to that indicated by the
FI and NPDOC, is probably the consequence of the complex interaction between

137
the various organic fractions of the TBP and HA. Clearly, the simple approach of
summing the individual UV-Visible absorbance values for TBP and HA is not
scientifically rigorous and inevitably leads to inaccuracies. It is also noted that in
these tests the residual NPDOC after coagulation was still at a relatively high
level, despite a high degree of overall NPDOC (>80%), mainly due to the large
TBP dose added.
6.3 Coagulation Stoichiometry using TBP as Sole Coagulant
Model waters with kaolin suspension were obtained by dispersing 25mg,
50mg, 100mg and 200mg of kaolin clay in 2L of de-ionised water to give mass
concentrations of 25 mg l-1, 50 mg l-1and 100 mg l-1, respectively. A series of
working solutions with different clay concentrations were used for the TBP
dose-stoichiometry tests. 50 mg l-1 kaolin suspensions were chosen as standard
kaolin mixtures (turbidity ~ 40 NTU) to investigate the floc strength (floc
break-up and re-formation) under controlled conditions. For comparison purposes,
model waters with different concentrations of humic acid were also used to
investigate the existence of a TBP dose-stoichiometry. Working solutions with
concentration of 15 mg l-1, 30 mg l-1 and 50 mg l-1 were prepared by diluting HA
stock solution with de-ionized water.
6.3.1 Coagulation Stoichiometry in Kaolin Suspension
The results of the flocculation tests using a series of concentrations of
kaolin suspension in terms of the FI response with different TBP dosages at pH4
are shown in Figures 6.11 to 6.12.

138
Figure 6.11 Flocculation index response with TBP dose at pH4 (25 mg l-1 kaolin
suspension)
Figure 6.12 Flocculation index response with TBP dose at pH4 (100 mg l-1 kaolin
suspension)

139
Table 6.9 summarises the results of the tests by giving the TBP optimum
dosage and turbidity reduction for the different kaolin concentrations at 25 mg l-1,
50 mg l-1 and 100 mg l-1, at pH 4.
TABLE 6.9 Optimum dosage of TBP with different kaolin concentrations at pH 4,
and the corresponding peak flocculation index and turbidity reduction
Kaolin Concentration
(mg l-1)
TBP optimum Dosage
(mg l-1) Peak FI
Turbidity Reduction
%
25 0.05 0.18 40
50 0.1 0.25 63.8
100 0.2 0.54 75
The corresponding results of the flocculation tests at pH 7 are shown in Figures
6.13 to 6.14.
Figure 6.13 Flocculation index response with TBP dose at pH7 (25 mg l-1 kaolin
suspension)

140
Figure 6.14 Flocculation index response with TBP dose at pH7 (100 mg l-1 kaolin
suspension)
Table 6.10 summarises the results of the tests by giving the TBP optimum
dosage and turbidity reduction for different kaolin concentration at 25 mg l-1, 50
mg l-1 and 100 mg l-1, at pH 7.
TABLE 6.10 Optimum dosage of TBP with different Kaolin concentrations at pH
7, and the corresponding peak flocculation index and turbidity reduction
Kaolin Concentration
(mg l-1)
TBP optimum Dosage
(mg l-1) Peak FI
Turbidity Reduction
%
25 0.15 0.34 50
50 0.3 0.52 67.5
100 0.6 0.83 84.8

141
It is clear from Tables 6.9 and 6.10 that the optimum TBP dosage
increased linearly with increasing kaolin concentration, suggesting that a
stoichiometric relationship exists between TBP and kaolin clay. This confirms
that at pH 4 and 7, where the TBP has a significant cationic charge, the charge
neutralisation is the dominant coagulation mechanism; since the counterions with
a very high affinity are quantitative. Furthermore, it can be seen that the
flocculation rate, peak flocculation index and turbidity reduction are also
dependent on the concentration. From Figures 6.11 to 6.14, and Figure 6.1 and
6.2, a distinct trend was evident, which is that the onset of flocculation occurred
more rapidly, and the time needed to attain the maximum FI reduced, with
increasing concentration of kaolin clay, from 25 mg l-1 to 100 mg l-1, at both pH 4
and 7. It is reasonable to assume that the kinetics of TBP flocculation (indicated
by the floc growth rate) at low pH are dependent on the concentration of particles
and polymer molecules (as indicated by Smoluchowski flocculation theory (67)).
Using model waters with different concentrations of kaolin clay, the
optimum dosages of TBP at pH 9 were determined. The results summarised in
Figures 6.15, 6.16 and 6.17 show the flocculation performance of TBP at pH 9 for
different concentrations of kaolin clay. It can be seen that at 50 mg l-1 kaolin clay,
the optimum dosage of TBP was in the range of 14-25 mg l-1. At the lower kaolin
concentration of 25 mg l-1, the optimum dosage of TBP was in the range of 20-25
mg l-1, and at the lowest clay concentration of 12.5 mg l-1, the optimum dosage of
TBP was 20 mg l-1. A relatively constant dose of TBP (say around 20 mg l-1)
could be chosen as the optimum dose for all of the kaolin concentrations tested at
pH 9. Thus, there appears to be no clear TBP dose stoichiometry at pH 9. This
behaviour is consistent with previous findings that TBP polymer has little cationic
charge at pH 9. Yukselen and Gregory (101) proposed that the mechanism of
polymer bridging is considered to be more important for long-chain polymers that
are not highly charged. Therefore, in this case, the principal coagulation
mechanism is likely be polymer bridging rather than charge interaction. However,

142
the obviously large amount of dosage indicated that at higher pH, TBP
precipitation occurs and this might play a part in the process, leading to the
“sweep coagulation”.
Figure 6.15 Flocculation index response with TBP dose at pH9 (50 mg l-1 kaolin
suspension)

143
Figure 6.16 Flocculation index response with TBP dose at pH9 (25 mg l-1 kaolin
suspension)
Figure 6.17 Flocculation index response with TBP dose at pH9 (12.5 mg l-1
kaolin suspension)

144
6.3.2 Coagulation Stoichiometry with Humic Acid Solution
The results of flocculation tests using a series of concentrations of humic
acid in terms of the FI response with different TBP dosages at pH 4 are shown in
Figures 6.18 to 6.19.
Figure 6.18 Flocculation index response with TBP dose at pH4 (15 mg l-1 HA)
From Figure 6.18 and Figure 6.19, it is observed that at low FI values there is a
spiky or discontinuous variation in the FI response curve. The precise reason for
this is unclear but it seems that small size flocs at low concentration present a
more sensitive and intermittent fluctuation in the intensity of light transmitted
through a flowing suspension. Secondly, this may be the result of the resolution
of the data acquisition.

145
Figure 6.19 Flocculation index response with TBP dose at pH4 (50 mg l-1 HA)
Table 6.11 summarises the results of the tests by giving the TBP optimum dosage
for the different HA concentrations of 15 mg l-1, 30 mg l-1 and 50 mg l-1, at pH 4.
TABLE 6.11 Optimum dosage of TBP with different HA concentration at pH 4,
and the corresponding peak FI and reduction in NPDOC and colour
Optimum Dosage
HA concentration
(mg l-1) mg l-1 (TBP:HA) FI
NPDOC
Reduction
%
Colour Reduction
%
15 15 1 0.1 68.6 96.80
30 30 1 0.33 83.5 97.02
50 50 1 0.24 89.9 97.14
The corresponding results of the flocculation tests at pH 7 are shown in Figures
6.20 to 6.21.

146
Figure 6. 20 Flocculation index response with TBP dose at pH7 (15 mg l-1 HA)
Figure 6.21 Flocculation index response with TBP dose at pH7 (50 mg l-1 HA)

147
Table 6.12 summarises the results of the tests by giving the TBP optimum dosage
for the different HA concentrations of 15 mg l-1, 30 mg l-1 and 50 mg l-1, at pH 7.
TABLE 6.12 Optimum dosage of TBP with different HA concentration at pH 7,
and the corresponding peak FI and reduction in NPDOC and colour
Optimum Dosage
HA concentration
(mg l-1) mg l-1 (TBP:HA) FI
NPDOC
Reduction
%
Colour Reduction
%
15 30 2 0.13 64.9 92
30 58 2 0.34 83.26 93.8
50 100 2 0.22 85.5 97.6
For HA flocculation, it is clear that there is a strong agreement in the
concentration ratio of TBP: HA, confirming that the TBP optimum dosages were
proportional with the HA concentration at low and neutral pH (≤ 7). This result is
consistent with the tests using kaolin suspension.
The previous study (in Figure 5.4) showed that the charge density of TBP
at pH 4 is 4-5 fold greater compared to the charge density at pH 7. Due to the
deprotonation of HA with pH decreasing, if the charge neutralisation is the only
coagulation mechanism, the optimum dosage of TBP at pH 7 should be much
more than double the optimum dosage at pH4. The results from table 6.11 and
6.12 indicated that other mechanisms were involved, such as ‘polymer bridging’,
which reduced the optimum dosage at pH 7, although stiochiometry exists at pH4
and 7 respectively.
6.4 Influence of Conditions on Coagulation Performance
6.4.1 Variation of Coagulation with Ageing Time of TBP

148
The results in Figures 6.22, 6.23 and 6.24 show the flocculation
performance of TBP at pH4, 7 and 9 for different polymer aging times used for
50 mg l-1 kaolin suspension. It can be seen that with increasing aging time the
flocculation index decreased, possibly due to the reduction of charge density with
time. At pH4, although the charge density of TBP decreased from 3.07 meq g-1 to
2.04 meq g-1 with the ageing time increasing from 3 hours to 24 hours, the charge
density was still sufficient to achieve charge neutralisation (small flocs were
observed) and the resulting FI response was only slightly inferior. At pH7,
because the charge density has substantially decreased from 1.2 meq g-1 to 0.1
meq g-1 at 3 hours to 24 hours of ageing, there was a more marked reduction in
the FI response. For pH9, the onset of flocculation was delayed as a consequence
of the aging (72hrs compared to 3hrs) but the peak flocculation index was
unchanged. Since at this pH value the polymer has very little cationic charge, it
seems likely that the flocculation effect is the result of other phenomena, such as
the extent of precipitation and polymer bridging effects.
Figure 6.22 Flocculation index response for different aging periods at pH 4
(50mg l-1 kaolin suspension)
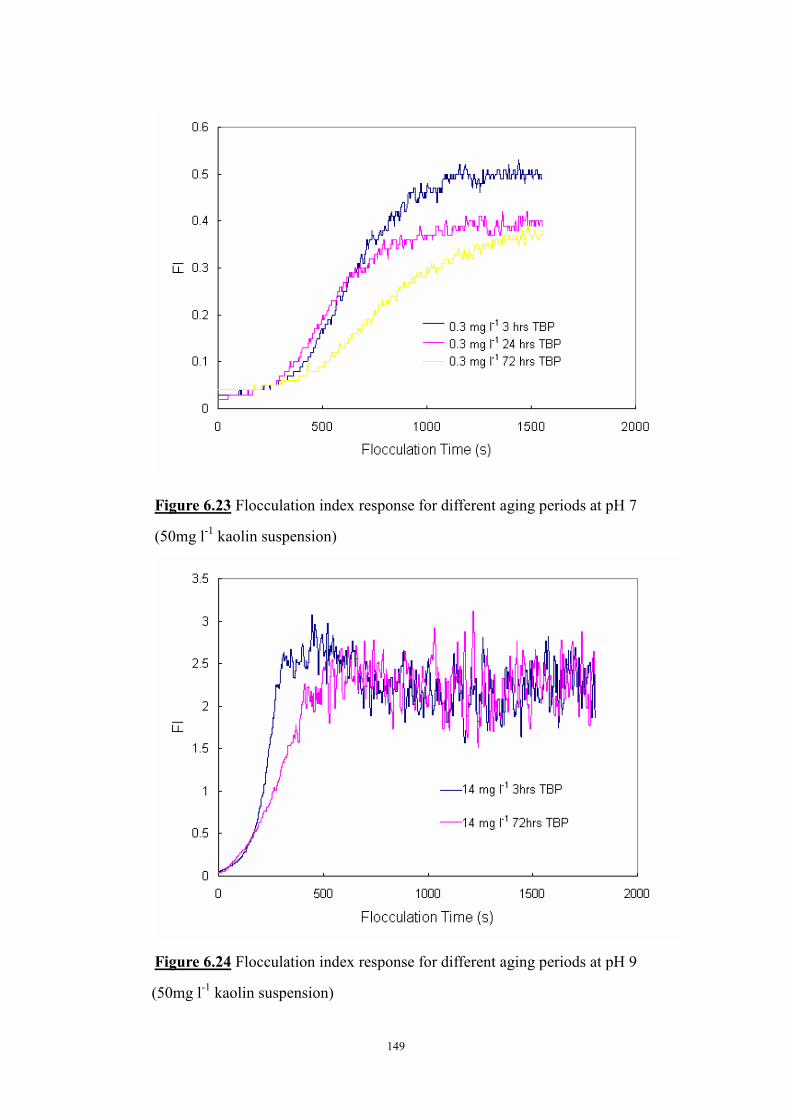
149
Figure 6.23 Flocculation index response for different aging periods at pH 7
(50mg l-1 kaolin suspension)
Figure 6.24 Flocculation index response for different aging periods at pH 9
(50mg l-1 kaolin suspension)

150
The coagulation performance of the TBP at the previously determined
optimum dose was studied for the following TBP aging times: 3 hrs, 24hrs and
48hrs, used in humic acid solution. Figures 6.25, 6.26 and 6.27 present the
coagulation results of 30 mg l-1 and 10 mg l-1 humic acid solutions at pH 4, 7 and
9; these display a very similar behaviour to that observed with the clay
suspensions. At pH 4 and 7, the charge density of TBP decreased with aging, and
therefore the coagulation performance decreased. However, at pH 9, the charge
density of TBP, even fresh, is very low (close to zero), and thus aging effects on
charge are not important. In these conditions the coagulation is likely to be
influenced by the relative extent of TBP precipitation and polymer bridging
effects; thus, Figure 6.27 shows that TBP aging had little effect on performance.
Figure 6.25 Flocculation index response for different aging periods at pH 4
(30 mg l-1 HA)
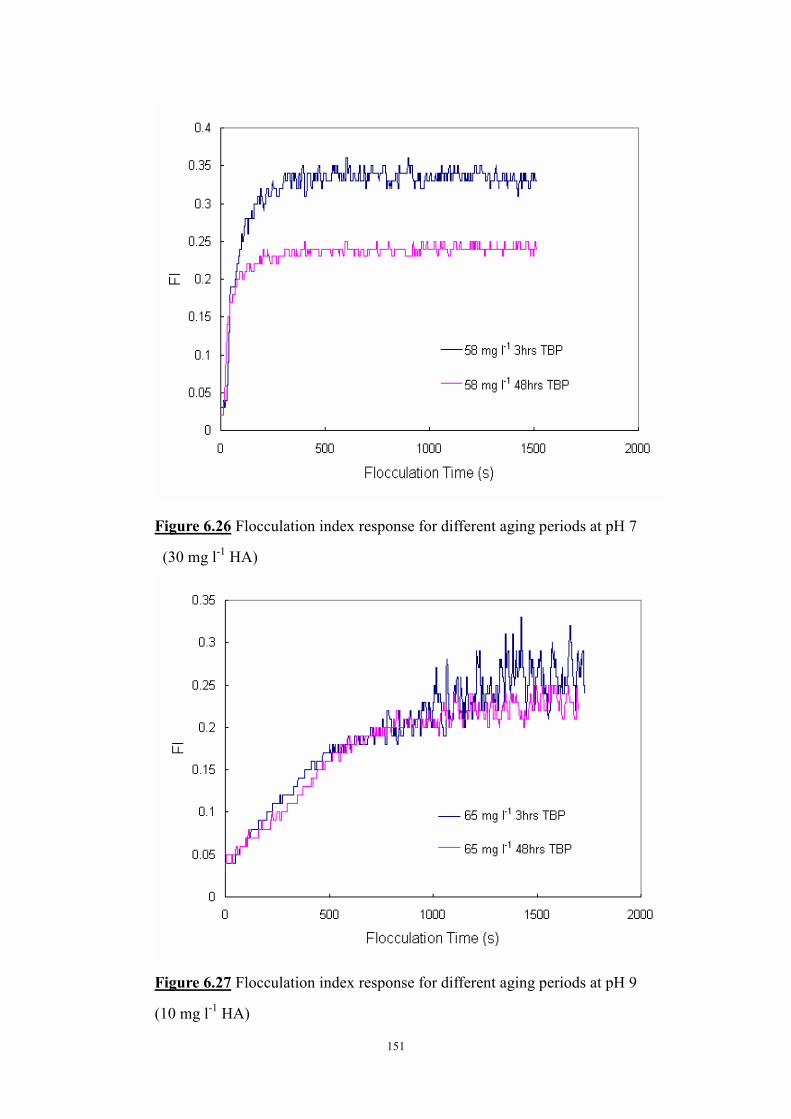
151
Figure 6.26 Flocculation index response for different aging periods at pH 7
(30 mg l-1 HA)
Figure 6.27 Flocculation index response for different aging periods at pH 9
(10 mg l-1 HA)

152
6.4.2 Variation of Coagulation with Mixing Speed
According to the paddle speed-velocity gradient calibration line for the
Gator reactor (Appendix I ), a series of velocity gradients, 950 s-1, 800 s-1, 600 s-1 ,
350 s-1 and 48 s-1 can be obtained with the following paddle speeds: 400 rpm,
350 rpm, 300 rpm, 200 rpm and 50 rpm. Using these conditions for the rapid
mixing phase of the coagulation experiments, and a set mixing time of 30 s,
followed by a constant slow coagulation phase at 50 rpm, the influence of the
mixing rate was studied. The coagulation results of 50 mg l-1 kaolin suspension in
Figure 6.28 show that at pH 4, with an optimal TBP dose of about 0.15 mg l-1, the
FI response was very similar for all mixing conditions and any differences
probably within experimental error, suggesting that the conventional rapid mix
design parameter, G = 350 s-1 may complete particle coagulation when TBP was
used as primary coagulant. However, at the highest velocity gradient of 950 s-1,
the peak FI value was discernibly lower than for the other conditions, suggesting
the possibility of floc break-up.
Figure 6.28 Flocculation index response for different mixing intensities at pH 4
(50mg l-1 kaolin suspension)

153
6.4.3 Variation of Coagulation with Reactor
Coagulation tests for 50mg l-1 kaolin suspension were carried out under
nominally similar mixing conditions (~50 rpm), but under optimal chemical
conditions for pH9 and 7 (ie. 14 mg l-1 TBP at pH9, and 0.3 mg l-1 TBP at pH7)
using two different jar test reactors (viz. glass beaker and Gator). The results
indicated no significance difference at pH 9, but a better performance by the gator
jar at pH 7 (see Figures 6.29 and 6.30). As noted previously the power transfer
seemed less efficient for the glass beaker as indicated by a large amount of
vortexing, and this effect may have been more influential for charge
neutralisation process under the slower coagulation conditions at pH 7. It seems
likely that in the case of “sweep coagulation”/polymer bridging, the initial mixing
conditions are not so important.
Figure 6.29 Flocculation index response for different reactors at pH 9
(50mg l-1 kaolin suspension)

154
Figure 6.30 Flocculation index response for different reactors at pH 7
(50mg l-1 kaolin suspension)
6.5 Coagulation Effectiveness in Comparison with Other Coagulant
Alum and polyDADMAC were chosen as reference chemicals for
comparing the coagulation performance of TBP with 50 mg l-1 kaolin clay
suspension. The optimal dosage for alum was found to be 3.4 mg l-1 (as Al3+) at
pH 7, and for polyDADMAC (Flobeads DB 45 SH) the optimal dose was about
0.12 mg l-1, and independent of pH. The comparable results are summarised in
Figures 6.31 and 6.32.

155
Figure 6.31 Flocculation index response with different coagulants at pH 7,
and TBP at pH 9 (50 mg l-1 kaolin suspension)
0
5
10
15
20
25
30
35
40
45
Alum polyDADMAC TBP pH9 TBP pH7
Coagulants
Resid
ual Turb
idity (N
TU
)
Turbidity after coagulation Turbidity before coagulation
Figure 6.32 Residual turbidity before and after coagulation with different
coagulants at pH 7 (50 mg l-1 kaolin suspension)

156
From Figure 6.31, it can be seen that at pH 7, the onset of flocculation
using TBP and polyDADMAC occurred rather later than for alum, and longer
times were needed to attain the maximum flocculation index (FI) value. The use
of polyDADMAC promoted the growth of very large flocs, with FI values about
twice as high as those with alum and four times as those with TBP. At pH 9, using
a higher optimal dosage of TBP, the time to attain the maximum value was
reduced significantly, and large flocs were formed. The peak value of the FI is
similar to that using the polyDADMAC as coagulant. Figure 6.32 shows that the
residual turbidity in solution after coagulation using alum was lowest, 3.5 NTU,
followed in performance by polyDADMAC where the residual tubidity was 10
NTU. At pH 9, the performance of TBP was virtually identical to the
polyDADMAC, although the mechanism of coagulation is believed to be
different.
The optimum dose for alum in the coagulation of 30 mg l-1 HA at pH 7
was found to be 6.75 mg l-1 (as Al3+), and for polyDADMAC (Flobeads DB 45
SH) the optimum dose was about 14 mg l-1. It was also found that a higher alum
dosage was required at higher pH because of increasing HA deprotonation
(increasing electronegativity of HA) and the decreasing cationic nature of the Al
coagulant species. For PolyDADMAC, being a quaternary ammonium cationic
polymer, the cationic charge does not vary with pH. Thus, its performance in
removing the HA only reflects the change in HA deprotonation with pH. At pH 4,
the optimum polyDADMAC dose was 10 mg l-1, compared with the optimum
dose of 14 mg l-1 at pH 7.
Figure 6.33 summarises the coagulation performance of 30 mg l-1 HA
solution for the different chemicals at their optimum doses and at pH 7. It can be
seen that both cationic polymers promoted the growth of large flocs, with the FI
values about 1.5 times higher than those with alum. Significant differences in the

157
reduction of NPDOC were observed (Table 6.13); viz. alum 88.1%, TBP, 83.3%,
and polyDADMAC 63.3%. However, the residual NPDOC in filtered water using
58 mg l-1 TBP was about 7 mg l-1, which is higher than that with the other two
coagulants.
Figure 6.33 Flocculation index response with different coagulants at pH 7
(30 mg l-1 HA)
TABLE 6.13 Optimum dose of coagulants at pH 7, and NPDOC reduction
(30 mg l-1 HA)
Coagulants
NPDOC--
30mg l-1
HA
NPDOC--
Coagulant
SUM NPDOC
before
coagulation
NPDOC
after
coagulation
Reduction
(mg l-1) (mg l-1) (mg l-1) (mg l-1) %
6.75 mg l-1Al3+ 9.957 0.05 10.007 1.189 88.1
14 mg l-1 PolyDADMAC 9.957 3.926 13.883 5.097 63.3
58 mg l-1 TBP 9.957 30.99 40.947 6.853 83.3

158
6.6 Floc Strength of TBP
Using a 2L gator jar, an indication of the relative floc strength can be
obtained by applying a sudden increase in shear rate to the formed aggregates and
relating velocity gradient applied to the maximum floc size resulting. In this study,
simple indices of floc strength have been applied based on the FI response, which
allows the relative floc strength with different coagulants to be compared.
6.6.1 The Effect of Rapid Mixing on Floc Re-formation
The formation, breakage and re-formation of flocs using TBP as
coagulant were investigated by studying the FI response to a sudden increase in
mean velocity gradient within the Gator reactor. In this experiment, the optimum
dose of 0.3 mg l-1 TBP was pipetted into 50 mg l-1 of kaolin suspension at pH 7,
and an initial period of 25 minutes for the slow stirring at 50 rpm (48 s-1) was
chosen since no significant changes were observed in the FI after this. Floc
breakage was brought about by suddenly increasing the stirring speed after the
initial period, and maintaining this for 60 seconds. Thus, a series of tests were
carried out whereby the stirring speed was varied from 200 rpm ( 350 s-1 )to 400
rpm ( 950 s-1 ), and the floc formation conditions were otherwise the same in all
cases. Figure 6.34 shows the results of dynamic monitoring for the optimum
dosage of TBP at pH 7. The initial parts of the flocculation curves show the
reproducibility of the process.

159
Figure 6.34 Monitoring of floc formation at 50 rpm (48 s-1) with varying
breakage speed (200 rpm (350 s-1) to 400 rpm (950 s-1)) and re-formation at 50
rpm (48 s-1) (50 mg l-1 kaolin suspension at pH7)
From Figure 6.34, it can be seen that by increasing the stirring rate from
50 rpm (48 s-1) to a higher rate (≥350 s-1), there is an immediate and rapid
decrease in FI, corresponding to a rapid breakage of flocs. The minimum FI value
was found to decrease from 0.18 to 0.08 with increasing stirring rate from 200
rpm (350 s-1) to 400 rpm (950 s-1). After the stirring speed was reduced back to 50
rpm (48 s-1) there was a clear but limited re-growth of flocs, to about the same FI
value for all the previous stirring speeds, with the exception of 400 rpm which
gave a lower FI. Clearly, when flocs formed by TBP are subjected to an increased
velocity gradient (≥350 s-1 ), irreversible floc breakage can occur, since the FI
value recovers to only a fraction of its value than that for the original flocs.
The differences in the dynamic monitoring results are reflected in the

160
residual turbidity values. The residual turbidity after settling for 30 minutes was
measured to compare the potential removal after sedimentation. The values
shown in Figure 6.35 are for samples taken before breakage and after
re-formation. There is an apparent increasing of residual turbidity after
re-formation of the flocs at 400 rpm (950 s-1). This residual turbidity is
discernibly higher than for the other conditions, suggesting the lower recovery of
flocs after breakage.
0
2
4
6
8
10
12
14
16
18
20
350 480 600 800 950
Velocity gradient (s-1)
Turb
idity
(N
TU
)
Turbidity before breakage (NTU) Turbidity after re-formation (NTU)
Figure 6.35 Variation of residual turbidity before breakage and after re-formation,
with velocity gradient at pH7 (50 mg l-1 kaolin suspension)
The influence of the duration of the fast stirring rate was investigated at a
constant rate of 300 rpm (600 s-1); the results are shown in Figure 6.36. It can be
seen that with increasing duration from 10 s to 300 s at 300rpm (600 s-1), there is
evidence of:
• a greater severity of floc breakup (lower minimum FI);
• a more delayed re-growth phase;

161
• a more limited final floc growth (steady state FI).
Figure 6.36 Monitoring of floc formation at 50 rpm (48 s-1), breakage at 300 rpm
(600 s-1)for different periods and re-formation at 50 rpm (48 s-1) at pH7 (50 mg l-1
kaolin suspension)
A general trend was found that the floc strength decreased with
increasing floc size. In Figure 6.36, the original flocs formed at the slow stirring
speed (at 50 rpm; with a high FI value of 0.5) were believed to have lower floc
strength than re-formed final flocs with a lower FI value of 0.4. Furthermore, the
results of residual turbidity before breakage and after re-formation with different
breakage periods are shown in Figure 6.37. It is apparent that floc breakage for
the longer period (300s) gives the highest residual turbidity.

162
0
5
10
15
20
25
10 30 60 90 120 300
Breakage periods (s)
Turb
idity (N
TU
)
Turbidity before breakage (NTU) Turbidity after re-formation (NTU)
Figure 6.37 Variation of residual turbidity before breakage and after re-formation,
with breakage period at pH 7 (50 mg l-1 kaolin suspension)
6.6.2 Floc Strength of TBP in Comparison with Other Coagulants
A comparison of floc strength tests with alum and polyDADMAC, as
coagulants, was investigated. For the test conditions used in this study (50 mg l-1
kaolin suspension, pH 7), previous work had found that the optimum dosage for
alum was about 3.4 mg l-1 as Al3+, and 0.125 mg l-1 for polyDADMAC. Some
researchers (99, 100) have used ‘strength factor’ and ‘recovery factor’ to quantify
floc strength. The Flocculation Index values for initial (FI1), broken (FI2) and
reformed (FI3) flocs are used as a surrogate for floc size in the strength equations,
which are defined by Gregory (101,158) as:
Strength factor = (FI2/ FI1) ·100 ---------- (6.1)
Recovery factor = [(FI3- FI2) / (FI1- FI2)] ·100 -------- (6.2)

163
However, the strength factor only represents the breakage factor, which may not
the best representative measure of the strength of flocs.
At pH 7, the formation, breakage and re-formation of flocs formed by
alum, polyDADMAC and TBP under two different conditions of breakage (300
rpm for 60 s; and 300 rpm for 300 s) were measured by PDA using the 2L Gator
jar. The results in terms of the FI response are shown in Figures 6.38 and 6.39.
Strength and recovery factors obtained for flocs obtained using the different
coagulants under the two different conditions of breakage (300 rpm for 60 s; and
300 rpm for 300 s) are given in Tables 6.14 and 6.15.
Figure 6.38 Monitoring of floc formation at 50 rpm, breakage at 300 rpm for 60 s
and re-formation at 50 rpm using different coagulants at pH 7 (50 mg l-1 kaolin
suspension)

164
Figure 6.39 Monitoring of floc formation at 50 rpm, breakage at 300 rpm for 300
s and re-formation at 50 rpm using different coagulants at pH 7 (50 mg l-1 kaolin
suspension)
TABLE 6.14 Strength and recovery factors obtained for different coagulants (floc
breakage at 300 rpm and 60 s) at pH 7 (50 mg l-1 kaolin suspension)
Alum polyDADMAC TBP
Strength factor 26.8 27.8 25.0
Recovery factor 42.3 96.2 61.5
TABLE 6.15 Strength and recovery factors obtained for different coagulants (floc
breakage at 300 rpm and 300 s) at pH 7 (50 mg l-1 kaolin suspension)
Alum polyDADMAC TBP
Strength factor 20.3 22.3 19.2
Recovery factor 30.7 70.1 47.6

165
The results given in Table 6.14 and 6.15 show that for both breakage
conditions, the strength factor for the three coagulants were very similar, with
polyDADMAC producing marginally the greatest floc strength, and TBP
marginally the lowest floc strength. However, the recovery factor for the two
polymer coagulants was significantly greater than that with alum. This is
consistent with other studies, for example, Yukselen and Gregory (101) found
that alum gave lower floc strength and recovery values than cationic
polyelectrolytes (including polyDADMAC). However, the recovery factor with
TBP was substantially lower than that obtained with polyDADMAC. It is
relevant to note that under the test conditions (ie. pH 7), polyDADMAC retains a
high cationic charge (~6 meq g-1), in sharp contrast to the TBP which has a
greatly reduced cationic charge (<0.7 meq g-1); this may be a key factor
influencing the capability for floc re-formation.
The formation, breakage and re-formation of flocs formed by TBP at pH
9 were also investigated since previous studies have shown rapid coagulation at
this elevated pH (at the optimal TBP dose), and the results are shown in Figure
6.40. At pH 9, for floc breakage times of 60 s and 300 s (at 300 rpm), the strength
factors of TBP were 35.3 and 29.6, respectively, and the recovery factors were
71.5 and 54.6, respectively. Comparing with the TBP performance at pH 7, the
strength and recovery factor of TBP at pH 9 were significantly increased. It is
also interesting to note that the TBP floc strength at pH 9 was superior to alum at
pH 7.
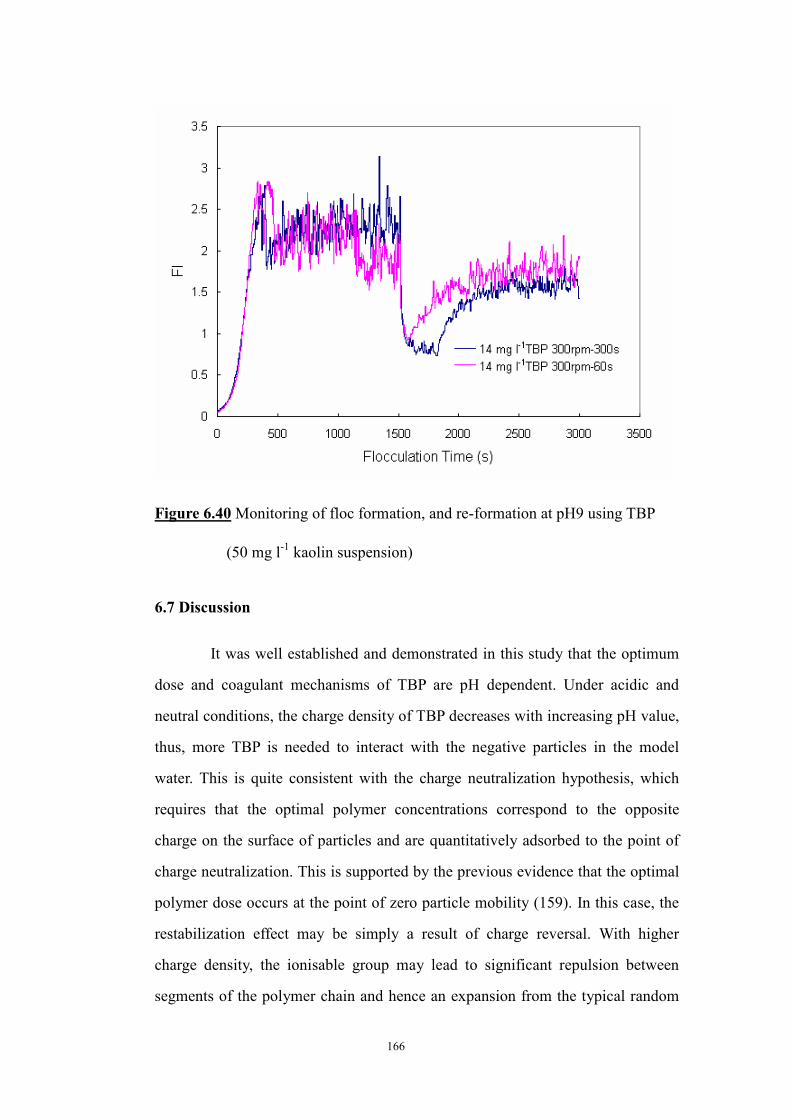
166
Figure 6.40 Monitoring of floc formation, and re-formation at pH9 using TBP
(50 mg l-1 kaolin suspension)
6.7 Discussion
It was well established and demonstrated in this study that the optimum
dose and coagulant mechanisms of TBP are pH dependent. Under acidic and
neutral conditions, the charge density of TBP decreases with increasing pH value,
thus, more TBP is needed to interact with the negative particles in the model
water. This is quite consistent with the charge neutralization hypothesis, which
requires that the optimal polymer concentrations correspond to the opposite
charge on the surface of particles and are quantitatively adsorbed to the point of
charge neutralization. This is supported by the previous evidence that the optimal
polymer dose occurs at the point of zero particle mobility (159). In this case, the
restabilization effect may be simply a result of charge reversal. With higher
charge density, the ionisable group may lead to significant repulsion between
segments of the polymer chain and hence an expansion from the typical random

167
coil configuration. Because of the strong electrostatic interaction, polyelectrolyte
chains should adopt a rather flat configuration on oppositely charged surfaces,
which would reduce the possibility of bridging (45). In contrast, at high pH, the
remarkable distinction was observed from the change in flocculation kinetics, floc
size and the amount of the flocculant. With regard to the low or non-charge of
TBP at alkali conditions, ‘polymer bridging’ was able to provide an adequate
explanation. Graham (21) indicated that for the optimal bridging effect, the
number of bound polymer segments available for interparticle adsorption should
equal the number of vacant sites of particles. Increasing the amount of the
polymer with non-charge would increase the number of adsorbed segment loops
thereby enhancing the possibility of interparticle bridging. At excess coagulant
concentrations, surfaces of particles become saturated with the adsorbed polymer
and the particles are re-stabilized.
During charge neutralisation, counterions are adsorbed on colloidal
particles and the particle charge is reduced. The concentration of
specifically-adsorbing counterions required to cause flocculation is called the
critical flocculation concentration (cfc) (160). Stumm and O’Melia (161)
employed the term ‘stoichiometric’ to describe the linear dependence of cfc on
particle concentration. At acid and neutral pH values, the optimum dosage of TBP
is directly proportional to the particle or humic substance concentrations, strongly
suggesting the existence of charge neutralization. In theory, when polymer
bridging is the principal mechanism of coagulation, the optimum dosages should
be also directly proportional to the total particle surface area and hence to the
particle concentration (19). However, Runkana et al. (62) found that theories of
bridging flocculation assuming equilibrium conditions were of limited use in
practice. In this case, evidence of non-stoichiometry between particle suspension
and a higher dosage of TBP at pH 9 implied that complications may arise from
the possible effects of ‘polymer bridging’ and the relative extent of TBP
precipitation at higher pH values.

168
It was clearly found that the flocculation kinetics and the effectiveness of
TBP are strongly dependent on pH and the concentrations of the particles and
the polymer. Furthermore, the flocculation performance at the optimal TBP
dosage was also found to be considerably influenced by some other factors,
namely the polymer age, mixing speed and the type of reactor. The apparent
diminution of the peak flocculation index at low pH for ‘ageing’ TBP is thought
to be the consequence of changes in the deprotonation of the charge group with
time.
Further evidence from the PDA results shows that, for all coagulants,
there is a variation in coagulation effectiveness with model waters of suspensions
and humic substances. In terms of Flocculation Index, a synthetic polymeric
coagulant, polyDADMAC, presented a consistently high performance in both
model waters at different pH values. In contrast, TBP only exhibited a superior
performance in humic solution or particle suspension with higher pH, compared
to the traditional metal coagulant, alum. Once more, aggregates formed by
‘polymer bridging’ using TBP at pH 9 or polyDADMAC (independent of pH)
appeared to be significantly more resistant to breakage (hence higher strength
factor) in comparison to the flocs produced by charge neutralization using alum
as the primary coagulant. The effectiveness of polymeric coagulants was largely
the result of the forming of strong flocs. This result is consistent with the
observation of Yukselen and Gregory (101), who proposed that the flocs produced
by cationic polymers can be much stronger than those formed when particles are
destabilized by simple salts. But, from the other parameters of treated water, for
the model water containing kaolin suspension, the treatment performance
(turbidity reduction) of the alternative coagulants decreased in the following
order (pH 7): alum, polyDADMAC, TBP; for the model water containing HA, the
treatment performance (DOC reduction) of the alternative coagulants decreased
in the following order (pH 7): alum, TBP and polyDADMAC.

169
7. RESULTS: IMPROVEMENT OF TBP COAGULATION
PERFORMANCE USING DUAL COAGULANTS OF TBP WITH ALUM IN
MODEL WATER
7.1 Introduction
The use of a high molecular weight, long-chain polymer in conjunction
with a metal salt as a primary coagulant has become the most attractive treatment
option for water treatment. It is logical to combine inorganic coagulants with
some cationic organic polymers that should strengthen both the aggregating and
charge neutralizing capabilities (5). This is supported by the results of Bolto et al.
(6), who, using jar tests on reconstituted waters with alum and cationic
polyDADMAC, indicated synergistic benefits from the combination of the two.
The use of polymers in this way resulted in a substantial lowering of the alum
dose required, a 40-60% reduction being possible (92). In addition, the work of
Edzwald et al. (7) showed that for water containing 5 mg l-1 humic acid, adding a
polymer in conjunction with 10 mg l-1 of alum gave a 95% reduction in DOC, in
comparison with only 20% removal when 75 mg l-1 of alum was used as the sole
coagulant. Yu et al. (162) has observed that the most effective removal of humic
substances prior to reverse osmosis treatment was achieved by the combination of
an inorganic coagulant with a cationic polymer such as polyDADMAC.
As a novel natural modified polymer, the application of TBP in water
treatment is still in the tentative and superficial stage. At the start of this work, the
relative merits of partial or complete replacement of alum by TBP as primary
coagulant in water treatment were still not determined. This chapter is concerned
with the coagulation performance in model waters using alum and cationic TBP
as combined primary coagulants (partial alum replacement). Other reported
studies (112, 134) have concluded that particles / color coagulation and removal
with alum are pH-dependent. Although the optimal pH for particles / color

170
removal is less than 6, some research evidence (163) has shown with natural
water samples that the optimum pH for minimum residual aluminium is between
6 and 7. Thus, in order to investigate the coagulation mechanism and the
effectiveness of alum-TBP combination in model water with particle suspension,
two pH values of 5 and 7 were chosen in this study. Furthermore, using humic
substances as model water, the study also summarized the results of extensive
laboratory experiments designed to investigate whether a unique optimal dosage
of combined alum and cationic TBP exists at a given pH value of 6, at which the
coagulation performance was believed to be maximized.
7.2 Coagulation Action of Dual Coagulant in 50 mg l-1 Kaolin Suspension
The primary aim of the laboratory tests in this stage is to assess the
coagulation performance of TBP/alum with a model water (50 mg l-1 kaolin
suspension) using the PDA coagulation system. Initial tests were undertaken at
pH 5.0 and 7.0 with a view to reduce the aluminium dose in the usual pH range
where aluminium is used as the sole coagulant. To select the optimum conditions
for the alum/TBP dose matrix and provide more insight into the nature of the
coagulation mechanism of TBP combined with aluminium, floc volume and
turbidity were measured. Efforts to employ Graphite furnace AAS have been
undertaken in order to measure the residual aluminium concentration after
filtration by 0.45µM filter paper.
7.2.1 Effect of Solution pH and Optimum Dosage of Alum
In order to investigate the effectiveness of partial replacement of alum by
TBP in the coagulation processes, it was necessary to determine initially, as a
reference, the optimum performance of the coagulation using alum as the sole
coagulant at different pH values. Prior to this, a preliminary assessment was made
of the influence of solution pH and alum dosage on particle coagulation using

171
PDA. The laboratory experiments have been undertaken over a wide range of
aluminium concentrations (0.05 mg l-1 -200 mg l-1 as Al3+) to determine the
optimum dose at pH4, 5, 7 and 9.
At pH4, very fine floc was observed using three broad aluminium
concentration ranges—low (0.5 mg l-1 -8 mg l-1 as Al3+), medium (10 mg l-1-100
mg l-1 as Al3+) and high (greater than 100 mg l3+ as Al3+). The wide concentration
ranges of Al3+ considered here were based on some previous research studies
(89,164-169). The PDA results are summarised in Figure 7.1.
Figure 7.1 Dynamic monitoring of kaolin coagulation (50 mg l-1) at pH4 using
different dosages of alum
It can be seen that at pH 4, for the 50 mg l3+ kaolin clay suspensions, the
maximum Flocculation Index, 0.15, was found when using 150 mg l-1 Al3+ as
coagulant. However, most of other dosages also gave similar FI values around

172
0.13 to 0.15, and the values of final turbidity were all close to 37 to 39 NTU,
compared with the initial turbidity of model water, 40 NTU. This indicates that
there was a poor coagulation performance over a wide range of alum doses at
pH4.
At pH5, there was a clear optimal Al3+ dose of 0.2 mg l-1, which gave a
maximum FI of around 0.3. The results are shown in Figure 7.2. Lower alum
concentrations (0.02 mg l-1 as Al3+) gave a poorer coagulation performance,
suggesting insufficient coagulant for destabilisation. At the highest alum dosage
(0.4 mg l-1 Al3+), the FI was less than at lower dosages, most likely indicating that
charge restabilisation was occurring.
Figure 7.2 Dynamic monitoring of kaolin coagulation (50 mg l-1) at pH5 using
different dosage of alum
At pH 7, the optimal Al dose, 3.4 mg l-1 as Al3+, has been determined as
reported in section 6.5. Figure 7.3 shows the PDA results using different doses of
alum as coagulant at pH 7.

173
Figure 7.3 Dynamic monitoring of kaolin coagulation (50 mg l-1) at pH7 using
different dosage of alum
At pH 9, there was no FI response observed by the PDA using different
doses of alum, indicating that the coagulation dose not occur at such high pH
values; this is believed to be because the soluble anionic form Al(OH)4- becomes
the dominant Al species at high pH (~ 9).
In general, it is well-known that the coagulation mechanism of alum is
pH dependent. At pH 5.0 and below, the dominant Al soluble species are
monomeric and dimeric cations (eg. Al3+, Al(OH)2+, Al(OH)2+) and the
mechanism involves aggregation of particles by charge neutralisation. At pH 6
(minimum Al solubility) and above, the dominant mechanism is believed to be
adsorption of particle species on precipitated Al(OH)3, known as ‘sweep
flocculation’. At high pH 9, the soluble anionic form Al(OH)4- occurs, thus, no
coagulation is observed (134). In view of these results, pH 5 and 7 were chosen as

174
the solution pH values for investigating the coagulation performance and
mechanism of combined alum/TBP as coagulants.
7.2.2 Optimum Alum-TBP Combination at pH 7
The optimal dosage of TBP for 50 mg l-1 kaolin suspension at pH7 is
about 0.3 mg l-1, giving a maximum FI around 0.52, and the lowest residual
turbidity about 13 NTU, compared with other dosages of TBP. The optimal dose
of alum is about 3.4 mg l-1 as Al3+, with an FI value of 1.39 and residual turbidity
of 3.5 NTU. These results were reported in section 6.5. Based on the optimum
dose of Al3+ at pH7, a series of tests have been undertaken by reducing the dosage
of aluminium from 3.4 mg l-1 to 1.0 mg l-1. At each dosage coagulation tests were
carried out with a range of polymer dosage from 0.05 mg l-1 to 0.4 mg l-1. The
dynamic monitoring results are shown in Figures 7.4 to 7.9.
Figure 7.4 Flocculation index response with TBP dose and 3.4 mg l-1 Al3+ at pH7
(50 mg l-1 Kaolin suspension)

175
Figure 7.5 Flocculation index response with TBP dose and 3.0 mg l-1 Al3+ at pH7
(50 mg l-1 kaolin suspension)
Figure 7. 6 Flocculation index response with TBP dose and 2.5 mg l-1 Al3+ at pH7
(50 mg l-1 kaolin suspension)

176
Figure 7.7 Flocculation index response with TBP dose and 2.0 mg l-1 Al3+ at pH7
(50 mg l-1 kaolin suspension)
Figure 7.8 Flocculation index response with TBP dose and 1.5 mg l-1 Al3+ at pH7
(50 mg l-1 kaolin suspension)

177
Figure 7.9 Flocculation index response with TBP dose and 1.0 mg l-1 Al3+ at pH7
(50 mg l-1 kaolin suspension)
The variation of Flocculation Index with the doses of alum and TBP is
summarised in Figure 7.10, where it is noted that in most cases the maximum
Flocculation Index values were found when 0.3 mg l-1 TBP was used in
combination with different doses of alum. Previous work has provided evidence
that for the flocculation of kaolin suspension at pH ≤ 7, a stoichiometric
relationship exists between TBP and kaolin clay, indicating that charge interaction
and neutralisation was the dominant mechanism for the flocculation using TBP.
However, in this series of tests there was no clear evidence of a need for
increasing TBP dosage to achieve a large Flocculation Index as the alum dosage
decreased. Consequently, it seems likely that the flocculation effect is influenced
by other phenomena (than simply charge interaction), such as the extent of
Al(OH)3 precipitation.

178
Figure 7.10 Variation of Flocculation index with alum (as Al) and TBP doses at
pH7 (50 mg l-1 kaolin suspension)
The optimum dosage for TBP at each alum dose (as Al, at pH 7) was
determined, and the results for the flocculation index, residual turbidity and floc
volume are summarised in Table 7.1. From Table 7.1, it can be seen that at pH 7,
the optimal dose of TBP was insensitive to the alum dose and in most cases equal
to the maximum TBP dose applied. Compared with the use of alum or TBP as
sole coagulant, the use of dual coagulants with a TBP/Al mass ratio of 0.3/2.0
improved the coagulation performance in terms of the highest FI (1.80) and floc
volume. It can be seen that compared to alum alone, the performance was not as
good in terms of the residual turbidity. However, compared to the use of TBP
alone, the TBP/Al combination was better in terms of a lower residual turbidity.
Subsequent analysis of the residual aluminium concentration was carried out by
Graphite furnace AAS after filtration. Even though there was no obvious
relationship between residual aluminium with the dose combinations of

179
TBP/alum, very low concentrations of aluminium in the final water indicated a
good coagulation performance using the dual coagulant.
TABLE 7.1 Coagulation performance for the optimum dosage of TBP at each alum dose (in terms of maximum flocculation index, residual turbidity and aluminium, and Floc volume) at pH7 (50 mg l-1 kaolin suspension)
Al dosage
(mg l-1)
TBP dosage
(mg l-1) FI
Residual Turbidity
(NTU)
Floc Volume
(ml)
Residual [Al3+]
(µg l-1)
3.4 0.0 1.39 3.5 5.0 10.1
3.4 0.2 1.39 16.0 4.5 11.9
3.0 0.3 1.50 14.0 6.5 3.4
2.5 0.3 1.76 12.5 6.5 8.6
2.0 0.3 1.80 9.0 6.5 8.1
1.5 0.25 1.65 10.0 3.5 7.2
1.0 0.3 1.62 15.0 3.5 6.7
0.0 0.3 0.52 13.0 4.0 - -
Note: “--” indicated the value is out of the calibration range of Graphite furnace AAS.
7.2.3 Optimum Alum-TBP Combination at pH 5
The optimum dosage of TBP for 50 mg l-1 kaolin suspension at pH 5 is
about 0.25 mg l-1, giving a maximum FI of about 0.32, and the lowest residual
turbidity about 18.5 NTU; these results were reported previously in Section 6.2.1.
As noted in Section 7.2.1, at pH 5, the optimal Al3+ dose for 50 mg l-1 kaolin
suspension is 0.2 mg l-1, which gave a maximum FI of approximately 0.3. Based
on the optimum dose of Al3+ at pH5, a series of tests have been undertaken by
reducing the dosage of alum from 0.2 mg l-1 to 0.05 mg l-1 as Al3+. At each dosage
coagulation tests were carried out with a range of polymer dosages from 0.01 mg
l-1 to 0.25 mg l-1. The dynamic monitoring results are shown in Figures 7.11 to
7.14.

180
Figure 7.11 Flocculation index response with TBP dose and 0.05 mg l-1 Al3+ at
pH5 (50 mg l-1 kaolin suspension)
Figure 7.12 Flocculation index response with TBP dose and 0.1 mg l-1 Al3+ at
pH5 (50 mg l-1 kaolin suspension)

181
Figure 7.13 Flocculation index response with TBP dose and 0.15 mg l-1 Al3+ at
pH5 (50 mg l-1 kaolin suspension)
Figure 7.14 Flocculation index response with TBP dose and 0.2 mg l-1 Al3+ at
pH5 (50 mg l-1 kaolin suspension)

182
The variation of Flocculation index with the doses of alum and TBP is
summarised in Figure 7.15, where it is noted that at each alum dose, from 0.2 mg
l-1 to 0.05 mg l-1 as Al3+, there is an optimal TBP dose corresponding to the
maximum FI. This can be seen clearer in Table 7.2, which gives the coagulation
performance at each alum-TBP dosage combination in terms of FI, residual
turbidity and floc volume.
Figure 7.15 Flocculation index with alum (as Al) and TBP doses at pH 5 (50 mg
l-1 kaolin suspension)
From Table 7.2, it is clear that the optimum TBP dosage increased with
decreasing Al concentration. Although nonlinear, the two coagulants are clearly
complementary, and this is consistent with a coagulation mechanism based on
charge neutralization between the TBP/Al cationic species and the kaolin
suspension at pH 5. The locus of the optimal alum-polymer dosage combinations
for the 50 mg l-1 kaolin suspension at pH 5 is shown in Figure 7.16.

183
TABLE 7.2 Coagulation performances for the optimum dosage of TBP at each
alum dose (in terms of maximum flocculation index, residual turbidity and
aluminium, and Floc volume) at pH 5 (50 mg l-1 kaolin suspension)
Al dose
(mg l1)
TBP dosage
(mg l-1) FI
Residual Turbidity
(NTU)
Floc Volume
(ml)
Residual
[Al3+]
(µg l-1)
0.05 0.06 0.34 32.0 1.2 4.4
0.10 0.05 0.29 32.0 0.8 5.8
0.15 0.04 0.28 32.0 0.8 5.9
0.20 0.01 0.32 34.0 1.0 5.6
0.20 0.00 0.30 34.5 0.8 4.8
0.00 0.25 0.32 18.5 0.7 --
Note: “--” indicated that the value is out of the calibration range of Graphite furnace AAS.
0
0.01
0.02
0.03
0.04
0.05
0.06
0.07
0 0.05 0.1 0.15 0.2 0.25
Aluminium dosage (mg l-1)
TB
P d
osage (m
g l-1
)
Figure 7.16 Locus of alum-polymer dosage combinations for 50 mg l-1 kaolin at
pH5

184
Compared to the use of the optimum dose of alum (0.2 mg l-1 as Al3+) or
TBP (0.25 mg l-1) as sole coagulant, the use of the combined coagulants in the
Al/TBP dose ratio of 0.05/0.06 gave the best coagulation performance in terms of
the FI (0.34); however, it is noted that the FI values were very similar for all of
the alum/TBP combinations and for the sole coagulants. This dual coagulant gave
a minor improvement to the residual turbidity compared to Alum alone, but a
much higher floc volume (1.2 ml). Nevertheless, the use of 0.25 mg l-1 TBP as the
sole coagulant was substantially better than the use of dual coagulants or alum
alone for the removal of turbidity, whilst giving a high FI and low floc volume.
7.3 Coagulation Action of Dual Coagulant in Humic Acid Solution at pH6
In order to investigate the dosage stoichiometry with respect to
coagulation performance at pH 6, the locii of the optimal alum-TBP dosage
combinations were established at two different HA concentrations of 15 mg l-1
(NPDOC approximately 4.01 mg l-1) and 30 mg l-1 (NPDOC approximately 9.96
mg l-1). Prior to studying the effect of partial replacement of alum by TBP, a
series of laboratory experiments were undertaken to determine the optimum
performances of the coagulation using alum and TBP, respectively, each as sole
coagulant. Based on these optimum dosages, further coagulation tests were
carried out by systematically reducing the alum dose with a range of TBP dosages.
The coagulation performance by the optimal alum-TBP dose was subsequently
compared with the result from a new commercial product TSL, which is a
mixture of TBP and Alum.
7.3.1 Optimum Alum-TBP Combinations in 15 mg l-1 HA Solution
Using the PDA test method, the flocculation of 15 mg l-1 HA solution at
pH6 was conducted to determine the optimum dose of different coagulants. In
addition, at the end of the PDA (flocculation index) monitoring period, the floc

185
volume and the colour removal were measured to further describe the
performance of the coagulation. Although the use of UV-visible absorbance for
monitoring the performance of the coagulation is complicated because of the
interaction between the organic fractions of the TBP and HA, and infeasible for
determining the optimum dose of TBP (see Section 6.2.3), the measurement of
light absorbance at 254nm and 400nm was carried out nevertheless, since it was
considered that the parameters may provide some further insight into the effect of
different alum-TBP combinations.
Figure 7.17 shows the variation of Flocculation Index with the
flocculation time using a range of alum concentrations (1.35 mg l-1 as Al3+ to 4.86
mg l-1 as Al3+) for 15 mg l-1 HA solution at pH6. The results indicate clearly the
existence of an optimal dose of 2.03 mg l-1 as Al3+, corresponding to a maximum
FI of approximately 0.27.
Figure 7.17 Dynamic monitoring of 15 mg l-1 HA at pH 6 using different dosages
of alum
In the range of 1.35 mg l-1-2.7 mg l-1 Al3+ using alum as coagulant, very

186
small floc volumes of about 0.25 ml to 0.5 ml were measured, while the decrease
in colour and UV-absorbance was high; the results are shown in the Table 7.3.
TABLE 7.3 Coagulation performance for the different dosage of alum at pH6 (15
mg l-1 HA)
Alum
(mg l-1
as Al3+)
Residual
Colour
(Hazen)
Colour
Removal %
Abs(254nm)
(cm-1)
Abs 254nm
Reduction %
Abs(400nm)
(cm-1)
Abs 400nm
Reduction %
1.76 10 92 0.019 95.2 0.004 96.3
2.03 7.5 94 0.014 96.5 0.004 96.3
2.43 15 88 0.049 87.7 0.007 93.5
2.70 10 92 0.021 94.7 0.007 93.5
3.24 15 88 0.052 87 0.012 88.9
* 15 mg l-1 HA solution pH 6. Initial colour: 125 Hazen; Initial Abs (254nm): 0.4; Initial Abs
(400nm): 0.108
The results obtained here, indicating an optimum alum dose of about 2.03 mg l-1
as Al3+ at pH6 with model water containing 15 mg l-1 HA (NPDOC
approximately 4.011 mg l-1), can be compared with previous studies (85) of the
coagulation of natural organic matter (TOC approximately 10 mg l-1) at pH 5-6.5,
which have indicated a maximum reduction of UV-absorbance at an alum dose of
about 2.7 mg l-1 as Al3+ (100 µM as Al3+). The higher dose of alum is consistent
with a dose stoichiometry, as originally reported by Hall and Packham (170) in
which an increasing presence of humic substances at pH > 5 leads to an increase
in the alum dosage required.
Figure 7.18 and Figure 7.19 give the coagulation monitoring results
using TBP and Tanfloc SL as sole coagulants for 15 mg l-1 HA, respectively.

187
Figure 7.18 Flocculation index response with TBP dose at pH 6 (15 mg l-1 HA)
Figure 7.19 Flocculation index response with Tanfloc SL dose at pH 6 (15 mg l-1
HA)

188
It was found that at pH6, the optimum TBP dosage was around 22.5 mg l-1,
which produced a maximum floc volume (10ml) and colour removal percentage
(92%). In a previous report (Section 6.3.2 ), the optimum dosages of TBP for 15
mg l-1 HA at pH4 and 7 were determined as 15 mg l-1 and 30 mg l-1. Clearly, there
is a consistent trend of increasing optimal TBP dose with increasing pH. From
Figure 7.19, the optimum dose of TSL at pH6 appeared to be 27.5 mg l-1, which
gave a maximum FI value of 0.92.
Based on the optimum dose of Al at pH6, a series of tests have been
undertaken with a reducing dosage of aluminium from 2.03 mg l-1 to 0.027 mg l-1.
At each dosage coagulation tests were carried out with a range of TBP dosage.
A coagulation performance matrix was produced for a full range of alum-TBP
combinations. Figures 7.20, 7.21 and 7.22 are examples of the dynamic
monitoring results obtained for the coagulation tests.
Figure 7.20 Flocculation index response with 1.35 mg l-1 as Al3+ and different
TBP dosages at pH 6 (15 mg l-1 HA)
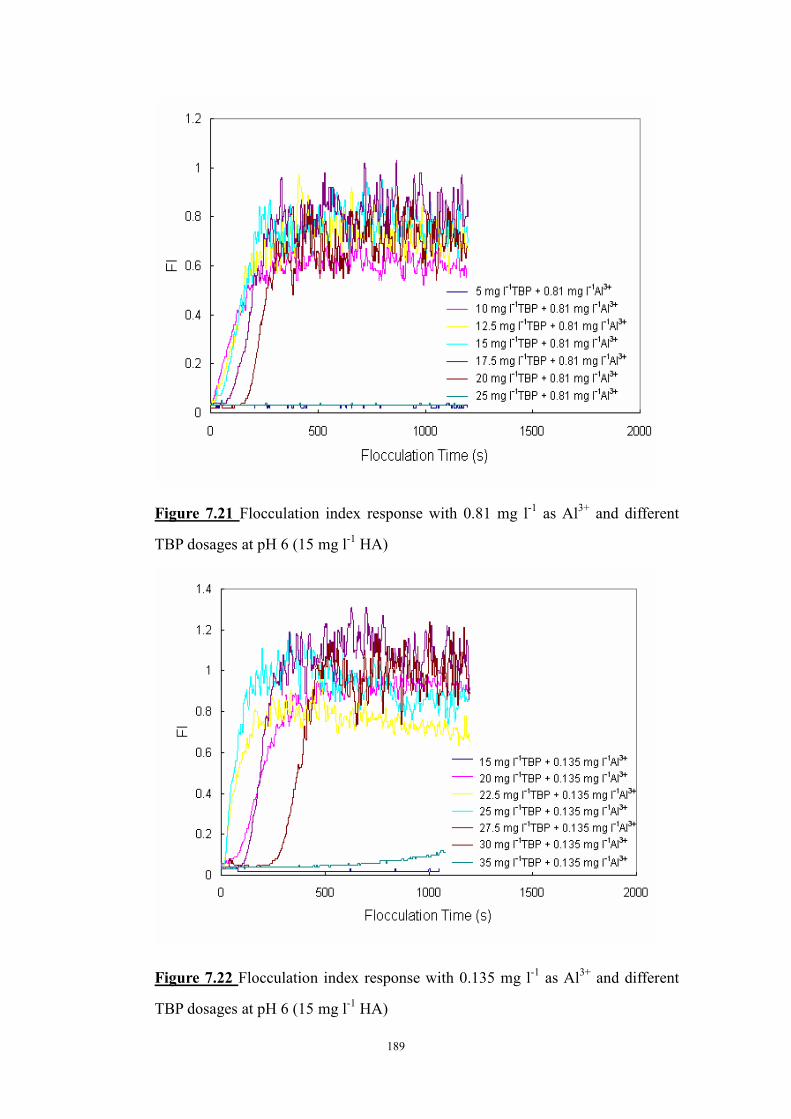
189
Figure 7.21 Flocculation index response with 0.81 mg l-1 as Al3+ and different
TBP dosages at pH 6 (15 mg l-1 HA)
Figure 7.22 Flocculation index response with 0.135 mg l-1 as Al3+ and different
TBP dosages at pH 6 (15 mg l-1 HA)

190
For each alum dose, the optimum dose of TBP was determined by
measurement of the maximum value of FI, floc volume, and colour removal in
each case. A summary of all the results for the range of alum doses and
corresponding optimal TBP doses is given in Table 7.4; the performance of each
coagulant combination is given in terms of FI, floc volume, colour removal and
UV-visible absorbance. The variation of FI with flocculation time for each
alum-optimal TBP dose is shown graphically in Figure 7.23.
Fi
Figure 7.23 Flocculation index response with TBP dose and different Al
concentrations at pH 6 (15 mg l-1 HA)
From Table 7.4, it can be seen that at low alum doses (0.027 mg l-1 to
0.27 mg l-1 as Al3+) the maximum Flocculation Index value corresponded to the
combination of 25 mg l-1 TBP with 0.135 mg l-1 as Al3+. This TBP dose is very
close to the optimum dose of TBP when used as the sole coagulant (22.5 mg l-1).
However, compared with the coagulation performances using alum and TBP as
sole coagulants, the small addition of the alum (0.135 mg l-1 as Al3+) significantly
improved the coagulation efficiency in terms of the FI (1.15), floc volume

191
(12.5ml), and colour removal (98%). Although UV absorbance is not a good
measurement of the required optimum dose of organic coagulants, in this case it
appears that the optimal alum-TBP combination (0.135 mg l-1 as Al3+ with 25 mg
l-1 TBP) gave a high UV absorbance reduction (94%) and visible absorbance
reduction (98.1%). At higher alum dosages, it is evident from the results shown in
Table 7.4 that the corresponding polymer dosage for optimal coagulation
performance decreases.
Tanfloc SL, TBP and Alum were chosen as reference chemicals for
comparing the coagulation performance with the overall optimal alum-TBP
combination (0.135 mg l-1 as Al3+ with 25 mg l-1 TBP). This latter combination is
of considerable interest in terms of achieving low residual Al in treated waters
since the initial aluminium dose of 0.135 mg l-1 is well below the UK water
quality standard for aluminium of 0.2 mg l-1. From Table 7.4, it is noted that the
alum-TBP combination of 1.08 mg l-1 as Al3+ with 10 mg l-1 TBP, also provided a
good coagulation performance. In view of a possible dose limitation for
tannin-based products, where the current DWI guideline (171) defines a
maximum dose of 10 mg l-1 of active material, the alum-TBP combination of 1.08
mg l-1 as Al3+ with 10 mg l-1 TBP, is particularly of interest since it meets this
regulatory guideline. The results of the coagulation by the different coagulants are
summarised in Figure 7.24.

192
TABLE 7.4 Coagulation performance for the optimum TBP dosage with different
alum doses at pH6 (15 mg l-1 HA)
Al3+
dosage
(mg l-1)
TBP
dosage
(mg l-1)
Peak
FI
Floc
Volume
(ml)
Colour
(Hazen)
Colour
Removal
%
Abs
254nm
Reductio
%
Abs
400nm
Reductio
%
Residual
[Al3+]
(µg l-1)
2.03 3 0.34 6.5 10 92 81.5 82.4 8.1
1.35 10 0.69 7 5 96 94 96.3 5.8
1.08 10 0.89 8.5 5 96 94 95.4 8.5
0.81 15 0.77 8 12.5 90 88.8 88.9 9.1
0.68 15 0.8 12 10 92 88.5 90.7 8.4
0.41 20 0.96 10 10 92 91.3 92.6 9.1
0.27 25 1.07 10 5 96 93.5 95.4 13.2
0.135 25 1.15 12.5 2.5 98 94 98.1 - -
0.081 25 0.75 10 7.5 94 85.5 94.4 - -
0.027 25 0.3 ---- 80 96 89.3 62.9 - -
2.03 0.27 6.5 7.5 94 94.8 93.5 6.9
22.5 0.41 10 10 92 91.5 92.6 - -
27.5
mgl-1
TSL
0.92 15 10 92 88.75 91.7 4.5
* 15 mg l-1 HA solution pH 6. Initial colour: 125 Hazen; Initial Abs (254nm): 0.4; Initial Abs
(400nm): 0.108
Note: All residual Al concentrations were < 14 µg l-1; “--” indicated the value is out of the
calibration range of Graphite furnace AAS.

193
Figure 7.24 Flocculation index response with different optimum coagulants at
pH6 (15 mg l-1 HA)
From Figure 7.24 it can be seen that at pH 6 both the alum-TBP
combinations of 0.135 mg l-1 Al3+ with 25 mg l-1 TBP, and 0.27 mg l-1 Al3+ with
25 mg l-1 TBP, presented good coagulation performances with a rapid response
and high FI values, compared with the use of alum or TBP as sole coagulant. In
terms of maximum FI achieved, these combinations outperformed the TSL,
although TSL still performed well. It is interesting to note that for the alum-TBP
combinations the 0.135 mg l-1 Al3+ dose corresponds to a percentage of
aluminium sulphate (assuming no water of hydration) of 3.3%, which is less than
the corresponding figure for TSL (5.6% aluminium sulphate). However, the 0.27
mg l-1 Al3+ dose corresponding to a percentage of aluminium sulphate (assuming
no water of hydration) of 6.4%, is higher than the corresponding figure for TSL
(5.6% aluminium sulphate). For the alum-TBP combination of 1.08 mg l-1 Al3+
with 10 mg l-1 TBP, the coagulation response was much slower than for the other
combinations, but the maximum FI was only slightly inferior (see Figure 7.24)

194
and significantly superior to the TSL.
7.3.2 Optimum Alum-TBP Combinations in 30 mg l-1 HA Solution
Figure 7.25 shows the variation of Flocculation Index with the
flocculation time using a range of alum concentrations (1.35 mg l-1 Al3+ to 4.86
mg l-1 Al3+) for 30 mg l-1 HA solution at pH6. It can be seen that the maximum FI
of around 0.36 was obtained by using 4.05 mg l-1 Al3+. This performance at this
dose also corresponded to a maximum floc volume (15.5ml), colour removal
(89.6%), and reduction in light absorbance at 254nm (74.1%) and at 400nm
(84.8%). Since the optimal dosage of alum with 15 mg l-1 HA was 2.03 mg l-1 as
Al3+ (Section 7.3.1), it is clear that the optimal dosage of alum is proportional to
the HA concentration, indicating a charge stoichiometry. This suggests that the
range of alum doses used, ≤4.05 mg l-1 as Al3+, are not sufficient at pH 6 to
cause rapid precipitation of aluminium hydroxide, and thus coagulation occurs
principally by charge neutralization of the HA by cationic aluminium hydrolysis
species.
Figure 7.26 and Figure 7.27 give the coagulation results using TBP and
Tanfloc SL as sole coagulants for 30 mg l-1 HA, respectively. The optimum dose
of TBP and Tanfloc SL were determined as 45 mg l-1 and 50 mg l-1, respectively.
The results were also confirmed by the measurement of floc volume, colour
removal and UV-visible absorbance reduction, and these are summarised in Table
7.5.

195
Figure 7.25 Dynamic monitoring of 30 mg l-1 HA at pH 6 using different dosages
of alum
Figure 7.26 Flocculation index response with TBP dose at pH 6 (30 mg l-1 HA)

196
Figure 7.27 Flocculation index response with TSL dose at pH 6 (30 mg l-1 HA)
It is clear that at pH6, the TBP optimum dosage is proportional to the HA
concentration and therefore it is assumed that charge neutralisation is the
dominant mechanism of coagulation. This assumption is consistent with previous
tests using HA at pH4 and 7 (see Section 6.3.2). With TSL there is a slight
departure in a strict dose stoichiometry at the two HA concentrations (viz: 15 mg
l-1 HA and 27.5 mg l-1 TSL; 30 mg l-1 HA and 50 mg l-1 TSL), which may indicate
a more complicated mechanism of coagulation than charge interaction.
Based on the optimum dose of alum (4.05 mg l-1 as Al3+) at pH6, a series
of tests have been undertaken by systematically reducing the dosage of
aluminium from 4.59 mg l-1 to 0.027 mg l-1. At each dosage coagulation tests
were carried out with a range of TBP dosages. Thus, a coagulation performance
matrix was produced for a full range of alum-TBP combinations. Figure 7.28,
7.29, 7.30 and 7.31 are examples of the dynamic monitoring results obtained for
the coagulation tests.

197
Figure 7.28 Flocculation index response with 2.7 mg l-1 as Al3+ and different TBP
doses at pH 6 (30 mg l-1 HA)
Figure 7.29 Flocculation index response with 1.35 mg l-1 as Al3+ and different
TBP doses at pH6 (30 mg l-1 HA)

198
Figure 7.30 Flocculation index response with 0.81 mg l-1 as Al3+ and different
TBP doses at pH6 (30 mg l-1 HA)
Figure 7.31 Flocculation index response with 0.405 mg l-1 as Al3+ and different
TBP doses at pH6 (30 mg l-1 HA)

199
Figure 7.32 Flocculation index response with TBP dose and different Al
concentrations at pH6 (30 mg l-1 HA)
The maximum variation of Flocculation Index with flocculation time
using different doses of alum with TBP is summarised in Figure 7.32, and the
overall optimum coagulation results of flocculation index, floc volume, colour
removal and UV-visible absorbance are summarised in Table 7.5. From Table 7.5,
it is clearly seen that the alum-TBP combination of 1.35 mg l-1 Al3+ with 30 mg l-1
TBP gave the best coagulation performance in term of the maximum FI (1.98),
floc volume (45ml), and colour removal (97.9%). In this case, the residual tannin
matter in final water was still very low, 0.311 mg l-1, and less than that for 45 mg
l-1 TBP as the sole coagulant, which gave a residual tannin of about 0.459 mg l-1.
Table 7.5 also shows that when the alum dose increased from 0.14 mg l-1 as Al3+
to 0.81 mg l-1 as Al3+, the optimal TBP dosage decreased from 50 mg l-1 to 30 mg
l-1, confirming that the two coagulants are complementary.

200
TABLE 7.5 Coagulation performance for the optimum dosage of TBP with
different alum dose at pH6 (30 mg l-1 HA)
Al3+
dosage
(mg l-1)
TBP
dosage
(mg l-1)
Peak
FI
Floc
Volume
(ml)
Colour
(Hazen)
Colour
Removal
%
Abs
254nm
Reduction
%
Abs
400nm
Reduction
%
Residual
[Al3+]
(µg l-1)
4.59 30 0.97 25 30 87.5 95.8 74.6 11.3
4.05 30 1.18 28 10 95.8 94.9 94.9 8.4
3.38 30 1.85 28 15 93.7 86.1 92.9 6.0
2.70 30 1.87 30 5 97.9 91.4 98.5 8.1
2.03 30 1.76 25 15 93.7 90.4 90.9 5.7
1.35 30 1.98 45 5 97.9 93.7 95.4 6.5
0.81 30 1.16 40 15 93.7 89.1 92.9 7.1
0.41 40 1.44 33 25 89.6 73.9 82.2 4.5
0.14 50 0.98 30 20 91.7 86.1 90.4 - -
4.05 - 0.36 15.5 25 89.6 74.1 84.8 13.0
- 45 0.31 38 30 87.5 76.5 82.2 - -
- 50mg l-1
TSL
1.81 40 10 95.8 90.9 94.9 6.2
* 30 mg l-1 HA solution pH 6 Initial colour: 240 Hazen; Initial Abs (254nm): 0.742; Initial
Abs (400nm): 0.197
Note: All residual Al concentrations were < 12µg l-1; and “--” indicated the value is out of the
calibration range of Graphite furnace AAS.
However, with increasing alum doses from 0.81 mg l-1 as Al3+ to 4.59 mg
l-1 as Al3+, there was no substantial further reduction in the optimal dose of TBP.
It is speculated that under these conditions of much higher humic and alum
concentrations, the coagulation mechanism is probably caused both by charge
neutralisation and adsorption on to solid phase aluminium hydrolysis species.

201
The comparative coagulation performances (in terms of FI) of alum, TBP,
TSL and alum-TBP combination (1.35 mg l-1 as Al3+ with 30 mg l-1 as TBP) at
their optimal doses are summarised in Figure 7.33. It is clear that compared with
alum and TBP alone, the TSL (5.6% aluminium sulphate) and alum-TBP
combination, which has a percentage of aluminium sulphate (assuming no water
of hydration) of about 22%, produced a dramatically better coagulation
performance; this was also the case in terms of colour and UV-absorbance
removal. Comparing specifically the performance of the TSL with that of the
alum-TBP combination showed a slight superiority of the alum-TBP
combination.
Figure 7.33 Flocculation index response with different optimum coagulants at
pH6 (30 mg l-1 HA)

202
7.3.3 Locii of the Optimal Alum-TBP Dosage Combinations
From the optimal alum-TBP combinations summarised in Tables 7.4 and
7.5, the locus lines of the optimal alum-TBP dosage combination for 15 mg l-1
and 30 mg l-1 HA are shown in Figure 7.34.
Figure 7.34 Locii of alum-TBP dosage combinations for optimal coagulation
performance at pH6 at two HA concentrations
It can be seen that at relatively low Al3+ doses (≤ 0.81 mg l-1), the alum
and TBP are complementary, as discussed before, and the two locii show a close
dose stoichiometry with respect to humic acid concentration. Thus, the coagulant
dosages at point H, I and J are approximately twice those at point B, C, and D.
At higher Al3+ doses (>0.81 mg l-1) and for the lower HA concentration

203
(15 mg l-1), although the locus line is strictly nonlinear, it continues to follow an
approximately linear inverse form (i.e., ,cmxy +−= in very general terms)
demonstrating the complementary relationship between the two coagulants. In
contrast, for the higher HA concentration (30 mg l-1), the locus line levels off, and
the TBP dose has a constant value (30 mg l-1) as the alum dose increases. The
precise reason for the constant trend of the TBP dose with increasing alum is not
obvious, but clearly this represents a departure from a mechanism of simple
charge neutralisation. The corresponding values for FI and colour removal at each
point along the locus lines are shown in Figures 7.35 and 7.36. The results show
that while colour removal is fairly insensitive to the alum-TBP dose combination
over the full range considered, the FI is strongly influenced by the dose
combination. Thus, for case of 15 mg l-1 HA, point B is clearly the optimal dose
combination, while for 30 mg l-1 HA, the optimal dose combination is
approximately point K.
Figure 7.35 Variation of Flocculation Index and colour removal along coagulant
dosage locus for 15 mg l-1 HA at pH6

204
Figure 7.36 Variation of Flocculation Index and colour removal along coagulant
dosage locus for 30 mg l-1 HA at pH6
7.4 Discussion
When a cationic polymer has been used to partially replace alum as the
primary coagulant in water treatment, coagulation/flocculation was observed to
occur over a wide concentration range and reduced the dosages of the reagents
(163). The results of the coagulation performance by the combination of TBP
with alum in this investigation have confirmed this phenomenon.
From the results collected from the first set of flocculation tests using
particle suspensions as model water at two different pH values, it can be
concluded that at pH 5 (and below), the dominant coagulant species are cationic
aluminium hydrolysis species and cationically charged TBP polymer, and this
gives rise to coagulation of the kaolin particles by charge neutralisation. This
mechanism was supported by the observed inverse relationship between the alum
and TBP dosages required for optimal coagulation which suggested a

205
quasi-charge stoichiometry between the coagulant and the suspension. In contrast,
at pH 7, the dominant mechanism of flocculation was believed to be adsorption of
kaolin particles onto and within precipitated Al(OH)3, known generally as ‘sweep
flocculation’(136). However, the influence of charge neutralisation from the
TBP-cationic charge may still be significant under these conditions. Thus, the Al
dose can be reduced from the optimum dose of 3.4 mg l-1 as sole coagulant, to 2.0
mg l-1 with the complementary presence of approximately 0.3 mg l-1 of TBP,
which thereby contributes to the neutralisation of negative surface charge on the
kaolin particles before and during sweep flocculation.
It is believed that at pH6, depending on the colour (humic) concentration
and alum dosage, the dominant coagulation mechanisms are partly ‘humate’
precipitation by polymeric aluminium hydrolysis species (charge neutralisation)
and partly adsorption of organic species onto aluminium hydroxide precipitate
(‘sweep flocculation’), leading to a maximum removal of the humic substances
(172). However, at the lower colour and humic substance concentration (15 mg
l-1), the small alum dose (< 2.03 mg l-1 as Al3+) may not be sufficient for a rapid
precipitation of aluminium hydroxide, and coagulation occured principally by
charge neutralization of the humic substances with the cationic TBP and
aluminium hydrolysis species. In support of this, there is the observed increase in
optimal polymer dose with decreasing alum dose, indicating an overall charge
stoichiometry in order to achieve charge neutralization. In contrast, from the
results obtained under the conditions of much higher humic concentrations (30
mg l-1), it is speculated that the coagulation mechanism is probably caused both
by charge neutralisation and adsorption on to solid phase aluminium hydrolysis
species. The general shape of the alum-polymer dosage locus for optimal
coagulation performance at the low concentration of HA is in accordance with the
mechanism of cation charge stoichiometry. However, the nonlinear nature of the
locus at high concentration of HA reflects the complex interaction between humic
substances with coagulants.
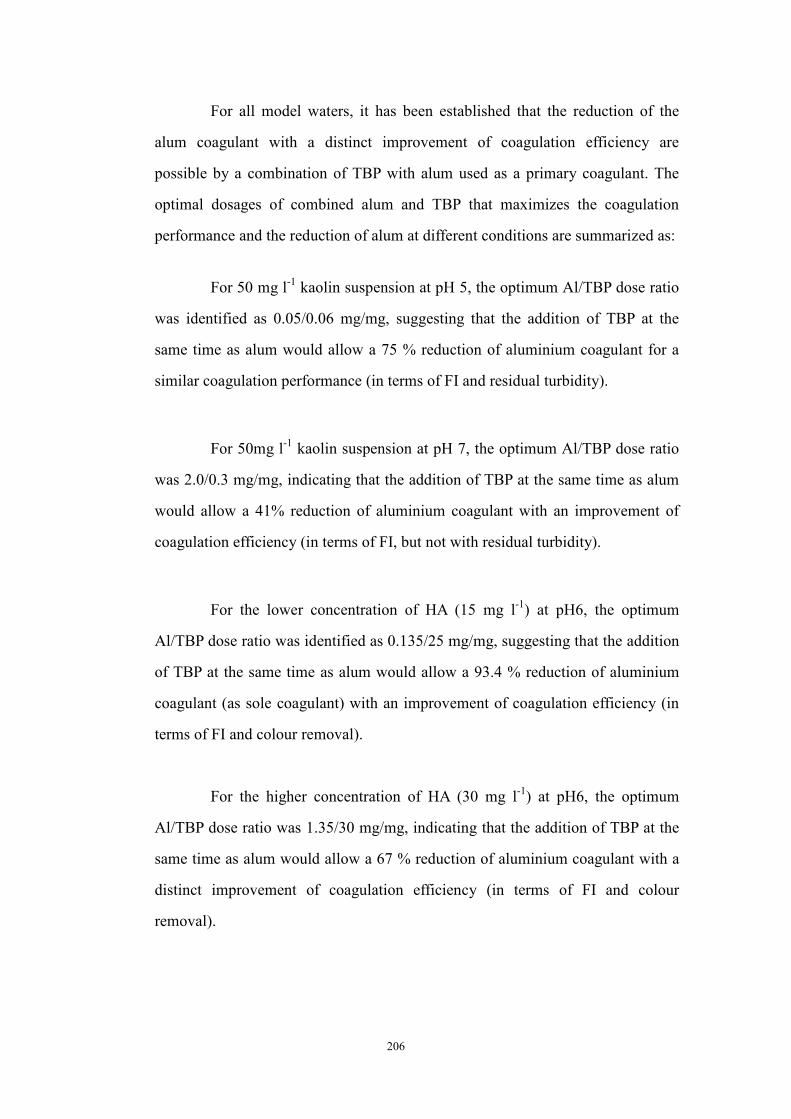
206
For all model waters, it has been established that the reduction of the
alum coagulant with a distinct improvement of coagulation efficiency are
possible by a combination of TBP with alum used as a primary coagulant. The
optimal dosages of combined alum and TBP that maximizes the coagulation
performance and the reduction of alum at different conditions are summarized as:
For 50 mg l-1 kaolin suspension at pH 5, the optimum Al/TBP dose ratio
was identified as 0.05/0.06 mg/mg, suggesting that the addition of TBP at the
same time as alum would allow a 75 % reduction of aluminium coagulant for a
similar coagulation performance (in terms of FI and residual turbidity).
For 50mg l-1 kaolin suspension at pH 7, the optimum Al/TBP dose ratio
was 2.0/0.3 mg/mg, indicating that the addition of TBP at the same time as alum
would allow a 41% reduction of aluminium coagulant with an improvement of
coagulation efficiency (in terms of FI, but not with residual turbidity).
For the lower concentration of HA (15 mg l-1) at pH6, the optimum
Al/TBP dose ratio was identified as 0.135/25 mg/mg, suggesting that the addition
of TBP at the same time as alum would allow a 93.4 % reduction of aluminium
coagulant (as sole coagulant) with an improvement of coagulation efficiency (in
terms of FI and colour removal).
For the higher concentration of HA (30 mg l-1) at pH6, the optimum
Al/TBP dose ratio was 1.35/30 mg/mg, indicating that the addition of TBP at the
same time as alum would allow a 67 % reduction of aluminium coagulant with a
distinct improvement of coagulation efficiency (in terms of FI and colour
removal).

207
8. RESULTS: IMPROVEMENT OF TBP COAGULATION
PERFORMANCE USING SOLID BOUND TBP WITH MICROSAND IN
MODEL WATER
8.1 Introduction
In this part of the research, a novel approach of applying TBP as a
TBP/microsand mixture (sand-TBP) for water treatment has been investigated.
Preliminary work has been undertaken on the feasibility of attaching the TBP to
an inert solid (fine sand), with the aim of being able to dose the polymer as a
particle suspension (‘solid bound TBP’) coagulant. The potential benefits of this
approach instead of simply dosing TBP as a solution are more rapid floc settling
(due to the weight of the sand) and minimising residual soluble polymer in treated
waters; the latter is important given the difficulties of measuring low
concentrations of TBP (say, by the titration method) in the presence of other high
molecular weight organic substances (e.g. humic substances). In practice, the use
of one specific ballasted flocculation method, trade-name ACTIFLO®, was
introduced in the 1990s (173). Although the use of a microsand and a polymer
together increases the weight of flocs and the settlement rate in this
coagulation-flocculation-settling methodology, the polymer used in the applied
ACTIFLO process is only to help the microsand attach to the flocs, which are
chiefly formed by metal coagulants (e.g., alum).
The method of preparing the sand-TBP mixture was based on the
adsorption of the cationic-charged TBP (at low pH) by the negatively charged
sand grains; this was carried out in a simple mixed reactor with high speed
mixing at 300 rpm (600 s-1) for 2 min contact time with TBP solution and sand
introduced simultaneously (this time is based on the ACTIFLO process design).
The sand (Micro Sand Grade 90') used in this study was supplied by Universal
Mineral Supplies Ltd, UK (via WRc, UK). The size of the sand was in the range

208
from 63 microns to 250 microns. It has a specific gravity of 2.65 and a bulk
density of about 1450 kg m-1, and is used by Yorkshire Water for the ACTIFLO
process. After discarding the un-adsorbed TBP retaining in the solution, the
resulting sand-TBP solid can be applied (dosed as a suspension) for coagulation.
To quantitatively determine the ‘active’ TBP attached on the surface of
sand, which can be further used to aggregate the fine particles in model water, it
was necessary to primarily measure the ratio of adsorption between TBP and sand.
Based on previous studies (see Section 5.2.1.3), the absorbance of UV at 210 nm
provides a satisfactory measure of the concentration of TBP in pure water.
Therefore, in the preparation of the sand-TBP, the degree of TBP adsorption by a
given mass of sand can be determined by the change in soluble TBP (measured
by UV210 absorbance) over a given time period of exposure. In summary, the
aim of this study was:
• To evaluate the maximum adsorption of TBP by sand at pH 4.
• To determine the optimum coagulation dose of the sand-TBP at pH 4 and 6
using a model water containing 30 mg l-1 humic acid. The coagulation
performance was evaluated by PDA monitoring and changes in solution
NPDOC, and UV-Visible absorbance at 254 nm and 400 nm.
8.2 Adsorption of TBP on Sand
8.2.1 Preparation of a Solid Bound TBP
Initial adsorption tests were carried out at pH 4 (maximum TBP charge
density) using 30 mg l-1 TBP with different amounts of sand, with the sand used
as received. A 2L gator jar with a high mixing speed of 300 rpm (600 s-1) for 2
minutes was used in this test, and the final solution was filtered by 0.45µM filter
paper. The results for the filtered water gave erratic UV210 absorbance values,
with some absorbance higher than that corresponding to the initial 30 mg l-1
standard TBP solution, indicating some organic contamination on the surface of

209
microsand was present.
The method was modified to employ washing of the sand by either 20%
(v/v) H2O2 or 5 % (v/v) decon solution (Decon Laboratories Ltd, UK), and drying
of the washed sand in an oven at an appropriate temperature. After this
pre-washing of the sand, the adsorption tests at pH4 were undertaken, and the
UV210 absorbance of filtered solutions is shown in Tables 8.1 and 8.2, for each
washing method. From Tables 8.1 and 8.2, it can be seen that after the 2 min rapid
mixing at 300 rpm (600 s-1), a partial and systematic adsorption of TBP by the
washed sand was observed. It was also observed that the optimum adsorption of
TBP occurred at a sand concentration of 50 mg l-1, and that the degree of
adsorption was greater with the sand washed by Decon solution compared to that
washed by hydrogen peroxide solution. Although the quantification of residual
TBP by measurement of NPDOC is not believed to be as accurate as UV
absorbance, the optimal ratio of TBP/sand (30mg l-1/50mg l-1) was confirmed, as
shown in Table 8.3. At the optimal TBP/sand ratio, the residual TBP
concentration in filtered water was 14.29 mg l-1 (Table 8.2), which corresponded
to nearly half of the original TBP dose (30 mg l-1-14.29 mg l-1=15.71 mg l-1),
indicating a polymer adsorption of 52%. The amount of TBP adsorbed in 1mg
sand surface was shown in Table 8.1, the reason for the unstable change is
unknown, and need to further studied.
TABLE 8.1 Residual TBP in solution after 2 min mixing with sand (20% H2O2
solution washed, 30 mg l-1 TBP)
TBP (mg l-1)
Sand (mg l-1)
UV210 Residual TBP concentration (mg l-1)
The amount of TBP/sand
(mg/mg)
15 1.815 29.50 0.03
30 25 1.658 26.86 0.13
50 1.273 20.39 0.19 100 1.595 25.81 0.04
150 1.766 28.69 0.008
250 1.802 29.28 0.003

210
TABLE 8.2 Residual TBP in solution after 2 min mixing with sand (5% Decon
solution washed, 30 mg l-1 TBP)
TBP
(mg l-1)
Sand
(mg l-1)
UV210 Residual TBP concentration
(mg l-1)
The amount of TBP/sand
(mg/mg)
15 1.633 26.44 0.24
30 25 1.589 25.70 0.29
40 1.324 21.25 0.22
45 1.204 19.23 0.24
50 0.910 14.29 0.31
55 1.421 22.88 0.13
60 1.512 24.41 0.09
100 1.602 25.92 0.04
150 1.611 26.07 0.03
250 1.672 27.10 0.01
TABLE 8.3 Residual NPDOC in solution after 2 min mixing with sand (5%Decon solution washed, 30mg l-1 TBP)
TBP
30 mg l-1
TBP 30 mg l-1
With
Sand 15mg l-1
TBP 30 mg l-1
With
Sand 25mg l-1
TBP30 mg l-1
With
Sand 50mg l-1
TBP30mg l-1
With
Sand100mg
l-1
TBP30 mg l-1
With
Sand150mg l-1
Residual
NPDOC
(mg l-1)
11.76 8.81 9.76 7.079 10.90 10.86
To check the uniqueness of the optimal TBP/sand ratio, a further test at
pH 4 was carried out at double the previous TBP concentration used, 60mg l-1,
with different amounts of sand washed by Decon; the results are shown in Table
8.4.

211
TABLE 8.4 Residual TBP in solution after 2 min mixing with sand (5% Decon
solution washed; 60mg l-1 TBP)
TBP Sand
(mg l-1)
UV210 Residual TBP concentration
(mg l-1)
The amount of TBP/ sand
(mg/mg)
80 3.194 52.68 0.09
60mg l-1 90 2.782 45.75 0.16
100 2.321 38.01 0.219
110 3.061 50.44 0.09
120 3.202 52.81 0.06
150 3.495 57.73 0.02
It is clear that the minimum residual TBP, 38.01 mg l -1, was found at the
optimum ratio of 60 mg l-1 TBP/100 mg l-1 Sand. This optimal ratio is virtually
identical to that found for 30 mg l-1 TBP solutions, but the degree of TBP
adsorption was lower at 37%. The overall results are shown graphically in Figure
8.1. No further tests were carried out at higher concentrations of TBP (> 60mg l-1)
since the absorbance of UV210 was out of the spectrophotometer’s limit,
indicating that the TBP-UV210 calibration relationship was unreliable.
Figure 8.1 Variation of the residual TBP with TBP/Sand Ratio

212
8.2.2 The Effect of Mixing Time to Solid Bound TBP
The mixing time for the interaction of TBP and sand has been
investigated by changing the time from 2 min to 45 min at high mixing speed
(300rpm). Bearing in mind that the subsequent coagulation experiments would be
carried out with 30 mg l-1 HA at pH6, which previously required an optimal dose
of 45 mg l-1 TBP as coagulant alone, a series of tests using 60 mg l-1 TBP with
100 mg l-1 sand was undertaken to see whether an increased mixing time
improves the adsorption effectiveness or causes desorption between TBP and
sand. The results in Table 8.5 showed that with increasing mixing time, the
solution absorbance at 210nm increased systematically, suggesting an increased
quantity of TBP remaining in the solution. The results of UV absorbance with
different mixing time were consistent with the NPDOC results, which showed the
minimum NPDOC in the final solution was 15.42 mg l-1 for the 2 min mixing,
compared to the highest NPDOC, 22.96 mg l-1 for 45 min mixing. It is clearly
seen that the optimum adsorption of TBP with sand occurred with the shortest
mixing time (2 min), and that further mixing leads to polymer desorption from
the sand. Further test results showed that mixing times less than 2 min gave
higher UV absorbance values compared to that with 2 min mixing.
TABLE 8.5 Residual TBP in solution with different mixing time (5% Decon
solution washed; 60 mg l-1 TBP)
TBP& Sand Mixing time
(min)
UV210
(cm-1)
Residual TBP concentration
(mg l-1)
NPDOC
(mg l-1)
2 2.321 38.01 15.41
60mg l-1 TBP 5 2.475 40.59 17.29
and 10 2.962 48.78 18.85
100mg l-1 sand 15 3.385 55.89 20.42
30 3.475 57.40 22.22
45 3.475 57.40 22.96

213
8.3 Coagulation Action of Solid Bound TBP in HA Solution
8.3.1 Coagulation Performance of Solid Bound TBP at pH 4
The coagulation performance of solid bound TBP was studied and
compared with the optimum dose of solution phase TBP at pH 4 for 30 mg l-1
humic acid solution; the latter was determined as 30 mg l-1, giving a maximum FI
of 0.34 (see Section 6.2.3). Different doses of TBP have been used in the
coagulation tests while maintaining the optimum TBP/Sand ratio, determined in
Section 8.2.1. In this case, the TBP doses were chosen in the range of 50 mg l-1 to
1.5 g l-1. The HA model water with the solid bound TBP were rapidly mixed in
the 2L gator jar at 260 rpm (500 s-1) and held at this value for the required time
(20-25 min). This rather high speed was found to be the optimum speed to
uniformly suspend the solid bound TBP in water. The results of the coagulation
tests with the solid bound TBP, in terms of the PDA Flocculation index for the
different amounts of TBP (optimum TBP/sand ratio), are shown in Figure 8.2.
Figure 8.2 Flocculation index response with the solid bound TBP at pH4 (30 mg
l-1 HA)

214
In Figure 8.2, it can be seen that the solid bound TBP was capable of
achieving some degree of HA coagulation. However, the maximum FI (0.14-0.17)
observed, corresponding to the solid bound TBP produced from 70 mg TBP with
116 mg sand, was substantially less than that produced by solution phase TBP (30
mg l-1 TBP). With the increasing or decreasing TBP mixed with sand at the
optimum ratio, the FI value clearly decreased. It is speculated that the charge
density of TBP adsorbed on the surface of sand after mixing at the optimal ratio
(70 mg l-1 TBP/116 mg l-1 sand) is similar to that of the optimum dose of
solution phase TBP (30 mg l-1), which interacts and neutralises the negative
charge of the humic acid at pH 4. The relatively smaller FI value, in comparison
with that using the 30 mg l-1 solution phase TBP, is possibly explained by the
high mixing speed required to maintain the sand in suspension, which may be
sufficient to shear weak flocs and prevent significant floc formation. For example,
in the previous studies with solution phase TBP, the maximum FI was reduced
from 0.34 to 0.14, when the stirring rate was increased suddenly from 50 rpm to
300 rpm (Section 6.6). The much greater fluctuation in FI in this study was
possibly caused by the variation of sand size and the presence of air bubbles in
solution produced by the extended period of high speed mixing. The quality of
the treated water after settling and filtering was measured in terms of NPDOC
and UV-visible light absorbance at 254nm and 400nm. The results are shown in
Table 8.6. From Table 8.6, it is clear that the sand/TBP combination of 116 mg l-1
sand/70 mg l-1 TBP, gave the best coagulation performance compared with the
performances of the other sand/TBP combinations; this is consistent with the
observed FI results. Assuming that no residual TBP remains in the filtered water,
the removal of NPDOC and UV254 absorbance by the solid bound TBP are
29.25% and 7.21%, which are much lower compared to the corresponding values
for 30mg l-1 solution phase TBP (30 mg l-1 HA solution at pH4) of NPDOC
83.5% and 92.3%, respectively. Thus, the corresponding values for the residual
NPDOC in the final water were 5.906 mg l-1 for solid bound TBP and 4.353 mg l-1
for the solution phase TBP.

215
TABLE 8.6 NPDOC and UV-visible light absorbance at 254nm and 400nm in
filtered water at pH4 (30 mg l-1 HA)
Sand
(mg l-1)
TBP
(mg l-1)
Abs at 254nm
(cm-1)
Abs at 400nm
(cm-1)
NPDOC
(mg l-1)
0 0 0.707 0.176 8.348
85 50 0.705 0.175 7.247
100 60 0.702 0.173 6.997
116 70 0.656 0.153 5.906
133 80 0.684 0.161 6.644
150 90 0.700 0.174 6.892
2500 1500 0.678 0.146 7.171
8.3.2 Coagulation Performance of Solid Bound TBP at pH 6
A further series of tests were carried out to measure the coagulation
performance of solid bound TBP with 30 mg l-1 HA at pH 6, involving the prior
preparation of sand with TBP for 2 min fast mixing at 300 rpm under pH 4. The
results of the coagulation tests with the solid bound TBP, in terms of the PDA
Flocculation index for the different amounts of TBP (optimum TBP/sand ratio),
are shown in Figure 8.3. As found previously at pH4, it can be seen that the solid
bound TBP was capable of achieving some degree of HA coagulation. However,
the maximum FI of 0.15 observed, corresponding to the solid bound TBP
produced from 160 mg TBP with 266 mg sand, was substantially less than that
produced by solution phase TBP (45 mg l-1 TBP). It also can be seen that the
coagulation performance by 160 mgTBP/266 mg sand is close to the performance
by 180 mgTBP/313 mg sand, suggesting that charge neutralization is not the
dominant mechanism in this case at pH6. However, it is possible in these tests
that the high speed mixing may have caused floc breakage.
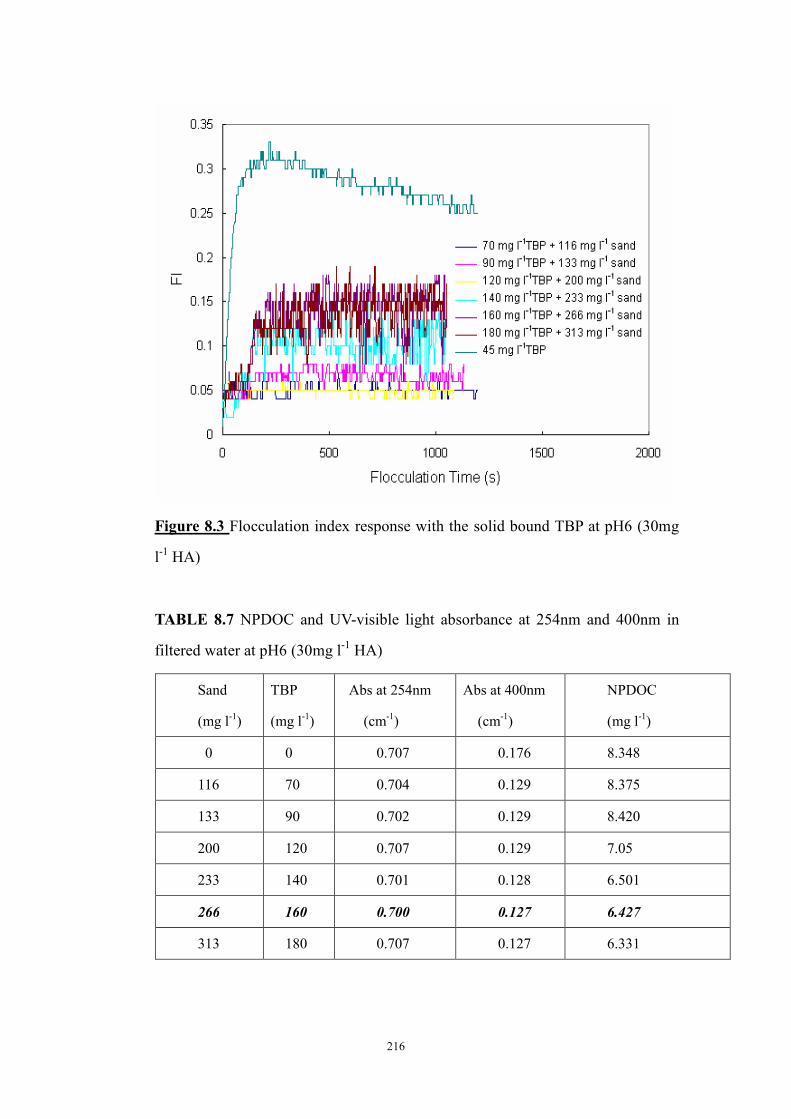
216
Figure 8.3 Flocculation index response with the solid bound TBP at pH6 (30mg
l-1 HA)
TABLE 8.7 NPDOC and UV-visible light absorbance at 254nm and 400nm in
filtered water at pH6 (30mg l-1 HA)
Sand
(mg l-1)
TBP
(mg l-1)
Abs at 254nm
(cm-1)
Abs at 400nm
(cm-1)
NPDOC
(mg l-1)
0 0 0.707 0.176 8.348
116 70 0.704 0.129 8.375
133 90 0.702 0.129 8.420
200 120 0.707 0.129 7.05
233 140 0.701 0.128 6.501
266 160 0.700 0.127 6.427
313 180 0.707 0.127 6.331

217
8.4 Discussion
When polymeric coagulants are used in the treatment of potable waters,
attention must be paid to their possible toxicity. Generally speaking, the presence
of residual polymer or/and residual monomer can present a hazard. However, a
practical problem with high molecular weight polymers is that they are difficult
to measure in solution at low concentrations (eg. < 1 mg l-1)(44). To date, a
standard colorimetric method is still considered a feasible means to measure the
phenol and tannin acid in water treatment. However, although the Determination
limit (DL) of this standard method has been determined by UV
spectrophotometry as a very low value (0.018 mg l-1 as tannin acid, Section 4.5.3),
there is still concern whether in real waters the TBP product or monomer could be
determined accurately at sufficiently low concentrations. Unfortunately, no
published work has considered the determination of residual TBP concentration,
possibly due to the complex nature of this polymer.
Under the circumstances of a certain optimal adsorption ratio of
TBP/sand, the combination of TBP and sand as ‘solid bound TBP’ was
encouraging with respect to the use of the coagulant whilst minimizing residual
TBP in the final water (following conventional filtration). This novel approach is
based on the theory that if there is some affinity between polymer segments and
particle surfaces, then adsorption of polymer chains may occur (19). In this case,
for sands carrying a net negative surface charge and cationic TBP, the bound ratio
of TBP/sand was found to be influenced by mixing time. It was observed that an
equilibrium arrangement was achieved within 2 min of interaction between the
TBP and the sand. The optimal bound ratio obtained in this mixing system was
found to be consistently of the order of 0.6 mg TBP/mg micro sand. Beyond this
optimal value, the adsorption effectiveness between sand with polymer was
worse.

218
According to a widely accepted model of an adsorbed polymer chain (7),
the tails and loops of TBP which is un-attached to the surface of sand and
projecting into the solution are able to interact with the humic substances in the
model water. Notwithstanding the evidence of coagulation between the solid
bound TBP and the humic solution in this study, the effectiveness (the removal of
NPDOC and UV254 absorbance) was inferior at pH 4 and 6, in comparison with
the performance by solution phase TBP. It is speculated that in practice, the
quantitative adsorption between TBP and sand is difficult to achieve at a very
high mixing speed. The overdose of sand possibly depleted too much cationic
charge of TBP, hence restricting the further interaction with humic acid to
aggregate in solution. On the other hand, the vigorous agitation may cause the
scission of polymer chains into small units and affect the coagulation
effectiveness of TBP.

219
9. RESULTS: COAGULATION EXPERIMENTS OF RAW WATER
9.1 Introduction
In the treatment of surface water, a cationic polyelectrolyte with high CD
and medium or high MW such as polyDADMAC or polyamine can be used to
replace a metal salt as the primary coagulant. However, there are fewer examples
of polymer-only coagulation in conventional coagulation/sedimentation/filtration
plants, compared to the use of polymer in conjunction with a metal salt, due to the
high polymer dose that would be required. A number of workers (102-105) have
found that the most effective removal of either turbidity or humic substances
from natural waters was achieved by the combination of an inorganic coagulant
and a cationic polymer such as polyDADMAC. In addition, Bolto(1) has also
indicated that for high turbidity waters, the alum dose required for effective
coagulation and filtration could be the limiting factor, with 12-15 mg l-1 as Al3+
suggested as the upper limit. In fact, the strategy of partial replacement of alum
with a polymer has been applied in treatment practice for years (105, 106). In
recent years, the combination of a natural polymer chitosan with alum as a
primary coagulant has been considered for raw water treatment. Very good
removal of turbidity and TOC from natural water by the combination of chitosan
with metal salts has been reported by Kawamura (3) and Vogelsang et al. (109),
respectively. Although these results indicated that chitosan was a potential
alternative flocculant for synthetic polymers, its economic aspect must be
considered in practice.
This chapter considers the coagulation effectiveness of TBP in
‘synthetic’ real waters using bench-scale tests with a photometric dispersion
analyzer to investigate whether TBP would be a workable substitute for alum and
polyDADMAC. Based on the previous results of model water tests, samples of a
real water from an organic-rich river source at Bamford, UK, were also included
for the bench-scale coagulation tests to raise the possibility of maximizing and

220
optimizing the performance using certain doses of TBP alone and dual coagulants
(alum/TBP) as primary coagulants.
9.2 Coagulation Performance of TBP in Simulated Water
A simulation test using a mixture of kaolin clay and humic acid as model
water was undertaken to simulate the performance of TBP with a real water and
to compare the results with those reported previously for real waters by WRc
(137). Details of the two waters and test methods were given in Section 4.4.3.
The results of the coagulation performance with the artificial model water are
shown in Figure 9.1.
Figure 9.1 Flocculation index response with TBP dose for artificial water
The coagulation tests indicated that a relatively high dose (15-20 mg l-1)
of TBP gave a good performance of colour, turbidity and NPDOC removal,
although at a lower dose, the onset of flocculation seemed to occur earlier. The
delayed flocculation phenomena at high dosage are difficult to explain by
Smoluchowski flocculation theory. It is likely affected by the precipitation of TBP
at high pH, however, the details need to be further studied. Even though the

221
nature of the organic matter in the real water is different to the HA used in the
model water, the optimum dose of around 15-20 mg l-1 for the model water is
consistent with the results of the WRc study, in which a similar dose of 15-20 mg
l-1 of TBP was required to produce the minimum residual turbidity. A comparison
of the results of the two types of water at a common TBP dose of 15 mg l-1 tests
are given in Tables 9.1 and 9.2.
TABLE 9.1 Coagulation results for the artificial water using 15 mg l-1 TBP
pH NPDOC*
(mg l-1)
NPDOC
Reduction
Colour
(Hazen)
Colour
Reduction
Turbidity
(NTU)
Turbidity
Reduction
Initial artifical
water
7.9 (15.26)** 32 27
Final filtered
water
7.1 (12.55)**
17.8%
8
75%
8
70.37%
* Initial NPDOC value is the sum of NPDOC values of TBP and artifical water.
** As indicated in Table 4.4, these values are believed to be incorrect.
TABLE 9.2 Coagulation results for the real water using 15 mg l-1 TBP (137)
pH NPDOC
(mg l-1)
NPDOC
Reduction
Colour
(Hazen)
Colour
Reduction
Turbidity
(NTU)
Turbidity
Reduction
Initial River
water
7.9 5.73 32.8 27
Final filtered
water
6.9 4.68
18.32%
10.5
67.98%
0.14
99.48%
9.3 Coagulation Performance of Different Coagulants with Raw Water
9.3.1 Coagulation Tests of Raw Water without pH Adjustment
In this study, TBP was dosed to samples of raw water from Bamford, UK
(see Section 4.4.4) without adjustment of pH and the coagulation performance
was investigated. The PDA results are shown graphically in Figure 9.2. From

222
these and the values of the other water quality parameters, shown in Table 9.3, it
is clear that a TBP dose of 30 mg l-1 gave the maximum FI, around 0.2, and the
optimal coagulation performance overall. The corresponding pH was 7.6.
Figure 9.2 Dynamic monitoring of raw water (Bamford, UK) using different
dosages of TBP without pH adjustment
TABLE 9.3 Variation of coagulation performance with TBP dosage for raw water
(Bamford, UK) without pH adjustment
TBP dose
(mg l-1)
Final pH NPDOC
(mg l-1)
Colour
Hazen
UV 254nm UV400nm Floc Vol
(ml)
FI
15 7.8 4.062 12.5 0.084 0.004 3.5 0.13
20 7.8 4.244 15 0.084 0.008 3.5 0.15
25 7.6 3.936 12.5 0.089 0.004 -- 0.08
30 7.6 3.096 10 0.073 0.004 5 0.2
35 7.2 4.513 15 0.081 0.004 -- 0.08
40 6.6 6.093 20 0.083 0.009 -- 0.07

223
9.3.2 Coagulation Tests of Raw Water with pH Adjustment at pH 6
9.3.2.1 Coagulation Performance of Alum
In these laboratory tests, 0.1 mol l-1 HCl solution was used to adjust the
pH value to 6.0. The optimum dose of alum used as coagulant alone was
measured by PDA and the results are shown in Figure 9.3. It is clear that 4.1 mg
l-1 as Al3+ gave the maximum FI as 0.17. The other water quality parameters were
also measured and are summarised in Table 9.4. Clearly, the optimal results of
final water qualities were in agreement with the PDA findings.
Figure 9.3 Dynamic monitoring of raw water at pH 6 using different doses of
alum (Bamford raw water)

224
TABLE 9.4 Variation of coagulation performance with alum dosage at pH6
(Bamford raw water)
Al3+
dosage
(mg l-1)
NPDOC
(mg l-1)
Colour
Hazen
UV 254nm
(cm-1)
UV400nm
(cm-1)
Floc Vol
(ml)
FI
3.4 1.090 10 0.022 0.002 3.5 0.11
4.1 1.003 5 0.019 0.001 4.5 0.17
4.5 1.026 7.5 0.024 0.002 3.5 0.13
5.0 1.052 15 0.024 0.003 2.0 0.14
9.3.2.2 Coagulation Performance of TBP
The optimum dose of TBP used as the sole coagulant was measured at
pH 6. From Figure 9.4, it is clear that 25 mg l-1 TBP gave a maximum FI value of
around 0.35. This optimal dose was confirmed by the other water quality
parameters shown in Table 9.5. However, the NPDOC value of the final water
using 10 mg l-1 TBP as the sole coagulant was smaller than that using 25 mg l-1
TBP, owing to the lower dose of TBP added to the initial water.
Compared to the previous results with model water containing 15 mg l-1
HA (NPDOC approximately 4.01 mg l-1), the dosages of alum and TBP for real
water (NPDOC approximately 3.662 mg l-1) are higher. However, it is reasonable
to expect significant differences between the real and model waters owing to the
different water qualities.

225
Figure 9.4 Dynamic monitoring of raw water at pH 6 using different doses of
TBP (Bamford raw water)
TABLE 9.5 Variation of coagulation performance with TBP dosage at pH6
(Bamford raw water)
TBP dose
(mg l-1)
NPDOC
(mg l-1)
Colour
Hazen
UV 254nm
(cm-1)
UV400nm
(cm-1)
Floc Vol
(ml)
FI
10 2.064 15 0.046 0.007 3 0.12
20 2.927 15 0.060 0.004 5 0.20
22.5 2.858 7.5 0.057 0.004 8 0.23
25 2.809 5 0.049 0.003 10 0.35
30 3.240 10 0.056 0.003 8 0.31

226
9.3.2.3 Coagulation Performance of Alum/TBP Combination
A narrow matrix test of the TBP/Alum dose combination for real water
at pH 6 was undertaken, based on the optimum dose of alum and TBP for real
water and the combination of TBP/Alum with the model water. The PDA results
are shown in Figures 9.5, 9.6 and 9.7 for different doses of TBP and alum.
Figure 9.5 Flocculation index response with 25 mg l-1 TBP and different Alum
doses at pH6 (Bamford raw water)

227
Figure 9.6 Flocculation index response with 20 mg l-1 TBP and different Alum
doses at pH6 (Bamford raw water)
Figure 9.7 Flocculation index response with 30 mg l-1 TBP and different Alum
doses at pH6 (Bamford raw water)

228
It is clearly seen that the combination of TBP/Alum remarkably
improved the coagulation performance (FI value). The optimal combination of
TBP/Alum (25 mg l-1 TBP and 0.27 mg l-1as Al3+) gave the maximum FI value of
about 1.1. With an increase or decrease in the amount of TBP (30 mg l-1 or 20 mg
l-1), the coagulation performances were inferior. However, the complementary
relationship between TBP and alum was evident in this study. The locus of
alum-TBP doses is shown in Figure 9.8.
0
5
10
15
20
25
30
35
0 0.5 1 1.5 2 2.5 3 3.5 4 4.5 5
Al3+
(mg l-1)
TB
P (m
g l-1
)
A
B
C
D
E
F
Figure 9.8 Locus of alum-TBP dosage combinations for optimal coagulation
performance at pH6 (Bamford raw water)
The corresponding values for FI and colour removal at each point along
the locus line are shown in Figure 9.9. The results showed that while colour
removal is fairly insensitive to the alum-TBP dose combination over the full
range considered, the FI is strongly influenced by the dose combination. Thus,
point C is clearly the optimal dose combination.

229
Figure 9.9 Variation of Flocculation Index and colour removal along locus line of
coagulant dosage at pH6 (Bamford raw water)
In general, the locus line of doses for the real water is very close to that
found for the model water with 15 mg l-1 HA. The coagulation performance in
terms of other water quality parameters is summarized in Table 9.6. From Table
9.6, it is seen that 25 mg l-1 TBP with 0.27 mg l-1 as Al3+ significantly improved
the coagulation performance and reduced the amount of alum compared to using
alum alone. However, the addition of TBP as coagulant increased the value of
final NPDOC, in comparison with alum as sole coagulant. It is also observed that
the values of NPDOC in the final treated water are very close for the different
TBP/alum combinations. It is likely that this was caused by the presence of
residual TBP concentrations remaining in the final water, since the high removal
of UV absorbance at 254nm indicated the absence of humic matter. Using the
standard method for measurement of residual tannin, the absorbance at 700nm is
about 0.132. From the calibration curve equation: 0043.00943.0 −= XY -------
(4.2), the corresponding residual TBP concentration in the final water is about
1.445 mg l-1 (the calibration curve is described in Section 4.5.3).

230
TABLE 9.6 Coagulation performance for the combination of TBP/Alum at pH6
(Bamford raw water)
TBP dose
( mg l-1)
Al3+
(mg l-1)
NPDOC
( mg l-1)
Colour
Hazen
UV 254nm
(cm-1)
UV400nm
(cm-1)
Floc Vol
(ml)
FI
0.135 2.687 7.5 0.033 0.002 10 0.95
0.27 2.791 10 0.038 0.002 8 0.85
30
0.41 2.783 12.5 0.037 0.002 6 0.6
0.135 2.777 7.5 0.039 0.003 10 0.9
0.27 2.432 5 0.031 0.002 14.5 1.1
25
0.41 2.566 7.5 0.042 0.003 12 1.0
0.135 2.843 17.5 0.049 0.004 2 0.45
0.27 2.828 15 0.046 0.004 4 0.55
20
0.41 2.602 12.5 0.037 0.002 5.5 0.63
25 0 2.809 5 0.049 0.003 10 0.35
0 4.1 1.003 5 0.019 0.001 4.5 0.17
In the previous tests for model water with 15 mg l-1 HA, the results
indicated that a small amount of TBP with rather higher dose of alum improved
the coagulation performance. In this case, 10 mg l-1 TBP was chosen to combine
with a range of alum (from 1.08 mg l-1 to 3.24 mg l-1 as Al3+) to see whether the
coagulation performance is improved. The results are shown in Figure 9.10 and
Table 9.7. It is clearly seen that in comparison with the performances using TBP
or alum as coagulant alone, 10 mg l-1 TBP with 2.16 mg l-1 as Al3+ gave a modest
performance.

231
Figure 9.10 Flocculation index response with 10 mg l-1 TBP and different Alum
doses at pH6 (Bamford raw water)
TABLE 9.7 Variation of coagulation performance with TBP and alum doses at
pH6 (Bamford raw water)
TBP dose
(mg l-1)
Al3+
(mg l-1)
NPDOC
(mg l-1)
Colour
Hazen
UV 254nm
(cm-1)
UV400nm
(cm-1)
Floc Vol
(ml)
FI
1.62 1.834 15 0.045 0.005 1.5 0.22
2.16 1.464 12.5 0.026 0.003 5.5 0.40
2.7 1.474 15 0.030 0.008 1.5 0.32
10
3.24 1.773 25 0.033 0.010 0.5 0.24
25 0 2.809 5 0.049 0.003 10 0.35
0 4.05 1.003 5 0.019 0.001 4.5 0.17

232
9.3.2.4 Floc Strength of Alum-TBP Combination
In this experiment, the optimum dose of alum, TBP and the combinations
of TBP/alum were pipetted into real water at pH 6, and an initial period of 25
minutes for the slow stirring at 50 rpm (48 s-1) was chosen since no significant
changes were observed in the FI value after this. Floc breakage was brought
about by suddenly increasing the stirring speed to 300 rpm (600 s-1) after the
initial period, and maintaining this for 60 seconds. Then, the stirring speed was
reduced back to 50 rpm (48 s-1). The PDA results are shown in Figure 9.11. The
behaviour of the flocs during these hydrodynamic changes can be described by
the following semi-quantitative parameters (Section 6.6.2) based on the FI
response:
Strength factor = (FI2/ FI1) ·100 ------------- (6.1)
Recovery factor = [(FI3- FI2) / (FI1- FI2)] ·100 ------------ (6.2)
Figure 9.11 Monitoring of floc formation at 50 rpm, breakage at 300 rpm for 60s
and re-formation at 50 rpm using different coagulants at pH6 (Bamford raw
water)

233
TABLE 9.8 Strength and recovery factors obtained for different coagulants (floc
breakage at 300rpm for 60s) at pH6 (Bamford raw water)
Alum TBP
10 mg l-1 TBP and
2.16 mg l-1 as Al3+
25 mg l-1 TBP and
0.27 mg l-1 as Al3+
Strength factor (%) 23.5 14.3 20.0 18.2
Recovery factor (%) 38.5 50 40.6 44.4
It is believed that the higher the value of the strength factor, the stronger
the flocs, since they are less sensitive to breakage as a result of the increased
shear rate. Compared with TBP, a stronger floc and lower recovery factor was
found with alum for model waters containing kaolin suspensions at low pH in our
previous studies (Section 6.6.2). In these experiments, from table 9.8 the strength
and recovery factors of the TBP/alum combinations at the optimum ration (10/
2.16 mg/mg) were similar to those with alum, and the strength factor was greater
than TBP alone. However, with the increasing dose of TBP in the combination,
the floc strength decreased slightly.
9.4 Discussion
The coagulation of a simulated river water showed that a relatively high
dose (15 mg l-1- 20 mg l-1) of TBP gave a good performance of colour and
turbidity removal, but less so with NPDOC removal. The results were consistent
with those reported by WRc for real river water under equivalent conditions.
Evidence that when particles are present, as would normally occur in natural
waters, the coagulation performance is improved (31) was supported by the
observed behaviour of a quaternary ammonium polymer with high CD and MW
in the study of Bolto et al. (31). The examination of the addition of kaolinite
when polyDADMAC was used as a primary coagulant suggests a 16% better
removal of colour, but there was little change in the removal of NOM, as

234
measured by UV absorbance. In this case, at pH 7, comparing the “synthetic”
water, in the presence of particles, with the HA model water, it is clearly observed
that kaolinite has a great effect on coagulation performance. Although an
adequate explanation is not possible, it seems likely that on addition of kaolinite
to humic acid solutions, the organic material is partly adsorbed on to the clay
surface, due to a strong affinity for humic acid (174). Therefore the enhanced
polymer coagulation could be explained by bridging, probably by hydrophobic
interaction between polymer molecules adsorbed onto adjacent particles (31).
The observed locus line (Figure.9.8) of TBP-alum combination dose for
the Bamford real water, an organic-rich river source, at pH 6 is totally consistent
with the previous results for the model water with 15 mg l-1 HA at the same pH.
The results of the Gator jar investigation showed that for the real water, at pH 6.0,
the optimum Al/TBP dose ratio was identified as 0.27/25 mg/mg, suggesting that
the addition of TBP at the same time as alum would enable a 93.25% reduction of
aluminium coagulant (as sole coagulant) with an improvement of coagulation
efficiency (FI is about 1.1), in comparison with the coagulation effectiveness by
TBP or alum alone. A rather high dose of alum with a low dose of TBP at a
Al/TBP ratio of 2.16mg/10mg also improved the coagulation performance and
reduced the alum usage. The strong complementary relationship between TBP
and alum favours the conclusion from the model water that at pH 6, the
mechanism of the flocculation action of the combination is predominantly charge
neutralization. The floc strength of the alum/TBP combination at the optimum
ratio (0.27/25 mg/mg) was found to be clearly greater than the strength of TBP
alone, and slightly lower than that of alum alone, as expressed in terms of
strength factor. This trend is in agreement with the findings for model waters
containing kaolin suspensions. There is still concern that as the amount of alum
was reduced significantly by the use of the dual coagulant, the NPDOC value in
the final treated water increases and is higher, compared to that with alum as a
sole coagulant.

235
10. GENERAL DISCUSSION
Cationic polymers are used in water and wastewater treatment primarily
as coagulants/flocculants to aid in solid-liquid separation. The majority of such
applications are treated with synthetic polymers mainly due to their high charge
densities and high molecular weights. However, synthetic products are likely to
have toxicity problems and their long-term effects on human health are not well
understood. To minimize these drawbacks, natural polymers and their derivatives
have gained popularity in water and waste water treatment. The selection of
natural polymers as primary coagulants is mainly on the basis of their cost,
coagulation effectiveness, biodegradability and safety to human health. The exact
coagulation mechanisms involved with these natural polymers are likely to vary
with the nature of the coagulant chemical. To select a suitable natural polymer for
a given application and evaluate its coagulation performance, it is necessary to
fully understand its properties, particularly its molecular weight, charge density,
chemical structure and functional groups. In general, naturally occurring products
used for coagulation are medium or high molecular weight polymers with high
cationic charge, such as chitosan. Although the relative importance of “charge
neutralisation” and “polymer bridging” during the coagulation process is still
unclear, it is evident from previous observations that highly positive CD polymers
tend to adsorb in a rather flat configuration, thus there is more opportunity for
neutralising the negative charges on the surface of particles (43); and the most
effective polymers for bridging are linear chains with high molecular weight (55).
For a high MW polymer with high CD, the ‘charge neutralisation’ is the dominant
coagulation mechanism for humic acid removal, and the absence of any effect of
molecular weight on the degree of removal indicated that a ‘bridging’ mechanism
is unlikely to play a major part in the process (18). Whilst natural polymers, such
as chitosan, have been used as primary coagulants to treat particles or organic
matter, it is difficult to determine a predominant mechanism due to their
complicated properties (175-177). Therefore, some workers (16) have strongly

236
proposed that a detailed knowledge of the character and properties of natural
polymers would be a significant step toward developing the study of coagulation
mechanisms and further polymer selection.
In agreement with the general information supplied by the TBP
manufacturer, the characterisation results described in Section 5, indicate that the
TBP is a moderate-to-high molecular weight polymer (~600,000 g mol-1), with
approximately 1000-2000 repeating units, and a reasonably narrow molecular
weight distribution. Thus, the cationic tannin based polymer is assumed to be as
shown in Figure 10.1; the condensation polymerization is believed to occur at the
4- and 8-positions of the "A" and "C" ring, respectively (129).
O
OH
OH
R
OH
OH
R
NR1
R2
N
OOH
OH
OH
OH
H
CHRH
R1
CHR
N
H
R1
R2
HOR2
O
OH
OH
OH
CHR
R
+
+
+
nCA
B2
34
6
8
8
CHR: the remainder of the aldehyde compound after the carbonyl oxygen has left.
R1 and R2: hydrogen or other organic moieties that were part of the original amino compound.
Figure.10.1 Proposed model structure for TBP
According to this model, the molecular weight of a repeating TBP unit is
estimated to be approximately 300, and the cationic charge is represented by the
amino group of the TBP.

237
From the literature review, it is understood that condensed tannins
comprise a group of polyhydroxylflavan-3-ol oligomers and polymers linked by
carbon-carbon bonds between flavanol subunits. Analysis of TBP is complicated
by the diversity of structures found within the group of condensed tannins.
According to the accepted principles of colloid science, systems are considered
to exhibit colloidal properties when the dimensions of the dissolved or dispersed
components (in hydrophilic or hydrophobic colloids, respectively) are in the
range of 1 to 1000nm (178). As we have measured the “radius of gyration” of
TBP to be around 78.4 (±19.3) nm, a colloidal system containing TBP could be
formed, depending on the chemical composition of the dissolved or dispersed
components and on the molecular interactions with the solvent molecules.
It is well understood that the dissociation of acidic HA functional groups,
such as carboxyl and phenolic groups, in aqueous media leads to the spontaneous
formation of an electric double layer. Therefore, electrostatic interactions play the
determining role in the conformational changes of humic macroions as well as in
the colloidal stability of humic solutions and in the aggregation of the individual
humic macroions (178). At high pH the functional groups are fully ionized,
resulting in the highly water-soluble anion. These chemically linked charges
endeavour to situate themselves as far apart as possible. In contrast, at low pH,
humic molecules can accumulate in interfacial layers, without any repulsion from
the charges. However, the explanation of HA precipitation is likely to be different
to the behavior of TBP, which also includes phenolic groups. In this case a
macromolecular solution is formed if TBP is dissolved in water at low pH and
precipitation occurred at higher pH (>6). It is assumed that the charges in the
electric double layer, caused by cationic amino groups, are mutually repelling at
low pH values. The dissociation of the cationic group with increasing pH leads to
TBP molecule accumulation. Further study of the chemistry of natural tannin
found that tannin may offer the potential to reconstruct by nucleophilic reactions
(179, 180). This is certainly true under basic conditions in the presence of oxygen,

238
both the extender unit and terminal unit of tannin (dependent on R group in
Figure 2.6) are subject to rearrangement (180), which can then possibly undergo
cross-link reactions between TBP molecules. Therefore, a higher degree of
polymerization corresponds to lower solubility and greater resistance to
degradation (181). These aspects supply some possible explanation for TBP
precipitation, but the precise mechanisms linking TBP precipitation to pH are still
considered to be far from straightforward.
The explanation of the ‘ageing effect’ by Shyluk and Stow (182), who
proposed that the diminishing flocculation ability of polymers with time was
associated with the disentangling of polymer chains, do not support the
observation of TBP precipitation with time in this study. A reasonable assumption
is that with an increasing time of exposure, a slow deprotonation process of the
phenolic hydroxyl group present on TBP might cause an increase in anionicity of
TBP, giving an inferior coagulation performance only by charge neutralization.
However, this effect may not contribute to the observed flocculation extent with
polymer bridging or precipitation of TBP. In overall terms, it can be concluded
that TBP is substantially affected by hydrolysis/hydration processes which lead to
changes in its charge density and solubility with solution time and pH.
Strong evidence of a non-quaternized amine group, possibly a tertiary
amine group, was found from different characterization tests (Section 5). The
positive charge density of TBP at low pH is believed to be due to the N+ ion of its
amine groups. However, by the deprotonation effect, the cationic TBP loses its
positive charge with increasing pH values. The results of the coagulation
experiments using TBP as a sole primary coagulant in this study (section 6) have
clearly illustrated that the variation in positive charge density with pH is the
major reason for the difference in optimum dosages of TBP. The greater the
positive charge density of TBP, the less the dose required to neutralize the
negative charge of the colloid. In contrast, a considerably greater dose was found

239
for TBP at relatively high pH corresponding to the polymer having weak or non-
positive charge, indicating flocculation caused by ‘bridging’(58) or other
mechanisms. In addition, it is clear from this work (Section 5) that at pH≥6, the
degree of insolubility of TBP increased dramatically with increasing pH values,
possibly caused by a low dissociation constant value (pKa) of its amino functions.
A relatively fast precipitation process of TBP, observed at higher pH (≥7),
appeared to influence the coagulation process and performance by the
enmeshment of precipitation.
It is well known that electrostatic interaction gives strong adsorption
between negatively charged particles and cationic polyelectrolytes. Coagulation
could occur by “charge neutralization” simply as a result of the reduced surface
charge of the particles and hence a decreased electrical repulsion between them
(19). From the results of the optimum TBP dosages for different concentrations of
kaolin, there seemed to be a simple one-to-one charge interaction between
negatively charged particles and the cationic TBP with a charge density of around
3 meq g-1 to 0.7 meq g-1 at low pH values (4 ~ 7). This is consistent with the
conclusions of Gregory (45) and Narkis and Rebhun (83), that if charge
neutralization is not a significant contribution to coagulation process then the
stoichiometric interaction between the anionic sites of particles/ humic substances
and the cationic charge of the polyelectrolytes might not exist. In contrast, the
theoretical optimum dosage for polymer bridging corresponds to “half-surface
coverage” of particles (61). However, Gregory (45) proposed that for adsorbed
polymers, it is difficult to precisely define “surface coverage” and optimum
flocculation usually occurs at well below monolayer coverage. Runkana et al. (62)
found that theories of bridging flocculation assuming equilibrium conditions were
of limited use in practice. Therefore, bridging interactions are likely to present a
non-equilibrium flocculation. The observed behaviour of non-stoichiometry by
TBP at high pH indicated that ‘bridging’ or the precipitate enmeshment
mechanism was only likely to play a major part in the process when the TBP has

240
a low positive charge or non-charge under higher pH conditions. Higher
aggregation rates and relatively larger flocs were found to occur under conditions
corresponding to ‘bridging’ or ‘sweep flocculation’ rather than charge
neutralization in this case. These observations could be explained by the fact that
the production of Al(OH)3 precipitate increased the effective particle
concentration and hence increased the collision rate; hydroxide precipitates are
quickly formed from large numbers of colloidal particles, and the aggregation of
these small particles gives low-density flocs, with a relatively large volume (145).
By understanding the chemical properties and structure of TBP, the
interrelationship between charge density, solution pH and polymer dosage with its
mechanism/performance of coagulation can be hypothesized. The loss of cationic
charge (amine de-protonation) and solubility with pH in the typical pH range for
water treatment (ie. pH 6-9) makes the behaviour of TBP similar to that of
conventional aluminium salt coagulants. A description of the aluminium
hydrolysis species and the solid precipitate domain as a function of pH can be
found from the well-established aluminium solubility diagram (134). At pH 5.0 -
6.0, the dominant Al species has been identified as doubly-and singly-charged
cationic species, leading to aggregation of particles by charge neutralization. At
pH 6 and above, due mainly to the uncharged (weakly charged) metal hydroxide,
Al(OH)3, the dominant coagulation mechanism is believed to be adsorption of
particles on, and enmeshment, by precipitates (“sweep flocculation”). In the same
way, at low pH (≤6) TBP is present as a moderate-to-high molecular weight,
soluble cationic polyelectrolyte with a charge density of approximately 3 meq g-1,
which is able to destabilise kaolin suspensions by charge neutralisation. Under
higher pH conditions (pH>6), increasing degrees of polymer precipitation occurs
leading to a decrease in soluble polymer concentration, a loss of cationic charge
and probable changes in polymer configuration. The impact of these changes on
coagulation performance is complex and likely to involve the well-established
mechanisms of charge interactions (including “electrostatic patch” effects),
polymer bridging, and colloid adsorption/enmeshment by solid phase TBP

241
hydrolysis products. Of importance to the first two mechanisms is the dependence
of the polymer configuration (ie. chain length, cross-linkage and chain stiffness)
on the solution chemistry. A summary of the proposed mechanisms with solution
pH is given in Table 10.1.
TABLE 10.1 Characteristics and coagulation behaviour of TBP with kaolin
pH
Charge
Density
(meq g-1)
Optimum
Dosage
(mg l-1)
Flocculation
Index (FI)
Turbidity
Removal
Possible Mechanism
4 3.072 0.15 0.25 63.7% Charge Neutralisation
5 2.662 0.25 0.32 53.7% Charge Neutralisation
6 2.048 0.25 0.35 57.5% Charge Neutralisation
7 0.666 0.3 0.52 67.5%
Charge Neutralisation
and/or Polymer Bridging
8 0.256 12.5 1.6-1.8 70%
Polymer Bridging and/or
Precipitate Enmeshment
9 0.205 14 2.3-2.5 72.5%
Polymer Bridging and /or
Precipitate Enmeshment
To study the optimal coagulation performances of individual coagulants,
the maximum Flocculation Index (as a surrogate for floc size) and strength factor
(as a surrogate for floc strength) at the optimum dose were compared by the
results determined from a Photometric Dispersion Analyser (PDA). At pH9, using
both model waters containing particles (kaolin) and soluble organic matter (HA),
considerably increased values of FI and strength factor were found, for polymer
bridging, in comparison with the lower values of these two parameters as
expected, for charge neutralisation with TBP at pH4 and 7. In comparison with
two alternative coagulant chemicals, alum and polyDADMAC, the performance
of the TBP in treating a kaolin suspension was inferior at neutral pH. For

242
polyDADMAC this is because it is a larger (1×10⁶ g mol -1) and more highly
charged (6 meq g-1) polymer, and its solubility is unaffected by solution time and
pH. Thus, it is capable of producing large flocs through efficient charge
neutralisation and polymer bridging. For alum at pH 7, the coagulation is
effective through rapid adsorption/enmeshment by aluminium hydrolysis species
and Al(OH)3 precipitates. Although the slow precipitation of TBP occurred at pH
7, the small amount of optimum dose may not produce enough enmeshment to
effectively “sweep” all the particles in the solution. Therefore, the main
coagulation mechanism of TBP at pH 7 is believed to be charge neutralization
and/or polymer bridging. However, in higher solution pH conditions the
coagulation performance of TBP appears to improve substantially, albeit with a
greater dose required, and at pH 9 it was arguably superior to the other
coagulants.
It is clear that “polymer bridging” is dependent on the adsorption of
polymer segments on to colloidal particles. When a long-chain polymer comes
into contact with a colloid particle, some of its active groups adsorb on to the
particle surface, while the rest of the segment of the macromolecule stretches out
from the surface into the solution as “loops” and “tails” to adsorb the other
particle. In general, the types of adsorption interaction between the polymer and
particle include electrostatic interaction, hydrogen bonding, hydrophobic bonding
and ion binding. In practice, the possibilities of these interactions are dependent
on the properties of the polymer and particle. In this case, at pH 9, a fair
proportion of TBP segments are believed to remain unattached and are available
for adsorption on other kaolin or HA particles. These particles then aggregate to
form flocs. “Bridging” will occur when the adsorbed chains interact with another
floc in the same way. Since TBP has a very weak charge at pH 9, hydrophobic
bonding and hydrogen bonding are believed to be important in considering the
affinity of segments for particle surfaces. The observation of stronger flocs by the
TBP at pH9 and by polyDADMAC in comparison with alum is matched by the

243
conclusion of Yukselen and Gregory (101), who proposed that the flocs produced
by bridging flocculation can be much larger and stronger than those formed when
particles are ionically destabilized by the charge neutralization of salts. Unlike
polyDADMAC which is a quaternary ammonium polymer and produces
destabilization of colloids as a result of charge neutralization and polymer
bridging, the action of TBP partially relies on its relative insolubility at pH values
higher than its isoelectric point (where the net charge on the polymer is close to
zero), which causes TBP to self-flocculate and sweep up other suspended
particles into the floc volume. This phenomenon is thought to be similar to the
precipitate enmeshment or ‘sweep flocculation’ mechanism of hydroxide
precipitate when alum is used as primary coagulant. The cross-linkage by TBP
precipitate probably enhances the strength of bonds between particles.
The main advantage of combining polymers with inorganic coagulants is
a consequent decrease in the inorganic coagulant dosage, leading to a decrease in
the generation of dry sludge, while achieving either an equivalent coagulation
performance or better performance. This has been clearly demonstrated by the
works of Filho et al. (105) for ferric sulphate with a cationic polymer. The results
from different model waters in this study (Section 6) have consistently shown a
substantial reduction in the dose of alum with a significant improvement of
coagulation effectiveness by the combination of alum/TBP. In mechanistic terms,
charge neutralisation appears to be a more important factor than polymer bridging
for the combination of coagulants at low pH for particle suspensions. This would
be expected to lead to an inversely quantitative relationship between alum and
TBP dosages (Figure 7.16). Notwithstanding a similar complementary
relationship between alum and TBP dosages at pH>6, the values in this case were
found to be non proportional. This is not surprising, since the dominant
flocculation mechanism of alum at pH>6 was believed to be adsorption of
particles on to and within precipitated Al(OH)3, known generally as ‘sweep
flocculation’(134). For model water with a turbidity of 70 NTU, Kawamura (3)

244
found that the addition of chitosan with alum would allow a 20% reduction of
alum as a coagulant alone with a small improvement of turbidity removal. The
optimum Al/chitosan dose ratio was suggested as 0.70/0.05mg (assumed the alum
as Al2 (SO4)3·14H2O). In our study, for a turbidity water at 40 NTU, the optimum
Al/TBP dose ratio was identified as 0.05/0.06 mg/mg, suggesting that the addition
of TBP with alum allowed a 75% reduction of aluminium coagulant (as sole
coagulant) with a small change of turbidity removal. It is seemed that TBP was
more efficient to replace alum when used as dual coagulant, compared with
chitosan. For HA solutions at pH 6, a superior performance and less dose were
achieved with the dual coagulant (alum-TBP combination), compared to the
commercial product TSL; however, both of them presented a higher floc volume
compared with alum as coagulant alone. The findings from this investigation
indicated that the precipitation of TBP at neutral and high pH produced a
significant amount of sludge, which may remove the advantage of alum
replacement by polymer in terms of sludge reduction.
In the results presented in this study, there is some doubt about the locus
of optimal alum/TBP combinations (Figure 7.34) at a relatively high
concentration of humic substances (30 mg l-1 HA). The precise reason for the
constant trend of the TBP dose with increasing alum is not obvious. The most
likely explanation for this trend was that for a high concentration of humic acids,
a large dosage of TBP combined with a small dose of alum gave charge
neutralisation and restabilisation at pH 6; further increasing the dose of alum only
gave an opportunity to produce a large amount of hydroxide precipitate.
Therefore, sweep flocculation played a predominant role in the flocculation
process, and reduced the impact of charge neutralisation effects by TBP. Thus, the
locus line levels off, and the TBP dose has a constant value (30 mg l-1) as the
alum dose increases. In practice, due to the precipitation of alum and/or TBP, a
rather wide range of alum/TBP dose combinations gave a coagulation
performance close to the optimum (indicated by the similar FI values). In Figure

245
10.2, the original Figure 7.34 has been modified to include the locii of dose
combinations corresponding to 75% of FImax, for the two levels of HA; this is
taken to be a range of good coagulation. The purpose of this is to show the
sensitivity of the peak coagulation performance to the coagulant dose
combinations.
At the lower level of HA, the locii are consistent and cover a narrow
range of dose variation corresponding to good coagulation. At the higher level of
HA, there is a wide range of dose combinations between the “upper limit” and
“lower limit” locii. It is interesting to note that while the optimum dose locus
(FImax) indicated a constant TBP dose for Al > 0.5 mg l-1, the upper limit and
lower limit locii displayed an inverse trend, or dose complementarity, as might be
expected for a coagulation mechanism based on charge neutralisation. The
departure from a simple inverse dose trend for the optimum dose locus may be a
consequence of the broad range of alum-TBP dose combinations giving good
coagulation and the imprecision in defining the optimum dose.
Figure 10.2 Locii of alum-TBP dose combinations for FImax (optimum) and 0.75
FImax with HA at two concentrations at pH 6

246
The distinct improvement of coagulation efficiency by the combination
of alum and TBP using as the primary coagulant (Section 7) is consistent with
that reported by Bolto et al. (6) and Edzwald et al. (7). Compared with a sole
coagulant, the combination of coagulants gave the benefits of more rapid kinetics
of floc growth and larger floc size (indicated by Flocculation Index) suggesting
an advantage in the use of the two coagulants. However, the presence of residual
polymer as a consequence of the use of TBP inevitably increases the value of the
final NPDOC in treated water, which may not be desirable.
Polyelectrolytes are known to produce stronger flocs than inorganic
coagulants (101). Some researchers (183) have indicated that polyelectrolytes of a
medium charge density and very high molecular weight were the optimum for the
production of strong flocs. Leentvaar and Rebhun (184) using ferric chloride for
water treatment found that a coagulant aid lead to stronger floc than
coagulation-flocculation without polymer addition. In this study, the combination
of TBP with alum caused a considerable increase in floc strength as indicated by
the calculated strength factor, compared to TBP as sole coagulant. The effect of
addition sequence on TBP/alum performance was not investigated in this research.
However, a previous study (185) using a cationic polymer with ferric inorganic
coagulant to coagulate clay suspensions, indicated that simultaneous addition of
coagulants produced higher flocculation index values, as well as higher strength
of flocs than the flocs formed when other addition sequences were used. There
have been previous reports of the irreversible nature of floc breakage in the case
of hydrolyzing coagulants and polymeric flocculants, due to “sweep flocculation”
and “bridging interactions”, respectively (101). For TBP and the TBP-alum
combination used as coagulants at pH6 or 7, it was noticeable that only limited
re-growth of flocs occurred indicating a significant irreversibility of the floc
break-up process. It was supposed that high shear rates may cause scission of
TBP cross-linkage chains, and adsorbed polymer could adopt a more flat
configuration during the breakage phase, and the reformed flocs may have a more

247
compact structure than that before breakage (101).
Whilst in general agreement with the performance observed in model
waters, the improvement of coagulation effectiveness of alum combined with
cationic TBP appeared to be substantially greater in real water (Section 9). The
real water test with an initial NPDOC of approximately 3.7 mg l-1 (Section 9)
presented a similar trend in the locus line of alum/TBP doses as the result from
the model water containing an equivalent NPDOC concentration of
approximately 4.0 mg l-1 (Section 7). The strong complementary relationship
between TBP and alum dose for the real water supports the conclusion from the
model water that at pH6, the coagulation mechanism of the alum-TBP
combination is predominantly charge neutralization. The results of the
coagulation experiments using both waters with similar NPDOC content can be
compared by considering the optimum dose of coagulants and the removal of
NPDOC; these are summarized in Table 10.2.
TABLE 10.2 Optimum dose of coagulants and treatment effectiveness from real
water and model water
NPDOC
(mg l-1)
TBP dose
(mg l-1)
Al3+
dosage
(mg l-1)
Ratio of
Al/TBP
(mg l-1/mg l-1)
Al
Reduction
%
Colour
Removal
%
Model
water
4.0 22.5 2.03 0.14/25 93.35 96
Real water 3.7 25 4.1 0.27/25 93.41 93
Using the optimal combination of TBP and alum as coagulants, the good
coagulation efficiency observed for the real water is in agreement with other
reported findings. Lee et al. (106) and Filho (105) have all demonstrated that both
cationic polyamine and polyDADMAC combined with metal salts were effective
as coagulants to treat river water; and enabled a reduction of the consumption of

248
inorganic coagulants. In this study, the results of the model water tests agreed
very well with the coagulation behaviour observed with the real water using the
dual coagulant of alum/TBP. However, it is worth noting that the values of
NPDOC in the final treated real water do not vary substantially for the different
TBP/alum combinations. Thus the removal of natural organic matter (NOM) by
coagulation alone was largely insensitive to the dose. Although total NOM is
similar in the final water, there may be differences in NOM fractions, and some
NOM fractions are probably unable to be coagulated by TBP. This is consistent
with the observation by Bolto et al. (6) that high MW polymers were effective to
remove NOM from water and the more hydrophobic NOM fractions were more
easily removed.
A preliminary two-stage (sedimentation/filtration) pilot scale investigation
of the performance of TBP has been undertaken by WRc (Swindon, UK) using a
“hard” (high alkalinity), lowland surface water (River Thames) (186). The
results of the pilot-scale tests were contradictory to the coagulation effectiveness
at bench scale when the TBP was observed in comparison with PACl. The
inferior performance of TBP in pilot scale tests, in contrast to that in bench-scale
tests, was speculated to be due to a slower floc formation with TBP preventing a
floc blanket to form in the clarifier during the plant run; this causes either the
TBP-dosed water to be inadequately flocculated or small flocs to pass through
the clarifier without separation. Thus, from a practical standpoint, TBP may not
be an appropriate coagulant for floc blanket clarification (FBC). However, TBP
may be effective for dissolved air flotation (DAF) or could be applied to direct
filtration processes.
The use of a “solid bound TBP” method (in Section 8) permits the
attachment of appropriate quantities of TBP on the surface of inert sands in order
to minimize the residual soluble polymer in the final water, and may enhance the
coagulation performance. Such a method which pre-determines the adsorption

249
ratio of cationic-charged TBP (at low pH) by negatively charged sand grains has
been found in this study to be moderately successful for the coagulation of a
given concentration of humic substances, and to the reduction of the residual TBP
in the treated water. A significantly faster settlement within several seconds, as
the other benefit of “solid bound TBP”, has been observed in the coagulation
processes. However, more research effort is required for this application in order
to avoid the breakage of forming flocs from a rather high mixing speed, which
was applied to keep the “solid bound TBP” suspended in water. The mechanism
of this method is based on the interaction between the polymer and particles
whereby some of the polymer’s segments are attached to the sand surfaces and
the “loops” and “tails” of the polymer are available to adsorb the particles in
solution. In contrast, polyDADMAC, which has a high charge density at pH6, is
believed to adsorb via a rather flat configuration which leads to little opportunity
for bridging interaction with sand. It is hypothesized that a polymer with low or
non charge density, such as TBP, is the optimum for this application.
In overall terms, as a primary coagulant for water treatment, TBP has been
found to be capable of effectively removing turbidity, colour and DOC. The large
flocs formed by this medium to high molecular weight polymer under optimal
conditions could give an accelerated rate of floc sedimentation prior to the
subsequent filtration process. Even though pre-adjustment of the pH is still
required, it can be concluded that TBP can be used over a wide range of pH.
Unlike synthetic polymers, the coagulation performance of TBP has been shown
to improve with the pH, although greater optimal doses are required. In
considering the usual range of natural water pH (say, 5-9), the TBP would be a
workable substitute for synthetic polymer or metal coagulants in the pH 8-9 range,
partly as a result of its diminishing solubility with pH. At pH ≤ 7, the results
suggested that the performance of TBP was inferior to other coagulants. To
minimize these drawbacks, TBP combined with alum has been investigated
extensively in this study. It is clear that the application of the dual coagulant

250
dramatically improves the coagulation performance at pH ≥ 6 in both model
water and real water. However, at pH 5, the coagulation performance is still
similar to that of using alum as coagulant alone. There are still two aspects of
concern, which will need to be evaluated further; these are any potential toxicity
and increased sludge volumes, which may affect the practical application of this
novel polymer. With the latter, it is generally recognised that alum forms rather
weak flocs and produces significant amounts of sludge. However, the results
from this study show that less strong and larger floc volumes were produced by
TBP alone and TBP/alum combinations in real surface water at pH6, compared
with alum as a sole coagulant. These effects may complicate the subsequent
filtration (eg. more rapid clogging) and disposal procedures after coagulation. It
is important to determine the residual TBP in the product water, and thus the
presence of any impurities in the TBP (and chlorinated TBP) that may reach the
consumers. To date, there is still no satisfactory method to effectively measure
the amount of residual polymers in treated water. A toxicological evaluation of
TBP and TBP coagulation sludge has been undertaken by São Paulo University
(187). The results of an autopsy accomplished with a test animal did not reveal
any signs of alteration in the viscera, and the tested sludge sample did not present
acute toxicity for Hialella azteca. The toxicity of TBP needs to be studied further
to meet the stringent limits of drinking water before it can be use as coagulant in
the UK.
The UK is probably the largest user of coagulants for water treatment in
the European Community because of the proportion of the supply that is derived
from surface water (137). The increasing price and demand for inorganic
coagulants and the growing interest in polymers presents a potential opportunity
for TBP in the water and wastewater treatment field, particular because of its
value as a naturally-derived product. For example, the greater bio-degradability
of the resultant sludge from TBP (187) could improve the acceptability of waste
sludge for disposal to agriculture.

251
11. CONCLUSIONS
(1) This study has investigated extensively the nature and performance of a new,
natural cationic polymer for use in water treatment.
(2) TBP (a tannin-based polymer), as a ‘Mannich’ polymer, can be classified as a
medium-to high molecular weight polymer with a mean molecular weight of
5.7 (±2.8)*105 g mol-1, based on the light scattering method; the charge
density of cationic TBP varied with pH and time (max ~3.1 meq g-1), based
on colloid titration method.
(3) A semi-quantitative identification of TBP predicted that the cationic function
group of monomer was a non-quaternized amine, believed to be the tertiary
amine group, R3NH+, as suggested by infra-red and NMR spectra. The
presence of the tertiary amine gave a variable charge density and possibly
was a cause of precipitation in solution due to the deprotonation of amine
groups, with pH.
(4) A consistent trend of increased TBP optimum dose with increase of pH
values was found for both model waters involving suspension particles and
humic substances. This phenomenon was directly linked to the observation
of the diminishing charge density with increasing pH.
(5) The mechanism of coagulation by TBP is closely related to the chemistry of
TBP in aqueous solution and depends strongly on pH values.

252
(6) Two important coagulation mechanisms of cationic synthetic polymers,
charge neutralisation and polymer bridging, were believed to be important in
the coagulation actions of TBP. However, the precipitation of TBP was also
proposed to cause “sweep coagulation”. The predominance of these different
mechanisms was considered to be strongly dependent upon pH values. A
dose stoichiometry can be appreciable at an acid or neutral pH, and hence
the predominance of charge interaction as the mechanism of coagulation was
proposed under these conditions. In contrast, there was no dose
stoichiometry under alkali pH conditions, suggesting polymer bridging or
precipitation enmeshment to be the dominant mechanism at this elevated pH
value.
(7) The comparative coagulation effectiveness of alum, polyDADMAC and TBP
were measured in terms of Flocculation Index, the turbidity reduction for
particle suspensions, the NPDOC removal in HA water and floc strength,
under certain similar conditions. A larger and stronger floc was achieved by
the effect of ‘polymer bridging’ or precipitation enmeshment of TBP at high
pH value.
(8) Evidence from coagulation experiments with kaolin suspensions suggested
that the coagulation performance and kinetics at optimal TBP dosages were
considerably influenced by factors such as the polymer age, mixing speed
and reactor design, apart from pH and the concentration of particles. The
apparent diminution of the peak flocculation index at low pH for ‘ageing’
TBP was thought to be the consequence of changes in the deprotonation of
the charge group with time.
253
(9) By studying the coagulation of kaolin suspension with combinations of alum
and TBP at different pH values, the interrelationship between coagulation
effectiveness and the ratio of optimum alum/TBP dosages represented
different coagulation mechanisms (charge neutralization and/or sweep
flocculation), which influence the amount of coagulants used. However, the
reduction of alum and the improvement in coagulation performance through
the combination of alum with TBP were consistently significant.
(10) The locii of the alum-polymer dosages for optimal coagulation performance
were achieved with two model waters at different concentrations of humic
acid. A unique optimal dosage of combined alum and TBP that maximizes
the coagulation performance can be easily determined by these locii with the
colour removal. The results from these experiments validated the benefit of
the dual coagulants in the reduction of alum requirement and the
improvement of coagulation effectiveness.
(11) A moderate adsorption was found by attaching the TBP to an inert solid (fine
sand) at low pH. The optimal adsorption ratio was determined by
determining the residual polymer indirectly by UV absorbance at the
maximum absorption wavelength of TBP solution (210nm). Through this
modified ‘solid bound TBP’ method, it was assumed to be possible to
achieve a low residual TBP in final water. Experimental evidence suggested
that some degree of coagulation performance (HA removal) was achieved,
but this was significantly lower than that achieved with an optimal dose of
solution phase TBP.
(12) Good agreement was found in the coagulation performance of cationic TBP,
for the simulated water and samples of lowland coloured real water under

254
equivalent conditions. A relatively high dose (15 mg l-1-20 mg l-1) of TBP
gave a good performance of colour and turbidity removal, but less so in
terms of NPDOC removal.
(13) The use of the PDA instrument was found to be a sensitive and reliable
method to monitor coagulation performance. The optimum dosage of alum
for a wide range of pH values were determined by the PDA method, and
found to be consistent with previous findings by other methods.
(14) It is suggested that the observed locus line of the optimum TBP-alum dose
combinations for real water from an organic-rich river source was broadly
consistent with the experimental results for the model water with the similar
concentration of NPDOC at the same pH. The results indicate that significant
opportunities exist for making a substantial reduction of alum and the
improvement of coagulation performance by using the combination of
alum/TBP as a primary coagulant in real water.
(15) The results of the tests indicated that the floc strength of TBP under “charge
neutralization” conditions was weaker than under “bridging” conditions. The
aggregates formed by the combined alum/TBP under “charge neutralization”
conditions appeared to be more resistant to breakage than those formed by
TBP alone.
(16) The colorimetric method, 5550B (18th Edition 1992), was approved to be
feasible for the determination of tannin acid in solution, but its suitability for
determining residual TBP remains in doubt. With the (uncertain) assumption
that it can be applied to the measurement of TBP, the results in this study

255
suggested that low concentrations of TBP (<1.5 mg l-1) remained in the final
water using optimal doses of TBP or TBP/alum as coagulants for the model
water and real water.

256
12. SUGGESTED FUTURE WORK
Topics for further investigation and development towards achieving a better
understanding and the improved use of TBP are as follows:
1. It is the case that all the characterisation data obtained so far have not been
able to provide an unambiguous description of the polymer, or monomer,
structure. This remains an important objective and an opportunity arises in the
future to apply new techniques to achieve this. A MALDI-TOF mass spectrum
method could be considered to give valuable information about molecular
weight distribution, end groups, and the oligomer repeating unit.
2. The nature of the coagulation mechanism of TBP (and cationic polymers in
general) with humic substances is still uncertain; particularly, the effect of
polymer molecular weight on the removal of NOM fractions. Further insight
could be obtained by analysing the coagulation performance and fundamental
behaviour of the hydrophobic and /or hydrophilic fractions of humic acid with
TBP. To do this, NOM can be fractionated by resin adsorption and coagulation
tests can be carried out using different fractions.
3. Attention has been given principally to the coagulation mechanism and
behaviour of TBP as a primary coagulant in this study. Further investigation is
necessary to evaluate in detail the nature of the flocs produced from the optimal
coagulant combinations (eg. size, density, charge and settling velocity) to
understand the fundamental mechanisms giving rise to good treatment
performance and the specific contribution of the polymer.
4. There is still no adequate method to effectively measure accurately the
concentration of residual polymer in treated water. In this work, the application of

257
a colorimetric method, which proved to be feasible for the determination of
tannin acid in solution, is not suitable or accurate for the measurement of TBP.
The possibility of chemically labeling the polymer (eg. by fluorescence) could be
undertaken for determining residual TBP in the future. The potential formation of
disinfection by-product (DBPs) from chlorine reactions with residual TBP would
also be a valuable topic of further work.
5. One potential application for TBP is as a filter aid applied to direct filtration
processes, due to a slow and less voluminous floc formation process, compared to
inorganic metal salts. This remains an important objective and a future
investigation might consider whether direct filtration could be improved by
partially or totally replacing alum with cationic TBP. A full matrix of coagulant
doses could be examined in order to identify optimal combinations of coagulant
doses giving the best filter performance and least volume of sludge solids in both
bench-and pilot-scale filter tests.
6. The role and use of TBP for sewage or waste water treatment have not been
studied adequately elsewhere in applications where it can be compared with
traditional metal coagulant and synthetic polymeric coagulant. For example, TBP
might be effective in the removal of phosphorus – this is an important subject
worthy of future investigation.

258
13. REFERENCES
1. Bolto, B. (1995) Soluble polymers in water purification. Progress in Polymer
Science. Vol. 20, 987-1041.
2. Amirtharajah, A. and C. R. O'Melia. (1990) Coagulation Processes:
Destabilization, Mixing and Flocculation. in Water Quality and Treatment,
4th ed., F. W. Pontius, ed., McGrawHill, Toronto, pp. 269-365.
3. Kawamura, S. (1991) Effectiveness of natural polyelectrolytes in water
treatment. Journal of American Water Works Association. Vol.83, 88-91.
4. Huang, C.P. and Chen, Y. (1996) Coagulation of colloidal particles in water
by chitosan. J. Chemical Technology and Biotechnology. Vol. 66, 227-232.
5. Tang, H. and Shi, B. (2002) The characteristics of composite flocculants
synthesized with inorganic polyaluminum and organic polymers. Chemical
Water and Wastewater Treatment VII, H.H.Hahn, E.Hoffmann,
H.ØDEGAARD (Eds.) IWA Publishing, London. 17-28.
6. Bolto, B., Abbt-Braun, G., Dixon, D., Eldridge, R., Frimmel, F., Hesse, S.,
King, S.J. and Toifl, M. (1999) Experimental evaluation of cationic
polyelectrolytes for removing natural organic matter from water. Water
Science and Technology. Vol.40, 71-79.
7. Edzwald, J.K., Haff, J. D. and Boak, J. W. (1977) Polymer coagulation of
humic-acid waters. J. Environmental Engineering DIV ASGE Vol.103,
989-1000.
8. Reed, P.E.and Finck, M.R. (1997) Modified tannin mannich polymers.

259
United States Patent No.5,659,002. 19 August.
9. Mallevialle, J., Bruchet, A. and Fiessinger, F. (1984) How safe are organic
polymers in water treatment? Journal of American Water Works
Association. Vol.76, 87-93.
10. Hutchison, P.R. and Healy, T.W. (1990) Surface and Colloid Chemistry in
Natural Water and Water Treatment. Plenum Press, New York.
11. Lee, J. F., Liao, P.M., Tseng, D.H. and Wen, P.T. (1998) Behavior of
organic polymers in drinking water purification. Chemosphere. Vol.37,
1045-1061.
12. Schwoyer, W.L.K. (1981) Polyelectrolytes for Water and Wastewater
Treatment. CRC Press Inc, Florida.
13. Napper, D.H. (1983) Polymeric Stabilization of Colloidal Dispersions.
Academic Press, London.
14. Hiemenz, P.C. and Rajagopalan, R. (1997) Principles of Colloid and
Surface Chemistry. Dekker, NewYork
15. Dentel, S.K., Abu-Orf, M. M. and Griskowitz, N.J. (1993) Guidance
Manual for Polymer Selection in Wastewater Treatment Plants. Water
Envt. Research Foundation, Alexandria, Va.
16. Ghosh, M.M., Cox, C.D. and Prakash, T.M. (1985) Polyelectrolyte
selection for water treatment. Journal of American Water Works
Association. Vol.77,67-73.

260
17. Wakeman, R.J. and Tarleton, E.S.(1999) FILTRATION: equipment
selection, modelling, and process simulation. Elsevier Science Ltd,
New York.
18. Kam, S.K. and Gregory, J. (2001) The interaction of humic substances
with cationic polyelectrolytes. Water Research, Vol.35, 3357-3566.
19. Bolto, B. and Gregory, J. (2007) Review: organic polyelectrolytes in water
treatment. Water Research, Vol.41, 2301-2324.
20. Ebeling, J.M., Rishel, K. L. and Sibrell, P.L. (2003) Screening and
evaluation of polymers as flocculation aids for the treatment of
aquacultural effluents. Aquacultural Engineering. Vol.29, 23-42.
21. Graham, N.J.D. (1982) Significance of Filter Pore Particle Flocculation in
Direct Filtration. PhD Thesis. Imperial College London.
22. Dentel, S.K., Gucciardi, B. M., Griskowitz, N. J., Chang, L.L.,
Raudenbush, D.L. and Arican, B. (2000) Chemistry, Function, and Fate
of Acrylamide-Based Polymers. 9th Gothenburg Symposium, Istanbul.
23. Chio, J.H., Shin, W.S., Lee, S.H., Joo, D.J., Lee, J.D., Choi, S.J. and Park,
L.S. (2001) Application of synthetic polyamine flocculations for dye
wastewater treatment. Separation Science and Technology Vol.36,
2945-2958.
24. Bailey, K.J. and Jackson, P. J. (1992) Determination of residual
polyelectrolyte in water. WRc Report number UM 1370 December.
25. Mangravite, F.J. (1983) Synthesis and properties of polymers in water

261
treatment. WRc Report Number 83-08.
26. Kawamura, S. (1959) Effectiveness of various types of flocculation aids on
alum flocculation, parts 1,2 and 3. J. Japan Water Works Association,
299:6 (Aug.1959), 302:10 (Nov.1959), and 303:34 (Dec.1959).
27. Rinaudo, M. (2006) Chitin and chitosan: properties and applications.
Progress in Polymer Science.Vol.31,603-632.
28. Huang, C.P., Chen, S. H. and Pan, J.R. (2000) Technical Note: Optimal
condition for modification of chitosan: a biopolymer for coagulation of
colloidal particles. Water Research. Vol.34, 1057-1062.
29. Guibal, E. and Roussy, J. (2007) Coagulation and flocculation of
dye-containing solutions using a biopolymer (chitosan). Reactive &
Functional Polymer. Vol.67, 33-42
30. Kvinnesland, T. and Odegaard, H. (2004) The effects of polymer
characteristics on nano particle separation in humic substances removal by
cationic polymer coagulation. Water Science and Technology. Vol.50,
185-191.
31. Bolto, B., Dixon, D., Eldridge, R. and King, S. (2001) Cationic polymer
and clay or metal oxide combinations for natural organic matter removal.
Water Research. Vol.35, 2669-2676.
32. Divakaran, R. and Pillai, V. N. S. (2004) Mechanism of kaolinite and
titanium dioxide flocculation using chitosan-assistance by fulvic acids.
Water Research. Vol.38, 2135-2143.

262
33. Fanta, G. C., Burr, R.C., Doane, M.M. and Russell, C.R. (1972) Graft
copolymers of starch with mixtures of acrylamide and the nitric acid salt of
dimethylaminoethyl methacrylate. J. Applied Polymer Science.Vol.16,
2835-2845.
34. Jarnstrom, L., Lason, L. and Rigdahl, M. (1995) Flocculation in Kaolin
Suspensions Induced by Modified Starches .1. Cationically Modified
Starch - Effects of Temperature and Ionic-Strength. Colloids and Surface A:
Physicochem. Eng. Aspects. Vol.10, 191-205.
35. Nystrom.,R., Backfolk, K., Rosenholm, J.B. and Nurmi. K. (2003)
Flocculation of calcite dispersions induced by the adsorption of highly
cationic starch. Colloids and Surfaces A: Physicochem. Eng. Aspects
Vol .219, 55-66.
36. Sableviciene, D., Klimaviciute, R., Bendoraitiene, J. and Zemaitaitis, A.
(2005) Flocculation properties of high-substituted cationic starches.
Colloids and Surface A: Physicochem. Eng. Aspects Vol. 259, 23-30.
37. Pal, S. Mal, D. and Singh, R. P. (2006) Synthesis, characterization and
flocculation characteristics of cationic glycogen: a novel polymeric
flocculant. Colloids and Surface A: Physicochem. Eng. Aspects Vol. 289,
193-199.
38. McKague, A.B. (1974) Flocculating agents derived from Kraft lignin. J.
Applied Chemical Biotechnology. Vol.24, 607-615.
39. Ndabigengesere, A., Narasiah, K.S. and Talbot, B.G. (1995) Active agents
and mechanism of coagulation of turbid water using moringa oleifera.
Water Research, Vol.29, 703-710.

263
40. Deryagin, B.V. and Landau, L.D. (1941) Theory of the stability of strongly
charged lyophobic sols and of the adhesion of strongly charged particles
in solutions of electrolytes. Acta Physicochim, URSS, Vol.14, 633.
41. Verwey, E.J.W. and Overbeek, J.Th. G. (1948) Theory of the stability of
lyophobic colloids. Elsevier, Amsterdam.
42. Ravina, L. (1993) Everything you want to know about coagulation and
flocculation. Zeta-Meter, Inc. USA.
43. Gregory, J. (1975) The effect of cationic polymers on the colloidal stability
of latex particles. J. Colloid and Interface Science.Vol.55, 35-44.
44. Higgins, J.M. (1999) Monitoring of polyelectrolytes in waters, process
streams and the environment. PhD Thesis. Imperial College London.
45. Gregory, J. (1978) Effects of polymers on colloid stability, The Scientific
Basis of Flocculation (Edited by Ives, K.J) NATO ASI Series.
Sijthoff&Noordhoff, Alphen a/d Rijn, Netherlands.
46. Krozel, J.W. (1993) Electrokinetic interactions between two spheres: the
role of surface charge transport in coagulation. J. Colloid and Interface
Science. Vol.163, 437-453.
47. Zhang, J, W. and Buffle, J. (1995) Kinetics of hematite aggregation by
polyacrylic acid: importance of charge neutralization. J. Colloid and
Interface Science. Vol.174, 500-509.
48. Jiang, J.Q. (1995) Development and performance of polyferric sulphate
as a coagulant in water treatment. PhD thesis. Imperial College London.

264
49. Sezaki, T., Hubbe, M.A., Heitmann, J.A., Argyropoulos, D.S. and Wang,
X.W. (2006) Colloidal effects of acrylamide polyampholytes Part 1.
Electrokinetic behaviour. Colloids and Surface A: Physicochem Eng.
Aspects 281, 74-81.
50. Gregory, J., and Nelson, D.W.(1986) Monitoring of aggregates in flowing
suspensions. Colloids and Surface. Vol.18, 175-188.
51. Gregory, J. (1973) Rates of flocculation of latex particles by cationic
Polymers. J. Colloid Interface Science. Vol.42, 448-456.
52. Gregory, J. (1978) Chemistry and Technology of water soluble polymer.;
Edited by Finch, C.A. Publisher Plenum Press. Chapter 18. polymeric
Flocculants.pp.307-313.
53. Kozlova, N. and Santore, M.M. (2006) Manipulation of micrometer-scale
adhesion by tuning nanometer-scale features. Langmuir,
Vol.22,1135-1142.
54. Ruehrwein, R.A. and Ward, D.W. (1952) Mechanism of clay aggregation
by polyelectrolytes. Soil Science. Vol.73, 485-492.
55. Caskey, J. A. and Primus, R. J. (1986) The effect of anionic
polyacrylamide molecular-conformation and configuration on
flocculation effectiveness. Environmental Progress. Vol. 5, 98-103.
56. Williams, P.A. (1982) The relationship between polyelectrolyte
configuration and colloid stability. The effect of polymer on dispersion
properties (Th.F.Tadros, editor).Academic Press, London.

265
57. Yu, J.F., Wang, D.S., Ge, X.P., Yan, M.Q. and Yang, M. (2006)
Flocculation of kaolin particles by two typical polyelectrolytes: A
comparative study on the kinetics and floc structures. Colloids and
Surface A: Physicochem.Eng.Aspects. Vol.290, 288-294.
58. Ferretti, R., Zhang, J.W. and Buffle, J. (1997) Kinetics of hematite
aggregation by polyacrylic acid: effect of polymer molecular weights.
Colloids and surface A: Physicochem.Eng. Aspects Vol.121, 203-215.
59. Chen, L., Chen, D. and Wu, C. (2003) A new approach for the
flocculation mechanism of chitosan. J. Polymers and Environment.
Vol.11, 87-92.
60. Roussy, J., Vooren, M.V., Dempsey, B. A, and Guibal, E. (2005)
Influence of chitosan characteristics on the coagulation and the
flocculation of bentonite suspensions. Water Research. Vol.39,
3247-3258.
61. La Mer, V.K. and Healy, T. W. (1963) Adsorption flocculation reactions
of macromolecules at the solid-liquid interface. Pure and Applied
Chemistry. Vol.13,122.
62. Runkana,V., Somasundaran, P. and Kapur, P. C. (2006) A population
balance model for flocculation of colloidal suspensions by polymer
bridging. Chemical Engineering Science. Vol. 61,182-191.
63. Bolto, B., Dixon, D., Eldridge, R. and King, S. j. (1998) The use of
cationic polymers as primary coagulants in water treatment.
In:Hahn,H.H.,Hoffmann,E., Odegaard,H. (Eds.), Proceedings of the Fifth
Gothenburg Symposium. Chemical Water and Wastewater Treatment.

266
Berlin, Springer, pp.173-182.
64. Graham, N. (1980) Orthokinetic flocculation rates for amorphous silica
microspheres with cationic polyelectrolytes. Colloids and Surface, Vol.3,
61-77.
65. Crompton, T.R. (1993) Practical polymer analysis. Plenum Press, New
York.
66. Fleer, G. J. (1971) Polymer adsorption and its effect on colloidal stability.
PhD Thesis. Agricultural University, Wageningen, The Netherlands.
67. Gregory, J. (1982) Polymer flocculation in flowing dispersions, in The
Effect of Polymers on Dispersion Properties (Edited by Tadros, T.F.).
Academic Press, London.
68. Vov Smoluchowski, M. (1917) Versuch Einer Mathematischen Theorie
der Koagnlottions Kinetic Kolloider Losungen. Phys. Chem. Vol.92,
129.
69. Gregory, J. (1988) Polymer adsorption and flocculation in sheared
suspensions. Colloids and Surface. Vol.31, 231-253.
70. Pelssers, E.G.M., Stuart, M.A.C. and Fleer, G.J. (1990) Kinetics of
bridging flocculation-role of relaxations in the polymer layer.
J.Chem.Soc.—Faraday Trans. Vol.86, 1355-1361.
71. Gill, R.I.S., and Herrington, T.M. (1989) The effect of colloid
concentration and pH on kaolin suspensions flocculated with cationic
polyacrylamides of high molar mass. Colloids and Surfaces. Vol.42,

267
23-37.
72. Morrow, J.J. and Rausch, E.G. (1974) Colloid destabilization with cationic
polyelectrolytes as affected by velocity gradients. Journal American Water
Works Association. Vol.66, 646.
73. Li, T., Zhu, Z., Wang, D.S., Yao, C.H. and Tang, H.X. (2006)
Characterization of floc size, strength and structure under various
coagulation mechanisms. Powder Technology. Vol.168, 104-110.
74. Ray, D.T. and Hogg, R. (1987) Agglomerate breakage in
polymer-flocculated suspensions. Journal of colloid and interface science.
Vol.116, 256-268.
75. Boller, M. and Blaser, S. (1998) Particles under stress. Water Science and
Technology. Vol.37, 9–29.
76. Parker, D. S., Kaufman, W. J. and Jerkins, D. (1972) Floc break up in
turbulent flocculation processes. J.Sanit. Eng.Div.: Proc.Am.Soc. Civ. Eng.
SA1, 79-99.
77. Gregory, J. and Yukselen, M. A. (2002) Break-up and re-formation of
flocs formed by hydrolyzing coagulants and polymeric flocculants. In:
Chemical Water and Wastewater Treatment –VII, IWA Publishing, UK,
pp29-38.
78. Jarvis, P., Jefferson, B., Gregory, J. and Parsons, S. A. (2005) A review of
floc strength and breakage.Water Research. Vol.39, 3121-3137.

268
79. Pan, J.R., Huang, C., Chen, S and Chung, Y.C. (1999) Evaluation of a
modified chitosan biopolymer for coagulation of colloidal particles.
Colloids and Surfaces A: Physicochemical and Engineering Aspects.
Vol.147, 359-364.
80. Thurman, E.M. and Morgan, R. L. (1981) Preparative isolation of humic
substances. Environmental Science and Technology. Vol.15, 463.
81. Newcombe, G. (1994) Activated carbon and soluble humic substances:
adsorption, desorption, and surface charge effects. J. Colloid and
Interface Science. Vol.164, 452-462.
82. Sutton, R. and Sposito, G. (2005) Molecular structure in soil humic
substances : the new view. Environmental Science and Technology.
Vol.39, 9009-9015.
83. Narkis, N. and Rebhun, M. (1977) Stoichiometric relationship between
humic and fulvic acids and flocculants. Journal American Water Works
Association. Vol.69, 325-328.
84. Bratskaya, S.Y, Avramenko, V.A., Sukhoverkhov, S.V. and Schwarz, S.
(2002) Flocculation of humic substances and their derivatives with
chitosan. Colloid Journal. Vol.64, 681-685.
85. O’Melia, C.R., Becker, W. C. and Au, K. (1999) Removal of humic
substances by coagulation. Water Science and Technology. Vol.40, 47-54.
86. Chang, E. E., Chiang, P.C., Tang, W.Y., Chao, S.H. and Hsing, H.J. (2005)
Effects of polyelectrolytes on reduction of model compounds via
coagulation. Chemosphere.Vol.58, 1141-1150.

269
87. Hall, T. and Hyde, R. A. (1992) Water Treatment Processes and Practices.
Water Research Centre, Swindon.
88. Yeh, H.-H. and Ghosh, M.M. (1981) Selecting polymers for direct
filtration. Journal American Water Works Association. Vol.73, 211
89. Duan, J.M., Wang, J. H., Graham, N. and Wilson, F. (2002) Coagulation
of humic acid by aluminium sulphate in saline water conditions.
Desalintion. Vol.150, 1-14.
90. Riddick, T.M. (1961) Zeta potential: new tool for water treatment.
Chemical Engineering. Vol.68, 121.
91. Ratnaweera, H., Hiller, N. and Bunse, U. (1999) Comparison of the
coagulation behaviour of different Norwegian aquqtic NOM sources.
Environment International. Vol.25, 347-355.
92. Bob, M.M. and Walker, H.W. (2001) Effect of natural organic coatings on
the polymer-induced coagulation of colloidal particles. Colloids and
surface A: Physicochemical and Engineering Aspects. Vol.177, 215-222.
93. Mikkelsen, L.H. (2003) Applications and limitations of the colloid titration
method for measuring activated sludge surface charges. Water Research.
Vol.37, 2458-2466.
94. Dentel, S.K., Wehnes, K. M. and Abu-Orf, M.M. (1994) Use of streaming
current and other parameters for polymer dose control in sludge
conditioning, In:Klute, R., Hahn,H.H.(Eds.) Proceedings of the Sixth
Gothenburg Symposium. Chemical Water and Wastewater Treatment
III.Berlin, Springer, pp.373-381.

270
95. Barron, W., Murray, B.S., Scales, P.J., Healy, T.W., Dixon, D.R. and
Pascoe, M. (1994) The streaming current detector: A comparison with
conventional electrokinetic techniques. Colloids and surface A:
Physicochemical and Engineering Aspects. Vol.88, 129-139.
96. Negro, C., Sanchez, L.M., Fuente, E., Blanco, A. and Tijero, J. (2006)
Polyacrylamide induced flocculation of a cement suspension. Chemical
Engineering Science. Vol.61, 2522-2532.
97. Lartiges, B.S., Bottero, J. Y., Democrate, C. and Coupel, J. f. (1995)
Optimizing flocculant demand by following floc size distribution. J. Water
Supply: Research and Technology—Aqua. Vol.44, 219-223.
98. Huang, C. P. and Liu, C. B. (1996) Technical note: Automatic control for
chemical dosing in laboratory-scale coagulation process by using an
optical monitor. Water Research. Vol. 30, 1924-1929.
99. Francois, R.J. (1987) Strength of aluminium hydroxide flocs. Water
Research. Vol. 21, 1023-1030.
100. Govoreanu, R., Seghers, D. and Nopens, I. (2000) Linking floc structure
and settling properties to activated sludge population dynamics in an
SBR. Water Science and Technology. Vol. 47, 9-18.
101. Yukselen, M.A. and Gregory, J. (2004) The reversibility of floc breakage.
International Journal of Mineral Processing. Vol.73, 251-259.
102. Rout, D., Verma, R. and Agarwal, S.K. (1999) Polyelectrolyte

271
treatment--an approach for water quality improvement. Water Science
and Technology. Vol. 40, 137-141.
103. Lindqvist, N., Jokela, J. and Tuhkanen, T. (2004) “Enhancement of
coagulation by using polyelectrolytes as coagulant or flocculant aids.” In
Chemical Water and Wastewater Treatment VIII edited by H.H.Hahn,
E.Hoffmann, H.Odegarrd IWA Publishing London, pp161-169.
104. Chang, E. E., Chiang, P. C., Chao, S. H. and Liang, C. H. (1999) Effects
of polydiallyldimethyl ammonium chloride coagulant on formation of
chlorinated by products in drinking water. Chemosphere. Vol.39,
1333-1346.
105. Filho, S.S.F, Fernandez, A. N., Mendes, R.L., Sinelli, P.A. and Cipriani,
M.J.I. (2004) Drinking water treatment of highly eutrophic waters:
coagulation process control by means of cationic polymers associated
with inorganic coagulants Chemical Water and Wastewater Treatment
VIII edited by H.H.Hahn, E.Hoffmann, H.Odegarrd IWA Publishing
London, p.233-242.
106. Lee, S.H., Shin, M. C., Choi, S. J., Shin, J. H. and Park, L.S. (1997)
Improvement of flocculation efficiency of water treatment by using
polymer flocculants. Environmental Technology. Vol. 19, 431-436.
107. Shultz, C. R. and Okun, D. A. (1982) Practical water treatment for
communities in developing countries. AWWA Ann. Conf., Miami, Fla.
108. Divakaran, R. and Sivasankara, P. V. N. (2001) Flocculation of kaolinite
suspensions in water by chitosan. Water Research. Vol.35, 3904-3908.

272
109. Vogelsang, C., Andersen, D.O., Hey. A., Hakonsen, T., Jantsch, T.G.,
Muller, E.D., Pedersen, M.A. and Varum, K.M. (2004) Removal of
humic substances by chitosan. Water Science and Technology: Water
Supply. Vol. 4, 121-129.
110. Scheuch, L.E. and Edzwald, J.K. (1981) Removing color and chloroform
precursors from low-turbidity waters by direct filtration. Journal of
American Water Works Association. Vol.73, 497.
111. Edzwald, J.K., Becker, W.C., and Tambini, S.J. (1987) Organics, polymer
and performance in direct filtration. Jour. Engry. Div,—ASCE. Vol.113,
167.
112. Graham, N. J. D., Brandao, C. C. S. and Luckham, P. F. (1992)
Evaluating the Removal of Color from Water Using Direct-Filtration
and Dual Coagulants. Journal of American Water Works Association.
Vol.84, 105-113.
113. Department of the Environment. Water, England and Wales: The Water
Supply (Water Quality) Regulations 2001. Statutory Instruments 3911.
HMSO, London 2002.
114. Lee, J.F., Liao,P.M., Tseng, D.H, and Wen, P. T. (1998) Behavior of
organic polymers in drinking water purification. Chemosphere. Vol.37,
1045-1061.
115. National Sanitation Foundation. Standard ANSI/NSF 60 1988
Drinking-water treatment chemicals-health effects. Standard NSF
International Brussels, Belgium.
273
116. NSF International, Drinking-water treatment chemicals-health effects;
2001 Certified product listings. ANSI/NSF Standard 60. Washington,
NSF.
117. Criddle, J. (1990) A review of the mammalian and aquatic toxicity of
polyelectrolytes. NR 2545, Medmenham, Foundation for Water
Research.
118. BSI Standards (1998) Chemicals used for treatment of water intensed
for human consumption-poly(diallyldimethylammonium chloride). BS
EN 1408.1998, British Standards Institute, London.
119. Lettermen, R.D. and Pero, R.W. (1990) Contaminants in polyelectrolytes
used in water treatment. Journal of American Water Works Association.
Vol.82, 87-97.
120. Parazak, D. P., Burkhardt, C.W. and McCarthy, K. J. (1987)
Determination of low-levels of cationic polyelectrolytes in water.
Analytical Chemistry. Vol.59, 1444-1445.
121. Howes, N.J. and Harper, G. (1998) Review of analytical methodology for
cationic polyacrylamides at levels of environmental significance. R&D
Technical Report No.E47, Environment Agency, Bristol, UK, pp.34.
122. Soponkanaporn, T. and Gehr, R. (1987) Quantitative determination and
peak molecular weight analysis of acrylamide-based polyelectrolytes by
size-exclusion chromatography. International Journal of Analytical
Chemistry. Vol.29, 1-8.
123. Martin, J., Thomas, S., Bellen, G.E., King, L.W. and Hylko, J.M. (1990)

274
Carbon-14 tracer study of polyacrylate polymer in a wastewater plant.
Applied Radiation and Isotopes. Vol.41, 1165-1173.
124. Chang, L. L., Bruch, M.D., Griskowitz, N.J. and Dentel, S.K. (2001)
NMR spectroscopy for determination of cationic polymer concentrations.
Water Research. Vol.36, 2255-2264.
125. Becker, N. S .C., Bennett, D.M., Bolto, B. A., Dixon, D.R., Eldridge, R.
E., Le, N. P. and Rye, C.S. (2004) Detection of polyelectrolytes at trace
levels in water by fluorescent tagging. Reactive & Functional
Polymers.Vol.60, 183-193.
126. Fielding, M, Hutchison, J., Hughes, D. M., Glaze, W. H. and Weinberg,
H.S. (1999) Analytical methods for polymers and their oxidative
by-products. Americal Water Works Association Research Foundation,
Denver.
127. Nozaic, D. J., Freese, S. D. and Thompson, P. (2001) Long term
experience in the use of polymeric coagulants at Umgeni Water. Water
Science and Technology: Water Supply. Vol.1, 43-50.
128. Roux, D.G. (1972) Review article: Recent advances in the chemistry and
chemical utilization of the natural condensed tannins. Phytochemistry.
Vol.11,1219-1230.
129. Quamme, J.E. and Kemp, A.H. (1985) Stable tannin based polymer
compound. United States Patent. No.4,558,080.
130. Hemingway, R. W. (1989) Structural variations in proanthocyanidins and
their derivatives. In: Hemingway, R.W., Karchesy, J. J., Branham, S. J.,

275
(Eds.), Chemistry and Significance of Condensed Tannins. Plenum Press,
New York, pp.83-107.
131. Ozacar, M. and Sengil, I. A. (2003) Evaluation of tannin biopolymer as a
coagulant aid for coagulation of colloidal particles. Colloids and
Surfaces. Vol. 229, 85-96.
132. Fife, J.G. (1962) Process for flocculating suspensions. British Patent.
No.899, 721, 27.
133. Pefferkorn, E. (2006) Clay and oxide destabilization induced by mixed
alum/macromolecular flocculation aids. Advances in Colloid and
Interface Science. Vol.120, 33-45.
134. Duan, J.M. and Gregory, J. (2003) Coagulation by hydrolyzing metal
salts. Advances in Colloid and Interface Science. Vol.100, 475-502.
135. Greenbery, A.E., Clesceri, L.S. and Eaton, A.D. (1992) Standard Methods
for the examination of water and wastewater, 4500-Cl- CHLORIDE B.
Argentometric titration .18th edition. APHA AWWA. Washington.
136. Duan, J.M. and Gregory, J. (1996) Influence of soluble silica on
coagulation by aluminium sulphate. Colloids and Surfaces A:
Physicochemical and Engineering Aspects. Vol.107, 309-319.
137. Watts, M. (2002) Evaluation and approval of tannin products for potable
water treatment - preliminary laboratory evaluation. WRc Report number:
UC 4081.

276
138. Greenbery, A.E., Clesceri, L.S. and Eaton, A.D. (1992) Standard Methods
for the examination of water and wastewater, 4500-Norg NITROGEN
(organic).18th edition. APHA AWWA. Washington.
139. Karaca, F., Islas, C.A., Millan, M., Behrouzi, M., Morgan, T.J., Herod,
A.A. and Kandiyoti, R. (2004) The calibration of size exclusion
chromatography columns: molecular mass distributions of heavy
hydrocarbon liquids. Energy and Fuels. Vol.18, 778-788.
140. Zimm, B. H. (1948) Apparatus and methods for measuring and
interpolation of the angular variation of light scattering preliminary
results on polystyrene solutions. J. Chemical Physics. Vol.16,1099.
141. Gregory, J., and Chung, H.J. (1995) Continuous monitoring of floc
properties in stirred suspensions. Water SRT – Aqua. Vol.44, 125-131.
142. Gregory, J. (1985) Turbidity fluctuations in flowing suspensions. J.
Colloid and Interface Science. Vol.105, 357.
143. AWWA. (2000) Operational Control of Coagulation and Filtration
Processes. Manual of Water Supply Practices-M37. 2nd Edition,
American Water Works Association, Denver, USA.
144. Greenbery, A.E., Clesceri, L.S. and Eaton, A.D. (1992) Standard Methods
for the examination of water and wastewater, 5550. TANNIN AND
LIGNIN.18th edition. APHA AWWA. Washington.
145. Gregory, J. (2007) Particles in water (properties and processes). CRC

277
Press Taylor & Francis Group. USA.
146. Prashanth, K.V.H. and Tharanathan, R.N. (2006) Crosslinked
chitosan—preparation and characterization. Carbohydrate Research.
Vol. 341, 169-173.
147. Payne GF, Chaubal MV, Barbari T. Enzyme-catalyzed polymer modification: reaction of phenolic compounds with chitosan films. Polymer. 1996;37:4643-4648.
148. Williams, D. H. and Fleming, I. (1996) Spectroscopic methods in organic
chemistry. Mc Graw-Hill Publishing Company Limited, London.
149. Huglin, M. B. (1972) Light scattering from polymer solutions. Academic
Press Inc Ltd, London.
150. Payne, G. F., Chaubal M. V. and Barbari, T. (1996) Enzyme-catalyzed
polymer modification: reaction of phenolic compounds with chitosan
films. Polymer. Vol.37, 4643-4648.
151. Nielsen, A.B., Frydenvang, K. and Liljefors, T. (2005) Assessment of the
combined approach of N-alkylation sand salt formation to enchance
aqueous solubility of tertiary amines using bupivacaine as a model drug.
Eur.J.Pham. Sci. Vol.24, 85-93.
152. Mitchell ,D.B., Minnis, R. L., Curran, T. P., Deboo, S.M., Kelly, J. A.,
Patwardhan, R. and Tai, W.T. (1998) Treatment of aqueous systems using
a chemically modified tannin. U.S. Patent No.5, 830, 315
153. Michaels, A. S. (1954) Aggregation of suspensions by polyelectrolytes,

278
Industrial and Engineering Chemistry. Vol. 46, 1485.
154. Dixon, J. K., La Mer, V. K., Messinger, S. and Linford, H.B. (1976) Effect
of the structure of cationic polymers on the flocculation and the
electrophpretic mobility of crystalline silica. J. Colloid and Interface
Science. Vol.23, 465.
155. Owen, A. T., Fawell, P. D., Swift, J.D. and Farrow, J.B.(2002) The impact
of polyacrylamide flocculant solution age on flocculation performance.
International Journal of Mineral Processing. Vol.67, 123-144.
156. Gregory, J. (2003) Monitoring floc formation and breakage. In;
Proceedings of the Nano and Micro Particles in Water and Wastewater
Treatment Conference. International Water Association, Zurich,
September.
157. Gregory, J. (1997) The density of particle aggregates. Water Science
Technology. Vol.36, 1-13.
158. Gregory, J. and Yukselen, M. A. (2004) The effect of rapid mixing on the
break-up and re-formation of flocs. Journal of Chemical Technology and
Biotechnology. Vol.79, 782-788.
159. Black, A. P., Birkner, F. B. and Morgan, J. J. (1966) The effect of polymer
adsorption on the electrokinetic stability of dilute clay suspensions.
J.Colloid and Interface Science. Vol.21, 626.
160. Gregory, J. (1978) “Flocculation by inorganic salts.” The scientific basis

279
of flocculation. Edited by Kenneth J.Ives. Sijthoff & Noordhoff
International Publishers, The Netherlands.
161. Stumm, W. and O’Melia, C. R. (1986) Chemical aspects of coagulation II
Stoichiometry of coagulation. Journal of American Water Works
association. Vol.60,514.
162. Yu, J., Sun, D. D. and Tay, J. H. (2003) Characteristics of
coagulation-flocculation of humic acid with effective performance of
polymeric flocculant and inorganic coagulant. Water Science and
Technology. Vol.47, 89-95.
163. Jackson, P.J. (1988) Studies of colour removal by coagulation. Rept.734-S.
Water Research Center, Stevenage, UK.
164. Amirtharajah, A. and Mills, K. M. (1982) Rapid-mix design for
mechanisms of alum coagulation. Journal of American Water Works
association. Vol.74, 210-216.
165. Holt, P. K., Barton, G. W., Wark, M. and Mitchell, C. A. (2002)
Aquantitative comparison between chemical dosing and
electrocoagulation. Colloids and Surfaces A: Physicochem.Eng. Vol.211,
233-248.
166. Stol, R.J., Van Helden, A. K. and Debruyn, P. L. (1976)
Hydrolysis-precipitation studies of aluminium solution. 2. A kinetic study
and model. J.Colloid and Interface Science. Vol.57,115.
167. McCOOK, N. J. and West, J.R. (1978) The coagulation of a kaolinite

280
suspension with aluminium sulphate. Water Reasearch. Vol. 12,
793-798.
168. Hanna, G. P. and Rubin, A. J. (1970) Effect of sulphate and other ions in
coagulation with aluminium. Journal of American Water Works
association. Vol. 54, 315-321.
169. Gupta, V. S., Bhattacharjya, S. K. and Dutta, B. K. (1975) Zeta-potential
control for alum coagulation. Journal of American Water Works
Association. Vol.63, 21-23.
170. Hall, E.S. and Packham, R.F. (1965) Coagulation of organic color with
hydrolyzing coagulants. Journal of American Water Works Association.
Vol.57,1149-1166.
171. DWI (2007) List of approved products and processes. Drinking Water
Inspectorate Regulation January 2007; The UK.
172. Semmens, M.J. and Field, T. K. (1980) Coagulation: experiences in
organics removal, Journal of American Water Works Association. Vol.72,
476-485.
173. Desjardins, C., Koudjonou, B. and Desjardins, R. (2002) Laboratory study
of ballasted flocculation. Water Research. Vol.36,744-754.
174. Parazak, D. P., Burkhardt, C.W., McCarthy, K. J. and Stehlin, M.P.(1988)
Hydrophoblic flocculation. J.Colloid and surface Science.Vol.123,59-72.
175. Divakaran, R. and Pillai, V.N.S. (2002) Flocculation of rive silt using

281
chitosan. Water Research. Vol.36, 2414-2418.
176. Magdassi, S., Kamyshny, A. and Baszkin, A. (2001) Interfacial properties
of hydrophobically modified biomolecules: fundamental aspects and
applications. J. Dispersion Science and Technology. Vol.22, 313–322.
177. Roussy, J., Van Vooren, M. and Guibal, E. (2004) Chitosan for the
coagulation and flocculation of mineral colloids. J. Dispersion Science
and Technology. Vol.25, 663–677.
178. Ghabbour, E.A. and Davies, G. (1999) Understanding Humic Substances:
advanced methods, properties and applications. Published by the Royal
Society of Chemistry. UK.
179. Schofield. P., Mbugua, D.M and Pell, A.N (2001) Review: Analysis of
condensed tannins: a review. Animal feed science and technology. Vol
91, 21-40.
180. Hernes.J.P., Benner. R., Cowie. G.L., Goni. M.A., Bergamaschi. B.A.
and Hedges, J.I. (2001) Tannin diagenesis in mangrove leaves from a
tropical estuary: A novel molecular approach. Pergamon. Vol.65,
3109-3122.
181. Ferreira D., Steynberg. J.P., Burger. J.F.W. and Bequidenhoudt.
B.C.B.(1992) Oxidation and rearrangement reactions of condensed
tannins. In Plant Polyphenols: Synthesis, Properties, Significance,
PP.349-384., Plenum Press, New York.
182. Shyluk, W. P. and Stow, F. S.(1969) Aging and loss of flocculation
activity of aqueous polyacrylamide solution. Journal of Applied Polymer

282
Science. Vol.13, 1023.
183. Gray, S.R. and Ritchie, C.B. (2006) Effect of organic polyelectrolyte
characteristics on floc strength. Colloids and Surfaces A:
Physicochem.Eng. Vol.273, 184-188.
184. Leentvaar, J. and Rebhun, M. (1982) Strength of ferric hydroxide flocs.
Water Research. Vol.17, 895-902.
185. Ammary, B. Y. and Cleasby, J.L. (2004) Effect of addition sequence on
dual coagulant performance. Journal of American Water Works
association. Vol. 96, 90-101.
186. Watts, M. (2004) Personal Communication.
187. Lamb, L.H. (2005) Personal Communication.

283
14. APPENDIX
APPENDIX I: Laboratory G Curve for Flat Paddle in 2L Gator Jar (143)
284
APPENDIX II: The specific refractive index increment (dn/dc) of TBP

285
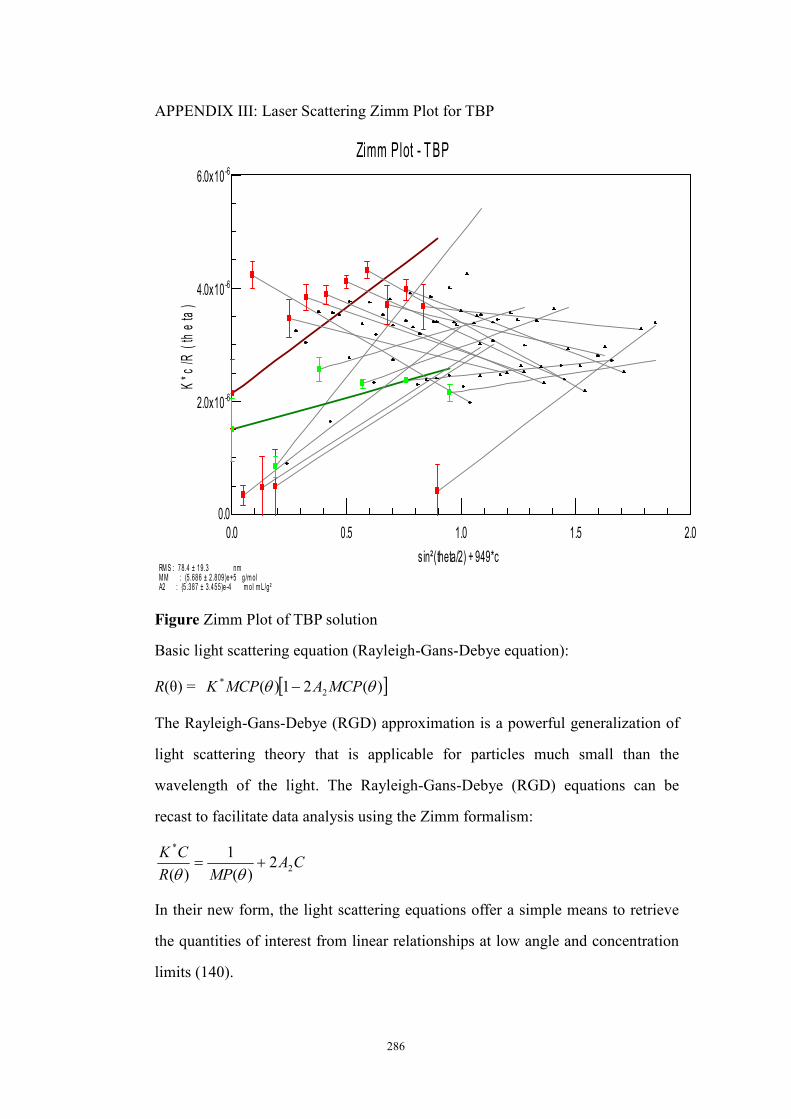
286
APPENDIX III: Laser Scattering Zimm Plot for TBP
0.0 0.5 1.0 1.5 2.0
0.0
-62.0x10
-64.0x10
-66.0x10
sin²(theta/2) + 949*c
K*c
/R(t
he
ta)
Zimm Plot - TBP
RMS : 78.4 ± 19.3 nmMM : (5 .686 ± 2.809)e+5 g /molA2 : (5 .387 ± 3.455)e-4 mol mL/g²
Figure Zimm Plot of TBP solution
Basic light scattering equation (Rayleigh-Gans-Debye equation):
R(θ) = [ ])(21)( 2* θθ MCPAMCPK −
The Rayleigh-Gans-Debye (RGD) approximation is a powerful generalization of
light scattering theory that is applicable for particles much small than the
wavelength of the light. The Rayleigh-Gans-Debye (RGD) equations can be
recast to facilitate data analysis using the Zimm formalism:
CAMPR
CK2
*
2)(
1
)(+=
θθ
In their new form, the light scattering equations offer a simple means to retrieve
the quantities of interest from linear relationships at low angle and concentration
limits (140).