Use of a Polymer Inclusion Membrane and a Chelating Resin ...
13
molecules Article Use of a Polymer Inclusion Membrane and a Chelating Resin for the Flow-Based Sequential Determination of Copper(II) and Zinc(II) in Natural Waters and Soil Leachates Tânia C. F. Ribas 1 , Charles F. Croft 2 , M. Inês G. S. Almeida 2 , Raquel B. R. Mesquita 1 , Spas D. Kolev 2 and António O. S. S. Rangel 1, * 1 CBQF—Centro de Biotecnologia e Química Fina—Laboratório Associado, Escola Superior de Biotecnologia, Universidade Católica Portuguesa, Rua Diogo Botelho 1327, 4169-005 Porto, Portugal; [email protected] (T.C.F.R.); [email protected] (R.B.R.M.) 2 School of Chemistry, University of Melbourne, Melbourne 3010, VIC, Australia; [email protected] (C.F.C.); [email protected] (M.I.G.S.A.); [email protected] (S.D.K.) * Correspondence: [email protected] Received: 4 September 2020; Accepted: 5 October 2020; Published: 31 October 2020 Abstract: A bi-parametric sequential injection method for the determination of copper(II) and zinc(II) when present together in aqueous samples was developed. This was achieved by using a non-specific colorimetric reagent (4-(2-pyridylazo)resorcinol, PAR) together with two ion-exchange polymeric materials to discriminate between the two metal ions. A polymer inclusion membrane (PIM) and a chelating resin (Chelex 100) were the chosen materials to retain zinc(II) and copper(II), respectively. The influence of the flow system parameters, such as composition of the reagent solutions, flow rates and standard/sample volume, on the method sensitivity were studied. The interference of several common metal ions was assessed, and no significant interferences were observed (<10% signal deviation). The limits of detection were 3.1 and 5.6 μgL -1 for copper(II) and zinc(II), respectively; the dynamic working range was from 10 to 40 μgL -1 for both analytes. The newly developed sequential injection analysis (SIA) system was applied to natural waters and soil leachates, and the results were in agreement with those obtained with the reference procedure. Keywords: bi-parametric method; sequential injection analysis; micronutrients; polymer inclusion membrane; Chelex 100 1. Introduction Sample preparation is considered an essential part of the analytical process. Some of the most commonly used sample pre-treatment methods are extraction techniques, namely solid-phase extraction (SPE), liquid–liquid extraction (LLE) and, more recently, membrane-based extraction techniques, among others [1]. The basic principles of both SPE and LLE can involve adsorption, partition or ion-exchange of solutes between the two different phases. In SPE, this occurs between a liquid phase (i.e., aqueous sample) and a solid phase (e.g., sorbent material), while, in LLE, this occurs between two immiscible liquid phases [2–5]. In recent years, these techniques have been evolving towards their miniaturization (i.e., solid-phase/liquid-phase microextraction), and different types of membranes have also been used as a support for organic phase in the microextraction process [1]. Separation techniques using solid resins or liquid membrane-based materials offer good selectivity, ease of operation, low use (or no use at all) of organic solvents, low cost, fast rates of analyte extraction Molecules 2020, 25, 5062; doi:10.3390/molecules25215062 www.mdpi.com/journal/molecules
-
Upload
khangminh22 -
Category
Documents
-
view
4 -
download
0
Transcript of Use of a Polymer Inclusion Membrane and a Chelating Resin ...

molecules
Article
Use of a Polymer Inclusion Membrane and aChelating Resin for the Flow-Based SequentialDetermination of Copper(II) and Zinc(II) in NaturalWaters and Soil Leachates
Tânia C. F. Ribas 1 , Charles F. Croft 2, M. Inês G. S. Almeida 2, Raquel B. R. Mesquita 1 ,Spas D. Kolev 2 and António O. S. S. Rangel 1,*
1 CBQF—Centro de Biotecnologia e Química Fina—Laboratório Associado, Escola Superior de Biotecnologia,Universidade Católica Portuguesa, Rua Diogo Botelho 1327, 4169-005 Porto, Portugal;[email protected] (T.C.F.R.); [email protected] (R.B.R.M.)
2 School of Chemistry, University of Melbourne, Melbourne 3010, VIC, Australia;[email protected] (C.F.C.); [email protected] (M.I.G.S.A.);[email protected] (S.D.K.)
* Correspondence: [email protected]
Received: 4 September 2020; Accepted: 5 October 2020; Published: 31 October 2020
Abstract: A bi-parametric sequential injection method for the determination of copper(II) and zinc(II)when present together in aqueous samples was developed. This was achieved by using a non-specificcolorimetric reagent (4-(2-pyridylazo)resorcinol, PAR) together with two ion-exchange polymericmaterials to discriminate between the two metal ions. A polymer inclusion membrane (PIM) and achelating resin (Chelex 100) were the chosen materials to retain zinc(II) and copper(II), respectively.The influence of the flow system parameters, such as composition of the reagent solutions, flowrates and standard/sample volume, on the method sensitivity were studied. The interference ofseveral common metal ions was assessed, and no significant interferences were observed (<10% signaldeviation). The limits of detection were 3.1 and 5.6 µg L−1 for copper(II) and zinc(II), respectively;the dynamic working range was from 10 to 40 µg L−1 for both analytes. The newly developedsequential injection analysis (SIA) system was applied to natural waters and soil leachates, and theresults were in agreement with those obtained with the reference procedure.
Keywords: bi-parametric method; sequential injection analysis; micronutrients; polymer inclusionmembrane; Chelex 100
1. Introduction
Sample preparation is considered an essential part of the analytical process. Some of themost commonly used sample pre-treatment methods are extraction techniques, namely solid-phaseextraction (SPE), liquid–liquid extraction (LLE) and, more recently, membrane-based extractiontechniques, among others [1].
The basic principles of both SPE and LLE can involve adsorption, partition or ion-exchangeof solutes between the two different phases. In SPE, this occurs between a liquid phase(i.e., aqueous sample) and a solid phase (e.g., sorbent material), while, in LLE, this occurs betweentwo immiscible liquid phases [2–5]. In recent years, these techniques have been evolving towardstheir miniaturization (i.e., solid-phase/liquid-phase microextraction), and different types of membraneshave also been used as a support for organic phase in the microextraction process [1].
Separation techniques using solid resins or liquid membrane-based materials offer good selectivity,ease of operation, low use (or no use at all) of organic solvents, low cost, fast rates of analyte extraction
Molecules 2020, 25, 5062; doi:10.3390/molecules25215062 www.mdpi.com/journal/molecules

Molecules 2020, 25, 5062 2 of 13
and the possibility of being reused [2,3,6]. These factors can be even more advantageous when thesetechniques are conducted in an on-line fashion as part of flow analysis methods. Therefore, these on-lineseparation techniques have gained high interest in the last decade [3,7].
In the present study, the strategy was to explore different polymeric materials to selectively separatecopper(II) and zinc(II) and subsequently use a color reagent able to produce a similar sensitivity to thedetermination of both metal ions. The chromogenic reagent selected was 4-(2-pyridylazo)resorcinol(PAR). PAR is a very commonly used chromogenic chelator for the spectrophotometric determinationof various metal ions [8]. This reagent was selected because it is water soluble and does not need theuse of organic solvents in the preparation of its solutions, unlike some chromogenic chelating agentsused for metals quantification [9].
According to previous work [9], Chelex 100 efficiently retains copper at pH of 2. Thus, Chelex 100was the chosen resin to avoid copper(II) interference in the zinc(II) determination. Chelex 100 resin isa styrene divinylbenzene copolymer, weakly acidic due to its carboxylic acid groups, thus allowingcation exchange. This sorbent material acts as chelating resin to bind metal ions and its selectivity isclosely related to the pH of the chelating process. Advantage was taken from this property to retainthe target analyte.
For the selective detection of zinc(II), a polymer inclusion membrane (PIM) was used [6,10].PIMs are considered as a type of liquid membranes which have attracted considerable attention inrecent years [11]. These membranes are usually fabricated by casting a solution containing an extractant,a base polymer, a plasticizer (if necessary) and a volatile solvent which dissolves all PIM components.After casting and evaporation of the volatile solvent a thin, flexible and stable polymeric film isformed. PIMs have the ability to selectively separate a species of interest depending on the extractantused [6]. Kolev et al. reported a PVC-based PIM with di-(2-ethylhexyl)phosphoric acid (D2EHPA) asthe extractant, capable of extracting Zn(II) selectively [12]. This PIM composition was thus chosen forthe zinc(II) extraction from the sample matrix, thus enabling the copper(II) determination.
The target analytes, copper(II) and zinc(II), are important micronutrients essential for the properfunctioning of living organisms, but both become toxic in high concentrations. The presence ofthese metal ions in ground and surface water are a direct result of using soil fertilizers or of otheranthropogenic activities influencing water quality. In this scenario, it is important to monitor these metalions in natural waters, as they act as pollution indicators. Some research has already been done for thedetermination of these two metal ions based on flow systems [9,13–19]. However, to accomplish bothdeterminations with a single sequential injection analysis (SIA) system, a mathematical discriminationtreatment of the experimental results had to be used [9,14–18], except for the system developed bySantos et al. [13]. A different approach is here proposed which involves the use of two on-line columnscontaining different ion-exchange polymeric materials for the bi-parametric determination of copper(II)and zinc(II) in natural waters and soil leachates.
2. Results and Discussion
2.1. Preliminary Studies
Two different colorimetric reagents for metal ions, namely PAR and 1-(2-pyridylazo)-2-naphthol(PAN), were initially studied via wet/bench chemistry, to determine which would be more advantageousfor the spectrophotometric quantification of both Cu(II) and Zn(II). Using the same conditions for bothreagents (1 mL of 0.1 mmol L−1 of reagent solution, 1 mL of 0.5 µg L−1 of metal solution and 1 mL of0.6 mmol L−1 of carbonate buffer solution at pH 10), a spectrum for each metal–reagent complex wasobtained (Figure S1). By assessing the wavelength of maximum absorption of both metal complexes,it was observed that the signal was higher for the metal–PAR complexes, therefore PAR was chosen asthe metal indicator to develop the SIA method. Additionally, PAR is water-soluble, which makes iteasier to use.

Molecules 2020, 25, 5062 3 of 13
2.2. Development of the SIA System
The development of the SIA system involved a number of optimization studies to assess theinfluence of some chemical and physical variables on the system’s analytical performance. As bothcomplexes of PAR, with copper(II) or zinc(II) showed similar sensitivity under the same conditions(concentration of PAR, metal and buffer), copper(II) was chosen as the model analyte to conductthe optimization of the colorimetric reaction in the SIA system. The parameters assessed were thevolumes of the PAR, sample and buffer solutions; the pH of the buffer solution; the reaction coil length;and the concentration of the PAR solution. These parameters were optimized in order to attain thehighest sensitivity (calibration curve slope), the lowest reagent consumption and the most effectivesampling rate.
2.2.1. Study of the Reaction Conditions
The first study carried out was on the PAR, sample and buffer solution volumes. Different volumesof PAR (250–350 µL), buffer (10–30 µL) and sample/standard (300–650 µL) solutions were studiedto evaluate their impact on the calibration curve parameters (Figure 1). The increase in the reagentvolume resulted in an increase of the intercept (≈15%) but no increase of sensitivity (calibration curveslope); thus, the lowest volume was selected to ensure minimal reagent consumption. The sensitivityincreased with increasing the buffer volume up to 20 µL, with almost no variation in the intercept(<5% variation). A similar behavior was observed for the sample volume, as the sensitivity increasedwith the increase in the sample volume up to 550 µL, but in this case the intercept decreased. For highersample volumes, the slope decreased slightly (≈10% variation) and the intercept increased slightly(≈10% variation).Molecules 2020, 25, x FOR PEER REVIEW 4 of 13
Figure 1. Study of the influence of the reagents (A,B) and sample (C) volumes on sensitivity expressed as the calibration curve slope (circles) and on the calibration curve intercept (squares). The chosen values are represented by solid-filled markers and the error bars represent the standard error.
2.2.2. Study of the Retention of Copper(II) and Zinc(II).
Since PAR is sensitive to both copper(II) and zinc(II), a dual-extraction approach was adopted in order to be able to determine both metal ions individually and sequentially. The strategy chosen for the selective copper(II) determination consisted of the use of a PVC-based PIM containing D2EHPA as the extractant to retain zinc(II). Some studies were conducted to maximize the on-line retention of zinc(II) in natural water samples into the PIM and consequently determine copper(II). As the PIM column was linked to one of the peripheral ports of the selection valve, direct aspiration of a standard, containing both copper(II) and zinc(II), through the column was attempted first; however, the retention was not efficient. Alternatively, with the aim to enhance the interaction between the solution and the PIM, the standard was aspirated from another port of the selection valve to the holding coil of the SIA system, subsequently propelled through the column and aspirated back to the holding coil. Using this approach, two experiments were conducted. In the first one, the standard was propelled through the PIM column, followed by the sequential aspiration of PAR reagent, buffer solution and Zn(II)-free standard into the holding coil. After flow reversal, the stack of solution zones in the holding coil were propelled towards the detector. In the second experiment, a similar procedure was adopted except that the flow was stopped for 5 s when the standard zone was in the PIM column. No significant difference in the maximum absorbance signals was observed between the two experiments; thus, to further improve the retention of zinc(II), the procedure involving propelling and aspirating the standard zone through the PIM column was conducted twice (Figure S2A). This retention procedure was thus the chosen approach for further optimization.
According to Paluch et al. [9], copper(II) can be retained in a column packed with Chelex 100 resin at pH of 2. Hence, for the selective zinc(II) determination, this was the strategy chosen to eliminate the interference of copper(II). A packed column was linked to one of the peripheral ports
Figure 1. Study of the influence of the reagents (A,B) and sample (C) volumes on sensitivity expressedas the calibration curve slope (circles) and on the calibration curve intercept (squares). The chosenvalues are represented by solid-filled markers and the error bars represent the standard error.

Molecules 2020, 25, 5062 4 of 13
The chosen volumes were 250 µL for PAR, 20 µL for the buffer and 550 µL for the sample/standardsolutions, as this combination displayed the highest slope and lowest intercept values for thecalibration curve, indicating better reaction sensitivity with potentially lower detection limits forboth determinations.
The reaction PTFE coil length was initially kept to a minimum (10 cm) allowing to physicallyconnect the central port of the selection valve to the flow cell. As there was no significant difference(<10%) in the absorbance signal when the coil length was increased to 20 cm, the 10-cm length wasused in the remaining experiments.
The influence of the buffer solution composition and pH was studied by comparing the sensitivityobtained when using a boric acid buffer (0.5 mol L−1) or a carbonate buffer (0.6 mol L−1). Both buffersolutions were tested at two different pH values: 10 or 11. No significant differences were observed(<5% sensitivity) between the boric acid buffer at pH 10 and 11 and the carbonate buffers at pH 10.However, with the use of the carbonate buffer, air bubbles were formed inside the tubing of the flowsystem. Additionally, when the carbonate buffer at pH 11 was used, poor repeatability of the signalwas obtained. Hence, the chosen buffer solution was the boric acid solution at pH 11.
The influence of the PAR reagent concentration was also evaluated and the concentration of25 µmol L−1 was chosen from the tested values (10, 25, 50 and 100 µmol L−1). When the concentrationwas increased above 25 µmol L−1, no significant variation (<10%) of the calibration curve slope wasobserved; the chosen concentration also produced a lower intercept value.
2.2.2. Study of the Retention of Copper(II) and Zinc(II).
Since PAR is sensitive to both copper(II) and zinc(II), a dual-extraction approach was adopted inorder to be able to determine both metal ions individually and sequentially. The strategy chosen forthe selective copper(II) determination consisted of the use of a PVC-based PIM containing D2EHPAas the extractant to retain zinc(II). Some studies were conducted to maximize the on-line retentionof zinc(II) in natural water samples into the PIM and consequently determine copper(II). As the PIMcolumn was linked to one of the peripheral ports of the selection valve, direct aspiration of a standard,containing both copper(II) and zinc(II), through the column was attempted first; however, the retentionwas not efficient. Alternatively, with the aim to enhance the interaction between the solution and thePIM, the standard was aspirated from another port of the selection valve to the holding coil of the SIAsystem, subsequently propelled through the column and aspirated back to the holding coil. Using thisapproach, two experiments were conducted. In the first one, the standard was propelled through thePIM column, followed by the sequential aspiration of PAR reagent, buffer solution and Zn(II)-freestandard into the holding coil. After flow reversal, the stack of solution zones in the holding coil werepropelled towards the detector. In the second experiment, a similar procedure was adopted except thatthe flow was stopped for 5 s when the standard zone was in the PIM column. No significant differencein the maximum absorbance signals was observed between the two experiments; thus, to furtherimprove the retention of zinc(II), the procedure involving propelling and aspirating the standard zonethrough the PIM column was conducted twice (Figure S2A). This retention procedure was thus thechosen approach for further optimization.
According to Paluch et al. [9], copper(II) can be retained in a column packed with Chelex 100 resinat pH of 2. Hence, for the selective zinc(II) determination, this was the strategy chosen to eliminatethe interference of copper(II). A packed column was linked to one of the peripheral ports of theselection valve, through which the standard/sample was directly aspirated towards the holding coil,thus retaining any copper(II) present in the original standard/sample (Figure S2B).
2.3. Interference Studies
Being a non-specific chromogenic reagent, PAR forms an orange complex with a variety of differentmetal ions and, thus, the potential interference from other metal ions was assessed. The ions that can bepresent in natural water samples and thus interfere with the proposed analytical method are described

Molecules 2020, 25, 5062 5 of 13
in Table 1. The selected concentrations for each ion corresponded to the maximum concentration thatcan be expected in environmental waters [20]. The obtained absorbance of a standard with and withoutthe possible interfering ion was measured and the interference percentage calculated (Table 1).
Table 1. Interference study of metal ions ([Mn+]) commonly present in environmental waters at theirmaximum expected concentrations ([Mn+]max) [20]. SD, Standard deviation (n = 3).
Tested Ion[Mn+]max inStreams,µg L−1
Tested[Mn+],µg L−1
Interference inCu(II)Determination,%
SD
Interference inZn(II)Determination,%
SD
Al3+ 400 400 −1.0 1.0 −1.3 0.9Ca2+ 15000 15000 1.0 1.0 −3.6 2.0Co2+ 0.2 10 1.6 0.1 1.5 0.1Cu2+ <12 40 - - 2.5 0.7
Fe3+ 700 400200
14.98.2
2.81.3
8.5-
0.3-
Mg2+ 4000 50002500
3.1-
2.6-
35.8−4.3
5.83.0
Mn2+ 7 50 4.3 3.0 1.4 0.3Ni2+ 1 50 4.5 1.8 1.2 0.4Zn2+ 20 40 5.1 2.1 - -
The only interferences above 10% were from iron(III) and magnesium(II); however, values above400 µg L−1 Fe(III) are not usually found in environmental waters, and the tested magnesiumconcentration was above the expected values. The interference from iron(III) has been previousreported and could be eliminated by precipitation with phosphate prior to the analysis [12].
2.4. Features
The features of the newly developed SIA method for the bi-parametric determination of copper(II)and zinc(II) are summarized in Table 2.
Table 2. Calibration curves and dynamic concentration ranges for copper(II) and zinc(II) and theirrespective limits of detection (LOD). A, absorbance; SD, standard deviation; M2+, metal ion.
Metal Ion Dynamic Range(µg L−1)
Calibration Curve a
A = (Slope ± SD) [M2+] + Intercept ± SDLOD(µg L−1)
RSD (%)
Copper(II) 10.0–40.0 A = (9.00 × 10⁻⁴± 1.00 × 10⁻⁴) [Cu2+] +
0.112 ± 0.0073.1 2.0
Zinc(II) 10.0–40.0 A = (1.80 × 10⁻³± 1.0 × 10⁻⁴) [Zn2+] +
0.099 ± 0.0035.6 1.3
RSD, relative standard deviation; a n = 3.
The limits of detection were calculated according to the IUPAC recommendations as theconcentration corresponding to the sum of three times the standard deviation to the mean value of tenconsecutive blank solution measurements [21,22].
The relative standard deviation (RSD) for Cu(II) and Zn(II) determination was calculated withtwelve replicate analysis (four consecutive cycles) of a standard with 20 µg L−1 of each metal ion.
A complete cycle, which includes three replicates for each determination and the washing of thePIM column at the end, has the duration of 10 min. The corresponding PAR, sodium hydroxide andboric acid consumption per cycle is 8.1 µg, 1.4 mg and 5.6 mg, respectively.
Molecules 2020, 25, 5062 6 of 13
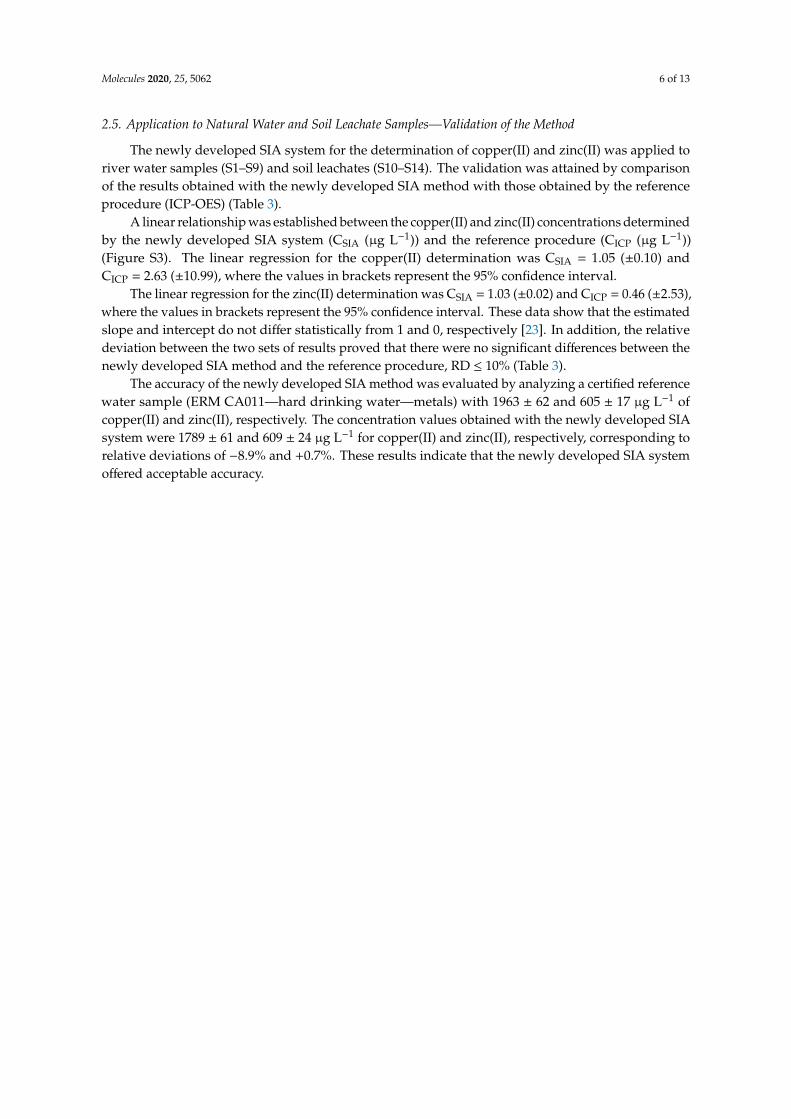
2.5. Application to Natural Water and Soil Leachate Samples—Validation of the Method
The newly developed SIA system for the determination of copper(II) and zinc(II) was applied toriver water samples (S1–S9) and soil leachates (S10–S14). The validation was attained by comparisonof the results obtained with the newly developed SIA method with those obtained by the referenceprocedure (ICP-OES) (Table 3).
A linear relationship was established between the copper(II) and zinc(II) concentrations determinedby the newly developed SIA system (CSIA (µg L−1)) and the reference procedure (CICP (µg L−1))(Figure S3). The linear regression for the copper(II) determination was CSIA = 1.05 (±0.10) andCICP = 2.63 (±10.99), where the values in brackets represent the 95% confidence interval.
The linear regression for the zinc(II) determination was CSIA = 1.03 (±0.02) and CICP = 0.46 (±2.53),where the values in brackets represent the 95% confidence interval. These data show that the estimatedslope and intercept do not differ statistically from 1 and 0, respectively [23]. In addition, the relativedeviation between the two sets of results proved that there were no significant differences between thenewly developed SIA method and the reference procedure, RD ≤ 10% (Table 3).
The accuracy of the newly developed SIA method was evaluated by analyzing a certified referencewater sample (ERM CA011—hard drinking water—metals) with 1963 ± 62 and 605 ± 17 µg L−1 ofcopper(II) and zinc(II), respectively. The concentration values obtained with the newly developed SIAsystem were 1789 ± 61 and 609 ± 24 µg L−1 for copper(II) and zinc(II), respectively, corresponding torelative deviations of −8.9% and +0.7%. These results indicate that the newly developed SIA systemoffered acceptable accuracy.

Molecules 2020, 25, 5062 7 of 13
Table 3. Comparison of the results obtained with the newly developed SIA system for copper(II) and zinc(II) determination (three replicates) with those obtained withICP-OES (two replicates). S1–S9, river water samples; S10–S14, soil leachate samples; SD, standard deviation; RD, Relative deviation.
Sample IDCopper(II) Zinc(II)SIA ICP SIA ICP[Cu2+] µg L−1 SD [Cu2+] µg L−1 SD RD % [Zn2+] µg L−1 SD [Zn2+] µg L−1 SD RD %
S1 * 14.9 1.2 14.3 0.1 +3.7 22.8 2.4 21.6 0.3 +5.4S2 * 19.5 2.6 20.6 0.3 −5.8 20.1 0.9 19.3 0.3 +3.9S3 * 22.8 1.8 20.8 0.3 +6.4 31.4 3.0 33.5 0.4 −6.5S4 197 8 183 3 +7.6 <LOD - <LOD - -S5 140 8 143 2 −2.3 <LOD - <LOD - -S6 107 5 114 2 −6.4 <LOD - <LOD - -S7 72.2 4.1 74 3 −2.4 <LOD - <LOD - -S8 156 10 143 5 +9.3 <LOD - <LOD - -S9 <LOD - <LOD - - <LOD - <LOD - -S10 <LOD - 2.08 0.1 - 15.2 2.0 14.9 0.2 +2.0S11 <LOD - 2.71 0.1 - 14.3 1.6 14.6 0.3 −2.0S12 <LOD - <LOD - - 340 12 332 3 +2.5S13 <LOD - <LOD - - 32.9 3.5 33.2 0.3 −0.9S14 <LOD - 0.58 0.1 - 203 3 193 3 +4.9
* Samples spiked with zinc(II).

Molecules 2020, 25, 5062 8 of 13
3. Materials and Methods
3.1. Reagents and Solutions
All solutions were prepared with analytical grade chemicals and MilliQ water (resistivity > 18 MΩcm,Millipore, Burlington, MA, USA).
A stock solution of 50.0 mg L−1 of copper(II) and zinc(II) were prepared by dilution of the respective1000 mg L−1 atomic absorption standard solutions (Spectrosol, Poole, England). An intermediatesolution of 500 µg L−1 of each metal solution was prepared by dilution of a 50.0 mg L−1 stock solution.Working standards, in the range 10–40 µg L−1 in 0.01 mol L−1 of nitric acid, were prepared weekly bydilution of a 500 µg L−1 intermediate solution with a 0.01 mol L−1 nitric acid solution.
A 0.01 mol L−1 nitric acid solution was prepared by dilution of the commercial concentrated nitricacid solution (d = 1.39; 65%, Merck; Darmstadt, Germany).
A buffer solution of 0.50 mol L−1 boric acid was prepared by dissolution of the solid (H3BO3,Aldrich, Germany) in a solution of 0.2 mol L−1 NaOH (Panreac, Chicago, IL, USA), with the final pHadjusted to 11.0 with a sodium hydroxide solution.
A 2 mmol L−1 stock solution of PAR (C11H8N3NaO2·H2O, Sigma-Aldrich, St Louis, MO, USA)was prepared by dissolving the corresponding quantity of the monosodium salt hydrate in water.A PAR reagent solution of 25 µmol L−1 was prepared weekly by dilution of the stock solution withMilliQ water.
3.2. Preparation of the PIM Column
PIMs were produced by dissolving a mixture of 8.25 g of PVC and 6.75 g of D2EHPA in 165 mL oftetrahydrofuran (THF). Approximately 2.75 mL of this solution was cast into a glass ring with a 76-mmdiameter which was positioned on a flat glass plate. All rings were covered with filter paper, a glassplate and a foil tray to control the evaporation of THF that was completed within a period of 48–72 h.The resulting PIM composition was 45 wt % D2EHPA and 55 wt % PVC.
PIMs were subsequently cut into strips of approximately 2 mm in width. A laboratory madecolumn (5.5 cm length of Versilon 2001 tubing with 4.8 mm i.d.) was packed with the PIM stripes(approximately 100 mg) between two female Luer Tefzel connectors (P-624; Thermo Scientific, Waltham,MA, USA). The column was connected to one of the ports of the selection valve of the SIA systemutilized in this study and subsequently used for zinc(II) retention.
Two columns were prepared and used along the method development and application to thesample analyses. This occurred for about four months for each column, without noticing significantdeterioration on their performance.
3.3. Preparation of the Chelex 100 Column
A laboratory made column with 25 mm in length of Tygon tubing (Gilson, Villiers-le-Bel, France)with 1.85 mm i.d. and 67 µL inner volume was used to pack the chelating resin. Approximately75 mg of Chelex 100 (mesh 200–400, Bio-Rad, Hercules, CA, USA), previously suspended in water,was introduced into the column between two pieces of dishwashing sponge. The column was connectedto one of the ports of the SIA selection valve and used for copper retention.
One column was prepared and used throughout the entire method development, correspondingto approximately eight months, displaying a consistent performance.
3.4. Apparatus
Solutions were propelled in the experimental SIA system (Figure 2) by a syringe pump with a5 mL barrel (Crison, Barcelona, Spain). The pump was connected to the central channel of a ten-portelectrically actuated selection valve (Valco VICI Cheminert C25-3180D 06B–0699C, Houston, TX,USA) with a polytetrafluoroethylene (PTFE) tubing. PTFE tubing (0.8 mm i.d., Omnifit, Cambridge,UK) connected all the components of the SIA system. The syringe pump and the selection valve

Molecules 2020, 25, 5062 9 of 13
were controlled by AutoAnalysis Station 5.0 computer software (Sciware, Balearic Islands, Spain).As detection system consisted of an Ocean Optics (Orlando, FL, USA) USB 4000 charged coupleddevice detector (CCD) equipped with a pair of 600 mm optical cables, a Mikropack DH-2000-BALdeuterium halogen light source and an Ultem® flow cell (SMA-Z-50 cell) with 50-mm optical path(130 µL inner volume).
Molecules 2020, 25, x FOR PEER REVIEW 9 of 13
At the end of the cycle, the PIM column was washed and reconditioned with 0.5 molL−1 nitric acid (Port R3) and ultrapure water (carrier solution), sequentially.
Each absorbance value was calculated as the difference between the absorbances at 490 nm (wavelength of maximum absorption) and 800 nm; this subtraction aimed at minimizing the schlieren effect [24].
Figure 2. Flow manifold for Cu(II) and Zn(II) determination in waters and soil leachates. St/S, standard solution or sample; R1, PAR reagent (25 µmol L−1); R2, boric acid buffer solution (pH 11); R3– nitric acid solution (0.5 mol L−1); C1, PIM column; C2, Chelex 100 resin column; P, syringe pump; SV, selection valve; HC, holding coil (300 cm); RC, reaction coil (10 cm); D, CCD detector; L, light source; FC, Z flow cell (50-mm path length); W, waste.
Table 4. Experimental protocol for the copper(II) and zinc(II) determination.
Step Selection Valve Position
Volume (mL)
Flow-Rate (mLmin−1)
Description
Preliminary steps before starting consecutive cycles
5.000 - Syringe reset position—syringe filled with carrier
1.000 5.000 Propel carrier (water) to waste A 1 0.250 3.529 Aspirate PAR solution B 2 0.020 3.529 Aspirate boric acid buffer solution
C 5 0.550 2.000 Aspirate standard/sample through the Chelex 100 column to eliminate Cu(II) interference
D 10 2.100 3.529 Propel through the spectrometer flow cell for Zn(II) quantification
Fill the syringe with carrier E 3 0.550 2.000 Aspirate standard/sample
F 4 0.600 2.000 Propel through the PIM column to eliminate Zn(II) interference by retaining Zn(II)
G 4 0.250 2.000 Aspirate standard/sample through the PIM column to promote retention of Zn(II)
Figure 2. Flow manifold for Cu(II) and Zn(II) determination in waters and soil leachates. St/S, standardsolution or sample; R1, PAR reagent (25 µmol L−1); R2, boric acid buffer solution (pH 11); R3– nitric acidsolution (0.5 mol L−1); C1, PIM column; C2, Chelex 100 resin column; P, syringe pump; SV, selectionvalve; HC, holding coil (300 cm); RC, reaction coil (10 cm); D, CCD detector; L, light source; FC, Z flowcell (50-mm path length); W, waste.
3.5. Flow Manifold and Procedure
The sequence of steps for the determination of copper(II) and zinc(II) is shown in Table 4. It wasdivided in two parts, one corresponding to the Zn(II) determination using solid-phase extraction forthe removal of Cu(II) and the other to the Cu(II) determination using PIM-based extraction to retainZn(II). For the Zn(II) determination (Steps A–D, Table 4), reagent (Port 1, Figure 2), buffer (Port 2) andsample/standard (Port 5) were sequentially aspirated into the holding coil (HC). The sample/standardwas aspirated through the Chelex 100 column (C2) via Port 5. Then, the staked zones were propelledto the flow cell (FC) where the absorbance was continuously monitored at 490 nm corresponding to theabsorption maximum of the Zn(II)-PAR colored complex. For the Cu(II) determination (Steps E–M,Table 4), sample/standard was aspirated to the holding coil via Port 3, and then propelled through thePIM column (C1) to eliminate possible Zn(II) interference (Steps E and F). After passing through thePIM column, the flow was reversed twice to promote Zn(II) retention. After this procedure, reagent(Port 1), buffer (Port 2) and the Zn(II) free sample/standard (Port 1) were aspirated into the holding coil(HC). Then, these three zones were propelled to the flow cell (FC) for absorbance measurement of theCu(II)-PAR colored complex at 490 nm.

Molecules 2020, 25, 5062 10 of 13
Table 4. Experimental protocol for the copper(II) and zinc(II) determination.
Step Selection ValvePosition
Volume(mL)
Flow-Rate(mL min−1)
Description
Preliminary steps beforestarting consecutive cycles
5.000 - Syringe reset position—syringe filled with carrier1.000 5.000 Propel carrier (water) to waste
A 1 0.250 3.529 Aspirate PAR solutionB 2 0.020 3.529 Aspirate boric acid buffer solution
C 5 0.550 2.000 Aspirate standard/sample through the Chelex 100column to eliminate Cu(II) interference
D 10 2.100 3.529 Propel through the spectrometer flow cell for Zn(II)quantification
Fill the syringe with carrier
E 3 0.550 2.000 Aspirate standard/sample
F 4 0.600 2.000 Propel through the PIM column to eliminate Zn(II)interference by retaining Zn(II)
G 4 0.250 2.000 Aspirate standard/sample through the PIM columnto promote retention of Zn(II)
H 4 0.250 2.000 Propel standard/sample through the PIM column topromote retention of Zn(II)
I 9 0.250 3.529 Dispense to waste the left residues in the holding coilJ 1 0.250 3.529 Aspirate PAR solutionK 2 0.020 3.529 Aspirate boric acid buffer solutionL 4 0.550 2.000 Aspirate Zn(II) free standard/sample solution
M 10 2.100 3.529 Propel through the spectrometer flow cell for Cu(II)quantification
Fill the syringe with carrier
R 7 0.500 5.000 Aspirate HNO3 solutionS 4 1.500 5.000 Propel through the PIM column—cleaning step
At the end of the cycle, the PIM column was washed and reconditioned with 0.5 mol L−1 nitricacid (Port R3) and ultrapure water (carrier solution), sequentially.
Each absorbance value was calculated as the difference between the absorbances at 490 nm(wavelength of maximum absorption) and 800 nm; this subtraction aimed at minimizing the schliereneffect [24].
3.6. Sample Collection and Preparation
3.6.1. Water Samples
River water samples (S1–S9) from various locations in the Porto area were collected, filtered(Acrodisc 25 mm syringe filters, 0.45 µm, Pall, USA) and acidified to pH 2 with nitric acid, according tothe reference procedure [20]. Samples were kept refrigerated at 4 C until analysis.
When copper(II) concentration was above 40 µg L−1, the water samples were diluted in orderto fit the respective linear working range. In some samples, the zinc(II) concentration was below thedetection limit, in which case the samples were spiked with zinc(II) (samples S1–S3).
3.6.2. Soil Leachates Samples
The soil samples were collected in the northwest of Portugal using an acrylic cylinder that waspushed into the ground to collect a superficial soil core (about 20 cm depth). Two soil cores were collected.A commercial fertilizer was applied to the soil columns following the manufactured instructions.
To simulate the soil leaching process naturally occurring in the field, rain simulations wereperformed by passing 50 mL of previously collected rainwater (pH ≈6.6; conductivity ≈8.4 µS cm−1)through each soil core. Both the collected rainwater and the obtained leachates were filtered (Acrodisc25 mm syringe filters, 0.45 µm, Pall, New York, NY, USA) and acidified to pH 2 with nitric acid.
Several simulations of rain were performed (for 5 consecutive days) and the soil leachates werecollected. Samples were kept refrigerated until analysis. The soil leachates samples (S9–S14) were

Molecules 2020, 25, 5062 11 of 13
diluted when zinc(II) concentrations were above 40 µg L−1, in order to fit in the linear range of thezinc(II) calibration.
3.7. Reference Procedure
For validation purposes, the determinations of Cu(II) and Zn(II) in soil leachates and naturalwaters were carried out by inductively coupled plasma–optical emission spectrometry, ICP-OES(Perkin Elmer Optima 7000 dv, USA), and the results were compared with those obtained with thenewly developed SIA method.
Additionally, the SIA system developed for the quantification of Cu(II) and Zn(II) was applied tothe analysis of a certified water sample, ERM-CA011 (hard drinking water, LGC, Teddington, UK).The certified water sample was diluted in a multi-step fashion so that its concentration would fit withinthe linear range of the corresponding calibration curves.
4. Conclusions
With the aim of directly and individually quantifying copper(II) and zinc(II) with the same colorreagent, two polymeric materials, namely a PIM and Chelex 100, packed in columns, were efficientlyused. To the authors best knowledge, this was the first time that a PIM was used with this objective ofon-line retaining and eliminating interferences from a sample. PVC-based PIMs containing D2EHPAproved to be efficient in retaining zinc(II), allowing for the quantification of copper(II). Chelex 100 wasthe polymeric material used to retain copper(II) at pH 2.0, as has already been reported in previousstudies [9]. Zinc(II) was not retained at this pH, thus allowing for its quantification to be performedfree of copper(II) interference.
Some flow-based methodologies have been previously developed [9,13,14,16–19] for thedetermination of these two metals in water samples using various chromogenic reagents (Table 5).Unlike these methods, the newly developed SIA system can determine copper(II) and zinc(II)individually and directly using a single manifold with the use of a single colorimetric reaction(PAR-Metal), thus reducing the time required per analysis while offering similar and in some casesbetter sensitivity. For example, the Zincon–Metal approach does not allow individual determination ofthe two metal ions [14,16–18].
Table 5. Analytical features of flow-based systems developed for copper(II) and zinc(II)spectrophotometric determination in water samples (presented in descending chronological order).
System SampleSampleVolume
(µL)SPE Reagent
SampleThroughput
(h−1)
LOD(µg L−1)
Ref.
SIA Naturalwaters 550 PIM and
Chelex 100 PAR 6 Cu, 3.1Zn, 5.6 This work
SIA Water and soilleachates 413 Chelex 100 PAN 3 Cu, 3.0
Zn, 1.4 [9]
µSI-LOV Freshwaters 600 NTA Dithizone Cu, 15Zn, 13
Cu, 0.11Zn, 2.39 [13]
SIC Water 90 - PAR 9 Cu, 13Zn, 13 [19]
MSFIA Waters 400 - Zincon 43 Cu, 0.1Zn, 2 [14]
SIA Water samples 150 - Zincon 36 Cu, 48Zn, 13 [17]
BIS-FIAWaters,
pharmaceuticalsand soils
1000 SephadexQAE A-25 Zincon 15 Cu, 29
Zn, 40 [16]
FIA Water andbrass Chelex 100 Zincon 70 Cu, 800
Zn, 350 [18]
SPE, solid phase extraction; LOD, limit of detection; Ref., Reference; SIA, sequential injection analysis; PIM, polymerinclusion membrane; PAR, 4-(2-pyridylazo)resorcinol; PAN, 1-(2-pyridilazo)-2-naphtol; µSI-LOV, micro sequentialinjection-lab-on-valve; SIC, sequential injection chromatography; MSFIA, multi-syringe injection analysis; BIS-FIA,bead injection spectrometry-flow injection analysis; FIA, flow injection analysis.

Molecules 2020, 25, 5062 12 of 13
The use of PAR as chromogenic reagent, instead of other reagents used by other authors(e.g., dithizone and PAN) [9,13], displays some advantages: PAR is considered a non-hazardoussubstance, unlike dithizone that is considered an eye and skin irritant according to European regulations(EC) [25]. PAR is also a water-soluble reagent and thus does not need the use of organic solvents inits preparation.
Overall, with the developed flow system, it is possible to attain in about 10 min the determinationof copper(II) and zinc(II) individual content in natural waters, involving relatively low cost andportable equipment and minimizing the consumption of reagents.
Supplementary Materials: The following are available online. Figure S1: Spectra of the colour metal complexeswith PAR (A) and PAN (B); spectra of the blank (reagent in milliQ water) (blue lines), Cu(II)-PAR/PAN complex(yellow lines) and Zn(II)-PAR/PAN complex (green lines); PAR/PAN concentration of 0.1 mmol L−1; metal ionconcentration of 0.5 µg L−1; and carbonate buffer (0.6 mmol L−1) solution at pH = 10, Figure S2: Study of the effectof the PIM column (A) and the Chelex column (B) on the calibration curves of zinc(II) and copper(II): (A) directzinc(II) calibration curve without (blue) and with (orange) using a PIM; and (B) calibration curve with mixedstandards of copper(II) and zinc(II) aspirated through the Chelex column (green) and without going throughthe Chelex column (grey) and calibration curve with zinc(II) standards with (yellow) and without (blue) usinga Chelex column, Figure S3: Comparison of the results obtained with the newly developed SIA system andthose obtained with a reference method (ICP-OES): (A) copper(II) determination; and (B) zinc(II) determination.The lines represent the linear relationship between the two methods.
Author Contributions: Conceptualization, R.B.R.M., S.D.K. and A.O.S.S.R.; methodology, T.C.F.R., C.F.C.,M.I.G.S.A. and R.B.R.M.; validation, T.C.F.R.; formal analysis, T.C.F.R. and R.B.R.M.; investigation, T.C.F.R. andC.F.C.; resources, S.D.K. and A.O.S.S.R.; writing—original draft preparation, T.C.F.R.; writing—review and editing,M.I.G.S.A., R.B.R.M., S.D.K. and A.O.S.S.R.; supervision, M.I.G.S.A., R.B.R.M., S.D.K. and A.O.S.S.R.; projectadministration, S.D.K. and A.O.S.S.R.; and funding acquisition, S.D.K. and A.O.S.S.R. All authors have read andagreed to the published version of the manuscript.
Funding: This work was funded by FEDER through project reference POCI-01-0145-FEDER-031522 (ProgramaOperacional Competitividade e Internacionalização) and by National Funds from FCT (Fundação para a Ciência eTecnologia); scientific collaboration from FCT projects PTDC/AAG-MAA/5887/2014 and UID/Multi/50016/2019 isalso acknowledged. T.C.F.R. thanks FEDER and FCT for the grant PTDC/CTA-OHR/31522/2017_BI_1.
Conflicts of Interest: The authors declare no conflict of interest.
References
1. Carasek, E.; Merib, J. Membrane-Based Microextraction Techniques in Analytical Chemistry: A Review.Anal. Chim. Acta 2015, 880, 8–25. [CrossRef] [PubMed]
2. Camel, V. Solid Phase Extraction of Trace Elements. Spectrochim. Acta Part B At. Spectrosc. 2003, 58, 1177–1233.[CrossRef]
3. Calderilla, C.; Maya, F.; Leal, L.O.; Cerdà, V. Recent Advances in Flow-Based Automated Solid-PhaseExtraction. TrAC Trends Anal. Chem. 2018, 108, 370–380. [CrossRef]
4. Płotka-Wasylka, J.; Szczepanska, N.; De La Guardia, M.; Namiesnik, J. Miniaturized Solid-Phase ExtractionTechniques. TrAC Trends Anal. Chem. 2015, 73, 19–38. [CrossRef]
5. Ribas, T.C.; Tóth, I.V.; Rangel, A.O. A Solid Phase Extraction Flow Injection Spectrophotometric Method forthe Zinc Determination in Plants. Microchem. J. 2017, 130, 366–370. [CrossRef]
6. Nghiem, L.D.; Mornane, P.; Potter, I.D.; Perera, J.M.; Cattrall, R.W.; Kolev, S.D. Extraction and Transportof Metal Ions and Small Organic Compounds Using Polymer Inclusion Membranes (PIMs). J. Membr. Sci.2006, 281, 7–41. [CrossRef]
7. Almeida, M.I.G.S.; Cattrall, R.W.; Kolev, S.D. Polymer Inclusion Membranes (PIMs) in ChemicalAnalysis—A Review. Anal. Chim. Acta 2017, 987, 1–14. [CrossRef]
8. Ohyoshi, E. Relative Stabilities of Metal Complexes of 4-(2-pyridylazo)resorcinol and 4-(2-thiazolylazo)resorcinol. Polyhedron 1986, 5, 1165–1170. [CrossRef]
9. Paluch, J.; Mesquita, R.B.; Cerdà, V.; Kozak, J.; Wieczorek, M.; Rangel, A.O. Sequential Injection SystemWith in-Line Solid Phase Extraction and Soil Mini-Column for Determination of Zinc and Copper in SoilLeachates. Talanta 2018, 185, 316–323. [CrossRef]
10. Almeida, M.I.G.; Cattrall, R.W.; Kolev, S.D. Recent Trends in Extraction and Transport of Metal Ions UsingPolymer Inclusion Membranes (PIMs). J. Membr. Sci. 2012, 9–23. [CrossRef]

Molecules 2020, 25, 5062 13 of 13
11. Kuswandi, B.; Nitti, F.; Almeida, M.I.G.S.; Kolev, S.D. Water Monitoring Using Polymer Inclusion Membranes:A Review. Environ. Chem. Lett. 2019, 18, 129–150. [CrossRef]
12. Kolev, S.D.; Baba, Y.; Cattrall, R.W.; Tasaki, T.; Pereira, N.; Perera, J.M.; Stevens, G.W. Solid Phase Extraction ofZinc(II) Using a PVC-Based Polymer Inclusion Membrane with Di(2-ethylhexyl)phosphoric Acid (D2EHPA)as the Carrier. Talanta 2009, 78, 795–799. [CrossRef] [PubMed]
13. Santos, I.C.; Mesquita, R.B.; Rangel, A.O. Micro Solid Phase Spectrophotometry in a Sequential InjectionLab-on-Valve Platform for Cadmium, Zinc, and Copper Determination in Freshwaters. Anal. Chim. Acta2015, 891, 171–178. [CrossRef] [PubMed]
14. Páscoa, R.; Tóth, I.V.; Rangel, A.O. Spectrophotometric Determination of Zinc and Copper in a Multi-SyringeFlow Injection Analysis System Using a Liquid Waveguide Capillary Cell: Application to Natural Waters.Talanta 2011, 84, 1267–1272. [CrossRef]
15. Shpigun, L.K.; Shushenachev, Y.V.; Kamilova, P.M. Simultaneous Spectrophotometric Determination ofcopper(II) and zinc(II) Based on Their Kinetic Separation in Flow-Injection Systems. J. Anal. Chem.2007, 62, 623–631. [CrossRef]
16. Ruedas-Rama, M.J.; Ruiz-Medina, A.; Molina-Díaz, A. Resolution of Biparametric Mixtures Using BeadInjection Spectroscopic Flow-through Renewable Surface Sensors. Anal. Sci. 2005, 21, 1079–1084. [CrossRef]
17. Morais, I.P.; Souto, M.R.S.; Rangel, A.O.S.S. A Double-Line Sequential Injection System for the SpectrophotometricDetermination of Copper, Iron, Manganese, and Zinc in Waters. J. AOAC Int. 2005, 88, 639–644. [CrossRef]
18. Richter, P.; Toral, M.I.; Fuenzalida, E.; Tapia, A.E. Flow Injection Photometric Determination of Zincand Copper With Zincon Based on the Variation of the Stability of the Complexes with PH. Analyst1997, 122, 1045–1048. [CrossRef]
19. Horstkotte, B.; Jarošová, P.; Chocholouš, P.; Sklenárová, H.; Solich, P. Sequential Injection ChromatographyWith Post-Column reaction/Derivatization for the Determination of Transition Metal Cations in NaturalWater Samples. Talanta 2015, 136, 75–83. [CrossRef]
20. Standard Methods for the Examination of Water and Wastewater, 19th ed.; American Public Health Association:Washington, DC, USA, 1998.
21. Nomenclature, symbols, units and their usage in spectrochemical analysis—II. Int. Union Pure Appl. Chem.1976, 45, 101–103. [CrossRef]
22. Currie, L.A. Nomenclature in Evaluation of Analytical Methods Including Detection and QuantificationCapabilities (IUPAC Recommendations 1995). Pure Appl. Chem. 1995, 67, 1699–1723. [CrossRef]
23. Miller, J.N.; Miller, J. Statistics and Chemometrics for Analytical Chemistry, 6th ed.; Pearson Education Limited:Harlow, UK, 2010.
24. Zagatto, E.A.G.; Arruda, M.; Jacintho, A.; Mattos, I. Compensation of the Schlieren Effect in Flow-InjectionAnalysis by Using Dual-Wavelength Spectrophotometry. Anal. Chim. Acta 1990, 234, 153–160. [CrossRef]
25. Guidance on Labelling and Packaging in Accordance With Regulation (EC) No 1272/2008—PublicationsOffice of the EU. Available online: https://echa.europa.eu/home (accessed on 28 October 2020).
Publisher’s Note: MDPI stays neutral with regard to jurisdictional claims in published maps and institutionalaffiliations.
© 2020 by the authors. Licensee MDPI, Basel, Switzerland. This article is an open accessarticle distributed under the terms and conditions of the Creative Commons Attribution(CC BY) license (http://creativecommons.org/licenses/by/4.0/).