Evaluating the effectiveness of public finance for household ...
31
Report WaterAid/Jon Spaul Evaluating the effectiveness of public finance for household sanitation in the state of Bihar, India
-
Upload
khangminh22 -
Category
Documents
-
view
3 -
download
0
Transcript of Evaluating the effectiveness of public finance for household ...

ReportW
ater
Aid/
Jon
Spau
l
Evaluating the effectiveness of public finance for household sanitation in the state of Bihar, India

2
> Report
Table of contentsAcronyms and abbreviations 3
Acknowledgements 3
1 Introduction 4
1.1 Overview of the WaterAid research project 4
1.2 Scope of the case study 4
1.3 Structure of the case study 5
2 Case study context 5
2.1 Socio-economic context 6
2.2 Sanitation coverage 6
2.3 Policy framework: the ‘Total Sanitation Campaign’ 6
3 Institutional set-up and financial flows for rural sanitation 9
3.1 Institutional set-up for sanitation in the state of Bihar 9
3.2 Financial flows under the Total Sanitation Campaign 11
3.3 Additional sanitation programmes in the state of Bihar 13
4 Sanitation coverage and expenditure 14
4.1 Software support activities 14
4.2 On-site sanitation: construction of latrines 16
4.3 Emptying latrines 19
5 Evaluating public finance for sanitation in Bihar 20
5.1 Criteria 1: Comprehensiveness 20
5.2 Criteria 2: Equity 21
5.3 Criteria 3: Leveraging 23
6 Conclusions 26
Annex A: List of supporting documents 29
Annex B: List of interviewees 30

3
> Report
Acronyms and abbreviationsCCDU Communication and Capacity Development Unit
CRSP Central Rural Sanitation Plan
DWSM District Water and Sanitation Mission
GP Gram Panchayat
IEC Information Education Communication
LSY Lohiya Swachata Yojana
NBA Nirmal Bharat Abhiyan
NDA National Democratic Alliance
NGP Nirmal Gram Puraskar
ODF Open Defecation Free
PHED Public Health Engineering Department
PIP Project Implementation Plan
PRI Panchayat Raj Institution
PMU Programme Management Unit
SCs Scheduled Castes
STs Scheduled Tribes
SWSM State Water and Sanitation Mission
TSC Total Sanitation Campaign
The exchange rate used in this case study is: US Dollar (USD) 1 = Indian Rupee (INR) 47 (as of June 2010).
Acknowledgements This study was written by Sophie Trémolet and Diane Binder, based on research conducted by Diane Binder in India conducted in March 2013. We are very grateful to WaterAid India staff for their assistance with organising the research. Many thanks go to Oliver Jones (Global Sanitation Fund) and Sweta Patnaik (WaterAid India) for their peer review and helpful comments comments and to Goufrane Mansour for all her help with finalising the case study.
The synthesis report and other case studies can be accessed here: www.wateraid.org/evaluatingeffectiveness
Cover photo: WaterAid/Jon Spaull. Rukhmani Devi cleaning her latrine, Tilhari Village, India. Similar facilities are being implemented in Bihar.

4
> Report
1 Introduction1.1 Overview of the research project
WaterAid has initiated a study to evaluate the effectiveness of public financing for sustainable household sanitation in the rural areas of the state of Bihar (India). This study is part of a broader research initiative that includes case studies of urban sanitation in Dar es Salaam (Tanzania) and rural sanitation in Thailand.
The objectives of the project were:
• To gather reliable information on the total cost of sanitation provision (including hardware and software).
• To identify the different sources and channels of sanitation financing and determine the share of financing originating from households and public sources for different components of the sanitation ‘value chain’ (from collection to safe disposal).
• To make recommendations about how public finance could be better targeted to accelerate progress towards universal access to sustainable improved sanitation.
1.2 Scope of the case study
This case study is focused on the implementation of the Total Sanitation Campaign (TSC) in the state of Bihar, India, between 2000 and 2010. The research for this case study was carried out in early 2010 and results presented here are valid up to that point in time. Since the study was carried out, the TSC was adapted and renamed Nirmal Bharat Abhiyan (NBA), a change that was initiated in April 2012. New guidelines were provided for the allocation of public funds to sanitation activities as part of the change. Although this study is not able to assess the impact of these new guidelines, significant departures from TSC policies that have been implemented since 2012 are mentioned when relevant.
The TSC was a national rural sanitation programme launched by the Government of India in 1999, for villages across all states. The programme covered a 13-year time period, until 2012. It was implemented in all 38 districts of Bihar, covering 8,471 Gram Panchayats (GPs)1. This case study evaluates TSC implementation at state level in Bihar, with a more detailed analysis for the Patna district, retrospectively examining financial flows over four years (2006-2010), with data since 1999 provided for reference only2.
The case study focuses on the provision of sanitation services, as per the definition used by the Joint Monitoring Programme (JMP) for drinking water supply and sanitation, as ‘the methods for the safe and sustainable management of human excreta’. This includes associated hygiene promotion, which supports sustainable sanitation uptake and behaviour change. This definition is more restrictive than the definition used in the TSC guidelines, which includes ‘liquid and solid waste disposal, food hygiene, and personal, domestic as well as environmental hygiene’. However, the practical focus of the TSC was on the construction of latrines and the related sanitation promotion activities.
The case study is specifically focused on the provision of sanitation services at household level (individual household latrines). This may include facilities that are shared by a small number of families (eg sanitary complexes shared by neighbours or people who do not have land to build their own latrines) but excludes community facilities (ie those shared by a large number of transient people in public spaces, such as markets or bus terminals) and institutional toilets in schools and anganwadis (government-sponsored child-care centres).
1 The lowest level of governance in India’s decentralised system.2 It is difficult to isolate data from a specific time period as there is no yearly budget under the TSC and funds are released
depending on actual expenditures. In several sections, the data is analysed for the entire period of the TSC.

5
> Report1.3 Structure of the case study
This case study is structured as follows:
• Section 2 gives a brief overview of the study area in terms of socio-economic status and access to sanitation and places this in the overall country context.
• Section 3 introduces the institutional set-up for the provision of sanitation services in Bihar, setting out the roles and responsibilities of the main sector stakeholders and the sources of finance they have at their disposal to carry out their functions.
• Section 4 assesses the sanitation services provided in Bihar and estimates the expenditure allocated to the provision of each type of service.
• Section 5 evaluates the effectiveness of public financing for sanitation in Bihar based on a set of criteria, including comprehensiveness, equity and leveraging.
• Section 6 formulates recommendations about how public finance could be better targeted to accelerate progress towards universal access to sustainable improved sanitation.
• Annex A contains a list of supporting documents.
• Annex B includes a list of people interviewed.
6
> Report
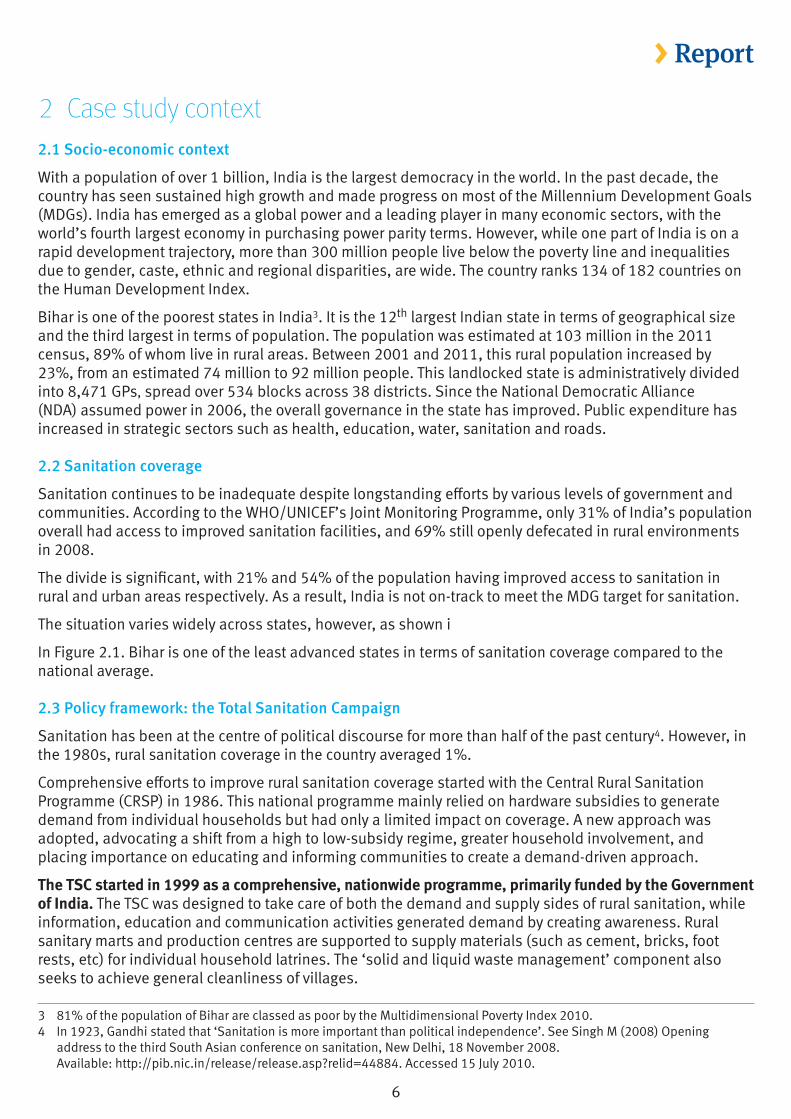
2 Case study context2.1 Socio-economic context
With a population of over 1 billion, India is the largest democracy in the world. In the past decade, the country has seen sustained high growth and made progress on most of the Millennium Development Goals (MDGs). India has emerged as a global power and a leading player in many economic sectors, with the world’s fourth largest economy in purchasing power parity terms. However, while one part of India is on a rapid development trajectory, more than 300 million people live below the poverty line and inequalities due to gender, caste, ethnic and regional disparities, are wide. The country ranks 134 of 182 countries on the Human Development Index.
Bihar is one of the poorest states in India3. It is the 12th largest Indian state in terms of geographical size and the third largest in terms of population. The population was estimated at 103 million in the 2011 census, 89% of whom live in rural areas. Between 2001 and 2011, this rural population increased by 23%, from an estimated 74 million to 92 million people. This landlocked state is administratively divided into 8,471 GPs, spread over 534 blocks across 38 districts. Since the National Democratic Alliance (NDA) assumed power in 2006, the overall governance in the state has improved. Public expenditure has increased in strategic sectors such as health, education, water, sanitation and roads.
2.2 Sanitation coverage
Sanitation continues to be inadequate despite longstanding efforts by various levels of government and communities. According to the WHO/UNICEF’s Joint Monitoring Programme, only 31% of India’s population overall had access to improved sanitation facilities, and 69% still openly defecated in rural environments in 2008.
The divide is significant, with 21% and 54% of the population having improved access to sanitation in rural and urban areas respectively. As a result, India is not on-track to meet the MDG target for sanitation.
The situation varies widely across states, however, as shown i
In Figure 2.1. Bihar is one of the least advanced states in terms of sanitation coverage compared to the national average.
2.3 Policy framework: the Total Sanitation Campaign
Sanitation has been at the centre of political discourse for more than half of the past century4. However, in the 1980s, rural sanitation coverage in the country averaged 1%.
Comprehensive efforts to improve rural sanitation coverage started with the Central Rural Sanitation Programme (CRSP) in 1986. This national programme mainly relied on hardware subsidies to generate demand from individual households but had only a limited impact on coverage. A new approach was adopted, advocating a shift from a high to low-subsidy regime, greater household involvement, and placing importance on educating and informing communities to create a demand-driven approach.
The TSC started in 1999 as a comprehensive, nationwide programme, primarily funded by the Government of India. The TSC was designed to take care of both the demand and supply sides of rural sanitation, while information, education and communication activities generated demand by creating awareness. Rural sanitary marts and production centres are supported to supply materials (such as cement, bricks, foot rests, etc) for individual household latrines. The ‘solid and liquid waste management’ component also seeks to achieve general cleanliness of villages.
3 81% of the population of Bihar are classed as poor by the Multidimensional Poverty Index 2010.4 In 1923, Gandhi stated that ‘Sanitation is more important than political independence’. See Singh M (2008) Opening
address to the third South Asian conference on sanitation, New Delhi, 18 November 2008. Available: http://pib.nic.in/release/release.asp?relid=44884. Accessed 15 July 2010.

7
> Report
Hardware subsidies were provided to households living below the poverty line after the latrines were been constructed. Since the subsidies are outcome-based, they are referred to as ‘incentives’ in the TSC guidelines5. Although the Indian Government consistently expressed its commitment to shift from a high to a low or no subsidy approach, the initial capital cost base for subsidies has had to be adjusted upwards to reflect cost inflation. From INR 500 (USD 11) at the beginning of the TSC, the amount was raised to INR 1,500 (USD 32) in 2006/07 and to 2,500 (USD 53) in 2008/09.
While the government issued policy guidance, the TSC was implemented by Panchayati Raj Institutions (PRIs). This decision was made as per the 73rd amendment of the Indian Constitution (1992) that covers devolution of powers and responsibilities to local government institutions in order to prepare and implement economic and social development plans.
5 In some states, such as Maharashtra, such incentives are paid to households once they have built a latrine and the village as a whole has reached open defecation free status.
Figure 2.1: Sanitation coverage in India
Source: GIS Database, as of March 2010. www.gis.nic.in.
Note: This map is based on the Government of India’s coverage figures. The JMP coverage data is based on access measured through household surveys at the country level. By contrast, the Government database for the Total Sanitation Campaign measures rural access through the number of households having applied for a hardware subsidy. We use the Government’s figures in the rest of this report as they are available at a higher level of detail.
Andhra Pradesh
Arunachal Pradesh
AssamBihar
Chhattisgarh
Goa
Gujarat
Haryana
Himachal Pradesh
Jammu and Kashmir
Jharkhand
Karnataka
Kerala
Madhya Pradesh
Maharashtra
Manipur
Meghalaya
Mizoram
Nagaland
Orissa
Punjab
RajasthanSikkim
Tamil Nadu
Tripura
Uttar Pradesh
Uttarakhand
West Bengal
Andaman and Nicobar Islands
Dadra and Nagar Haveli
Daman and Diu
Lakshadweep
Delhi
Pondicherry
Coverage <25%
Coverage between 26% and 45%
Coverage between 46% and 72%
Coverage between 73% and 100%

8
> ReportThe PRIs are a three-tier system of governance that includes the district, block and GPs. As the closest level of government to communities, they are responsible for motivating the community to change their behaviour towards better sanitation and facilitate the disbursement of incentives. PRIs often rely on cooperatives, women’s groups, self-help groups, non-governmental organisations (NGOs), etc, to change sanitation behaviours, and run rural sanitary marts and production centres
To add vigour to the TSC, the Government of India initiated an incentive scheme for fully sanitised and open defecation free GPs in 2003. The scheme, called the ‘Nirmal Gram Puraskar’ (NGP), aimed to encourage PRIs, individuals and institutions to work towards achieving total sanitation. The NGP scheme provides one-off monetary awards from the central government to the GPs that qualify, based on a set of criteria that include 100% sanitation coverage of individual households and being totally open defecation free. GPs can use the cash incentive to improve and maintain sanitation facilities in their respective areas with a focus on solid and liquid waste disposal and maintaining sanitation standards.
Given India’s federal structure, the implementation of the TSC varied from state to state. In Bihar, the campaign started in 2001 but all dedicated funds were not approved until 2006. Physical and financial progress on the TSC started in 2003.
There are significant variations in the way that the TSC has been implemented in each state, both in terms of the implementation framework and outcomes. The government of Bihar has prioritised sanitation, and made substantial efforts to improve the outcomes of both the TSC and its own programmes.
Rural sanitation coverage in Bihar at the beginning of the TSC (according to the 2001 Census of India) was only 2%, with 1.8 million households having access to latrines. The TSC started with an objective of having 11.2 million households with latrines by the year 2010, ie 78.2% of the households.
In 2010, sanitation coverage in Bihar lagged behind the ambitious targets of the TSC programme with only 27.9% of households having a latrine, ie 2.2 million constructed over the 2000-10 period.
Bihar’s achievements under the TSC are shown in more detail in Table 2.1.
Table 2.1: Achievement in the state of Bihar under the TSC (April 2000 to May 2010)
Status at census (2001) TSC target Overall achievement (excl. census)
Number % against TSC target
Total number of households
12,660,007 14,282,117* N/A N/A
Households with latrines 1,761, 591 11,171,314 2,225,084 19.9%
APL N/A 4,975,535 524,947 10.6%
BPL N/A 6,195,779 1,700,137 27.4%
% of households with latrine
13.9% 78.2% 27.9%** N/A
Source: DDWS website, Online Progress Monitoring System* Projected number of households in 2008, DDWS, Statewise Basic Information.** This percentatge includes the status at census. The total number of households having latrines is 3,986,675.

9
> Report
3 Institutional set-up and financial flows for rural sanitation This section sets out the institutional arrangements for delivering rural sanitation in the state of Bihar, with a particular focus on the institutional arrangements for implementing the TSC. It then presents the overall financing flows of the TSC, followed by an overview of additional sanitation financing programmes that have been initiated by the government of Bihar6.
3.1 Institutional set-up for sanitation in the state of Bihar
The TSC is financed by the Government of India, the state of Bihar and the beneficiaries. Funds from the governments of India and Bihar are transferred directly to the districts. Given the lack of capacity in PRIs, districts often contract out sanitation promotion activities, the creation of rural sanitary marts/production centres (RSM/PC) and the construction of latrines to NGOs, who contribute to these TSC-funded activities from their own resources. The financing flows in the sector are mapped out in Figure 3.1.
Figure 3.1: Institutional arrangements and financing flows under the TSC in Bihar
6 Although the Total Sanitation Campaign (TSC) finished in 2012, and was adapted and renamed as the Nirmal Bharat Abhiyan (NBA), these sections are written using mainly the present tense, reflecting the 2010 date that the research was conducted.
Maha dalits
Below the poverty
line
Centre level
State level
District level
Village level
DDWS
PHED
Block
Gram Panchayat
Village
Above the poverty
line
NGOs
NGOs, community-based organisations,
entrepreneurs
Rural sanitation marts/production
centres
Demand promotion
Supply promotion
Construction
SWSM
DWSM
PMU CCDU
CRSP National NGPSC
Centre share NGP award
IEC funds to state
TSC coordinator
TSC coordinator
State share
Centre and state shares
Panchayati Raj Institutions (PRIs)
Public financing flows
Private financing flows
Government institutions/governance units
TSC implementing structures

10
> ReportAt national level, the TSC is operated as part of the Central Rural Sanitation Programme (CRSP), by the Department of Drinking Water Supply (DDWS), in the Ministry of Rural Development. The CRSP was launched in 1986 with the primary objective of improving the quality of life of rural people. The CRSP designs policy and decides the allocation of funds through the National Sanctioning Committee (for subsidies) and the NGP Scrutiny Committee.
The allocation of resources from government to states is based on both the efforts needed to reach the TSC targets according to the baseline survey, and the pace of expenditure by districts. Central funds are released to districts in four instalments (30%, 30%, 30% and 10%) as per the TSC guidelines. The first instalment is released immediately after approval of the project proposal by the National Scheme Sanctioning Committee. The state share is supposed to be released at least in the same proportion as the central share and at the same time. The next instalment is subject to a utilisation certificate, as a proof that at least 60% of the total central and state funds have been properly spent. This can be verified through the monthly reporting system.
In addition, NGP awards flow directly from the Government of India to the PRIs that have been selected by the National NGP Selection Committee. Between 2006 and 2010, 199 GPs had been awarded the NGP award in Bihar, although it appears that none of them have received the associated monetary award and the attribution of these awards has later been contested.
At state level, the State Water and Sanitation Mission (SWSM) is the nodal agency for implementing the TSC. It is operationally independent but sits under the Public Health Engineering Department (PHED). The SWSM plays a supportive, planning and facilitating role for the implementation of the TSC. It is divided between a Programme Management Unit (PMU) and a Capacity and Communication Development Unit (CCDU), the latter being responsible for producing the Information Education Communication (IEC) material and facilitating training. A TSC coordinator is appointed by the national TSC administration to oversee its implementation in that state and operate under the PHED. However, most of the operational capabilities lie in the hands of PHED engineers, who tend to have limited knowledge of software activities and for whom sanitation is not the main priority, as opposed to improving water coverage. The state government is responsible for contributing the state share of the TSC district projects at the same time as the Government of India’s share. This is done via the PMU within the SWSM.
The responsibility for implementing the TSC is held at district level. In each district, the District Water and Sanitation Mission is the PHED’s operational agency. The district mission plays a pivotal role in improving sanitation and is in charge of preparing the Project Implementation Plan for implementing the TSC at district level, as well as receiving both Centre and State funds. As such, it allocates subsidies to households, creates Rural Sanitary Marts and Production Centres and organises IEC activities. In District Water and Sanitation Missions (DWSM), both the Executive Engineer, in charge of disbursing funds for hardware subsidies, and the TSC Coordinator, play an important role. However, even though the allocation of funds is dictated in the TSC guidelines, the TSC coordinator often has no control over the budget, as decisions are made by the District Water and Sanitation Committee, which is composed of Government officials from PHED and chaired by the Deputy Development Commissioner (DDC). The TSC coordinator is contracted mainly to coordinate NGOs contributions to demand creation and the construction of latrines.
The block is placed under the district; it is administered both by a block Development Officer (BDO, a Government official) and an elected representative of the villages, the Pramukh. Under each block, there are several Gram Panchayats, which is the lowest level of governance in the country and comprises of several villages. While in most cases, the block has no authority to implement the TSC, the Muhkiya, or elected figure of the Gram Panchayat, is responsible for creating awareness for sanitation, having masons build households toilets when no NGO is present (NGOs would usually be in charge of building latrines otherwise) and signing off the subsidies requirement before passing it to the next level of government.
11
> Report3.2 Financial flows under the TSC
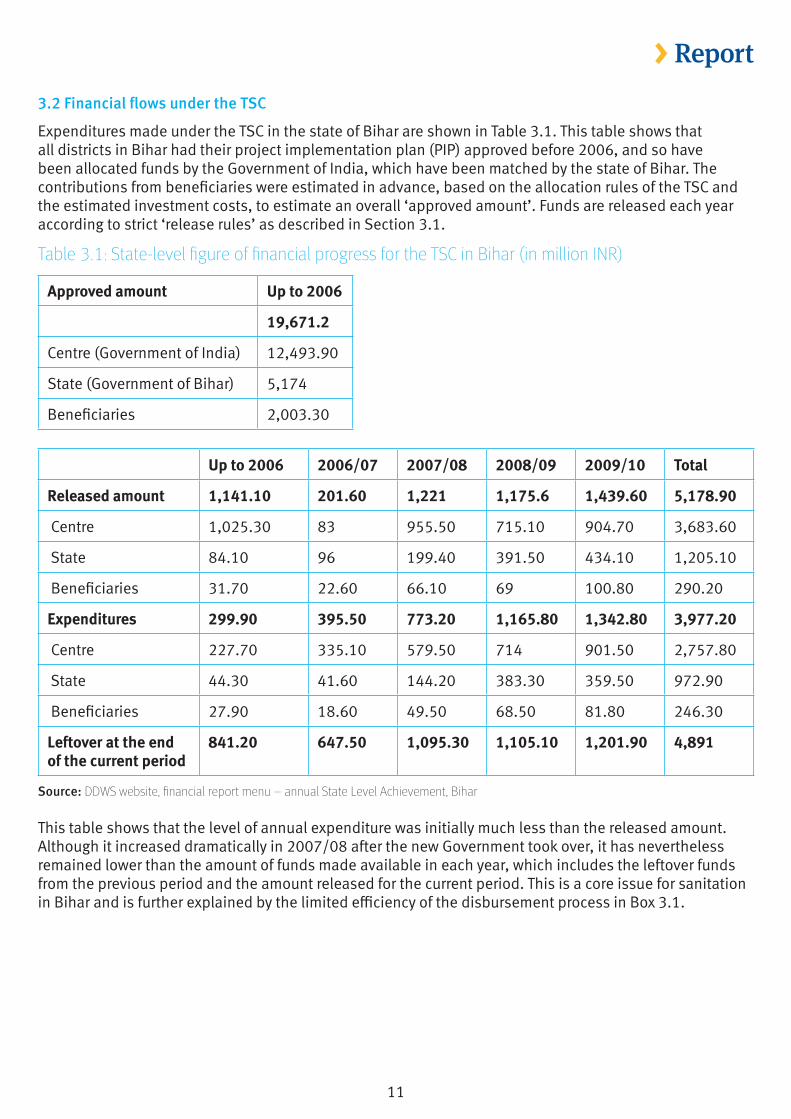
Expenditures made under the TSC in the state of Bihar are shown in Table 3.1. This table shows that all districts in Bihar had their project implementation plan (PIP) approved before 2006, and so have been allocated funds by the Government of India, which have been matched by the state of Bihar. The contributions from beneficiaries were estimated in advance, based on the allocation rules of the TSC and the estimated investment costs, to estimate an overall ‘approved amount’. Funds are released each year according to strict ‘release rules’ as described in Section 3.1.
Table 3.1: State-level figure of financial progress for the TSC in Bihar (in million INR)
Approved amount Up to 2006
19,671.2
Centre (Government of India) 12,493.90
State (Government of Bihar) 5,174
Beneficiaries 2,003.30
Up to 2006 2006/07 2007/08 2008/09 2009/10 Total
Released amount 1,141.10 201.60 1,221 1,175.6 1,439.60 5,178.90
Centre 1,025.30 83 955.50 715.10 904.70 3,683.60
State 84.10 96 199.40 391.50 434.10 1,205.10
Beneficiaries 31.70 22.60 66.10 69 100.80 290.20
Expenditures 299.90 395.50 773.20 1,165.80 1,342.80 3,977.20
Centre 227.70 335.10 579.50 714 901.50 2,757.80
State 44.30 41.60 144.20 383.30 359.50 972.90
Beneficiaries 27.90 18.60 49.50 68.50 81.80 246.30
Leftover at the end of the current period
841.20 647.50 1,095.30 1,105.10 1,201.90 4,891
Source: DDWS website, financial report menu – annual State Level Achievement, Bihar
This table shows that the level of annual expenditure was initially much less than the released amount. Although it increased dramatically in 2007/08 after the new Government took over, it has nevertheless remained lower than the amount of funds made available in each year, which includes the leftover funds from the previous period and the amount released for the current period. This is a core issue for sanitation in Bihar and is further explained by the limited efficiency of the disbursement process in Box 3.1.

12
> Report
Box 3.1: The disbursement issue in the state of Bihar
Although a total of close to INR 20 billion7 has been allocated to the TSC in Bihar (from the Government of India, the state government and the beneficiaries) since the beginning of the campaign, only a quarter of this amount has been effectively released to finance sanitation activities. Only 77% of the released funds have been spent. The discrepancy between availability of funds and actual expenditure over the four year study period is further demonstrated in Figure 3.2.
Figure 3.2: Discrepancy between total funds available and funds spent
Note: Funds available for each period include the leftovers from previous period and the amount released in the current year.
Figure 3.2 shows that the available budget for sanitation is systematically under-spent. There are two main explanations for such discrepancies:
Implementation capacity at district level is limited. Although sanitation has been made a policy priority by the government of Bihar, Executive Engineers at DWSM are also pressured with other demanding and time-consuming responsibilities such as improving drinking water supply. Executive Engineers are also civil servants, who are not specifically trained to engage in sanitation promotion activities. As a result, the IEC-allocated budget remains under-spent, and the demand for latrine construction remains low, so the disbursement of subsidies is too.
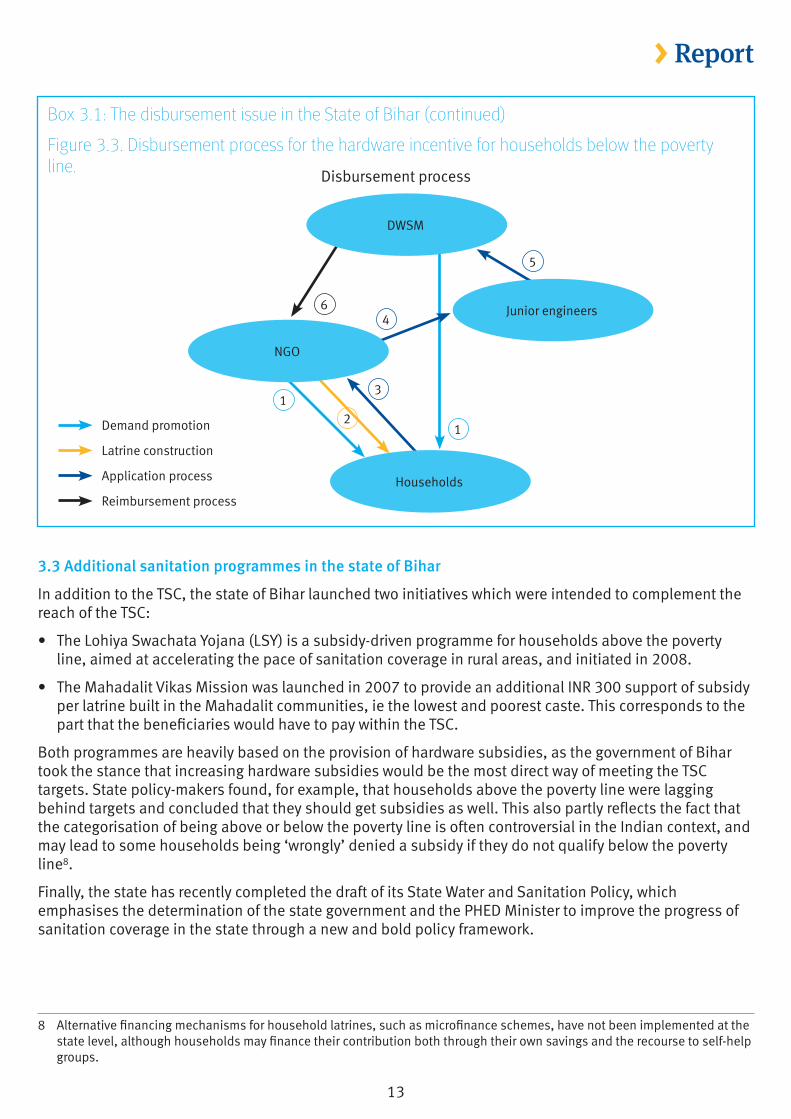
The disbursement process is sequential and lengthy. After demand is created by the DWSM (through the IEC budget), NGOs usually lead on building the latrines for households. To apply for the hardware subsidies that that households below the poverty line are entitled to receive, NGOs must fill an application form, including a picture of the latrine built. The application goes through the Junior Engineer (at Block level), then to the Assistant Engineer in the District and then to the Executive Engineer. Upon validation by the Executive Engineer, funds are disbursed to the NGOs. According to several NGOs in Patna, the time lag between construction and reimbursement can take up to a year – whereas the Government estimates that the disbursement process could take around 45 days. As shown in Figure 3.3, many steps need to take place before the funds can actually be disbursed. Each step has the potential risks of delays and corruption.
7 For purposes of comparison, the GDP of Bihar in 2010 amounts to INR 26 billion (Associated Chambers of Commerce and Industry, India, 2010).
3000.0
2500.0
2000.0
1500.0
1000.0
500.0
0.02006/2007 2007/2008 2008/2009 2009/2010
Funds available
Actual level of expenditure
13
> Report
Box 3.1: The disbursement issue in the State of Bihar (continued)
Figure 3.3. Disbursement process for the hardware incentive for households below the poverty line.
3.3 Additional sanitation programmes in the state of Bihar
In addition to the TSC, the state of Bihar launched two initiatives which were intended to complement the reach of the TSC:
• The Lohiya Swachata Yojana (LSY) is a subsidy-driven programme for households above the poverty line, aimed at accelerating the pace of sanitation coverage in rural areas, and initiated in 2008.
• The Mahadalit Vikas Mission was launched in 2007 to provide an additional INR 300 support of subsidy per latrine built in the Mahadalit communities, ie the lowest and poorest caste. This corresponds to the part that the beneficiaries would have to pay within the TSC.
Both programmes are heavily based on the provision of hardware subsidies, as the government of Bihar took the stance that increasing hardware subsidies would be the most direct way of meeting the TSC targets. State policy-makers found, for example, that households above the poverty line were lagging behind targets and concluded that they should get subsidies as well. This also partly reflects the fact that the categorisation of being above or below the poverty line is often controversial in the Indian context, and may lead to some households being ‘wrongly’ denied a subsidy if they do not qualify below the poverty line8.
Finally, the state has recently completed the draft of its State Water and Sanitation Policy, which emphasises the determination of the state government and the PHED Minister to improve the progress of sanitation coverage in the state through a new and bold policy framework.
8 Alternative financing mechanisms for household latrines, such as microfinance schemes, have not been implemented at the state level, although households may finance their contribution both through their own savings and the recourse to self-help groups.
1
12
3
4
5
6
DWSM
Junior engineers
NGO
Households
Demand promotion
Latrine construction
Application process
Reimbursement process
Disbursement process
14
> Report
4 Sanitation coverage and expenditureThis section evaluates the sanitation services currently being provided in the state of Bihar and estimates the average levels of expenditure in such services over the study period.
The TSC is primarily focused on financing software activities, such as demand and supply promotion and capacity building, combined with hardware subsidies for building latrines. No public funding is allocated to other segments of the value chain, such as latrine emptying (which is considered to be the responsibility of individual households). Treatment and reuse activities are not carried out in rural areas and therefore do not receive any financing.
TSC financing has come predominantly from domestic resources (mobilised at the level of the Government of India and the State of Bihar), with donor contributions taking place via fairly limited projects. In Bihar, public financing has tended to take precedence over private financing, whereas public finance was estimated to account for 82% of total spending on household sanitation based on estimated costs, in practice it accounted for only 57% of spending. Actual investment costs have been higher than original estimates by the Government of India, with the difference being borne by the households themselves, partly due to the rising cost of materials (see Section 4.2. for more details).
In keeping with the overall methodological framework for the study, the following sections examine the types of sanitation services provided along the sanitation value chain and the amounts of financing dedicated to each of these activities.
4.1 Software support activities
Software activities under the TSC are carried out by PRI and NGOs and include the following:
Information, Education and Communication (IEC) is an important component of the TSC. The activities carried out under this component aim at creating demand for latrines and awareness about sanitation and hygiene. They are implemented at all levels of government, as set out below:
• At state level: two mass media campaigns have been conducted by the CCDU department under the SWSM to spread the message about the sanitation schemes available for different categories of people, raise awareness about the importance of sanitation and hygiene and create demand. The first campaign of this type was conducted in 2007. Vehicles displaying sanitation messages travelled across each district while demand for building latrines was registered. This resulted in the construction of more than 550,000 latrines (WaterAid, 2008). The second campaign, Gram Guarv Yatra, was launched by the Chief Minister in January 2009, in which the State PHED Minister travelled to all districts within a year. In addition, CCDU used dedicated budget to print out and distribute leaflets with sanitation and hygiene messages to districts.
• At district level: The district’s involvement in sanitation promotion is limited to the diffusion of IEC material prepared by the government. More recently, the importance of NGOs for spreading the messages of the TSC and LSY has been understood by government agencies. As such, NGOs have been contracted to facilitate construction of individual household latrines at the community level. Their services have been procured by the DWSMs in their respective districts. For example in Patna, close to 70 NGOs have been contracted by the government to run sanitation promotion activities, including street plays, wall paintings and announcements.
• At community level: As per the TSC guidelines, IEC activities must rely on motivators engaged at village level to carry out demand creation activities and behaviour change communications. Motivators are selected from within the community by NGOs and given incentives based on their performance, ie INR10 per latrine constructed and an additional INR5 when usage has been verified (usage is actually verified once the next batch of latrines has been constructed and verified by the Junior Engineer). According to the TSC guidelines, they do not get any fixed remuneration in addition to this performance payment.

15
> ReportAlthough methods of remuneration can vary from state to state, this guideline was applied in Patna district in the state of Bihar.
A government ill-equipped for generating demand relies heavily on NGOs, who find themselves at the forefront to implement software activities. From interviews conducted with NGOs, it appears that many are dissatisfied with carrying out tasks that they see as the responsibility of the government rather than having the independence and flexibility to complement the government’s actions.
Support for the establishment of rural sanitary marts and production centres. These are outlets selling materials for sanitation facilities, such as government-certified rural pans, compost pits, cement rings and squatting plates. Production centres are supposed to improve cost-effective production of sanitation materials, yet in Bihar, because of rising material costs, most parts are produced locally and production centres function less effectively. There are 30 rural sanitation marts and production centres in Bihar. Six are run by the private sector while others are run by NGOs9. Government funding is used to finance PRIs or NGOs to set up the marts and centres, train masons and start a revolving fund providing low or zero interest loans (up to INR 5,000,000 per district as per Government of India provisions) to the members of self-help groups for latrine construction10.
These software activities generate the following associated costs:
Start-up activities include conducting preliminary surveys to assess the status of sanitation and hygiene practices, the preparation of the project implementation plan for districts and the initial orientation and training of key officials at district level.
Administrative costs for training, salary of temporary staff during the TSC (eg TSC coordinator at state and district level), vehicle hire charges and various expenses, as well as monitoring and evaluation of TSC project. However, although the Government has put in place a monthly bottom-up reporting system for physical and financial progress for the TSC to evaluate coverage improvement and the pace of spending, there is no monitoring of how software funds are spent and whether latrines built are actually used.
Financing of software activities follows these guidelines:
• The costs of start-up activities are met fully by the Government of India and should not exceed 5% of the total project outlay at district level.
• IEC costs are capped at 15% of the total project cost and are financed at 80% by the Government of India and 20% by the Government of Bihar.
• Administrative charges are supported at a ratio of 80:20 by the governments of India and Bihar respectively. They should not account for more than 5% of the total project cost;
• The government also earmarked 5% of total project cost for rural sanitation marts, production centres and other alternative delivery mechanisms, with a maximum expenditure of INR 350,000 (USD 7,452) for each sanitation mart/production centre, with a ratio of 80:20 support respectively between the governments of India and Bihar.
Software activities for households represent 8.8% of total financing for sanitation in Bihar, with a cumulative expenditure of INR 355 million over the past 10 years since the beginning of the TSC. Yet, it is important to note that this amount is much smaller than the funds that had been allocated and released, as shown in Figure 4.1 (see Box 3.1).
9 DDWS website, Physical Report Menu, List of rural sanitary marts/production centres.10 In the government database, funding of rural sanitary marts/production centres is considered as hardware: this is how it is
treated in the next two sections to avoid discrepancies with government figures.
16
> Report
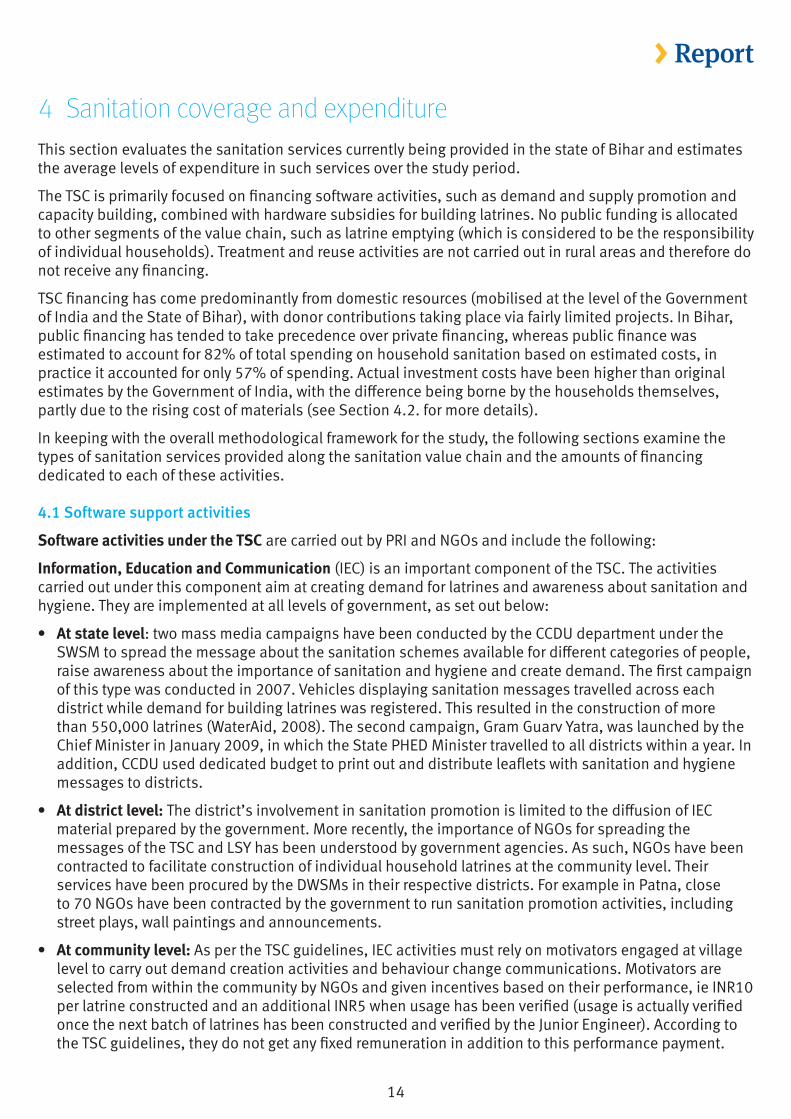
Figure 4.1: Software financing for household sanitation in Bihar from the beginning of the TSC to mid-2010
Source: DDWS website, financial report menu, cumulative software expenditure details as of 25 May 2010.
This figure shows that software funds are well under-spent, with expenditure amounting to only 14% of approved funds. Given the disbursement rules set out in section 3.2 (by which new funds are released only when the previous block has been spent), this explains why the released software funds are less than the allowed amounts.
Because capacity in demand promotion and hygiene-related educational activities have not been built at local levels within the PRIs, and because PHED officials have been facing an increased pressure to report a growing number of latrines built (thereby skimping on usage and sustainability), software activities are effectively carried out by NGOs from their own funding (including donor funding), whilst public funding is available but under-spent11. From interviews conducted with local NGOs, it appeared that many of them are leaving the sanitation sector, because the government does not release the subsidies for software within an acceptable length of time. Not only do NGOs have to carry out demand promotion activities from their own funds, but they often have to wait for one or two years to be reimbursed. Such delays act as a strong disincentive for those who have the skills to carry out demand promotion activities.
A combination of factors explain these delays, including overly bureaucratic processes, a suspicion in the relationship between local governments and NGOs and an inherent reluctance of local governments to give funds to NGOs. In addition, there is a lack of understanding of what services local government can support (from both parties).
4.2 On-site sanitation: construction of latrines
Coverage and unit cost At the beginning of the study period, about 2 million households had a latrine in Bihar state. In the following years, latrine construction grew at an average rate of 24% and the total number of latrines was close to 4 million in 2010. The number of latrines in Bihar has grown sharply since 2006/07 (see Figure 4.2).
11 Field visits in Patna district indicated that whilst IEC material is published by CCDU in the form of articles in newspapers or leaflets, it appears of little use in remote villages where people are illiterate. In a recent publication, WaterAid India reports that under IEC initiatives, 50 wall writings were planned for every GP, but that the small size of the display would not allow for the messages to effectively draw people’s attention. In Gaya district, stocks of promotion material have piled up in an office of the district. In most cases (based on our field visits), districts do not engage in outreach activities (street plays, etc), this is rather done (and paid) by NGOs.
Start-up costs
Administrative expenses
IEC
0 500 1000 1500 2000 2500 3000 3500
Expenditures
Approved funds
Allowed funds as per the guidelines
62
59
234
47
205
1698
959
959
2877

17
> Report
Figure 4.2: Number of individual household latrines built under the TSC in Bihar
Source: DDWS website, Physical progress report, year-wise state level achievement
Although the TSC campaign effectively started in Bihar in 2000/01, the plans have been received gradually and all of them were received by 2007. The 2006/07 upsurge, (which corresponds to the start of our study period), is largely due to the far-reaching reform agenda pushed by the NDA (National Democratic Alliance) Government (elected in November 2005).
Individual households are in charge of building latrines. The TSC advocates affordable options with the provision that ‘a duly completed household sanitary latrine shall comprise of a Basic Low Cost Unit with a superstructure’.
However, while the stated position of the TSC is to offer households a menu of options, there is little effort in Bihar to make it happen. The state Government has very strict requirements for latrines, which are a pre-condition for receiving the hardware subsidy. While these requirements have evolved over time, there is little room for user preference, as only one model of squatting plates and rural pans is provided for latrine construction and the depth and width of pit are imposed by the Indian Government’s guidelines.
Requirements have evolved along the increase of subsidies’ allocation. At the beginning of the study period (2006/07), the state Government advocated the construction of an on-pit latrine without superstructure with a brick or cement ring lining (Option 1). In 2007/08, the same model was promoted with the exception that a superstructure, even temporary, was required (Option 2). In 2008/09, the Government required a two-pit latrine with chamber, three feet of brick lining, a door and a roof, (Option 3) and in 2009/10 the required minimum lining increased to five feet (Option 4).
Table 4.5 gives cost estimates for each of these options. It is important to note that the level of subsidies defined in the TSC guidelines relies on cost estimates for the type of latrine promoted by the Government. For this reason, the level of subsidies has increased over the years, in order to keep up with the rising cost of material.
The government incentives were intended to cover 80% of the costs of building latrines (with the central and state governments’ shares combined), the remainder being at the expense of households themselves. However, focus groups in the districts of Patna and Gaya indicated that the government cost estimates were actually well below actual market prices, as shown on Table 4.5 below.
4,500,000
4,000,000
3,500,000
3,000,000
2,500,000
2,000,000
1,500,000
1,000,000
0
2001/02
2002/03
2003/04
2004/05
2005/06
2006/07
2007/08
2008/09
2009/10
below the
above the
Number otoilets at tperiod
poverty line
poverty line
f households with he beginning of the

18
> Report
Table 4.1: Estimated cost of latrines and related financing gap
Unit 2006/07 2007/08 2008/09 2009/10
Estimated costs INR 800 1,500 2,200 2,500
Central government share (60%) INR 480 900 1,320 1,500
State government share (20%) INR 160 300 440 500
Beneficiaries (20%) INR 160 300 440 500
Actual market price INR 1,200 2,000 3,000 5,000
Financing gap per unit INR 400 500 800 2,500
Individual household latrines constructed below the poverty line
130,286 389,205 570,905 472,722
Total financing gap Million INR 52.1 194.6 456.7 1,181.8
Source: TSC guidelines, focus groups in the districts of Patna and Gaya, DDWS website
The fact that actual costs have been under-estimated by the government generates an increased financial burden for households. At state level, it would mean that for 2009/10 only, households should have spent an additional INR 1.1 billion to pay for latrines at the required level of service, ie five times more than what they were supposed to pay according to the TSC guidelines.
An alternative option for households is to skimp on quality in order to adjust to the government cost estimates. For instance, NGOs may line bricks vertically instead of horizontally to reduce the quantity of bricks needed, even though the structure is then less solid and opaque. It results in lower quality construction, such as thinner brick lining or a door made of leaves, which eventually discourage usage.
Financing sources for the construction of latrinesFunds allocated to the construction of latrines below the poverty line (from both public and private sources) amounted to INR 2,791 million. This represented 69% of the total funding for sanitation under the TSC (the total costs of which were estimated at INR 4,049 million until May 2010) and 76% of funding for hardware activities, which includes sanitary complexes, school and anganwadis latrines and rural sanitation marts/production centres. However, as for software funds, the amount actually spent for the construction of individual household latrines is 19% of the approved financing amount.
This amount does not include incentives towards those above the poverty line: under the LSY, the government of Bihar provided an additional INR 14.5 billion for latrine construction over the period 2006-12, ie INR 2,000 for each family above the poverty line. It represents five times the cumulative amount spent for households below the poverty line under the TSC.
As per the TSC guidelines, hardware is financed at 60% by the Government of India, 20% by the government of Bihar and 20% by households. Yet, as mentioned above, this funding allocation does not reflect actual practice since the market price of latrines turns out to be higher than the cost estimates (see section 5.3 for more details about leverage ratio). If we chose to consider actual market price, the contribution of public financing decreases to an average of 53% over the four years of the study period instead of the projected 80%.
Since the financial support for latrine construction is provided by the TSC to households below the poverty line after construction, the GPs have worked out support strategies for those households who cannot come up with the necessary funds up front, including procurement of materials on credit, financial support to households from GP funds, and NGO funding. However, many NGOs have recently been taking a step back

19
> Reportfrom the sanitation sector, a chief reason being that they must pay the cost of construction up front and there is an important time lag between their expenses and reimbursement with incentives by the DWSM.
Households must therefore increasingly rely on their own resources, including in-kind contribution, savings, remittances, self-help groups or cooperatives, and micro-finance institutions. Besides, there is no public funding available to upgrade existing latrines; this is the sole responsibility of households.
4.3 Emptying latrines
No public funding is allocated to emptying latrines, as this is usually considered to be an activity that households would carry out themselves, discharging the content of the pit nearby.
In practice, emptying latrines does not seem to be a common practice in Bihar. Until 2008, the most common model of pit latrine would take one or two years to fill. A common practice once the pit was full was to revert to the practice of open defecation, with a limited number of households actually emptying the pit in the fields to continue using the latrine. According to interviews in villages in the districts of Patna and Gaya, the percentage of the population going back to open defecation was close to 90%. This percentage was only an educated guess, however, as there is no monitoring of latrine usage.
The two-pit latrine with a chamber, introduced in 2008, appears more suited to continuous use. When the first pit is filled, households may build and use the second one. During this time, the sludge dries up in the first pit into compost, which is later emptied and used in the field. However, it is too early to say if the second pit, whose construction cost is borne by the households (the government financing only includes the pipes laid from the chamber to the second pit), has effectively been built by a majority of households. Most models date from 2008/09, and it takes two to three years before the pit fills up so it is too early to tell what emptying practices are likely to be.
However, it must be noted that this high rate of return to open defecation indicates that the barrier to the adoption of improved sanitation is not so much a technical one, for example the model of pit-latrine, but a lack of real behaviour change.

20
> Report
5 Evaluating public finance for sanitation in BiharThis section seeks to evaluate the effectiveness of public financing for household sanitation in Bihar based on a set of criteria, including comprehensiveness (whether public funds are allocated in a way that allows all segments of the sanitation value chain to function in a sustainable manner), equity (whether public funds are adequately targeted on the poor and other disadvantaged groups) and leveraging (whether public funds are used in a way that effectively leverages other forms of finance).
5.1 Comprehensiveness
The key question examined here is whether public financing is flowing to the right segments and activities alongside the sanitation value chain so that they function effectively. In the context of the TSC, which is conducted in a rural environment, the main focus of sanitation service delivery is on collection, as pit emptying is not such a high priority and wastewater services are non-existent. As a result, the definition of the ‘sanitation value chain’ is different from that used in the Dar es Salaam case study, which also examined sludge removal, treatment and safe disposal. A key step in the value chain here, however, includes the software activities (such as for demand promotion) that need to be carried out up-stream from collection in order for the latrines to be functioning in a sustainable manner.
Table 5.1 shows the allocation of expenditures for sanitation in Bihar under the TSC.
Table 5.1: Cumulative sanitation expenditures in Bihar under the TSC (1999 to 2010)
Activities (Ratio: Government of India – Bihar – beneficiaries)
Amount (in million INR) % of total project outlay
Expenditure on software activities
Start-up (100-0-0) 63.5 1.5%
Administrative charges (80-20-0) 60.9 1.5%
IEC (80-20-0) 239.7 5.9%
Total financing to software 364 9%
Expenditure on hardware (latrine construction)
Individual household latrines (60-20-20) 2,791 68.9%
Sanitary complex 20 0.5%
Rural sanitary mart/production centres 34.8 0.86%
School and Anganwadi latrines 839 20.7%
Total financing to hardware 3,685 91%
Total expenditures for sanitation in Bihar 4,049 100%
Source: DDWS website, Financial report menu, Cumulative hardware and software expenditure details, 25/05/2010
Note: The cumulative total expenditures mentioned in this table is slightly different than the cumulative amount derived from Table 3.2. The reason is that the cumulative amount is updated every day in the Government reporting system and as such corresponds to the amount at the date when the report was written, whereas the 2009/10 financial period ends in March (hence two months difference).
This table shows that software costs (including start-up activities, administration charges and IEC) made up 9% of the total project outlay and the remaining 91% was devoted to subsidies for latrine construction (with no funding allocated to deal with the residual waste downstream).

21
> ReportThese figures need to be treated with some caution, however. As Figure 5.1 shows, the amount of approved funds compared to what has actually been spent was 5.5 times higher for software activities and 5.2 times higher for hardware support.
The approved amount for hardware (for individual household latrines only) – INR 14.4 billion– is to be compared with the amount needed to reach the TSC target, ie an addition 7.2 million latrines built by 2012. At current cost estimates by the government, this corresponds to an additional INR 14.3 billion from the government share (both India and Bihar). This means that the approved amount for hardware from public sources, if spent, would therefore be sufficient to reach the TSC target.
Figure 5.1: Approved public funding vs actual expenditures (cumulative under the TSC)
Source: Estimates from DDWS database. Cumulative amounts from the beginning of the TSC until 25 May 2010.
Finally, public funds are not necessarily used in the most efficient manner possible. For instance, while contribution to administrative charges includes funds for monitoring, monitoring activity is limited to construction rather than usage. The present system requires verification of the assets constructed by Government representatives on submission of the completion report by the facilitating organisation (NGO/PRI). However, according to local experts, the usage rate can be as low as 10%12. If this finding was confirmed through a larger sample evaluation, this would significantly lower the impact of latrines that have been built have on actual health and hygiene improvements.
This issue is partly confirmed by the fact that only 199 GPs (of 8,471 in Bihar) had won the NGP awards by mid-2010, ie 2.3% of GPs. This indicates that only a small percentage of villages have reached open defecation free status. The number of NGP awards has been a matter of debate in the state, with the number of awards reverting to zero due to previous mis-reporting (and allegations of corruption) in the past year. Yet, it is important to note that the small percentage of NGP awards is also related to weak administrative capacity, which makes it difficult for all open defecation free (ODF) GPs to be awarded and vetted.
5.2 Equity
This criterion seeks to assess whether public funds are adequately targeted to reach poor and disadvantaged groups of the population.
In India, poverty targeting is officially defined across all sectors except for water or sanitation. Households below the poverty line are defined by the Government of India as in need of government assistance.
12 This information comes from interviews with local NGOs, households and local governors. UNICEF found the same result from surveys in a recent research that has finally not been published.
16,000
14,000
12,000
10,000
8,000
6,000
4,000
2,000
0Start-up and
administrative charges
IEC Construction of individual
household latrines and sanitary
complex
Emptying of latrines
Approved funds
Expenditures
22
> ReportThis threshold is determined by using various parameters, which were set out in 2002 by the Planning Commission through a survey. However, the number of households below the poverty line in Bihar has recently been at the centre of a controversy between the Government of Bihar and the Planning Commission13. In April 2010, the Commission agreed to increase the number of households classed as below the poverty line from 6.5 million to 9 million, although this was still far below the number advocated by the government of Bihar.
The TSC was designed to target households below the poverty line with specific hardware subsidies. Although families living above the poverty line can benefit from sanitation marketing activities under the TSC, the bulk of government financial support goes to financing incentives for families below the poverty line. In that sense, public funds from the TSC seem to be adequately targeted to reach the poor. The government of Bihar recently decided to provide additional subsidies to the poorest and lowest caste people (the Mahadalits), with an additional allocation of INR 300 (USD 6) per latrine constructed, to cover their contributions, which represents a total earmarked amount of INR 150 million (USD 3.2 million).
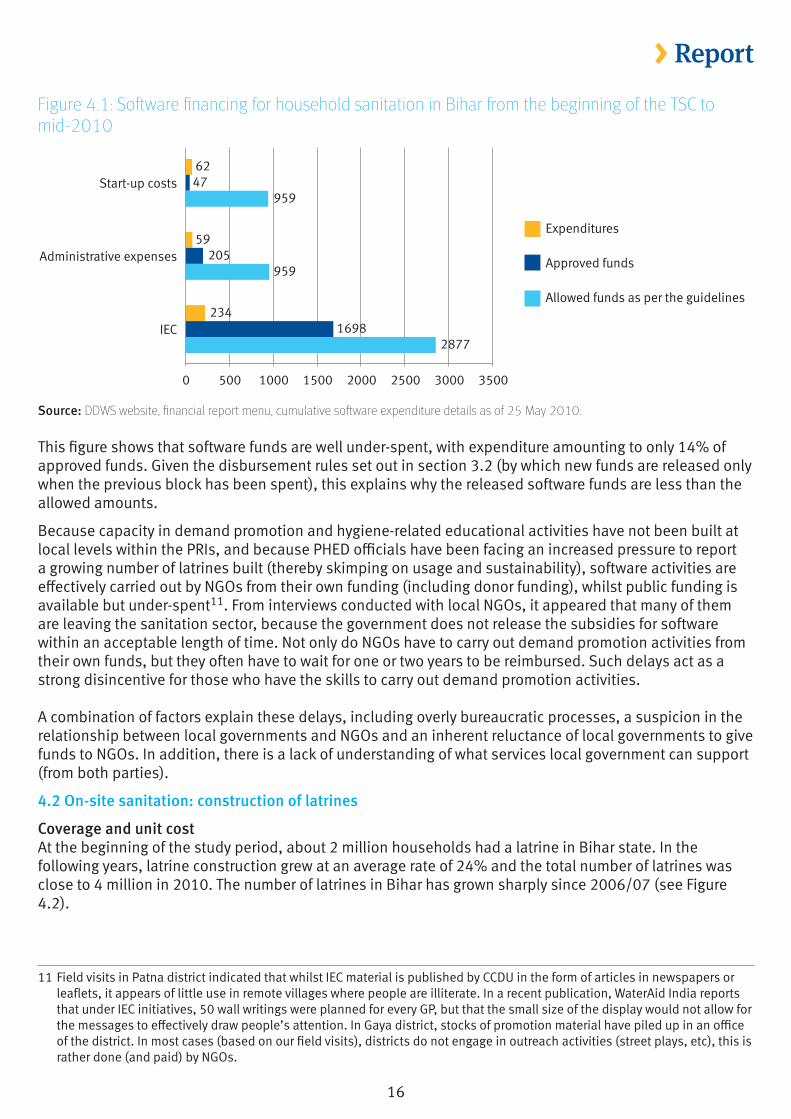
However, the LSY programme initiated by the government of Bihar in 2009 based on the observation that latrine construction byfamilies above the poverty line was lagging behind (See Figure 4.2) may well dampen such poverty targeting. Under the LSY, the government of Bihar decided in 2009 to provide additional subsidies to households above the poverty line to help them build latrines, with a INR 2000 (USD 42.5) subsidy per latrine constructed (see Section 3.3. for more information). This means that the biggest share of state public funds allocated to the sector is now allocated to households above the poverty line, as shown on Table 5.2.
Table 5.2: Public financing, approved and spent, for households above and below the poverty line (million INR)
2006/07 2007/08 2008/09 2009/10 Total
Released, or approved public funding*
For households below the poverty line, including Mahadalits
123.4 796.1 762.8 922.9 2,605.1
For households above the poverty line, under LSY
0 0 0 14,500 14,500
Public expenditures (central and state)
For households below the poverty line 83.4 467 1,004.8 945.4 2,500.7
For households above the poverty line 0 0 0 335.3 335.3
* Amounts of funds under the TSC for those below the poverty line are released, whereas under the state programmes, the funds have only been approved.
Note: In this table, we assumed that funds for Mahadalits have been approved but not spent, and, that all latrines constructed for households above the poverty line in 2009/10 benefited from a INR 2,000 subsidy from the government of Bihar (this is likely to be an over-estimate, however, and would need to be revised based on actual utilisation rate for those subsidies). In this table, we consider for households below the poverty line the amount of funds released within the TSC.
Although households below the poverty line have so far received 88% of public expenditure (since the majority of the funds made available to households above the poverty line has not been disbursed yet), households below the poverty line are planned to benefit from only 16% of the released funds following the start of the LSY programme. This raises the question of whether a large proportion of public funds are likely to be captured by households with average or above average incomes, thereby blurring the poverty targeting principle that lies at the heart of the TSC.
13 Bihar Times, 20 April 2010.
23
> Report5.3 Leveraging
This section looks at the effectiveness of public funds to effectively leverage financing from households. We look at two indicators:
• The ratio of household investments over public funds provided (leverage ratio).
• The number of individual latrines built for INR 50,000 of public investment (‘value for money’).
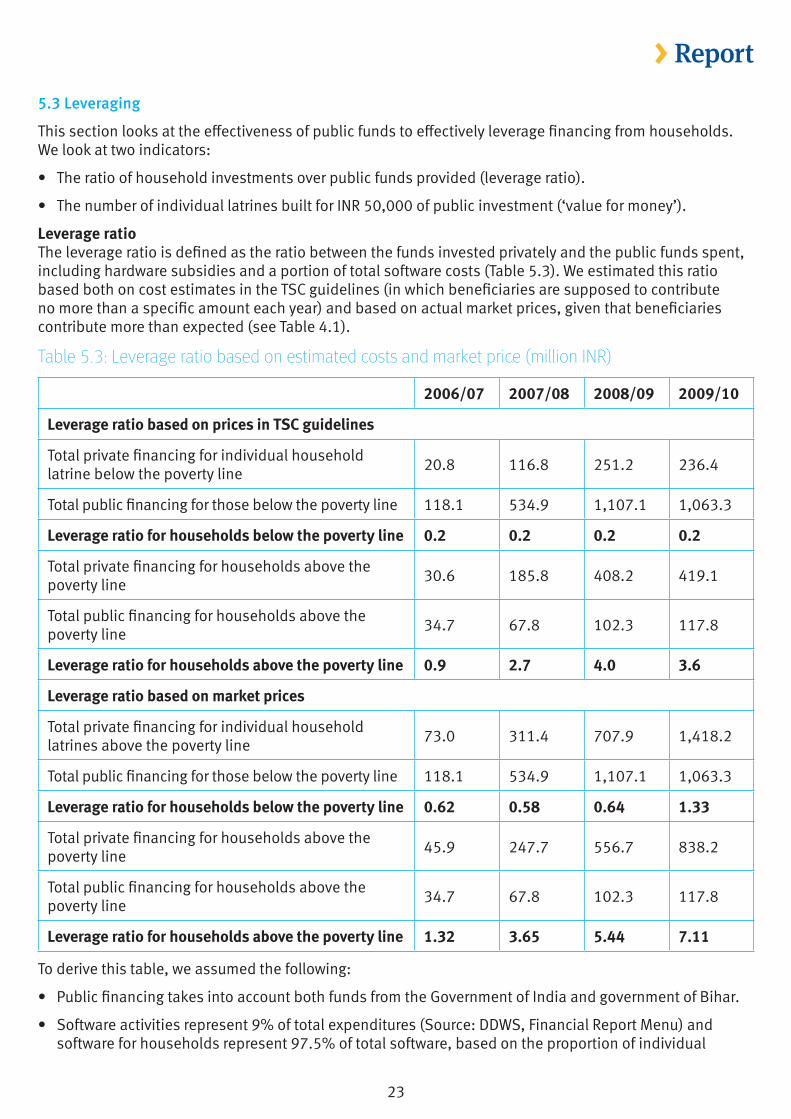
Leverage ratioThe leverage ratio is defined as the ratio between the funds invested privately and the public funds spent, including hardware subsidies and a portion of total software costs (Table 5.3). We estimated this ratio based both on cost estimates in the TSC guidelines (in which beneficiaries are supposed to contribute no more than a specific amount each year) and based on actual market prices, given that beneficiaries contribute more than expected (see Table 4.1).
Table 5.3: Leverage ratio based on estimated costs and market price (million INR)
2006/07 2007/08 2008/09 2009/10
Leverage ratio based on prices in TSC guidelines
Total private financing for individual household latrine below the poverty line 20.8 116.8 251.2 236.4
Total public financing for those below the poverty line 118.1 534.9 1,107.1 1,063.3
Leverage ratio for households below the poverty line 0.2 0.2 0.2 0.2
Total private financing for households above the poverty line 30.6 185.8 408.2 419.1
Total public financing for households above the poverty line 34.7 67.8 102.3 117.8
Leverage ratio for households above the poverty line 0.9 2.7 4.0 3.6
Leverage ratio based on market prices
Total private financing for individual household latrines above the poverty line 73.0 311.4 707.9 1,418.2
Total public financing for those below the poverty line 118.1 534.9 1,107.1 1,063.3
Leverage ratio for households below the poverty line 0.62 0.58 0.64 1.33
Total private financing for households above the poverty line 45.9 247.7 556.7 838.2
Total public financing for households above the poverty line 34.7 67.8 102.3 117.8
Leverage ratio for households above the poverty line 1.32 3.65 5.44 7.11
To derive this table, we assumed the following:
• Public financing takes into account both funds from the Government of India and government of Bihar.
• Software activities represent 9% of total expenditures (Source: DDWS, Financial Report Menu) and software for households represent 97.5% of total software, based on the proportion of individual
24
> Reporthousehold latrines built compared to sanitary complexes, school and balwadi toilets over the TSC period from 2001 to 2010.
• Latrine costs are the same for households above and below the poverty line – only households above the poverty line pay the full amount for latrines, whereas households below the poverty line only pay 20% of the cost.
• Public funds for households above the poverty line are limited to software expenditures, and we consider that all software expenditures for individual household latrines are directed households both above and below the poverty line.
We can draw two main conclusions from this table:
• The leverage ratio for households above the poverty line is much higher than those below the poverty line, since there are no subsidies in the TSC for household latrines for those above the poverty line. However, with the NBA programme providing subsidies to identified households above the poverty line14 (up to INR 5100 (USD 108) per household, with a household contribution of INR 900 (USD 19)) this leveraging ratio was set to decrease. It is unlikely that this will lead to a decrease in subsidies for households below the poverty line as the overall budget has increased significantly under the NBA.
• The leverage ratio actually increases when we consider actual market prices, since households had to invest more to comply with Government requirements15.
Value for money ratioTable 5.4 below shows the value for money ratio, ie the number of latrines built with INR 50,000 (approximately USD 1,000) for all households, both above and below the poverty line16. This table shows a decrease in the ratio over time, as the technical specifications and the costs of latrines have increased. The ratio is consistently higher for those above the poverty line than for those below, however, as households above the poverty line received no hardware subsidy until recently and were expected to invest themselves in building a latrine.
14 Under the NBA guidelines, these ‘identified’ households above the poverty line are: scheduled castes/scheduled tribes, small and marginal farmers, landless labourers with homesteads, physically handicapped and women-headed households.
15 However, we note that the estimated leverage ratio is lower than the similar ratio estimated under the TSC in the State of Maharashtra (Trémolet et al, 2010), which found an average leverage ratio of 10, with the ratio going up to 30 for APL households in certain districts. Several factors may account for this difference: on the one hand, the WSP study calculated leverage based on actual investments made by households above and below the poverty line, which were higher for households above the poverty line. The number of households above the poverty line which had invested in building latrines was comparatively higher in Maharashtra, something that may partly be the result of a strong emphasis on community awards for becoming ODF (in fact Maharashtra initiated what then became the NGP throughout India).
16 A comparable ratio estimated in Trémolet et al (2010) was 50 on average in the state of Maharashtra.

25
> Report
Table 5.4: Value for money: number of latrines built with INR 50,000 of public spending (approximately USD 1,000)
2006/07 2007/08 2008/09 2009/10
Number of individual household latrines below the poverty line constructed 130,286 389,205 570,905 472,722
Total public financing for individual household latrines below the poverty line 118,070,615 534,894,300 1,107,091,750 1,063,274,700
Below poverty line value for money ratio 55 36 26 22
Number of individual household latrines above the poverty line constructed 38,280 123,845 185,560 167,637
Total public financing for individual household latrines above the poverty line 34,687,575 67,848,300 102,298,950 117,830,700
Above poverty line value for money ratio ratio 55 91 91 71
Total number of latrines constructed 168,566 513,050 756,465 640,359
Total public financing 152,758,190 602,742,600 1,209,390,700 1,181,105,400
Value for money ratio 55 43 31 27

26
> Report
6 ConclusionsTo conclude, we examine whether public financing for sanitation in Bihar can be considered effective and formulate recommendations for improvement. Such recommendations are focused on how to improve financing rather than other aspects of public policy, but where other bottlenecks have been identified, these are also noted.
Financing availability for sanitation has not been an issue so far in Bihar, but absorption capacity has been a constraining factor. Substantial amounts of public funding have been allocated to the TSC in the state of Bihar, both by the Government of India and the government of Bihar, with a total of close to INR 20 billion (USD 425.5 million) set aside for the TSC by 2006. Yet only 20% of this amount had been effectively spent by mid-2010, even though the TSC ended in 2012. Although the number of latrines in rural parts of the state had more than doubled since 2001, there remained a considerable access deficit, with more than two thirds of the rural population without access to an improved latrine in the state of Bihar by 2010.
Slow disbursement of funds can be attributed to a variety of factors. Most district engineers have no experience in allocating funds to software activities: they would benefit from initial training on demand-responsive approaches and collaborating with NGOs and CBOs, which would help them to make appropriate allocations of software. Whereas total software expenditure accounts for about 9% of the funds allocated to sanitation in Bihar, slightly under 15% had been spent effectively in this spending category (IEC activities). Funds that have been spent did not necessarily lead to results. There appear to be considerable stocks of leaflets and communication materials left over, which had never been used to communicate critical messages. As a result, demand for latrines had not been sufficiently stimulated and there was no evidence that capacity to conduct demand promotion activities had been built.
Another factor leading to slow disbursement is the number of NGOs active in the sanitation sector, often to fill a gap left by local governments. In the district of Patna alone, there are 70 NGOs active in rural sanitation, which increases the length of the verification process for subsidies’ disbursement as there are numerous reimbursement applications for comparatively small amounts of money. This is compounded by the fact that the verification process is too centralised and limited to a small number of functionaries, who are usually unclear about what the local government will support and have an inherent reluctance against channelling funding to NGOs. To remedy this, some states like Tamil Nadu have decentralised the verification process. GP or village-level government representatives are now in charge of monitoring and evaluation.
Where demand promotion is done, some good principles are in place in order to ensure better accountability for such funds, such as paying motivators based on performance. However, there are limits to how much relatively fragile service providers can be required to pre-finance services, especially when there are delays in transferring the funds due to the multiple procedural steps required. As a result, several NGOs which were in charge of demand promotion and latrine building have decided to withdraw from the sanitation sector as it was taking too long for them to obtain reimbursement for their initial outlay.
Other financial tools to stimulate demand, like the NGP awards, have been under-utilised in Bihar compared to other states. In Bihar, only a limited number of districts have been awarded the NGP award and delays were noted in transferring the awards to those who had obtained it whilst the number of ODF villages has been questioned. By contrast, in Maharashtra, for example, the NGP has provided added incentives for households above the poverty line to invest, since all households had to invest in building a latrine for the village to be eligible for the NGP award17. In Maharashtra, the NGP also allowed a change in mind set on the public side, away from a focus on building latrines towards demand promotion. The use of such financial tools should be encouraged so as to trigger community mobilisation to reach ODF status at village level, provided adequate performance verification mechanisms can be built into the overall process.
17 See Trémolet et al (2010).

27
> ReportUnder the TSC, instead of placing emphasis on demand promotion, the government of Bihar decided to allocate additional hardware subsidies to households above the poverty line18. The rationale for providing subsidies to households above the poverty line seems unclear, which is a significant issue considering the large sums of public financing that have been allocated for such subsidies (this is much higher than the sums dedicated to, households below the poverty line and Mahadalit which raises issues in terms of equity and value for money). There are several issues with this approach. This subsidy policy does not seem to rest on a thorough analysis as to why households above the poverty line are not currently investing in sanitation as much as they should, so as to understand whether a lack of investment is due to a lack of understanding, demand or availability, of the product or a financial constraint.
As an alternative, the possibility of providing financing assistance (in the form of access to credit for example) to enable households above the poverty line to invest in building a latrine appears to have been insufficiently explored during the TSC. If it was established that households above the poverty line are not currently investing sufficiently because of difficulties in financing their share (which is the underlying assumption of the LSY), additional options to help them cover their share should be contemplated to reduce the impact on public funds. This could include the creation of revolving funds (with seed money from the government only provided to finance a small number of demonstration latrines) or facilitated access to existing micro-finance institutions. Such an approach has proved effective in other parts of India (including in the state of Maharashtra, as reviewed in Trémolet et al (2010) or in Thailand, as reviewed in a companion case study. Through the NBA programme, revolving funds will be set up at district level. Those revolving funds will be accessed by households above the poverty line, who are not covered for incentives under the guidelines.
In addition, providing more flexibility to households as to the choice of latrines may help stimulate demand. The government of Bihar has been gradually tightening requirements for the type of latrines to be constructed, which act as a pre-condition for receiving the subsidy. However, the cost of building such latrines has been under-estimated in the government guidelines and we estimated that the actual market prices were between 30% and 100% higher than the cost estimated by the government. Given that the difference needs to be covered by households, this has probably dampened demand further (or led some households to skimp on quality in a way that might not be sustainable). Additional flexibility on the type of latrine built, with a fixed subsidy provided to cover the cost of a ‘minimum quality’ latrine and leaving households in charge of deciding which quality level they can afford, may also contribute to boosting demand.
The NBA seeks to implement a demand-driven approach, which places greater emphasis on software activities. This is a positive evolution from TSC guidelines. High rates of return to open defecation when pits are full (close to 90% in some districts) indicate that the TSC has failed to trigger real behaviour change. Although this behaviour could be deterred by more adequate material, if thorough software activities had been conducted and real behaviour change realised, households who have been using latrines for two years would find solutions to continue safe sanitation practices and not return to open defecation practices. The NBA programme has included the provision for increased investment in IEC materials around the maintenance of latrines, although pit-emptying is not directly referenced in the new guidelines.
A clear monitoring and verification system is crucial to ensure:
• Sustainability: Although latrine coverage has increased substantially in the past few years, there remains a considerable question mark as to the sustainability of these latrines. Monitoring is focused on construction rather than on actual usage of the latrines (and in some cases on disbursed subsidies as discussed in the next point below). Anecdotal evidence collected in the villages, bolstered by a
18 Since the case study research was carried out in 2010, the policy at Federal level has also changed. The NBA allocates important subsidies to ‘identified above poverty line families’ (see footnote 15). In the context of the NBA, it is unlikely that this will divert resource from families below the poverty line as the overall budget allocated to the programme has also increased significantly.
28
> Reportrecent research on usage in NGP-awarded Panchayats (TARU, 2008), indicated that only women tend to use the latrines, whilst men and children continue to defecate in the open fields19. Besides, public funding is exclusively focused on building new latrines, and no public funds are allocated for upgrading latrines or helping households to empty them hygienically once they fill up. Besides, there does not appear to be much analysis done on the health impact that may occur when householders empty the content of their latrines in a nearby field. Additional funding should be allocated to ensure continuous monitoring, perhaps with the release some of the ex-post subsidies in tranches based on verification of ongoing usage.
• The actual use of subsidy delivery for latrines construction: The lack of thorough verification means there is of room for abuse and subsidies can be disbursed without latrine being constructed. This study in Bihar indicates that results are reported based on latrine construction, not on usage. However, there is evidence that some DDWS and TSC data coverage figures have been reported based on subsidies disbursed, and not on actual latrine constructed. This explains why the NGP has been given out to so few communities even though latrine construction levels are reported to be high.
Institutional weakness is a blockage in the delivery of software activities. Under the TSC, capacity to promote demand has not been built at the PRI level. CCDUs, in charge of overall guidance and support to local level software activities, lack capacity, both in number and skills of staff. The new NBA programme tries to respond to this by providing more guidance on resources available to CCDUs and placing more people at the block and GP level with a mandate to lead software activities. However, there are still weak structures and support mechanisms within the system to maximise these people and this new institutional set-up effectively. It will therefore remain to be seen whether the NBA delivers a substantial shift in the pace of sanitation service delivery for the rural population in Bihar.
19 Discussions with communities indicate that this is because of several reasons and key among them are: (1) one toilet per household is not enough for large families and members often find it more convenient to go out; (2) when all family members use the toilet, the water carrying burden increases, leading to men or women preferring using the fields.

29
> Report
Annex A: List of supporting documentsWeb resources:
Government database: TSC online progress monitoring system http://ddws.gov.in/crspnet/crspmain.aspx
Background documents:
Trémolet, S with Kolsky, P and Perez, E (2010), Financing on-site sanitation for the poor: A six-country comparative review and analysis. Water and Sanitation Program, Washington DC, USA
WaterAid (2008), Feeling the pulse: A study of the total sanitation campaign in five states, WaterAid, UK
Supporting documents
Department of Drinking Water Supply, Ministry of Rural Development, Government of India (2007) Guidelines, central rural sanitation programme: Total Sanitation Campaign www.nird.org.in/brgf/doc/TSC%20Guideline%20Oct07.doc
Department of Drinking Water Supply, Ministry of Rural Development, Government of India (2008) Revised guidelines for TSC: office memorandum
Department of Drinking Water Supply, Ministry of Rural Development, Government of India (2012) Nirmal Bharat guidelines www.mdws.gov.in/sites/upload_files/ddws/files/pdfs/Final%20Guidelines%20(English).pdf
Department of Drinking Water Supply, Ministry of Rural Development, Government of India (2012) Nirmal Gram Puraskar guidelines http://ddws.nic.in/popups/ngp-guidelines.pdf.
TARU (2008) Impact assessment of the Nirmal Gram Puraskar Awarded Panchayats (prepared for UNICEF)
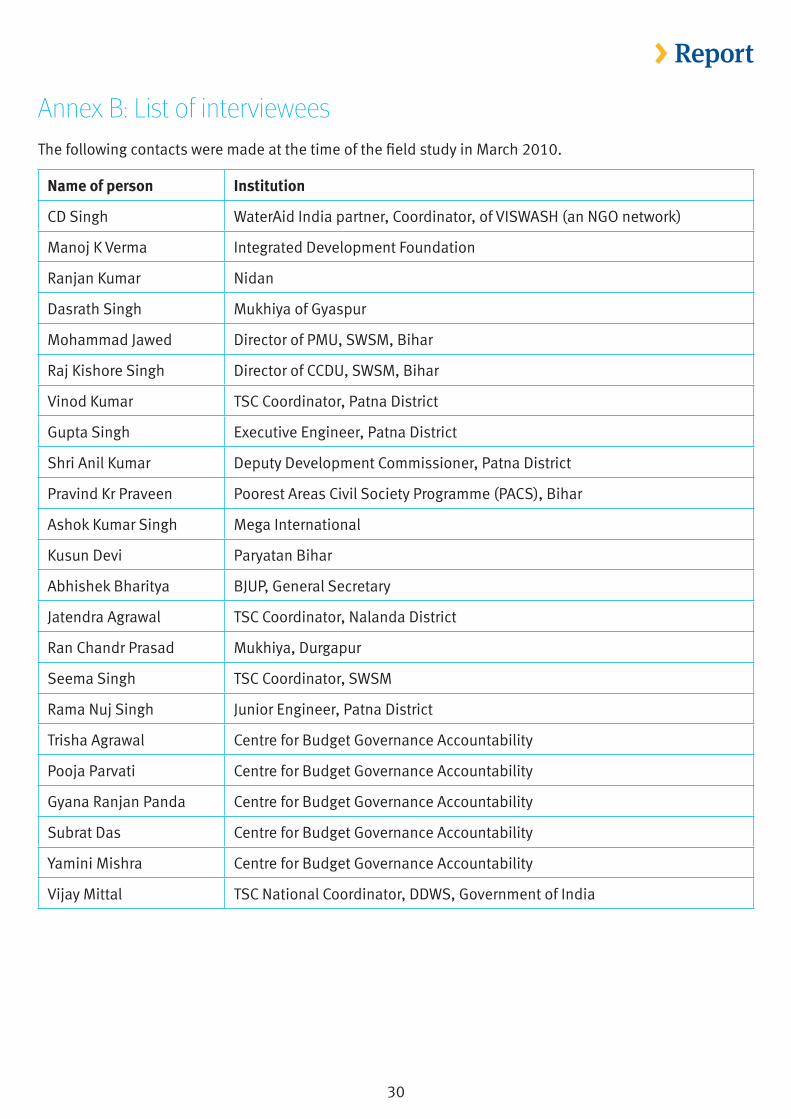
30
> Report
Annex B: List of intervieweesThe following contacts were made at the time of the field study in March 2010.
Name of person Institution
CD Singh WaterAid India partner, Coordinator, of VISWASH (an NGO network)
Manoj K Verma Integrated Development Foundation
Ranjan Kumar Nidan
Dasrath Singh Mukhiya of Gyaspur
Mohammad Jawed Director of PMU, SWSM, Bihar
Raj Kishore Singh Director of CCDU, SWSM, Bihar
Vinod Kumar TSC Coordinator, Patna District
Gupta Singh Executive Engineer, Patna District
Shri Anil Kumar Deputy Development Commissioner, Patna District
Pravind Kr Praveen Poorest Areas Civil Society Programme (PACS), Bihar
Ashok Kumar Singh Mega International
Kusun Devi Paryatan Bihar
Abhishek Bharitya BJUP, General Secretary
Jatendra Agrawal TSC Coordinator, Nalanda District
Ran Chandr Prasad Mukhiya, Durgapur
Seema Singh TSC Coordinator, SWSM
Rama Nuj Singh Junior Engineer, Patna District
Trisha Agrawal Centre for Budget Governance Accountability
Pooja Parvati Centre for Budget Governance Accountability
Gyana Ranjan Panda Centre for Budget Governance Accountability
Subrat Das Centre for Budget Governance Accountability
Yamini Mishra Centre for Budget Governance Accountability
Vijay Mittal TSC National Coordinator, DDWS, Government of India

47-49 Durham StreetLondon SE11 5JDUK