Evaluating population structure by neutral markers in a thinned progeny trial of Eucalyptus...
11
Journal of Tropical Forest Science 25(3): 350–360 (2013) Quang TH et al. 350 © Forest Research Institute Malaysia *[email protected] EVALUATING POPULATION STRUCTURE BY NEUTRAL MARKERS AND QUANTITATIVE GENETIC PARAMETERS IN A THINNED PROGENY TRIAL OF EUCALYPTUS UROPHYLLA TH Quang 1, 2, *, N Gyllenstrand 1 , G Jansson 1, 4 , R Griffin 3 , S von Arnold 1 & D Clapham 1 1 Department of Plant Biology and Forest Genetics, Swedish University of Agricultural Sciences, Box 7080, SE-750 07 Uppsala, Sweden 2 Centre for Biotechnology in Forestry, Vietnamese Academy of Forest Sciences, Dong Ngac, Tu Liem, Ha Noi, Vietnam 3 School of Plant Science, University of Tasmania, Private Bag 55, Hobart , Tasmania 7001, Australia 4 Forestry Research Institute of Sweden, Uppsala Science Park, SE-751 83 Uppsala, Sweden Received April 2012 QUANG TH, GYLLENSTRAND N, JANSSON G, GRIFFIN R, VON ARNOLD S & CLAPHAM D. 2013. Evaluating population structure by neutral markers and quantitative genetic parameters in a thinned progeny trial of Eucalyptus urophylla. The aim of this study was to estimate from microsatellite variation the levels of homozygote excess within nine populations comprising a combined population and progeny trial of Eucalyptus urophylla in northern Vietnam and to compare the population differentiation estimated by molecular markers with that estimated from growth traits. The material was thinned in year 2 (removing 75% of the trees) and year 5 (removing 37% of the remaining trees). Microsatellite variation was measured after the second thinning. Homozygote excess (F IS ) among populations ranged from 0.069 to 0.198. Most of the molecular variation was within populations (97.1% of the total variation), in agreement with the low FST value (0.023) of neutral molecular markers (F ST ) (0.023). Estimates of quantitative trait differentiation (Q ST ) based on a univariate model among populations for height and diameter at breast height were low over the first eight years of the trial, at most 0.21. This presumably reflected selection for the same traits in a common environment. The differences between Q ST after the second thinning and F ST , a measure of the effects of selection, were also small. Prospects for further breeding progress are bright, whether or not crosses are made among populations. Keywords: Genetic variation, homozygote excess, microsatellite, quantitative variation QUANG TH, GYLLENSTRAND N, JANSSON G, GRIFFIN R, VON ARNOLD S & CLAPHAM D. 2013. Menilai struktur populasi menggunakan penanda neutral serta parameter genetik kuantitatif bagi uji kaji progeni Eucalyptus urophylla yang dijarangkan. Tujuan kajian ini adalah untuk menganggar tahap lebihan homozigot (F IS ) mengunakan variasi mikrosatelit. Kajian melibatkan sembilan populasi yang terdiri daripada populasi bercampur serta uji kaji progeni Eucalyptus urophylla di utara Vietnam. Seterusnya nilai pembezaan populasi yang dianggar menggunakan penanda molekul dibandingkan dengan nilai yang dianggar daripada ciri pertumbuhan. Penjarangan pokok dijalankan pada tahun kedua (75% pokok ditebang) dan kelima (37% daripada baki pokok ditebang). Variasi mikrosatelit diukur selepas penjarangan kedua. F IS di kalangan populasi berjulat antara 0.069 dengan 0.198. Kebanyakan variasi molekul berlaku dalam populasi (97.1% daripada variasi keseluruhan) selari dengan nilai penanda molekul neutral (F ST ) yang rendah iaitu 0.023. Anggaran pembezaan ciri kuantitatif (Q ST ) berdasarkan model univariat di kalangan populasi untuk ketinggian dan diameter aras dada adalah rendah sepanjang lapan tahun pertama uji kaji dan nilai tertinggi hanyalah 0.21. Ini menggambarkan pemilihan ciri yang sama di persekitaran yang serupa. Ukuran kesan pemilihan iaitu perbezaan antara Q ST selepas penjarangan kedua dengan F ST adalah kecil. Kejayaan kemajuan pembiakbakaan seterusnya adalah cerah, tanpa mengira sama ada kacukan berlaku di kalangan populasi atau tidak. INTRODUCTION Seed orchards consist of selected clones (clonal seed orchard) or families (seedling seed orchard) that are managed to produce genetically improved seed for operational forestry without jeopardising genetic diversity. Seedling seed orchards are preferred to clonal seed orchards when a progeny trial can form the basis of a production seed orchard as well as a step in a long-term breeding programme (White et al. 2007). Seedling seed orchards have been used
-
Upload
independent -
Category
Documents
-
view
0 -
download
0
Transcript of Evaluating population structure by neutral markers in a thinned progeny trial of Eucalyptus...

Journal of Tropical Forest Science 25(3): 350–360 (2013) Quang TH et al.
350© Forest Research Institute Malaysia
EVALUATING POPULATION STRUCTURE BY NEUTRAL
MARKERS AND QUANTITATIVE GENETIC PARAMETERS IN A
THINNED PROGENY TRIAL OF EUCALYPTUS UROPHYLLA
TH Quang1, 2, *, N Gyllenstrand1, G Jansson1, 4, R Griffin3, S von Arnold1 & D Clapham1
1Department of Plant Biology and Forest Genetics, Swedish University of Agricultural Sciences, Box 7080, SE-750 07 Uppsala, Sweden2Centre for Biotechnology in Forestry, Vietnamese Academy of Forest Sciences, Dong Ngac, Tu Liem, Ha Noi, Vietnam3School of Plant Science, University of Tasmania, Private Bag 55, Hobart , Tasmania 7001, Australia4Forestry Research Institute of Sweden, Uppsala Science Park, SE-751 83 Uppsala, Sweden
Received April 2012
QUANG TH, GYLLENSTRAND N, JANSSON G, GRIFFIN R, VON ARNOLD S & CLAPHAM D. 2013.
Evaluating population structure by neutral markers and quantitative genetic parameters in a thinned progeny
trial of Eucalyptus urophylla. The aim of this study was to estimate from microsatellite variation the levels of homozygote excess within nine populations comprising a combined population and progeny trial of Eucalyptus urophylla in northern Vietnam and to compare the population differentiation estimated by molecular markers with that estimated from growth traits. The material was thinned in year 2 (removing 75% of the trees) and year 5 (removing 37% of the remaining trees). Microsatellite variation was measured after the second thinning. Homozygote excess (FIS) among populations ranged from 0.069 to 0.198. Most of the molecular variation was within populations (97.1% of the total variation), in agreement with the low FST value (0.023) of neutral molecular markers (FST) (0.023). Estimates of quantitative trait differentiation (QST) based on a univariate model among populations for height and diameter at breast height were low over the first eight years of the trial, at most 0.21. This presumably reflected selection for the same traits in a common environment. The differences between QST after the second thinning and FST , a measure of the effects of selection, were also small. Prospects for further breeding progress are bright, whether or not crosses are made among populations.
Keywords: Genetic variation, homozygote excess, microsatellite, quantitative variation
QUANG TH, GYLLENSTRAND N, JANSSON G, GRIFFIN R, VON ARNOLD S & CLAPHAM D. 2013. Menilai struktur populasi menggunakan penanda neutral serta parameter genetik kuantitatif bagi uji kaji
progeni Eucalyptus urophylla yang dijarangkan. Tujuan kajian ini adalah untuk menganggar tahap lebihan homozigot (FIS) mengunakan variasi mikrosatelit. Kajian melibatkan sembilan populasi yang terdiri daripada populasi bercampur serta uji kaji progeni Eucalyptus urophylla di utara Vietnam. Seterusnya nilai pembezaan populasi yang dianggar menggunakan penanda molekul dibandingkan dengan nilai yang dianggar daripada ciri pertumbuhan. Penjarangan pokok dijalankan pada tahun kedua (75% pokok ditebang) dan kelima (37% daripada baki pokok ditebang). Variasi mikrosatelit diukur selepas penjarangan kedua. FIS di kalangan populasi berjulat antara 0.069 dengan 0.198. Kebanyakan variasi molekul berlaku dalam populasi (97.1% daripada variasi keseluruhan) selari dengan nilai penanda molekul neutral (FST) yang rendah iaitu 0.023. Anggaran pembezaan ciri kuantitatif (QST) berdasarkan model univariat di kalangan populasi untuk ketinggian dan diameter aras dada adalah rendah sepanjang lapan tahun pertama uji kaji dan nilai tertinggi hanyalah 0.21. Ini menggambarkan pemilihan ciri yang sama di persekitaran yang serupa. Ukuran kesan pemilihan iaitu perbezaan antara QST selepas penjarangan kedua dengan FST adalah kecil. Kejayaan kemajuan pembiakbakaan seterusnya adalah cerah, tanpa mengira sama ada kacukan berlaku di kalangan populasi atau tidak.
INTRODUCTION
Seed orchards consist of selected clones (clonal seed orchard) or families (seedling seed orchard) that are managed to produce genetically improved seed for operational forestry without jeopardising genetic diversity. Seedling seed
orchards are preferred to clonal seed orchards when a progeny trial can form the basis of a production seed orchard as well as a step in a long-term breeding programme (White et al. 2007). Seedling seed orchards have been used

Journal of Tropical Forest Science 25(3): 350–360 (2013) Quang TH et al.
351© Forest Research Institute Malaysia
successfully in improvement programmes for a number of eucalypt species such as Eucalyptus urophylla, E. grandis and E. tereticornis in China (Jiayu et al. 2003). A seedling seed orchard is established from open-pollinated families or full-sib mating among selected trees. During development of seedling seed orchards, genetic thinning is used to increase genetic gain. To reduce the risk of inbreeding among trees in the same family which can lead to inbreeding depression, restrictions are put on the number of trees per family (White et al. 2007). Trees with inferior predicted breeding values are removed from the seedling seed orchard and genetically superior trees are kept for seed production. For many species including forest trees, estimates of population divergences in quantitative growth traits (QST) have been compared with estimates of population divergence obtained from supposedly neutral molecular markers (FST) such as microsatellites. Steane et al. (2006) compared QST and FST data for 10 native populations of E. globulus and suggested that at least five of the quantitative traits that defined races had been influenced by natural selection. In Eucalyptus breeding populations, microsatellite markers have been used to analyse parentage in a population/progeny trial of E. grandis (Kirst et al. 2005), gene flow in seed orchards of E. grandis (Chaix et al. 2003), and genetic diversity and relationship between individuals and populations in seedling seed orchards of E. nitens (Gea et al. 2007) and E. urophylla (Tripiana et al. 2007). Random amplification polymorphic DNA (RAPD) markers have been used to analyse genetic variability in E. urophylla (Leite et al. 2002). Eucalyptus urophylla is a forest tree species that is frequently planted in humid and subhumid tropical climates. The natural range in the Indonesian islands extends from elevations of 300 to about 1100 m, with a dry season varying from 2 to 8 months. In northern and central regions of Vietnam it has become a commercially important tree species since its introduction in 1984 and materials from a wide range of populations have been included in the Vietnamese breeding programmes. Combined population and progeny trials have been set up at various locations. Progeny trials have been selectively thinned and have formed the basis of seedling seed orchards (Kien et al. 2009). The structure of genetic variation among thinned populations
needs to be studied in order to guide further breeding. A question of particular interest is the extent of homozygote excess (FIS) among various populations after selection through thinning. The objectives of the present investigation were to (1) assess the genetic structure of materials within the progeny trial after thinning and (2) compare, after the second thinning, the population differentiation estimated by FST with that estimated by QST according to a univariate model. To compare population differentiation in the original planted material, QST was estimated according to a multivariate model.
MATERIALS AND METHODS
Plant material
Trees of E. urophylla were obtained from a stand that included 144 open-pollinated families from nine natural populations distributed over seven islands in East Timor (122° –127°
E, 8°–10° S). This comprised an area of 500 km × 200 km (Figure 1, Table 1). Following the classification of Brooker (2000), all populations, including Wetar 4 and Wetar 5, were regarded as belonging to E. urophylla. Trees studied were from a combined population and progeny trial which also served as a seedling seed orchard at Ba Vi, Ha Noi (21° 07' N, 105° 26' E, 44 m above sea level). The soil is degraded ferralitic clay–loam with general loss of topsoil through erosion, low levels of nitrogen, phosphorus and potassium and soil depth 40–70 cm. The families in this study were set out in a row–column design (12 rows × 12 columns) with eight replicates of all 144 families and four-tree row plots. Each four-tree plot consisted of trees of the same family. The initial spacing was 4 m between rows and 1.5 m within rows. Of the 4244 planted trees, 3962 were alive after two years. The progeny test was first thinned at age 2 years by leaving the single tree with the best vigour and stem form in each plot. For the second thinning at age 5 years, 17 slowest-growing families and inferior trees of some other families were removed, leaving 127 families representing all nine populations with four to eight trees per family (except in the case of Alor 2; Table 1). Height and diameter at breast height (dbh) were measured for all trees at 1, 2, 3, 5 and 8 years. For deoxyribonucleic acid (DNA) analysis, fresh leaves were collected after the second thinning
Journal of Tropical Forest Science 25(3): 350–360 (2013) Quang TH et al.
352© Forest Research Institute Malaysia
from 12 (except for Alor 1, 10) trees chosen randomly from each of the nine populations. The number of families sampled varied from 5 (Pantar 1 and Pantar 2) to 11 (Flores 2) per population.
DNA extraction and microsatellite analysis
DNA was extracted from 200 mg leaves of each sampled tree following the cetyl trimethyl
ammonium bromide (CTAB) method of Gawel and Jarret (1991). The quality of DNA was checked by agarose gel electrophoresis and spectrophotometry. A260/A280 ratios of the DNA samples were in the range of 1.8–2.2. Thirteen EMBRA microsatellite markers (Brondani et al. 2006) were selected for analysis to be reasonably spread over the genome: EMBRA 12, EMBRA 16, EMBRA 56 and EMBRA 70 were located in linkage group I, EMBRA 36
Figure 1 Location of natural populations of Eucalyptus urophylla in Indonesia and Timor with collection
seedlot numbers
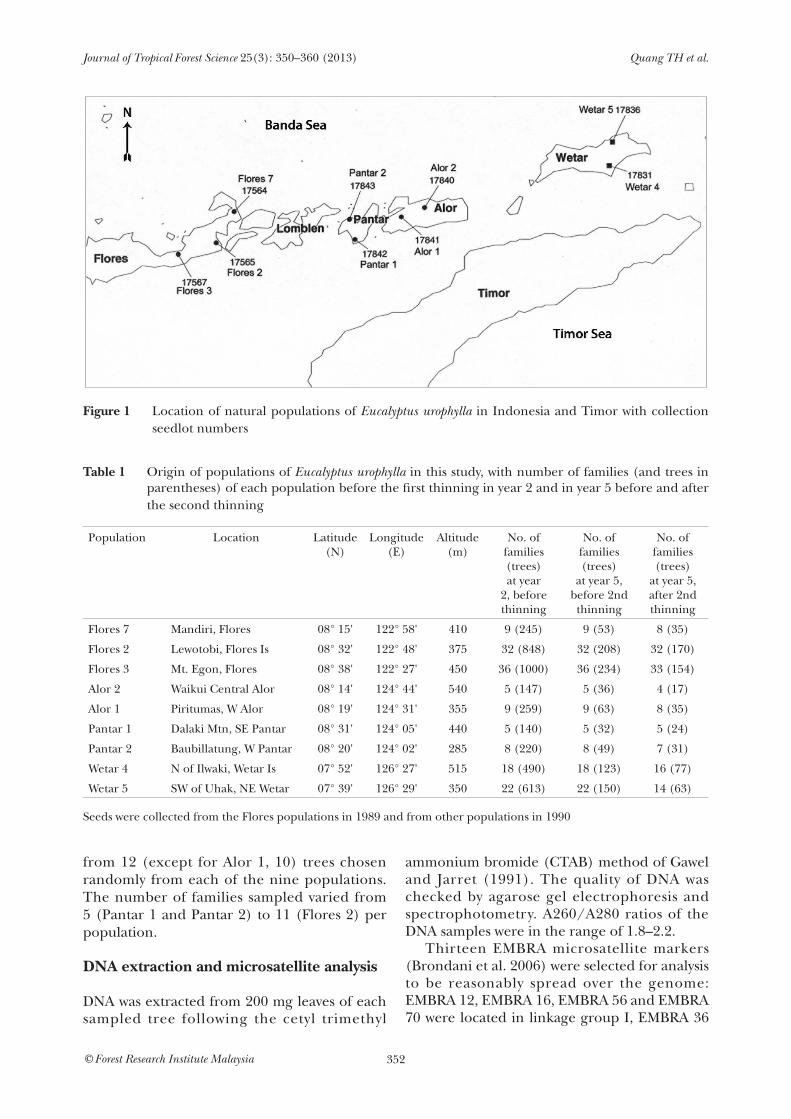
Table 1 Origin of populations of Eucalyptus urophylla in this study, with number of families (and trees in parentheses) of each population before the first thinning in year 2 and in year 5 before and after
the second thinning
Population Location Latitude(N)
Longitude(E)
Altitude(m)
No. of families (trees) at year
2, before thinning
No. of families (trees)
at year 5, before 2nd thinning
No. of families (trees)
at year 5, after 2nd thinning
Flores 7 Mandiri, Flores 08° 15' 122° 58' 410 9 (245) 9 (53) 8 (35)
Flores 2 Lewotobi, Flores Is 08° 32' 122° 48' 375 32 (848) 32 (208) 32 (170)
Flores 3 Mt. Egon, Flores 08° 38' 122° 27' 450 36 (1000) 36 (234) 33 (154)
Alor 2 Waikui Central Alor 08° 14' 124° 44' 540 5 (147) 5 (36) 4 (17)
Alor 1 Piritumas, W Alor 08° 19' 124° 31' 355 9 (259) 9 (63) 8 (35)
Pantar 1 Dalaki Mtn, SE Pantar 08° 31' 124° 05' 440 5 (140) 5 (32) 5 (24)
Pantar 2 Baubillatung, W Pantar 08° 20' 124° 02' 285 8 (220) 8 (49) 7 (31)
Wetar 4 N of Ilwaki, Wetar Is 07° 52' 126° 27' 515 18 (490) 18 (123) 16 (77)
Wetar 5 SW of Uhak, NE Wetar 07° 39' 126° 29' 350 22 (613) 22 (150) 14 (63)
Seeds were collected from the Flores populations in 1989 and from other populations in 1990

Journal of Tropical Forest Science 25(3): 350–360 (2013) Quang TH et al.
353© Forest Research Institute Malaysia
in group II, EMBRA 41 and EMBRA 64 in group V, EMBRA 28 in group VI, EMBRA 42 in group VII, EMBRA 58 in group IX, EMBRA 38 and EMBRA 40 in group X and EMBRA 29 in group XI. The primer sequences and polymerase chain reaction (PCR) amplification were as described by Brondani et al. (2006). PCR products were separated on 40% denaturing polyacrylamide gels and stained by silver nitrate. Product sizes were assessed by the Quantity One program (Bio-Rad).
Molecular genetic data analysis
Before analysing for different genetic parameters, all microsatellite data were checked for genotyping errors owing to null alleles or short allele dominance (large allele dropout) and for scoring error due to stuttering using the Micro-Checker 2.2.3 program. Variations in mobilities of alleles from gel to gel were compensated for by including reference DNA ladders. Linkage disequilibrium among the 13 microsatellite loci was tested using Genpop web (2008) service with Bonferroni adjustment for multiple comparisons. This test determined if loci in the same linkage group (group I, group V or group X) were associated in our samples. If loci are associated, they are not independent markers of genetic variation among populations. Population genetic parameters and principal component analysis (PCA) were calculated using GenAlEx 6.1 (Excel, 2006) for number of different alleles per polymorphic locus (Na), number of effective alleles (Ne), observed heterozygosity (Ho) and unbiased expected heterozygosity (He). Analysis of molecular variance (AMOVA) for the nine populations was calculated using ARLEQUIN 3 program (2005). Population differentiation was estimated by F-statistics using the program FSTAT 2.9.3.2 (2001) following Weir and Cockerham (1984). Mean values of the F-statistics parameters, namely, FIT (correlation of alleles within individuals), FIS (correlation of alleles within individuals within populations) and FST (correlation of alleles of different individuals in the same population) were obtained across loci and standard errors by jackknifing over loci. Deviations from Hardy–Weinberg equilibrium were estimated by evaluating whether FIS values within each sample were significantly different from zero. Tests of disequilibria were performed
between all pairs of loci over samples and between all pairs of loci within each sample. Sequential Bonferroni corrections were performed on all analyses as a function of this program. Indicative adjustment nominal level was set at 5% (following traditional tests for significance at 5% level with 2000 permutations)
Quantitative data analysis
Data were analysed using univariate and multivariate models. A univariate model estimated the effect of thinning on genetic parameters. A longitudinal multivariate model was used as a comparison to minimise the effect of reducing the number of trees by thinning and thereby account for selective thinning. This approach, with data on all trees prior to thinning and only remaining trees after thinning, produced nearly unbiased genetic parameters (Wei & Borralho 1998). Variance components between and within populations were calculated using ASReml (version 3.0, 2009) based on the following mixed model equation:
y = Xb + Zpp + Zuu + Ztt + Zcc + Zww + e
where y = vector of individual tree observations at one age in the univariate model and at different ages in the multivariate model, b = fixed block effects, p = random population effects, u = random individual effects, t = random row within block effects, c = random column within block effects, w = random plot effects and e = vector of random residuals. X, Zp, Zu, Zt, Zc and Zw are incidence matrices relating b, p, u, t, c, w and e to y. The random effects were assumed to follow an independent multivariate distribution with zero means and (co)variances:
where 0 = is a null matrix, I = an identity matrix of order equal to the number of populations, rows, columns, plots and residuals respectively, A = additive relationship matrix and ⊗ = direct (Kronecker) product operation.

Journal of Tropical Forest Science 25(3): 350–360 (2013) Quang TH et al.
354© Forest Research Institute Malaysia
,
, , ,
and are the population, additive genetic, row, column, plot and residual variance-covariance matrices respectively between trait i and j (i.e. measurements at different ages), denoting variances when i = j and covariances when i ≠ j or only variances with the univariate model. Restrictions were in some cases applied to the parameters to ensure that the variance–covariance matrix was positive definite. In cases with single tree on the plot (i.e. after thinning to one tree per plot), the within plot effects were omitted. Log-likelihood ratio tests were used to test for significance of population and additive genetic effects (p < 0.05). To test the effect of adding a factor, log-likelihood of a full model (LLF) was compared with the log-likelihood of a reduced model (LLR). A log-likelihood ratio (LRX) was constructed as LRX = -2 (LLR – LLF), which was tested against the chi-square distribution with degrees of freedom given by the difference in number of parameters in the two models. Studies of out-crossing rate in natural populations of E. urophylla using isozyme (House & Bell 1994) or RAPD (Gaiotto et al. 1997) indicated out-crossing around 0.9.
Consequently, the selfing rate was assumed to be 0.1 (corresponding to a relationship of 1/3) and this coefficient was used in the individual tree model in ASReml (version 3.0, 2009) to estimate the additive genetic variance. Within population narrow-sense heritability (h2) for growth traits (height and dbh) at year 1, year 5 before thinning and year 8 of planting was estimated as
where = additive genetic variance within populations, = variance between plots and = residual variance. The corresponding genetic variation between populations was estimated by QST values which were calculated as in McKay & Latta (2002):
where = variance between populations. Standard errors of h2 and QST were calculated using Taylor series expansion in ASReml (version 3.0, 2009). Estimates of mean values and genetic variances at different ages with the univariate and multivariate models are given in Tables 2 and 3 respectively.
Table 2 Estimates of mean values, population ( 2P), additive genetic ( 2A), and residual ( 2E) variances for height and dbh at
different ages using univariate model
Age (year) Trait/ mean 2P 2
A 2
E
Height (m)
1 2.4 0.01072 0.07038 0.32170
2* 5.5 0.04830 0.42006 1.17209
2** 6.5 0.05174 0.34443 0.62164
3 9.0 0.08016 0.46975 1.35600
5* 15.0 0.55028 1.61069 4.35023
5** 16.2 0.41967 1.52482 3.51755
8 18.9 0.47971 2.18904 2.91775
Dbh (cm)
1 1.7 0.01641 0.12572 0.73409
2* 5.0 0.01852 0.27248 1.78928
2** 6.2 0.04269 0.17696 0.89022
3 8.5 0.08488 0.27411 1.59220
5* 12.9 0.69430 1.27745 5.07681
5** 14.1 0.36668 1.09633 4.21574
8 18.1 0.55300 2.18532 7.04469
*Before thinning, **after thinning; all variance components are significantly different (p < 0.05) from zero based on a log-likelihood ratio test

Journal of Tropical Forest Science 25(3): 350–360 (2013) Quang TH et al.
355© Forest Research Institute Malaysia
RESULTS
Variation of microsatellite markers
Linkage disequilibrium tests did not show any significant difference in independent segregation of the 13 microsatellite marker loci (data not shown). The alleles at each locus segregated independently of alleles at the other loci; each locus provided a separate estimate of the genetic divergence between populations. All 13 microsatellite markers showed polymorphism (Table 4). FIS for each population ranged from 0.069 (Alor 2) to 0.198 (Flores 2); all were significantly different from zero but not from each other. Overall mean of FST values over all loci was 0.023 ± 0.008, ranging from -0.014 to 0.106 for each locus individually (data not shown). Though overall FST was low, the PCA of microsatellite markers suggested that populations Alor 1, Alor 2 and Flores 7 were somewhat differentiated though pairwise-FST estimates were low (0.010–0.054). There was no obvious geographical structuring except that Flores 2 and Flores 3 seemed to be genetically close to each other (Figure 2). Major axes of variation explained together over 60% of the total variance. This indicated low differentiation but geographical structuring between populations in the progeny trial after thinning. The AMOVA analysis showed that most of the variance of gene frequencies (97.1%) was observed within populations and only 2.9% was attributed to differences between populations (data not shown). Both variation
within populations and the population-to-population variation in allelic distribution were, however, significant (p < 0.001).
Variation of quantitative traits
Population and additive genetic variance components for all traits were statistically significant (p < 0.05) based on a log-likelihood ratio test, comparing the likelihood in a model with and without population or additive genetic effects respectively. The QST values (based on the univariate model) for height and dbh were low, i.e. 0.07 or less, in year 1 and year 2 before thinning (Table 5). They increased after thinning in year 2 and reached a maximum of 0.15 and 0.21 respectively in year 5 before thinning, after which they declined to 0.10 and 0.11 respectively. However, the changes were not statistically significant. Mean dbh for each population at year 2 before thinning, when QST was lowest, and at year 5 before thinning, when QST was maximum, are illustrated in Figure 3 together with data after thinning. The distribution of mean values between populations was much more uniform in year 2 before thinning than in year 5 before thinning. The effect of thinning on mean dbh for each population in year 2 (3a and b) followed closely the changes in QST based on the univariate model (Table 5). Similar trend was observed for thinning in year 5 (3c and d, Table 5). The within-population narrow-sense heritability was initially 0.18 and 0.15 for height and dbh respectively and showed some trend towards higher values with
Table 3 Estimates of mean values, population ( 2P), additive genetic ( 2A), and residual ( 2E) variances for height and dbh at different ages using
multivariate model
Age (years) Trait/mean 2P
2A
2E
Height (m)
1 2.4 0.01807 0.07221 0.32251
5* 15.0 0.34731 1.72495 4.69445
8 18.9 0.51731 1.71856 4.18701
Dbh (cm)
1 1.7 0.01551 0.16610 0.75176
5* 12.9 0.50225 1.76253 5.43982
8 18.1 0.74205 2.95008 7.73567
*Before thinning; all variance components are significantly different (p < 0.05) from zero based on a log-likelihood ratio test

Journal of Tropical Forest Science 25(3): 350–360 (2013) Quang TH et al.
356© Forest Research Institute Malaysia
age and after thinning, as expected, though the differences were not statistically significant. The mutltivariate model used in the study adjusted for bias caused by selective thinnings, and reflected the genetic values in an unthinned trial. Accordingly, QST values for height and dbh were consistently around 0.1 (Table 6) with the exception of dbh at year 1, where errors for the low dbh values might have affected the estimation. Within population, narrow-sense heritability was 0.18 for both height and dbh at age 1, similar to the values for year 1 on the
univariate model. Heritability values increased to 0.29 and 0.28 for height and dbh respectively at age 8.
DISCUSSION
Homozygote excess and populat ion differentiation estimated by microsatellites
The extent of inbreeding, or FIS, is an important consideration for breeders. Each 0.1 increase in FIS appears to be associated with a 5% reduction in height and diameter for E. globulus ssp. globulus (Hardner & Potts 1995) and 10% reduction in E. grandis (Reddy et al. 1985). Managing for a degree of inbreeding in subpopulations may, however, have advantages for breeding flexibility, purging deleterious alleles, selecting negatively correlated traits and allele conservation (Hardner & Potts 1995). All populations showed significant positive values for FIS ranging from 0.069 to 0.198 (Table 4), indicating some degree of homozygote excess. FIS was estimated at age 5 after the second thinning. In a previous study of E. urophylla, FIS values were higher, ranging over populations from 0.13 to 0.31(Tripiana et al. 2007). The difference between results of this study and those of Tripiana et al. (2007) might be explained by the different dates of the seedlots. Degree of outcrossing varies from year to year in E. urophylla (House & Bell 1994). Furthermore, the differences could be due to different number of
Table 4 Genetic diversity within nine populations of Eucalyptus urophylla based on microsatellite markers
Population Na Na (freq ≥ 5%) Ne Ho He FIS
Flores 7 13.8 5.0 10.8 0.76 0.92 0.174
Flores 2 14.2 4.6 10.9 0.73 0.90 0.198
Flores 3 12.9 4.2 9.8 0.80 0.89 0.104
Wetar 4 14.0 5.7 11.3 0.79 0.93 0.152
Wetar 5 13.6 5.2 10.8 0.78 0.92 0.155
Alor 2 9.7 6.6 7.7 0.82 0.88 0.069
Alor 1 11.2 5.3 8.8 0.77 0.90 0.150
Pantar 1 13.6 5.0 11.3 0.80 0.92 0.142
Pantar 2 13.7 4.8 10.8 0.84 0.91 0.080
Mean 12.9 10.3 0.78 0.91 0.137
Na = mean number of alleles per polymorphic locus, Na (freq ≥ 5%) = mean number of different
alleles with a frequency ≥ 5%; Ne = effective number of alleles, Ho = observed heterozygosity, He
= unbiased expected heterozygosity and FIS = homozygote excess for individuals within population
Figure 2 Population structure in Eucalyptus
urophylla based on microsatellite data; major axis of variation based on principal component analysis; percentage of total variation explained in brackets for each axis
Coord
inate
2 (
23.3
%)
Coordinate 1 (38.5%)
Weter
Weter4
Weter5
Pantar2
Pantar1
Alor1Alor2
Flores7
Flores2Flores3

Journal of Tropical Forest Science 25(3): 350–360 (2013) Quang TH et al.
357© Forest Research Institute Malaysia
Figure 3 Family means of dbh (cm) for each of the nine populations at year 2 (a) before and (b) after the first thinning and year 5 (c) before and (d) after the second thinning; bars show standard errors of means; the order of populations is similar to that of
Table 1
Table 5 Quantitative trait differentiation (QST) and within population narrow-sense heritability (h2) based on univariate model for height and diameter at various years after planting, before and after thinning for years 2 and 5
Year N Number of families
Mean number of trees per family
QST h2
Height Dbh Height Dbh
1 4244 144 29.5 0.07 ± 0.04 0.06 ± 0.04 0.18 ± 0.03 0.15 ± 0.03
2* 3962 144 27.5 0.05 ± 0.04 0.03 ± 0.03 0.26 ± 0.04 0.13 ± 0.03
2** 1055 144 7.3 0.07 ± 0.05 0.11 ± 0.08 0.36 ± 0.09 0.17 ± 0.08
3 1051 144 7.3 0.08 ± 0.06 0.13 ± 0.10 0.26 ± 0.08 0.15 ± 0.07
5* 948 144 6.6 0.15 ± 0.09 0.21 ± 0.12 0.27 ± 0.09 0.20 ± 0.09
5** 606 127 4.8 0.12 ± 0.09 0.14 ± 0.11 0.30 ± 0.13 0.21 ± 0.12
8 606 127 4.8 0.10 ± 0.07 0.11 ± 0.09 0.43 ± 0.14 0.24 ± 0.12
*Before thinning, **after thinning; ± standard error; N = number of observations; intensity of selection is indicated by number of families and number of trees per family at each occasion
16
14
12
10
8
6
4
2
0
Dbh (
cm
)
a b c d
microsatellite markers used in both studies as well as the number of families and individuals. Nevertheless, we suggest that the most likely explanation for the lower FIS values in this study is that the material is sampled for microsatellite variation after selective thinning, which favours heterozygous outbred genotypes.
The F IS values were highest in Flores populations. Despite this, Flores 2 was the fastest growing population. It performed well in earlier trials in Vietnam and China (Kien et al. 2009). Thinnings reduced the number of trees within families without removing entire families within Flores 2 (Table 1) so that the superiority of the population did not depend on a few outstanding families remaining after selection. It may be advisable to cross Flores 2 with other populations to maintain genetic variation in the future breeding. Heterozygote deficiencies in Eucalyptus and other wind-pollinated species were results of crossing between neighbouring trees or close relatives, rather than selfing, particularly for stands that have spatial structure (House & Bell 1994) and, in eucalypts, post-zygotic incompatibility (Byrne 2008). For adult trees of natural eucalypt stands, Byrne (2008) listed FIS values for seven eucalypt species, of which five had values below 0.1. The highest value reported was 0.3 for E. brownii/E. populnea (Holman et al. 2003). Values for natural stands of additional eucalypt species were also generally low, 0.01–0.27 for E. camaldulensis, 0.04–0.14 for E. rudis, 0.10–0.21 for E. tereticornis (Butcher et al. 2009) and -0.058–0.173 for E. benthamii (Butcher et al. 2005). For progeny trees of E. benthamii growing without selection in a seed orchard, the FIS value rose to 0.206 (Butcher et al. 2005). Mean observed heterozygosity for the various populations, 0.78 (Table 4), was higher than the 0.69 reported by Payn et al. (2008) who

Journal of Tropical Forest Science 25(3): 350–360 (2013) Quang TH et al.
358© Forest Research Institute Malaysia
studied unthinned open-pollinated progenies of the wild E. urophylla trees. This could be due to the fact that samples in our study were taken after two rounds of thinning, which favoured heterozygous material, hence the higher observed heterozygosity values compared with values reported by Payn et al. (2008) . Most molecular variation was found within populations, amounting to 97.1% of the total variation. This was in agreement with FST estimates which were low (0.023) but significantly different from zero (p < 0.01). Only slightly higher estimates of FST were reported for unthinned open-pollinated progenies of wild E. urophylla, i.e. 0.031 (Payn et al. 2008) and 0.04 (Tripiana et al. 2007). Higher values were observed for E. camaldulensis (0.082, Butcher et al. 2009), E. globulus (0.09, Steane et al. 2006) and E. benthamii (0.105, Butcher et al. 2005). The higher values can be attributed to the generally much larger and climatically more diverse areas sampled which were about four times larger than that of our study. Low degree of differentiation observed for neutral genetic markers between populations is probably due to (1) high outcrossing rates of eucalypts and most woody plant species (Nybom 2004), i.e. around 90% in natural populations and seed orchards of E. urophylla (House & Bell 1994, Gaiotto et al. 1997); and (2) relatively high levels of pollen dispersal by non-specific biotic vectors such as insects and birds over distances of 1 km or more, characterising at least some eucalypts (Byrne 2008). This results in high genetic diversity within and low diversity between populations. There was no apparent geographical structure in the sampled populations (Figure 2), which is consistent with observations by Tripiana et al. (2007), and with the low genetic
differentiation (FST) between populations. However, population structure comprising two genetically homogeneous groups had been reported from a larger-scale investigation using clustering approach, although the authors considered that the microsatellite data were insufficient for recognising new species (Payn et al. 2008).
Population differentiation estimated by growth traits
Unlike their mother trees which were subjected to contrasting environments and degrees of competition during establishment, progenies were grown as spaced plants in a protective environment without competition from natural vegetation. At year 2 after planting, and before thinning, the populations had similar growth and low variation between families within a population (Figure 3a). The differences increased after strong selective thinning in year 2 (Figure 3b), resulting in increased QST values. Thinning probably removed much inbred material since inbreeding depression in eucalypts such as E. globulus had appeared as early as 19 months for both height and dbh (Hardner & Potts 1995). Thinning in year 2 brought forward superiority of the best populations (Figures 3a, b). The differences between populations increased further with age up to year 5 before thinning (Figure 3c). As trees aged, competition increased and this increased the variance of population means and QST. However, univariate QST for height and dbh decreased (Table 5) after year 5 before the second thinning which removed 17 poor families comprising 123 trees and 224 other inferior trees (Table 1). Thinning in
Table 6 Quantitative trait differentiation (QST) and within population narrow-sense heritability (h2)
based on a multivariate model for height and diameter at various years after planting
Year N Number of families
Mean number of trees per family
QST h2
Height Dbh Height Dbh
1 4244 144 29.5 0.11 ± 0.06 0.04 ± 0.03 0.18 ± 0.03 0.18 ± 0.03
5* 948 144 6.6 0.09 ± 0.05 0.12 ± 0.07 0.27 ± 0.08 0.24 ± 0.08
8 606 127 4.8 0.13 ± 0.07 0.11 ± 0.06 0.29 ± 0.10 0.28 ± 0.10
* = Before thinning; ± standard error; N = number of observations; intensity of selection is indicated by number of families and number of trees per family at each occasion
Journal of Tropical Forest Science 25(3): 350–360 (2013) Quang TH et al.
359© Forest Research Institute Malaysia
year 5 reduced the difference in performance between the best growing (Flores 2) and other populations (Figures 3c, d). The changes in QST did not result from selection creating non-normal distributions of height or dbh (data not shown). For 10 populations common to field and molecular studies of E. urophylla grown in the Republic of Congo (Tripiana et al. 2007), QST estimates at 37 months were 0.66 for height and 0.22 for circumference, much higher than the values at the same age in the present study of 0.08 for height and 0.13 for dbh. In the early study, natural selection favoured different genes according to the local natural environment, particularly altitude. In the present study, strong conscious selection favoured the same genes in a more uniform environment. Using the multivariate model to compensate for selective thinning, QST values obtained were of 0.09–0.13 for height and 0.04–0.12 for dbh (Table 6). These low values reflected the differentiation between populations in the first two growth seasons before thinning when differences were less marked, especially for dbh.
Comparison between quantitative and molecular genetic variation
The difference between QST and FST, based on neutral microsatellite markers, is a measure of the influence of selection (Latta 1998). In a review of 52 studies by Leinonen et al. (2008), QST was generally greater than FST; the average difference between them was 0.12. In our study, the effect of selection on height was estimated by the difference between QST (0.12 ± 0.009) and FST (0.023 ± 0.008) from the univariate model at age 5 years after selection. The corresponding difference measuring the effect of selection on dbh was also small (0.14 – 0.023). On the other hand, much larger differences were reported by Tripiana et al. (2007), with QST estimates for height and circumference of E. urophylla up to eight times higher than FST. Natural selection adapting the populations to different altitudes accounted for much of these differences. In the current study, the influence of selection (i.e. QST – FST) partly reflected the previous history of natural selection acting on parental trees growing in the wild, as well as selection during the far from natural conditions of the progeny trial, most intensely after the two
thinnings. While these two effects could not be distinguished from our data, we noted that conscious selection during thinnings was for the same traits in the same environment, unlike the situation in the wild. This may be related to relatively low values of univariate QST after the second thinning.
CONCLUSIONS
This study was unusual in that microsatellite variation was used to estimate the degree of homozygote excess and population structure after selection in breeding programmes. Molecular data gave estimates of level of homozygote excess after thinning within populations (FIS) and the genetic differentiation between populations for selectively neutral markers (FST). The FIS values were generally low and not significantly different from each other, though significantly different from zero. It is important to note that selective thinning, which reduced the number of trees to 14%, favoured heterozygosity in all populations. The FST estimate was low, 0.023 ± 0.008, and only 2.9% of the total variation was attributable to variation among populations. This was considered to reflect the recent history of dispersal of the species through the islands, the initial high percentage of outbreeding and the relatively long distance of pollen transport in eucalypts in the wild. As expected, the value was essentially unchanged by selection for economic characters during thinning. The genetic differentiation for growth traits among populations, QST, based either on univariate or multivariate model, was initially low. It increased with age particularly for the univariate model, where it reached a maximum of 0.15 for height and 0.21 for dbh at year 5 before the second thinning. The standard errors on QST estimates were, however, large. Differences between QST and FST estimates in year 5, a measure of the effects of selection, were small and of doubtful significance. The relatively low estimates for QST reflected the influence of selection for the same traits in the same environment for each population in our study. Selection was effective in raising the performance of the poorer populations while maintaining heterozygosity. The prospects for further breeding progress are bright, whether or not crosses are made among populations.

Journal of Tropical Forest Science 25(3): 350–360 (2013) Quang TH et al.
360© Forest Research Institute Malaysia
ACKNOWLEDGEMENTS
The work was supported by the FAO Regional Project RAS/91/004 (FORTIP), AusAID, SIDA/SAREC (Sweden) and MARD (Vietnam). We thank the staff at the Forest Science Institute of Vietnam for help in material collection and providing growth and molecular data, and G Eriksson for helpful comments on the manuscript.
REFERENCES
BRONDANI RPV, WILLIAMS ER, BRONDANI C & GRATTAPAGLIA
D. 2006. A microsatellite-based consensus linkage map for species of Eucalyptus and a novel set of 230 microsatellite markers for the genus. BMC Plant Biology 6: 20, doi:10.1186/1471-2229-6-20.
BROOKER MIH. 2000. A new classification of the genus Eucalyptus L’Her. (Myrtaceae). Australian Systematic Botany 13: 79–148.
BUTCHER PA, MCDONALD MW & BELL JC. 2009. Congruence between environmental parameters, morphology and genetic structure in Australia’s most widely distributed eucalypt, Eucalyptus camaldulensis. Tree Genetics and Genomes 5: 189–210.
BUTCHER PA, SKINNER AK & GARDINER CA. 2005. Increased inbreeding and inter-species gene flow in remnant populations of the rare Eucalyptus benthamii. Conservation Genetics 6: 213–226.
BYRNE M. 2008. Eucalypt phylogeny, diversity and evolution. Pp 303–346 in Sharma AK & Sharma A (eds) Plant Genome: Biodiversity and Evolution. Volume 1, Part E: Phanerogam―Angiosperm. Science Publishers, Enfield.
CHAIX G, GERBER S, RAZAFIMAHARO V, VIGNERON P, VERHAEGEN
D & HAMON S. 2003. Gene flow estimation with microsatellites in a Malagasy seed orchard of Eucalyptus grandis. Theoretical and Applied Genetics 107: 705–712.
GAIOTTO FA, BRAMUCCI M & GRATTAPAGLIA D. 1997. Estimation of outcrossing rate in a breeding population of Eucalyptus urophylla with dominant RAPD and AFLP markers. Theoretical and Applied Genetics 95: 842–849.
GAWEL NJ & JARRET RL. 1991. A modified CTAB DNA extraction procedure for Musa and Ipomoea. Plant Molecular Biology Reporter 9: 262–266.
GEA LD, MCCONNOCHIE R & WYNYARD S. 2007. Parental reconstruction for breeding, deployment, and seed-orchard management of Eucalyptus nitens. New Zealand Journal of Forestry Science 37: 23–36.
HARDNER CM & POTTS BM. 1995. Inbreeding depression and changes in variation after selfing in Eucalyptus globulus spp. globulus. Silvae Genetica 44: 46–54.
HOLMAN JE, HUGHES JM & FENSHAM RJ. 2003. A morphological cline in Eucalyptus: a genetic perspective. Molecular Ecology 12: 3013–3025.
HOUSE APN & BELL JC. 1994. Isozyme variation and mating system in Eucalyptus urophylla S.T. Blake. Silvae Genetica 43: 167–179.
JIAYU B, JIANMIN X & SIMING G. 2003. Genetic improvement of tropical eucalypts in China. Pp 64–70 in Turnbull J (ed) Eucalyptus in Asia. ACIAR Proceedings No. 111. 7–11 April 2003, Zhanjiang.
KIEN ND, JANSSON G, HARWOOD C & THINH HH. 2009. Genetic control of growth and form in Eucalyptus urophylla S.T. Blake in northern Vietnam. Journal of Tropical Forest Science 21: 50–65.
KIRST M, CORDEIRO CM, REZENDE G & GRATTAPAGLIA D. 2005. Power of microsatellite markers for fingerprinting and parentage analysis in Eucalyptus grandis breeding populations. Journal of Heredity 96: 161–166.
LATTA RG. 1998. Differentiation of allelic frequencies at quantitative trait loci affecting locally adaptive traits. American Naturalist 151: 283–292.
LEINONEN T, O’HARA RB, CANO JM & MERILA J. 2008. Comparative studies of quantitative trait and neutral marker divergence: a meta-analysis. Journal of Evolutionary Biology 21: 1–17.
LEITE SMM, BONINE CA, MORIES, DO VALLE CF & MARINO CL.
2002. Genetic variability in a breeding population of Eucalyptus urophylla S.T. Blake. Silvae Genetica 51: 253–256.
MCKAY JK & LATTA RG. 2002. Adaptive population divergence: markers, QTL and traits. Trends in Ecology and Evolution 17: 285–291.
NYBOM H. 2004. Comparision of different nuclear DNA markers for estimating intraspecific genetic diversity in plants. Molecular Ecology 13: 1143–1155.
PAYN KG, DVORAK WS, JANSE BJH & MYBURG AA. 2008. Microsatellite diversity and genetic structure of the commercially important tropical tree species Eucalyptus urophylla, endemic to seven islands in eastern Indonesia. Tree Genetics and Genomes 4: 519–530.
REDDY KV, ROCKWOOD DL, COMER CW & MESKIMEN GF. 1985. Predicted genetic gains adjusted for inbreeding for an Eucalyptus grandis seed orchard. Pp 283–289 in Schmidtling RC & Griggs MM (eds) Proceedings of the 18th Southern Forest Tree Improvement Conference. 21–25 May 1985, Long Beach.
STEANE DA, CONOD N, JONES RC, VAILLANCOURT RE & POTTS BM. 2006. A comparative analysis of population structure of a forest tree, Eucalyptus globulus (Myrtaceae), using microsatellite markers and quantitative traits. Tree Genetics and Genomes 2: 30–38.
TRIPIANA V, BOURGEOIS M, VERHAEGEN D, VIGNERON P & BOUVET
JM. 2007. Combining microsatellites, growth, and adaptive traits for managing in situ genetic resources of Eucalyptus urophylla. Canadian Journal of Forest Research 37: 773–785.
WEI X & BORRALHO NMG. 1998. Use of individual tree mixed models to account for mortality and selective thinning when estimating base population genetic parameters. Forest Science 44: 246–253.
WEIR BS & COCKERHAM CC. 1984. Estimating F-statistics for the analysis of population structure. Evolution 38: 1358–1370.
WHITE TL, ADAMS WT & NEALE DB. 2007. Forest Genetics. CABI Publishing, Wallingford.