Evaluating a proposed modification to Federal Crop Insurance
13
Evaluating a Proposed Modification to Federal Crop Insurance By Shuqiong Ling, Xiaohui Deng, and Barry J. Barnett* Abstract: A proposed modification to the Federal Crop Insurance Program would allow crop producers to simultaneously purchase both a farm-level crop insurance policy and a supplemental county-level crop insurance policy. This study evaluates this proposal for representative cotton farms in Georgia. The goal is to test whether the additional risk protection provided by the supplemental policy is considered to be worth the additional cost. Key words: certainty equivalent, combined insurance product, group risk plan, multiple peril crop insurance Selected Paper prepared for presentation at the Southern Agricultural Economics Association Annual Meetings Mobile, Alabama, February 4-7,2007 *Ling is graduate research assistant, Department of Agricultural and Applied Economics, University of Georgia. Deng is assistant professor, Department of Agricultural Economics, California State University, Fresno. Barnett is associate professor, Department of Agricultural and Applied Economics, University of Georgia.
Transcript of Evaluating a proposed modification to Federal Crop Insurance
Evaluating a Proposed Modification to Federal Crop Insurance
By
Shuqiong Ling, Xiaohui Deng, and Barry J. Barnett*
Abstract: A proposed modification to the Federal Crop Insurance Program would allow crop
producers to simultaneously purchase both a farm-level crop insurance policy and a
supplemental county-level crop insurance policy. This study evaluates this proposal for
representative cotton farms in Georgia. The goal is to test whether the additional risk
protection provided by the supplemental policy is considered to be worth the additional
cost.
Key words: certainty equivalent, combined insurance product, group risk plan, multiple peril crop insurance
Selected Paper prepared for presentation at the Southern Agricultural Economics Association Annual Meetings
Mobile, Alabama, February 4-7,2007 *Ling is graduate research assistant, Department of Agricultural and Applied Economics, University of Georgia. Deng is assistant professor, Department of Agricultural Economics, California State University, Fresno. Barnett is associate professor, Department of Agricultural and Applied Economics, University of Georgia.
Evaluating a Proposed Modification to Federal Crop Insurance
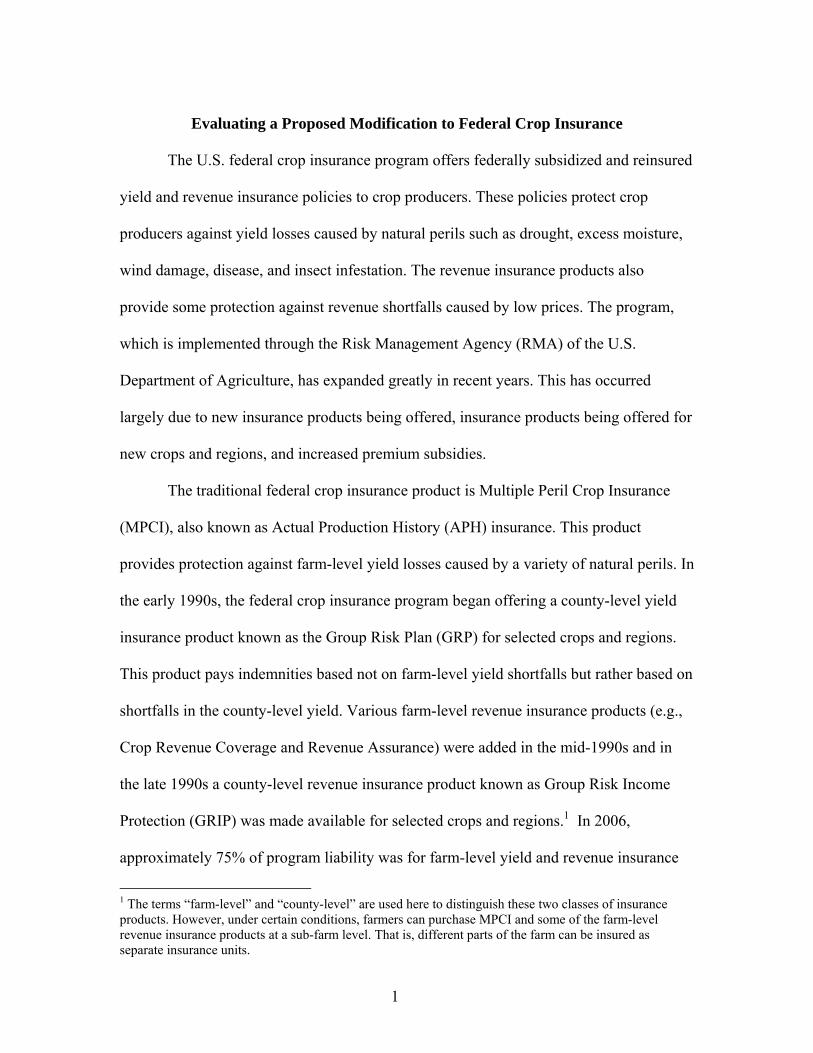
The U.S. federal crop insurance program offers federally subsidized and reinsured
yield and revenue insurance policies to crop producers. These policies protect crop
producers against yield losses caused by natural perils such as drought, excess moisture,
wind damage, disease, and insect infestation. The revenue insurance products also
provide some protection against revenue shortfalls caused by low prices. The program,
which is implemented through the Risk Management Agency (RMA) of the U.S.
Department of Agriculture, has expanded greatly in recent years. This has occurred
largely due to new insurance products being offered, insurance products being offered for
new crops and regions, and increased premium subsidies.
The traditional federal crop insurance product is Multiple Peril Crop Insurance
(MPCI), also known as Actual Production History (APH) insurance. This product
provides protection against farm-level yield losses caused by a variety of natural perils. In
the early 1990s, the federal crop insurance program began offering a county-level yield
insurance product known as the Group Risk Plan (GRP) for selected crops and regions.
This product pays indemnities based not on farm-level yield shortfalls but rather based on
shortfalls in the county-level yield. Various farm-level revenue insurance products (e.g.,
Crop Revenue Coverage and Revenue Assurance) were added in the mid-1990s and in
the late 1990s a county-level revenue insurance product known as Group Risk Income
Protection (GRIP) was made available for selected crops and regions.1 In 2006,
approximately 75% of program liability was for farm-level yield and revenue insurance
1 The terms “farm-level” and “county-level” are used here to distinguish these two classes of insurance products. However, under certain conditions, farmers can purchase MPCI and some of the farm-level revenue insurance products at a sub-farm level. That is, different parts of the farm can be insured as separate insurance units.
1
policies. Approximately 14% of program liability was for county-level yield and revenue
insurance policies with the remaining 11% of liability being for a variety of insurance
products targeted primarily to producers of specialty crops.
While the farm-level insurance products protect against farm-level yield losses,
they are subject to problems such as adverse selection and moral hazard (Knight and
Coble, 1997). The county-level products are much less subject to adverse selection and
moral hazard problems but policyholders are exposed to basis risk. In this context, basis
risk refers to the fact that a farm may experience a yield loss but not receive an indemnity
from a GRP or GRIP policy because there was no county-level yield shortfall.
Conversely, it is also possible that a farm may not experience a yield loss but still receive
a GRP or GRIP indemnity because of a shortfall in the county-level yield.
Currently, for a given crop produced in a given county, crop insurance purchasers
must choose only one federal crop insurance product. That is to say, that an insurance
purchaser must choose either a yield or a revenue insurance product and must choose to
insure at either the farm-level or the county-level. In the 109th Congress, Representative
Randy Neugebauer (TX) introduced legislation (H.R.721) that would authorize the RMA
to offer GRP coverage as a supplement to an underlying farm-level insurance policy
(MPCI or one of the revenue insurance products). This study evaluates the implications
of this proposal for representative cotton farms in Georgia. The goal is to test whether the
additional risk protection provided by the supplemental GRP policy is considered to be
worth the additional cost. Specifically, we compare outcomes assuming that the
representative farms purchase MPCI (at various coverage levels), GRP, or the proposed
combined insurance product.
2
Crop Insurance Products
MPCI insurance is based on the farm’s actual production history (APH) yield. In
its most basic form, the APH yield is a 10-year rolling average for the insured unit. APH
yields can be initiated with as few as four years of yield records and then build to ten
years. MPCI indemnities per acre are calculated as
(1) electionpriceyyn iiMPCI ×−= )~,0max(~
where MPCIn~ is the indemnity per acre, iy is a trigger yield equal to the product of the
APH yield and the selected coverage level, and iy~ is the stochastic realized farm-level
yield. For MPCI, the available coverage levels are from 50% to 85% in 5% increments.
The maximum price election is established by the RMA. Policyholders can select a price
election anywhere between 60% and 100% of the maximum. For cotton in Georgia, the
maximum price election for 2006 was $0.53.
For GRP the indemnity is calculated as
(2) acreperprotectiony
yyn
c
ccGRP ×⎟⎟
⎠
⎞⎜⎜⎝
⎛ −=
~,0max~
where GRPn~ is the GRP indemnity, cy is a trigger yield equal to the product of the
expected county yield and the selected coverage level, and cy~ is the stochastic realized
county yield. For GRP, the available coverage levels are from 70% to 90% in 5%
increments. Protection per acre is calculated as
(3) scaleelectionpriceyieldcountyexpectedacreperprotection ××=
where . The GRP indemnity function has a “disappearing
deductible” which means that, in an extreme case, if the realized county yield is zero the
%150%90 ≤≤ scale
3
effective coverage is 100%. Procedures for establishing the expected county yield are
described in Skees, Black and Barnett (1997).
For the proposed combined insurance product the indemnity per acre would be
calculated as
(4) ( ) ( )( )max~1~~
GRPMPCIMPCIcombined ncoveragenn ×−+=
where combinedn~ is the indemnity per acre on the combined product, MPCIn~ is as defined in
(1), is the coverage level selected for the MPCI portion of the policy, and MPCIcoverage
(max )~
GRPn is equal to the GRP indemnity equation in (2) with protection per acre set at the
maximum level (i.e., scale = 150%).
Previous Studies
We are aware of only one other study that has examined the impacts of the
combined insurance product proposed in H.R. 721. Knight (2006) evaluated the proposed
combined insurance product for six representative farms: one cotton farm in Texas, one
cotton farm in Mississippi, one corn farm in Ohio, one corn farm in Kansas, and two
wheat farms in Kansas. For each farm, three levels of MPCI yield protection were
considered (50%, 65%, and 75%) in combination with 90% GRP coverage. The findings
indicated that the combined coverage offered under H.R. 721 would provide additional
revenue risk protection for all of the farms. The combined insurance product provided the
greatest benefit (relative to an MPCI policy alone) in counties where yield risk for the
insured crop was relatively high. In counties with relatively low yield risk, the combined
insurance product generated only modest additional benefits relative to an MPCI policy
alone. The added benefits of the combined insurance product declined for higher MPCI
4
coverage levels. This study extends Knight’s analysis to consider the implications of the
proposed combined insurance product for representative cotton farms in Georgia.
Data
Two types of yield data are used in the analysis. The first is farm-level yield data
collected from the USDA’s Risk Management Agency (RMA). These data are APH yield
histories from Georgia farmers who purchased farm-level cotton insurance (MPCI or
revenue insurance) in 2001. Thus, the data are for 1991 to 2000. Farms with actual yield
data for at least the last 6 consecutive years were included in the study.2
Historical county-level yield data were obtained from the National Agricultural
Statistics Service (NASS). These data are available for cotton production in Georgia from
1971 to 2005. Due to a positive time trend, the data were detrended using simple linear
regression
(5) it tCY εββ ++= 10
where is the county yield in year t. Detrended county yields were generated by: tCY
(6) predpred
t
tt CY
CYCY
CY 2005det =
where is the detrended county yield, is the predicted county yield in year t,
and is the predicted county yield for year 2005.
dettCY pred
tCY
predCY2005
For the s years when both farm-level and county-level yield data are available (6
≤ s ≤ 10), the ratio of the farm yield to the county yield is calculated as:
(7) s
isis CY
y=ε
2 Only actual verified yield data are included in the analysis (e.g., T-yields, etc. have been excluded). The actual yield data have been aggregated to the whole-farm or “enterprise unit” level.
5
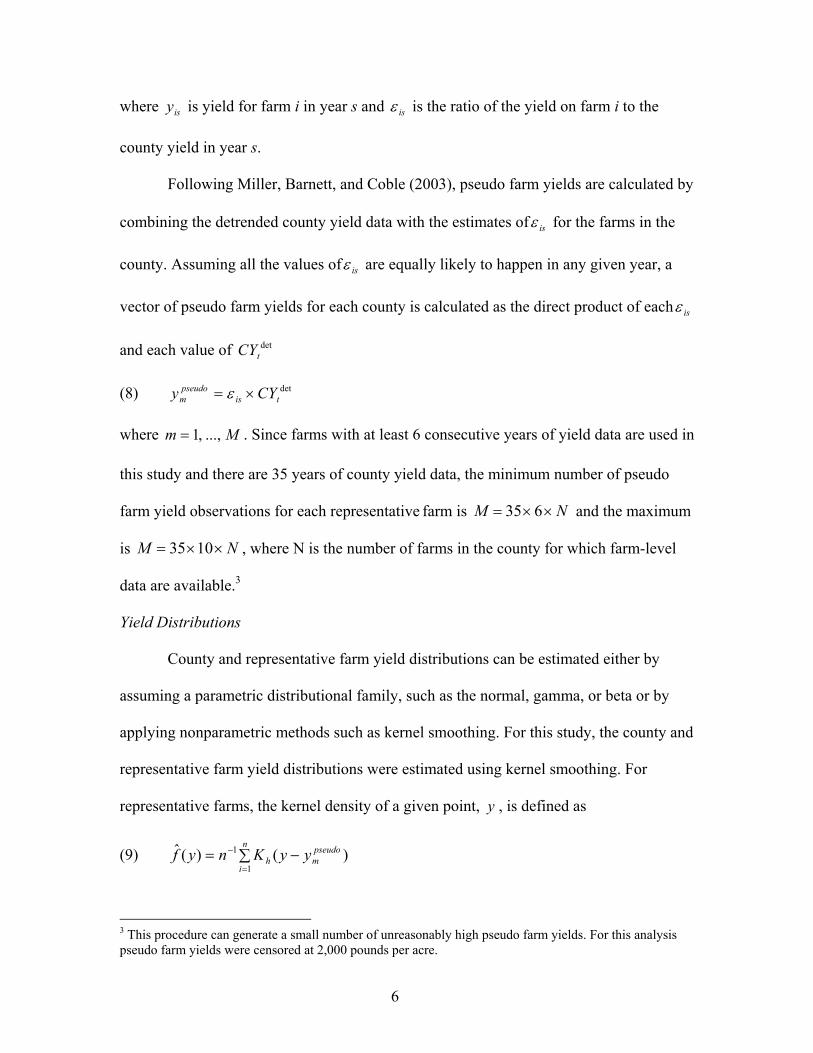
where is yield for farm i in year s and isy isε is the ratio of the yield on farm i to the
county yield in year s.
Following Miller, Barnett, and Coble (2003), pseudo farm yields are calculated by
combining the detrended county yield data with the estimates of isε for the farms in the
county. Assuming all the values of isε are equally likely to happen in any given year, a
vector of pseudo farm yields for each county is calculated as the direct product of each isε
and each value of dettCY
(8) dettis
pseudom CYy ×= ε
where . Since farms with at least 6 consecutive years of yield data are used in
this study and there are 35 years of county yield data, the minimum number of pseudo
farm yield observations for each representative
Mm ...,,1=
farm is NM ××= 635 and the maximum
is , where N is the number of farms in the county for which farm-level
data are available.
NM ××= 1035
3
Yield Distributions
County and representative farm yield distributions can be estimated either by
assuming a parametric distributional family, such as the normal, gamma, or beta or by
applying nonparametric methods such as kernel smoothing. For this study, the county and
representative farm yield distributions were estimated using kernel smoothing. For
representative farms, the kernel density of a given point, , is defined as y
(9) )()(ˆ1
1 pseudom
n
ih yyKnyf −∑=
=
−
3 This procedure can generate a small number of unreasonably high pseudo farm yields. For this analysis pseudo farm yields were censored at 2,000 pounds per acre.
6
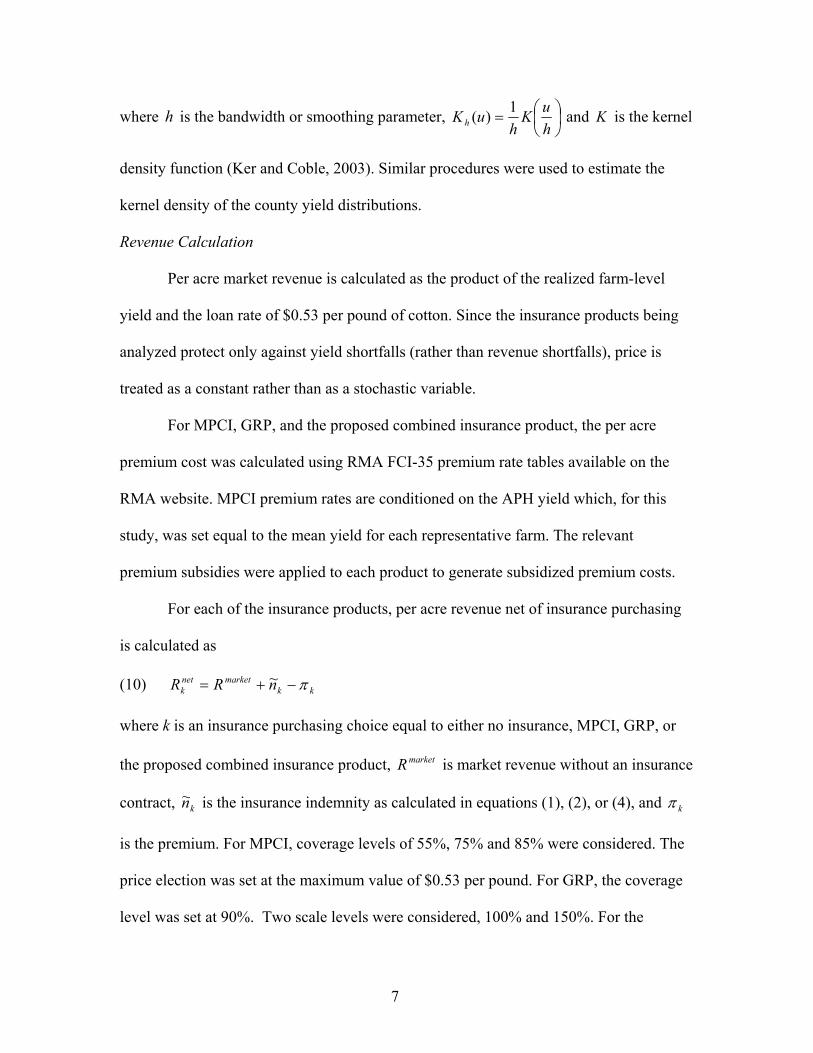
where is the bandwidth or smoothing parameter, h ⎟⎠⎞
⎜⎝⎛=
huK
huK h
1)( and K is the kernel
density function (Ker and Coble, 2003). Similar procedures were used to estimate the
kernel density of the county yield distributions.
Revenue Calculation
Per acre market revenue is calculated as the product of the realized farm-level
yield and the loan rate of $0.53 per pound of cotton. Since the insurance products being
analyzed protect only against yield shortfalls (rather than revenue shortfalls), price is
treated as a constant rather than as a stochastic variable.
For MPCI, GRP, and the proposed combined insurance product, the per acre
premium cost was calculated using RMA FCI-35 premium rate tables available on the
RMA website. MPCI premium rates are conditioned on the APH yield which, for this
study, was set equal to the mean yield for each representative farm. The relevant
premium subsidies were applied to each product to generate subsidized premium costs.
For each of the insurance products, per acre revenue net of insurance purchasing
is calculated as
(10) kkmarketnet
k nRR π−+= ~
where k is an insurance purchasing choice equal to either no insurance, MPCI, GRP, or
the proposed combined insurance product, marketR is market revenue without an insurance
contract, kn~ is the insurance indemnity as calculated in equations (1), (2), or (4), and kπ
is the premium. For MPCI, coverage levels of 55%, 75% and 85% were considered. The
price election was set at the maximum value of $0.53 per pound. For GRP, the coverage
level was set at 90%. Two scale levels were considered, 100% and 150%. For the
7

combined insurance product the GRP coverage level was set equal to 90%. Note that if k
is no insurance, . marketnetk RR =
Decision Criterion
The various insurance contracts are compared based on certainty equivalent
revenues (CER) from the constant relative risk aversion utility function
(11)
( ) 1log
,11
1
==
≠−
=−
γ
γγ
γ
whenRU
andwhenR
U
netkk
netk
k
where is from (10) and netkR γ is the measure of relative risk aversion. For this analysis, γ
was set equal to 2. The certainly equivalent of (11) is
(12a) ( )( )netkkk REUUCE 1−=
or for each of the insurance choices
(12b) ))()((1 pseudopseudomarketInsuranceNo dyyfRUUCE ∫= −
(12c) ))()((1 pseudopseudonetMPCIMPCI dyyfRUUCE ∫= −
(12d) ))()((1cc
netGRPGRP dyyfRUUCE ∫= −
(12e) ⎟⎟⎟⎟
⎠
⎞
⎜⎜⎜⎜
⎝
⎛
−×−∫
+−∫
+∫
= −
(max)(max)
1
)()~)cov1((
)()~()()(
GRPccGRPMPCI
MPCIpseudopseudo
MPCI
pseudopseudomarket
Combined
dyyfnerageU
dyyfnUdyyfRU
UCE
π
π
Numerical methods were used to integrate under the kernel density functions.
Results
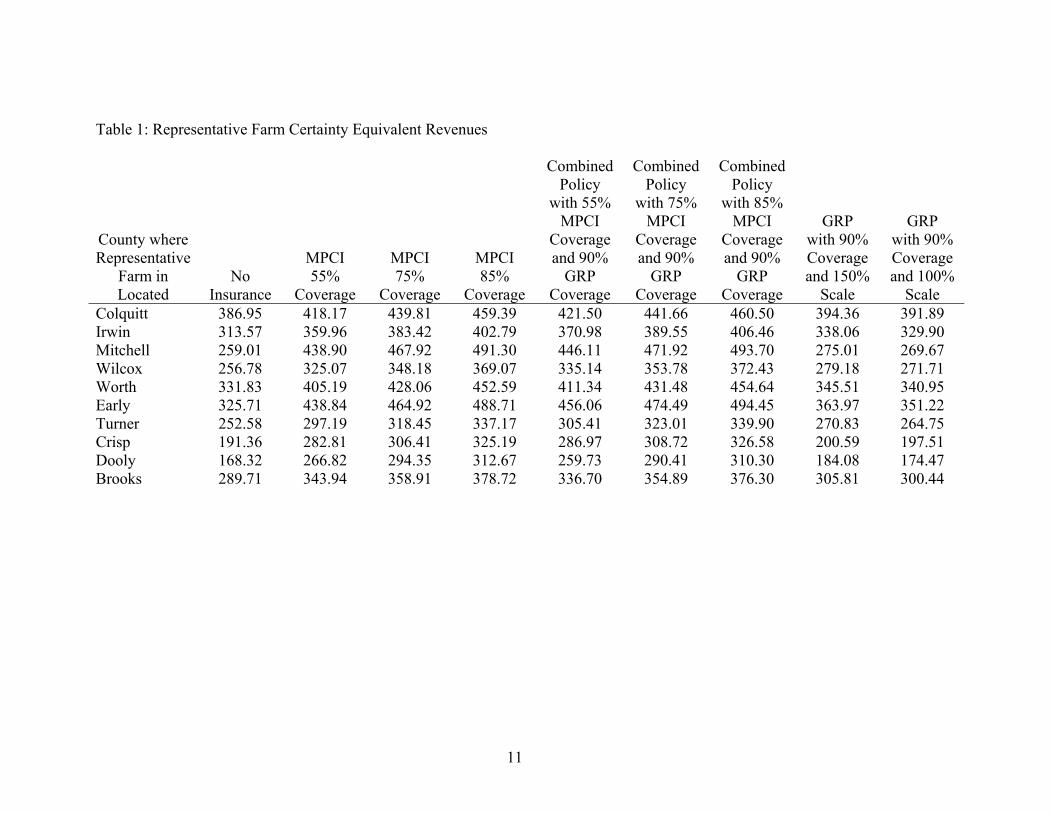
Table 1 shows certainty equivalent revenues (CERs) under various scenarios. The
insurance choices shown are MPCI (coverage level at 55%, 75% and 85%), the proposed
8
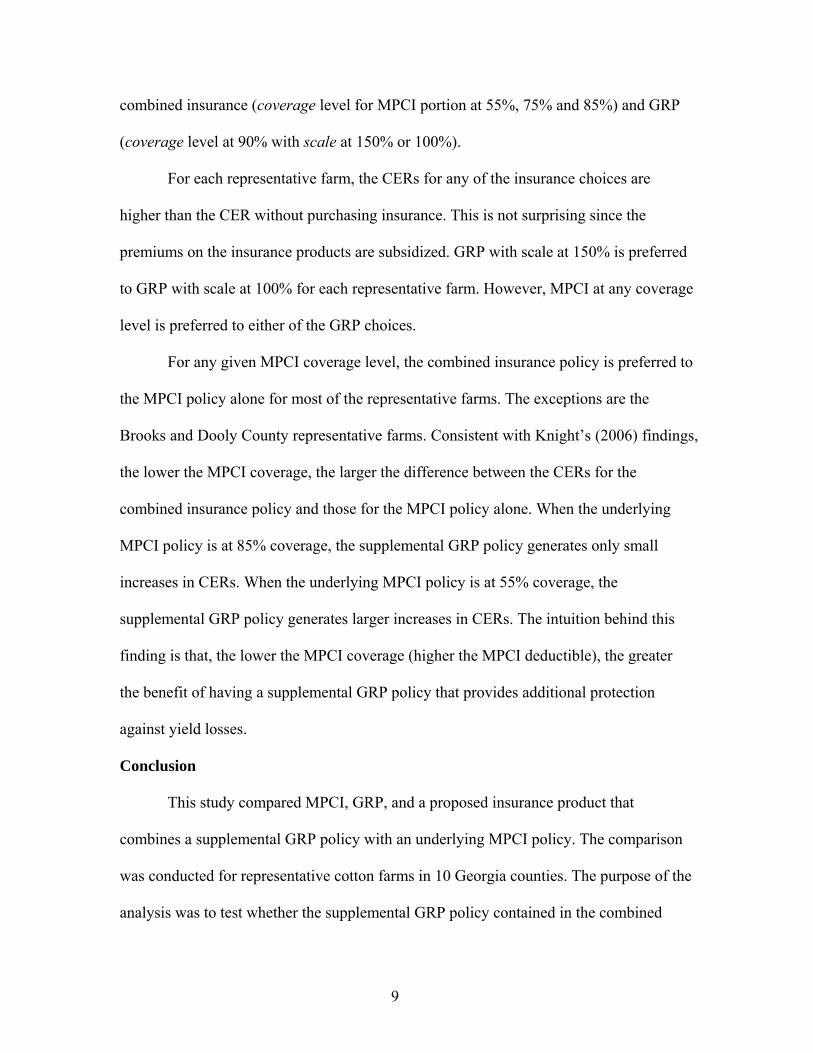
combined insurance (coverage level for MPCI portion at 55%, 75% and 85%) and GRP
(coverage level at 90% with scale at 150% or 100%).
For each representative farm, the CERs for any of the insurance choices are
higher than the CER without purchasing insurance. This is not surprising since the
premiums on the insurance products are subsidized. GRP with scale at 150% is preferred
to GRP with scale at 100% for each representative farm. However, MPCI at any coverage
level is preferred to either of the GRP choices.
For any given MPCI coverage level, the combined insurance policy is preferred to
the MPCI policy alone for most of the representative farms. The exceptions are the
Brooks and Dooly County representative farms. Consistent with Knight’s (2006) findings,
the lower the MPCI coverage, the larger the difference between the CERs for the
combined insurance policy and those for the MPCI policy alone. When the underlying
MPCI policy is at 85% coverage, the supplemental GRP policy generates only small
increases in CERs. When the underlying MPCI policy is at 55% coverage, the
supplemental GRP policy generates larger increases in CERs. The intuition behind this
finding is that, the lower the MPCI coverage (higher the MPCI deductible), the greater
the benefit of having a supplemental GRP policy that provides additional protection
against yield losses.
Conclusion
This study compared MPCI, GRP, and a proposed insurance product that
combines a supplemental GRP policy with an underlying MPCI policy. The comparison
was conducted for representative cotton farms in 10 Georgia counties. The purpose of the
analysis was to test whether the supplemental GRP policy contained in the combined
9
10
insurance product is worth the additional cost, relative to just a stand alone MPCI policy.
The results indicate that for a given MPCI coverage level the combined insurance product
generates higher certainty equivalent revenues than an MPCI policy for eight of the 10
representative farms. Also, the difference between the combined product certainty
equivalent revenues and the MPCI certainty equivalent revenues is larger for lower levels
of MPCI coverage.
11
Table 1: Representative Farm Certainty Equivalent Revenues
County where Representative
Farm in Located
No Insurance
MPCI 55%
Coverage
MPCI 75%
Coverage
MPCI 85%
Coverage
Combined Policy
with 55% MPCI
Coverage and 90%
GRP Coverage
Combined Policy
with 75% MPCI
Coverage and 90%
GRP Coverage
Combined Policy
with 85% MPCI
Coverage and 90%
GRP Coverage
GRP with 90% Coverage and 150%
Scale
GRP with 90% Coverage and 100%
Scale Colquitt 386.95 418.17 439.81 459.39 421.50 441.66 460.50 394.36 391.89Irwin 313.57
359.96 383.42 402.79 370.98 389.55 406.46 338.06 329.90Mitchell 259.01 438.90 467.92 491.30 446.11 471.92 493.70 275.01 269.67Wilcox 256.78 325.07 348.18 369.07 335.14 353.78 372.43 279.18 271.71Worth 331.83 405.19 428.06 452.59 411.34 431.48 454.64 345.51 340.95Early 325.71 438.84 464.92 488.71 456.06 474.49 494.45 363.97 351.22Turner 252.58 297.19 318.45 337.17 305.41 323.01 339.90 270.83 264.75Crisp 191.36 282.81 306.41 325.19 286.97 308.72 326.58 200.59 197.51Dooly 168.32 266.82 294.35 312.67 259.73 290.41 310.30 184.08 174.47Brooks 289.71 343.94 358.91 378.72 336.70 354.89 376.30 305.81 300.44

References Ker, A.P., and K.H. Coble. “Modeling Conditional Yield Densities.” American Journal of Agricultural Economics 85(2003):291-304. Knight, T.O. “An Analysis of the Risk Reducing Benefits of H.R. 721.” Unpublished manuscript. Department of Agricultural and Applied Economics, Texas Tech University, March 7, 2006. Knight, T.O. and K.H. Coble. “Survey of U.S. Multiple Peril Crop Insurance Literature Since 1980.” Review of Agricultural Economics, 19(1997):128-156. Miller, J.C., B.J. Barnett, and K.H. Coble. “Analyzing Producer Preferences for Counter-Cyclical Government Payments.” Journal of Agricultural and Applied Economics, 35(2003):671-684. Skees, J.R., J.R. Black, and B.J. Barnett. “Designing and Rating an Area Yield Crop Insurance Contract.” American Journal of Agricultural Economics, 79(1997):430-438.
12