Simultaneous improvement in productivity, water use, and albedo through crop structural modification
23
Simultaneous improvement in productivity, water use, and albedo through crop structural modification DARREN T. DREWRY 1,2 , PRAVEEN KUMAR 3,4 andSTEPHEN P. LONG 5,6 1 Climate Physics Group, Jet Propulsion Laboratory, California Institute of Technology, m/s 233-300, Pasadena, CA 91109-8099, USA, 2 Joint Institute for Regional Earth System Science & Engineering, University of California Los Angeles, 607 Charles E Young Drive East, Young Hall, Room 4242, Los Angeles, CA 90095-7228, USA, 3 Department of Civil and Environmental Engineering, University of Illinois, 2527B Hydrosystems Laboratory, 301 North Mathews Avenue, Urbana, IL 61801-2352, USA, 4 Department of Atmospheric Sciences, University of Illinois, 150 South Gregory Street, Urbana, IL 61801-3070, USA, 5 Department of Crop Sciences, University of Illinois, AW-101 Turner Hall, 1102 South Goodwin Avenue, Urbana, IL 61801, USA, 6 Department of Plant Biology, University of Illinois, 265 Morrill Hall, 505 South Goodwin Avenue, Urbana, IL 61801, USA Abstract Spanning 15% of the global ice-free terrestrial surface, agricultural lands provide an immense and near-term opportunity to address climate change, food, and water security challenges. Through the computationally informed breeding of canopy structural traits away from those of modern cultivars, we show that solutions exist that increase productivity and water use efficiency, while increasing land-surface reflectivity to offset greenhouse gas warming. Plants have evolved to maximize capture of radiation in the upper leaves, thus shading competi- tors. While important for survival in the wild, this is suboptimal in monoculture crop fields for maximizing pro- ductivity and other biogeophysical services. Crop progenitors evolved over the last 25 million years in an atmosphere with less than half the [CO 2 ] projected for 2050. By altering leaf photosynthetic rates, rising [CO 2 ] and temperature may also alter the optimal canopy form. Here using soybean, the world’s most important protein crop, as an example we show by applying optimization routines to a micrometeorological leaf canopy model linked to a steady-state model of photosynthesis, that significant gains in production, water use, and reflectivity are possible with no additional demand on resources. By modifying total canopy leaf area, its vertical profile and angular distribution, and shortwave radiation reflectivity, all traits available in most major crop germplasm collec- tions, increases in productivity (7%) are possible with no change in water use or albedo. Alternatively, improve- ments in water use (13%) or albedo (34%) can likewise be made with no loss of productivity, under Corn Belt climate conditions. Keywords: agriculture, albedo, carbon uptake, climate change, crop breeding, crop ideotype, evapotranspiration, plant optimi- zation, sustainability, water use efficiency Received 21 August 2013 and accepted 24 October 2013 Introduction Global demand for the major grain and seed crops is beginning to outstrip production for the first time in more than four decades, complicating decisions at the intersection of food security, water use, and cli- mate change mitigation (Godfray et al., 2010; Strzepek & Boehlert, 2010; Foley et al., 2011). Trends in popu- lation growth and the expansion of the middle class globally have driven calls for a near doubling of food production by the middle of the century (United Nations, 2011). At the same time, the yield gains for the major food crops have stagnated (Duvick & Cass- man, 1999; Cassman et al., 2003; Ray et al., 2012), and at present rates of improvement, this doubling will not be achieved (Long & Ort, 2010). This can be attributed to the fact that the approaches of the Green Revolution are nearing their biological limits. Radical new approaches may therefore be needed if the yield jumps required to avoid significant short- ages are to be realized. Yield potential of crop germ- plasm was increased during the Green Revolution primarily by improving the proportion of the plant’s biomass partitioned into the harvested product (har- vest index, HI) and the amount of radiation captured over the growing season (interception efficiency, e i ) (Long et al., 2006a; Murchie et al., 2009). However, with HI for elite modern crop germplasm now at approximately 60% (Evans, 1993; Hay, 1995) and e i at approximately 90% (Beadle & Long, 1985), these traits are close to their biological limits (Long et al., 2006a). Crop photosynthesis, however, falls far short Correspondence: Darren T. Drewry, tel. +818 393 2992, e-mail: [email protected]; Praveen Kumar, tel. +217-333-4688, e-mail: [email protected] 1 © 2014 California Institute of Technology. Government sponsorship acknowledged. Global Change Biology (2014), doi: 10.1111/gcb.12567 Global Change Biology
-
Upload
independent -
Category
Documents
-
view
5 -
download
0
Transcript of Simultaneous improvement in productivity, water use, and albedo through crop structural modification
Simultaneous improvement in productivity, water use,and albedo through crop structural modificationDARREN T . DREWRY 1 , 2 , PRAVEEN KUMAR 3 , 4 and STEPHEN P. LONG5 , 6
1Climate Physics Group, Jet Propulsion Laboratory, California Institute of Technology, m/s 233-300, Pasadena, CA 91109-8099,
USA, 2Joint Institute for Regional Earth System Science & Engineering, University of California Los Angeles, 607 Charles E
Young Drive East, Young Hall, Room 4242, Los Angeles, CA 90095-7228, USA, 3Department of Civil and Environmental
Engineering, University of Illinois, 2527B Hydrosystems Laboratory, 301 North Mathews Avenue, Urbana, IL 61801-2352, USA,4Department of Atmospheric Sciences, University of Illinois, 150 South Gregory Street, Urbana, IL 61801-3070, USA,5Department of Crop Sciences, University of Illinois, AW-101 Turner Hall, 1102 South Goodwin Avenue, Urbana, IL 61801,
USA, 6Department of Plant Biology, University of Illinois, 265 Morrill Hall, 505 South Goodwin Avenue, Urbana, IL 61801, USA
Abstract
Spanning 15% of the global ice-free terrestrial surface, agricultural lands provide an immense and near-term
opportunity to address climate change, food, and water security challenges. Through the computationally
informed breeding of canopy structural traits away from those of modern cultivars, we show that solutions exist
that increase productivity and water use efficiency, while increasing land-surface reflectivity to offset greenhouse
gas warming. Plants have evolved to maximize capture of radiation in the upper leaves, thus shading competi-
tors. While important for survival in the wild, this is suboptimal in monoculture crop fields for maximizing pro-
ductivity and other biogeophysical services. Crop progenitors evolved over the last 25 million years in an
atmosphere with less than half the [CO2] projected for 2050. By altering leaf photosynthetic rates, rising [CO2]
and temperature may also alter the optimal canopy form. Here using soybean, the world’s most important protein
crop, as an example we show by applying optimization routines to a micrometeorological leaf canopy model
linked to a steady-state model of photosynthesis, that significant gains in production, water use, and reflectivity
are possible with no additional demand on resources. By modifying total canopy leaf area, its vertical profile and
angular distribution, and shortwave radiation reflectivity, all traits available in most major crop germplasm collec-
tions, increases in productivity (7%) are possible with no change in water use or albedo. Alternatively, improve-
ments in water use (13%) or albedo (34%) can likewise be made with no loss of productivity, under Corn Belt
climate conditions.
Keywords: agriculture, albedo, carbon uptake, climate change, crop breeding, crop ideotype, evapotranspiration, plant optimi-
zation, sustainability, water use efficiency
Received 21 August 2013 and accepted 24 October 2013
Introduction
Global demand for the major grain and seed crops is
beginning to outstrip production for the first time in
more than four decades, complicating decisions at
the intersection of food security, water use, and cli-
mate change mitigation (Godfray et al., 2010; Strzepek
& Boehlert, 2010; Foley et al., 2011). Trends in popu-
lation growth and the expansion of the middle class
globally have driven calls for a near doubling of food
production by the middle of the century (United
Nations, 2011). At the same time, the yield gains for
the major food crops have stagnated (Duvick & Cass-
man, 1999; Cassman et al., 2003; Ray et al., 2012), and
at present rates of improvement, this doubling will
not be achieved (Long & Ort, 2010). This can be
attributed to the fact that the approaches of the
Green Revolution are nearing their biological limits.
Radical new approaches may therefore be needed if
the yield jumps required to avoid significant short-
ages are to be realized. Yield potential of crop germ-
plasm was increased during the Green Revolution
primarily by improving the proportion of the plant’s
biomass partitioned into the harvested product (har-
vest index, HI) and the amount of radiation captured
over the growing season (interception efficiency, ei)(Long et al., 2006a; Murchie et al., 2009). However,
with HI for elite modern crop germplasm now at
approximately 60% (Evans, 1993; Hay, 1995) and ei atapproximately 90% (Beadle & Long, 1985), these
traits are close to their biological limits (Long et al.,
2006a). Crop photosynthesis, however, falls far short
Correspondence: Darren T. Drewry, tel. +818 393 2992, e-mail:
[email protected]; Praveen Kumar, tel. +217-333-4688,
e-mail: [email protected]
1© 2014 California Institute of Technology. Government sponsorship acknowledged.
Global Change Biology (2014), doi: 10.1111/gcb.12567
Global Change Biology
of its theoretical maximum (Murchie et al., 2009; Zhu
et al., 2010). Experimental open-air elevation of
atmospheric CO2 concentration [CO2] around rice,
soybean, and wheat crops in the field increases pho-
tosynthesis and in turn crop yields (Long et al.,
2006b). We show here that by radical redesign of
crop canopies, through conventional breeding, a large
increase in photosynthetic carbon gain and in turn,
yield potential could be achieved while improving or
maintaining other ecosystem service benefits.
Demand for greater yield is further complicated by
concurrent environmental demands on agricultural
systems, in particular, improved water use efficiency
(WUE) to allow improved yields without increasing
water demand (Wallace, 2000; Howell, 2001; Condon
et al., 2004). In addition, the broad geographical
extent of agricultural lands planted with the major
annual food crops (Monfreda et al., 2008; Ramankutty
et al., 2008) provides a large scale opportunity to bio-
geophysically engineer a key climate warming offset,
increased crop albedo, which would effectively cause
surface cooling (Lenton & Vaughan, 2009; Ridgwell
et al., 2009; Singarayer et al., 2009; Woodward et al.,
2009). Given that new seed is sown annually, this is
a global warming offset that could be rapidly imple-
mented compared to other geophysical engineering
options, providing it is not detrimental to maintain-
ing or increasing yield.
The functional traits of modern agricultural species
reflect many millions of years of preceding evolution
which has selected for survival and fecundity of the
individual, which will include traits in conflict with
maximizing yield, the aim of modern agriculture
(Loomis, 1993; Denison et al., 2003). Our previous work
has shown radiation to be suboptimally distributed in
modern soybean cultivars (Drewry et al., 2010a,b) as a
function of observed foliage density and distribution
(Dermody et al., 2006). Insights such as these have
made canopy morphological traits such as leaf erect-
ness key targets of breeding and genetic modification
aimed at yield increases (Long et al., 2006a; Sakamoto
et al., 2006). A number of other traits, such as leaf angle
(Austin et al., 1976), glaucousness (Johnson et al., 1983;
Holmes & Keiller, 2002), and leaf hair properties
(Holmes & Keiller, 2002) have been shown to impact
shortwave reflectivity, modifying canopy light
distribution. However, exploring the implications of all
possible permutations of these characteristics
experimentally would be exhaustive in time and
resources. Since the results are governed by well-
defined biophysical principles, a more effective initial
way forward is to use high performance computing to
explore all permutations. In so doing, we can predict
the quantitative biophysical properties to select for
breeding the optimized ideotype for objectives of
increased productivity, water use, and albedo.
Soybean, together with corn with which it is rotated
over much of the US Corn Belt, arguably forms the larg-
est single ecosystem type in the 48 contiguous US
States. It is the second most important crop in the Uni-
ted States in terms of area planted and the fourth most
important in terms of global production (FAOSTAT,
2012). While this investigation focuses on soybean, the
principles developed would apply equally to the other
major food crops.
The degree to which fundamental biophysical trade-
offs will limit the flexibility of agricultural systems to
be managed to simultaneously improve crop yield,
water use, and canopy reflectivity is a critical open
question whose answer will guide the management of
future agricultural systems. Here, we leverage
advances in numerical optimization (Vrugt &
Robinson, 2007) and in the biophysical and biochemical
modeling of crop canopies (Drewry et al., 2010a,b) to
address this question, with the aim of opening new
avenues for future breeding programs targeting
canopy-scale traits. We ask the question: by selection of
canopy-scale characteristics, can a substantial improve-
ment be achieved over existing canopies of elite
germplasm?
Materials and methods
We examine numerically if crop canopies could be rede-
signed to simultaneously achieve: (i) maximization of CO2
uptake (Max An); (ii) minimization of water use, or transpira-
tion (Min Tr); and (iii) maximization of total shortwave
albedo (Max as). We conducted optimization experiments to
explore the extent to which each of the three selection criteria
above could be improved without deterioration in the others,
and the extent to which simultaneous improvement could be
achieved. These cases have unique applications. For example,
in a dry climate, the improvement of water use without com-
promising productivity and albedo may be the priority,
whereas in a climate where radiation is limiting, maximizing
An with no change in water use or albedo may be the ideal
goal. To address these objectives, the following canopy traits
were varied: total canopy leaf area (leaf area index, LAI), leaf
area density as a function of height [LAD(z)], photosyntheti-
cally active radiation reflectivity [PARr(z)], near-infrared radi-
ation reflectivity [NIRr(z)], and leaf angle [c(z)]. Details of the
canopy model formulation, simulation setup, optimization
algorithm, and canopy optimization experimental design are
provided below.
Multi-layer canopy simulations
The optimizations of canopy structural traits were con-
ducted using a biophysical canopy model (MLCan) that
has been parameterized for a modern soybean cultivar
© 2014 California Institute of Technology. Government sponsorship acknowledged., Global Change Biology, doi: 10.1111/gcb.12567
2 D. T. DREWRY et al.
growing in the US Corn Belt (Drewry et al., 2010a) and
validated with respect to canopy-scale CO2, water, and
energy exchange (Drewry et al., 2010a). This model is now
publicly available (Le et al., 2012). The soybean model can-
opy in these experiments was discretized into 15 layers
vertically, which allows for the within-canopy resolution of
biochemical, ecophysiological, and physical states and
fluxes. The 15 layer discretization has been shown to be
sufficient to accurately capture canopy-atmosphere mass
and energy exchange for both maize and soybean canopies
(Drewry et al., 2010a). At each canopy level, a coupled
system of equations was solved representing the limiting
biochemical steps of steady-state photosynthesis (Farquhar
et al., 1980; Farquhar & Sharkey, 1982), stomatal
conductance (Ball & Berry, 1982), leaf energy balance
(Nikolov, 1995), and leaf boundary layer conductance
(Nikolov & Zeller, 2003). Shortwave radiation absorption,
reflection, and transmission through the canopy were com-
puted at each canopy layer using a Beer’s Law relationship
that incorporates vegetation clumping, separating leaves in
direct sunlight from those in diffuse and shaded light
(Campbell & Norman, 1998).
Photosynthetically active and near-infrared shortwave
bands were considered separately as green foliage interacts
differently with these two portions of the shortwave spectrum.
The longwave radiation regime was resolved through the can-
opy as a function of absorption of downwelling radiation and
emission in each layer using the Stefan-Boltzmann equation
(Campbell & Norman, 1998). Within-canopy gradients of wind
speed were calculated using the mean momentum equation
(Poggi et al., 2004). Gradients of humidity, temperature, and
CO2 were computed using a temporally averaged conserva-
tion of mass equation and assuming negligible storage within
the canopy airspace (Katul et al., 2004). The complete mathe-
matical formulation of the MLCan model, including all
parameters describing the species-specific physiological and
physical characteristics of the soybean canopy, are provided
in Drewry et al. (2010a) and the supplementary material of
that article.
The model was run at hourly time steps. The environ-
mental forcing variables used to drive the canopy model
include top-of-canopy wind speed, air temperature, humid-
ity, CO2 concentration, and downward photosynthetically
active, near-infrared, and thermal radiation fluxes. Each
MLCan run was for a full diurnal period using the mean
environmental forcing measured at the Bondville, Illinois
Ameriflux site (http://ameriflux.ornl.gov/fullsiteinfo.php?
sid=44) (located at 40.0062° North 88.2904° West, in central
IL, USA) on 15 clear-sky days in July and August during
the three study years for which MLCan was previously
validated (2002, 2004, 2006) for soybean crop carbon diox-
ide, water, and energy fluxes (Drewry et al., 2010a) (see
Fig. S1). This mean diurnal forcing is representative of the
conditions when the canopy is fully closed and seed filling
is occurring, and therefore a critical period in crop devel-
opment. We focus on clear-sky conditions as these repre-
sentative periods, in which the canopy is most likely to
have high levels of both carbon dioxide assimilation and
subsurface moisture utilization, making these periods the
most challenging and critical for enhancing both productiv-
ity and moisture conservation.
Acclimatory response to climate change
Above-canopy CO2 concentration was set to 370 ppm for the
‘Current Climate’ simulations, to represent the average value
during the model validation years (2001–2006). Canopy simu-
lations for the elevated CO2 scenarios incorporated acclimato-
ry responses of soybean plants to growth in a 550 ppm
environment (Ainsworth & Long, 2005; Dermody et al., 2006;
Ort et al., 2006) as observed at the SoyFACE Free Air Carbon
Enrichment (FACE) experiment in central Illinois. For these
experiments, total canopy leaf area was increased by 10% to
represent observed structural acclimation of the soybean
canopy (Dermody et al., 2006). To represent the observed
photosynthetic down-regulation under 550 ppm growth con-
ditions (Ainsworth et al., 2002; Bernacchi et al., 2005), the max-
imum carboxylation velocity of Rubisco (Vcmax) was reduced
by 5%. Variations in stomatal regulation of gas exchange as a
function of ambient [CO2] are simulated dynamically through
the coupling of the Ball-Berry model (Ball & Berry, 1982) of
stomatal conductance, a widely utilized biochemical model of
photosynthesis (Farquhar et al., 1980), and a model of the
energy balance of a leaf (Nikolov, 1995). This is identical to the
methodology employed by Drewry et al. (2010b) and vali-
dated with observations from the SoyFACE site.
Optimization algorithm
The canopy optimization experiments were conducted using
the AMALGAM multi-objective optimization algorithm
(Vrugt et al., 2003; Vrugt & Robinson, 2007). AMALGAM is a
genetically adaptive multi-algorithm that combines multiple
search algorithms to ensure reliable and efficient global opti-
mization. For each two-objective optimization performed here,
a population size of 200 members and 50 000 model evalua-
tions was utilized. The three-objective optimization utilized a
population size of 1000 members and 500 000 model evalua-
tions. The objective function computations, along with the
parameters varied in the optimization experiments and their
ranges of variability are discussed below.
Canopy traits
The optimization algorithm converged to the optimal canopy
structural values by varying up to five canopy characteristics,
depending on the specific experiment being conducted. The
LAI was one free parameter in the optimization experiments,
and was allowed to vary within the range 3.0–7.5 (m2 m�2).
This range contains the observed mean value of 5.34 (m2 m�2)
for the period considered here (Dermody et al., 2006; Drewry
et al., 2010a).
Four canopy-level traits were allowed to vary vertically
throughout the canopy domain: (i) the vertical distribu-
tion of foliage, or leaf area density [LAD(z)]; (ii) mean leaf
© 2014 California Institute of Technology. Government sponsorship acknowledged., Global Change Biology, doi: 10.1111/gcb.12567
ENHANCING PRODUCTIVITY, WATER USE, AND ALBEDO 3
angle [c(z)]; (iii) reflectivity to photosynthetically active radia-
tion [PARr(z)]; and (iv) reflectivity to near-infrared radiation
[NIRr(z)]. The vertical distribution of foliage, LAD(z), was
varied according to a two-parameter distribution previously
used to model crop canopy structure (Boedhram et al., 2001;
Drewry et al., 2010b).
LADðzÞ ¼ LAI
dz:exp �ðz� zoptÞ2=r2
� �ð1Þ
zopt and r2 were allowed to vary over the ranges [0.01–1.0]
and [0.3–5.0]. These values respectively control the location of
the vertical LAD(z) peak value and the dispersion of the distri-
bution vertically. These specified ranges allowed for the opti-
mization algorithm to search the space of canopy foliage
distributions ranging from near-uniform to strongly concen-
trated in a few canopy layers. In the above equation, dz is the
canopy grid spacing.
The two shortwave reflectivity distributions, PARr(z) and
NIRr(z), were allowed to vary vertically through the canopy as
a function of the distribution of their respective leaf-level ab-
sorptivities (ap and an), which were selected from the ranges
[0.7–0.9] and [0.1–0.3], and allowed to vary linearly through
the canopy.
PARrðzÞ ¼1� ffiffiffiffiffi
app
1þ ffiffiffiffiffiap
p ð2Þ
NIRrðzÞ ¼ 1� ffiffiffiffiffian
p1þ ffiffiffiffiffi
anp ð3Þ
Vertical variation in mean leaf angle was obtained by allowing
a linearly varying profile of the leaf angle distribution parame-
ter, x, bounded by values in the range [0–10] (Campbell, 1986),
in the following equation that describes the extinction coeffi-
cient for beam radiation (Kb), which is also a function of the
solar zenith angle (/) (Drewry et al., 2010a).
KbðzÞ ¼ffiffiffiffiffiffiffiffiffiffiffiffiffiffiffiffiffiffiffiffiffiffiffix2 þ tan2/
pxþ 1:774ðxþ 1:182Þ�0:733
ð4Þ
The vertical distribution of mean leaf angle is calculated as the
inverse cosine of Kb(z) for a zenith angle of zero (Campbell,
1986):
cðzÞ ¼ arccos
ffiffiffiffiffix2
p
xþ 1:774ðxþ 1:182Þ�0:733
" #ð5Þ
Model optimization experiments
Optimization experiments were conducted for two or three
simultaneous goals, and by allowing one or a combination of
several traits to vary together. This approach provided insight
into the individual traits that produced the greatest benefit
with respect to optimal goal values, and which trait
combinations together provide the greatest, and potentially
synergistic, improvements in performance. The values of the
three selection criteria (Max An, Min Tr, and Max as), or goals,were determined by computing total canopy CO2 uptake,
transpiratory water use, and outgoing shortwave radiation at
each iteration of the optimization algorithm. Total net canopy
CO2 uptake, An, which was maximized in the optimization
experiments, was computed by vertically integrating through
the plant canopy the net exchange of CO2 uptake by all foli-
age, both sunlit and shaded, over the course of the diurnal
period. The computation of total canopy water use, Tr, which
was minimized in the optimization experiments, was similarly
calculated by integrating vertically leaf water loss over all
foliage over the diurnal period. No precipitation or dew accu-
mulation was allowed on the foliage in these experiments to
limit consideration to water use through transpiration. Total
canopy shortwave albedo, as, which was maximized in the
optimization experiments, was computed as the total upward
photosynthetically active and near-infrared flux at the top of
the canopy, also integrated over the diurnal period.
Optimization results are also presented in terms of WUE
and radiation use efficiency (RUE). WUE is calculated as the
ratio of daytime total CO2 uptake over all foliage layers to
daytime total water use by the canopy.
WUE ¼R t2t1
R h0 An;tðz; tÞdzdtR t2
t1
R h0 Tr;tðz; tÞdzdt
ð6Þ
RUE is calculated similarly, with the denominator represent-
ing the total daytime shortwave radiation absorbed by the
canopy.
RUE ¼R t2t1
R h0 An;tðz; tÞdzdtR t2
t1
R h0 SWabs;tðz; tÞdzdt
ð7Þ
The variables An,t(z, t), Tr,t(z, t), and SWabs,t(z, t) represent,
respectively, foliage CO2 uptake, water use, and absorbed
shortwave radiation at each canopy layer and model time
step, h the height of the soybean canopy, and t1 and t2 the
start and end times of the day.
Results
The canopy model optimization results are presented
as changes in each objective (An, Tr, or as) produced by
the new in silico optimized canopy, relative to the
solution produced by a simulation with the ‘control
canopy’, which is based on that measured for a current
elite line in the field. The symbol D represents the
percent change in a variable, as shown below for a
hypothetical variable v.
Dv ¼ voptimized canopy � vcontrol canopyvcontrol canopy
� 100% ð8Þ
The control canopy was defined by the MLCan
model description given in the Methods section above
and elaborated in detail in Drewry et al. (2010a) and
supporting information therein, including the parame-
ter specifications provided for the measured soybean
canopy. MLCan has been rigorously validated under
current and future elevated CO2 atmospheres (Drewry
et al., 2010a,b). The optimization results are also pre-
sented in terms of water and radiation use efficiencies
© 2014 California Institute of Technology. Government sponsorship acknowledged., Global Change Biology, doi: 10.1111/gcb.12567
4 D. T. DREWRY et al.
(WUE and RUE, respectively), two metrics widely used
in agricultural research to quantify resource utilization
and potential limitations in crop production (Dooren-
bos et al., 1979; Horton, 2000; Wallace, 2000).
Two-objective optimizations
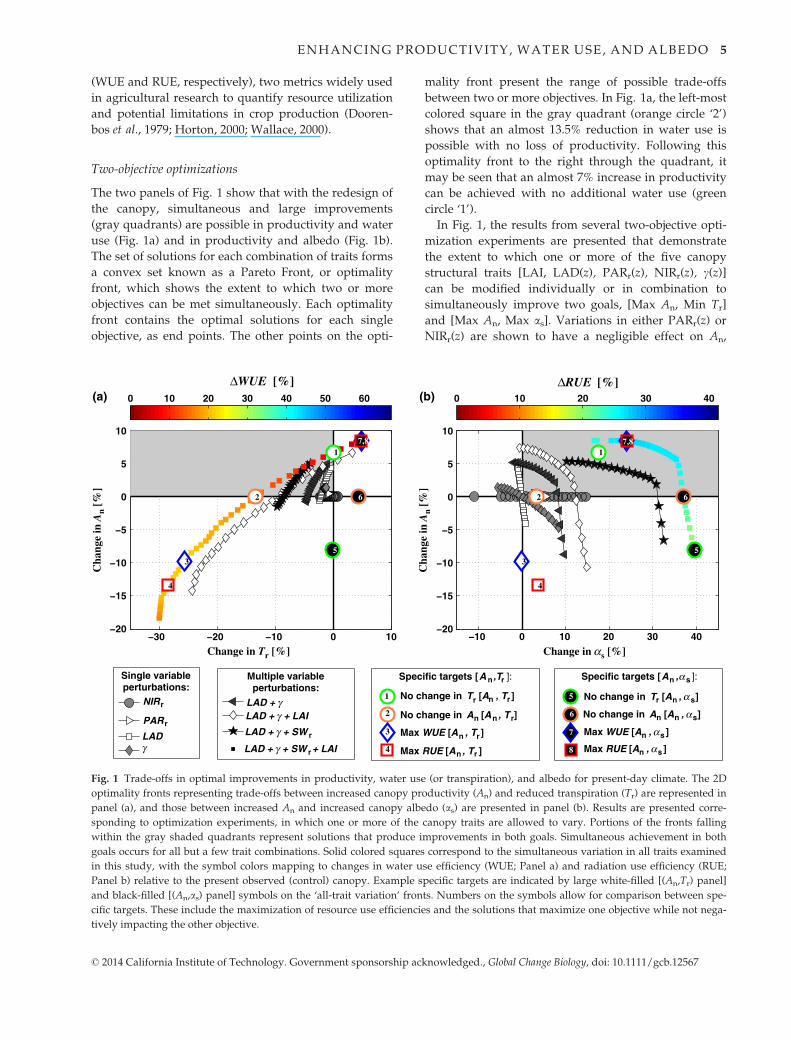
The two panels of Fig. 1 show that with the redesign of
the canopy, simultaneous and large improvements
(gray quadrants) are possible in productivity and water
use (Fig. 1a) and in productivity and albedo (Fig. 1b).
The set of solutions for each combination of traits forms
a convex set known as a Pareto Front, or optimality
front, which shows the extent to which two or more
objectives can be met simultaneously. Each optimality
front contains the optimal solutions for each single
objective, as end points. The other points on the opti-
mality front present the range of possible trade-offs
between two or more objectives. In Fig. 1a, the left-most
colored square in the gray quadrant (orange circle ‘2’)
shows that an almost 13.5% reduction in water use is
possible with no loss of productivity. Following this
optimality front to the right through the quadrant, it
may be seen that an almost 7% increase in productivity
can be achieved with no additional water use (green
circle ‘1’).
In Fig. 1, the results from several two-objective opti-
mization experiments are presented that demonstrate
the extent to which one or more of the five canopy
structural traits [LAI, LAD(z), PARr(z), NIRr(z), c(z)]can be modified individually or in combination to
simultaneously improve two goals, [Max An, Min Tr]
and [Max An, Max as]. Variations in either PARr(z) or
NIRr(z) are shown to have a negligible effect on An,
−30 −20 −10 0 10−20
−15
−10
−5
0
5
10
Change in Tr [%]
Cha
nge
in A
n [%
]
1
2
3
4
ΔWUE [%]
5
6
7,8
(a)
−10 0 10 20 30 40−20
−15
−10
−5
0
5
10C
hang
e in
An
[%]
Change in αs [%]
5
6
7,81
2
3
4
ΔRUE [%](b)0 10 20 30 40 50 60 0 10 20 30 40
NIRr
PARr
LADγ
Single variableperturbations:
LAD + γLAD + γ + LAI
LAD + γ + SW r
LAD + γ + SW r + LAI
Multiple variableperturbations:
No change in T r [An , T r ]
No change in An [An , T r]
Max WUE [An , T r ]
Max RUE [An , T r ]
Specific targets [A n,Tr ]:
1
2
3
4
No change in An [An , αs]
No change in Tr [An , α s]
Max WUE [An , αs]
Max RUE [An , αs]
Specific targets [An ,α s ]:
5
6
7
8
Fig. 1 Trade-offs in optimal improvements in productivity, water use (or transpiration), and albedo for present-day climate. The 2D
optimality fronts representing trade-offs between increased canopy productivity (An) and reduced transpiration (Tr) are represented in
panel (a), and those between increased An and increased canopy albedo (as) are presented in panel (b). Results are presented corre-
sponding to optimization experiments, in which one or more of the canopy traits are allowed to vary. Portions of the fronts falling
within the gray shaded quadrants represent solutions that produce improvements in both goals. Simultaneous achievement in both
goals occurs for all but a few trait combinations. Solid colored squares correspond to the simultaneous variation in all traits examined
in this study, with the symbol colors mapping to changes in water use efficiency (WUE; Panel a) and radiation use efficiency (RUE;
Panel b) relative to the present observed (control) canopy. Example specific targets are indicated by large white-filled [(An,Tr) panel]
and black-filled [(An,as) panel] symbols on the ‘all-trait variation’ fronts. Numbers on the symbols allow for comparison between spe-
cific targets. These include the maximization of resource use efficiencies and the solutions that maximize one objective while not nega-
tively impacting the other objective.
© 2014 California Institute of Technology. Government sponsorship acknowledged., Global Change Biology, doi: 10.1111/gcb.12567
ENHANCING PRODUCTIVITY, WATER USE, AND ALBEDO 5
indicating that the amount of shortwave radiation
absorbed during the course of a cloud-free day is not
constraining photosynthesis and that a canopy-scale
bottleneck may exist in another aspect of the canopy
structure. The single trait having the greatest impact on
An is LAD(z), with the combined variation in [LAD(z), c(z)] resulting in an almost 5% decrease in transpiration
for no loss of productivity relative to the control can-
opy, or alternatively a 5% increase in productivity with
a slight reduction in water use (Fig. 1a). Augmenting
the variable set to include either LAI or both shortwave
reflectivities [SWr(z)], i.e. [LAD(z), c(z), LAI] or [LAD
(z), c(z), PARr(z), NIRr(z)], results in conservation of
water, through reduced transpiration, of approximately
10% without loss of productivity (Fig. 1a).
Canopy albedo is most sensitive to variations in NIR
reflectivity. PARr(z) or NIRr(z) variations provide an
opportunity for canopy shortwave albedo to be
increased by up to 6% and 15%, respectively, with no
cost to canopy productivity. Leaf angle distribution
alone also has a large impact on canopy reflectance,
increasing as by up to 8.5% (Fig. 1b). Variations in LAD
(z) and c(z) individually do not produce simultaneous
improvement in An and as, but together synergisticallyprovide a range of possible solutions that improve both
goals at the same time (Fig. 1b, gray quadrant). Varying
the reflectivities in combination with canopy foliage
distribution and leaf angle variation [LAD(z), c(z),PARr(z), NIRr(z)] can produce a greater than 30%
increase in total canopy albedo without loss of produc-
tivity (Fig. 1b).
When all traits are allowed to vary simultaneously
[LAI, LAD(z), PARr(z), NIRr,(z), c(z)], the optimality
fronts in Fig. 1 describe solutions that improve WUE
by as much as 21% for (An, Tr) and RUE by 27% for
(An,as), as indicated by the coloring of the all-trait varia-
tion scenarios and associated color bars in Fig. 1a,b. It
is of note that ideotypes related to ‘specific target solu-
tions’ in one of the two-objective spaces, presented as
large numbered symbols in Fig. 1, may perform poorly
when the third objective is considered. For example,
the solution that minimizes Tr while maintaining An at
the control canopy level (Fig. 1a; orange circle ‘2’)
results in a small improvement in as (Fig. 1b), while the
canopy that maximizes as for no relative change in An
(Fig. 1b; symbol ‘6’) results in increased canopy water
use by more than 4% (Fig. 1a). Three of the four specific
target solutions in the (An,as) objective space result in
an increase in transpiration in the (An,Tr) space, with
the only exception being the solution in which Tr is
constrained to remain unchanged (symbol ‘5’). This
contrasts with the (An,Tr) target solutions, which all
show increases in shortwave reflectivity. These consid-
erations demonstrate the power of this multi-objective
optimization approach to guide solutions that simulta-
neously meet a range of agricultural goals. Overall, the
two-objective optimization experiments show signifi-
cant opportunities for simultaneous improvements in
key agricultural goals.
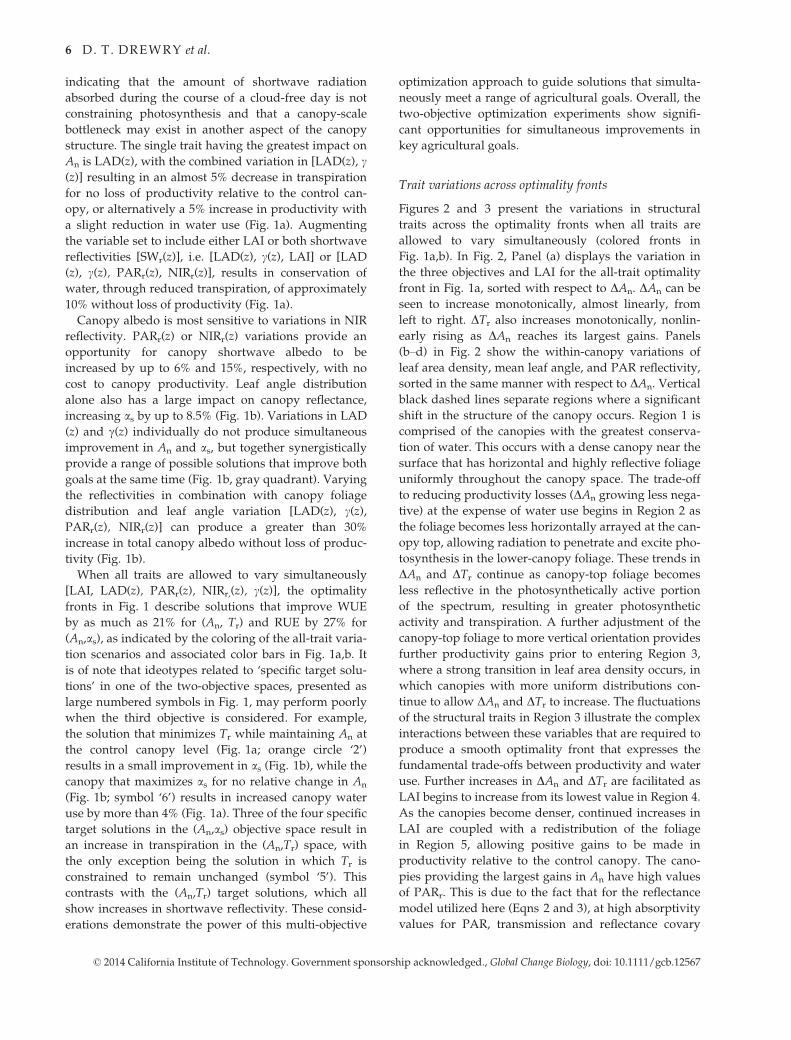
Trait variations across optimality fronts
Figures 2 and 3 present the variations in structural
traits across the optimality fronts when all traits are
allowed to vary simultaneously (colored fronts in
Fig. 1a,b). In Fig. 2, Panel (a) displays the variation in
the three objectives and LAI for the all-trait optimality
front in Fig. 1a, sorted with respect to DAn. DAn can be
seen to increase monotonically, almost linearly, from
left to right. DTr also increases monotonically, nonlin-
early rising as DAn reaches its largest gains. Panels
(b–d) in Fig. 2 show the within-canopy variations of
leaf area density, mean leaf angle, and PAR reflectivity,
sorted in the same manner with respect to DAn. Vertical
black dashed lines separate regions where a significant
shift in the structure of the canopy occurs. Region 1 is
comprised of the canopies with the greatest conserva-
tion of water. This occurs with a dense canopy near the
surface that has horizontal and highly reflective foliage
uniformly throughout the canopy space. The trade-off
to reducing productivity losses (DAn growing less nega-
tive) at the expense of water use begins in Region 2 as
the foliage becomes less horizontally arrayed at the can-
opy top, allowing radiation to penetrate and excite pho-
tosynthesis in the lower-canopy foliage. These trends in
DAn and DTr continue as canopy-top foliage becomes
less reflective in the photosynthetically active portion
of the spectrum, resulting in greater photosynthetic
activity and transpiration. A further adjustment of the
canopy-top foliage to more vertical orientation provides
further productivity gains prior to entering Region 3,
where a strong transition in leaf area density occurs, in
which canopies with more uniform distributions con-
tinue to allow DAn and DTr to increase. The fluctuations
of the structural traits in Region 3 illustrate the complex
interactions between these variables that are required to
produce a smooth optimality front that expresses the
fundamental trade-offs between productivity and water
use. Further increases in DAn and DTr are facilitated as
LAI begins to increase from its lowest value in Region 4.
As the canopies become denser, continued increases in
LAI are coupled with a redistribution of the foliage
in Region 5, allowing positive gains to be made in
productivity relative to the control canopy. The cano-
pies providing the largest gains in An have high values
of PARr. This is due to the fact that for the reflectance
model utilized here (Eqns 2 and 3), at high absorptivity
values for PAR, transmission and reflectance covary
© 2014 California Institute of Technology. Government sponsorship acknowledged., Global Change Biology, doi: 10.1111/gcb.12567
6 D. T. DREWRY et al.
(a)
(b)
(c)
(d)
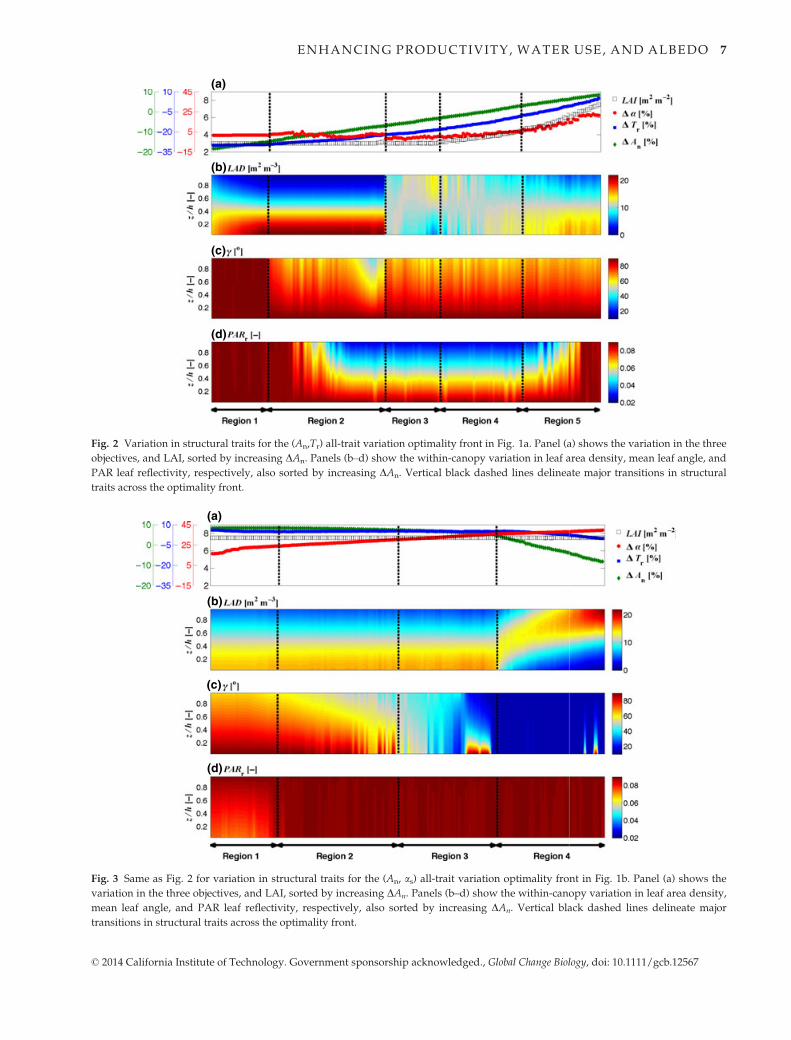
Fig. 2 Variation in structural traits for the (An,Tr) all-trait variation optimality front in Fig. 1a. Panel (a) shows the variation in the three
objectives, and LAI, sorted by increasing DAn. Panels (b–d) show the within-canopy variation in leaf area density, mean leaf angle, and
PAR leaf reflectivity, respectively, also sorted by increasing DAn. Vertical black dashed lines delineate major transitions in structural
traits across the optimality front.
(a)
(b)
(c)
(d)
Fig. 3 Same as Fig. 2 for variation in structural traits for the (An, as) all-trait variation optimality front in Fig. 1b. Panel (a) shows the
variation in the three objectives, and LAI, sorted by increasing DAn. Panels (b–d) show the within-canopy variation in leaf area density,
mean leaf angle, and PAR leaf reflectivity, respectively, also sorted by increasing DAn. Vertical black dashed lines delineate major
transitions in structural traits across the optimality front.
© 2014 California Institute of Technology. Government sponsorship acknowledged., Global Change Biology, doi: 10.1111/gcb.12567
ENHANCING PRODUCTIVITY, WATER USE, AND ALBEDO 7
such that an increase in reflectance is accompanied by
an increase in transmission. This increase in transmis-
sion, at the highest allowed LAI in these experiments
(7.5 m2 m�2), allows greater photosynthesis deep in the
canopy and thus provides a slight increase in An rela-
tive to higher absorptivity cases. NIRr shows little vari-
ability for these solutions, varying between 0.50 and
0.52.
In Fig. 3, a similar set of panels describe the within-
canopy trait variations as canopy albedo monotonically
increases from left to right for the all-trait variation
optimality front of Fig. 1b. For maximization of An and
as, LAI remains at its maximum value of 7.5 m2 m�2.
The highest An gains, and lowest as gains, are found in
Region 1 with an LAD distribution that is more uni-
form than the control canopy, but with denser foliage
near the surface, similar to that found for the highest
DAn canopies in the (An, Tr) space (Fig. 2). Leaves in
Region 1 become more vertical and less reflective in the
PAR regime with depth. In Region 2, albedo increases
with little cost to An through simultaneous modifica-
tions to the leaf angle distribution that make canopy-
top leaves more horizontal and PAR reflectivity
increases with depth. These trends in An and as con-
tinue in Region 3 as the foliage throughout the canopy
is made progressively more horizontal. It is notable that
the changes across Regions 1–3 do not result in signifi-
cant reductions in An, as the multi-objective optimiza-
tion is able to find variations in LAD and PARr that
offset the impacts of leaf angle variations, allowing
gains in albedo to occur at almost no cost to productiv-
ity. A major shift in leaf area distribution occurs in
Region 4, allowing albedo to continue to increase, but
with a dramatic decline in productivity. As the foliage
is made denser near the canopy top, leaves throughout
the canopy are horizontally arrayed and have high
PAR reflectance, producing the canopies with highest
total albedo. NIRr shows little variability for these solu-
tions, varying between 0.47 and 0.52, allowing for maxi-
mum shortwave albedo by reflecting much of the
radiation that is surplus to that needed to drive photo-
synthesis at light-saturation.
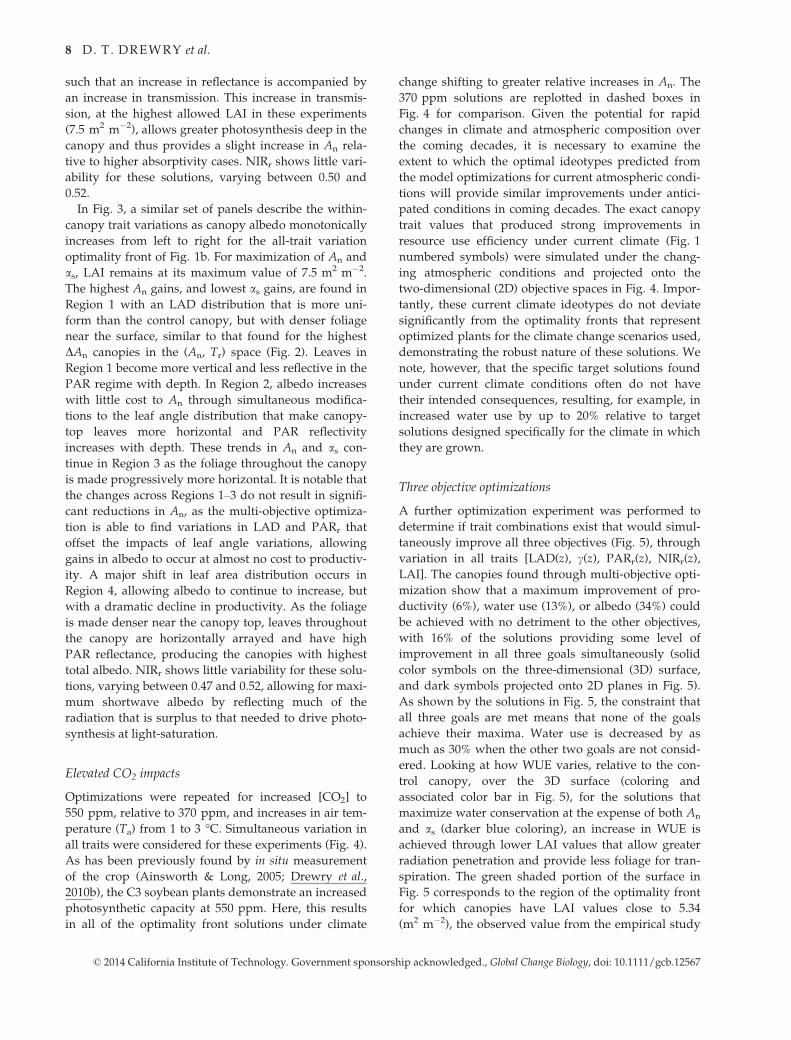
Elevated CO2 impacts
Optimizations were repeated for increased [CO2] to
550 ppm, relative to 370 ppm, and increases in air tem-
perature (Ta) from 1 to 3 °C. Simultaneous variation in
all traits were considered for these experiments (Fig. 4).
As has been previously found by in situ measurement
of the crop (Ainsworth & Long, 2005; Drewry et al.,
2010b), the C3 soybean plants demonstrate an increased
photosynthetic capacity at 550 ppm. Here, this results
in all of the optimality front solutions under climate
change shifting to greater relative increases in An. The
370 ppm solutions are replotted in dashed boxes in
Fig. 4 for comparison. Given the potential for rapid
changes in climate and atmospheric composition over
the coming decades, it is necessary to examine the
extent to which the optimal ideotypes predicted from
the model optimizations for current atmospheric condi-
tions will provide similar improvements under antici-
pated conditions in coming decades. The exact canopy
trait values that produced strong improvements in
resource use efficiency under current climate (Fig. 1
numbered symbols) were simulated under the chang-
ing atmospheric conditions and projected onto the
two-dimensional (2D) objective spaces in Fig. 4. Impor-
tantly, these current climate ideotypes do not deviate
significantly from the optimality fronts that represent
optimized plants for the climate change scenarios used,
demonstrating the robust nature of these solutions. We
note, however, that the specific target solutions found
under current climate conditions often do not have
their intended consequences, resulting, for example, in
increased water use by up to 20% relative to target
solutions designed specifically for the climate in which
they are grown.
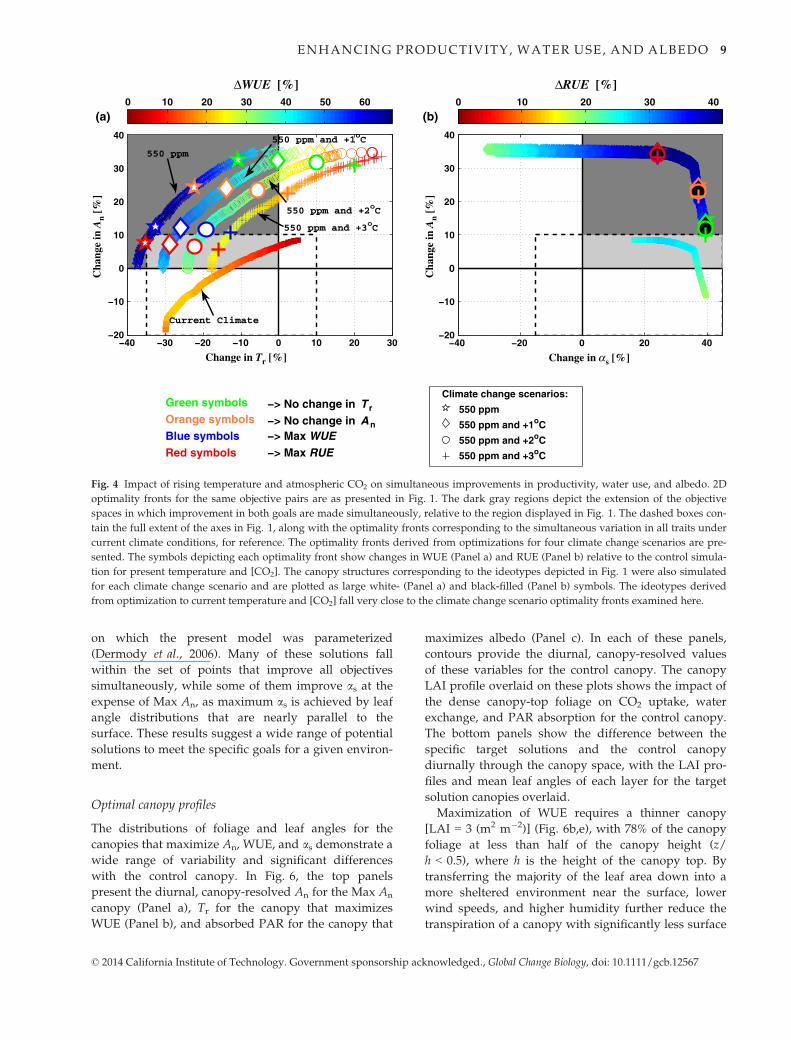
Three objective optimizations
A further optimization experiment was performed to
determine if trait combinations exist that would simul-
taneously improve all three objectives (Fig. 5), through
variation in all traits [LAD(z), c(z), PARr(z), NIRr(z),
LAI]. The canopies found through multi-objective opti-
mization show that a maximum improvement of pro-
ductivity (6%), water use (13%), or albedo (34%) could
be achieved with no detriment to the other objectives,
with 16% of the solutions providing some level of
improvement in all three goals simultaneously (solid
color symbols on the three-dimensional (3D) surface,
and dark symbols projected onto 2D planes in Fig. 5).
As shown by the solutions in Fig. 5, the constraint that
all three goals are met means that none of the goals
achieve their maxima. Water use is decreased by as
much as 30% when the other two goals are not consid-
ered. Looking at how WUE varies, relative to the con-
trol canopy, over the 3D surface (coloring and
associated color bar in Fig. 5), for the solutions that
maximize water conservation at the expense of both An
and as (darker blue coloring), an increase in WUE is
achieved through lower LAI values that allow greater
radiation penetration and provide less foliage for tran-
spiration. The green shaded portion of the surface in
Fig. 5 corresponds to the region of the optimality front
for which canopies have LAI values close to 5.34
(m2 m�2), the observed value from the empirical study
© 2014 California Institute of Technology. Government sponsorship acknowledged., Global Change Biology, doi: 10.1111/gcb.12567
8 D. T. DREWRY et al.
on which the present model was parameterized
(Dermody et al., 2006). Many of these solutions fall
within the set of points that improve all objectives
simultaneously, while some of them improve as at theexpense of Max An, as maximum as is achieved by leaf
angle distributions that are nearly parallel to the
surface. These results suggest a wide range of potential
solutions to meet the specific goals for a given environ-
ment.
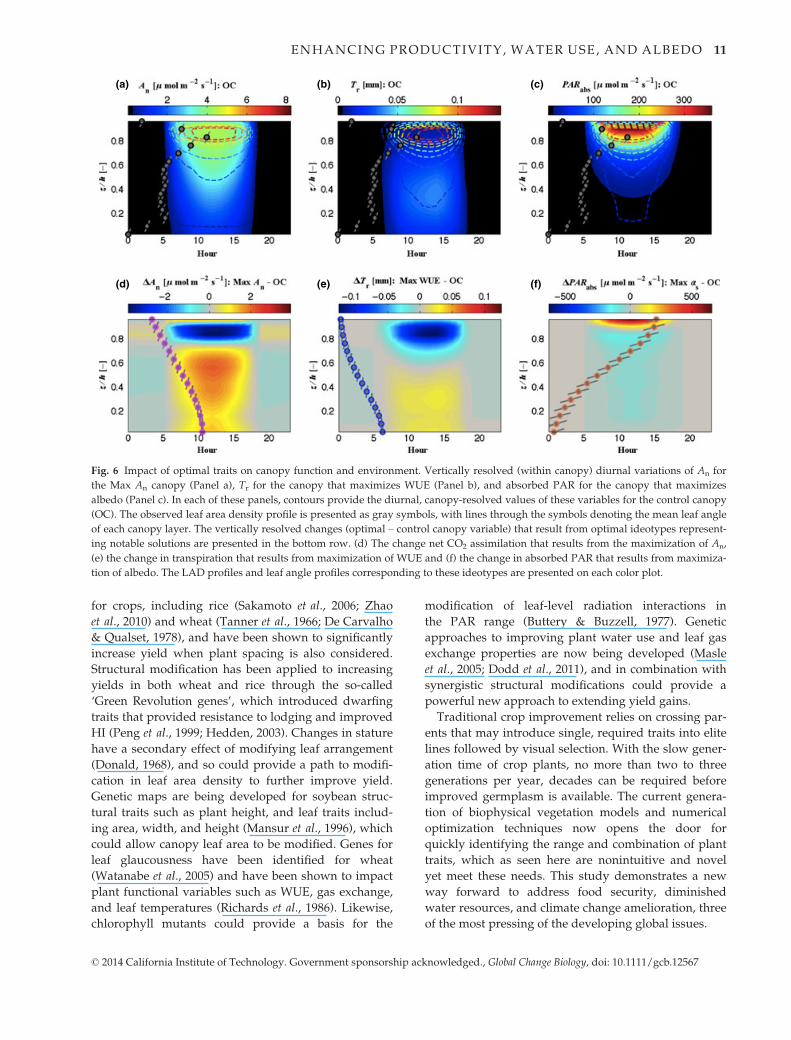
Optimal canopy profiles
The distributions of foliage and leaf angles for the
canopies that maximize An, WUE, and as demonstrate a
wide range of variability and significant differences
with the control canopy. In Fig. 6, the top panels
present the diurnal, canopy-resolved An for the Max An
canopy (Panel a), Tr for the canopy that maximizes
WUE (Panel b), and absorbed PAR for the canopy that
maximizes albedo (Panel c). In each of these panels,
contours provide the diurnal, canopy-resolved values
of these variables for the control canopy. The canopy
LAI profile overlaid on these plots shows the impact of
the dense canopy-top foliage on CO2 uptake, water
exchange, and PAR absorption for the control canopy.
The bottom panels show the difference between the
specific target solutions and the control canopy
diurnally through the canopy space, with the LAI pro-
files and mean leaf angles of each layer for the target
solution canopies overlaid.
Maximization of WUE requires a thinner canopy
[LAI = 3 (m2 m�2)] (Fig. 6b,e), with 78% of the canopy
foliage at less than half of the canopy height (z/
h < 0.5), where h is the height of the canopy top. By
transferring the majority of the leaf area down into a
more sheltered environment near the surface, lower
wind speeds, and higher humidity further reduce the
transpiration of a canopy with significantly less surface
−40 −30 −20 −10 0 10 20 30−20
−10
0
10
20
30
40
Cha
nge
in A
n [%
]
Change in Tr [%]
ΔWUE [%]
(a)
Green symbolsOrange symbolsBlue symbolsRed symbols
−> No change in T r
−> No change in A n−> Max WUE−> Max RUE
−40 −20 0 20 40−20
−10
0
10
20
30
40
Cha
nge
in A
n [%
]
Change in αs [%]
ΔRUE [%]
(b)0 10 20 30 40 50 60 0 10 20 30 40
550 ppm
550 ppm and +1oC
550 ppm and +2oC
550 ppm and +3oC
Climate change scenarios:
Fig. 4 Impact of rising temperature and atmospheric CO2 on simultaneous improvements in productivity, water use, and albedo. 2D
optimality fronts for the same objective pairs are as presented in Fig. 1. The dark gray regions depict the extension of the objective
spaces in which improvement in both goals are made simultaneously, relative to the region displayed in Fig. 1. The dashed boxes con-
tain the full extent of the axes in Fig. 1, along with the optimality fronts corresponding to the simultaneous variation in all traits under
current climate conditions, for reference. The optimality fronts derived from optimizations for four climate change scenarios are pre-
sented. The symbols depicting each optimality front show changes in WUE (Panel a) and RUE (Panel b) relative to the control simula-
tion for present temperature and [CO2]. The canopy structures corresponding to the ideotypes depicted in Fig. 1 were also simulated
for each climate change scenario and are plotted as large white- (Panel a) and black-filled (Panel b) symbols. The ideotypes derived
from optimization to current temperature and [CO2] fall very close to the climate change scenario optimality fronts examined here.
© 2014 California Institute of Technology. Government sponsorship acknowledged., Global Change Biology, doi: 10.1111/gcb.12567
ENHANCING PRODUCTIVITY, WATER USE, AND ALBEDO 9
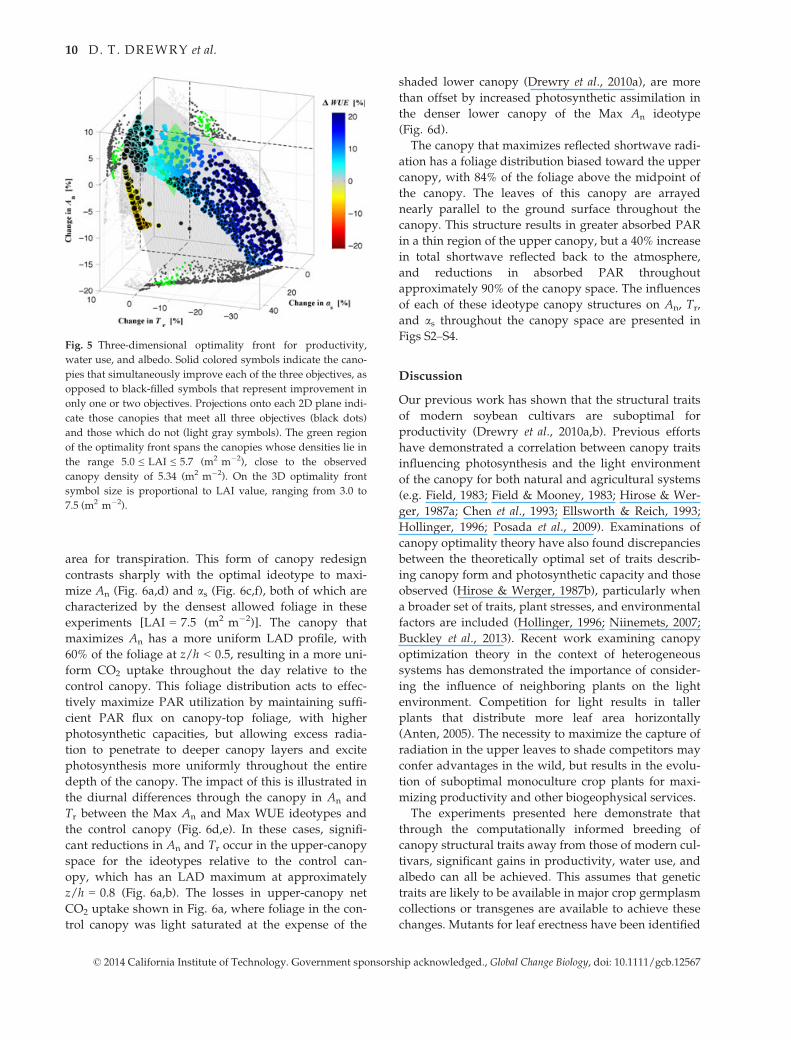
area for transpiration. This form of canopy redesign
contrasts sharply with the optimal ideotype to maxi-
mize An (Fig. 6a,d) and as (Fig. 6c,f), both of which are
characterized by the densest allowed foliage in these
experiments [LAI = 7.5 (m2 m�2)]. The canopy that
maximizes An has a more uniform LAD profile, with
60% of the foliage at z/h < 0.5, resulting in a more uni-
form CO2 uptake throughout the day relative to the
control canopy. This foliage distribution acts to effec-
tively maximize PAR utilization by maintaining suffi-
cient PAR flux on canopy-top foliage, with higher
photosynthetic capacities, but allowing excess radia-
tion to penetrate to deeper canopy layers and excite
photosynthesis more uniformly throughout the entire
depth of the canopy. The impact of this is illustrated in
the diurnal differences through the canopy in An and
Tr between the Max An and Max WUE ideotypes and
the control canopy (Fig. 6d,e). In these cases, signifi-
cant reductions in An and Tr occur in the upper-canopy
space for the ideotypes relative to the control can-
opy, which has an LAD maximum at approximately
z/h = 0.8 (Fig. 6a,b). The losses in upper-canopy net
CO2 uptake shown in Fig. 6a, where foliage in the con-
trol canopy was light saturated at the expense of the
shaded lower canopy (Drewry et al., 2010a), are more
than offset by increased photosynthetic assimilation in
the denser lower canopy of the Max An ideotype
(Fig. 6d).
The canopy that maximizes reflected shortwave radi-
ation has a foliage distribution biased toward the upper
canopy, with 84% of the foliage above the midpoint of
the canopy. The leaves of this canopy are arrayed
nearly parallel to the ground surface throughout the
canopy. This structure results in greater absorbed PAR
in a thin region of the upper canopy, but a 40% increase
in total shortwave reflected back to the atmosphere,
and reductions in absorbed PAR throughout
approximately 90% of the canopy space. The influences
of each of these ideotype canopy structures on An, Tr,
and as throughout the canopy space are presented in
Figs S2–S4.
Discussion
Our previous work has shown that the structural traits
of modern soybean cultivars are suboptimal for
productivity (Drewry et al., 2010a,b). Previous efforts
have demonstrated a correlation between canopy traits
influencing photosynthesis and the light environment
of the canopy for both natural and agricultural systems
(e.g. Field, 1983; Field & Mooney, 1983; Hirose & Wer-
ger, 1987a; Chen et al., 1993; Ellsworth & Reich, 1993;
Hollinger, 1996; Posada et al., 2009). Examinations of
canopy optimality theory have also found discrepancies
between the theoretically optimal set of traits describ-
ing canopy form and photosynthetic capacity and those
observed (Hirose & Werger, 1987b), particularly when
a broader set of traits, plant stresses, and environmental
factors are included (Hollinger, 1996; Niinemets, 2007;
Buckley et al., 2013). Recent work examining canopy
optimization theory in the context of heterogeneous
systems has demonstrated the importance of consider-
ing the influence of neighboring plants on the light
environment. Competition for light results in taller
plants that distribute more leaf area horizontally
(Anten, 2005). The necessity to maximize the capture of
radiation in the upper leaves to shade competitors may
confer advantages in the wild, but results in the evolu-
tion of suboptimal monoculture crop plants for maxi-
mizing productivity and other biogeophysical services.
The experiments presented here demonstrate that
through the computationally informed breeding of
canopy structural traits away from those of modern cul-
tivars, significant gains in productivity, water use, and
albedo can all be achieved. This assumes that genetic
traits are likely to be available in major crop germplasm
collections or transgenes are available to achieve these
changes. Mutants for leaf erectness have been identified
Fig. 5 Three-dimensional optimality front for productivity,
water use, and albedo. Solid colored symbols indicate the cano-
pies that simultaneously improve each of the three objectives, as
opposed to black-filled symbols that represent improvement in
only one or two objectives. Projections onto each 2D plane indi-
cate those canopies that meet all three objectives (black dots)
and those which do not (light gray symbols). The green region
of the optimality front spans the canopies whose densities lie in
the range 5.0 ≤ LAI ≤ 5.7 (m2 m�2), close to the observed
canopy density of 5.34 (m2 m�2). On the 3D optimality front
symbol size is proportional to LAI value, ranging from 3.0 to
7.5 (m2 m�2).
© 2014 California Institute of Technology. Government sponsorship acknowledged., Global Change Biology, doi: 10.1111/gcb.12567
10 D. T. DREWRY et al.
for crops, including rice (Sakamoto et al., 2006; Zhao
et al., 2010) and wheat (Tanner et al., 1966; De Carvalho
& Qualset, 1978), and have been shown to significantly
increase yield when plant spacing is also considered.
Structural modification has been applied to increasing
yields in both wheat and rice through the so-called
‘Green Revolution genes’, which introduced dwarfing
traits that provided resistance to lodging and improved
HI (Peng et al., 1999; Hedden, 2003). Changes in stature
have a secondary effect of modifying leaf arrangement
(Donald, 1968), and so could provide a path to modifi-
cation in leaf area density to further improve yield.
Genetic maps are being developed for soybean struc-
tural traits such as plant height, and leaf traits includ-
ing area, width, and height (Mansur et al., 1996), which
could allow canopy leaf area to be modified. Genes for
leaf glaucousness have been identified for wheat
(Watanabe et al., 2005) and have been shown to impact
plant functional variables such as WUE, gas exchange,
and leaf temperatures (Richards et al., 1986). Likewise,
chlorophyll mutants could provide a basis for the
modification of leaf-level radiation interactions in
the PAR range (Buttery & Buzzell, 1977). Genetic
approaches to improving plant water use and leaf gas
exchange properties are now being developed (Masle
et al., 2005; Dodd et al., 2011), and in combination with
synergistic structural modifications could provide a
powerful new approach to extending yield gains.
Traditional crop improvement relies on crossing par-
ents that may introduce single, required traits into elite
lines followed by visual selection. With the slow gener-
ation time of crop plants, no more than two to three
generations per year, decades can be required before
improved germplasm is available. The current genera-
tion of biophysical vegetation models and numerical
optimization techniques now opens the door for
quickly identifying the range and combination of plant
traits, which as seen here are nonintuitive and novel
yet meet these needs. This study demonstrates a new
way forward to address food security, diminished
water resources, and climate change amelioration, three
of the most pressing of the developing global issues.
(a) (b) (c)
(d) (e) (f)
Fig. 6 Impact of optimal traits on canopy function and environment. Vertically resolved (within canopy) diurnal variations of An for
the Max An canopy (Panel a), Tr for the canopy that maximizes WUE (Panel b), and absorbed PAR for the canopy that maximizes
albedo (Panel c). In each of these panels, contours provide the diurnal, canopy-resolved values of these variables for the control canopy
(OC). The observed leaf area density profile is presented as gray symbols, with lines through the symbols denoting the mean leaf angle
of each canopy layer. The vertically resolved changes (optimal – control canopy variable) that result from optimal ideotypes represent-
ing notable solutions are presented in the bottom row. (d) The change net CO2 assimilation that results from the maximization of An,
(e) the change in transpiration that results from maximization of WUE and (f) the change in absorbed PAR that results from maximiza-
tion of albedo. The LAD profiles and leaf angle profiles corresponding to these ideotypes are presented on each color plot.
© 2014 California Institute of Technology. Government sponsorship acknowledged., Global Change Biology, doi: 10.1111/gcb.12567
ENHANCING PRODUCTIVITY, WATER USE, AND ALBEDO 11

Acknowledgements
This study was initiated under NSF Grant ATM 06-28687 whenthe first author was at the University of Illinois. This support isgratefully acknowledged. DTD further acknowledges supportby the National Science Foundation International Research Fel-lowship Program (IRFP), award OISE-0900556. DTD alsoacknowledges support of the Jet Propulsion Laboratory, Califor-nia Institute of Technology, under a contract with the NationalAeronautics and Space Administration. SPL and PK acknowl-edge support from the Bill and Melinda Gates Foundation(OPP1060461) titled ‘RIPE – Realizing Increased PhotosyntheticEfficiency for Sustainable Increases in Crop Yield’. PK alsoacknowledges NSF awards CBET 12-09402 and EAR 13-31906,as well as support from the Civil and Environmental Engineer-ing Department, University of Illinois, to support research onWater Security and Emergent Risks.
References
Ainsworth EA, Long SP (2005) What have we learned from 15 years of free-air CO2
enrichment (FACE)? A meta-analytic review of the responses of photosynthesis,
canopy properties and plant production to rising CO2. New Phytologist, 165, 351–
372.
Ainsworth EA, Davey PA, Bernacchi CJ et al. (2002) A meta-analysis of elevated
[CO2] effects on soybean (glycine max) physiology, growth and yield. Global
Change Biology, 8, 695–709.
Anten NP (2005) Optimal photosynthetic characteristics of individual plants in vegeta-
tion stands and implications for species coexistence. Annals of Botany, 95, 495–506.
Austin R, Ford M, Edrich J, Hooper B (1976) Some effects of leaf posture on photosyn-
thesis and yield in wheat. Annals of Applied Biology, 83, 1975.
Ball J, Berry J (1982) The Ci/Cs ratio: a basis for predicting stomatal control of photo-
synthesis. Carnegie Institute of Washington Yearbook, 81, 88–92.
Beadle C, Long S (1985) Photosynthesis—is it limiting to biomass production? Bio-
mass, 8, 119–168.
Bernacchi CJ, Morgan PB, Ort DR, Long SP (2005) The growth of soybean under free
air [CO2] enrichment (FACE) stimulates photosynthesis while decreasing in vivo
Rubisco capacity. Planta, 220, 434–446.
Boedhram N, Arkebauer TJ, Batchelor WD (2001) Season-long characterization of ver-
tical distribution of leaf area in corn. Agronomy Journal, 93, 1235–1242.
Buckley TN, Cescatti A, Farquhar GD (2013) What does optimization theory actually
predict about crown profiles of photosynthetic capacity when models incorporate
greater realism? Plant, Cell & Environment, 36, 1547–1563.
Buttery B, Buzzell R (1977) The relationship between chlorophyll content and rate of
photosynthesis in soybeans. Canadian Journal of Plant Science, 57, 1–5.
Campbell G (1986) Extinction coefficients for radiation in plant canopies calculated
using an ellipsoidal inclination angle distribution. Agricultural and Forest Meteorol-
ogy, 36, 317–321.
Campbell GS, Norman JM (1998) An Introduction to Environmental Biophysics. Springer,
New York.
Cassman KG, Dobermann A, Walters DT, Yang H (2003) Meeting cereal demand
while protecting natural resources and improving environmental quality. Annual
Review of Environment and Resources, 28, 315–358.
Chen J-L, Reynolds JF, Harley PC, Tenhunen JD (1993) Coordination theory of leaf
nitrogen distribution in a canopy. Oecologia, 93, 63–69.
Condon AG, Richards RA, Rebetzke GJ, Farquhar GD (2004) Breeding for high water-
use efficiency. Journal of Experimental Botany, 55, 2447–2460.
De Carvalho FI, Qualset C (1978) Genetic variation for canopy architecture and its
use in wheat breeding. Crop Science, 18, 561–567.
Denison RF, Kiers ET, West SA (2003) Darwinian agriculture: when can humans find
solutions beyond the reach of natural selection? The Quarterly Review of Biology, 78,
145–168.
Dermody O, Long SP, DeLucia EH (2006) How does elevated CO2 or ozone affect the
leaf-area index of soybean when applied independently? New Phytologist, 169,
145–155.
Dodd IC, Whalley WR, Ober ES, Parry MAJ (2011) Genetic and management
approaches to boost UK wheat yields by ameliorating water deficits. Journal of
Experimental Botany, 62, 5241–5248.
Donald CM (1968) The breeding of crop ideotypes. Euphytica, 17, 385–403.
Doorenbos J, Kassam AH et al. (1979) Yield Response to Water. Food and Agriculture
Organization of the United Nations, Rome, Italy.
Drewry DT, Kumar P, Long S, Bernacchi C, Liang X-Z, Sivapalan M(2010a) Ecohydro-
logical responses of dense canopies to environmental variability: 1. Interplay
between vertical structure and photosynthetic pathway. Journal of Geophysical
Research, 115, G04022.
Drewry DT, Kumar P, Long S, Bernacchi C, Liang X-Z, Sivapalan M (2010b) Ecohy-
drological responses of dense canopies to environmental variability: 2. Role of
acclimation under elevated CO2. Journal of Geophysical Research, 115, G04023.
Duvick D, Cassman KG (1999) Post–green revolution trends in yield potential of tem-
perate maize in the North-Central United States. Crop Science, 39, 1622–1630.
Ellsworth D, Reich P (1993) Canopy structure and vertical patterns of photosynthesis
and related leaf traits in a deciduous forest. Oecologia, 96, 169–178.
Evans LT (1993) Crop Evolution, Adaptation and Yield. Cambridge University Press,
Cambridge, England.
FAOSTAT (2012) FAO Statistical Databases. Food and Agriculture Organization of the
United Nations, Rome, Italy. http://www.fao.org.
Farquhar GD, Sharkey TD (1982) Stomatal conductance and photosynthesis. Annual
Review of Plant Physiology, 33, 317–345.
Farquhar G, von Caemmerer S, von Berry J (1980) A biochemical model of photosyn-
thetic CO2 assimilation in leaves of C3 species. Planta, 149, 78–90.
Field C (1983) Allocating leaf nitrogen for the maximization of carbon gain: leaf age
as a control on the allocation program. Oecologia, 56, 341–347.
Field C, Mooney H (1983) Leaf age and seasonal effects on light, water, and nitrogen
use efficiency in a California shrub. Oecologia, 56, 348–355.
Foley JA, Ramankutty N, Brauman KA et al. (2011) Solutions for a cultivated planet.
Nature, 478, 337–342.
Godfray HCJ, Beddington JR, Crute IR et al. (2010) Food security: the challenge of
feeding 9 billion people. Science, 327, 812–818.
Hay R (1995) Harvest index: a review of its use in plant breeding and crop physiol-
ogy. Annals of Applied Biology, 126, 197–216.
Hedden P (2003) The genes of the Green Revolution. Trends in Genetics, 19, 5–9.
Hirose T, Werger MJ (1987a) Nitrogen use efficiency in instantaneous and daily pho-
tosynthesis of leaves in the canopy of a Solidago altissima stand. Physiologia Planta-
rum, 70, 215–222.
Hirose T, Werger M (1987b) Maximizing daily canopy photosynthesis with respect to
the leaf nitrogen allocation pattern in the canopy. Oecologia, 72, 520–526.
Hollinger D (1996) Optimality and nitrogen allocation in a tree canopy. Tree Physiol-
ogy, 16, 627–634.
Holmes M, Keiller D (2002) Effects of pubescence and waxes on the reflectance of
leaves in the ultraviolet and photosynthetic wavebands: a comparison of a range
of species. Plant, Cell & Environment, 25, 85–93.
Horton P (2000) Prospects for crop improvement through the genetic manipulation of
photosynthesis: morphological and biochemical aspects of light capture. Journal of
Experimental Botany, 51, 475–485.
Howell TA (2001) Enhancing water use efficiency in irrigated agriculture. Agronomy
Journal, 93, 281–289.
Johnson DA, Richards RA, Turner NC (1983) Yield, water relations, gas exchange,
and surface reflectances of near-isogenic wheat lines differing in glaucousness.
Crop Science, 23, 318–325.
Katul GG, Mahrt L, Poggi D, Sanz C (2004) One- and two-equation models for canopy
turbulence. Boundary-Layer Meteorology, 113, 81–109.
Le PVV, Kumar P, Drewry DT, Quijano JC (2012) A graphical user interface for
numerical modeling of acclimation responses of vegetation to climate change.
Computers & Geosciences, 49, 91–101.
Lenton TM, Vaughan NE (2009) The radiative forcing potential of different climate
geoengineering options. Atmospheric Chemistry and Physics, 9, 5539–5561.
Long SP, Ort DR (2010) More than taking the heat: crops and global change. Current
Opinion in Plant Biology, 13, 240–247.
Long SP, Naidu S, Ort D (2006a) Can improvement in photosynthesis increase crop
yields? Plant Cell and Environment, 29, 315–330.
Long SP, Ainsworth EA, Leakey ADB, N€osberger J, Ort DR (2006b) Food for thought:
lower-than-expected crop yield stimulation with rising CO2 concentrations. Sci-
ence, 312, 1918–1921.
Loomis R (1993) Optimization theory and crop improvement. International Crop Sci-
ence, I, 583–588.
Mansur L, Orf J, Chase K, Jarvik T, Cregan P, Lark K (1996) Genetic mapping of agro-
nomic traits using recombinant inbred lines of soybean. Crop Science, 36,
1327–1336.
Masle J, Gilmore SR, Farquhar GD (2005) The ERECTA gene regulates plant transpi-
ration efficiency in Arabidopsis. Nature, 436, 866–870.
© 2014 California Institute of Technology. Government sponsorship acknowledged., Global Change Biology, doi: 10.1111/gcb.12567
12 D. T. DREWRY et al.
Monfreda C, Ramankutty N, Foley JA (2008) Farming the planet: 2. Geographic distri-
bution of crop areas, yields, physiological types, and net primary production in
the year 2000. Global Biogeochemical Cycles, 22, 1–19.
Murchie E, Pinto M, Horton P (2009) Agriculture and the new challenges for photo-
synthesis research. New Phytologist, 181, 532–552.
Niinemets U (2007) Photosynthesis and resource distribution through plant canopies.
Plant, Cell & Environment, 30, 1052–1071.
Nikolov N (1995) Coupling biochemical and biophysical processes at the leaf level: an
equilibrium photosynthesis model for leaves of C3 plants. Ecological Modelling, 80,
205–235.
Nikolov N, Zeller KF (2003) Modeling coupled interactions of carbon, water, and
ozone exchange between terrestrial ecosystems and the atmosphere. I: Model
description. Environmental Pollution, 124, 231–246.
Ort DR, Ainsworth EA, Aldea M et al. (2006) SoyFACE: the effects and interactions of
elevated CO2 and O3 on soybean. In: Managed Ecosystems and CO2, Vol. 187 (eds
N€osberger J, Long SP, Norby RJ, Stitt M, Hendrey GR, Blum H, Caldwell MM,
Heldmaier G, Jackson RB, Lange OL, Mooney HA, Schulze E-D, Sommer U), pp.
71–86. Springer, Berlin Heidelberg.
Peng J, Richards DE, Hartley NM et al. (1999) “Green revolution”genes encode
mutant gibberellin response modulators. Nature, 400, 256–261.
Poggi D, Porporato A, Ridolfi L, Albertson JD, Katul GG (2004) The effect of vegetation
density on canopy sub-layer turbulence. Boundary-Layer Meteorology, 111, 565–587.
Posada JM, Lechowicz MJ, Kitajima K (2009) Optimal photosynthetic use of light by
tropical tree crowns achieved by adjustment of individual leaf angles and nitrogen
content. Annals of Botany, 103, 795–805.
Ramankutty N, Evan AT, Monfreda C, Foley JA (2008) Farming the planet: 1. Geo-
graphic distribution of global agricultural lands in the year 2000. Global Biogeo-
chemical Cycles, 22, GB1003.
Ray DK, Ramankutty N, Mueller ND, West PC, Foley JA (2012) Recent patterns of
crop yield growth and stagnation. Nature Communications, 3, 1293.
Richards R, Rawson H, Johnson D (1986) Glaucousness in wheat: its development
and effect on water-use efficiency, gas exchange and photosynthetic tissue temper-
atures. Functional Plant Biology, 13, 465–473.
Ridgwell A, Singarayer JS, Hetherington AM, Valdes PJ (2009) Tackling regional
climate change by leaf albedo bio-geoengineering. Current Biology, 19, 146–150.
Sakamoto T, Morinaka Y, Ohnishi T et al. (2006) Erect leaves caused by brassinoster-
oid deficiency increase biomass production and grain yield in rice. Nature Biotech-
nology, 24, 105–109.
Singarayer JS, Ridgwell A, Irvine P (2009) Assessing the benefits of crop albedo bio-
geoengineering. Environmental Research Letters, 4, 045110.
Strzepek K, Boehlert B (2010) Competition for water for the food system. Philosophical
Transactions of the Royal Society B: Biological Sciences, 365, 2927–2940.
Tanner J, Gardener C, Stoskopf N, Reinbergs K (1966) Some observations on upright-
leaf-type small grains. Canadian Journal of Plant Science, 46, 690–690.
United Nations (2011) The Great Green Technological Transformation. United Nations,
New York.
Vrugt JA, Robinson BA (2007) Improved evolutionary optimization from genetically
adaptive multimethod search. Proceedings of the National Academy of Sciences, 104,
708–711.
Vrugt JA, Gupta HV, Bastidas LA, Bouten W, Sorooshian S (2003) Effective and effi-
cient algorithm for multiobjective optimization of hydrologic models. Water
Resources Research, 39, 1214.
Wallace JS (2000) Increasing agricultural water use efficiency to meet future food pro-
duction. Agriculture, Ecosystems & Environment, 82, 105–119.
Watanabe N, Takesada N, Shibata Y, Ban T (2005) Genetic mapping of the genes for
glaucous leaf and tough rachis in Aegilops tauschii, the D-genome progenitor of
wheat. Euphytica, 144, 119–123.
Woodward FI, Bardgett RD, Raven JA, Hetherington AM (2009) Biological
approaches to global environment change mitigation and remediation. Current
Biology, 19, R615–R623.
Zhao S-Q, Hu J, Guo L-B, Qian Q, Xue H-W (2010) Rice leaf inclination2, a VIN3-like
protein, regulates leaf angle through modulating cell division of the collar. Cell
Research, 20, 935–947.
Zhu X-G, Long SP, Ort DR (2010) Improving photosynthetic efficiency for greater
yield. Annual Review of Plant Biology, 61, 235–261.
Supporting Information
Additional Supporting Information may be found in theonline version of this article:
Figure S1 Environmental forcing variables at top of canopyused to conduct simulations.Figure S2 Impact of specific target goals on canopy struc-tures and net canopy CO2 uptake (An).Figure S3 Impact of specific target goals on canopy struc-tures and canopy transpiration (Tr).Figure S4 Impact of specific target goals on canopy struc-tures and absorbed canopy photosynthetically active radia-tion flux (PARabs).
© 2014 California Institute of Technology. Government sponsorship acknowledged., Global Change Biology, doi: 10.1111/gcb.12567
ENHANCING PRODUCTIVITY, WATER USE, AND ALBEDO 13
1
Supporting Information Document
Title: Simultaneous improvement in productivity, water use and albedo through
crop structural modification
Authors: Darren T. Drewry1,2, Praveen Kumar3,4, Stephen P. Long5,6
Affiliations:
1Climate Physics Group, Jet Propulsion Laboratory, California Institute of Technology,
m/s 233-300, Pasadena, California, USA 91109-8099
2Joint Institute for Regional Earth System Science & Engineering, University of
California Los Angeles, 607 Charles E Young Drive East Young Hall, Room 4242, Los
Angeles, California, USA 90095-7228
3Department of Civil and Environmental Engineering, University of Illinois, 2527B
Hydrosystems Laboratory, 301 N. Mathews Ave., Urbana, Illinois, USA 61801-2352
4Department of Atmospheric Sciences, University of Illinois, 150 South Gregory Street,
Urbana, Illinois, USA 61801-3070
5Department of Crop Sciences, University of Illinois, AW-101 Turner Hall, 1102 South
Goodwin Avenue, Urbana, Illinois, USA 61801
6Department of Plant Biology, University of Illinois, 265 Morrill Hall, 505 South
Goodwin Avenue, Urbana, Illinois, USA 61801

2
Corresponding Authors: Darren T. Drewry (Phone: 818-393-2992; Email:
[email protected]); Praveen Kumar (Phone: 217-333-4688; Email:
3
Supporting Information
Results are presented as percent changes from the solution (An, Tr, or αs) produced by
simulation with the “control canopy”. The control canopy is defined by the MLCan
model description elaborated in detail in Drewry et al (2010b) and the supplementary
material for that paper, including the parameter specifications provided in that paper.
Supporting Figures:
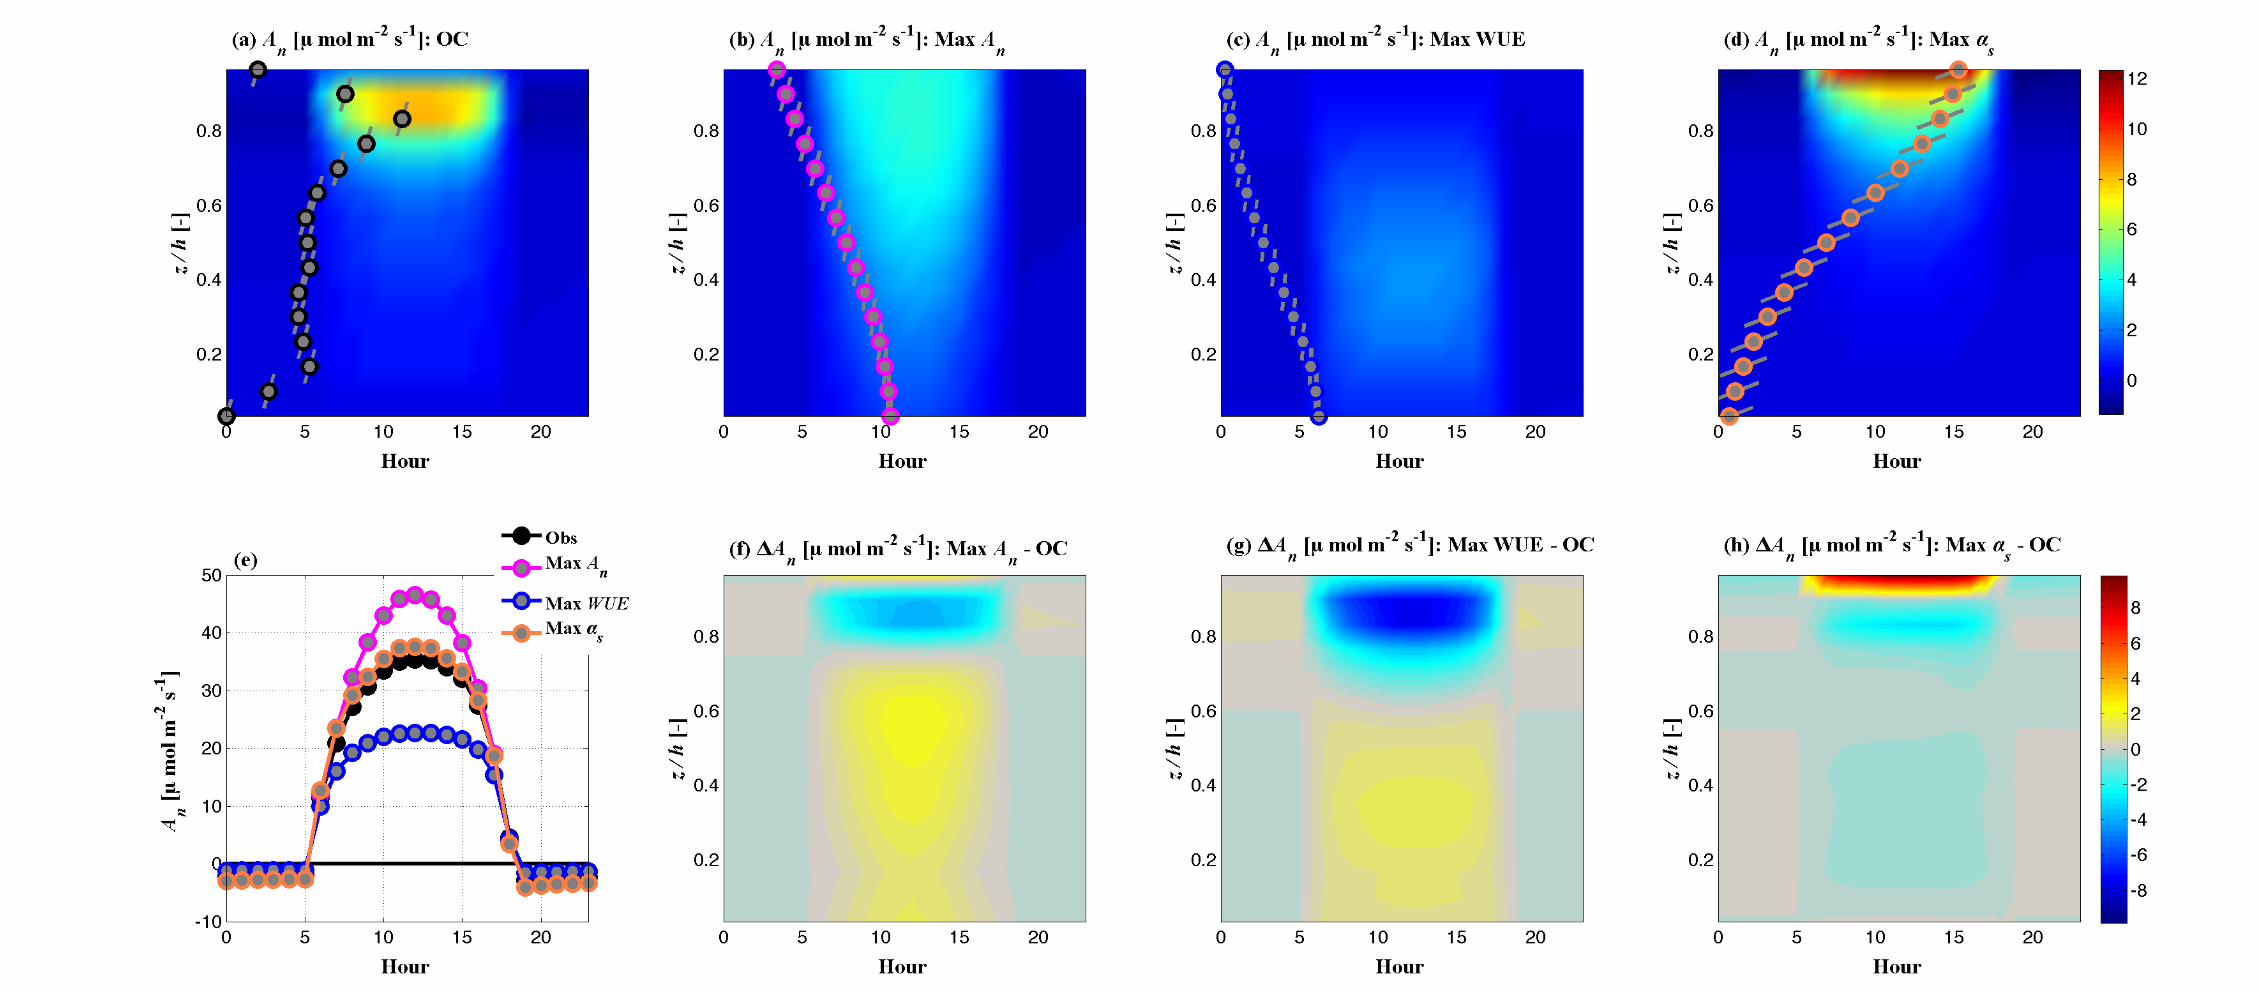
The impact on canopy CO2 uptake (An) of the canopy structures corresponding to the
maximization of An, WUE and αs are presented in Figure S2. The diurnal within-canopy
variation of An for the control canopy is presented in Figure S2 (a), with the LAD and leaf
angle profiles of the control canopy super-imposed to demonstrate the impact of the
foliage distribution on CO2 uptake. The contrasting diurnal variations in An induced by
the ideotypes corresponding to the maximization of An, WUE and αs are presented in
Figure S2 (b-d). The plots show how shifting leaf area to lower canopy levels (Max An),
reducing the overall density of foliage (Max WUE) or shifting foliage to higher canopy
levels (Max αs) results in strong variations of the magnitude and location of canopy CO2
fixation. The differences (Ideotype – Control) in An through the canopy over the course of
the day (Figure S2 f-h) highlight these differences, with the canopy-integrated An series
(Figure S2 e) showing the differences in net uptake over the course of the day. Figures S3
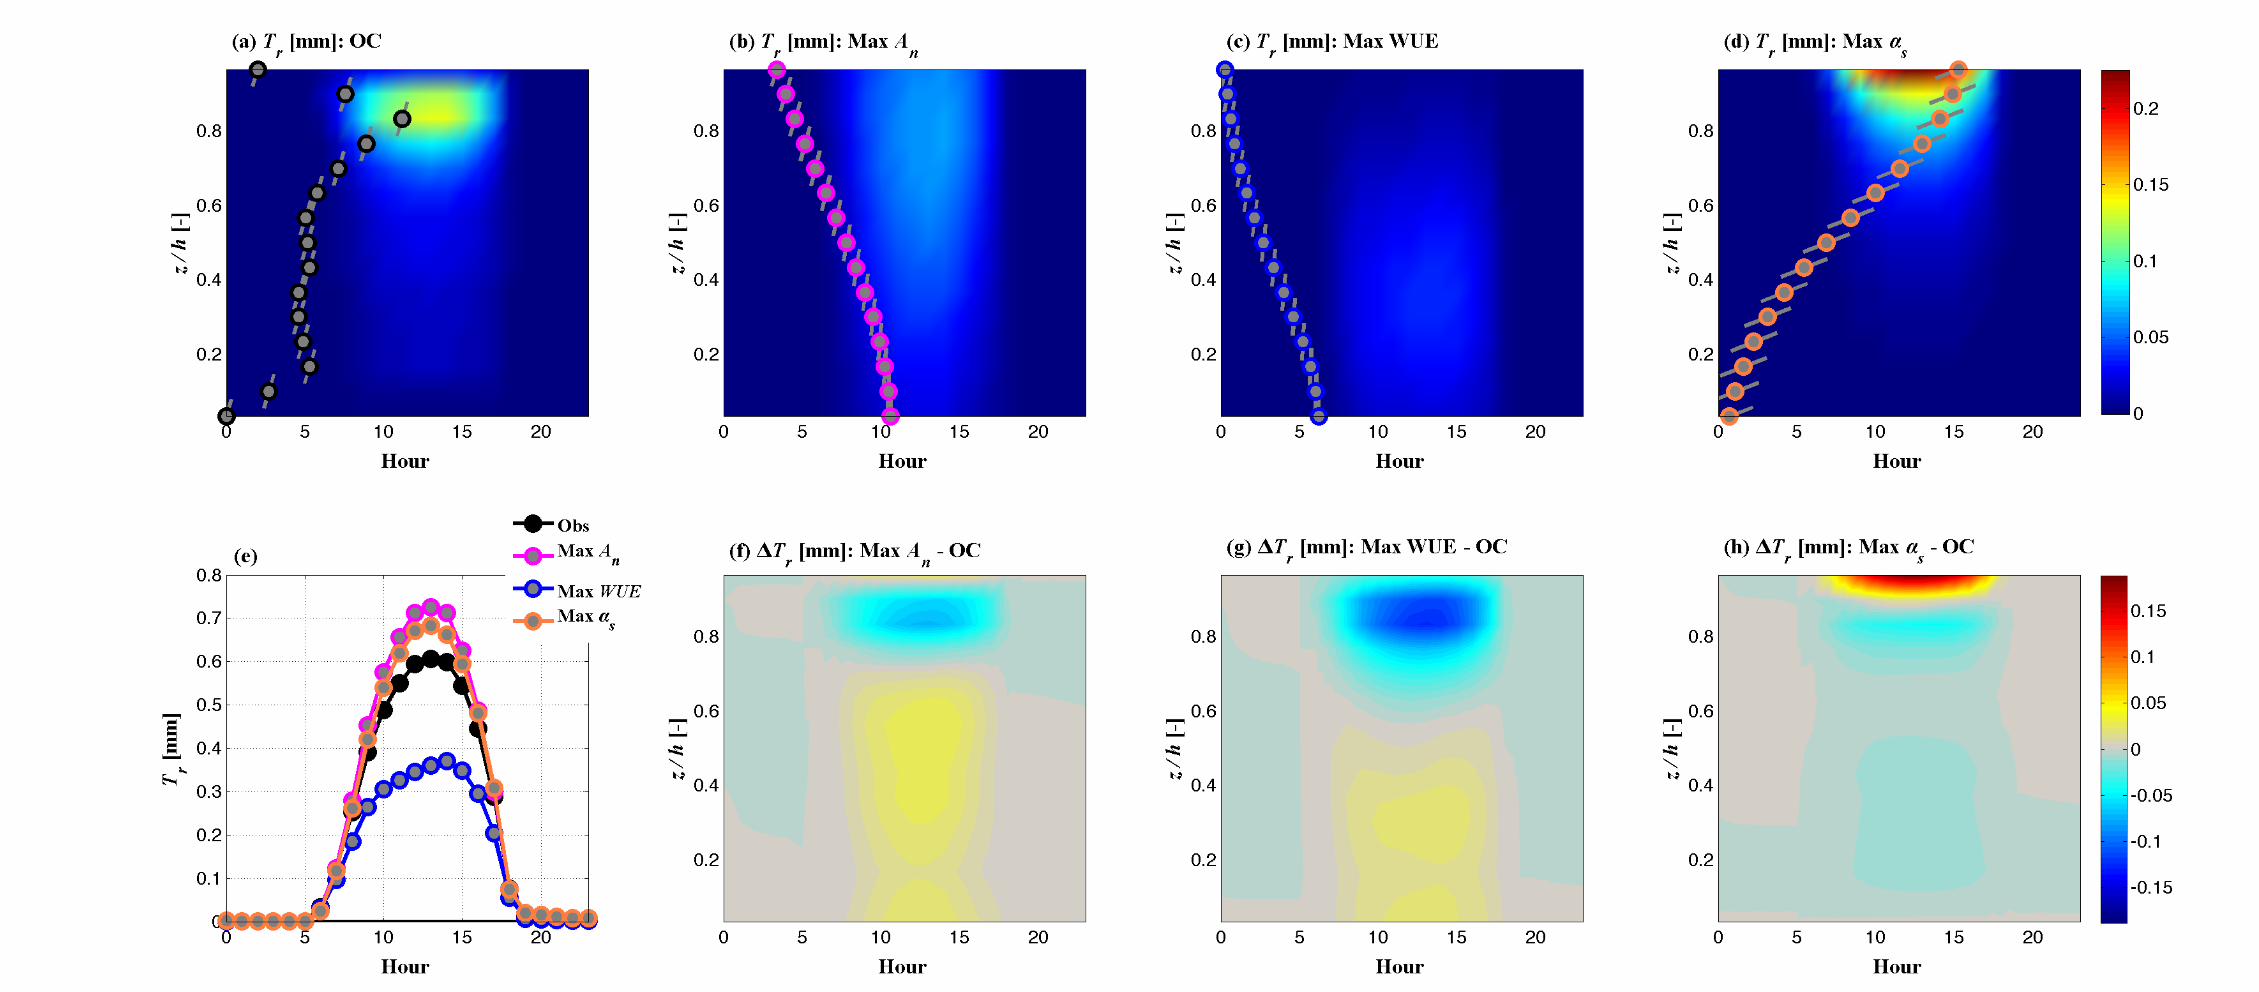
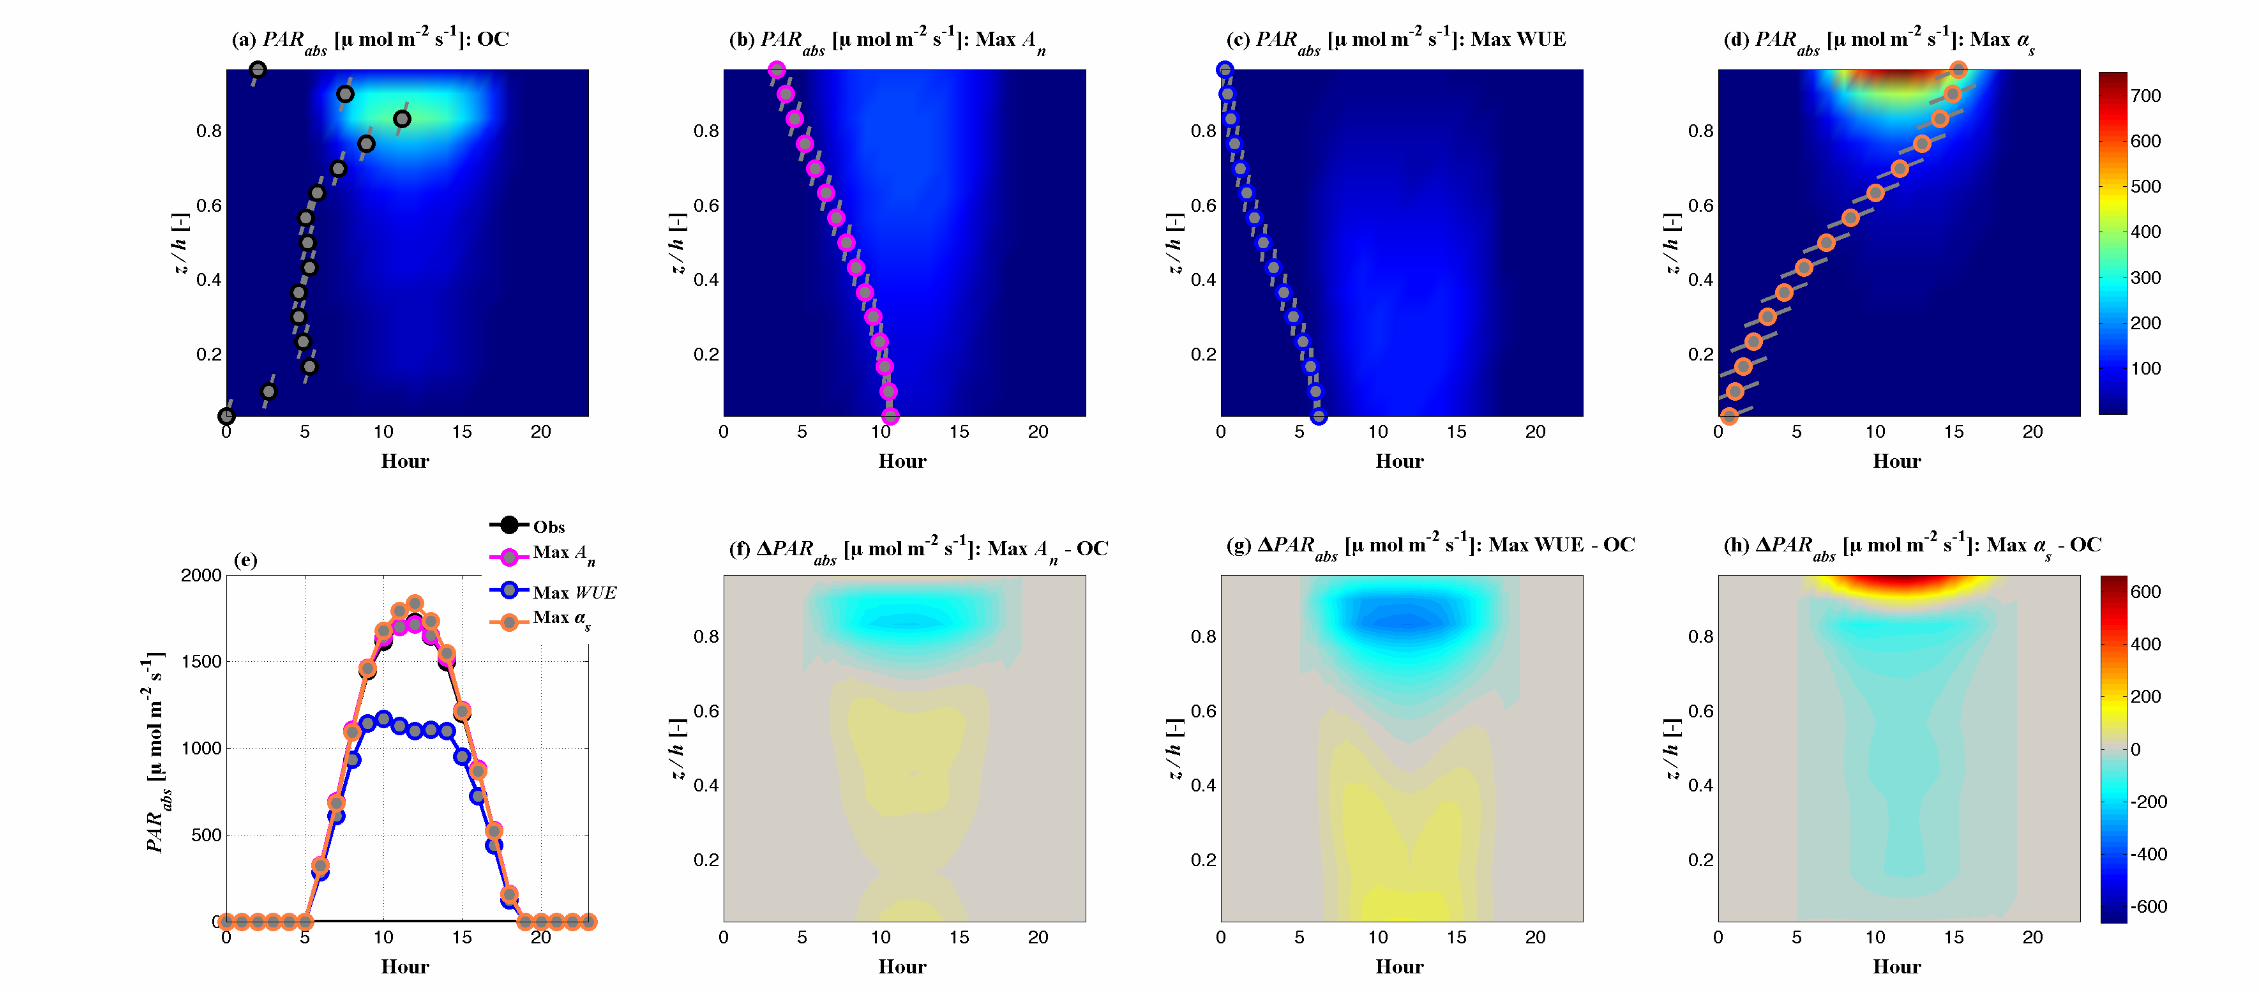
and S4 provide similar demonstrations of the role of canopy structure and leaf angle the
vertical patterns and magnitudes of canopy water use (Figure S3) and photosynthetically
active radiation absorption (Figure S4), the key driving factor in vegetation
photosynthesis.
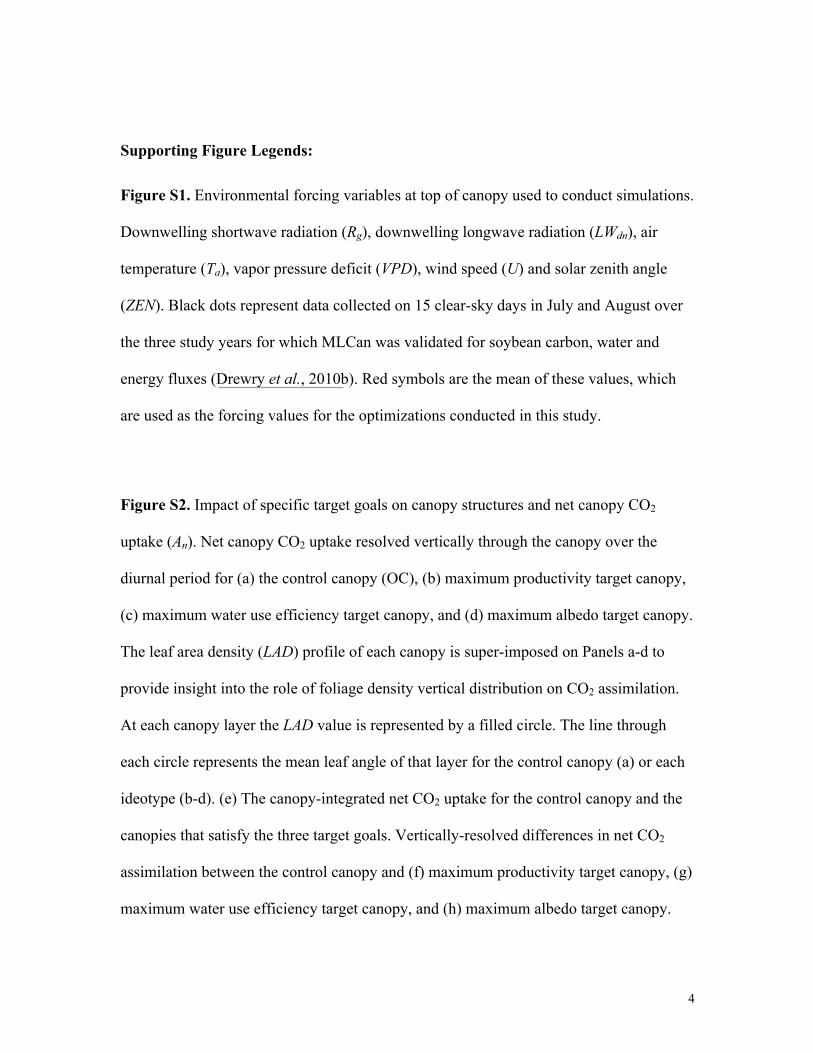
4
Supporting Figure Legends:
Figure S1. Environmental forcing variables at top of canopy used to conduct simulations.
Downwelling shortwave radiation (Rg), downwelling longwave radiation (LWdn), air
temperature (Ta), vapor pressure deficit (VPD), wind speed (U) and solar zenith angle
(ZEN). Black dots represent data collected on 15 clear-sky days in July and August over
the three study years for which MLCan was validated for soybean carbon, water and
energy fluxes (Drewry et al., 2010b). Red symbols are the mean of these values, which
are used as the forcing values for the optimizations conducted in this study.
Figure S2. Impact of specific target goals on canopy structures and net canopy CO2
uptake (An). Net canopy CO2 uptake resolved vertically through the canopy over the
diurnal period for (a) the control canopy (OC), (b) maximum productivity target canopy,
(c) maximum water use efficiency target canopy, and (d) maximum albedo target canopy.
The leaf area density (LAD) profile of each canopy is super-imposed on Panels a-d to
provide insight into the role of foliage density vertical distribution on CO2 assimilation.
At each canopy layer the LAD value is represented by a filled circle. The line through
each circle represents the mean leaf angle of that layer for the control canopy (a) or each
ideotype (b-d). (e) The canopy-integrated net CO2 uptake for the control canopy and the
canopies that satisfy the three target goals. Vertically-resolved differences in net CO2
assimilation between the control canopy and (f) maximum productivity target canopy, (g)
maximum water use efficiency target canopy, and (h) maximum albedo target canopy.
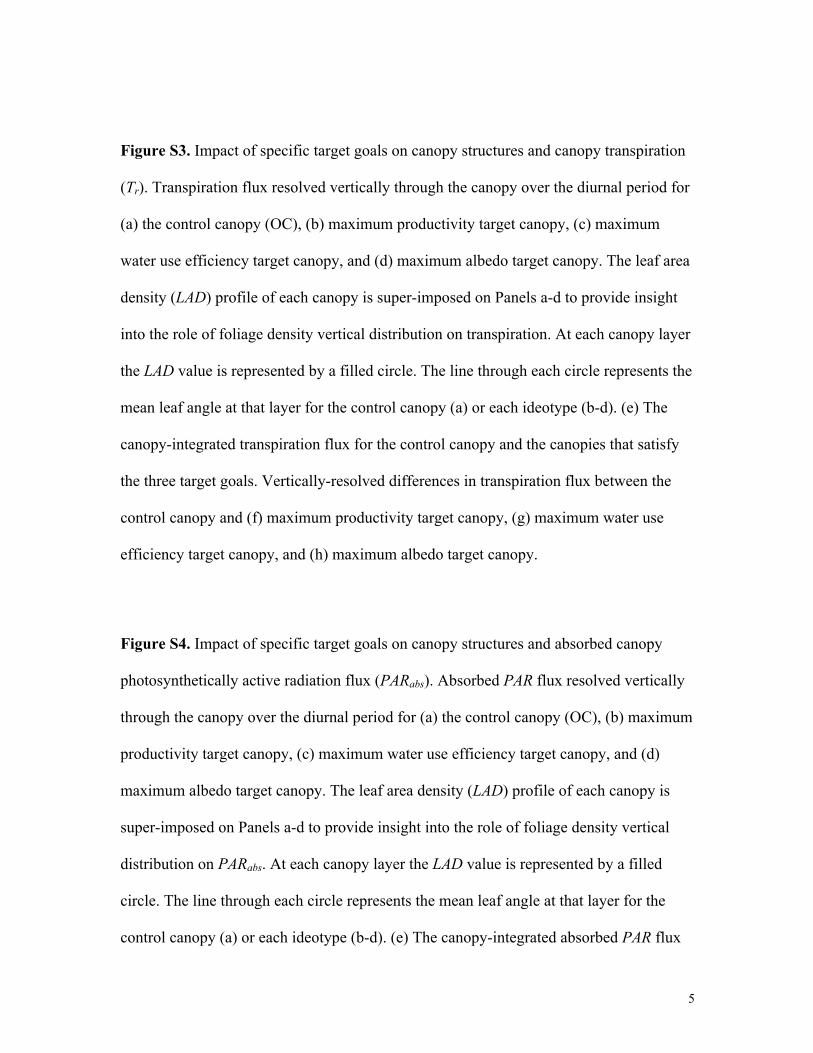
5
Figure S3. Impact of specific target goals on canopy structures and canopy transpiration
(Tr). Transpiration flux resolved vertically through the canopy over the diurnal period for
(a) the control canopy (OC), (b) maximum productivity target canopy, (c) maximum
water use efficiency target canopy, and (d) maximum albedo target canopy. The leaf area
density (LAD) profile of each canopy is super-imposed on Panels a-d to provide insight
into the role of foliage density vertical distribution on transpiration. At each canopy layer
the LAD value is represented by a filled circle. The line through each circle represents the
mean leaf angle at that layer for the control canopy (a) or each ideotype (b-d). (e) The
canopy-integrated transpiration flux for the control canopy and the canopies that satisfy
the three target goals. Vertically-resolved differences in transpiration flux between the
control canopy and (f) maximum productivity target canopy, (g) maximum water use
efficiency target canopy, and (h) maximum albedo target canopy.
Figure S4. Impact of specific target goals on canopy structures and absorbed canopy
photosynthetically active radiation flux (PARabs). Absorbed PAR flux resolved vertically
through the canopy over the diurnal period for (a) the control canopy (OC), (b) maximum
productivity target canopy, (c) maximum water use efficiency target canopy, and (d)
maximum albedo target canopy. The leaf area density (LAD) profile of each canopy is
super-imposed on Panels a-d to provide insight into the role of foliage density vertical
distribution on PARabs. At each canopy layer the LAD value is represented by a filled
circle. The line through each circle represents the mean leaf angle at that layer for the
control canopy (a) or each ideotype (b-d). (e) The canopy-integrated absorbed PAR flux

6
for the control canopy and the canopies that satisfy the three target goals. Vertically-
resolved differences in absorbed PAR flux between the control canopy and (f) maximum
productivity target canopy, (g) maximum water use efficiency target canopy, and (h)
maximum albedo target canopy.
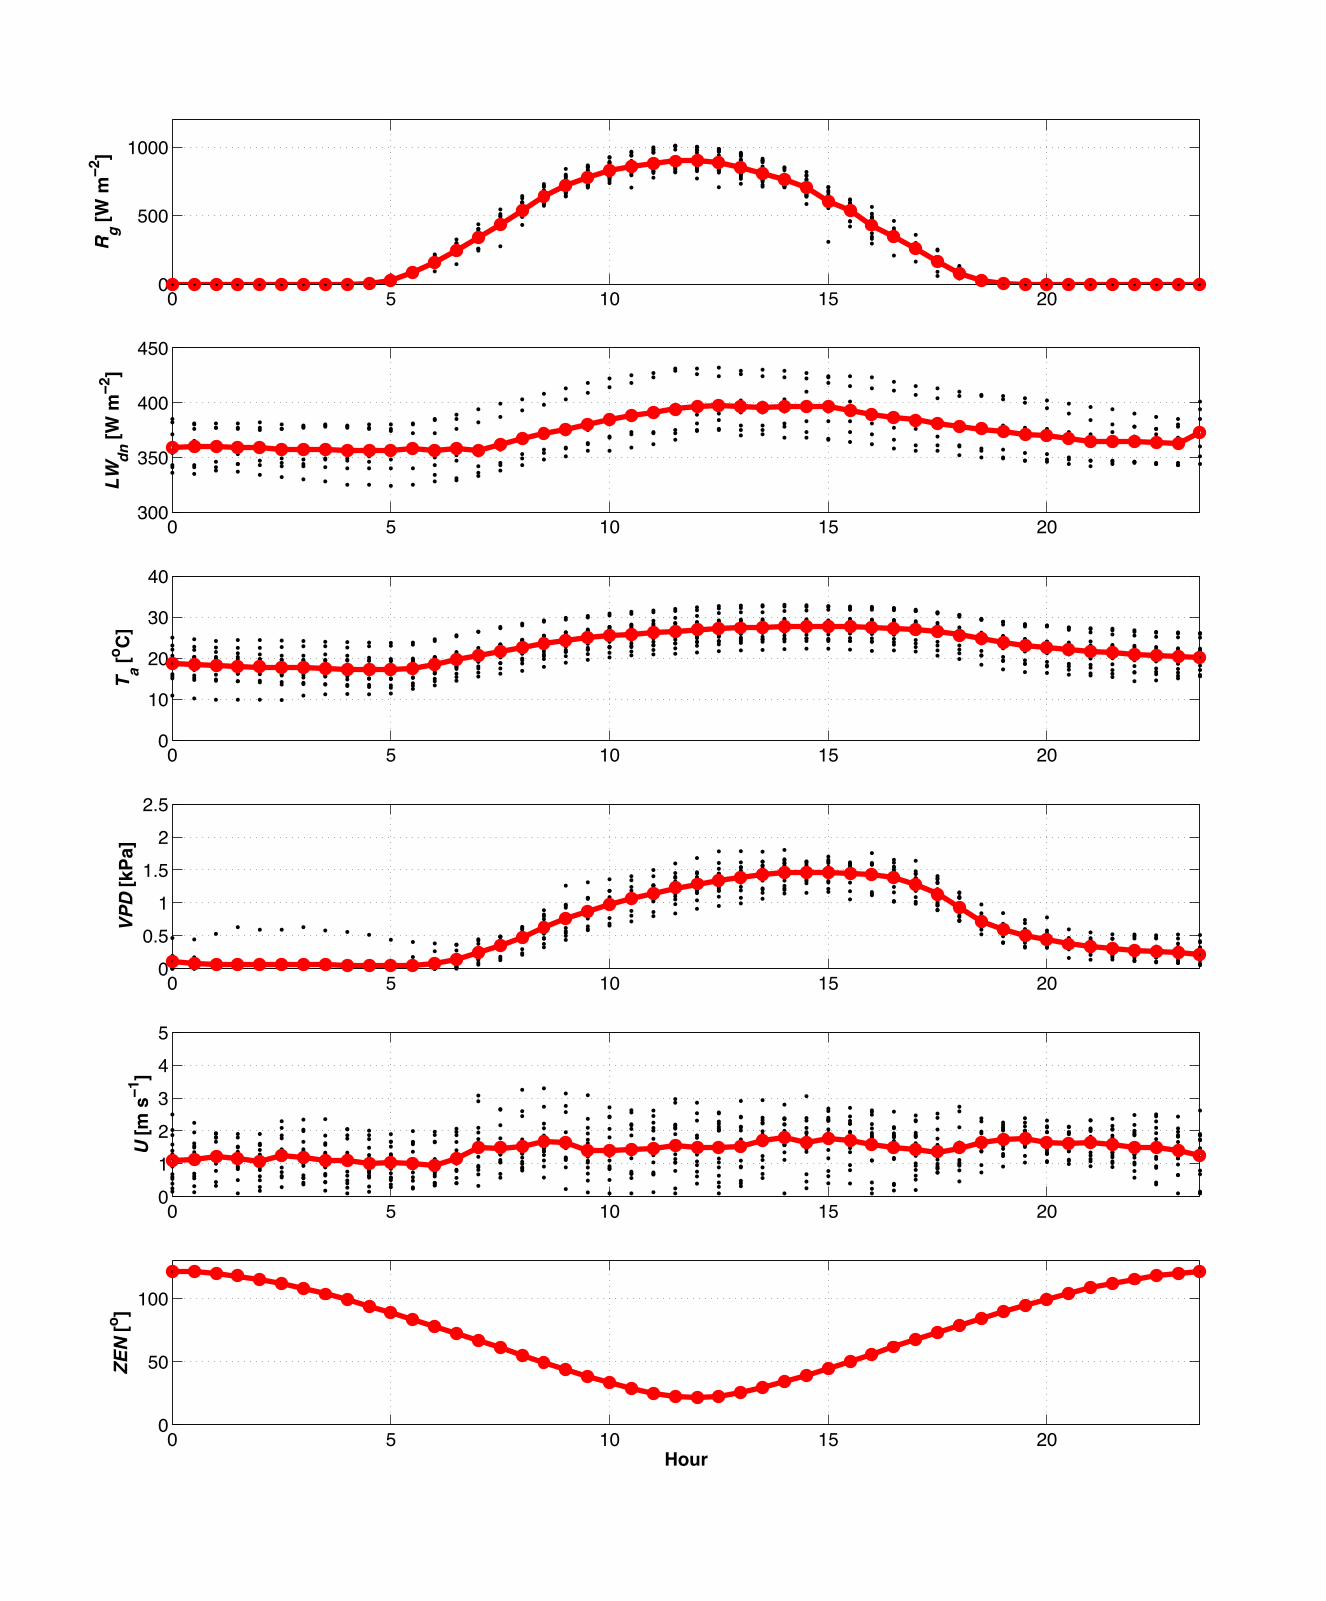
0 5 10 15 200
500
1000
Rg [W
m−2
]
0 5 10 15 20300
350
400
450
LWdn
[W m
−2]
0 5 10 15 200
10
20
30
40
T a [o C]
0 5 10 15 200
0.5
1
1.5
2
2.5
VPD
[kPa
]
0 5 10 15 200
1
2
3
4
5
U [m
s−1
]
0 5 10 15 200
50
100
ZEN
[o ]
Hour