Evaluating a Functional Size Measurement Method for Web Applications: An Empirical Analysis
12
Evaluating a Functional Size Measurement Method for Web Applications: An Empirical Analysis 1 Silvia Abrahão 1 , Geert Poels 2 and Oscar Pastor 1 1 Department of Information Systems and Computation Valencia University of Technology Camino de Vera, s/n, 46022, Valencia, Spain sabrahao, [email protected] 2 Faculty of Economics and Business Administration Ghent University Hoveniersberg 24, 9000 Ghent, Belgium geert.poels@ UGent.be 1 This work is partially supported by the CICYT project with reference TIC 2001-3530-C02-01, Spain. Abstract This paper describes a laboratory experiment which evaluates OO-Method Function Points for the Web. OOmFPWeb measures the functional size of Web applications using conceptual models that are developed with Object-Oriented Web Solutions (OOWS), an automated software production method for Web applications. OOmFPWeb is evaluated on a range of performance-based and perception-based variables, including efficiency, reproducibility, perceived ease of use, perceived usefulness and intention to use. The results show that OOmFPWeb is efficient when compared to current industry practices. Furthermore, the method produces consistent functional size assessments and is perceived to be easy to use and useful by its users. Keywords: Functional Size Measurement, Web Applications, Conceptual Modeling, Validation, Method Evaluation, Empirical Software Engineering. 1. Introduction Web projects differ from traditional software projects in two key dimensions: the rate of releases is higher; and the extent of what is deployed in each release is smaller [1]. The traditional balance between the project tradeoffs of time, cost, and quality is therefore changing. The nature of Web development forces project managers to focus primarily on the time variable, in order to achieve the required short cycle times. Because of this imbalance, several problems with Web projects have been observed, such as exceeding budgets and unknown or bad product quality [2]. To avoid a “Web crisis” development, approaches are needed that provide high-quality Web applications on time and within budget. Over the last few years, several development methods have been proposed that specifically aim at Web application development such as OOHDM [3], WebML [4], W2000 [5] and OOWS [6] [7]. Of these proposals, those that start with a user-defined problem space representation (i.e., a conceptual model) of the Web application seem to be the most promising. Adopting such a method, however, poses new management problems, in particular with respect to resource estimation and project planning. A fundamental problem in this context is the size measurement of the future Web application based on its conceptual model. The functional size measurement (FSM) methods used in industry (mainly Function Point Analysis (FPA) [8]) date from a pre-Web era. None of the ISO-standardized FSM methods (i.e. FPA, COSMIC-Full Function Points [9], Mark II Function Points [10]) were designed taking the particular features of Web applications into account. Hence, existing FSM methods need to be adapted or extended to cope with Web application development projects. Some approaches have been proposed in the literature to address this issue [1], [11], [12]. The main limitation of these approaches is that they apply measurement to the final software product (i.e., the implemented Web application), and hence depend on the implementation technology used. Furthermore, for project resource estimation purposes measurements of this type come too late. What is needed is a timely and implementation- independent FSM method that is based on the user- defined requirements captured in the conceptual model of the Web application.
Transcript of Evaluating a Functional Size Measurement Method for Web Applications: An Empirical Analysis
Evaluating a Functional Size Measurement Method for Web Applications: An Empirical Analysis1
Silvia Abrahão1, Geert Poels2 and Oscar Pastor1
1Department of Information Systems and
Computation Valencia University of Technology
Camino de Vera, s/n, 46022, Valencia, Spain sabrahao, [email protected]
2Faculty of Economics and Business Administration Ghent University
Hoveniersberg 24, 9000 Ghent, Belgium geert.poels@ UGent.be
1 This work is partially supported by the CICYT project with reference TIC 2001-3530-C02-01, Spain.
Abstract This paper describes a laboratory experiment which
evaluates OO-Method Function Points for the Web. OOmFPWeb measures the functional size of Web applications using conceptual models that are developed with Object-Oriented Web Solutions (OOWS), an automated software production method for Web applications. OOmFPWeb is evaluated on a range of performance-based and perception-based variables, including efficiency, reproducibility, perceived ease of use, perceived usefulness and intention to use. The results show that OOmFPWeb is efficient when compared to current industry practices. Furthermore, the method produces consistent functional size assessments and is perceived to be easy to use and useful by its users.
Keywords: Functional Size Measurement, Web
Applications, Conceptual Modeling, Validation, Method Evaluation, Empirical Software Engineering.
1. Introduction Web projects differ from traditional software projects
in two key dimensions: the rate of releases is higher; and the extent of what is deployed in each release is smaller [1]. The traditional balance between the project tradeoffs of time, cost, and quality is therefore changing. The nature of Web development forces project managers to focus primarily on the time variable, in order to achieve the required short cycle times. Because of this imbalance, several problems with Web projects have been observed, such as exceeding budgets and unknown or bad product quality [2]. To avoid a “Web crisis” development,
approaches are needed that provide high-quality Web applications on time and within budget.
Over the last few years, several development methods have been proposed that specifically aim at Web application development such as OOHDM [3], WebML [4], W2000 [5] and OOWS [6] [7]. Of these proposals, those that start with a user-defined problem space representation (i.e., a conceptual model) of the Web application seem to be the most promising. Adopting such a method, however, poses new management problems, in particular with respect to resource estimation and project planning.
A fundamental problem in this context is the size measurement of the future Web application based on its conceptual model. The functional size measurement (FSM) methods used in industry (mainly Function Point Analysis (FPA) [8]) date from a pre-Web era. None of the ISO-standardized FSM methods (i.e. FPA, COSMIC-Full Function Points [9], Mark II Function Points [10]) were designed taking the particular features of Web applications into account. Hence, existing FSM methods need to be adapted or extended to cope with Web application development projects.
Some approaches have been proposed in the literature to address this issue [1], [11], [12]. The main limitation of these approaches is that they apply measurement to the final software product (i.e., the implemented Web application), and hence depend on the implementation technology used. Furthermore, for project resource estimation purposes measurements of this type come too late. What is needed is a timely and implementation-independent FSM method that is based on the user-defined requirements captured in the conceptual model of the Web application.
In a previous work [13], we developed such a FSM method for Web applications, called OO-Method Function Points for the Web (OOmFPWeb). This method has been proposed to overcome the difficulties mentioned above. OOmFPWeb is intended to be used with OOWS (Object-Oriented Web Solutions) [6] [7], an automated and model-driven production method for Web applications. OOmFPWeb was designed to conform to the IFPUG (International Function Point Users Group) counting rules for FPA [8]. It redefines these rules in terms of the concepts used in OOWS, in order to enable and facilitate the application of this widely accepted and ISO-standardized FSM method.
This paper reports on a laboratory experiment that investigated whether OOmFPWeb would achieve its objectives. The evaluation was conducted according to a new theoretical model for evaluating FSM methods, which is based on Rescher’s theory of pragmatic justification [14] and Davis’ Technology Acceptance Model [15]. The model incorporates both performance-based and perception-based variables of a method’s efficacy. Furthermore, it allows making predictions of the likely adoption in practice of a FSM method.
This paper is organized as follows. Section 2 gives an overview of related work in size measurement for Web sites and applications. Section 3 presents OOWS and OOmFPWeb. Section 4 presents the theoretical model that was developed to evaluate FSM methods. This is followed by a description of the experiment in Section 5. The results of the experiment are discussed and evaluated in Section 6. Finally, section 7 describes our conclusions and presents ideas for future work.
2. Related Work
Although there exist various size measures for Web
applications [16], here we focus on discussing only those related to functional size measurement.
In 1998, the IFPUG published guidelines to measure Web applications using the FPA counting rules [17]. Rollo [18], however, identified difficulties when measuring Web applications with these guidelines, such as difficulties encountered in identifying the system’s boundary and its logical files. Also, the company Total Metrics [19] recognized that the IFPUG guidelines did not resolve many of the counting issues faced when sizing Web applications. They provided interpretations of the IFPUG guidelines and explained how FPA can be applied to size Web Applications.
Other researchers proposed solutions in the form of Web-extensions to FPA. In the Web Objects approach of Reifer [1], functional size is determined taking into account the components that make up a Web application. These components are the number of operands (the five
function types defined in FPA2 plus four new function types) and the number of operators (operations that can be applied to the object). The new function types introduced in Reifer’s proposal are: multimedia files (e.g., MPEG-1&2 files), web building blocks (e.g., ActiveX, applets, shopping carts, etc.), scripts (to link html/xml data), and links (e.g., xml, html and query language lines). As in IFPUG FPA, a set of counting rules and a table of complexity ratings with weights are also defined.
The main advantages of this proposal are the use of a mathematical basis for prediction and the existence of an extension mechanism allowing for the addition of new types of operands and operators. Also, an adaptation of the COCOMO II [20] estimation model, called WebMo, for estimating the effort and duration of Web applications based on Web Objects was proposed.
Another proposal is Internet Points [12], which extends FPA to explicitly support Web project estimation. A Web site is sized by counting seven types of functions: files, RDB tables, APIs, messages sent by the system, number of static HTML pages, number of dynamic HTML pages and number of interactive pages. This method was automated in a tool called Cost Xpert.
Cleary proposed Web-Points [11] to measure the size of static Web sites. This method takes into account the complexity of the HTML pages of a web site. The number of Web-Points assigned to a page is a function of the size of the page in words, the number of existing links, and the number of non-textual elements of the web page. Cleary’s metric was used with productivity data to determine the effort required for the development or improvement of static Web sites. Cleary’s proposal focuses on static Web sites and therefore does not consider behavioral and navigational properties of Web applications.
The major limitations of Web Objects and Internet Points is their dependence on implementation technology and the fact that they cannot be applied in an early stage of the Web application development lifecycle. In addition, a main criterion for determining the success of a proposed method is its adoption in practice. The other proposals discussed above have been developed in the context of companies. No details about their actual usage inside and outside these companies are publicly available.
Some empirical studies on effort prediction for Web application projects have been published. Mendes et al. [16] present a comparison of several size metrics as effort predictors for Web applications. Ruhe et al. [21] validate Web Objects [1] in the context of a small Australian Web development company. Similarly, Baresi et al. [22] present an empirical study to estimate the effort needed to design Web applications that were developed using W2000 [5]. As far as we know, no study has been
2 Internal Logical Files, External Interface Files, External Input, External Output and External Inquiry.
published that contains a rigorous empirical validation of a proposed FSM method for measuring the functional size of Web applications. Demonstrating an empirical relationship with effort is of course useful, but it does not validate a proposed metric as a functional size measure for Web applications.
Our work is different from the studies that were mentioned here. We evaluate OOmFPWeb as a functional size measurement method for Web applications, not as a predictor of project effort. Another difference is that our evaluation is based on a laboratory experiment. To organize this experiment we used a theory-based evaluation model for FSM methods, that was tested in advance in the experimental evaluation of an FSM method for object-oriented systems [23]. It is our firm belief that the evaluation of the design and application of an FSM method should precede the validation of predictive models that are based on the functional size measurements. After all, effort prediction is only one use of functional size measurement.
3. OOWS and OOmFPWeb
OOWS (Object-Oriented Web Solutions) [6] is an
extension of an OO software production method called OO-Method [24]. It adds to OO-Method the required expressiveness to capture navigational and presentational features of Web applications. In the OOWS development process, we can distinguish two models: the Conceptual Model and the Execution Model.
As an extension of the OO-Method, the basic goal of OOWS is to obtain a precise system specification that will be transformed into the corresponding software product. This process can be automated by implementing the provided set of mappings between conceptual primitives (problem space) and their software representations (solution space). The Conceptual Model is based on the specification of five complementary conceptual model
views (Object, Dynamic, Functional, Navigational and Presentation), which describe the Web application’s functionality within a well-defined OO framework. This specification generates a XML document that acts as a high-level system repository. Furthermore, by using a precise Execution Model, a Web application that is functionally equivalent to the formal specification can be generated in a semi-automated way. OOWS was applied in the development of several real-world projects such as a university department web system (www.dsic.upv.es) and an e-commerce application for ticket sales of a theater company.
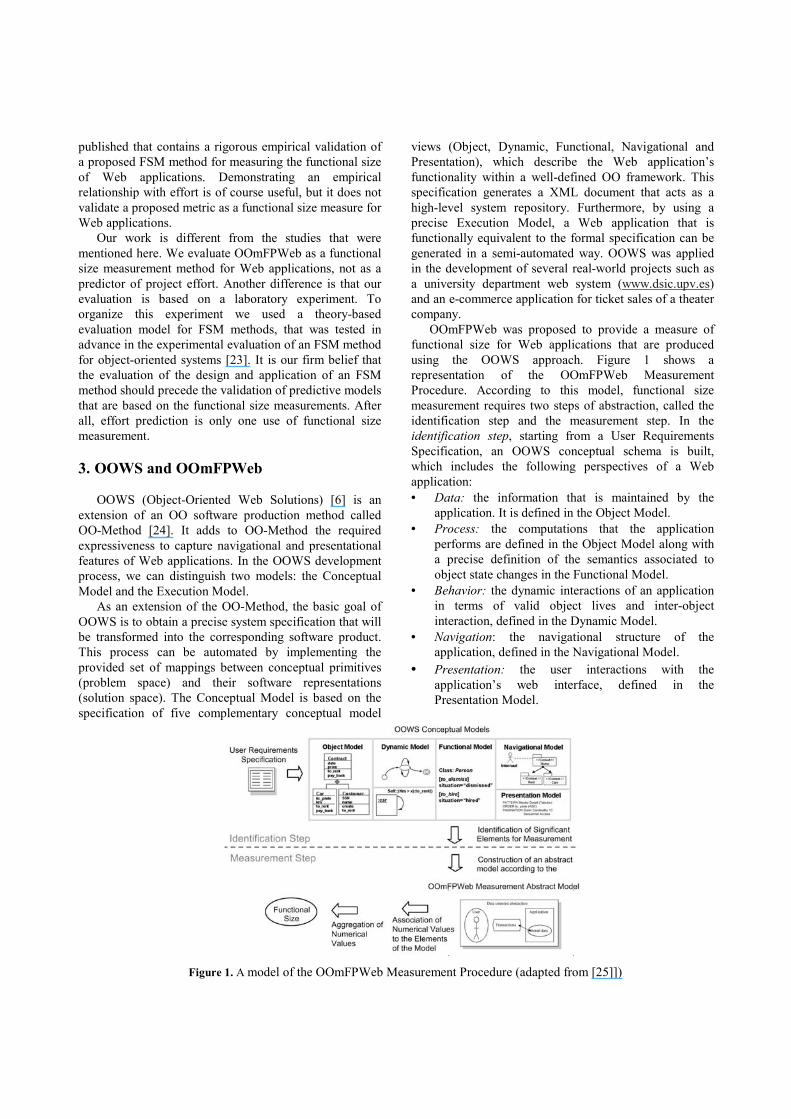
OOmFPWeb was proposed to provide a measure of functional size for Web applications that are produced using the OOWS approach. Figure 1 shows a representation of the OOmFPWeb Measurement Procedure. According to this model, functional size measurement requires two steps of abstraction, called the identification step and the measurement step. In the identification step, starting from a User Requirements Specification, an OOWS conceptual schema is built, which includes the following perspectives of a Web application: • Data: the information that is maintained by the
application. It is defined in the Object Model. • Process: the computations that the application
performs are defined in the Object Model along with a precise definition of the semantics associated to object state changes in the Functional Model.
• Behavior: the dynamic interactions of an application in terms of valid object lives and inter-object interaction, defined in the Dynamic Model.
• Navigation: the navigational structure of the application, defined in the Navigational Model.
• Presentation: the user interactions with the application’s web interface, defined in the Presentation Model.
Figure 1. A model of the OOmFPWeb Measurement Procedure (adapted from [25]])
OOmFPWeb assumes that the five model views of the OOWS conceptual schema contain all the elements that may contribute to the functional size of the Web application. The OOWS conceptual schema is, thus, the basis for identifying these elements. The kind of elements that are relevant to the functional size measurement of a Web application are described in the OOmFPWeb Measurement Abstract Model. Elements of these kind are more aptly defined as Base Functional Component (BFC) Types, as in the ISO/IEC standard for functional size measurement [26].
Given the conformity of OOmFPWeb to IFPUG FPA, the Measurement Abstract Model is in essence the same as the meta-model underlying IFPUG-FPA (basically distinguishing the five FPA BFC types). The difference with the IFPUG FPA meta-model is that the BFC types are described in terms of the OOWS modeling primitives. To identify BFCs and classify them according to the defined BFC types, OOmFPWeb offers a collection of measurement rules. In the measurement step, an abstract model of the required Web application is specified by applying these OOmFPWeb measurement rules. Next, the functional size of each of the identified BFCs is quantified by rating their complexity and translating this complexity rating into a Function Points value, using the schemes provided by IFPUG. Finally, the functional size values of the BFCs are summed to obtain the functional size value of the Web application. We do not take into account the FPA adjustment phase. The ISO principles for functional size measurement also exclude any adaptation factor that does not directly measure functional size.
As shown in Figure 1, the measurement step starts from the elements modeled in an OOWS conceptual schema. As a consequence, the functional size of a Web application is calculated in the problem space and is thus independent from the implementation technology chosen.
4. Theoretical Model For Evaluating FSM Methods
The evaluation of a new FSM method can be guided
by the ISO/IEC standard on functional size measurement. Part 1 of the standard [26] presents general concepts on functional size measurement and specifies the characteristics and requirements of a FSM method. Part 2 [27] describes a process to verify whether a candidate FSM method conforms to part 1 of the standard. Finally, part 3 [28] (which does not yet have the status of International Standard), describes a process to verify whether a FSM method exhibits the stated performance properties (e.g. accuracy, convertibility, applicability to functional domains) and meets the (prospective) user’s needs.
We acknowledge the value of a conformity check against the ISO/IEC standard for newly proposed FSM methods. For our purposes, part 3 is, however, more relevant for evaluating OOmFPWeb. This method was specifically proposed to enhance FPA in order to enable and facilitate the functional size measurement of Web applications (produced with OOWS). The development of OOmFPWeb, therefore, grew out of the need for a FSM method for Web applications, taking into account their specific features. Hence, the evaluation should focus on the efficiency and effectiveness of OOmFPWeb in satisfying its goal, i.e., measuring the functional size of Web applications.
Although the performance properties and verification procedures in part 3 of the ISO/IEC standard provide a starting point for evaluating OOmFPWeb, what is missing is a comprehensive view of the quality of a FSM method. A simple list of isolated quality criteria hides the interrelationships among quality properties and their impact on overall quality. What is needed is a structured quality framework or model that allows for a systematic evaluation of FSM methods. Such an evaluation should not only seek objective evidence of the efficacy of a method in achieving its objectives3. It should also test the user’s response to a new method and allow the prediction of its acceptance in practice.
Empirical studies can help determine the efficacy of proposed theories and methods. According to Riemenschneider et al. [29], the acceptance of software engineering methodologies is also determined by the user’s perceptions. If a method is not regarded as useful by its intended users, then its prospects for successful deployment are undermined. We therefore believe that future research directions for empirical software engineering should take into account not only the efficacy of a method in achieving its objectives, but also the likelihood of the method being accepted by practitioners based on their perception of efficacy.
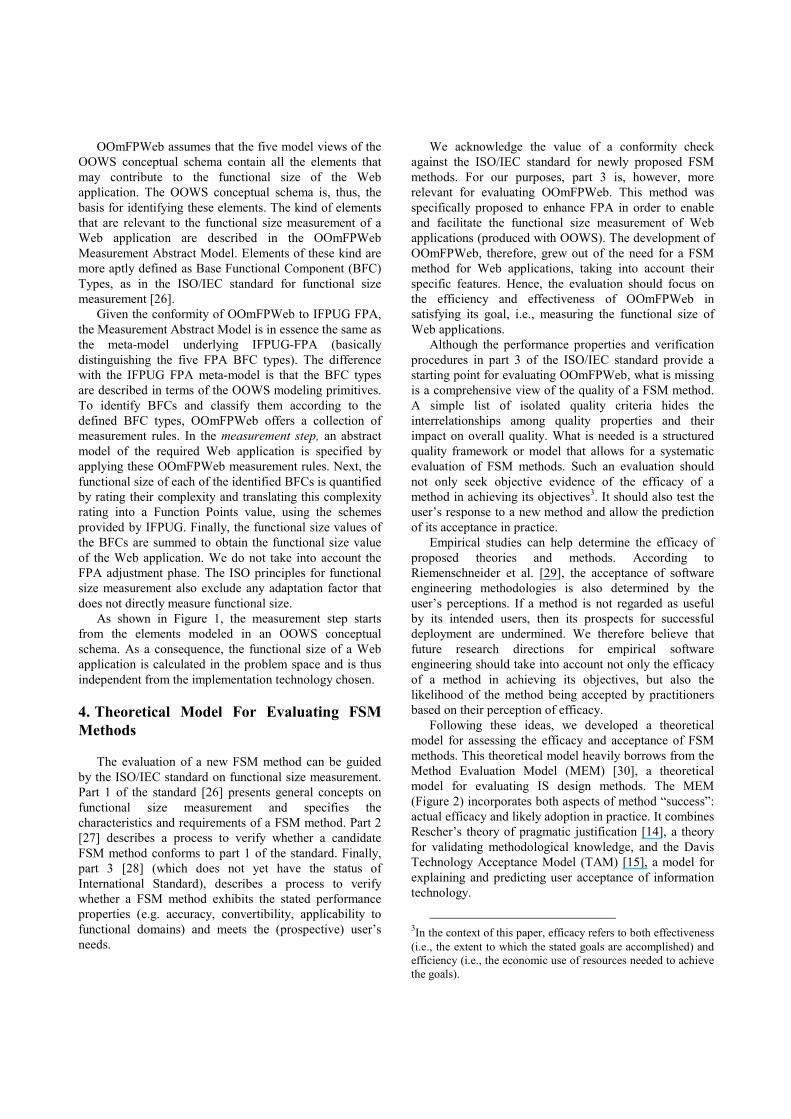
Following these ideas, we developed a theoretical model for assessing the efficacy and acceptance of FSM methods. This theoretical model heavily borrows from the Method Evaluation Model (MEM) [30], a theoretical model for evaluating IS design methods. The MEM (Figure 2) incorporates both aspects of method “success”: actual efficacy and likely adoption in practice. It combines Rescher’s theory of pragmatic justification [14], a theory for validating methodological knowledge, and the Davis Technology Acceptance Model (TAM) [15], a model for explaining and predicting user acceptance of information technology.
3In the context of this paper, efficacy refers to both effectiveness (i.e., the extent to which the stated goals are accomplished) and efficiency (i.e., the economic use of resources needed to achieve the goals).
The core of the MEM consists of the same perception-based constructs as the TAM, but now adapted for evaluating methods (as a special kind of information technology). These constructs are: • Perceived Ease of Use: the degree to which a person
believes that using a particular method would be free of effort.
• Perceived Usefulness: the degree to which a person believes that a particular method will be effective in achieving its intended objectives.
• Intention to Use: the extent to which a person intends to use a particular method.
These central constructs are called the Method
Adoption Model (MAM). This model is extended with additional constructs that provide inputs to the MAM and predict its ultimate output (i.e., whether the method will be used in practice). These additional constructs are: • Actual Efficiency: the effort required to apply a
method. This represents an input variable to the MAM.
• Actual Effectiveness: the degree to which a method achieves its objectives. This also represents an input variable to the MAM.
• Actual Usage: the extent to which a method is used in practice. This represents an output variable from the MAM.
The input variables relate to the actual performance of
users when employing a method. The assumption underlying the Method Evaluation Model is that perceptions of efficacy are the result of actual experience with the method and that a user’s performance when using a method has an impact on the user’s perception of the method’s efficacy. This, in turn, determines the user’s intention to adopt the method. Lastly, the actual usage of a method will be determined by this intention to use.
Perceived Ease of Use
Perceived Usefulness
Intention to Use
Actual Efficiency
Actual Effective-
ness
Performance
Actual Usage
External (Performance Based) Variables
Internal (Perception Based) Variables
External Behaviour
Method Adoption Model
Perceptions
Intentions Behaviour
ACTUAL EFFICACY
PERCEIVED EFFICACY
ADOPTION IN PRACTICE
Figure 2. Method Evaluation Model
We have adapted the constructs of the MEM to evaluate the efficacy and acceptance of a specific kind of methods, i.e., FSM methods. Our theoretical model for evaluating FSM methods provides a range of performance-based and perception-based variables, including efficiency, reproducibility, accuracy, perceived ease of use, perceived usefulness and intention to use.
Our choice of performance-based variables reflects the specific properties and requirements of functional size measurement. This choice was guided by part 3 of the ISO/IEC standard where performance properties for FSM methods are listed. For the perception-based variables, we relied on an existing measurement instrument for the MAM/TAM, though we adapted this instrument for use with FSM methods.
A detailed discussion and motivation of our theoretical model for evaluating FSM methods is beyond the scope of this paper. In this paper, we report upon how this model was applied in the design of an experiment to evaluate OOmFPWeb. The experiment, along with its operationalization of the theoretical evaluation model, is presented in the next section.
5. Experimental Design
In order to design the experiment, we used the
framework for experimental software engineering of Wohlin et al.[31]. In terms of the Goal/Question/Metric (GQM) template for goal-oriented software measurement [32], the goal of the experiment was to analyze functional size measurements for the purpose of evaluating OOmFPWeb with respect to its efficacy and likely adoption in practice from the point of view of the researcher. The context of the experiment was an OOWS conceptual schema of a Web application that is measured by PhD students in the Department of Computer Science at the Valencia University of Technology.
The broad research questions addressed by this experiment were: • RQ1: Is OOmFPWeb efficacious? • RQ2: Is OOmFPWeb likely to be adopted in
practice?
5.1. Planning
5.1.1. Selection of subjects. The subjects that participated in this study were fifteen students in the PhD Program in Software Engineering at the Valencia University of Technology. The students were between 24 and 28 years old and had similar backgrounds in the use of the OOWS approach.
The subjects were chosen for convenience, i.e., they were students enrolled in the Software Engineering for Web Environments course during the period from March
until July of 2003. The course included the topic of functional size measurement of Web applications.
This course was selected because it was a specialized teaching unit (where students learn advanced techniques about web development). Furthermore, the necessary preparation and training and the experimental task itself fitted well into the scope of this course. The experiment was therefore organized as a mandatory part of the course.
5.1.2. Variable selection. Evaluating the actual efficacy of a method requires the measurement of the effort required (inputs) and the quality of the results (outputs).
Hence, we distinguish between two performance-based variables: efficiency and effectiveness. Effectiveness can be further refined as the consistency of measurements. Consistency is defined as the agreement between the measurements of a same system, taken at different points in time or by different people. The consistency of measurements determines the reliability of the measurement method, i.e., the trust that people can have in the measurement results.
To evaluate effectiveness, the proposed evaluation model for FSM methods also considers the accuracy of measurements. Accuracy is defined as the agreement between the measurement value and its ‘true value’. The evaluation of accuracy assumes that there is another, supposedly right way of finding the ‘true value’ of functional size. Such an evaluation makes sense if an alternative method is proposed that aims to improve the efficiency or other performance properties (e.g., consistency) of an existing and validated FSM method, or if the new method is more likely to be accepted in practice. However, in our case, no method exists to measure the functional size of Web applications based on their conceptual models. So, there is no independent way of obtaining the ‘true value’ of functional size. Hence, in this experiment, effectiveness is operationalized as the consistency of measurements, not their accuracy.
To further operationalize the performance-based variable efficiency and effectiveness (or consistency) we used: • Measurement Time: the time taken by a subject to
measure an OOWS conceptual schema using OOmFPWeb.
• Reproducibility: the agreement between the measurement results of different subjects using OOmFPWeb (for the same system).
To evaluate the perceived efficacy and intention to use
OOmFPWeb, we selected the three perception-based variables of the MAM (or TAM): Perceived Ease of Use, Perceived Usefulness and Intention to Use: • Perceived Ease of Use: the degree to which a subject
believes that using OOmFPWeb will be free of effort.
• Perceived Usefulness: the degree to which a subject believes that OOmFPWeb will be effective in achieving its intended objectives.
• Intention to Use: the degree to which an individual intends to use OOmFPWeb as a result of his/her perception of the method’s efficacy.
5.1.3. Experimental Tasks. This experiment includes two tasks: a measurement task and a post-task survey.
In the measurement task, each subject used the OOmFPWeb measurement rules to measure an OOWS conceptual schema. This task was used to collect data to evaluate the performance-based variables.
Next, in the post-task survey, students were asked to complete a survey to evaluate OOmFPWeb. The survey is a measurement instrument to collect data for the evaluation of the perception-based variables.
5.1.4. Instrumentation. The instrumentation used in this experiment included the experimental object, the training materials and the survey instrument.
The experimental object was an OOWS conceptual schema of an e-commerce application for a photography agency. The following training materials were prepared for all subjects: a set of instructional slides describing OOmFPWeb and the procedure for applying it; a case-study that describes an example application of OOmFPWeb; and a measurement guideline summarizing the measurement rules of the method. The survey instrument4 included 14 closed questions (i.e., survey items), which were based on the items used to measure the constructs of the Method Adoption Model [30] (which itself adapted the items normally used to measure the constructs of the Technology Acceptance Model [15]). The items that we used were formulated using a 5-point Likert scale, using the opposing statements question format. The order of the items was randomized and half the questions were negated to avoid monotonous responses. Perceived Ease of Use was measured using 5 items on the survey (Questions 1, 3, 4, 6, and 9). Perceived Usefulness is measured using 6 items on the survey (Questions 2, 5, 8, 10, 11, and 13). Finally, Intention to Use was measured using 3 items on the survey (Questions 7, 12, 14).
5.1.5. Hypothesis formulation. As there is currently no other method for measuring the functional size of Web applications based on a problem-space representation, we cannot evaluate OOmFPWeb against a control method.
Hence, the independent variable has only one value
(i.e., using OOmFPWeb). Instead of using a control group (as in a between-subjects experiment) or letting each
4 http://www.dsic.upv.es/~sabrahao/FSM/survey.html
subject be its own control (as in a within-subject experiment), we decided to evaluate the performance-based variables in a qualitative way by comparing the data collected for OOmFPWeb against similar performance data reported in industry or in other empirical studies. To evaluate the perception-based variables, a more quantitative analysis could be used as the measurement instrument itself provides a reference point to assess the significance of the results.
In the following section of the paper we test the following hypotheses: • Hypothesis 1: OOmFPWeb is efficient when
compared to current industry practices. • Hypothesis 2: OOmFPWeb is effective when
compared to similar studies reported in the literature. • Hypothesis 3: OOmFPWeb is perceived as easy to
use. • Hypothesis 4: OOmFPWeb is perceived as useful. • Hypothesis 5: There is an intention to use
OOmFPWeb. These hypotheses relate to a direct relationship
between the use of OOmFPWeb and the users’ performance, perceptions and intentions. The theoretical model contains a number of other hypothesized relationships that indicate causal links between dependent variables (like performance having an effect on perceptions or perceptions influencing intentions). The purpose of these hypotheses is to test the predictive and explanatory power of the model. Testing these hypotheses is, however, beyond of the scope of this paper.
5.2. Experiment Operation
5.2.1. Execution. The experiment took place in a single room. It was ensured that no interaction among subjects occurred. To avoid a possible ceiling effect, there was no time limit to size the OOWS conceptual schema. We also allowed the use of the material used in the training session. After they finished the measurement task, the subjects were asked to perform the post-task survey.
5.2.2. Data Recording and Validation. The performance-based dependent variables were measured using a data collection form. This form records the outputs of the OOmFPWeb functional size measurement (called subject assessment using Function Points as the measurement unit) and the time spent to measure the size of the OOWS conceptual schema.
We called this time measurement time, expressed in hours. Once the data were collected, we verified whether the tests were complete. As all tests were completed, we took into account the responses of all subjects.
6. Analysis and Interpretation
6.1. Analysis of the Actual Efficacy of OOmFPWeb
We first evaluate the efficiency of OOmFPWeb. As
the time required to apply the procedures and rules of a measurement method depends on the size of the application measured, we cannot directly compare the recorded measurement times with industry findings. Therefore, the evaluation is made by comparing the measurement productivity of subjects using OOmFPWeb against reported industry averages. Measurement productivity is defined in this context as the number of Function Points that can be “counted” per unit of time (e.g. per day).
We are aware that the productivity of people in sizing a specification or application can vary considerably, even when using the same FSM method. It depends on many factors such as experience, the quality of the specifications, the use of tools, etc. Notwithstanding these limitations, a comparison of the measurement productivity observed in the experiment with what is considered as being “normal” in industry, gives us some basis to assess the performance of people using OOmFPWeb.
According to reported industry experience5, we can expect “counting rates” of 300 Function Points per day (FP/day) by first-time counters with one day's training. The IBM stated counting rate is 800 FP/day with one week of counting assistance. After two weeks of assisted counting, 1000-1500 FP/day can be measured. As further evidence, the company Total Metrics published different counting levels [33]. According to these levels, the productivity of an estimator can vary between 200-750 FP/day. Considering the performance data reported in industry, we can conclude that the lowest productivity for first-time counters is 200-300 FP/day. As a day is assumed to have 8 working hours, the obtained productivity rate is approximately 25-37.5 FP/hour.
In this experiment, we adopted 37.5 FP/hour as the benchmark industry rate for the productivity of “not-so-experienced” function point counters. To calculate the measurement productivity of a subject, we divided the subject assessment by the measurement time.6 The obtained productivity rate for each subject measuring the experimental object is presented in Appendix A.
As can be seen in Table 1, the mean measurement productivity that was observed (108.79 FP/hour) is about
5 http://www.functionpoints.com/faq.asp#a14
6 It is of course better to use the ‘true value’ of the functional size of the experimental object as the output measure in the productivity ratio. As discussed before, it was impossible to establish this true value. Therefore, the true value is approximated by the subject assessment.
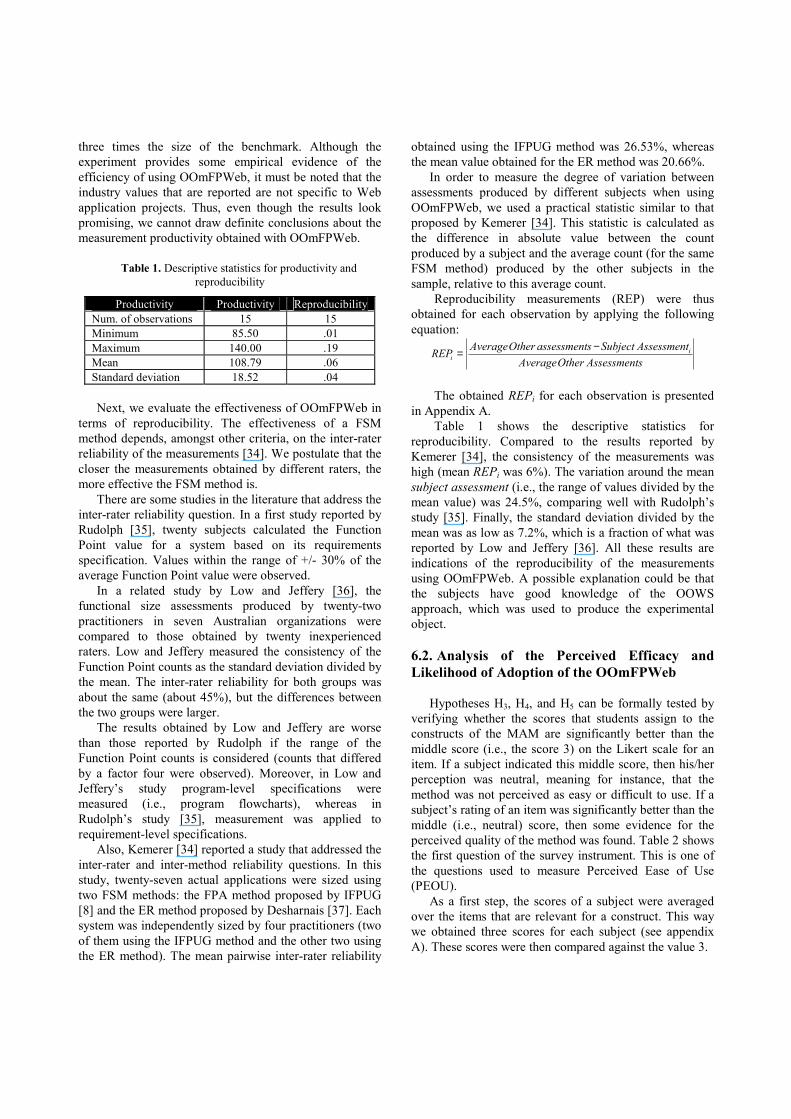
three times the size of the benchmark. Although the experiment provides some empirical evidence of the efficiency of using OOmFPWeb, it must be noted that the industry values that are reported are not specific to Web application projects. Thus, even though the results look promising, we cannot draw definite conclusions about the measurement productivity obtained with OOmFPWeb.
Table 1. Descriptive statistics for productivity and reproducibility
Productivity Productivity Reproducibility Num. of observations 15 15 Minimum 85.50 .01 Maximum 140.00 .19 Mean 108.79 .06 Standard deviation 18.52 .04
Next, we evaluate the effectiveness of OOmFPWeb in
terms of reproducibility. The effectiveness of a FSM method depends, amongst other criteria, on the inter-rater reliability of the measurements [34]. We postulate that the closer the measurements obtained by different raters, the more effective the FSM method is.
There are some studies in the literature that address the inter-rater reliability question. In a first study reported by Rudolph [35], twenty subjects calculated the Function Point value for a system based on its requirements specification. Values within the range of +/- 30% of the average Function Point value were observed.
In a related study by Low and Jeffery [36], the functional size assessments produced by twenty-two practitioners in seven Australian organizations were compared to those obtained by twenty inexperienced raters. Low and Jeffery measured the consistency of the Function Point counts as the standard deviation divided by the mean. The inter-rater reliability for both groups was about the same (about 45%), but the differences between the two groups were larger.
The results obtained by Low and Jeffery are worse than those reported by Rudolph if the range of the Function Point counts is considered (counts that differed by a factor four were observed). Moreover, in Low and Jeffery’s study program-level specifications were measured (i.e., program flowcharts), whereas in Rudolph’s study [35], measurement was applied to requirement-level specifications.
Also, Kemerer [34] reported a study that addressed the inter-rater and inter-method reliability questions. In this study, twenty-seven actual applications were sized using two FSM methods: the FPA method proposed by IFPUG [8] and the ER method proposed by Desharnais [37]. Each system was independently sized by four practitioners (two of them using the IFPUG method and the other two using the ER method). The mean pairwise inter-rater reliability
obtained using the IFPUG method was 26.53%, whereas the mean value obtained for the ER method was 20.66%.
In order to measure the degree of variation between assessments produced by different subjects when using OOmFPWeb, we used a practical statistic similar to that proposed by Kemerer [34]. This statistic is calculated as the difference in absolute value between the count produced by a subject and the average count (for the same FSM method) produced by the other subjects in the sample, relative to this average count.
Reproducibility measurements (REP) were thus obtained for each observation by applying the following equation:
sAssessmentOtherAverageAssessmentSubjectsassessmentOtherAverageREP i
i−=
The obtained REPi for each observation is presented
in Appendix A. Table 1 shows the descriptive statistics for
reproducibility. Compared to the results reported by Kemerer [34], the consistency of the measurements was high (mean REPi was 6%). The variation around the mean subject assessment (i.e., the range of values divided by the mean value) was 24.5%, comparing well with Rudolph’s study [35]. Finally, the standard deviation divided by the mean was as low as 7.2%, which is a fraction of what was reported by Low and Jeffery [36]. All these results are indications of the reproducibility of the measurements using OOmFPWeb. A possible explanation could be that the subjects have good knowledge of the OOWS approach, which was used to produce the experimental object.
6.2. Analysis of the Perceived Efficacy and Likelihood of Adoption of the OOmFPWeb
Hypotheses H3, H4, and H5 can be formally tested by
verifying whether the scores that students assign to the constructs of the MAM are significantly better than the middle score (i.e., the score 3) on the Likert scale for an item. If a subject indicated this middle score, then his/her perception was neutral, meaning for instance, that the method was not perceived as easy or difficult to use. If a subject’s rating of an item was significantly better than the middle (i.e., neutral) score, then some evidence for the perceived quality of the method was found. Table 2 shows the first question of the survey instrument. This is one of the questions used to measure Perceived Ease of Use (PEOU).
As a first step, the scores of a subject were averaged over the items that are relevant for a construct. This way we obtained three scores for each subject (see appendix A). These scores were then compared against the value 3.

Table 2. Excerpt of the survey instrument
I found the procedure for applying the method complex and difficult to follow
O
O
O
O
O
I found the procedure for applying the method simple and easy to follow
We first tested hypothesis H3 related to PEOU. The
descriptive statistics are presented in Table 3. The Kolmogorov-Smirnov test for normality was applied to the PEOU data. As this distribution was normal, we used the one-tailed sample t-test7 to check for a difference in mean PEOU for OOmFPWeb and the value 3. To evaluate the significance of the observed difference, we applied a statistical test with a significance level of 5 %, i.e. alpha = 0.05.
Table 3. Descriptive statistics for PEOU, PU and ITU
Descriptive Statistics PEOU PU ITU Number of observations 15 15 15 Minimum 3.00 2.20 1.67 Maximum 5.00 4.60 5.00 Mean 3.86 3.80 3.73 Standard deviation 0.58 .67 1.01
The results shown in Table 4 allow for the rejection
of the null hypothesis, meaning that we empirically corroborated that participants perceived OOmFPWeb to be easy to use.
Table 4. 1-tailed One Sample t-test rank for differences in mean perceived ease of use
Perceived Ease of Use Mean 3.866 Std. Deviation .583 Std. error mean .150 95% confidence interval of the difference
.5433 (lower) 1.1900 (upper)
t 5.748 1-tailed p-value .000
Next, we tested the hypothesis H4 related to Perceived
Usefulness (PU). The descriptive statistics for PU are presented in Table 3. The Kolmogorov-Smirnov test shows that PU observations were also normally distributed. Again, we used the one-tailed sample t-test
7 The Likert scales used for PEOU, PU and ITU are meant to approximate interval scales. Given the robustness of the parametric techniques (e.g. t-tests) to non-linear distortions of interval scales [38] L. Briand, K. El-Emam, and S. Morasca, "On the Application of Measurement Theory in Software Engineering", Empirical Software Engineering: An international Journal, vol. 1, no. 1, 1996., we decided to use them instead of the less powerful non-parametric alternatives.
with a significance level of 5 %. The results of the test (Table 5) allow for the rejection of the null hypothesis. Hence, participants perceived OOmFPWeb as being useful.
Table 5. 1-tailed One Sample t-test rank for differences in mean perceived usefulness
Perceived Usefulness Mean 3.800 Std. deviation .671 Std. error mean .173 95% confidence interval of the difference
.429 (lower) 1.172 (upper)
T 4.611 1-tailed p-value .000
Finally, we tested the hypothesis H5 related to
Intention to Use (ITU). The descriptive statistics for ITU are presented in Table 3. To test the hypothesis, the same procedure as detailed above was used. The Kolmogorov-Smirnov test for normality showed a normal distribution. The result of the t-test for ITU (Table 6) allows for the rejection of the null hypothesis, meaning that we empirically corroborated that the participants intend to use OOmFWeb in the future.
Table 6. 1-tailed One Sample t-test rank for differences in mean intention to use
Intention to Use Mean 3.73 Std. deviation 1.017 Std. error mean .262 95% confidence interval of the difference
.1733 (lower) 1.2996 (upper)
t 2.792 1-tailed p-value .007
Although the statistical significance of the results was
very high (p < 0,001) for H3 and H4, and high (p < 0,01) for H5, it is necessary to validate the survey items used to measure the constructs of the MAM before any definite conclusions can be drawn. An analysis of the construct validity and reliability of the survey instrument is presented in the next subsection.
6.3. Validating the Validity and Reliability of the MAM Constructs
In order to evaluate the validity of the MAM constructs, an inter-item correlation analysis was carried out. We assumed that all items associated with a particular construct have equal weights. Specifically, we used the concepts of convergent and discriminant validity proposed by Campbell and Fiske [39].
Convergent validity (CV) refers to the convergence among different indicators used to measure a particular construct. The CV of an indicator is measured by the average correlation between the indicator and the other indicators that are used to measure the same construct. This average correlation should be as high as possible. Discriminant validity (DV) refers to the divergence of the indicators used to measure different constructs. The DV of an indicator is measured by the average correlation between the indicator and the indicators that are used to measure different constructs. This average correlation should be as low as possible.
The results of the validity analysis for each construct are: • PEOU: the average CV of all items was .45. Overall,
CV was almost twice the size of DV. • PU: the average CV across all indicators was .44.
Overall, CV was greater than the size of DV. • ITU: The average CV across all indicators was .72.
Overall, CV was twice the size of DV. The problem that emerged from the analysis was the
low level of convergent validity for the item Q10 (intended to measure Perceived Usefulness). This item had a value for DV that was greater than its value for CV. For this reason, Q10 was excluded from the analysis reported in the previous subsection.
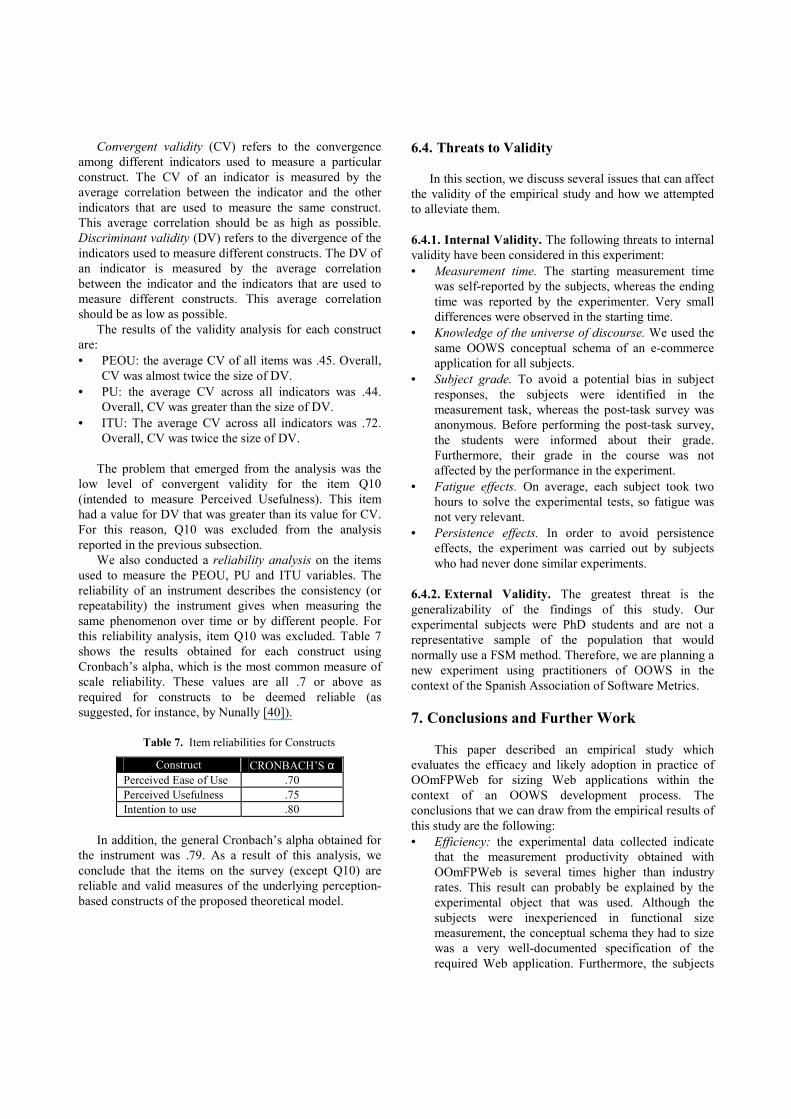
We also conducted a reliability analysis on the items used to measure the PEOU, PU and ITU variables. The reliability of an instrument describes the consistency (or repeatability) the instrument gives when measuring the same phenomenon over time or by different people. For this reliability analysis, item Q10 was excluded. Table 7 shows the results obtained for each construct using Cronbach’s alpha, which is the most common measure of scale reliability. These values are all .7 or above as required for constructs to be deemed reliable (as suggested, for instance, by Nunally [40]).
Table 7. Item reliabilities for Constructs
Construct CRONBACH’S α Perceived Ease of Use .70 Perceived Usefulness .75 Intention to use .80
In addition, the general Cronbach’s alpha obtained for
the instrument was .79. As a result of this analysis, we conclude that the items on the survey (except Q10) are reliable and valid measures of the underlying perception-based constructs of the proposed theoretical model.
6.4. Threats to Validity In this section, we discuss several issues that can affect
the validity of the empirical study and how we attempted to alleviate them.
6.4.1. Internal Validity. The following threats to internal validity have been considered in this experiment: • Measurement time. The starting measurement time
was self-reported by the subjects, whereas the ending time was reported by the experimenter. Very small differences were observed in the starting time.
• Knowledge of the universe of discourse. We used the same OOWS conceptual schema of an e-commerce application for all subjects.
• Subject grade. To avoid a potential bias in subject responses, the subjects were identified in the measurement task, whereas the post-task survey was anonymous. Before performing the post-task survey, the students were informed about their grade. Furthermore, their grade in the course was not affected by the performance in the experiment.
• Fatigue effects. On average, each subject took two hours to solve the experimental tests, so fatigue was not very relevant.
• Persistence effects. In order to avoid persistence effects, the experiment was carried out by subjects who had never done similar experiments.
6.4.2. External Validity. The greatest threat is the generalizability of the findings of this study. Our experimental subjects were PhD students and are not a representative sample of the population that would normally use a FSM method. Therefore, we are planning a new experiment using practitioners of OOWS in the context of the Spanish Association of Software Metrics.
7. Conclusions and Further Work
This paper described an empirical study which
evaluates the efficacy and likely adoption in practice of OOmFPWeb for sizing Web applications within the context of an OOWS development process. The conclusions that we can draw from the empirical results of this study are the following: • Efficiency: the experimental data collected indicate
that the measurement productivity obtained with OOmFPWeb is several times higher than industry rates. This result can probably be explained by the experimental object that was used. Although the subjects were inexperienced in functional size measurement, the conceptual schema they had to size was a very well-documented specification of the required Web application. Furthermore, the subjects
were well-versed in the OOWS method that was used to produce this schema. In practice, these conditions are not always met, which might explain why industry productivity rates are low compared to what was observed in this study.
• Effectiveness: we have corroborated that users of OOmFPWeb produce consistent assessments. This result can be explained by the detailed measurement procedures and rules of OOmFPWeb, which provide a precise mapping between OOWS constructs and the concepts used in FPA. The more precise these mapping rules are, the fewer interpretation problems people will have when using a functional size measurement method.
• Acceptance: The perceptions of the subjects seem to confirm the performance-related results. Subjects perceived OOmFPWeb as easy to use and useful, and they intend to use the method when sizing OOWS conceptual schemas. A further analysis is required to investigate whether these perceptions and intentions are really a result of their performance in using OOmFPWeb, as suggested by the theoretical model. Another explanation (and perhaps more plausible) is that there is currently no alternative to OOmFPWeb.
We are aware that more experimentation is needed in
order to reconfirm the first results obtained. In future replications, some changes need to be made to the experimental set-up, for instance, with respect to some possible threats to validity. A more fundamental change is that in the new experiment a control could be used in the form of FPA. Given the many problems encountered when using FPA to size Web applications, it would be interesting to see to what extent OOmFPWeb improves the Function Point counting, both from a performance-based perspective and a perception-based perspective.
References
[1] D. Reifer, "Web Development: Estimating Quick-to-
Market Software", IEEE Software, vol. 17, no. 6, 2000, pp. 57-64.
[2] Cutter Consortium, "Poor Project Management – Problem of E-Projects" October 2000 http://www.cutter.com/consortium/press/001019.html.
[3] D. Schwabe and G. Rossi, "The Object-Oriented Hypermedia Design Model", Communications of the ACM, vol. 38, no. 8, 1995, pp. 45-46.
[4] S. Ceri, P. Fraternali, and A. Bongio, "Web Modeling Language (WebML): a modeling language for designing Web sites", Proc. of 9th Word Wide Web Conference (WWW'00), Amsterdam, The Netherlands, 2000, pp. 137-157.
[5] L. Baresi, F. Garzotto, and P. Paolini, "From Web Sites to Web Applications: New Issues for Conceptual Modeling",
Proc. of ER'2000 Workshop on Conceptual Modeling and the Web, 2000.
[6] O. Pastor, S. Abrahão, and J. Fons, "An Object-Oriented Approach to Automate Web Applications Development", Proc. of 2nd International Conference on Electronic Commerce and Web Technologies (EC-Web'01), Munich, Germany, 2001, LNCS 2115, Springer-Verlag, pp. 16-28.
[7] J. Fons, V. Pelechano, M. Albert, and O. Pastor, "Development of Web Applications from Web Enhanced Conceptual Schemas", Proc. of International Conference on Conceptual Modeling (ER 2003), Chicago, USA, 2003, LNCS 2813, Springer Verlag, pp. 232-245.
[8] IFPUG, "Function Point Counting Practices Manual, Release 4.1", International Function Point Users Group, Westerville, Ohio, USA, 1999.
[9] COSMIC-FFP Measurement Manual version 2.2, Common Software Measurement International Consortium, January 2003.
[10] C. R. Symons, Software sizing and estimating: Mk II FPA (Function point analysis), John Wiley & Sons, 1991.
[11] D. Cleary, "Web-Based Development and Functional Size Measurement." Proc. of IFPUG Annual Conference, San Diego, USA, 2000.
[12] Cost Xpert Group Inc., Estimating Internet Development. http://www.costxpert.com/Reviews_Articles/SoftDev/.
[13] S. Abrahão and O. Pastor, "Measuring the Functional Size of Web Applications", International Journal of Web Engineering and Technology, Inderscience Enterprises Ltd., England, vol. 1, no. 1, 2003, pp. 5-16.
[14] N. Rescher, The Primacy of Practice, Basil Blackwel, Oxford1973.
[15] F. D. Davis, "Perceived Usefulness, Perceived Ease of Use and User Acceptance of Information Technology", MIS Quarterly, vol. 3, no. 3, 1989.
[16] E. Mendes, N. Mosley, and S. Counsell, "Comparison of Web size measures for predicting Web design and authoring effort", IEE Proceedings - Software, vol. 149, no. 3, 2002, pp. 86-92.
[17] IFPUG, "Hints to Counting Web Sites" IFPUG White Paper, 1998.
[18] T. Rollo, "Sizing E-commerce", Proc. of Proc. of the Australian Conference on Software Metrics (ACOSM'00), Sydney, Australia, 2000.
[19] Total Metrics, “Web Based Applications: How is FPA applied to sizing Web Based applications?", Australia, 2001.
[20] B. W. Boehm, C. Abts, A. W. Brown, S. Chulami, B. K. Clark, E. Horowitz, M. R., D. Reifer, and B. Steece, Software Cost Estimation with Cocomo II, Prentice-Hall, 1st edition, 544 p., 2000.
[21] M. Ruhe, R. Jeffery, and I. Wieczorek, "Using Web Objects for Estimating Software Development Effort for Web Applications", Proc. of 9th International Software Metrics Symposium (METRICS'03), Sydney, Australia, 2003, pp. 30-39.
[22] L. Baresi, S. Morasca, and P. Paolini "Estimating the Design Effort of Web Applications", Proc. of 9th International Software Metrics Symposium (METRICS'03), Sydney, Australia, 2003, pp. 62-72.
[23] S. Abrahão, G. Poels, and O. Pastor, "Assessing the Reproducibility and Accuracy of FSM Methods through
Experimentation", Proc. of ACM-IEEE International Symposium on Empirical Software Engineering (ISESE 2004), Redondo Beach CA, USA, 2004.
[24] O. Pastor, J. Gómez, E. Insfrán, and V. Pelechano, "The OO-Method Approach for Information Systems Modelling: From Object-Oriented Conceptual Modeling to Automated Programming", Information Systems, vol. 26, no. 7, 2001, pp. 507-534.
[25] V. Bévo, G. Lévesque, and J. Meunier, "Toward an ontological formalization for a software functional size measurement method's application process: the COSMIC-FFP case", Proc. of 13th International Workshop on Software Measurement, Montréal, Canada, 2003, Shaker Verlag, pp. 186-203.
[26] ISO, "ISO/IEC 14143-1- Information Technology - Software measurement - Functional Size Measurement. Part 1: Definition of Concepts", 1998.
[27] ISO, "ISO/IEC 14143-2 - Information Technology - Software measurement - Functional Size Measurement. Part 2: Conformity evaluation of software size measurement methods to ISO/IEC 14143-1:1998", 2002.
[28] ISO, "ISO/IEC 14143-3 - Information technology -- Software measurement -- Functional size measurement -- Part 3: Verification of functional size measurement methods", 2003.
[29] C. K. Riemenschneider, B. C. Hardgrave, and F. D. Davis, "Explaining Software Developer Acceptance of Methodologies: A Comparison of Five Theoretical Models", IEEE Transactions on Software Engineering, vol. 28, no. 12, 2002, pp. 1135-1145.
[30] D. L. Moody, "Dealing with Complexity: A Practical Method for Representing Large Entity Relationship Models", PhD. Thesis, Department of Information Systems, University of Melbourne, Australia, 2001, 354p.
[31] C. Wohlin, P. Runeson, M. Höst, M. C. Ohlsson, B. Regnell, and A. Wesslén, Experimentation in Software Engineering: An Introduction2000.
[32] V. R. Basili and H. D. Rombach, "The TAME Project: Towards Improvement-Oriented Software Environments", IEEE Transactions on Software Engineering, vol. 14, no. 6, 1988, pp. 758-773.
[33] Total Metrics, "Levels of Counting", Australia, August 2001.
[34] C. F. Kemerer, "Reliability of Function Points Measurement", Communications of the ACM, vol. 36, no. 2, 1993, pp. 85-97.
[35] E. E. Rudolph, "Productivity in computer application development", Working paper 9, Department of Management Studies, University of Auckland, New Zealand, 1983.
[36] G. C. Low and D. R. Jeffery, "Function Points in the estimation and evaluation of the software process", IEEE Transactions on Software Engineering, vol. 16, no. 1, 1990, pp. 64-71.
[37] A. Abran, J. M. Desharnais, S. Oligny, D. St.Pierre, and C. Symons, "COSMIC-FFP Measurement Manual, Version 2.1", The Common Software Measurement International Consortium, May 2001.
[38] L. Briand, K. El-Emam, and S. Morasca, "On the Application of Measurement Theory in Software Engineering", Empirical Software Engineering: An international Journal, vol. 1, no. 1, 1996.
[39] D. T. Campbell and D. W. Fiske, "Convergent and Discriminant Validation by the Multitrait-Multimethod Matrix", in Psychological Bulletin, vol. 56, 1959, pp. 81-105.
[40] J. Nunally, Psychometric Theory, McGraw-Hill, 2nd ed., New York, NY1978.
Appendix A
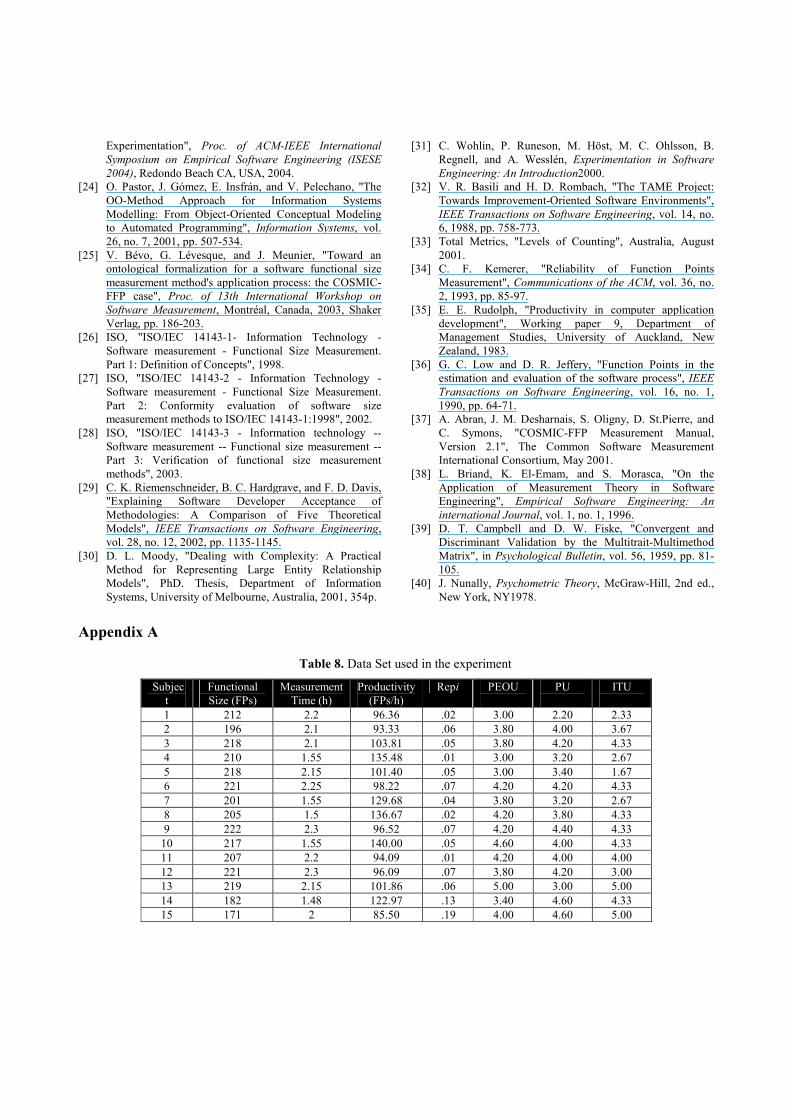
Table 8. Data Set used in the experiment
Subject
Functional Size (FPs)
Measurement Time (h)
Productivity (FPs/h)
Repi PEOU
PU
ITU
1 212 2.2 96.36 .02 3.00 2.20 2.33 2 196 2.1 93.33 .06 3.80 4.00 3.67 3 218 2.1 103.81 .05 3.80 4.20 4.33 4 210 1.55 135.48 .01 3.00 3.20 2.67 5 218 2.15 101.40 .05 3.00 3.40 1.67 6 221 2.25 98.22 .07 4.20 4.20 4.33 7 201 1.55 129.68 .04 3.80 3.20 2.67 8 205 1.5 136.67 .02 4.20 3.80 4.33 9 222 2.3 96.52 .07 4.20 4.40 4.33
10 217 1.55 140.00 .05 4.60 4.00 4.33 11 207 2.2 94.09 .01 4.20 4.00 4.00 12 221 2.3 96.09 .07 3.80 4.20 3.00 13 219 2.15 101.86 .06 5.00 3.00 5.00 14 182 1.48 122.97 .13 3.40 4.60 4.33 15 171 2 85.50 .19 4.00 4.60 5.00