Estimation of the Transition/Transversion Rate Bias and Species Sampling
10
Estimation of the Transition/Transversion Rate Bias and Species Sampling Ziheng Yang, 1 Anne D. Yoder 2,3 1 Department of Biology (Galton Laboratory), University College London, 4 Stephenson Way, London NW1 2HE, England 2 Department of Cell and Molecular Biology, Northwestern University Medical School, Chicago, IL 60611, USA 3 Department of Zoology, Field Museum of Natural History, Chicago, IL 60605, USA Received: 1 October 1997 / Accepted: 29 September 1998 Abstract. The transition/transversion (ti/tv) rate ratios are estimated by pairwise sequence comparison and joint likelihood analysis using mitochondrial cytochrome b genes of 28 primate species, representing both the Strep- sirrhini (lemurs and lories) and the Anthropoidea (mon- keys, apes, and humans). Pairwise comparison reveals a strong negative correlation between estimates of the ti/tv ratio and the sequence distance, even when both are corrected for multiple substitutions. The maximum- likelihood estimate of the ti/tv ratio changes with the species included in the analysis. The ti/tv bias within the lemuriform taxa is found to be as strong as in the an- thropoids, in contradiction to an earlier study which sampled only one lemuriform. Simulations show the sur- prising result that both the pairwise correction method and the joint likelihood analysis tend to overcorrect for multiple substitutions and overestimate the ti/tv ratio, especially at low sequence divergence. The bias, how- ever, is not large enough to account for the observed patterns. Nucleotide frequency biases, variation of sub- stitution rates among sites, and different evolutionary dynamics at the three codon positions can be ruled out as possible causes. The likelihood-ratio test suggests that the ti/tv rate ratios may be variable among evolutionary lineages. Without any biological evidence for such a variation, however, we are left with no plausible expla- nations for the observed patterns other than a possible saturation effect due to the unrealistic nature of the model assumed. Key words: Transition/transversion rate ratio — Maximum likelihood — Species sampling — Saturation — Lemurs — Primates Introduction In virtually all DNA sequences from any genome exam- ined, transitions (T↔C, A↔G) have been noted to occur at higher frequencies than transversions (T↔A, T↔G, C↔A, C↔G) (Brown et al. 1982; Gojobori et al. 1982; Curtis and Clegg 1984; Wakeley 1994, 1996). While transition/transversion (ti/tv) bias is known to be a gen- eral property of DNA sequence evolution, it is more pronounced in animal mitochondrial DNAs (mtDNAs) than in nuclear or chloroplast DNAs (for a review see Wakeley 1996). Estimation of the ti/tv rate bias is im- portant not only to our understanding of the patterns of DNA sequence evolution, but also to reliable estimation of sequence distance and phylogeny reconstruction. The ti/tv rate ratio has most often been estimated by counting the proportions of sites with transitional (P) and transversional (Q) differences between two sequences, that is, by P/Q. A major problem with this approach has been the correlation between the genetic distance and the observed ti/tv (P/Q). It has been repeatedly noted that at low levels of genetic divergence, ti/tv appears to be high, and at high levels of genetic divergence, ti/tv appears to be low. Figure 1 illustrates the pattern in three eutherian groups. In all three, transition frequencies (P) appear to peak at approximately 15% genetic divergence, where- upon they are gradually matched in frequency by trans- versions as genetic distance increases. At levels of 20% Correspondence to: Ziheng Yang; e-mail: [email protected] J Mol Evol (1999) 48:274–283 © Springer-Verlag New York Inc. 1999
-
Upload
independent -
Category
Documents
-
view
1 -
download
0
Transcript of Estimation of the Transition/Transversion Rate Bias and Species Sampling
Estimation of the Transition/Transversion Rate Bias and Species Sampling
Ziheng Yang,1 Anne D. Yoder2,3
1Department of Biology (Galton Laboratory), University College London, 4 Stephenson Way, London NW1 2HE, England2Department of Cell and Molecular Biology, Northwestern University Medical School, Chicago, IL 60611, USA3Department of Zoology, Field Museum of Natural History, Chicago, IL 60605, USA
Received: 1 October 1997 / Accepted: 29 September 1998
Abstract. The transition/transversion (ti/tv) rate ratiosare estimated by pairwise sequence comparison and jointlikelihood analysis using mitochondrial cytochromebgenes of 28 primate species, representing both the Strep-sirrhini (lemurs and lories) and the Anthropoidea (mon-keys, apes, and humans). Pairwise comparison reveals astrong negative correlation between estimates of the ti/tvratio and the sequence distance, even when both arecorrected for multiple substitutions. The maximum-likelihood estimate of the ti/tv ratio changes with thespecies included in the analysis. The ti/tv bias within thelemuriform taxa is found to be as strong as in the an-thropoids, in contradiction to an earlier study whichsampled only one lemuriform. Simulations show the sur-prising result that both the pairwise correction methodand the joint likelihood analysis tend to overcorrect formultiple substitutions and overestimate the ti/tv ratio,especially at low sequence divergence. The bias, how-ever, is not large enough to account for the observedpatterns. Nucleotide frequency biases, variation of sub-stitution rates among sites, and different evolutionarydynamics at the three codon positions can be ruled out aspossible causes. The likelihood-ratio test suggests thatthe ti/tv rate ratios may be variable among evolutionarylineages. Without any biological evidence for such avariation, however, we are left with no plausible expla-nations for the observed patterns other than a possiblesaturation effect due to the unrealistic nature of themodel assumed.
Key words: Transition/transversion rate ratio —Maximum likelihood — Species sampling — Saturation— Lemurs — Primates
Introduction
In virtually all DNA sequences from any genome exam-ined, transitions (T↔C, A↔G) have been noted to occurat higher frequencies than transversions (T↔A, T↔G,C↔A, C↔G) (Brown et al. 1982; Gojobori et al. 1982;Curtis and Clegg 1984; Wakeley 1994, 1996). Whiletransition/transversion (ti/tv) bias is known to be a gen-eral property of DNA sequence evolution, it is morepronounced in animal mitochondrial DNAs (mtDNAs)than in nuclear or chloroplast DNAs (for a review seeWakeley 1996). Estimation of the ti/tv rate bias is im-portant not only to our understanding of the patterns ofDNA sequence evolution, but also to reliable estimationof sequence distance and phylogeny reconstruction.
The ti/tv rate ratio has most often been estimated bycounting the proportions of sites with transitional (P) andtransversional (Q) differences between two sequences,that is, byP/Q. A major problem with this approach hasbeen the correlation between the genetic distance and theobserved ti/tv (P/Q). It has been repeatedly noted that atlow levels of genetic divergence, ti/tv appears to be high,and at high levels of genetic divergence, ti/tv appears tobe low. Figure 1 illustrates the pattern in three eutheriangroups. In all three, transition frequencies (P) appear topeak at approximately 15% genetic divergence, where-upon they are gradually matched in frequency by trans-versions as genetic distance increases. At levels of 20%Correspondence to:Ziheng Yang;e-mail: [email protected]
J Mol Evol (1999) 48:274–283
© Springer-Verlag New York Inc. 1999

divergence or more, the two substitution types showequal frequencies, thereby yielding an apparent ti/tv ofapproximately 1. Saturation of transitions at high levelsof genetic divergence is commonly believed to explainthe pattern (e.g., Brown et al. 1982; Moritz et al. 1987).Thus, it has been suggested that the comparison ofclosely related sequences may yield more accurate esti-mates of substitution patterns than will comparisons ofmore divergent sequences (e.g., Purvis and Bromham1997). Unfortunately, there are other confounding fac-tors that limit the power of such comparisons. For ex-ample, there will typically be a huge variance in ob-served ti/tv at low levels of divergence when a limitednumber of sites are examined for sequences with a hightransition bias (Wakeley 1996). Also, there is recent evi-
dence to suggest that different sites can exhibit vastlydifferent ti/tv rate ratios (e.g., Wills 1995). Given thesecaveats, methods that correct for multiple substitutionsshould offer the best option for the accurate determina-tion of the ti/tv rate ratio (Jukes 1987).
A maximum-likelihood approach was used by Ha-segawa et al. (1990) to estimate the rates of transitionsand transversions in primates in an 896-bp segment ofmtDNA that contains parts of two proteins (ND4 andND5) and three tRNA genes (Brown et al. 1982; Hay-asaka et al. 1988). The species sample included thehominoids (human, chimpanzee, gorilla, orangutan, gib-bon), four closely related cercopithecoids (Japanese ma-caque, rhesus macaque, crab-eating macaque, and Bar-bary macaque), one platyrrhine (common squirrel
Fig. 1. Negative correlation between apparent (uncorrected) ti/tv andgenetic divergence in cytochromeb from three mammalian groups.A–C Counts of sites with transitional (open circles) and transversional(filled circles) differences in pairwise comparisons relative to sequencedivergence corrected with the K80 model.Dashed lineindicates thelevel of sequence divergence at which transitions appear to approachsaturation.D–F P/Q, derived from uncorrected pairwise transition andtransversion frequencies. The three data sets are used to show thegenerality of the problem in usingP/Q to estimate ti/tv, but only theprimate data set is analyzed in detail in this paper. Primate cytochromeb sequences used in A and D are specified in Table 1. Species andGenBank accession numbers (in parentheses) for rodent sequencesused in B and E areAcomys cahirinus(Z96051),A. cahirinus(Z96052,Z96053), A. dimidiatus (Z96060, Z96061, Z96062),A. ignitus(Z96063, Z96064),A. russatus(Z96065, Z96066),A. sp. (Z96055,Z96056, Z96057, Z96058, Z96059),A. spinosissimus(Z96068),Musmusculoides(Z96069),Mus musculus(J01420),Ctenomys sociabilis
(U34853),Euryzygomatomys spinosus(U34858),Spermophilus rich-ardsonii (S73150),Thrichomys apereoides(U34854),Trinomys albi-spinis (U34856), andRattus norvegicus(X14848). In Figs. C and Fcetaceans with artiodactyl and perissodactyl outgroups are analyzed.The species names and GenBank accession numbers (in parentheses)are Balaenoptera musculus(X72204),B. acutorostrata(X75753),B.bonaerensis(X75581), B. borealis(X75582), B. edeni(X75583), B.glacialis (X75887),Balaena mysticetus(X75588),Caperea marginata(X75586), Eschrichtius robustus(X75585), Megaptera novaeangliae(X75584), Physeter macrocephalus(X75589), Stenella attenuata(X56294), S. longirostrus(X56292), Halichoerus grypus(X72004),Dugong dugong(U07564), Hippopotamus amphibius(U07565), H.amphibius(Y08813), H. liberiensis (Y08814), Sus scrofa(X56295),Bos taurus(J01394),Camellus dromedarius(X56281), Antilocapraamericana(X56286),Equus grevyi(X56282),F. caballus(X79547),andDiceros bicornis(X56283).
275
monkey),Tarsius(the Philipine tarsier), and one strep-sirrhine (the ring-tailed lemur,Lemur catta). Hasegawaet al.’s maximum-likelihood analysis allowed differenttransition rates and transversion rates in different lin-eages of the phylogeny and found that the transition rateis an order of magnitude lower in the lemur than in thehominoids. The fact that the ring-tailed lemur was theonly representative of the Strepsirrhini to be included inthe study raises a concern: perhaps the extremely lowestimated transition rate is related to the large geneticdivergence that separatesLemurfrom the other primatesincluded in the study. Our study addresses this concernby including mitochondrial sequences from numerousclosely related lemuriforms. When these sequences arecompared, a contradictory pattern emerges. The ti/tv ratebias in the lemuriforms appears to be as pronounced as inthe hominoids.
In Hasegawa et al.’s study, the numbers of transitionaland transversional differences between pairs of se-quences, instead of the original sequence data, were ana-lyzed using a normal approximation. This approximationappears quite good and is unlikely to account for theconflict with our results. Moreover, Hasegawa et al.’sresults are reproduced by our study of a different mito-chondrial gene, cytochromeb, when a similar taxon
sample is examined. The purpose of our paper is to de-scribe the surprising patterns in estimates of the ti/tv rateratios and explore possible causes for the observed pat-terns. Although we can rule out several molecular evo-lutionary factors as the proximal cause of the patterns, abiologically plausible interpretation that is consistentwith the results remains elusive. Clearly more work isnecessary to fully understand the ti/tv rate bias.
Data and Methods
Sequence Data
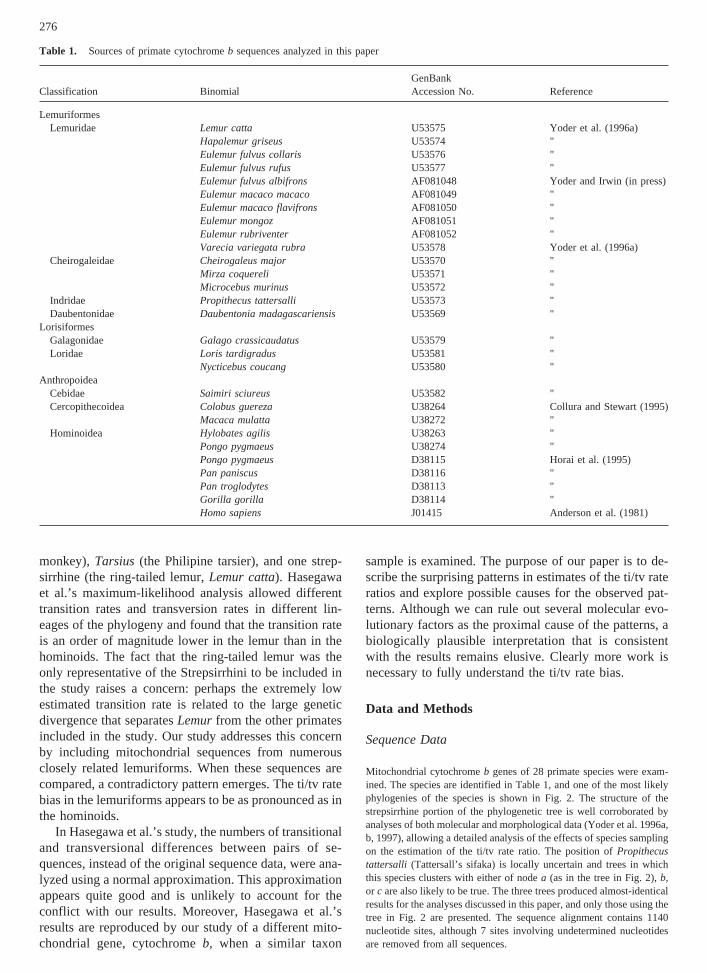
Mitochondrial cytochromeb genes of 28 primate species were exam-ined. The species are identified in Table 1, and one of the most likelyphylogenies of the species is shown in Fig. 2. The structure of thestrepsirrhine portion of the phylogenetic tree is well corroborated byanalyses of both molecular and morphological data (Yoder et al. 1996a,b, 1997), allowing a detailed analysis of the effects of species samplingon the estimation of the ti/tv rate ratio. The position ofPropithecustattersalli (Tattersall’s sifaka) is locally uncertain and trees in whichthis species clusters with either of nodea (as in the tree in Fig. 2),b,or c are also likely to be true. The three trees produced almost-identicalresults for the analyses discussed in this paper, and only those using thetree in Fig. 2 are presented. The sequence alignment contains 1140nucleotide sites, although 7 sites involving undetermined nucleotidesare removed from all sequences.
Table 1. Sources of primate cytochromeb sequences analyzed in this paper
Classification BinomialGenBankAccession No. Reference
LemuriformesLemuridae Lemur catta U53575 Yoder et al. (1996a)
Hapalemur griseus U53574 "Eulemur fulvus collaris U53576 "Eulemur fulvus rufus U53577 "Eulemur fulvus albifrons AF081048 Yoder and Irwin (in press)Eulemur macaco macaco AF081049 "Eulemur macaco flavifrons AF081050 "Eulemur mongoz AF081051 "Eulemur rubriventer AF081052 "Varecia variegata rubra U53578 Yoder et al. (1996a)
Cheirogaleidae Cheirogaleus major U53570 "Mirza coquereli U53571 "Microcebus murinus U53572 "
Indridae Propithecus tattersalli U53573 "Daubentonidae Daubentonia madagascariensis U53569 "
LorisiformesGalagonidae Galago crassicaudatus U53579 "Loridae Loris tardigradus U53581 "
Nycticebus coucang U53580 "Anthropoidea
Cebidae Saimiri sciureus U53582 "Cercopithecoidea Colobus guereza U38264 Collura and Stewart (1995)
Macaca mulatta U38272 "Hominoidea Hylobates agilis U38263 "
Pongo pygmaeus U38274 "Pongo pygmaeus D38115 Horai et al. (1995)Pan paniscus D38116 "Pan troglodytes D38113 "Gorilla gorilla D38114 "Homo sapiens J01415 Anderson et al. (1981)
276

Analytical Methods
Both pairwise and joint likelihood sequence comparisons are per-formed using two nucleotide substitution models. The first, referred toas ‘‘K80’’ (Kimura 1980), is a model of transition–transversion ratebias. The instantaneous substitution rate from nucleotidei to nucleotidej (i Þ j) under this model is
Rij = Ha, for transitionb, for transversion (1)
In a pairwise comparison, the sequence distance is defined asd 4 (a+ 2b)t, wheret is the total time that separates the two sequences (twicethe divergence time). The ti/tv rate ratio is defined ask 4 a/b. In amaximum-likelihood analysis of multiple sequences, the ti/tv rate ratiok is often assumed to be constant among lineages withd used as thebranch length. Both the sequence distance and branch length are mea-sured by the expected number of nucleotide substitutions per site.
Let the proportions of sites in two sequences with transitional andtransversional differences byP andQ, respectively. The sequence dis-tance (d) and the transition/transversion rate ratiok can be estimated asfollows:
d̂ = −1
2log$1 − 2P − Q% −
1
4log$1 − 2Q% (2)
k̂ =2log$1 − 2P − Q%
log$1 − 2Q%− 1
(Kimura 1980; Jukes 1987). These estimates, whenever obtainable, arealso maximum-likelihood estimates.
The second model used in this paper, referred to as ‘‘HKY85’’(Hasegawa et al. 1985), allows for both transition–transversion bias and
unequal nucleotide frequencies. The substitution rate from nucleotideito nucleotidej (i Þ j) is
Rij = Hapj, for transitionbpj, for transversion (3)
where pj is the frequency of nucleotidej. The expected number ofnucleotide substitutions per site during timet (that is, the sequencedistance or branch length) is
d = 2~pTpC + pApG!at + 2pYpRbt (4)
wherepY 4 pT + pC andpR 4 pA + pG. The ti/tv rate ratio is againdefined ask 4 a/b.
It should be noted that several definitions of the ti/tv rate ratio havebeen used in the literature. The definition we use in this paper (k) is theratio of instantaneous transition rate to instantaneous transversion rate(k 4 a/b) or the ratio of the number of transitions to the number oftransversions after accounting for multiple substitutions at the same site(k 4 at/bt); without any transition–transversion bias,k 4 1. It there-fore differs from the ratio of the proportions of transitional to trans-versional differences observed between two sequences (P/Q) as used inmany other studies (e.g., Wakeley 1994). The two measures are verydifferent, as discussed later. Another definition of the ti/tv rate ratio isthe ti/tv rate ratio averaged over the nucleotide frequencies (see, e.g.,Wakeley 1996). This is equal toa/(2b) under the K80 model and(pTpC + pApG)a/(pYpRb) under HKY85.
In a maximum-likelihood analysis of multiple sequences, the ti/tvrate ratiok under either the K80 or HKY85 model is estimated bynumerical optimization, together with the branch lengths in the tree. Amodel that allows for different ti/tv rat ratios among lineages is alsoimplemented. This model uses a separatek parameter (and a branchlength) for each branch in the tree and involves some modifications to
Fig. 2. The phylogenetic tree of the 28 primate species analyzed inthis paper. Thearrow indicates the root of the tree, although unrootedtrees are used in the analyses in this paper. The position ofP. tattersalliis uncertain, and it can be placed to cluster with the nodea (as in thegraph),b, or c. The mitochondrial cytochromeb genes are analyzed by
maximum likelihood assuming the model of Kimura (1980) with adifferent ti/tv rate ratio (k 4 a/b in the notation of Kimura) for eachbranch. Branches are drawn in proportion to their estimated lengths,measured as the number of nucleotide substitutions per site. Estimatesof the ti/tv rate ratios (k) under the model are shown along the branches.
277

the standard likelihood algorithm (Felsenstein 1981). The PAML pro-gram package (Yang 1997) is used for all analyses of this paper, and theDRAWTREE program in the PHYLIP package (Felsenstein 1997) isused to help draw the figures. Because the K80 and HKY85 modelsproduced very similar estimates of the ti/tv rate ratios, results are oftenreported for the K80 model only. Patterns in estimates of the ti/tv rateratios from three analyses are reported: (1) pairwise sequence compari-son, (2) maximum likelihood in a stepwise addition algorithm forwhich more and more distant sequences are added in the tree, and (3)maximum likelihood under a model that allows for different ti/tv ratiosamong evolutionary lineages. We then explore possible causes for theobserved patterns.
Results
Estimates of the Transition/Transversion Rate Ratio(k) in Pairwise Sequence Comparisons
Figure 3 shows the estimated ti/tv rate ratios (k 4 a/b)plotted against the estimated sequence distances underthe K80 model [Eq. (2)]. A total of 378 pairwise com-parisons of the mitochondrial cytochromeb genes fromthe 28 species in Fig. 2 is illustrated. There is a strongnegative correlation between estimates ofd and k. Be-cause the variation at very low levels of sequence diver-gence may be due to sampling errors, there is an almost-perfect functional relationship betweend andk. Notably,the estimates ofk from comparisons within the homi-noids are very similar to those from comparisons withinthe lemuriforms. This result is surprising with respect tothe conclusions of Hasegawa et al. (1990) and suggests
that species sampling may have an effect on the estima-tion of k, as has been problematic for the estimation ofkusingP/Q.
Maximum-Likelihood Estimates of theTransition/Transversion Rate Ratio (k) in the StepwiseAddition Algorithm
We further examine how the maximum-likelihood esti-mate of the ti/tv rate ratio changes with the sampling ofspecies, when the same ti/tv ratio is assumed for all lin-eages (branches) in the tree. An interesting approach forthis purpose is through the stepwise addition algorithm.The algorithm starts from closely related species (such asdifferent hominoids or different lemuriforms), with moreand more divergent species added to the tree in a step-wise manner. Table 2A lists estimates ofk at each stageof the algorithm, which is used to construct the phylog-eny in Fig. 4A, starting with the hominoids and endingwith Lemur catta.The estimate ofk becomes smallerwhen more divergent sequences are added, and changesfrom about 40 for the human–chimpanzee comparison to4 for the entire tree of nine species. The results thereforeseem to suggest a low ti/tv ratio in the lemur and highratios in the hominoids.
Table 2B lists estimates ofk when the stepwise ad-dition algorithm is applied to construct the tree in Fig.4B, in this case starting from the lemurid species, withthe human sequence added last. Again, the estimate ofk
Fig. 3. Estimated transition/transversion rate ratio (k) plotted as afunction of the sequence distance from pairwise comparisons of mito-chondrial cytochromeb genes. The 28 primate species in Fig. 2 areused. No transversional difference is observed (Q 4 0) between thesequences for two eulemur species,E. f. collarisandE. f. rufus,yield-ing ak of infinity, and thus this comparison is not shown in the graph.The model of Kimura (1980) is assumed, with a constant substitutionrate for all sites. (j) Within the 15 lemuriform species; (d) within theseven hominoid species; (s) all other comparisons.
Table 2. Estimates of the transition/transversion rate ratio (k) fromcytochromeb genes during different stages of the stepwise additionalgorithma
Added species K80 HKY85
A. For species in Fig. 4A
1. Human (H. sapiens)2. Chimpanzee (P. troglodytes) 39.98 40.773. Gorilla (G. gorilla) 20.91 21.614. Orangutan (P. pygmaeus) 11.96 12.265. Gibbon (H. agilis) 9.57 9.846. Rhesus macaque (M. mulatta) 6.85 7.087. Squirrel monkey (S. sciureus) 5.14 5.298. Bushbaby (G. crassicaudatus) 4.20 4.319. Ring-tailed lemur (L. catta) 4.24 4.35
B. For species in Fig. 4B
1. Eulemur (E. f. collaris)2. Eulemur (E. mongoz) 46.05 46.763. Ring-tailed lemur (L. catta) 12.43 12.714. Red ruffed lemur (V. v. rubra) 9.93 10.195. Dwarf lemur (C. major) 6.86 7.056. Aye aye (D. madagascariensis) 5.60 5.757. Bushbaby (G. crassicaudatus) 4.56 4.678. Squirrel monkey (S. sciureus) 4.04 4.149. Human (H. sapiens) 3.78 3.87
a Species in the trees in Figs. 4A (A) and 4B (B) are added into the treein a stepwise manner, and a singlek parameter is assumed and esti-mated by maximum likelihood for all branches in the subtree at eachstage of the algorithm.
278

becomes smaller with the addition of more divergentsequences, changing from 46 for the comparison of twoEulemurspecies to 3.8 for the entire tree. In contradic-tion to the results in Table 2A, the estimates seem tosuggest that the ti/tv rate ratio may be high in the lemursand low in the anthropoids.
Estimation of the Transition/Transversion Rate Ratiosfor Different Lineages
To test for the possibility that the ti/tv rate bias variesamong the different primate lineages, we use a modelthat assumes different ti/tv rate ratios for differentbranches and apply it to the data in Figs. 4A and B.Estimates of the ti/tv rate ratios (k) under this model arelisted along branches of the trees. Since the model as-suming a single ti/tv rate ratio is a special case of themodel assuming variable ti/tv rate ratios, the likelihood-ratio test can be applied to compare the two models. Thelog-likelihood value under a model measures the model’sfit to data. Because of the additional parameters, themodel with variable ti/tv ratios among lineages is ex-pected to fit the data better and have a higher log-likelihood value than the model assuming a single ti/tvratio. However, the improvement in the log-likelihoodvalue by relaxing the assumption of constancy of the ti/tvratio will not be statistically significant if the single-ratiomodel provides an adequate fit to the data. For the tree inFig. 4A, the log-likelihood value under the model withvariable ti/tv ratios among branches isl1 4 −6548.77,
while the model assuming a single ratio for the entire treehas log-likelihood valuel0 4 −6464.75. The variable-ratio model involves 30 parameters, with 2 parameters(lengthd and ti/tv ratiok) for each of the 15 branches inthe tree, while the constant-ratio model has 16 param-eters (15 branch lengths and 1k). Twice the log-likelihood difference, 2Dl 4 2(l1 − l0) 4 168.04, shouldbe compared withx2 4 29.1 with df4 14 (30 − 16) atthe 1% significance level. The two models are signifi-cantly different, with different ti/tv ratios amongbranches being preferred.
The species included in the tree in Fig. 4A are similarto those analyzed by Hasegawa et al. (1990), althoughthose authors used a different segment of the mitochon-drial genome. Even so, the estimates of ti/tv rate ratios inFig. 4A agree with Hasegawa et al.’s (1990) results. Theti/tv ratios in the hominoids, especially in humans andchimpanzees, appear to be much higher than those in themore-divergent outgroup species such as the lemur andthe Old World and New World monkeys.
For the tree in Fig. 4B, the log-likelihood values underthe variable-ratio and constant-ratio models arel1 4−6605.68 andl0 4 −6667.57, respectively, with 2Dl 42(l1 − l0) 4 123.78. The results again indicate that ti/tvrate ratios are significantly different among branches.However, estimates of the ti/tv ratios for branches of thistree under the variable-ratio model show a reversed pat-tern to that in Fig. 4A, with ti/tv rate ratios appearing tobe much higher in the lemurs than in the hominoids(human).
The model of variable ti/tv rate ratios among lineages
Fig. 4. Maximum-likelihood estimates of ti/tv (k) for differentbranches in two phylogenetic trees of subsets of primate species in Fig.2. The K80 model is assumed to analyze the mitochondrial cytochromeb genes, with a different ti/tv rate ratio assumed for each branch in the
tree.A Many anthropoid species are used with two strepsirrhine species(G. crassicaudatusand L. catta) as outgroups.B Many strepsirrhinespecies are used with two anthropoid species (S. sciureusand H. sa-piens) as outgroups.
279
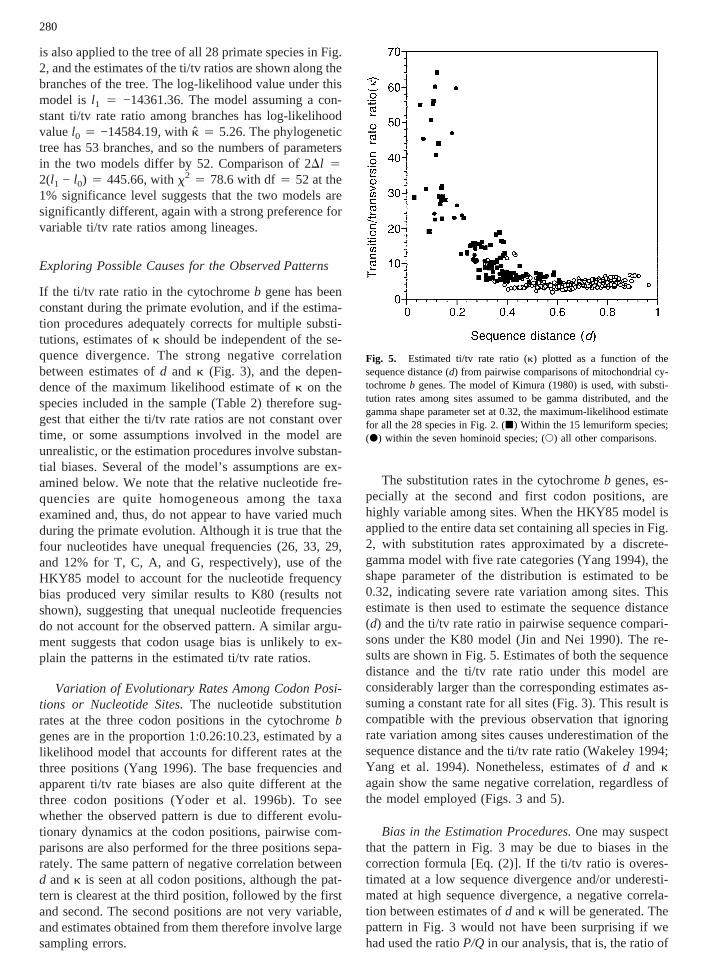
is also applied to the tree of all 28 primate species in Fig.2, and the estimates of the ti/tv ratios are shown along thebranches of the tree. The log-likelihood value under thismodel is l1 4 −14361.36. The model assuming a con-stant ti/tv rate ratio among branches has log-likelihoodvaluel0 4 −14584.19, withk̂ 4 5.26. The phylogenetictree has 53 branches, and so the numbers of parametersin the two models differ by 52. Comparison of 2Dl 42(l1 − l0) 4 445.66, withx2 4 78.6 with df4 52 at the1% significance level suggests that the two models aresignificantly different, again with a strong preference forvariable ti/tv rate ratios among lineages.
Exploring Possible Causes for the Observed Patterns
If the ti/tv rate ratio in the cytochromeb gene has beenconstant during the primate evolution, and if the estima-tion procedures adequately corrects for multiple substi-tutions, estimates ofk should be independent of the se-quence divergence. The strong negative correlationbetween estimates ofd and k (Fig. 3), and the depen-dence of the maximum likelihood estimate ofk on thespecies included in the sample (Table 2) therefore sug-gest that either the ti/tv rate ratios are not constant overtime, or some assumptions involved in the model areunrealistic, or the estimation procedures involve substan-tial biases. Several of the model’s assumptions are ex-amined below. We note that the relative nucleotide fre-quencies are quite homogeneous among the taxaexamined and, thus, do not appear to have varied muchduring the primate evolution. Although it is true that thefour nucleotides have unequal frequencies (26, 33, 29,and 12% for T, C, A, and G, respectively), use of theHKY85 model to account for the nucleotide frequencybias produced very similar results to K80 (results notshown), suggesting that unequal nucleotide frequenciesdo not account for the observed pattern. A similar argu-ment suggests that codon usage bias is unlikely to ex-plain the patterns in the estimated ti/tv rate ratios.
Variation of Evolutionary Rates Among Codon Posi-tions or Nucleotide Sites.The nucleotide substitutionrates at the three codon positions in the cytochromebgenes are in the proportion 1:0.26:10.23, estimated by alikelihood model that accounts for different rates at thethree positions (Yang 1996). The base frequencies andapparent ti/tv rate biases are also quite different at thethree codon positions (Yoder et al. 1996b). To seewhether the observed pattern is due to different evolu-tionary dynamics at the codon positions, pairwise com-parisons are also performed for the three positions sepa-rately. The same pattern of negative correlation betweend andk is seen at all codon positions, although the pat-tern is clearest at the third position, followed by the firstand second. The second positions are not very variable,and estimates obtained from them therefore involve largesampling errors.
The substitution rates in the cytochromeb genes, es-pecially at the second and first codon positions, arehighly variable among sites. When the HKY85 model isapplied to the entire data set containing all species in Fig.2, with substitution rates approximated by a discrete-gamma model with five rate categories (Yang 1994), theshape parameter of the distribution is estimated to be0.32, indicating severe rate variation among sites. Thisestimate is then used to estimate the sequence distance(d) and the ti/tv rate ratio in pairwise sequence compari-sons under the K80 model (Jin and Nei 1990). The re-sults are shown in Fig. 5. Estimates of both the sequencedistance and the ti/tv rate ratio under this model areconsiderably larger than the corresponding estimates as-suming a constant rate for all sites (Fig. 3). This result iscompatible with the previous observation that ignoringrate variation among sites causes underestimation of thesequence distance and the ti/tv rate ratio (Wakeley 1994;Yang et al. 1994). Nonetheless, estimates ofd and kagain show the same negative correlation, regardless ofthe model employed (Figs. 3 and 5).
Bias in the Estimation Procedures.One may suspectthat the pattern in Fig. 3 may be due to biases in thecorrection formula [Eq. (2)]. If the ti/tv ratio is overes-timated at a low sequence divergence and/or underesti-mated at high sequence divergence, a negative correla-tion between estimates ofd andk will be generated. Thepattern in Fig. 3 would not have been surprising if wehad used the ratioP/Q in our analysis, that is, the ratio of
Fig. 5. Estimated ti/tv rate ratio (k) plotted as a function of thesequence distance (d) from pairwise comparisons of mitochondrial cy-tochromeb genes. The model of Kimura (1980) is used, with substi-tution rates among sites assumed to be gamma distributed, and thegamma shape parameter set at 0.32, the maximum-likelihood estimatefor all the 28 species in Fig. 2. (j) Within the 15 lemuriform species;(d) within the seven hominoid species; (s) all other comparisons.
280

the proportions of transitional and transversional differ-ences between two sequences. A strong negative corre-lation betweenP/Q and d indeed exists for these data(Fig. 1D), and saturation of transitions at a high sequencedivergence is clearly a very important cause. However,the bias in the estimate ofk from the method of Kimura(1980) and Jukes (1987), which corrects for multiplehits, is less clear.
Computer simulations are thus performed to examinethe bias in the estimate of the ti/tv ratio by both Kimura’scorrection [Eq. (2)] andP/Q. Figure 6 shows estimates ofk in pairwise sequence comparisons when the truek isfixed at either 10 or 40. The performance of the twomeasures are very different. The ratioP/Q always un-derestimates the ti/tv rate ratio and decreases veryquickly with the increase in the sequence divergence,approaching 1/2 irrespective of the true ti/tv rate ratio.Saturation of transitions is clearly the major reason forthe negative correlation betweenP/Q and d. However,the bias in the estimate ofk by Eq. (2) appears always tobe positive; that is, Kimura’s formula always overcor-rects for multiple transitions at the same site and thusoverestimates the ti/tv rate ratio. The overestimation isnegligible at a high sequence divergence but is substan-tial at a low divergence. Note that simulation results arenot obtained for very low sequence divergences in Fig. 6,although they are commonplace in our analysis of thereal data (Fig. 3), indicating that the overestimation maybe more serious than the results in Fig. 6 suggest.
Simulations were also performed to examine the bias
in the likelihood method applied to multiple sequences,which should be even more tolerant of multiple substi-tutions than pairwise comparison. In one simulation, se-quences of 1000 sites are generated from an unrootedmodel tree of five species. All seven branch lengths areset at 0.5 substitution per site, so that the tree length (thetotal number of substitutions per site on the tree) is 3.5.The K80 model is assumed, withk fixed at 50. At thislevel of sequence divergence, the pairwise distance for-mula [Eq. (2)] is inapplicable in almost every simulateddata set. The average of the maximum-likelihood esti-mate ofk over 500 replicates is 50.8, with a very slightpositive bias. Even at such a high sequence divergence,saturation of transitions is not a problem. When the sevenbranches of the tree are all shortened to 0.02, so that thetree length is 0.14, the average of the estimate ofk is66.7, with a much larger bias. Thus, both pairwise com-parison and likelihood joint analysis tend to overcorrectfor multiple transitions at the same site and overestimatek, particularly at a low sequence divergence. The bias isalso greater when the true ti/tv ratio (k) is higher andwhen the sequences are shorter (results not shown).
Overestimation ofk at a low sequence divergence hasclearly contributed to the negative correlation betweenestimates ofd andk seen in Fig. 3. However, the bias ofthe estimation method cannot fully account for the pat-tern. If the observed pattern were due to the bias in themethod, reliable estimates ofk would be those at highlevels of sequence divergence, according to the simula-tion results discussed above, that is, ak of about 2–3(Fig. 3). With such a low ti/tv rate ratio, however, thebias in Kimura’s correction would be very small (Fig. 6)and could not possibly create such large estimates ofk as40 (Fig. 3).
Variable ti/tv Rate Ratios Among Evolutionary Lin-eages.Results in Table 2 and, in particular, the likeli-hood ratio tests of Figs. 2 and 4A and B suggest that theti/tv rate ratios may be variable among evolutionary lin-eages. If the transition and transversion rates are indeedvariable among lineages, the pattern in Fig. 3 may beexplained by estimates of the branch lengths and ti/tvrate ratios for branches shown in Fig. 2.
Suppose that the transition and transversion rates dur-ing time t1 area1 andb1, respectively, and the transitionand transversion rates during timet2 area2 andb2. It iseasy to show (see Appendix) that the ti/tv rate ratio dur-ing the entire time period (t1 + t2) is (a1t1 + a2t2)/(b1t1 +b2t2). This result applies to both pairwise comparison ora branch in the phylogenetic tree in a likelihood analysis.If the real ti/tv ratio varies over time but a constant ratiois assumed for estimation, the resulting estimate will bean ‘‘average’’ of the ratios over the entire time period.This result can be used to calculate the expected ti/tv rateratios for pairwise comparisons using the estimates inFig. 2. For example, estimates ofat along the 14branches in the tree in Fig. 2 linking the ring-tailed lemur
Fig. 6. Average, among 1000 simulated replicates, of pairwise esti-mates of the ti/tv rate ratio by Eq. 2 (k̂ for filled symbols) and byP/Q(open symbols) as functions of the true sequence distance. The K80model is used to simulate data sets of pairs of sequences. The true ti/tvrate ratio isk 4 10 (squares) and 40 (circles). The sequence length is1000. Simulation results at very low sequence divergence (d < 0.04 fork 4 10 andd < 0.1 for k 4 40) are not presented because Eq. (2) issometimes inapplicable and excluding the inapplicable cases wouldbias results. Inapplicable cases also occur at a very high sequencedivergence.
281
to human are 0.0573, 0.0292, 0.0208, 0.0057, 0.0150,0.0252, 0.0091, 0.0203, 0.0074, 0.0064, 0.0148, 0.0022,0.0107, and 0.0638, with a sum of 0.2878 transitions persite. The corresponding estimates ofbt are 0.0031,0.0027, 0.0014, 0.0048, 0.0042, 0.0151, 0.0103, 0.0180,0.0200, 0.0084, 0.0021, 0.0050, 0.0022, and 0.0027, withthe sum to be 0.1000 (which means 0.2 transversions persite between the two sequences). The estimate ofk 4a/b for the pairwise comparison (assuming a constantti/tv rate ratio) is expected to be 0.2878/0.10004 2.88.This value is close to 2.56, the estimate from Eq. (2) forthe pairwise comparison of the two sequences. The av-erage of the ti/tv ratios (k) across the 14 branches (Fig. 2)is 6.41.
Furthermore, estimates of the ti/tv ratios amongbranches shown in Fig. 2 suggest the unexpected con-clusion that the ti/tv ratios are small near the root of theprimate phylogeny. In particular, several long interiorbranches near the root are all characterized by low ti/tvrate ratios. This pattern, together with the overestimationof the ti/tv rate ratio at low sequence divergence, willcreate a strong negative correlation between estimates ofthe ti/tv rate ratio and sequence distance.
Discussion
The dependence of the estimate of the ti/tv rate ratio onthe sampled species in either pairwise comparison orjoint likelihood analysis is more complex than has beenpreviously considered. Likelihood-ratio tests suggest thatthe ti/tv rate ratios may be variable among evolutionarylineages. This variation, together with the overestimationof the ti/tv rate ratio at low sequence divergence, appearssufficient to account for the observed patterns. Even so,the hypothesis of changing ti/tv rate ratios, as either asubstitutional or mutational dynamic, is difficult to sub-stantiate. Maximum-likelihood estimates of synony-mous/nonsynonymous rate ratios for branches in the treein Fig. 2 (obtained from an extension of the model ofGoldman and Yang 1994) are not correlated with esti-mates of the ti/tv rate ratios, suggesting that variation ofselectional constraints is probably unlikely to explain thevariable ti/tv ratios among lineages. It is also unlikelythat mutation rates could have varied so drastically onthe phylogenetic scale represented by the primates. Al-though the patterns in Figs. 3 and 5 appear compatiblewith the expectation of saturation at high sequence di-vergence and/or even more substantial overcorrection ata low sequence divergence, such biases in the estimationprocedure are unlikely to explain the observed patternwhich is at a much greater scale. Nucleotide frequencybias and variable evolutionary rates among sites and atthe three codon positions can be ruled out as possibleexplanations. It seems, therefore, that the pattern is dueto some unknown factor that has not been considered inour models. The models (K80 or HKY85) used in this
paper are simple and may not capture the complexities ofcytochromeb evolution. Moreover, it is not clear whichaspects of the evolutionary process that have not beenaccounted for in the models might have caused the ob-served patterns. This emphasizes the need for continuedexploration of the multiple factors that affect sequenceevolution.
The overcorrection of multiple transitions at the samesite by Kimura’s formula (or the maximum-likelihoodmethod in general) at a low sequence divergence is anunexpected result and may have important implications.Most significantly, it suggests that assessing rate param-eters from recently diverged taxa may bias conclusionsin favor of overestimation of transition rates.
Acknowledgments. We Thank Joe Felsenstein, Paul Lewis, MagnusNordborg, Bruce Rannala, Jeff Thorne, and John Wakeley for helpfuldiscussions and comments. A.D.Y. was supported by NSF Grant DEB-9303313.
References
Anderson SA, Bankier T, Barrell BG, et al. (1981) Sequence and or-ganization of the human mitochondrial genome. Nature 290:457–465
Brown WM, Prager EM, Wang A, Wilson AC (1982) MitochondrialDNA sequences of primates, tempo and mode of evolution. J MolEvol 18:225–239
Collura RV, Stewart C-B (1995) Insertions and duplications of mtDNAin the nuclear genomes of Old World monkeys and hominoids.Nature 378:485–489
Curtis SE, Clegg MT (1984) Molecular evolution of chloroplast DNAsequences. Mol Biol Evol 1:291–301
Felsenstein J (1981) Evolutionary trees from DNA sequences: a maxi-mum likelihood approach. J Mol Evol 17:368–376
Felsenstein J (1997) PHYLIP (phylogeny inference package), Version4.0. University of Washington, Seattle
Gojobori T, Li W-H, Graur D (1982) Patterns of nucleotide substitutionin pseudogenes and functional genes. J Mol Evol 18:360–369
Goldman N, Yang Z (1994) A codon-based model of nucleotide sub-stitution for protein-coding DNA sequences. Mol Biol Evol 11:725–736
Hasegawa M, Kishino H, Yano T (1985) Dating the human-ape split-ting by a molecular clock of mitochondrial DNA. J Mol Evol 22:160–174
Hasegawa M, Kishino H, Hayasaga K, Horai S (1990) MitochondrialDNA evolution in primates: transition rate has been extremely lowin the lemur. J Mol Evol 31:113–121
Hayasaga K, Gojobori T, Horai S (1988) Molecular phylogeny andevolution of primate mitochondrial DNA. Mol Biol Evol 5:626–644
Horai S, Hayasaka K, Kondo R, Tsugane K, Takahata N (1995) RecentAfrican origin of modern humans revealed by complete sequencesof hominoid mitochondrial DNAs. Proc Natl Acad Sci USA 92:532–536
Jin L, Nei M (1990) Limitations of the evolutionary parsimony methodof phylogenetic analysis. Mol Biol Evol 7:82–102
Jukes TH (1987) Transitions, transversions, and the molecular clock. JMol Evol 26:87–98
Kimura M (1980) A simple method for estimating evolutionary rates ofbase substitutions through comparative studies of nucleotide se-quences. J Mol Evol 16:111–120
282

Moritz C, Dowling TE, Brown WM (1987) Evolution of animal mito-chondrial DNA: Relevance for population biology and systematics.Annu Rev Ecol Syst 18:269–292
Purvis A, Bromham L (1997) Estimating the transition/transversionratio from independent pairwise comparisons with an assumed phy-logeny. J Mol Evol 44:112–119
Wakeley J (1994) Substitution rate variation among sites and the esti-mation of transition bias. Mol Biol Evol 11:436–442
Wakeley J (1996) The excess of transitions among nucleotide substi-tutions: New methods of estimating transition bias underscore itssignificance. TREE 11:158–163
Wills C (1995) When did Eve live? An evolutionary detective story.Evolution 49:593–607
Yang Z (1994) Maximum likelihood phylogenetic estimation fromDNA sequences with variable rates over sites: approximate meth-ods. J Mol Evol 39:306–314
Yang Z (1996) Maximum likelihood models for combined analyses ofmultiple sequence data. J Mol Evol 42:587–596
Yang Z (1997) Phylogenetic analysis by maximum likelihood (PAML),Version 1.3. University of California, Berkeley
Yang Z, Goldman N, Friday AE (1994) Comparison of models fornucleotide substitution used in maximum likelihood phylogeneticestimation. Mol Biol Evol 11:316–324
Yoder AD (1997) Back to the future: a synthesis of strepsirrhine sys-tematics. Evol Anthropol 6:11–22
Yoder AD, Irwin JA (1999) Phylogeny of the Lemuridae: Effects oftaxon and character sampling on resolution of species relationshipswith Eulemur. Cladistics (in press)
Yoder AD, Cartmill M, Ruvolo M, Smith K, Vilgalys R (1996a) An-cient single origin for malagasy primates. Proc Natl Acad Sci USA93:5122–5126
Yoder AD, Vilgalys R, Ruvolo M (1996b) Molecular evolutionarydynamics of cytochrome b in strepsirrhine primates: The phyloge-netic significance of third position transversions. Mol Biol Evol13:1339–1350
Appendix. Estimation of the Transition/Transversion Rate Ratio When the Ratio VariesOver Time
The substitution rate matrixR 4 { Rij} [Eq. (3)] under the HKY85model (Hasegawa et al. 1985) can be written as
wherepY 4 pT + pC and pR 4 pA + pG, and the nucleotides areordered T, C, A, and G. The diagonals are determined by the math-ematical requirement that sums of rows of the matrix are all zero. Theeigenvalues and eigenvectors ofR are obtained by Hasegawa et al.(1985), so that the matrix can be diagonalized as follows:
R = U L U−1 (A2)
L 4 diag{0, −b, −(apR + bpY), −(apY + bpR)} is a diagonal matrixwith the diagonals to be the eigenvalues ofR and the off-diagonals tobe zero.
U = 31 1/pY 0 pC/pY
1 1/pY 0 −pT/pY
1 −1/pR pG/pR 0
1 −1/pR −pA /pR 04 (A3)
is a matrix of the corresponding right eigenvectors, and
U−1 = 3pT pC pA pG
pTpR pCpR −pApY −pGpY
0 0 1 1
1 −1 0 04 (A4)
is the inverse ofU; that is,U U−1 4 U−1 U 4 I, the identity matrix.Note that matricesU andU−1 are functions of the nucleotide frequen-cies only, independent of the transition and transversion rates,a andb.We assume that nucleotide frequencies do not change over time, andonly the transition and transversion rates are variable.
Since time and rate are confounded, the transition probability ma-trix over time t is a function ofat andbt only. Let this beM(at, bt).Thus
M~at, bt! = exp~Rt! = U exp~Lt! U−1
= U diag$1, exp$−bt%, exp$−~apR + bpY!t%,
exp$−~apY + bpR!t%% U−1 (A5)
Suppose that the transition and transversion rates area1 and b1
during timet1, anda2 andb2 during timet2. The transition probabilitymatrix over the entire time period (t1 + t2) is easily shown to be
M~a1t1, b1t1! × M~a2t2, b2t2! = M~a1t1 + a2t2, b1t1 + b2t2!(A6)
The statistical behavior of the sequence data when the transition andtransversion rates area1 andb1 during timet1 anda2 andb2 duringtime t2 is determined by two parameters only: (a1t1 + a2t2) and (b1t1 +
b2t2). If a constant ti/tv rate bias is assumed while in fact the ratio isvariable, we will obtain the correct estimate of the sequence distancefor the entire period, but the ti/tv rate ratio will be estimated as (a1t1 +a2t2)/(b1t1 + b2t2). The result applies to the K80 model too since K80is a special case of HKY85.
R = 3−~apC + bpR! apC bpA bpG
apT −~apT + bpR! bpA bpG
bpT bpC −~apG + bpY! apG
bpT bpC apA −~apA + bpY!4 (A1)
283