ESTIMATION OF MELOXICAM IN HUMAN PLASMA BY LIQUID CHROMATOGRAPHYTANDEM MASS SPECTROMETRY (LC-MS/ MS)
15
This article was downloaded by: [Hanyang University] On: 21 March 2013, At: 20:14 Publisher: Taylor & Francis Informa Ltd Registered in England and Wales Registered Number: 1072954 Registered office: Mortimer House, 37-41 Mortimer Street, London W1T 3JH, UK Journal of Liquid Chromatography & Related Technologies Publication details, including instructions for authors and subscription information: http://www.tandfonline.com/loi/ljlc20 ESTIMATION OF MELOXICAM IN HUMAN PLASMA BY LIQUID CHROMATOGRAPHY- TANDEM MASS SPECTROMETRY (LC-MS/ MS) Mani Ganesh a , Pushparaj Hemalatha a , Mei Mei Peng a , Kalaimani Sakthimanigandan b & Hyun Tae Jang a a Department of Chemical Engineering, Hanseo University, Chungcheongnam-do, South Korea b Alkem Lab Ltd., Navi Mumbai, Maharashtra, India Accepted author version posted online: 19 Jun 2012.Version of record first published: 21 Mar 2013. To cite this article: Mani Ganesh , Pushparaj Hemalatha , Mei Mei Peng , Kalaimani Sakthimanigandan & Hyun Tae Jang (2013): ESTIMATION OF MELOXICAM IN HUMAN PLASMA BY LIQUID CHROMATOGRAPHY- TANDEM MASS SPECTROMETRY (LC-MS/MS), Journal of Liquid Chromatography & Related Technologies, 36:7, 867-880 To link to this article: http://dx.doi.org/10.1080/10826076.2012.678453 PLEASE SCROLL DOWN FOR ARTICLE Full terms and conditions of use: http://www.tandfonline.com/page/terms-and-conditions This article may be used for research, teaching, and private study purposes. Any substantial or systematic reproduction, redistribution, reselling, loan, sub-licensing, systematic supply, or distribution in any form to anyone is expressly forbidden. The publisher does not give any warranty express or implied or make any representation that the contents will be complete or accurate or up to date. The accuracy of any instructions, formulae, and drug doses should be independently verified with primary sources. The publisher shall not be liable for any loss, actions, claims, proceedings, demand, or costs or damages whatsoever or howsoever caused arising directly or indirectly in connection with or arising out of the use of this material.
Transcript of ESTIMATION OF MELOXICAM IN HUMAN PLASMA BY LIQUID CHROMATOGRAPHYTANDEM MASS SPECTROMETRY (LC-MS/ MS)

This article was downloaded by: [Hanyang University]On: 21 March 2013, At: 20:14Publisher: Taylor & FrancisInforma Ltd Registered in England and Wales Registered Number: 1072954 Registeredoffice: Mortimer House, 37-41 Mortimer Street, London W1T 3JH, UK
Journal of Liquid Chromatography &Related TechnologiesPublication details, including instructions for authors andsubscription information:http://www.tandfonline.com/loi/ljlc20
ESTIMATION OF MELOXICAM IN HUMANPLASMA BY LIQUID CHROMATOGRAPHY-TANDEM MASS SPECTROMETRY (LC-MS/MS)Mani Ganesh a , Pushparaj Hemalatha a , Mei Mei Peng a , KalaimaniSakthimanigandan b & Hyun Tae Jang aa Department of Chemical Engineering, Hanseo University,Chungcheongnam-do, South Koreab Alkem Lab Ltd., Navi Mumbai, Maharashtra, IndiaAccepted author version posted online: 19 Jun 2012.Version ofrecord first published: 21 Mar 2013.
To cite this article: Mani Ganesh , Pushparaj Hemalatha , Mei Mei Peng , Kalaimani Sakthimanigandan& Hyun Tae Jang (2013): ESTIMATION OF MELOXICAM IN HUMAN PLASMA BY LIQUID CHROMATOGRAPHY-TANDEM MASS SPECTROMETRY (LC-MS/MS), Journal of Liquid Chromatography & Related Technologies,36:7, 867-880
To link to this article: http://dx.doi.org/10.1080/10826076.2012.678453
PLEASE SCROLL DOWN FOR ARTICLE
Full terms and conditions of use: http://www.tandfonline.com/page/terms-and-conditions
This article may be used for research, teaching, and private study purposes. Anysubstantial or systematic reproduction, redistribution, reselling, loan, sub-licensing,systematic supply, or distribution in any form to anyone is expressly forbidden.
The publisher does not give any warranty express or implied or make any representationthat the contents will be complete or accurate or up to date. The accuracy of anyinstructions, formulae, and drug doses should be independently verified with primarysources. The publisher shall not be liable for any loss, actions, claims, proceedings,demand, or costs or damages whatsoever or howsoever caused arising directly orindirectly in connection with or arising out of the use of this material.

ESTIMATION OF MELOXICAM IN HUMAN PLASMA BYLIQUID CHROMATOGRAPHY-TANDEM MASS SPECTROMETRY(LC-MS/MS)
Mani Ganesh,1 Pushparaj Hemalatha,1 Mei Mei Peng,1
Kalaimani Sakthimanigandan,2 and Hyun Tae Jang1
1Department of Chemical Engineering, Hanseo University, Chungcheongnam-do,South Korea2Alkem Lab Ltd., Navi Mumbai, Maharashtra, India
& A simple, rapid, selective, and sensitive liquid chromatography-tandem mass spectrometry(LC-MS=MS) method has been developed for estimation of meloxicam (MX) in human plasmausing hypersil gold column (C18, 10 cm x 4.6mm i.d, 5 lm), methanol: Milli-Q-water: formic acid(70:30:1 v=v) as mobile phase and piroxicam (PX) as an internal standard. Samples wereextracted using liquid–liquid extraction. The concentration of MX was determined by isocraticHPLC-MS=MS in multiple reaction monitoring (MRM) mode. The mass transition ion-pair forMX was m=z 352.0!115.0 and 331.8! 94.8 for PX. The proposed method was linear in therange of 10.090–3002.964 ng=mL for MX. The intra- and inter-run precision values are within12.82% for MX at a lower limit of quantitation (LLOQ) level. The overall recovery for PX was60.81% with a total runtime of 3min.
Keywords human plasma, LC-MS=MS, meloxicam, MRM-mode, piroxicam, validation
INTRODUCTION
Meloxicam (MX) (4-Hydroxy-2-methyl-N-(5-methyl-2-thiazolyl)-2H-1,2-benzothiazine-3-carboxamide-1,1-dioxide) and the internal standard (IS),piroxicam (PX) (3E)-3-[hydroxy-(pyridin-2-ylamino)methylidene]-2-methyl-1,1-dioxo-1k6,2-benzothiazin-4-one (Figure 1a and b) belongs tothe class of nonsteroidal anti-inflammatory drug category (NSAID). MXhas low ulcerogenic potency and gastric irritation when compared withother NSAID’s.[1] MX binds strongly to serum albumin (>99%) and rea-ches a maximum concentration at 4.5 hr after oral administration. MX is
Address correspondence to Hyun Tae Jang, Department of Chemical Engineering, HanseoUniversity, 360 Daegok-ri, Haemi-myun, Season-si 360-706, Chungcheongnam-do, South Korea. E-mail:[email protected]
Journal of Liquid Chromatography & Related Technologies, 36:867–880, 2013Copyright # Taylor & Francis Group, LLCISSN: 1082-6076 print/1520-572X onlineDOI: 10.1080/10826076.2012.678453
Journal of Liquid Chromatography & Related Technologies, 36:867–880, 2013Copyright # Taylor & Francis Group, LLCISSN: 1082-6076 print/1520-572X onlineDOI: 10.1080/10826076.2012.678453
Dow
nloa
ded
by [
Han
yang
Uni
vers
ity]
at 2
0:14
21
Mar
ch 2
013

metabolized extensively in the liver into four pharmacologically inactivemetabolites that are excreted through urine and feces[2] with a absolutebioavailability of 89%.[3]
Methods such as UV-spectrophotometric,[4–6] stability indicating assayby spectrophotometric,[7] flow injection spectrophotometric,[8] fluorimet-ric,[9] colorimetric,[10] flow injection chemiluminescence,[11] sequentialinjection spectrophotometric,[12] high performance liquid chromato-graphy (HPLC) by UV detection,[13,14] capillary zone electrophoresis,[15]
polarographic,[16,17] and electrochemical reduction method[18] werereported for estimation of MX in individual or combined formulation.HPLC[19] and some LC-MS=MS[20–22] were reported for its estimation ina biological matrix either individually or simultaneously with other oxicamderivatives. Among the aforementioned methods of estimation for MX inbiological matrix, HPLC method has low sensitivity due to its high linearrange, which is unsuitable for estimating the nanogram (ng) level of MXwhile the LC-MS=MS methods are sensitive enough to estimate MX in nglevel. Though the LC-MS=MS methods are advantageous, it suffers draw-backs such as (i) high injection volume (20 mL), inherently using acetoni-trile (ACN) as one of the organic phase (about 80% in total volume),which is expensive, as well as potentially hazards organic solvent, use of
FIGURE 1 (a) Structure of Meloxicam and (b) Piroxicam.
868 M. Ganesh et al.
Dow
nloa
ded
by [
Han
yang
Uni
vers
ity]
at 2
0:14
21
Mar
ch 2
013

guard column and high plasma volume for sample preparation;[21] and (ii)high injection volume (5mL), high ammonium formate concentration(15 mM), and a less commonly available instrumentation which is costly.[22]
Both the methods are also time consuming as the total run time is about6 min, that is, retention time (RT) for both MX and PX is about3.8 min[21] and in the latter method the RT of MX and PX is 4.7 min and3.3 min, respectively.
Our present work describes a simple, rapid, sensitive, and selectivemethod for the determination of MX using commonly available LC-MS=MS system. The current method offers a number of advantages over exist-ing methods: shorter run time, less sample volume, simple sample clean upprocedure and cost effectiveness. This method can be applied to pharma-cokinetic study of plasma MX concentration after oral administration.
EXPERIMENTAL
Chemicals and Reagents
The reference standard of MX and PX was obtained from Aldrich(Gmbh, Germany). High purity water was obtained from Milli-Q-water puri-fication unit (Millipore, Hong Kong). HPLC grade ethyl acetate (EA),formic acid and methanol were purchased from Aldrich (Korea). tert-Butylmethyl ether (TBME); N,N-dimethyl acetamide (DMAc), hydrochloric acidanalytical reagent grade, and dichloromethane (DCM) were purchasedfrom Acros organics (Korea). Drug free (Blank) human plasma with antico-agulant disodium EDTA were obtained from local blood bank and wasstored at�20�C prior to use.
Preparation of Standards and Quality Control (QC) Solutions
A standard stock solution of MX was prepared by dissolving an accu-rately weighed MX in DMAc and made up the volume with methanol to givefinal concentration of 1000mg=mL in the volumetric flask. The solution wasthen further diluted to achieve standard working solutions of desired con-centrations. IS working solution (1000 mg=mL) was prepared by dissolvingin DCM and made up the volume with methanol. All the working solutionswere kept refrigerated (4�C) and brought to room temperature before use.
Preparation of Calibration Curve (CC) Standard and QCStardards
The standard solutions were used to spike in 100 mL blank plasmasamples either for CC or QC standards of MX during the validation. CC
Estimation of Meloxicam by LC-MS=MS 869
Dow
nloa
ded
by [
Han
yang
Uni
vers
ity]
at 2
0:14
21
Mar
ch 2
013

standards were prepared in plasma with the following concentrations:10.090, 20.179, 100.960, 252.249, 630.622, 1261.244, 2102.074, and3002.964 ng=mL while QC samples were prepared with blank plasma atlower limits of quantification (LLOQ), low, medium and high concentra-tions of 10.234, 28.828, 1441.422, and 2402.371 ng=mL for MX.
Preparation of Plasma Samples
Frozen plasma samples were thawed at room temperature andthoroughly vortexed prior to extraction. Plasma (100mL) was mixed with20 mL of IS (50 mg=mL), 100mL of 0.1 N hydrochloric acid and then vor-texed for 10 s. The samples were then extracted with 3 mL of organicmixture containing TBME: EA (70:30 v=v) by shaking in a vibramax shakerfor 20 min at 2000 rpm followed by centrifugation for 5 min at 4000 rpm.From this, 2000 mL of supernatant organic layer was transferred to a poly-ethylene tube and evaporated to dryness under a stream of nitrogen at40�C. Finally, the residue was reconstituted using 400 mL of methanol:Milli-Q-water: formic acid (70:30:1 v=v). A sample volume of 5mL of thesolution was injected into the LC-MS=MS system.
High Performance Liquid Chromatography
Chromatographic separation was carried out by using a ShimadzuLiquid Chromatographic system (Shimadzu, Japan) with Hypersil goldC18 10 cm X 4.6 mm i.d., 5mm column dimensions (Thermo Fisher Lim-ited, Korea). A mobile phase consisting of methanol: Milli-Q-Water: formicacid (70:30:1 v=v) was delivered with a flow rate of 1 mL=min and with asplit ratio of 50%. The total run time for each sample analysis was 3 min.
Mass Spectrometric Conditions
The mass spectrometry was performed using an API 3000 triple quadru-pole mass spectrometer (AB Sciex, Canada) equipped with an electrosprayion (ESI) source. The mass spectrometer was operated in multiple reactionmonitoring (MRM) in positive mode. The spray voltage and source tempe-rature were 5500 V and 400�C, respectively. Nitrogen gas was used as colli-sion gas. The declustering potential (DP), focusing potential (FP),collision energy (CE), and cell exit potential (CXP) were optimized duringtuning at 40, 200, 30, and 20 V for MX and 81, 330, 31, and 16 V for PX,respectively. The entrance potential (EP) was kept constant as 10 V forthe analyte and IS. Nebulizer gas, curtain gas, and gas for collision activateddissociation (CAD) were kept as 7, 8, and 6 Psi, respectively, for both analyte
870 M. Ganesh et al.
Dow
nloa
ded
by [
Han
yang
Uni
vers
ity]
at 2
0:14
21
Mar
ch 2
013

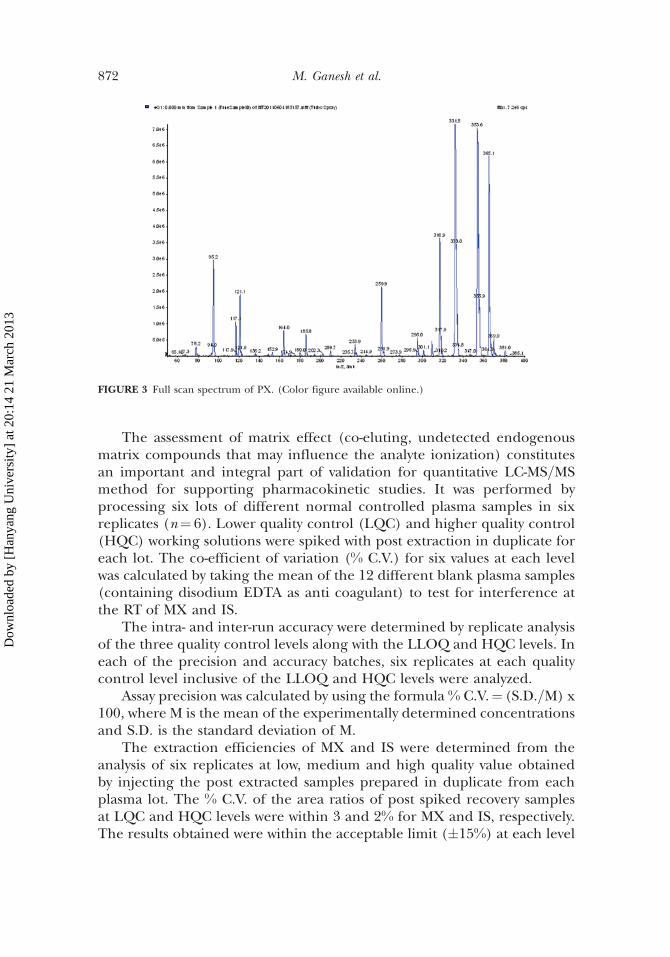
and IS. The mass transition ion-pair was selected as 352.0! 115.0 for MXand 331.8! 94.8 for PX. The parent and product ion spectrum forMX and PX are represented in Figures 2 and 3. The data acquisitionsoftware, Analyst version 1.4.1 was used for quantification. Method ofleast squares with weighting 1=X2 was used to calculate the peak area ratiosof the target ions of the drugs to those of the IS and the calibrationcurve was constructed by plotting peak area ratios of MX against itsconcentrations.
Validation
The validation for the determination of MX in plasma samples was per-formed in accordance with food and drug administration (FDA) guidelinesfor bioanalytical method validation.[23,24]
The method was validated for its selectivity, linearity, precision, accu-racy, recovery, and stability. Selectivity was performed by control concen-tration for MX, and at one concentration for IS. The % recovery wasevaluated by comparing the peak areas of extracted analytes to the peakareas of non-extracted standards.
FIGURE 2 Full scan spectrum of MX. (Color figure available online.)
Estimation of Meloxicam by LC-MS=MS 871
Dow
nloa
ded
by [
Han
yang
Uni
vers
ity]
at 2
0:14
21
Mar
ch 2
013
The assessment of matrix effect (co-eluting, undetected endogenousmatrix compounds that may influence the analyte ionization) constitutesan important and integral part of validation for quantitative LC-MS=MSmethod for supporting pharmacokinetic studies. It was performed byprocessing six lots of different normal controlled plasma samples in sixreplicates (n¼ 6). Lower quality control (LQC) and higher quality control(HQC) working solutions were spiked with post extraction in duplicate foreach lot. The co-efficient of variation (% C.V.) for six values at each levelwas calculated by taking the mean of the 12 different blank plasma samples(containing disodium EDTA as anti coagulant) to test for interference atthe RT of MX and IS.
The intra- and inter-run accuracy were determined by replicate analysisof the three quality control levels along with the LLOQ and HQC levels. Ineach of the precision and accuracy batches, six replicates at each qualitycontrol level inclusive of the LLOQ and HQC levels were analyzed.
Assay precision was calculated by using the formula % C.V.¼ (S.D.=M) x100, where M is the mean of the experimentally determined concentrationsand S.D. is the standard deviation of M.
The extraction efficiencies of MX and IS were determined from theanalysis of six replicates at low, medium and high quality value obtainedby injecting the post extracted samples prepared in duplicate from eachplasma lot. The % C.V. of the area ratios of post spiked recovery samplesat LQC and HQC levels were within 3 and 2% for MX and IS, respectively.The results obtained were within the acceptable limit (�15%) at each level
FIGURE 3 Full scan spectrum of PX. (Color figure available online.)
872 M. Ganesh et al.
Dow
nloa
ded
by [
Han
yang
Uni
vers
ity]
at 2
0:14
21
Mar
ch 2
013

tested for the analyte and within �20% for the IS. Moreover, the minorenhancement of analyte signal due to endogenous matrix interferencesdoes not affect the quantification of analyte and IS peak which wasconfirmed by the post-column infusion techniques.
As a part of the method validation, stability was evaluated. Analytes wereconsidered stable if the recovery of the mean test responses were within15% of appropriate controls. Analytes were tested using the QC sampleswherever appropriate. The stability of spiked human plasma kept at roomtemperature of about 25�C (Bench top stability) was evaluated for 6 hr. Theprocessed sample stability was evaluated by comparing the extracted plasmasamples that were injected immediately (time 0 hr) and re-injected after24 hr by keeping in the auto sampler at 4�C. The freeze thaw stability wasconducted by comparing the stability of the samples which was been frozenand thawed three times with freshly spiked QC samples. Six aliquots of eachlow and high concentration were used for the freeze thaw stability evalu-ation. For long term stability six replicates of LQC and HQC samples werespiked in plasma, kept at �70�C for 30 d, thawed to room temperature, andanalyzed. The dry extract stability was conducted by comparing the stabilitysamples that had been evaporated and stored at 4�C. The dry residue sam-ples were then reconstituted after 12 hr and compared with freshly spikedQC samples at low and high concentrations. In addition working solutionstability was carried out by comparing the areas obtained from aqueousworking solutions which were kept for 6 hr and up to 7 d in refrigeration(4�C) with freshly prepared working solutions prepared at the middlequality control (MQC) level.
RESULTS AND DISCUSSION
Method Development
The goal of this work was to develop and validate a simple, rapid, andsensitive assay method for the extraction and quantitation of MX for itspharmacokinetics studies. To achieve this during the method development,different trails were carried out to optimize sample extraction, detectionparameters and chromatography. As the pKa of MX is 1.1, in order to main-tain it in unionized form and to prevent it from ionization before extrac-tion, the plasma samples were treated with 0.1 N hydrochloric acid andextracted by liquid–liquid extraction using TBME: EA (70:30% v=v). Thisorganic mixture was found to be the most reproducible and gave less batchvariation when compared with other organic mixture or individual solvents.By acidification with hydrochloric acid, the response increased and the bestsignal with symmetrical peaks were achieved with positive ion electrospray
Estimation of Meloxicam by LC-MS=MS 873
Dow
nloa
ded
by [
Han
yang
Uni
vers
ity]
at 2
0:14
21
Mar
ch 2
013

(ESI) mode. A mobile phase containing methanol in combination withMilli-Q-water and formic acid resulted in improved signal. As a part ofmethod development; matrix effect was determined by post columninfusion technique. There was no ion suppression or enhancementobserved at the RT of analyte and IS. Use of short Hypersil C18 (10 cm� 4.64.6 i.d, 5 mm) column resulted in reduced flow rate and run time of 3 min.With the aforementioned optimized parameters, the RT of MX and IS wereobserved at 2.06 and 1.81 min, respectively.
Selectivity
Representative chromatogram obtained for blank plasma and plasmaspiked with LLOQ for MX and PX are represented in Figures 4 and 5. Simi-larly a representative chromatogram obtained for blank plasma and itsnominal concentration for IS is shown in Figure 6. The standard MX elutedat RT 2.06 min with a sharp and symmetrical peak (Figure 5) while IS elutedat 1.81 min. Hence, in the developed method, the RT of both MX and ISare significantly less when compared to the methods reported by other
FIGURE 4 Chromatograms of blank plasma. (Color figure available online.)
874 M. Ganesh et al.
Dow
nloa
ded
by [
Han
yang
Uni
vers
ity]
at 2
0:14
21
Mar
ch 2
013

researchers.[21,22] Further, no interfering peaks of endogenous compoundswere observed at RT of analyte or IS in blank human plasma containingdisodium EDTA as anticoagulant from six different lots and the signal
FIGURE 6 Chromatogram of blank with PX. (Color figure available online.)
FIGURE 5 Chromatogram of MX and PX at LLOQ level. (Color figure available online.)
Estimation of Meloxicam by LC-MS=MS 875
Dow
nloa
ded
by [
Han
yang
Uni
vers
ity]
at 2
0:14
21
Mar
ch 2
013

observed was more than 10 times shorter than the respective LLOQ of PXand MX.
Linearity
The peak area ratios for CC standards were proportional to the concen-tration of analyte in each assay over the nominal concentration range of10.090–3002.964 ng=mL for MX. The calibration curves appeared linearand were well described by least squares lines. A weighting factor on 1=X2 was chosen to achieve homogeneity of variance. The correlation coeffi-cients were �0.99 for MX. Across the eight points taken as calibration stan-dards the % C.V. obtained over five batches were �2.77 for MX (Table 1).
LLOQ
The LLOQ is defined as the lowest concentration that could be ana-lyzed with acceptable accuracy and precision of 20%. The LLOQ of MXwas found to be 10.090 ng=mL, emphasizing its usage in pharmacokineticstudy after oral administration.
Precision and Accuracy
The intra-run precision at LQC level was �6.1 (% C.V.) for MX whereasat the LLOQ level it was �12.6% and the accuracy was within the range of87%–97.3% for MX across all the four levels tested (Table 2). The inter-runprecision and accuracy were determined by pooling all individual assayresults of replicate (n¼ 6) QC samples over five separate batch runs. Theinter-run precision was �5.1% at LQC level for MX where as at the LLOQ
TABLE 1 Results of Linearity
Parameters CC1 CC2 CC3 CC4 CC5 CC6 CC7 CC8
Actual conc. (ng=mL) 10.09 20.18 100.9 252.249 630.622 1261.245 2102.075 3002.964Calculated conc.
(ng=mL)10.142 19.974 100.087 260.641 601.398 1263.927 2143.314 3016.1319.785 21.329 101.454 267.953 589.453 1216.575 2174.575 2918.0089.948 20.509 105.902 264.845 598.959 1249.969 2120.145 2849.319
10.110 20.459 101.258 250.589 610.258 1264.364 2109.364 2984.1979.876 19.985 104.321 254.369 603.735 1258.497 2171.040 3008.431
Mean 9.972 20.451 102.605 259.679 600.760 1250.666 2143.688 2955.217S.D.(�) 0.152 0.5526 2.413 7.192 7.592 19.923 29.303 70.6768% C.V. 1.5 2.7 2.3 2.8 1.3 1.6 1.4 2.3% Nominal 98.8 101.3 101.7 103.0 95.3 99.2 102.0 98.4
876 M. Ganesh et al.
Dow
nloa
ded
by [
Han
yang
Uni
vers
ity]
at 2
0:14
21
Mar
ch 2
013

level it was �12.8%. The inter run accuracy was within the range of 89.3 to95.7% for MX (Table 3).
Matrix Effect
In this study the matrix effect was evaluated by analyzing LQC, HQCsamples. Average matrix factor values (MF=Response of post spiked conc.=response of neat sample conc.) obtained for MX was þ1.01, þ0.98 at LQCand HQC level, respectively, whereas for the MF for IS was found tobeþ0.96.
Recovery
Six replicates at LQC, MQC, and HQC concentrations for MX were pre-pared for recovery determination. The mean recovery for MX was 60.8%.The % C.V. obtained was within the range of 4.09–10.43 for MX. The meanrecovery for IS was 52.2% with a % C.V. of 3.4%.
Stability
The results on stability of MX are presented in Table 4. Bench top, dryextract, and process stabilities for MX were investigated at LQC and HQClevels. The results revealed that MX was stable in plasma for at least 6 hr atroom temperature of about 25�C and 24 hr in the auto sampler at 10�C. It
TABLE 3 Accuracy and Precision (Interday) of MX in Human Plasma (n¼ 6)
Parameters LLOQ LQC MQC HQC
Nominal conc. (ng=mL) 10.234 28.829 1441.423 2402.371Mean 9.608 27.503 1286.762 2298.363S.D.(�) 1.232 1.425 49.242 61.140% C.V. 12.8 5.2 3.8 2.7% Nominal 93.9 95.4 89.3 95.7
TABLE 2 Accuracy and Precision (Intraday) of MX in Human Plasma (n¼ 6)
Parameters LLOQ LQC MQC HQC
Nominal conc. (ng=mL) 10.234 28.829 1441.423 2402.371Mean 8.903 27.797 1295.821 2337.668S.D.(�) 1.125 1.696 57.097 28.149% C.V. 12.6 6.1 4.4 1.2%Nominal 87.0 96.4 89.9 97.3
Estimation of Meloxicam by LC-MS=MS 877
Dow
nloa
ded
by [
Han
yang
Uni
vers
ity]
at 2
0:14
21
Mar
ch 2
013

was confirmed that repeated freeze thawing (three cycles) of plasma spikedwith MX at LQC and HQC level did not affect the stability of MX. Dryextract stability was also evaluated for a period of 12 hr at LQC and HQClevels. The long term stability results also indicated that the analyte MXwas stable in the matrix up to 30 d at the storage temperature of �70�C.Study on working solution stability proved that they were stable for morethan 6 hr at room temperature (about 25�C) and stable up to 7 d underrefrigeration (4�C).
CONCLUSIONS
A simple, selective, rapid, and sensitive LC-MS=MS method for thedetermination of MX in human plasma has been developed. The presentmethod is advantageous over the reported method by (i) use of less plasmasample volume, (ii) less injection volume (5mL), (iii) easy sample clean upprocedure, and (iv) methanol as one of the mobile phase solvent instead ofACN, a high cost hazardous solvent. Further, the present method needs avery short run time of only 3 min as total run time with analyte eluting at2.06 and IS at 1.82 min. In addition, the developed method makes use ofcommonly available and cost-effective LC-MS=MS instrument. Excellentspecificity and linearity with a LLOQ of 10.090 ng=mL for MX is an addedadvantage in this method. As the developed method is both cost and timeeffective, it is concluded that it can be applied for the routine pharmaco-kinetic evaluation of MX in human subjects after oral administration ofthe same.
TABLE 4 Stability Data
Nominal Concen-tration(ng=mL) Stability
Mean �S.Da.,n¼ 6 (ng=mL)
Precision(%CV)
Accuracy(%)b
28.829 (LQC) 0 hr (for all) 28.008� 0.438 1.57 97.2Bench top stability (25�C 6 hr) 28.606� 0.273 0.96 102.5Auto sampler (4�C 10 hr) 28.520� 0.669 2.35 101.3Dry Extract stability(4�C 12 hr) 28.063� 0.439 1.57 100.5Freeze thaw stability (3 cycles) 28.194� 0.665 2.36 101.3Long term stability (�70�C 30 days) 28.027� 0.663 2.37 99.3
2402.370 (HQC) 0 hr (for all) 2395.995� 50.577 2.11 99.7Bench top stability (25�C 6 hr) 2347.569� 106.182 4.52 99.2Auto sampler (4�C 10 hr) 2413.317� 63.525 2.63 97.3Dry Extract stability (4�C 12 hr) 2370.545� 83.837 3.56 99.4Freeze thaw stability (3 cycles) 2296.069� 120.871 5.26 95.9Long term stability (�70�C 30 d) 2350.286� 99.552 4.24 99.2
aBack calculated plasma concentrations.
878 M. Ganesh et al.
Dow
nloa
ded
by [
Han
yang
Uni
vers
ity]
at 2
0:14
21
Mar
ch 2
013

ACKNOWLEDGMENT
The financial support by grants from Korea CCS R&D Centre, fundedby the Ministry of Education, Science and Technology of the KoreanGovernment is greatly acknowledged.
REFERENCES
1. Engelhardt, G.; Homma, D.; Schlegel, K.; Schnitzler, C. H.R. Anti-Inflammatory, Analgesic,Antipyretic and Related Properties of Meloxicam, a New Non-Steroidal Anti-Inflammatory Agent.Inflamm. Res. 1995, 44 (10), 423–433.
2. Schmid, J.; Busch, U.; Heinzel, G.; Bozler, G.; Kaschke, D.; Kummer, M. Pharmacokinetics andMetabolic Pattern after Intravenous Infusion and Oral Administration to Healthy Subjects. Drug.Metab. Dispos. 1995, 23 (11), 1206–1213.
3. Davies, N. M.; Skjodt, N. M. Clinical Pharmacokinetics of Meloxicam. A Cyclo-Oxygenase-2Preferential Non-Steroidal Anti-Inflammatory Drug. Clin. Pharmacokinet. 1999, 36 (2), 115–126.
4. You, W. W.; Liu, Y.; Wang, Z. B. Determination of Meloxicam by Ultraviolet Spectrophotometry.Chinese J. Anal. Chem. 1999, 27, 841–853.
5. Nemutlu, E.; Kir, S. Validated Determination of Meloxicam in Tablets by Using UV Spectrophoto-metry. Hacettepe Univ. J. Facul. Pharm. 2004, 24 (1), 13–24.
6. Thanh, T. D.; Jaime, J. F.; Alvarez, C. A.; Iglesias, P. M. T. Spectrophotometric Simultaneous Deter-mination of Meloxicam and Sodium Amoxicillin in Combined Dosage Forms. J. Pharm. Res. 2010, 3(3), 425–428.
7. Bebawy, L. I. Stability-Indicating Method for the Determination of Meloxicam and TetracaineHydrochloride in the Presence of their Degradation Products. Spectros. Lett. 1998, 31 (4), 797–820.
8. Garcıa, M. S.; Sanchez-Pedreno, C.; Albero, M. I.; Martı, J. Spectrophotometric Methods for Deter-mining Meloxicam in Pharmaceuticals Using Batch and Flow-Injection Procedures. Eur. J. Pharm.Sci. 2000, 9 (3), 311–316.
9. Hassan, E. M. Spectrophotometric and Fluorimetric Methods for the Determination of Meloxicamin Dosage Forms. J. Pharm. Biomed. Anal. 2002, 27 (5), 771–777.
10. Zawilla, N. H.; Mohammad, M. A.A.; El kousy, N. M.; El-Moghazy Aly, S. M. Determination ofMeloxicam in Bulk and Pharmaceutical Formulations. J. Pharm. Biomed. Anal. 2003, 32 (6), 1135–1144.
11. Liu, H.; Zhang, L.; Hao, Y.; Wang, Q.; He, P.; Fang, Y. Flow-Injection Chemiluminescence Determi-nation of Meloxicam by Oxidation with N-Bromosuccinimide. Anal. Chim. Acta 2005, 541 (1–2),185–192.
12. Vasiliki, V.; Pinto, P. C.A. G.; Lucia, M.; Saraiva, M. F.S.; Lima, J. L.F. C. Sequential InjectionDetermination of Meloxicam in Pharmaceutical Formulations with Spectrophotometric Detection.Can. J. Anal. Sci. Spectros. 2007, 52 (6), 351–358.
13. Bandarkar, F. S.; Vavia, P. R. A Stability Indicating HPLC Method for the Determination ofMeloxicam in Bulk and Commercial Formulations. Trop. J. Pharm. Res. 2009, 8 (3), 257–264.
14. Dasandi, B.; Shivaprakash, Saroj H.; Bhat, K. M. LC Determination and Pharmacokinetics ofMeloxicam. J. Pharm. Biomed. Anal. 2002, 28 (5), 999–1004.
15. Nemutlu, E.; Kir, S. Method Development and Validation for the Analysis of Meloxicam in Tabletsby CZE. J. Pharm. Biomed. Anal. 2003, 31 (2), 393–400.
16. Altiokka, G.; Atkosar, Z.; Tuncel, M. Pulse Polarographic Determination of Meloxicam. Die Pharmazie2001, 56 (2), 184–203.
17. Altınoz, S.; Nemutlu, E.; Kır, S. Polarographic Behavior of Meloxicam and its Determination inTablet Preparations and Spiked Plasma, IL Farmaco, 2002, 57(6), 463–468.
18. Beltagi, A. M.; Ghoneim, M. M.; Radi, A. Electrochemical Reduction of Meloxicam at MercuryElectrode and Its Determination in Tablets. J. Pharm. Biomed. Anal. 2002, 27 (5), 795–801.
Estimation of Meloxicam by LC-MS=MS 879
Dow
nloa
ded
by [
Han
yang
Uni
vers
ity]
at 2
0:14
21
Mar
ch 2
013

19. Bae, J. W.; Kim, M. J.; Jang, C. G.; Lee, S. Y. Determination of Meloxicam in Human Plasma Using aHPLC Method with UV Detection and its Application to a Pharmacokinetic Study. J. Chromatogr. B2007, 859 (1), 69–73.
20. Wiesner, J. L.; de Jager, A. D.; Sutherland, F. C.W.; Hundt, H. K.L.; Swart, K. J.; Hundt, A. F.; Els, J.Sensitive and Rapid Liquid Chromatography-Tandem Mass Spectrometry Method for the Determi-nation of Meloxicam in Human Plasma. J. Chromatogr. B 2003, 785 (1), 115–121.
21. Yuan, Y.; Chen, X.; Zhong, D. Determination of Meloxicam in Human Plasma by LiquidChromatography-Tandem Mass Spectrometry Following Transdermal Administration. J. Chromatogr.B 2007, 852 (1–2), 650–654.
22. Lee, H. W.; Ji, H. Y.; Kim, H. Y.; Lee, K. C.; Lee, H. S. Liquid Chromatography-Tandem Mass Spec-trometry Method for the Determination of Meloxicam and Its Metabolite 5-Carboxymeloxicam inHuman Plasma. Bioanal. 2009, 1 (1), 63–70.
23. Food and Drug Administration. Guidance for Industry: Bioanalytical Method Validation. US Departmentof Health and Human Services, FDA, Center for Drug Evaluation and Research: Rockville, MD,2001.
24. Viswanathan, C. T.; Bansal, S.; Booth, B.; DeStefano, A. J.; Rose, M. J.; Sailstad, J.; Shah, V. P.; Skelly,J. P.; Swann, P. G.; Weiner, R. Workshop=Conference Report - Quantitative Bioanalytical Methods:Validation and Implementation: Best Practices for Chromatographic and Ligand Binding Assays.The AAPS J. 2007, 9 (1), Article 4, E30–E42.
880 M. Ganesh et al.
Dow
nloa
ded
by [
Han
yang
Uni
vers
ity]
at 2
0:14
21
Mar
ch 2
013