Estimating the burden of occupational bladder cancer in ...
128
Estimating the burden of occupational bladder cancer in Ontario using the CAREX Canada database: calculation and application of the population attributable risk by JOY ANGELES A thesis submitted to the Department of Community Health and Epidemiology In conformity with the requirements for the degree of Master of Science Queen’s University Kingston, Ontario, Canada August, 2008 copyright © Joy Angeles, 2008
-
Upload
khangminh22 -
Category
Documents
-
view
1 -
download
0
Transcript of Estimating the burden of occupational bladder cancer in ...

Estimating the burden of occupational bladder cancer in Ontario using the CAREX
Canada database: calculation and application of the population attributable risk
by
JOY ANGELES
A thesis submitted to the Department of Community Health and Epidemiology
In conformity with the requirements for
the degree of Master of Science
Queen’s University
Kingston, Ontario, Canada
August, 2008
copyright © Joy Angeles, 2008

- i -
Abstract
Objective: This study attempts to estimate the proportion of incident cases of bladder
cancer in Ontario, Canada that is due to exposure to occupational carcinogens.
Methods: The population attributable risk approach is used to estimate the proportion of
bladder cancer in Ontario that is due to occupation. Risk ratios were obtained from a
review of epidemiologic literature using a priori inclusion and exclusion criteria.
Summary risk estimates for each bladder carcinogen included were calculated using
RevMan 4.2. The CAREX Canada database provided Ontario-specific estimates of the
proportion of workers exposed to bladder carcinogens.
Results: In Ontario, the proportion of bladder cancer due to occupational exposure is
approximately 5.6% (95% CI 0.2% to 14%). Based on the incident number of bladder
cancer cases in 2001 in Ontario, it is estimated that approximately 52 new cases of
bladder cancer were due to occupational exposure to polycyclic aromatic hydrocarbons
(PAHs), diesel exhaust, aromatic amines and 2-naphthylamine. An alternate
interpretation is if these occupational exposures were eliminated, 52 cases of bladder
cancer per year in Ontario alone could be avoided.
Conclusion and Recommendations: The current study advances our knowledge of the
extent to which specific occupational bladder carcinogens contribute to the overall
bladder cancer burden in Ontario. The current study highlights the utility of the CAREX
Canada database in advancing current knowledge on the burden of occupational cancer
in Ontario. The methods used to estimate the proportion of bladder cancer attributable
to occupational exposure in Ontario may be replicated to estimate the proportion of
cancer in Ontario that is due to occupational exposure.

ii
Acknowledgements
I would like to thank the following people for their contributions to this thesis:
My supervisors, Dr Kristan Aronson and Dr Loraine Marrett for their continued guidance
and encouragement throughout the entire course of this project. Their dedication to
furthering knowledge on occupational cancer in Ontario has been truly inspirational.
Dr Paul Demers, Bronwen Waller and Weiwei Du for providing access to the CAREX
Canada database and for acting as key informants in all aspects related to CAREX.
My fellow class mates and co-workers for their friendship and support. My family and
friends for their encouragement, love and understanding.
Most of all, I thank Clayton, Noelle and Cailyn for believing in me and providing the
motivation to do my best - always.

iii
Table of Contents
ABSTRACT........................................... .......................................................................... I
ACKNOWLEDGEMENTS ................................... ........................................................... II
LIST OF TABLES ..................................... .................................................................... IV
FIGURES AND ILLUSTRATIONS .......................... ...................................................... VI
CHAPTER 1: INTRODUCTION............................ .......................................................... 1
CHAPTER 2: LITERATURE REVIEW....................... ..................................................... 2
2.1 BLADDER CANCER STATISTICS ................................................................................ 2 2.2 GENERAL DISEASE CHARACTERISTICS..................................................................... 3 2.3 BLADDER CANCER RISK FACTORS ........................................................................... 4 2.4 BLADDER CANCER OCCUPATIONAL RISK FACTORS ................................................... 6 2.5 OCCUPATIONAL BURDEN OF BLADDER CANCER........................................................ 7
CHAPTER 3: STUDY DESIGN AND METHODS ................ ..........................................13
3.1 OBJECTIVES ..........................................................................................................13 3.2 METHODS .............................................................................................................13 3.3 SOURCES OF DATA ................................................................................................17
3.3.1 CAREX Canada Database............................................................................17 3.3.2 2001 Canadian Census.................................................................................21 3.3.3 Identification of Bladder Carcinogens Through Existing Literature ................22 3.3.4 Cancer Surveillance On-Line ........................................................................22
3.4 LITERATURE REVIEW SEARCH TERMS AND INCLUSION CRITERIA...............................23 3.5 CALCULATING SUMMARY RISK ESTIMATES ..............................................................27 3.6 POPULATION ATTRIBUTABLE RISK CALCULATION .....................................................28
CHAPTER 4: RESULTS ................................. ..............................................................30
4.1 IDENTIFICATION OF KNOWN OCCUPATIONAL BLADDER CARCINOGENS ......................30 4.2 NUMBER AND PROPORTIONS OF ONTARIO WORKERS EXPOSED TO BLADDER CARCINOGENS ............................................................................................................36 4.3 RISK ESTIMATES TO BE USED IN PAR CALCULATION .................................................48 4.4 CALCULATION OF POPULATION ATTRIBUTABLE FRACTION (PAR) ...............................69 4.5 SENSITIVITY ANALYSIS ...........................................................................................70 4.6 APPLICATION OF PAR TO ONTARIO BLADDER STATISTICS ........................................76
CHAPTER 5: DISCUSSION.............................. ............................................................77
CHAPTER 5: DISCUSSION.............................. ............................................................77
REFERENCES..............................................................................................................92
APPENDIX A ......................................... .......................................................................97
APPENDIX B ......................................... .....................................................................102
APPENDIX C ..............................................................................................................105

iv
List of tables TABLE 1 – BLADDER CANCER INCIDENCE BY FIVE-YEAR AGE GROUP IN ONTARIO 2004, AGE-
STANDARDIZED INCIDENCE RATE PER 100, 000........................................................... 3 TABLE 2 – ESTIMATED AGE-STANDARDIZED INCIDENCE RATE ACROSS CANADA, 2008........... 4 TABLE 3 – SELECTED STUDIES THAT HAVE ESTIMATED THE PROPORTION OF CANCER DUE TO
OCCUPATIONAL FACTORS .......................................................................................... 8 TABLE 4 - COMPARISON OF COMMON OCCUPATIONAL EXPOSURES ACROSS DIFFERENT
EUROPEAN COUNTRIES............................................................................................11 TABLE 5 – IARC CLASSIFICATIONS...................................................................................15 TABLE 6 - EXPOSURE QUALITY RATING.............................................................................25 TABLE 7 - BLADDER CARCINOGENS (STRONG AND SUGGESTIVE EVIDENCE) .......................31 TABLE 8 - INDUSTRIES AND OCCUPATIONS WITH EXCESS RISKS FOR BLADDER CANCER......33 TABLE 9 – NATURE OF EVIDENCE FOR BLADDER CARCINOGENS INCLUDED ..........................35 TABLE 10 – PROPORTION OF ONTARIO WORKFORCE EMPLOYED BY INDUSTRY SECTOR .......36 TABLE 11 – NUMBER AND PROPORTION OF ONTARIO WORKERS POTENTIALLY EXPOSED TO
PAHS .....................................................................................................................39 TABLE 12 - NUMBER AND PROPORTION OF ONTARIO WORKERS POTENTIALLY EXPOSED TO
DIESEL EXHAUST......................................................................................................42 TABLE 13 - NUMBER AND PROPORTION OF ONTARIO WORKERS POTENTIALLY EXPOSED TO
AROMATIC AMINES ..................................................................................................45 TABLE 14 – NUMBER AND PROPORTION OF ONTARIO WORKFORCE EXPOSED TO BLADDER
CARCINOGENS.........................................................................................................46 TABLE 15 – PROPORTION OF ONTARIO WORKFORCE AND POPULATION EVER/NEVER EXPOSED
TO BLADDER CARCINOGENS .....................................................................................47 TABLE 16 – PROPORTION OF ONTARIO WORKFORCE AND POPULATION EXPOSED TO HIGH
LEVELS OF BLADDER CARCINOGENS..........................................................................47 TABLE 17 - PROPORTION OF ONTARIO WORKFORCE AND POPULATION EXPOSED TO LOW
LEVELS OF BLADDER CARCINOGENS..........................................................................48 TABLE 18 – SUMMARY RISK ESTIMATES FOR SELECTED BLADDER CARCINOGENS.................68 TABLE 19 – POPULATION ATTRIBUTABLE FRACTION CALCULATION – PAH EXPOSURE .........69 TABLE 20 – POPULATIONATTRIBUTABLE FRACTION CALCULATION – DIESEL EXHAUST
EXPOSURE..............................................................................................................69 TABLE 21 – POPULATION ATTRIBUTABLE FRACTION CALCULATION – 2-NAPHTHYLAMINE......69 TABLE 22 – POPULATION ATTRIBUTABLE FRACTION CALCULATION – AROMATIC AMINES .....70 TABLE 23 – OVERALL POPULATION ATTRIBUTABLE FRACTION/ POPULATION ATTRIBUTABLE
FRACTION ...............................................................................................................70 TABLE 24 – POPULATION ATTRIBUTABLE FRACTION CALCULATED USING POOLED RISK
ESTIMATE FOR LOW-LEVEL PAH EXPOSURE ..............................................................71 TABLE 25 – POPULATION ATTRIBUTABLE FRACTION CALCULATED BASED ON THE RANDOM
EFFECTS MODEL (USING POOLED RISK ESTIMATE FOR LOW-LEVEL PAH EXPOSURE).....71 TABLE 26 – POPULATION ATTRIBUTABLE FRACTION CALCULATED BASED ON THE RANDOM
EFFECTS MODEL (USING NON-POOLED RISK ESTIMATE FOR LOW-LEVEL PAH EXPOSURE)..............................................................................................................................72
TABLE 27 – ATTRIBUTABLE FRACTION CALCULATED USING STUDIES WITH EXPOSURE QUALITY 4 AND 5...................................................................................................................72
TABLE 28 – POPULATION ATTRIBUTABLE FRACTION CALCULATED WITH THE EXCLUSION OF DIESEL EXHAUST EXPOSURE.....................................................................................73
TABLE 29 – POPULATION ATTRIBUTABLE FRACTION FOR PAH EXPOSURE BASED ON COHORT STUDIES ONLY .........................................................................................................73

v
TABLE 30 – ATTRIBUTABLE FRACTION FOR DIESEL EXHAUST EXPOSURE BASED ON COHORT STUDIES ONLY .........................................................................................................73
TABLE 31 – POPULATION ATTRIBUTABLE FRACTION FOR 2-NAPHTHYLAMINE EXPOSURE BASED ON COHORT STUDIES ONLY.......................................................................................74
TABLE 32 – POPULATION ATTRIBUTABLE FRACTION FOR AROMATIC AMINE EXPOSURE BASED ON COHORT STUDIES ONLY.......................................................................................74
TABLE 33 – POPULATION ATTRIBUTABLE FRACTION CALCULATION BASED ON COHORT STUDIES ONLY ......................................................................................................................74
TABLE 34 – POPULATION ATTRIBUTABLE FRACTION FOR PAH EXPOSURE BASED ON CASE-CONTROL STUDIES ONLY ..........................................................................................75
TABLE 35 – POPULATIONATTRIBUTABLE FRACTION FOR DIESEL EXPOSURE BASED ON CASE-CONTROL STUDIES ONLY ..........................................................................................75
TABLE 36 – POPULATION ATTRIBUTABLE FRACTION FOR 2-NAPHTHYAMINE EXPOSURE BASED ON CASE-CONTROL STUDIES ONLY ............................................................................75
TABLE 37 – POPULATION ATTRIBUTABLE FRACTION FOR AROMATIC AMINE EXPOSURE BASED ON CASE-CONTROL STUDIES ONLY ............................................................................76
TABLE 38 – POPULATION ATTRIBUTABLE FRACTION CALCULATION BASED ON CASE-CONTROL STUDIES ONLY .........................................................................................................76
TABLE 39 – SAMPLE SIZE ESTIMATES FOR POSTULATED RELATIVE RISKS OF BLADDER CANCER ASSOCIATED WITH PAH EXPOSURE.............................................................79
TABLE 40 – SAMPLE SIZE ESTIMATES FOR VARIOUS PROPORTIONS OF EXPOSURE TO PAHS AMONG CONTROLS..................................................................................................79

vi
List of figures and illustrations
FIGURE 1 – FLOW DIAGRAM OF OVERALL METHODS ..........................................................26 FIGURE 2 – TOP TEN ONTARIO INDUSTRY SECTORS (CAREX CANADA) .............................38 FIGURE 3 – TEN INDUSTRY SECTORS IN ONTARIO WITH THE MOST WORKERS POTENTIALLY
EXPOSED TO PAHS .................................................................................................41 FIGURE 4 – TEN INDUSTRY SECTORS ON ONTARIO WITH THE MOST WORKERS POTENTIALLY
EXPOSED TO DIESEL EXHAUST ..................................................................................44 FIGURE 5 – FOREST PLOT: PAH EXPOSURE......................................................................52 FIGURE 6 – FOREST PLOT: LOW-LEVEL PAH EXPOSURE....................................................53 FIGURE 7 – FOREST PLOT: LOW-LEVEL PAH EXPOSURE – DELETION OF HIGHEST AND
LOWEST RISK ESTIMATES .........................................................................................54 FIGURE 8 – FOREST PLOT: DIESEL EXPOSURE ..................................................................58 FIGURE 9 – FOREST PLOT: LOW-LEVEL DIESEL EXPOSURE.................................................59 FIGURE 10 – FOREST PLOT: AROMATIC AMINE EXPOSURE ................................................62 FIGURE 11 – FOREST PLOT: AROMATIC AMINE EXPOSURE – DELETION OF HIGHEST AND
LOWEST RISK ESTIMATES .........................................................................................63 FIGURE 12 – FOREST PLOT: LOW-LEVEL AROMATIC AMINE EXPOSURE ................................64 FIGURE 13 – FUNNEL PLOT: PAH EXPOSURE....................................................................65 FIGURE 14 – FUNNEL PLOT: DIESEL EXPOSURE.................................................................66 FIGURE 15 – FUNNEL PLOT: AROMATIC AMINE EXPOSURE ..................................................67

- 1 -
Chapter 1: Introduction
Studies in occupational epidemiology and occupational cancer contribute to the
overall body of knowledge on the aetiology of human cancer. Almost half of all
recognized human carcinogens are occupational carcinogens (Siemiatycki et al., 2004)
and therefore are modifiable risk factors. Occupational cancer can be defined as cancers
that are due to exposure to carcinogens in the workplace. Occupational bladder
cancers, then, are bladder cancers that are due to exposure to carcinogens in the
workplace. Cigarette smoking and certain occupational exposures, such as exposure to
aromatic amines, are known modifiable risk factors for bladder cancer (Negri and La
Vecchia, 2001; Silverman et al., 2006; van der Meijden, 1998; Tola, 1980; Cohen et al.,
2000; Borden et al., 2003; Adami et al., 2002). Quantifying the number of workers who
are exposed to bladder carcinogens is an important step in understanding the burden of
occupational bladder cancer and identifying possible interventions. Most countries do
not have good sources of data or adequate reporting systems in place with which to
produce reliable statistics on occupational cancer (‘t Mannetje and Pearce, 2005). The
assessment of the burden of occupational bladder cancer, therefore, requires the use of
indirect methods from various data sources. This study will attempt to determine the
magnitude or burden of occupational bladder cancer in Ontario by answering the
question: What proportion of bladder cancers in Ontario is attributable to occupational
factors, specifically occupational carcinogens? This quantification shows the degree to
which the elimination of these occupational carcinogens would reduce the number of
bladder cancer cases in Ontario each year.

2
Chapter 2: Literature Review
2.1 Bladder Cancer Statistics
In Ontario, bladder cancer is the fourth most commonly diagnosed cancer in men
and the thirteenth among women (Cancer Care Ontario website, 2008). The age-
adjusted incidence rate (using 1991 Canadian standard population) for all age groups
from 1995 to 2004 in Ontario for bladder cancer is 22.09 per 100,000 men, and 5.86 per
100,000 women. The age-adjusted mortality rate (using 1991 Canadian standard
population) for all age groups from 1995 to 2004 is 7.40 per 100,000 men and 2.08 per
100,000 women (Cancer Surveillance On-Line, 2008). Among Canadian males, the
age-standardized incidence rate has been decreasing on average by 0.5 percent per
year from 1995 to 2004 (Canadian Cancer Society, 2008). In this same time period
there was also a corresponding decrease among males in the age-standardized
mortality rate which decreased an average of 0.4 percent. Among Canadian females,
however, while the incidence rate has been decreasing over time at an annual average
of 0.4 percent, the mortality rate from 1995 to 2004 has been increasing by an average
of 0.4 percent annually (Canadian Cancer Society, 2008). The male to female ratio is
approximately 3 to 1 in Canada. The higher incidence among men is consistent with
their more likely past exposure to occupational carcinogens, their earlier, long-term, and
higher smoking rates.
The incidence and mortality of bladder cancer directly increase with age after age
50 years (Borden et al., 2003; Silverman et al., 2006). More than two-thirds of cases
occur in people over 65 years of age. Bladder cancer incidence in Ontario by five-year
age groups is presented in Table 1:

3
Table 1 – Bladder cancer incidence by five-year age group in Ontario 2004, age-standardized incidence rate per 100, 000
Age Group 1 Rate/100, 0002
35-39 1.43 40-44 2.57 45-49 8.54 50-54 16.42 55-59 29.54 60-64 59.29 65-69 92.35 70-74 121.89 75-79 179.38 80-84 239.24 85+ 235.61
The incidence of bladder cancer varies greatly internationally. The highest
rates occur among men in Europe (southern, western and northern), North America and
Oceania. Low rates are found in eastern Europe, Central America, South America and
several areas of Asia. The five-year survival rate is about 80% (Adami et al., 2002).
2.2 General Disease Characteristics
About 95% of bladder cancers are transitional cell carcinomas (Cancer
Surveillance On-line, 2008). Less than 5% develop as squamous cell carcinoma (found
in 1-3% of cases) and even fewer as adenocarcinomas (found in less than 1% of
patients) (Steineck, 2001; Droller, 2006). The development of the bladder cancer is
associated with the excretion of carcinogenic metabolites in the urine (van der Meijden,
1998). Eighty percent of bladder tumours are superficial and are confined to the bladder
mucosa. Twenty percent invade the muscle layer. A variable degree of reporting of
bladder cancer may substantially influence descriptive data available (Adami et al.,
2002). For example, in Ontario, the coding changed such that preinvasive lesions
1 Bladder cancer incidence rate per 100, 000 in the age groups prior to 35-39 years is 0 2 Incidence rate includes in situ carcinomas

4
(carcinoma in situ) were reported with invasive cancer up to 1989, but have been
excluded since, resulting in an apparent drop in incidence in 1989 (Marrett et al., 1995).
This continues to be the case in Ontario; however, other provinces have begun to report
carcinoma in situ under bladder cancer again since 2006 resulting in variation in the age-
standardized incidence rate among both males and females (Canadian Cancer
Statistics, 2008). The variation in the estimated incidence rate due to this difference in
reporting across the provinces can be seen in Table 2:
Table 2 – Estimated age-standardized incidence rate across Canada, 2008
Rate per 100, 000
Canada NL PE NS NB QC ON MB SK AB BC
Males 27 26 32 35 33 37 19 30 28 29 28
Females 7 7 7 9 9 9 5 8 7 8 8
(Canadian Cancer Society, 2008)
Bladder cancer is considered a malignancy with a long latency period, the time
between disease initiation and disease detection. This observation arose from that fact
that most new cases of bladder cancer are found in those over 65 years of age. The
average latent period for the development of bladder cancer has been estimated to be
more than 15 years (van der Meijden, 1998) and has been speculated to range from 18
years to 44 years (Mantanoski and Elliot, 1981; Cohen and Johansson, 1992).
2.3 Bladder Cancer Risk Factors
Cigarette smoking is the most common and well-established risk factor for
bladder cancer, contributing an estimated 35 to 50% of all bladder cancer in the United
States (Borden et al., 2003). The proportion of bladder cancer attributable to ever
smoking is 66% for men and 30% for women, according to the International Agency for

5
Research on Cancer (2004). Overall, smokers have two to three times the risk of
developing bladder cancer compared to non-smokers (Silverman et al., 2006).
However, the specific carcinogens involved in elevating the bladder cancer risk among
smokers are unknown. There is suggestive evidence that aromatic amines are the
bladder carcinogens in tobacco smoke, whereas tar and nicotine content in cigarettes
have been shown to have little impact on cancer risk (Silverman et al., 2006). It has
been demonstrated that cessation of smoking reduces the risk of bladder cancer (IARC,
2004). A recent review of 15 studies found inconclusive evidence of whether smoking
status affects the recurrence or progression of disease (Borden et al., 2003).
In addition to smoking, a number of other non-occupational factors have also
been suggested to be associated with bladder cancer risk such as: (1) genetic factors:
race, family history and genetic polymorphisms; (2) dietary factors: consumption of fruits
and vegetables, coffee, meat and fat, total fluid intake and consumption of drinking water
containing arsenic and disinfection by-products ; (3) infections and inflammation of the
bladder; (4) treatment-related factors such as the use of phenacetin-containing
analgesics, chemotherapeutic agents and radiation therapy; and (5) physical activity
(Gaertner et al., 2004).
The proportions of bladder cancer attributable to different risk factors would
depend on the relative risk associated to each factor and on the frequency of exposure.
The frequency of exposure varies according to geographic area and time period. In one
Italian hospital-based case-control study, the investigators estimated that over 70% of
bladder cancer cases could be explained by smoking, coffee consumption, low intake of
vegetables, a history of cystitis, and occupation (D’Avanzo et al., 1995). Consistently,
about half of bladder cancer cases can be accounted for by smoking, but the proportion
of bladder cancer due to other factors remains unclear. This study aims to estimate the
proportion bladder cancer due to occupational carcinogens in Ontario.

6
2.4 Bladder Cancer Occupational Risk Factors
Bladder cancer is strongly associated with occupational exposure to chemicals
and has a well-established link with certain occupational exposures (van der Meijden,
1998; Steenland et al., 2003; ‘t Mannetje and Pearce, 2005). Occupational bladder
cancer was first reported in 1895 by Rehn, who found four cases of bladder cancer in
aniline workers (Tola, 1980). The study of occupational causes of bladder cancer began
in the 1950s with the identification of bladder cancer in British dyestuffs and rubber
industries (Silverman et al., 2006). Since then, many other occupations with potentially
high risk for the development of bladder cancer have been suggested. However, much
of the evidence on many of these occupational risks remains unclear due to inconsistent
findings, small numbers of exposed subjects, or relatively small risk estimates.
The strongest evidence for the development of bladder cancer exists for
occupational exposure to aromatic amines such as 2-naphthylamine, 4-aminodiphenyl,
and benzidine to which dyestuffs workers, manufacturers of these chemicals, and rubber
workers are exposed (Borden et al., 2003; Silverman et al., 2006). As such, their use in
the workplace has been eliminated, particularly in developed countries. This leads to
shifts in high-risk occupations, for example, reduced risks among rubber and leather
workers and emerging risks among truck drivers and aluminum smelter workers
(Carreon et al., 2006).
One problem encountered in the study of occupational bladder cancer is that
there are occupational groups for which there have been consistently observed
increased risks, but the bladder carcinogen responsible is unknown. Such is the case
for increased risk of bladder cancer found among leather workers, painters, truck drivers
(and other motor vehicles – buses, taxi cabs), and aluminum workers (Silverman et al.,
2006).

7
2.5 Occupational Burden of Bladder Cancer
The measure used to determine the public health burden of a particular risk
factor is the attributable fraction (AF) or the attributable risk (AR). These terms will be
used interchangeably here. The attributable fraction may be calculated for an exposed
group of individuals or for the population as a whole (Kelsey et al., 1996). It may be
considered the proportion of the disease in the exposed group (or population) that would
be eliminated if the exposure were eliminated. The population attributable risk combines
the relative risk and the prevalence of exposure to measure the burden of disease and
can be interpreted as the fraction of disease that would be avoided if exposure were
eliminated.
For nearly three decades, several methods have been employed to estimate the
burden of occupational disease. The most commonly cited figure of the proportion of
cancers caused by occupational factors is 4% (Doll and Peto, 1981). These authors
also estimated that the proportion of bladder cancer attributable to occupational
exposures was 10% in males and 5% in females. Table 3 below outlines the estimates
made and the methods used by some of the investigators who have attempted to
determine the proportion of cancer due to occupational exposure.

8
Table 3 – Selected studies that have estimated the proportion of cancer due to
occupational factors
Study (year)
Country
Estimate –
cancer
overall
Estimate -
bladder
cancer
Methods
Doll and Peto
(1981)
United States
4 % of U.S
cancer
deaths
10% males
5% females
Classified individual cancers as
definitely, possibly or not known
occupational hazards. PAR
estimates based on existing
studies that have provided
estimates of the proportions
cases due to occupational
exposure
Vineis and
Simonato (1991)
Multiple countries:
United Kingdom,
Italy, Germany,
United States,
Spain, Canada,
Argentina,
Denmark, Belgium,
Finland
No estimate
made
0-2% to 24% Systematic review of case-
control studies, including only
studies that controlled for
smoking

9
Study (year)
Country
Estimate –
cancer
overall
Estimate -
bladder
cancer
Methods
Nurminen and
Karjalainen (2001)
Finland
8%
14% male
2% female
10.3%
14.2% male
0.7% female
Risk estimates obtained from
epidemiologic literature with
preference given to studies
conducted in Finland and
Scandinavia.
Proportion of people exposed to
occupational risk factors was
obtained from census data and
the use of a job-exposure matrix
Kogevinas et al.
(2003)
Western Europe:
Germany, France,
Spain, Greece, Italy,
Denmark
No estimate
made
4.2% to 7.4% Pooled analysis of data from 11
case-control studies.
Job-exposure matrix (FINJEM)
used to evaluate prevalence of
exposure and average levels of
exposure
Steenland et al.
(2003)
United States
2.4% to
4.8%
3.3% to
7.3% males
0.8% to
5.6% to
19.0%
7% to 19%
males
3% to 19%
AF calculated using
epidemiologic studies, 1997 U.S
mortality data and estimates of
the proportion of the population
exposed from two NIOSH
surveys.

10
Study (year)
Country
Estimate –
cancer
overall
Estimate -
bladder
cancer
Methods
1.0%
females
females
‘t Mannetje and
Pearce (2005)
New Zealand
No estimate
made
14.2% male
7.1% female
Relied on the estimates for
gender-specific attributable
fraction used in the report of
Nurminen and Karjalainen
(2001) which were based on the
Finnish population and applied
these to data from New Zealand
Deschamps et al.
(2006)
France
3.18%
5.67% males
0.22%
females
2.1% Descriptive study of incident
cancer cases over 3 years.
Occupational histories obtained.
Diagnosis of work-related cancer
based on systematic approach
where there was potential
exposure to carcinogens based
on meeting 2 criteria.
Fritschi and Driscoll
(2006)
Australia
11% males
2% females
14.2% males
0.7% females
Estimates of risk from Nurminen
and Karjalainen (2001).
Used individual EU estimates for
each industry and applied to
Australian data.

11
From the table above, it has been estimated that occupational exposures may be
responsible for 2% to 24% of bladder cancer, ranging from 7% to 19% among males and
0.7% to 19% among females. The estimates for cancer overall range from 2.5% to 8%
for both males and females combined. The main determinant of the differences in these
estimates is the prevalence of exposure to bladder carcinogens across the different
populations, and the time periods under study.
The differing exposure circumstances to a range of carcinogens will vary from
place to place. For example, using the CAREX International database, the two most
common occupational carcinogen exposures across various European countries were
consistently solar radiation and environmental tobacco smoke (Kauppinen et al., 1998).
These are both fairly ubiquitous exposures. However, the differences in the exposure
circumstances start to become apparent when the third, fourth and fifth most common
occupational exposures are examined (Table 4)
Table 4 - Comparison of common occupational exposures across different European
countries
Country 3 rd Most Common Occupational Carcinogen
4th Most Common Occupational Carcinogen
5th Most Common
Occupational Carcinogen
Denmark Formaldehyde Diesel exhaust Crystalline silica
Finland Crystalline silica Wood dust Radon
France Radon Diesel exhaust Sulphuric acid
mist
Italy Asbestos Diesel exhaust PAHs
Netherlands Crystalline silica Diesel exhaust Wood dust
(table generated from the results of Kauppinen et al., 1998)

12
The calculation of the population attributable risk involves not only the relative
risk associated with a risk factor, but the frequency of the exposure in the population.
Therefore, the population attributable risk will vary according to the geographical area
and the calendar period in which the frequency of exposure was estimated. For these
reasons, and to achieve the objective of this thesis, it is important to base the estimate of
the proportion of bladder cancer due to occupational carcinogens using Ontario-specific
data. It is important for occupational safety and health practitioners to have an
understanding of the burden of occupational bladder cancer to identify the extent to
which bladder cancer is avoidable and to be able to target the appropriate sub-groups
for intervention. The aim of this study, then, is to estimate the proportion of bladder
cancer in Ontario due to exposure to occupational carcinogens.

13
Chapter 3: Study Design and Methods The purpose of this study is to estimate the burden of bladder cancer in Ontario
that is attributable to occupational factors using the CAREX Canada database.
3.1 Objectives I. Estimate the proportion of bladder cancer in Ontario that is due to
exposure to occupational carcinogens through the calculation of the
population attributable risk.
II. Conduct sensitivity analyses to determine the effect of varying the
estimates of the “input data” on the attributable risk calculated.
III. Estimate the absolute number of occupational bladder cancer in Ontario
by applying the population attributable fraction calculated above to
Ontario bladder cancer statistics among the general population.
3.2 Methods
This study used a systematic approach to estimate the proportion of bladder
cancer in Ontario that can be attributed to occupational exposures. The population
attributable risk (PAR) was calculated to determine the burden of bladder cancer among
workers in Ontario. These methods were based mainly on the methodology endorsed
by the World Health Organization (WHO) for estimating the environmental burden of
disease at the national and local levels by Driscoll et al. (2004), which includes:
i. The identification of known occupational bladder carcinogens
ii. The estimation of the proportion of the population with exposure to the
carcinogen
iii. Ascertaining the relative risk for bladder cancer from the literature

14
iv. Calculation of the population attributable risk, by combining the
information on the fraction of the population exposed with the data on the
relative risks.
The first step in the calculation of the population attributable risk involved
determining bladder carcinogens that are relevant in Ontario. The listing of occupational
carcinogens by Siemiatycki et al. (2004) served as the main source of bladder
carcinogen identification. This listing is based largely on the evaluations published by
the International Agency for Research on Cancer (IARC).
The IARC Monograph Program evaluates the carcinogenic risk of chemicals to
humans and publishes critical reviews evaluating the evidence on a wide range of
exposures. The evaluations are conducted by an international working group of experts.
Each monograph contains information on the extent of past and present human
exposure to the agent(s) chosen for evaluation as well as information on the physical
and chemical properties of the agent being reviewed. The overall evaluation of human
carcinogenicity is based on epidemiologic studies, experimental evidence in animals,
and other relevant evidence on genotoxicity, mutagenicity and metabolism. The IARC
classifications are found in Table 5.

15
Table 5 – IARC Classifications
Group Description of group 1 The agent, mixture, or
exposure circumstance is carcinogenic to humans
2A The agent, mixture, or exposure circumstance
is probably carcinogenic to humans
2B The agent, mixture, or exposure circumstance
is possibly carcinogenic to humans
3 The agent, mixture, or exposure circumstance
is not classsifiable as to its carcinogenicity to humans
4 The agent, mixture, or exposure circumstance
is probably not carcinogenic to humans
(IARC, 2004)
The IARC Monographs are considered an authoritative source of information on the
carcinogenicity of various human exposures (IARC 2004; Siemiatycki et al., 2004).
Without such evaluations, it would be difficult for an individual investigator to assess
causality, as this requires judgment which could be easily biased if based on the
assessment of a single individual. It is important to have some understanding of how the
IARC evaluations take place as this study relied on these authoritative assessments to
determine which carcinogens would be included in the PAR calculation. Without the
evaluations such as those of IARC and Siemiatycki et al. (2004) it would be difficult to
compile an adequate list of occupational carcinogens related to bladder cancer.
From this list, a list specifically pertaining to bladder carcinogens was compiled.
This list of carcinogens was then compared to the carcinogens listed on the CAREX
Canada database to determine if they are relevant exposures in Ontario.

16
The second step in the PAR calculation was based entirely on the data contained
in the Ontario-specific portion of the CAREX Canada database. To estimate the
proportion of Ontario workers exposed to carcinogens related to bladder cancer, the
number of workers in the industrial sector or occupations that are exposed to the
carcinogens was obtained from the CAREX Canada database. Similar methodology
was recently used in a global estimate of the burden of occupational disease (Ezzati et
al., 2002; WHO, 2002; Concha-Barrientos et al.,2004).
The methods endorsed by the WHO assess the environmental burden of disease
(Driscoll et al., 2004). This method for estimating the proportion of people exposed to
occupational carcinogens requires the following information:
i. the proportion of the workforce employed in each sector
ii. the proportion of the workers exposed to individual carcinogens
iii. the likely turnover of workers
iv. the estimated level of exposure
v. the proportion of the population who are in the workforce.
The third step in the PAR calculation involved conducting a search of the scientific
literature. The search was systematic in that the search terms were defined and a priori
inclusion and exclusion criteria were outlined. Data from the studies included was
consistently extracted and compiled in an evidence table, also known as a data
extraction table. Part of this data extraction included an assessment of thoroughness of
each study’s exposure information. A summary risk estimate was calculated for each
bladder carcinogen under study, as well as tests for heterogeneity conducted.
Sensitivity analyses were conducted to explore any heterogeneity as well as to test the
effects on the calculation of the PAR.

17
The final step in the PAR calculation was to combine the individual PAR’s calculated
for each carcinogen to obtain an overall PAR as per the methods of Nurminen and
Karjalainen, 2001:
PARoverall= 1-(1-PARa) X (1-PARb)….. where,
PARa is related to carcinogen a, PARb is related to carcinogen b and so on.
Alternatively, depending on the PAR values obtained, the PARoverall can be the sum of
the exposure-specific PARs, if the values obtained are small (Steenland and Armstrong,
2006).
The data contained within the CAREX Canada database reflects the current
exposure experience in Ontario. However, the methods proposed by Driscoll et al.
(2004) involve estimating the proportion of the workforce ever exposed to occupational
carcinogens so that a measure of the current burden of disease can be estimated. The
final step in estimating the burden of bladder cancer was to apply the PAR to Ontario-
specific incidence data.
3.3 Sources of Data
3.3.1 CAREX Canada Database
The CAREX database, International Information System on Occupational Exposure to
Carcinogens, was developed by the Finnish Institute for Occupational Health (FIOH) as
a tool to estimate the burden of occupational cancer in Europe. The CAREX database
estimates the number of exposed workers by country, carcinogen and industry, and
provides selected exposure data. The estimates were obtained using labour force and
exposure estimates from two reference countries, Finland and the United States. It
contains estimates of the number of workers exposed to 139 carcinogens as ranked by

18
the International Agency for Research on Cancer: Group 1, carcinogenic to humans;
Group 2A, probably carcinogenic to humans; and selected agents in Group 2B, possibly
carcinogenic to humans are considered in the database. Industries are grouped in 55
categories using the International Standard Industry Codes,ISIC-2 (Kauppinen et al.,
1998).
CAREX Canada is the Canadian version of the database containing information
from British Columbia and Ontario. Preliminary exposure estimates in Ontario have
been generated and added to the CAREX Canada database (Demers et al., 2007).
Providing exposure estimates for hundreds of industrial sectors was beyond the
resources available to CAREX Canada. However, detailed labour force estimates were
added to the database. The ISIC-2 categories were converted into Census industry
categories. Data from the Ontario portion of the 2001 Census of Canada were entered
into the CAREX database to estimate the number of workers potentially exposed to
carcinogens by industry. The preliminary data contained in the CAREX Canada
database was based on proportions of workers in Finland and/or the United States.
Recently, the estimates have been refined through the assessment of a team of
Canadian occupational hygienists using available Ontario-specific exposure information,
professional judgment and a review of the literature. Developing estimates within the
CAREX Canada database involved multiple stages (Demers et al., unpublished).
Stage 1
Industry-specific prevalence estimates from Finland and the United States were
used initially, because they were part of the original CAREX system. Prevalence
estimates from Finland were based on two sources; the Finnish national register of
workers exposed to carcinogens, held by FIOH since 1979, and a comprehensive
estimation survey, SUTKEA, conducted by the hygiene staff of FIOH in the late

19
1980s/early 1990s based on industrial hygiene data collected for research projects or
compliance testing. US prevalence estimates were based on the National Occupational
Exposure Survey (NOES) carried out by NIOSH from 1981-83. The NOES used site
visits to 4,490 establishments to gather data by occupational category within industry
sector.
For each carcinogen/industry combination, a local expert in occupational
exposure assessment determined whether conditions in Ontario were closer to those in
that industry in Finland or in the US, or whether an average of the two was most
applicable. Based on the Finnish and U.S data, the assessors generated initial
estimated of the numbers of workers exposed to the carcinogens included in CAREX
Canada.
Stage 2
The next stage involved improving these initial estimates to identify exposures
that were overly underestimated or overestimated. These were identified as exposures
that were not comparable between the reference country and Ontario due to industrial
infrastructure, geology or major regulatory differences, as per the assessors’ judgement.
The most common carcinogens were prioritized for further evaluation to improve
estimates.
Stage 3
Next, the specific exposure information underlying the Finnish and US
prevalence data for each of these common carcinogens were reviewed by several
Canadian occupational hygienists (each with training at either the masters or doctorate
degree level) to assess whether similar conditions identified exist in Ontario and, where

20
possible, to improve the estimates. The assessors used a combination of professional
judgment and review of both the published and the grey literature regarding exposure.
Stage 4
Workplaced exposure measurement data were obtained from Ontario’s Ministry
of Labour, which maintains a database of air monitoring measurements collected in
workplaces to measure compliance with regulatory exposure limits both personal
(collected in the breathing zone of the worker) and area (collected at a stationary point in
the workplace) measurements are included. Measurements made between 1981 and
1996 for nine carcinogens were obtained: asbestos (n=757), benzene (n=1,304),
cadmium (n=924), ethylene dibromide (n=10), formaldehyde (n=7,607), lead (n=7,688),
perchloroethylene (n=2,666), crystalline silica (n=4,592), and styrene (n=5,945). In
addition, radiation exposure data from the National Dose Registry, operated by the
Radiation Protection bureau of Health Canada were also obtained. The industry
information on both data sources was recoded and the aggregated data was added to
the CAREX system for easy retrieval. Members of the study team reviewed these data
to identify potentially exposed groups that were not identified in the initial estimates.
Agents such as alcoholic beverages and betel quid with tobacco that are not useful for
occupational surveillance in Canada were eliminated from the original CAREX database.
As well, IARC has classified certain industries and occupations as carcinogenic. These
exposure circumstances have also been eliminated from the CAREX Canada database
since the underlying carcinogens have yet to be identified. Appendix A lists the
carcinogens currently included in the CAREX Canada database.
The CAREX Canada database provides information through a number of screens in a
Microsoft Access interface. The main screen contains information on exposure
estimates by region, carcinogen and industry sector. Information is provided regarding

21
the total number of workers by industry sector, as well as the number of workers
exposed to a particular carcinogen within that industry sector. In addition to the
exposure estimates, the CAREX Canada database contains information regarding the
definitions of the industries and carcinogens included, the number of workers within
occupational groups according to the 2001 Census, and information on subgroup
exposures where the data are available. The CAREX Canada database is useful for on-
going surveillance of occupational cancer in Ontario since it provides provincial
estimates of the number of exposed workers using expertise of Canadian occupational
hygienists and local labour force data where available. More information on the CAREX
Canada database is available on the CAREX Canada website
(http://www.carexcanada.ca/) and the Worksafe BC website
(http://www.worksafebc.com/contact_us/research/research_results/res_60_10_340.asp).
3.3.2 2001 Canadian Census
The 2001 Census was used to calculate prevalence of exposure in Ontario workers that
are potentially exposed to bladder carcinogens. To estimate the proportion of Ontario
workers in the total population exposed to a given occupational bladder cancer
carcinogen, the estimation was limited to those between the ages of 15 to 64 years to
account for those of working age. Since the estimates of the number of workers
exposed to carcinogens captured in the CAREX Canada database are based on the
2001 Census, the same data source will be used to calculate the prevalence of
exposure: the number of workers exposed to bladder cancer carcinogens will serve as
the numerator, and the Ontario population aged 15 to 64 years will serve as the
denominator.

22
3.3.3 Identification of Bladder Carcinogens Through Existing Literature
There is no single source available to determine which bladder carcinogens affect
Ontario workers. Thus an indirect method was utilized to determine occupations in
Ontario where workers are at risk for bladder cancer. IARC Group 1, Group 2A and
Group 2B served as the baseline for carcinogens that were considered in this study.
This was further filtered to known and suspected bladder carcinogens as per the listing
of occupational carcinogens by Siemiatycki et al. (2004). The final list of carcinogens
were those carcinogens that are both listed by Siemiatycki et al. (2004) and for which
data are available in the CAREX Canada database. IARC also identifies carcinogenic
industries or occupations. In such cases the actual carcinogens are not easily identified,
nor will such exposures be identifiable in the CAREX Canada database.
3.3.4 Cancer Surveillance On-Line
To determine the burden of occupational bladder cancer in Ontario the attributable
fraction calculated was applied to the absolute number of incident cases of bladder
cancer obtained through the Cancer Surveillance On-line website, http://dsol-
smed.phac-aspc.gc.ca/dsol-smed/cancer/index_e.html.
Cancer Surveillance On-Line provides the most current publicly available cancer
statistics in Canada. Trends in cancer incidence over time, by province/territory, and by
age group for forty-five cancers, including bladder cancer, are available. The source of
incidence data is the Canadian Council of Cancer Registries and population estimates
are provided by Statistics Canada.
The age-range was restricted to those between the ages of 30 to 75 years. The lower
age limit of 30 years was chosen to account for the latency period of bladder cancer and
the likelihood that the potential exposure period before the age of 30 years is too short to

23
produce a pathological effect. Although the incidence of bladder cancer increases with
age, bladder cancer also has a relatively long latency, therefore the upper limit of 75
years was chosen.
3.4 Literature Review Search Terms and Inclusion Cr iteria
Once the carcinogens and occupations at risk for bladder cancer in Ontario were
identified, a review of the literature for studies to be included in the attributable risk
calculation was conducted on PubMed. Search terms included: bladder cancer, urinary
bladder neoplasms, polycyclic aromatic hydrocarbons, 2-napthylamine, aromatic
amines, vehicle emissions, automobile exhaust, and diesel exhaust. To ensure the
comprehensiveness of the search, the search term “occupational exposure” was
combined with “bladder cancer” and the reference lists of included articles were scanned
to identify studies that may have been missed.
The literature review was conducted in two phases. The first phase was a title and
abstract review, in which the inclusion criteria were be applied to the title and abstracts
of the identified studies. The inclusion criteria were case-control and cohort studies on
occupation and bladder cancer that have controlled for smoking, since smoking is a
major confounder for bladder cancer. Studies based on populations in North America,
Finland and Scandinavia and Western Europe were included to approximate risks for
bladder cancer in Ontario from countries with similar industrial development. As well,
the risks for bladder cancer vary geographically; therefore, counties with similar risks for
bladder cancer were ideally included. Only when risk estimates were not available for
these countries will populations from other countries be considered. Studies that have
not controlled for smoking, studies that have used cancer controls, and studies with
insufficient exposure information were excluded. In situations where it is unclear

24
whether the inclusion criteria have been met, the assessment was made through
information available in the entire article.
Studies included based on the assessment of the first phase were further assessed in
the second phase of the literature review, which included a review of the entire study,
data extraction of elements determined a priori, and an assessment of the exposure
quality of each study. The elements extracted from each included study are available in
the evidence tables presented in Appendix C.
The quality of the exposure assessment in each study was assessed on a scale of 1 to 5
by the student. Studies with exposure quality of 1 were not included in the calculation of
the summary risk estimate. This allowed for sensitivity analysis by quality of exposure
assessment. Each study was be rated as follows:

25
Table 6 - Exposure Quality Rating
Exposure Quality Rating Criteria
1 – poor exposure information Study includes occupations or industries
where the carcinogen of interest may be
present but occupational or industrial
groupings are too broad to glean any
information on the carcinogen(s) of
interest.
2 – fair exposure information Study includes occupational groups
where the carcinogen of interest is
prevalent but other exposures are
possible and not accounted for.
3 – moderate exposure information Study includes occupational groups
where the carcinogen of interest is
prevalent and other exposures have been
accounted for.
4 – good exposure information Study includes qualitative exposure
information on the carcinogen(s) of
interest.
5 – excellent exposure information Study includes quantitative measures of
exposure levels to carcinogen(s) of
interest.

26
Figure 1 – Flow diagram of Overall Methods
1. Identify bladder carcinogens in Ontario
2. Estimation of summary risk estimate for each bladder carcinogen identified to be used in calculation of population attributable risk (PAR)
3. Estimation of corresponding proportion of the population exposed to each carcinogen to be used in calculation of PAR
4. Calculation of overall PAR based on component attributable fractions
5. Application of overall attributable fraction to Ontario bladder cancer statistics
Source: IARC Group 1 and Group 2A, Siemiatycki et al
(2004) & CAREX Canada
Method: Systematic approach to literature, summary risk
estimates calculated using RevMan
Source: CAREX Canada & 2001 Canadian Census
Method: Nurimen et al., 2001, Steenland 2006 and Driscoll
et al 2004
Source: Cancer Surveillance On-Line

27
3.5 Calculating Summary Risk Estimates
Review Manager 4.2 was used to calculate the summary risk estimates used in
the PAR calculation. The following steps were undertaken:
1. Define the studies to combine
Separate summary estimates were calculated for studies on incidence and mortality,
provided the data were available. Studies were combined based on exposure to specific
bladder carcinogens. The CAREX Canada database estimates the number of people
exposed to carcinogens by industry for both men and women combined. It is not
possible to obtain separate results by gender using the CAREX Canada database. Nor
is it possible to obtain separate results by race. Therefore, a separate analysis by
gender or race was not possible.
2. Evaluate the statistical heterogeneity of the data
Heterogeneity was evaluated using the I2 statistic. The I2 statistic measures the extent
of inconsistency and is interpreted as the proportion of total variation in the study
estimates that is due to heterogeneity between studies rather than sampling error
(Higgins et al., 2003). A value of 0% indicates no observed heterogeneity, and larger
values indicate increasing heterogeneity. Tests of heterogeneity statistically assess
whether differing results from different studies could have come from the same
population. However, tests for heterogeneity have notoriously weak power and should
be complemented by sound judgment.
3. Estimate a common effect
4. Explore and explain any heterogeneity

28
Sensitivity analyses were conducted to explore any heterogeneity found.
5. Assess the potential for bias
Funnel plots were produced to assess the potential for publication bias.
Summary risk estimates were calculated using the generic inverse variance method.
Standard errors were calculated from the 95% confidence intervals of the adjusted risk
estimates using the following calculation:
Standard Error = log(upper limit) – log(lower limit)/2(1.96)
3.6 Population Attributable Risk Calculation
Calculation of the population attributable risk can answer the question: what
proportion of bladder cancer in the population is due to occupational carcinogens?
Once the summary risk estimates were calculated through the pooled analysis, and the
proportion of Ontario workers exposed to bladder carcinogens determined, the
component population attributable risk (PAR) for each carcinogen identified was
calculated as:
PAR= (Pe) (RR-1)/ (Pe (RR-1) + 1)
Where,
Pe = proportion of individuals exposed in the total population
RR = the relative risk of the disease in the exposed subjects
Given that there are multiple potential risk factors for bladder cancer in Ontario,
the calculation of the attributable fraction due to all of the risk factors simultaneously will
be required. According the to the methodology of Nurminen (2001), an overall
attributable fraction for multiple risk factors in terms of the component attributable
fractions can be calculated using the following formula:

29
AF= 1-(1-AFa) x (1-AFb)…..,
under the assumption of statistical and biological independence between the factors.
Alternatively, depending on the PAR values obtained, the PARoverall can be the sum of
the exposure-specific PARs, if the values obtained are small (Steenland et al., 2006).

30
Chapter 4: Results
4.1 Identification of Known Occupational Bladder Ca rcinogens
Based largely on the International Agency for Research on Cancer Monograph
Program, Siemiatycki et al. (2004) listed 28 definite human occupational carcinogens
(IARC group 1), 27 probable human occupational carcinogens (IARC group 2A), 113
possible human occupational carcinogens (IARC group 2B) and 18 occupational and
industries for which there is a possible, probable or definite excess risk of cancer.
Occupational bladder carcinogens and carcinogenic circumstances for which the
evidence was deemed to be strong by Siemiatycki et al. (2004) were: aluminum
production, 4-aminobiphenyl, auramine manufacture, benzidine, coal gasification,
magenta manufacture, 2-naphthylamine and the rubber industry. Occupational bladder
carcinogens and carcinogenic circumstances for which the evidence was deemed to be
suggestive of increased bladder cancer risk were: ben[a]antracene, benzidine-based
dyes, benzo[a]pyrene, boot and shoe manufacture and repair, 4-chloro-ortho-toluidine;
coal tars and pitches, coke production, dibenz[a,h]antracene, diesel engine exhaust,
hairdressers and barbers, 4,4’-methylenbe bis(2-chloroaniline), mineral oils untreated
and mildly treated, ortho-toluidine, painters and petroleum refining.
Table 5 identifies which agents in the CAREX Canada database have also been
included by Siemiatycki et al (2004) as bladder carcinogens.
31
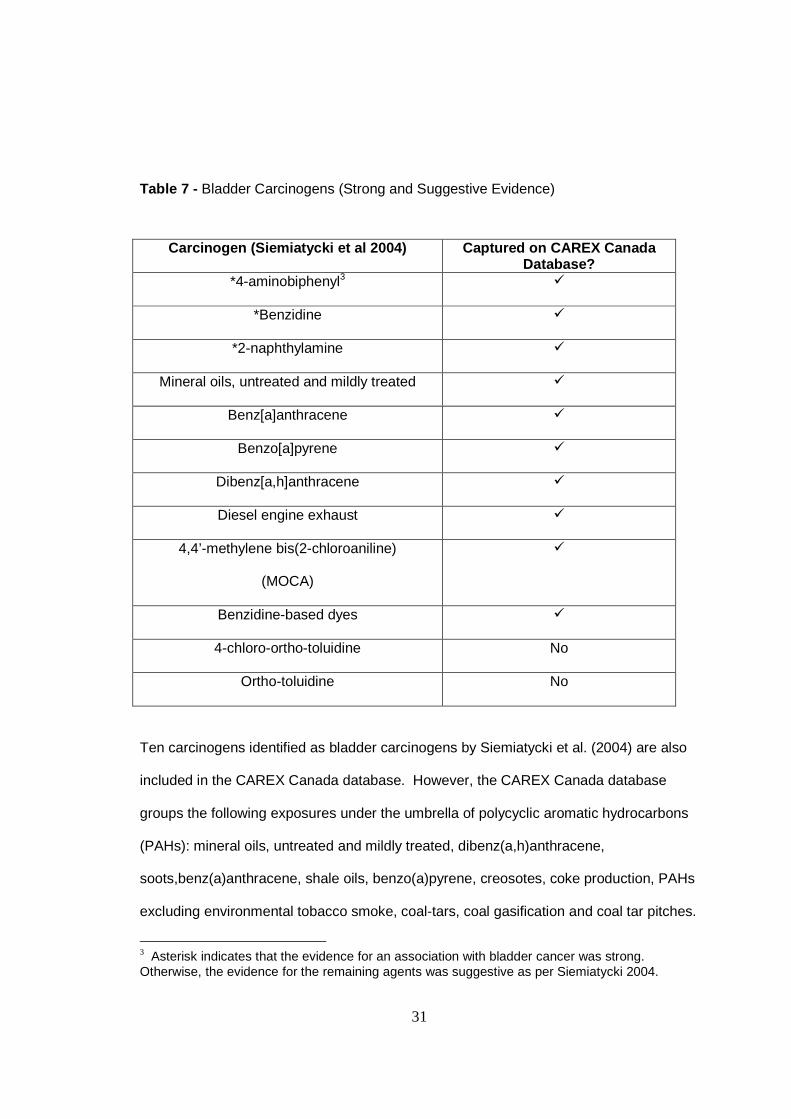
Table 7 - Bladder Carcinogens (Strong and Suggestive Evidence)
Carcinogen (Siemiatycki et al 2004) Captured on CAR EX Canada
Database? *4-aminobiphenyl3 �
*Benzidine �
*2-naphthylamine �
Mineral oils, untreated and mildly treated �
Benz[a]anthracene �
Benzo[a]pyrene �
Dibenz[a,h]anthracene �
Diesel engine exhaust �
4,4’-methylene bis(2-chloroaniline)
(MOCA)
�
Benzidine-based dyes �
4-chloro-ortho-toluidine No
Ortho-toluidine No
Ten carcinogens identified as bladder carcinogens by Siemiatycki et al. (2004) are also
included in the CAREX Canada database. However, the CAREX Canada database
groups the following exposures under the umbrella of polycyclic aromatic hydrocarbons
(PAHs): mineral oils, untreated and mildly treated, dibenz(a,h)anthracene,
soots,benz(a)anthracene, shale oils, benzo(a)pyrene, creosotes, coke production, PAHs
excluding environmental tobacco smoke, coal-tars, coal gasification and coal tar pitches.
3 Asterisk indicates that the evidence for an association with bladder cancer was strong. Otherwise, the evidence for the remaining agents was suggestive as per Siemiatycki 2004.

32
In addition to the carcinogens identified above, based on the IARC classifications
Siemiatycki et al. (2004) also identified carcinogenic occupations and industries. These
occupations and industries have been identified as such because the evidence has
shown there to be increased risks for the development of cancer; however, the specific
carcinogens involved have yet to be identified. This presents a problem in the
estimation of the proportion of bladder cancer in Ontario that is due to occupational
exposure since the CAREX Canada database provides information on the number of
workers exposed by carcinogen. In their assessment of occupations and industries
entailing a risk of cancer, Siemiatycki et al. (2004) tried to identify the suspected
carcinogenic substances involved. The majority of identified carcinogens are already
included in Table 5-1 above. The following occupations and industries have been
identified by Siemiatycki et al (2004) as involving an excess risk of bladder cancer:

33
Table 8 - Industries and Occupations with Excess Risks for Bladder Cancer
Occupation or Industry Suspected Substance (Siemiatycki et al., 2004)
Substance captured on CAREX Canada
Database? Pitch volatiles � Aluminum production
Aromatic amines � - specific aromatic
amines included
2-naphthylamine �
auramine No
Other chemicals Too broad
Auramine manufacture
pigments Too broad
Leather dust No
benzene �
Boot and shoe manufacture and repair
Other solvents Too broad
Coal tar �
Coal-tar fumes �
Coal gasification
PAHs �
Coke production Coal-tar fumes �
Dyes (aromatic amines,
amino-phenols with
hydrogen peroxide)
Too broad
solvents Too broad
propellants Too broad
Hairdressers and barbers
aerosols Too broad
Magenta manufacture magenta No

34
Occupation or Industry Suspected Substance (Siemiatycki et al., 2004)
Substance captured on CAREX Canada
Database? Ortho-toluidine No
4,4’-methylene bis(2-
methylaniline)
�
Ortho-nitrotoluene No
Painters No suspected substances
identified
No
Petroleum refining PAHs �
Aromatic amines � Rubber industry
solvents Too broad
Based on a combination of the listing by Siemiatycki et al. (2004) and the
carcinogens that are included in the CAREX Canada database using Ontario-specific
estimates, the bladder carcinogens identified as hazards to Ontario workers and which
will be included in this analysis are: polycyclic aromatic hydrocarbons (PAHs), diesel
exhaust, beta-naphthylamine, 4-aminobiphenyl, benzidine, and benzidine-based dyes.
Due to the small number of workers exposed in Ontario to the latter four agents, these
agents have been grouped into a larger group known as aromatic amines.

35
Table 9 – Nature of evidence for bladder carcinogens included
Nature of evidence Bladder carcinogen
IARC Siemiatycki et al (2004) PAHs coal tars and pitches 1 suggestive mineral oils, untreated and mildly treated 1 suggestive benz[a]anthracene 2B suggestive benzo[a]pyrene 1 suggestive dibenz[a,h]anthracene 2A suggestive Aromatic amine dyes 4-aminobiphenyl 1 strong benzidine 1 strong Beta-naphthylamine 1 strong Diesel engine exhaust 2A suggestive 4,4'-methylene bis(2-chloroaniline) 1 suggestive
The CAREX Canada database definition of occupational exposure to PAH includes the
following scenarios (Demers et al. 2007):
“Inhalatory exposure at work to PAHs with at least four aromatic rings (eg,
benzo(a)pyrene, benz(a)anthracene, dibenz[a,h]anthracene) likely to exceed
significantly the nonoccupational levels in urban air (usually <0.005 ug/m3 of
benzo(a)pyrene). Includes coal tar pitch, coal tars, soots, creosotes, shale oils, and
untreated/mildly treated mineral oils. Excludes environmental tobacco smoke (assessed
separately) and bus/truck/van/taxi drivers exposed to engine exhaust (low exposure)”.
The CAREX Canada database defines occupational exposure to diesel as:
“Inhalatory exposure at work to diesel engine exhaust likely to exceed significantly the
nonoccupational background level in urban air (usually <0.6 mg/m3, often <0.1 mg/m3,
measured as nitrogen dioxide)”.

36
4.2 Number and Proportions of Ontario Workers Expos ed to Bladder Carcinogens
To determine the number and proportion of Ontario workers exposed to bladder
carcinogens, the proportion of the Ontario workforce within each industry sector was
obtained from the CAREX Canada database. The CAREX Canada database contains
Ontario-specific information on the number of employed persons within each industry
sector based on the 2001 Census. Table 8 below shows the number and proportion of
Ontario workers in 52 industrial sectors. The CAREX Canada database provides
information for specific manufacturing sectors, but for ease of presentation 24
manufacturing sectors have been collapsed into an overall combined manufacturing
industry below.
Table 10 – Proportion of Ontario workforce employed by industry sector
Industry No. employed persons in
Ontario (2001 Census) Proportion of Ontario
Workforce Wholesale and retail trade and restaurants and hotels 1,472,085 0.226 Financing insurance real estate and business services 1,206,300 0.185 All manufacturing combined 941,090 0.144 Medical dental and other health and verterinary services 450,300 0.069 Education services 409,145 0.063 Construction 354,060 0.054 Public administration and defense 334,025 0.0513 Recreational and cultural services 247,280 0.038 Personal and household services 214,560 0.033 Land transport 172,955 0.026 Agriculture and hunting 121,810 0.019 Welfare institutions 121,560 0.019 Printing publishing and allied industries 94,370 0.014 Business professional and other organization 85,505 0.013 Communication 58,800 0.009

37
Industry No. employed persons in
Ontario (2001 Census) Proportion of Ontario
Workforce Electricity gas and steam 43,360 0.007 Iron and steel basic industries 40,590 0.006 Services allied to transport 32,045 0.005 Air transport 31,090 0.005 Metal ore mining 13,265 0.002 Beverage industries 13,245 0.002 Forestry and logging 13,165 0.002 Non-ferrous metal basic industries 11,555 0.002 Sanitary and similar services 10,495 0.002 Other mining 8,700 0.001 Water works and supply 6,125 0.001 Water transport 2,855 <0.001 Fishing 1,110 <0.001 Crude pertoleum and natural gas production 915 <0.001 Coal mining 105 <0.001 TOTAL EMPLOYED PERSONS 6,512,465 1
Over half (55%) of Ontario’s workforce is concentrated within three industry sectors:
wholesale and retail trade and restaurants and hotels (23%), financing insurance real
estate and business services (18%), and manufacturing (14%). Figure 2 below shows
the ten industry sectors in Ontario with the greatest proportions of workers based on
information compiled from the CAREX Canada database.

38
Top Ten Industry Sectors in Ontario (CAREX Canada)
1472085
1206300
941090
450300409145
354060 334025
247280214560
172955
wholesale andretail trade andrestaurants and
hotels
financinginsurance real
estate andbusinessservices
all manufacturingcombined
medical dentaland other healthand verterinary
services
educationservices
construction publicadministrationand defense
recreational andcultural services
personal andhouseholdservices
land transport
Industry Sector
No.
Per
sons
Em
ploy
ed
Figure 2 – Top Ten Ontario Industry Sectors (CAREX Canada)

39
The next step is to determine the proportion of workers in each industry sector
potentially exposed to the selected bladder carcinogens. The CAREX Canada database
contains Ontario-specific estimates based on the assessment of industrial hygienists and
available Ontario-specific labour data. The following tables present the numbers and
proportions of Ontario workers potentially exposed to PAHs, diesel exhaust and aromatic
amines within each industry sector.
Table 11 – Number and proportion of Ontario workers potentially exposed to PAHs
Industry No. workers exposed to
PAH Proportion workers
exposed within sector
Wholesale and retail trade and restaurants and hotels 59,156 0.040 Personal and household services 14,942 0.070 Public administration and defense 11,254 0.034 Manufacture of transport equipment 5,109 0.026
Manufacture of fabricated metal products except machinery and equipment 4,963 0.049 Land transport 4,097 0.024 Manufacturing of machinery except electrical 2,784 0.037 Iron and steel basic industries 2,581 0.064 Medical dental and other health and verterinary services 1,973 0.004 Non-ferrous metal basic industries 1,515 0.131 Manufacture of plastic products not elsewhere classified 1,504 0.026 Financing insurance real estate and business services 1,391 0.001 Construction 1,334 0.004 Welfare institutions 696 0.006 Recreational and cultural services 597 0.002 Food manufacturing 559 0.006 Sanitary and similar services 536 0.051 Business professional and other organization 487 0.006 Air transport 454 0.015

40
Industry No. workers exposed to
PAH Proportion workers
exposed within sector Metal ore mining 406 0.031 Manufacture of industrial chemicals 327 0.018 Education services 307 0.001 Agriculture and hunting 290 0.002 Manufacture of other non-metallic mineral products 273 0.018 Electricity gas and steam 247 0.006 Manufacture of glass and glass products 245 0.034 Forestry and logging 220 0.017 Other mining 160 0.018 Printing publishing and allied industries 155 0.002
Manufacture of wood and wood and cork products, except furniture 148 0.004 Manufacture of china pottery and earthenware 134 0.043 Communication 130 0.002 Manufacture of paper and paper products 129 0.004 Services allied to transport 118 0.004
Manufacture of electrical machinery apparatus appliances and supplies 103 0.001 Water transport 64 0.022 Manufacture of miscellaneous products of petroleum and coal 54 0.009 Manufacture of instruments photographic and optical goods 47 0.002 Manufacture of rubber products 44 0.004 Other manufacturing industries 41 0.001 Beverage industries 26 0.002 Manufacture of textiles 26 0.001 Manufacture of wearing apparel except footwear 23 0.001 Water works and supply 21 0.003 Crude pertoleum and natural gas production 12 0.013 Fishing 8 0.007
Manufacture of furniture and fixtures except primary metal 7 <0.001 TOTAL WORKERS EXPOSED to PAHs
119,779 Total % ON Workers Exposed ~ 0.02 to PAHs

41
Number of Ontario workers exposed to PAH by Industr y Sector
59156
1652014942
11254
40972581 1973 1515 1391 1334
0
10000
20000
30000
40000
50000
60000
70000
wholesale andretail trade andrestaurants and
hotels
allmanufacturing
combined
personal andhouseholdservices
publicadministrationand defense
land transport iron and steelbasic industries
medical dentaland otherhealth andverterinaryservices
non-ferrousmetal basicindustries
financinginsurance real
estate andbusinessservices
construction
Industry sector
No.
wor
kers
exp
osed
According to the CAREX Canada database, the total number of workers potentially
exposed to PAHs in Ontario is 119,779. The industries where the most workers are
exposed to PAHs in Ontario are: wholesale and retail trade and restaurants and hotels
(59,156 workers), all manufacturing industries combined (16,520 workers), personal and
household services (14,942 workers), and public administration and defense (11,254
workers). The industry in which the greatest proportion of workers is exposed to PAHs
is the basic non-ferrous metal industry with 13% of workers exposed.
Figure 3 – Ten Industry Sectors in Ontario with the most workers potentially exposed to PAHs

42
Table 12 - Number and proportion of Ontario workers potentially exposed to diesel exhaust
Industry No. workers exposed to
Diesel Exhaust Proportion workers
exposed Land transport 94,652 0.547 Wholesale and retail trade and restaurants and hotels 26,124 0.018 Construction 24,247 0.068 Public administration and defense 15,215 0.046 Personal and household services 8,592 0.040 Communication 7,902 0.134 Financing insurance real estate and business services 7,532 0.006 Forestry and logging 6,203 0.471 Sanitary and similar services 3,439 0.328 Metal ore mining 3,001 0.226 Manufacture of transport equipment 2,571 0.013 Food manufacturing 2,560 0.028 Manufacture of other non-metallic mineral products 2,550 0.168 Other mining 2,512 0.289 Medical dental and other health and veterinary services 2,399 0.005
Manufacture of wood and wood and cork products, except furniture 2,120 0.060 Recreational and cultural services 1,584 0.006 Agriculture and hunting 1,551 0.013
Manufacture of fabricated metal products except machinery and equipment 1,422 0.014 Non-ferrous metal basic industries 1,322 0.114 Iron and steel basic industries 1,027 0.025 Beverage industries 995 0.075 Printing publishing and allied industries 979 0.010 Manufacturing of machinery except electrical 899 0.012 Manufacture of paper and paper products 882 0.024 Water works and supply 667 0.109 Services allied to transport 650 0.020 Education services 613 0.001 Water transport 489 0.171

43
Industry No. workers exposed to
Diesel Exhaust Proportion workers
exposed
Business professional and other organization 414 0.005 Manufacture of plastic products not elsewhere classified 385 0.007 Air transport 385 0.012 Manufacture of industrial chemicals 335 0.019
Manufacture of furniture and fixtures except primary metal 333 0.007 Welfare institutions 284 0.002 Other manufacturing industries 271 0.009 Electricity gas and steam 268 0.006
Manufacture of electrical machinery apparatus appliances and supplies 205 0.002 Manufacture of other chemical products 176 0.005 Manufacture of wearing apparel except footwear 143 0.004 Coal mining 139 undefined Manufacture of glass and glass products 134 0.019 Manufacture of textiles 100 0.006 Manufacture of instruments photographic and optical goods 90 0.004 Manufacture of rubber products 72 0.006 Manufacture of china pottery and earthenware 50 0.016 Manufacture of miscellaneous products of petroleum and coal 45 0.007 Crude pertoleum and natural gas production 23 0.025 Tobacco manufacture 18 0.010 Fishing 10 0.009 Manufacture of footwear 10 0.004
TOTAL WORKERS EXPOSED to DIESEL EXHAUST 228,719
Total % ON Workers Exposed ~ 0.04 to Diesel Exhaust

44
Number of Ontario workers exposed to diesel exhaust by industry sector
94652
2612424247
15371 15215
8592 7902 7532 62033439
0
10000
20000
30000
40000
50000
60000
70000
80000
90000
100000
land transport wholesale andretail trade andrestaurants and
hotels
construction allmanufacturing
combined
publicadministrationand defense
personal andhouseholdservices
communication financinginsurance real
estate andbusinessservices
forestry andlogging
sanitary andsimilar services
Industry Sector
No.
wor
kers
exp
osed
to d
iese
l exh
aust
The total number of workers potentially exposed to diesel exhaust in Ontario is 228,719.
The industries where the most workers are exposed to diesel exhaust in Ontario are:
land transport (94,652 workers), wholesale and retail trade and restaurants and hotels
(26,124 workers), construction (24,247 workers), and all manufacturing sectors
combined (15,371 workers). The industry in which the greatest proportion of workers is
exposed to diesel exhaust is the land transport industry, with 55% of workers exposed.
Figure 4 – Ten Industry Sectors on Ontario with the most workers potentially exposed to diesel exhaust

45
Table 13 shows the number and proportion of Ontario workers potentially exposed to
aromatic amines.
Table 13 - Number and Proportion of Ontario Workers Potentially Exposed to Aromatic Amines
Carcinogen No. workers exposed in
Ontario
Proportion of Ontario
workforce exposed
4-aminobiphenyl 20 (nominal estimate) 3.07 x10⁻⁶
Benzidine 10 (nominal estimate) 1.50 x10⁻⁶
2-naphthylamine 81 (Finland & United
States)
1.24 x10⁻⁵
Benzidine-based dyes 10 (nominal estimate) 1.50 x10⁻⁶
4,4’-methylene bis(2-
chloroaniline)
(MOCA)
negligible N/A
Very few workers were estimated to be exposed to 4-aminobiophenyl, benzidine, and
benzidine-based dyes. The estimate for exposure to beta-naphtylamine was based on
Finnish and US estimates. The estimates for workers exposed to PAHs and diesel
exhaust were based on Ontario data. For 4-aminobiphenyl, a nominal estimate was
made. The hygienists assessing this exposure in Ontario were unaware of any data
specifically on 4-aminobiphenyl. Industry Canada’s Trade Data Online database groups
4-aminobiphenyl under aromatic monoamines not elsewhere specified. Therefore, it is
feasible that 4-aminbiohenyl is used in commercial and non-commercial research
settings in Ontario, and a nominal estimate of 20 exposed persons was made.
A nominal estimate was also made for benzidine and benzidine-based dyes. Benzidine
and benzidine dihydrochloride are listed on the List of Prohibited Toxic Substances

46
under the Canadian Environmental Protection Act, 1999. However, there are potential
exposure scenarios permitting limited use in Canada, such as in a laboratory for
scientific research. The Chemical Control Branch of Environment Canada, which does
not currently collect emissions data for these agents, states that for benzidine and
benzidine dihydrochloride emission data should be collected for the National Pollutant
Release Inventory database. Therefore, it may be possible for some workers to be
exposed to emissions, and a nominal estimate of 10 exposed workers in Ontario was
made.
To estimate the proportion of the Ontario workforce that is exposed to bladder
carcinogens, the proportion of the workforce in each industry sector is multiplied by the
proportion of workers in that sector who are exposed to the carcinogen. Table 14 below
shows the proportion of the workforce exposed to bladder carcinogens. All the
proportions are summed to estimate the proportion of the total workforce exposed to
bladder carcinogens.
Table 14 – Number and Proportion of Ontario workforce exposed to bladder carcinogens
Bladder carcinogen
No. ON workers exposed
Proportion ON workforce exposed
PAH 119,848 0.018 diesel exhaust 228,719 0.035 4-aminobiphenyl 20 3.07x10⁻⁶ benzidine 10 1.50x10⁻⁶ benzidine-based dyes 10 1.50x10⁻⁶ 2-naphthylamine 81 1.24x10⁻⁵ 4,4'methylense bis(2-chloroaniline) (MOCA) negligible N/A TOTAL 348,688 0.054

47
In Ontario, an estimated 348, 688 workers are exposed to bladder carcinogens. The
proportion of the workforce currently exposed to “above background” levels of bladder
carcinogens is approximately 5.4%.
Using the method endorsed by the World Health Organization (Driscoll et al., 2004), the
proportion of the workforce ever exposed to bladder carcinogens was calculated. A
workforce turnover factor of four and a partitioning factor of 0.1 (high-level exposure) and
0.9 (low-level exposure) was used to estimate the proportion of Ontario workers who are
exposed to high-levels and low-levels of bladder carcinogens.
Table 15 – Proportion of Ontario workforce and population ever/never exposed to
bladder carcinogens
Bladder carcinogen Proportion of workforce ever exposed
Proportion of population never
exposed PAH 0.074 0.938 diesel exhaust 0.140 0.882 2-naphthylamine 4.98E-05 0.999 aromatic amines 2.46E-05 0.999
Table 16 – Proportion of Ontario workforce and population exposed to high levels of
bladder carcinogens
Bladder carcinogen Proportion of workforce ever exposed high level
Proportion of population ever
exposed high level PAH 0.007 0.006 diesel exhaust 0.014 0.012 2-naphthylamine 4.98E-06 4.18E-06 aromatic amines 2.46E-06 2.06E-06

48
Table 17 - Proportion of Ontario workforce and population exposed to low levels of
bladder carcinogens
Bladder carcinogen Proportion of workforce ever exposed low level
Proportion of population ever
exposed low level PAH 0.066 0.056 diesel exhaust 0.126 0.106 2-naphthylamine 4.48E-05 3.76E-05 aromatic amines 2.21E-05 1.86E-05
The economically active population (0.84) was calculated as the number of employed
persons in Ontario according to the CAREX Canada database (6, 512, 465) divided by
the number of working-aged people in Ontario aged 15 to 64 years according to the
2001 Census (7, 705, 140). Multiplying the economically active population with the
proportion of the workforce ever exposed to bladder carcinogens at high- and low-levels
yields an estimate of the proportion of the Ontario population ever exposed at high- and
low-levels.
4.3 Risk estimates to be used in PAR calculation
4.3.1 Pooled risk estimates
Bladder cancer and occupational exposure to PAH
In the literature search, seven studies met the inclusion/exclusion criteria and
reported results for bladder cancer incidence or mortality and exposure to PAHs.
Results of these studies are shown in the tables found in Appendix C and results of the
pooled analysis are shown in Figure 5. Of the seven studies only Moulin et al. (2000)
reported on bladder cancer mortality (SMR 1.77, 95% CI 0.71 to 3.64). Since there was
only a single study reporting on bladder cancer mortality associated with exposure to
PAHs, this SMR is the estimate that will be used in the calculation of PAR for bladder
cancer mortality.

49
Of the six studies reporting on bladder cancer incidence after PAH exposure, two
case-control studies reported statistically significant increased risks of 1.97 (95% CI 1.10
to 3.51) (Tremblay et al., 1995) and 1.6 (95% CI 1.1 to 2.3) (Pesch et al., 2000). The
remaining four studies (3 cohort studies, 1 case-control study) (Zeegers et al., 2001;
Romundstad et al., 2000a; Romundstad et al., 2000b; Clavel et al., 1994) reported
slightly increased risks that were not statistically significant ranging from 1.18 (95% CI
0.62 to 2.24) to 1.37 (95% CI 0.96 to 1.90). The summary risk estimate calculated was
statistically significant at 1.40 (95% CI 1.19 to 1.63) and did not show evidence of
heterogeneity.
The study by Zeegers et al. (2001) was a population based case cohort study in
the Netherlands which was conducted among 58, 279 men. A case-cohort was
assembled consisting of 532 cases and 1, 630 subcohort members. The overall cohort
of men followed was large. However, the number of cases of bladder cancer
ascertained was small. To increase the precision of the measurement, a larger number
of subcohort members were included. A strength of this study was the exposure
assessment, in which the probability of exposure to PAHs was assessed by experts in
occupational epidemiology and hygiene. However, the assessment was based on
occupational titles and no quantitative measurements were available. No dose-response
trend was found for increasing levels of PAH exposure.
The study by Romundstad et al. (2000a) investigated the association between
bladder cancer and exposure to PAHs in a cohort of 1790 aluminum production workers.
A quantitative estimate of PAH exposure was based on personal measurements,
stationary measurements and descriptions of processes over time. An attempt was
made to account for the confounding effects of smoking through information obtained
from company medical files and the recollection of three long-term employees. Thus,
the smoking data was subject to recall bias. This study may have been too small to

50
detect statistically significant increased risk for bladder cancer. Although no test for
trend was reported, there did not appear to be increased risk for bladder cancer with
increasing cumulative exposure to PAHs.
Clavel et al. (1994) conducted a hospital based case-control study in France.
The controls were patients admitted to the hospitals for diseases other than cancer,
haematuria and work accidents. By excluding potential “work-related” diseases, the
control subjects’ diseases were less likely to be associated with occupational exposure
to PAHs and the comparison group was more likely to be representative of the healthy
population with respect to occupational exposures. Only a small number of cases and
controls were included and this was further restricted to males, further reducing the
sample size. Due to the small sample size, it is possible that this study did not have
enough power to detect an effect. A strength of this study was the exposure
assessment in which occupational exposures were evaluated by industrial health experts
who were blind to case and control status of the patients. The investigators reported a
statistically significant dose-response trend for increasing levels of PAH exposure, which
remained statistically significant after adjustment for smoking.
Romundstad et al. (2000b) conducted a cohort study of 5,627 men employed in
two Norwegian aluminum reduction plants. Quantitative estimates of exposure to PAHs
were based on statistical modeling of personal measurements, stationary measurements
and process data. This was a strength of the study. The workers’ age distribution was
not provided. If the majority of the workers were less than 55 years, it is possible that
the length of follow-up was not long enough to account for the long latency of bladder
cancer. However, this is impossible to state with any certainty since the age distribution
of the cohort was not provided. This is a study weakness. No clear dose-response
trend was present.

51
Pesch et al. (2000) conducted a population based case-control study. This was
a large multicentre study which identified 1035 cases of bladder cancer. To increase the
precision of the estimate 4298 population controls were included. Exposure assessment
was based on job titles and job tasks obtained in a structured questionnaire. The
workers were asked to self-assess exposure by estimating the average working hours
per day per exposure. The exposure assessment was prone to recall bias. A job-
exposure matrix and a job task-exposure matrix were used to assess the probability and
intensity of exposure to PAHs. No dose-response trends were included in this study
A nested case-control study was conducted by Tremblay et al. (1995). From a
cohort of 16, 0000 males employed at an aluminum plant in Quebec, 123 cases of
bladder cancer were found and matched to 414 controls obtained from a random sample
of cohort members. The sample size was small and the investigators attempted to
address this by matching three controls per case. Detailed occupational histories were
available from company records for all subjects. A job-exposure matrix was constructed
by a company industrial hygienist. The estimation of exposure was also based on
personal sampling carried out since 1972 and stationary sampling which was carried out
since the 1950s. This exposure assessment was a strength of the study as it was not
prone to recall bias. Furthermore, smoking status was obtained from company medical
records and abstracted by a medical record technician who was blind to the disease
status of the worker. Although tests for trend were not reported, there was evidence of
increasing risk for bladder cancer associated with increasing cumulative exposure to
coal tar pitch volatiles.

52
Figure 5 – Forest Plot: PAH exposure
Study risk estimate (fixed) risk estimate (fixed) 95% CI 95% CI
Zeegers 2001 1.19 [0.62, 2.26]
Romundstad 2000a 1.30 [0.84, 2.00]
Clavel 1994 1.30 [0.99, 1.71]
Romundstad 2000b 1.36 [0.98, 1.90]
Pesch 2000 1.60 [1.10, 2.32]
Tremblay 1995 1.97 [1.10, 3.55]
Total (95% CI) 1.40 [1.19, 1.63] Test for heterogeneity: Chi² = 2.50, df = 5 (P = 0.78), I² = 0% Test for overall effect: Z = 4.15 (P < 0.0001)
0.1 0.2 0.5 1 2 5 10 reduced risk increased risk

53
Study risk estimate (fixed) risk estimate (fixed)
95% CI 95% CI
Zeegers 2001 0.51 [0.22, 1.19] Pesch 2000 1.00 [0.78, 1.28] Romundstad 2000b 1.29 [0.85, 1.96] Clavel 1994 1.70 [1.20, 2.41] Tremblay 1995 1.97 [1.10, 3.52]
Total (95% CI) 1.22 [1.03, 1.44] Test for heterogeneity: Chi² = 12.87, df = 4 (P = 0.01), I² = 68.9% Test for overall effect: Z = 2.29 (P = 0.02)
0.1 0.2 0.5 1 2 5 10 reduced risk increased risk
Figure 6 – Forest Plot: Low-level PAH exposure
Five of the seven studies on bladder cancer and occupational exposure to PAH
reported qualitative or quantitative values for low PAH exposure. Two studies did not
find increased risks of bladder cancer after low-level exposure to PAH (Zeegers et al.,
2001; Pesch et al., 2000). The three remaining studies did find increased risks for
bladder cancer after low-level PAH exposure. Two case-control studies reported
statistically significant increased risks of 1.70 (95% CI 1.20 to 2.41) (Clavel et al., 1994)
and 1.97 (95% CI 1.10 to 3.52) (Tremblay et al., 1995). The remaining study reported a
non-significant increased risk of 1.29 (95% CI 0.85 to 1.96) (Romundstad et al., 2000b).
The summary risk estimate calculated was statistically significant 1.22 (95% CI 1.03 to
1.44). However, the studies were identified as heterogeneous by the test of
heterogeneity.
To account for the heterogeneity, the studies with the highest (Tremblay et al.,
1995) and lowest (Zeegers et al., 2001) risk estimates were deleted. However, the
studies were still heterogeneous. It is not, therefore, appropriate to pool the results of

54
these studies. The decision was made to use the risk estimate (1.97, 95% CI 1.10 to
3.51) from the study with the highest exposure quality rating (EQ=5) and having the
greatest number of subjects included in the analysis (16,000) (Tremblay et al., 1995)
among the studies that included levels of exposure to PAH in their analyses.
Figure 7 – Forest Plot: Low-level PAH exposure – deletion of highest and lowest risk
estimates
Study risk estimate (fixed) risk estimate (fixed) 95% CI 95% CI
Pesch 2000 1.00 [0.78, 1.28] Romundstad 2000b 1.29 [0.85, 1.96] Clavel 1994 1.70 [1.20, 2.41]
Total (95% CI) 1.21 [1.01, 1.45] Test for heterogeneity: Chi² = 6.15, df = 2 (P = 0.05), I² = 67.5% Test for overall effect: Z = 2.07 (P = 0.04)
0.1 0.2 0.5 1 2 5 10 reduced risk increased risk

55
Bladder cancer and occupational exposure to Diesel Exhaust
In the literature search, seven studies met the inclusion/exclusion criteria and
reported results for bladder cancer incidence associated with exposure to diesel
exhaust. Results of these studies are shown in the tables in Appendix C and results of
the pooled analysis are shown in Figure 8. None of the seven studies reported on
bladder cancer mortality: all seven reported on bladder cancer incidence.
Of the seven studies reporting on bladder cancer incidence associated with
diesel exhaust exposure, one case-control study reported a statistically significant
increased risk of 1.5 (95% CI 1.10 to 2.0) (Silverman et al., 1986). Five studies (1 cohort
studies, 4 case-control studies) (Zeegers et al., 2001; Kellen et al., 2007; Soll-Johanning
et al., 2003; Steineck et al., 1990; Smith et al., 1985) reported increased risks that were
not statistically significant ranging from 1.17 (95% CI 0.74 to 1.84) to 1.70 (95% CI 0.90
to 3.30). One cohort study reported a risk approaching unity: 0.97 (95% CI 0.77 to 1.21)
(Guo et al., 2004). The summary risk estimate calculated was 1.21 (95% CI 1.05 to
1.39) and demonstrated very little heterogeneity.
Guo et al. (2004) conducted a cohort study of all economically active Finns born
between 1906 and 1945 who were followed-up from 1971 to 1995. The sample size was
large and comprised of 667, 121 males and 513, 110 females. Exposure estimates were
derived from a Finnish job-exposure matrix (FINJEM), which was developed based on
exposure measurements, hazard surveys and the judgment of 20 Finnish occupational
hygienists. A limitation of this study is that the average level of exposure to diesel
exhaust captured in FINJEM was based on the concentration of nitrogen dioxide in the
air as an indicator of diesel exhaust exposure. Diesel exhaust is a complex mixture of
gaseous and particulate matter and basing exposure estimates on a single indicator may
underestimate levels of exposure. There was no evidence for increasing risk of bladder
cancer associated with increasing levels of diesel exhaust exposure.

56
The study by Zeegers et al. (2001) was a population based case cohort study in
the Netherlands which was conducted among 58, 279 men. The details of this study
are described in the section above on exposure to PAHs. Since bladder cancer risk
estimates were also provided for diesel exhaust exposure, this study was included in this
section as well.
Smith et al. (1985) conducted a population based case-control study in the
United States. The sample size was relatively large, with 2,108 cases and 4,046
controls. Exposure data was obtained through face-to-face interviews using a structured
questionnaire which captured information on lifetime history of artificial sweeteners,
smoking, caffeine intake, and occupation. A limitation of this study is that occupation as
an auto or truck mechanic for at least six months in their lifetime was considered the
“exposed” group. The subjects were also grouped in a “chemically related” exposure
group if they worked in occupations or industries with similar chemical exposures as
auto and truck mechanics. This presents problem in exposure misclassification, as it is
possible that those classified as “exposed” using such a broad definition of exposure
may not be in fact exposed to any of the suspected chemicals being studied, resulting in
an overestimation of the relevant exposure.
Soll-Johanning et al. (2003) conducted a nested case-control study of 84 bladder
cancer cases, and 255 controls among a cohort of 18, 174 bus drivers and tramway
employees. This represents a small sample size, one which may not have the power to
detect a statistically significant effect. A strength of this study is that exposure
information was obtained from employment records in addition to structured interviews,
thus reducing the occurrence of recall bias. The investigators also took into account
exposure to air pollution on the various bus routes. There was some evidence of an
increased risk for bladder cancer with increasing time as a bus driver; however no tests
for trend were reported.

57
A population based case-control study was conducted by Silverman et al. (1986),
which included 1, 909 cases and 3, 569 controls. This is a relatively large sample size.
The authors frequency matched approximately two controls per case to increase the
precision of their measurement. A limitation in the study methods is that exposure was
assessed based on “ever’ or “usually” employed in various motor exhaust-related
occupations. This is a broad definition of exposure that may lead to misclassification of
exposure, leading to an overestimated risk of bladder cancer. A statistically significant
dose-response trend was observed for truck drivers and deliverymen with increasing
duration of employment.
Kellen et al. (2007) conducted a population based case-control study which
included 200 cases and 385 controls. This small sample size may not have the power to
detect statistically significant risks for bladder cancer. A strength in study methodology
was the way in which exposure data was collected. Trained interviewers conducted
face-to-face interviews collecting information on medical history, lifetime smoking history,
family history of bladder cancer, 20-year residential history, food frequency, and lifetime
occupational history. Occupational exposure to diesel exhaust was blindly coded by two
occupational hygienists. Tests for trend were conducted and no dose-response trend
was evident for increasing levels of diesel exposure.
Steineck et al. (1990) conducted a population based case-control study which
included 256 cases and 287 controls. This is a small sample size, which may not have
the power to detect statistically significant effects. A strength of this study was the
exposure assessment. Questionnaires were mailed out and collected information on
occupational history. An occupational hygienist, who was unaware of case-control
status, classified subjects as exposed or unexposed to 38 different agents. There was
evidence of increased bladder cancer risk associated with increasing levels of annual
does, although no test for trend was reported.

58
Figure 8 – Forest Plot: Diesel exposure
Study risk estimate (fixed) risk estimate (fixed) 95% CI 95% CI
Guo 2004 0.97 [0.77, 1.23] Zeegers 2001 1.17 [0.75, 1.84] Smith 1985 1.21 [0.90, 1.62] Soll-Johanning 2003 1.28 [0.52, 3.16] Silverman 1986 1.51 [1.12, 2.02] Kellen 2007 1.51 [0.84, 2.71] Steineck 1990 1.70 [0.89, 3.24]
Total (95% CI) 1.21 [1.05, 1.39] Test for heterogeneity: Chi² = 7.15, df = 6 (P = 0.31), I² = 16.0% Test for overall effect: Z = 2.69 (P = 0.007)
0.1 0.2 0.5 1 2 5 10 reduced risk increased risk

59
Figure 9 – Forest Plot: Low-level diesel exposure
Four of the seven studies on bladder cancer and occupational exposure to diesel
exhaust included qualitative or quantitative analyses by level of diesel exhaust exposure.
Only one of the four studies found an increased risk for bladder cancer associated with
low-level diesel exhaust exposure, and this lacked statistical significance. The summary
risk estimate was 1.00 (95% CI 0.91 to 1.10).
Study risk estimate (fixed) risk estimate (fixed) 95% CI 95% CI
Kellen 2007 0.80 [0.40, 1.59] Zeegers 2001 1.00 [0.65, 1.54] Guo 2004 1.00 [0.90, 1.11] Steineck 1990 1.30 [0.57, 2.95]
Total (95% CI) 1.00 [0.91, 1.10] Test for heterogeneity: Chi² = 0.80, df = 3 (P = 0.85), I² = 0% Test for overall effect: Z = 0.02 (P = 0.99)
0.1 0.2 0.5 1 2 5 10 reduced risk increased risk

60
Bladder cancer and occupational exposure to Aromati c Amines
In the literature search, seven studies met the inclusion/exclusion criteria and
reported results for bladder cancer incidence associated with exposure to aromatic
amines as a group of exposures. Results of these studies are shown in the tables in
Appendix C and results of the pooled analysis are shown in Figure 10. None of the
seven studies reported on bladder cancer mortality: all reported on bladder cancer
incidence.
Of the seven studies reporting on bladder cancer incidence associated with
aromatic amine exposure, all studies with the exception of one cohort study reported
statistically significant increased risks ranging from 2.60 (95% CI 1.84 to 3.66) to 8.8
(95% CI 3.3 to 17.1) (Outellet-Hellstron et al., 1996; Bonassi et al., 1989; Boyko et al.,
1985; Kellen et al., 2007; Schulte et al., 1986; Vineis et al., 1987). The remaining study
reported a non-statistically significant increased risk of 1.36 (95% CI 0.42 to 4.35). The
summary risk estimate calculated was 3.21 (95% CI 2.52 to 4.09). However, the studies
were determined to be heterogeneous.
The study by Zeegers et al. (2001) also included the risk for bladder cancer
associated with exposure to aromatic amines. A description of study strengths and
limitations can be found in the section on bladder cancer and occupational exposure to
PAHs.
Boyko et al. (1985) conducted a hospital based case-control study, 932 cases
and 1457 controls were included. Subjects were classified as chemical dye workers or
non-chemical dye workers based on information collected in a face-to-face interview. A
limitation of this study was that although aromatic amine exposure is highly prevalent in
dye manufacturing, exposures were only assessed at the level of occupation, and no
exposure measurements were estimated or obtained.

61
A hospital based case-control study with 461 male cases and 566 controls was
carried out by Vineis and Esteve (1987). Exposure data was obtained by a trained
interviewer using a standard questionnaire. Information was collected on history of
smoking and lifetime occupational history. A limitation of this study is that only exposure
to cigarette smoke and occupational exposure in the rubber industry or in the dyestuff
production was considered. Other bladder cancer risk factors were not accounted for,
thus it is impossible to assess whether the increased risk for bladder cancer observed is
due to exposure to aromatic amines or confounded by other bladder cancer risk factors
such as genetic or dietary factors.
Bonassi et al. (1989) conducted a population based case-control study between
1972 and 1982. 121 cases and 342 controls were included. This is a small sample size
and the study may not have enough power to detect a statistically significant effect.
Exposure data was obtained through a standard questionnaire administered by trained
interviewers. Subjects were classified into occupational categories which were identified
a priori. In addition, a job-exposure matrix was constructed to assess potential lifetime
exposure to aromatic amines.
Schulte et al. (1986) conducted a nested case-control study among a cohort of
workers 1, 385 occupationally exposed to aromatic amines in a dye-intermediary
production plant. There were 13 cases of bladder cancer and the remaining 1372
workers in the cohort comprised the control group. It is possible that the control group or
the “non-cases” experienced the same occupational exposures as the cases, and
therefore was not a good comparison group.
The study by Kellen et al. (2007) also included the risk for bladder cancer
associated with exposure to aromatic amines. A description of study strengths and
limitations can be found in the section on bladder cancer and occupational exposure to
diesel exhaust.

62
A cohort study on the incidence of bladder cancer in a cohort of 700 chemical
plant workers was undertaken by Ouellet-Hellstrom et al. (1996). Work histories and
exposure data was obtained form a corporate database and personnel records. A
strength of this study was that an exposure assessment committee of former and current
workers who were knowledgeable about work processes developed an exposure score
for each job title. Work histories were also obtained through a mailed survey.
Figure 10 – Forest Plot: Aromatic Amine Exposure
To account for the heterogeneity, the studies with the highest (Ouellet-Hellstrom
et al., 1996) and lowest (Zeegers et al., 2001) risk estimates were deleted, thus reducing
the I2 statistic to 0%. The studies with the highest and lowest risk estimates were both
cohort studies, leaving only case-control studies as contributing to the pooled risk
estimate. The resulting summary risk estimate was statistically significant at 3.05 (95%
CI 2.35 to 3.95).
Study risk estimate (fixed) risk estimate (fixed) 95% CI 95% CI
Zeegers 2001 1.36 [0.42, 4.42] Boyko 1985 2.61 [1.84, 3.72] Vineis 1987 2.97 [1.68, 5.25] Bonassi 1989 3.56 [1.56, 8.11] Schulte 1986 4.31 [1.82, 10.20] Kellen 2007 5.75 [2.08, 15.95] Ouellet-Hellstrom 96 8.33 [3.66, 18.98]
Total (95% CI) 3.21 [2.52, 4.09] Test for heterogeneity: Chi² = 10.34, df = 6 (P = 0.11), I² = 42.0% Test for overall effect: Z = 9.46 (P < 0.00001)
0.1 0.2 0.5 1 2 5 10 reduced risk increased risk

63
Figure 11 – Forest Plot: Aromatic amine exposure – deletion of highest and lowest risk
estimates
Study risk estimate (random) risk estimate (random) 95% CI 95% CI
Boyko 1985 2.61 [1.84, 3.72] Vineis 1987 2.97 [1.68, 5.25] Bonassi 1989 3.56 [1.56, 8.11] Schulte 1986 4.31 [1.82, 10.20] Kellen 2007 5.75 [2.08, 15.95]
Total (95% CI) 3.05 [2.35, 3.95] Test for heterogeneity: Chi² = 2.99, df = 4 (P = 0.56), I² = 0% Test for overall effect: Z = 8.43 (P < 0.00001)
0.1 0.2 0.5 1 2 5 10 reduced risk increased risk

64
Figure 12 – Forest Plot: Low-level aromatic amine exposure
Three of the seven studies on bladder cancer and occupational aromatic amine
exposure included analyses by level of exposure. Only one study found an increased
risk for bladder cancer after low aromatic amine exposure lacking statistical significance.
The summary risk estimate for low-level exposure to aromatic amines was 0.98 (95% CI
0.50 to 1.94).
:
Study risk estimate (fixed) risk estimate (fixed) 95% CI 95% CI
Zeegers 2001 0.64 [0.13, 3.19] Bonassi 1989 0.81 [0.33, 1.97] Kellen 2007 2.16 [0.54, 8.67]
Total (95% CI) 0.98 [0.50, 1.94] Test for heterogeneity: Chi² = 1.69, df = 2 (P = 0.43), I² = 0% Test for overall effect: Z = 0.05 (P = 0.96)
0.1 0.2 0.5 1 2 5 10 reduced risk increased risk

65
Publication Bias
The funnel plot for the studies included on the risk of bladder cancer and
occupational exposure to PAH appears to be fairly symmetrical, an indication that
publication bias is not present. Although the funnel plot is missing the wide scatter of
points toward the bottom of the funnel, this is due to the a priori inclusion criteria that
excluded any studies with a low exposure quality rating. The smaller studies with poor
methodological design were purposely excluded from the calculation of the summary risk
estimate.
Figure 13 – Funnel Plot: PAH exposure

66
The funnel plot for the studies on bladder cancer and occupational exposure to
diesel exhaust appears to be asymmetrical, with points missing on the left side of the
funnel, indicating that smaller studies with negative findings may not have been
published. With seven points on the plot, it is difficult to assess the degree of bias
present. With this type of asymmetry, it is possible that the summary risk estimate found
may be an overestimate. As with the funnel plot above, the wide area of the funnel is
missing due to the a priori inclusion criteria used.
Figure 14 – Funnel Plot: diesel exposure

67
The funnel plot below represents the studies included on bladder cancer
associated with occupational exposure to aromatic amines. Upon initial assessment,
this funnel plot does appear to be asymmetrical. Again, for the same reasons cited
above, the scatter of points along the bottom of the plot (or the wide end of the funnel) is
missing due to the a priori inclusion criteria which prevented smaller, less
methodologically sound studies from being excluded. It is possible that the asymmetry
presented here is due to a true heterogeneity among the studies. This is further
supported by the high I2= 42%.
Figure 15 – Funnel Plot: aromatic amine exposure

68
The table below summarizes the summary risk estimates obtained from the pooled
analyses. These summary risk estimates will be used in the calculation of the population
attributable fraction for the incidence of bladder cancer due to occupational exposures.
A separate calculation for mortality will not be conducted as only one study on mortality
associated with PAH exposure met the inclusion criteria, while no studies met the
inclusion criteria for mortality associated with diesel exhaust, and aromatic amine
exposure.
Table 18 – Summary risk estimates for selected bladder carcinogens
Summary risk estimate (SRE) Exposure Level
PAH Diesel
Exhaust 2-
naphthylamine aromatic amines
unexposed 1.00 1.00 1.00 1.00 low 1.97 1.00 1.00 0.98 high 1.40 1.21 16.83 3.21

69
4.4 Calculation of population attributable fraction (PAR)
Tables 19 to 22 contain the population attributable fraction calculated for each
occupational bladder carcinogen under consideration.
Table 19 – Population Attributable Fraction Calculation – PAH Exposure
PAH Exposure Level
Proportion of population ever exposed
by level SRE Pi x RRi Unexposed 0.938 1.00 0.938 Low 0.056 1.97 0.110 High 0.006 1.40 0.009 Σ Pi x RRi 1.057 PAR 0.054
Table 20 – PopulationAttributable Fraction Calculation – Diesel Exhaust Exposure
Diesel Exposure Level
Proportion of population ever exposed
by level SRE Pi x RRi Unexposed 0.882 1.00 0.882 Low 0.106 1.00 0.106 High 0.012 1.21 0.014 Σ Pi x RRi 1.002 PAR 0.002
Table 21 – Population Attributable Fraction Calculation – 2-naphthylamine
BNAP Exposure Level
Proportion of population ever exposed
by level SRE Pi x RRi Unexposed 0.999 1.00 0.999 Low 3.76E-05 1.00 3.76E-05 High 4.18E-06 16.83 7.03E-05 Σ Pi x RRi 1.000066155 PAR 6.62E-05

70
Table 22 – Population Attributable Fraction Calculation – Aromatic Amines
Aromatic Amine Exposure Level
Proportion of population ever exposed
by level SRE Pi x RRi Unexposed 0.999 1.00 0.999 Low 1.86E-05 0.98 1.82E-05 High 2.06E-06 3.21 6.62E-06 Σ Pi x RRi 1.000004189 PAR 4.19E-06
Table 23 – Overall Population Attributable Fraction/ Population Attributable Fraction
Carcinogen PAR 2-naphthylamine 6.62E-05 aromatic amines 4.19E-06 diesel exhaust 0.002 PAH 0.054 PAR Overall 0.056
Since the exposure-specific attributable fractions are small, the overall
attributable fraction for bladder cancer due to exposure to beta-naphtylamine, aromatic
amines, polycyclic aromatic hydrocarbons and diesel exhaust can simply be summed to
approximate the overall population attributable fraction (Steenland et al., 2006).
Therefore, the proportion of bladder cancer in Ontario due to occupational exposures is
approximately 0.056 (95% CI 0.002 to 0.140). By far, the majority of this is due to
occupational exposure to PAHs.
4.5 Sensitivity Analysis
The attributable fraction calculated depends on both the relative risk due to
exposure and the proportion of the population exposed. Tables 22 to 36 illustrate
changes to the overall PAR based on various sensitivity analyses conducted.
The decision was made not to use the pooled risk estimate for low-level PAH exposure
due to the heterogeneous nature of the studies. The pooled risk estimate for low-level

71
PAH exposure was 1.21 (95% CI 1.01 to 1.45), I2=67.5%. Had this pooled risk estimate
been used, the resulting attributable fraction would have been 0.017.
Table 24 – Population Attributable fraction calculated using pooled risk estimate for low-
level PAH exposure
Carcinogen
PAR (low-level PAH
pooled) PAH 0.014493191 Diesel exhaust 0.002470553 BNAP 6.61502E-05 Aromatic amines 4.18936E-06 Total 0.017034084
All pooled risk estimates were calculated using the fixed effects model. Calculation of
the pooled risk estimates under the random effects model was conducted twice: once
using a pooled risk estimate for low-level PAH exposure (even though the summary risk
estimate was heterogeneous) and again using a single risk estimate for low-level PAH
exposure based on the study with the highest exposure quality rating and the greatest
number of subjects.
Table 25 – Population Attributable fraction calculated based on the random effects
model (using pooled risk estimate for low-level PAH exposure)
Carcinogen PAR (random
effects) PAH 0.017723281 Diesel exhaust 0.002705208 BNAP 6.61502E-05 Aromatic amines 3.85917E-06 Total 0.020498498

72
Table 26 – Population Attributable fraction calculated based on the random effects
model (using non-pooled risk estimate for low-level PAH exposure)
Carcinogen PAR (random
effects) PAH 0.053402728 Diesel exhaust 0.002705208 BNAP 6.61502E-05 Aromatic amines 3.85917E-06 Total 0.056177945
The PAR was recalculated using only the studies that included either qualitative or
quantitative measures of level of exposure to the carcinogens, exposure quality rating 4
and 5. Using studies that were deemed to have better exposure assessment quality, the
overall PAR was 0.035.
Table 27 – Attributable fraction calculated using studies with exposure quality 4 and 5
Bladder carcinogen PAR (EQ = 4/5) PAH 0.033849726 Diesel exhaust 0.001177978 BNAP 6.61502E-05 Aromatic amines 1.32903E-05 Total 0.035107145
Upon closer examination of the bladder carcinogens included for analysis, the
inclusion of diesel exhaust as a bladder carcinogen can come under closer scrutiny.
Although IARC has classified diesel exhaust as “probably carcinogenic to humans” and
Siemiatycki et al. (2004) have concluded that there is suggestive evidence linking diesel
exhaust to bladder cancer, the SRE found here is considerably low at 1.21 (95% CI 1.05
to 1.39). This calls into question whether diesel exhaust should be included here as a
bladder carcinogen. The resulting PAR without diesel included in the analysis is 0.053,
thus in fact it makes very little difference if diesel exhaust is included or not.

73
Table 28 – Population Attributable fraction calculated with the exclusion of diesel
exhaust exposure
Carcinogen PAR 2-naphthylamine 6.61502E-05 aromatic amines 4.18936E-06 PAH 0.053402728 Total 0.053473068
A common exercise when calculating summary risk estimates is to reanalyze the
data by study type. This was also done here. Tables 29 to 38 present changes to the
PAR when the summary risk estimates used are based on cohort studies and case-
control studies separately. The PAR recalculated using only cohort studies was 0.006
and 0.020 using only case-control studies.
Table 29 – Population Attributable fraction for PAH exposure based on cohort studies
only
PAH Exposure Level
Proportion of population ever exposed
by level
SRE (cohort
studies only) Pi x RRi Unexposed 0.938208687 1.00 0.938208687 Low 0.055612181 1.07 0.059505034 High 0.006179131 1.32 0.008156453 Σ Pi x RRi 1.005870175 PAR 0.005835917
Table 30 – Attributable fraction for diesel exhaust exposure based on cohort studies only
Diesel Exposure Level
Proportion of population ever exposed
by level SRE
(cohort only) Pi x RRi Unexposed 0.882063237 1.00 0.882063237 Low 0.106143087 1.00 0.106143087 High 0.011793676 1.01 0.011911613 Σ Pi x RRi 1.000117937 PAR 0.000117923

74
Table 31 – Population Attributable fraction for 2-naphthylamine exposure based on
cohort studies only
BNAP Exposure Level
Proportion of population ever exposed
by level SRE Pi x RRi Unexposed 0.999958209 1.00 0.999958209 Low 3.76116E-05 1.00 3.76116E-05 High 4.17906E-06 16.83 7.03336E-05 Σ Pi x RRi 1.000066155 PAR 6.61502E-05
Table 32 – Population Attributable fraction for aromatic amine exposure based on cohort
studies only
Aromatic Amine Exposure Level
Proportion of population ever exposed
by level SRE
(cohort only) Pi x RRi Unexposed 0.999979363 1.00 0.999979363 Low 1.85736E-05 0.64 1.18871E-05 High 2.06373E-06 4.59 9.47254E-06 Σ Pi x RRi 1.000000722 PAR 7.22307E-07
Table 33 – Population attributable fraction calculation based on cohort studies only
Bladder carcinogen PAR (cohort only) PAH 0.005835917 Diesel exhaust 0.000117923 BNAP 6.61502E-05 Aromatic amines 7.22307E-07 Total 0.006020712

75
Table 34 – Population Attributable fraction for PAH exposure based on case-control
studies only
PAH Exposure Level
Proportion of population ever exposed
by level
SRE (case-control studies only) Pi x RRi
Unexposed 0.938208687 1.00 0.938208687 Low 0.055612181 1.26 0.070071348 High 0.006179131 1.46 0.009021532 Σ Pi x RRi 1.017301568 PAR 0.017007314
Table 35 – PopulationAttributable fraction for diesel exposure based on case-control
studies only
Diesel Exposure Level
Proportion of population ever exposed
by level
SRE (case-control
only) Pi x RRi Unexposed 0.882063237 1.00 0.882063237 Low 0.106143087 0.98 0.104020225 High 0.011793676 1.39 0.01639321 Σ Pi x RRi 1.002476672 PAR 0.002470553
Table 36 – Population Attributable fraction for 2-naphthyamine exposure based on case-
control studies only
BNAP Exposure Level
Proportion of population ever exposed
by level SRE Pi x RRi Unexposed 0.999958209 1.00 0.999958209 Low 3.76116E-05 1.00 3.76116E-05 High 4.17906E-06 16.83 7.03336E-05 Σ Pi x RRi 1.000066155 PAR 6.61502E-05

76
Table 37 – Population Attributable fraction for aromatic amine exposure based on case-
control studies only
Aromatic Amine Exposure Level
Proportion of population ever exposed
by level
SRE (case-control
only) Pi x RRi Unexposed 0.999979363 1.00 0.999979363 Low 1.85736E-05 1.08 2.00595E-05 High 2.06373E-06 3.05 6.29439E-06 Σ Pi x RRi 1.000005717 PAR 5.71651E-06
Table 38 – Population Attributable fraction calculation based on case-control studies
only
Bladder carcinogen
PAR (case control only)
PAH 0.017007314 Diesel exhaust 0.002470553 BNAP 6.61502E-05 Aromatic amines 5.71651E-06 Total 0.019549734
4.6 Application of PAR to Ontario Bladder Statistics
In Ontario, the total number of new cases of bladder cancer in the year 2001 in the
population aged 25 to 75 years was 929 cases (Cancer Surveillance On-line). To
estimate the number of these cases that are due to occupational exposure to the
carcinogens included here, the total number of new cases of bladder cancer in the
population aged 25 to 75 years is multiplied by the PAR calculated above (0.056) for
bladder cancer due to occupational carcinogens. It is estimated that in 2001, there were
approximately 52 new cases of bladder cancer due to occupational exposure to PAH,
diesel exhaust, aromatic amines and 2-naphthylamine.

77
Chapter 5: Discussion
5.1 PAR Estimates
Using the Ontario-specific estimates contained in the CAREX Canada database, 348,
688 workers, approximately 5.3% of the workforce in Ontario are potentially exposed to
bladder carcinogens at greater than background levels. The overall proportion of
bladder cancer due to occupational exposures is approximately 5.6% (95% CI 0.2% to
14%).
A number of sensitivity analyses were conducted to observe the effect of excluding
studies with weaker exposure assessments; using the random effects model; excluding
carcinogens for which the strength of evidence may be weaker; and regrouping the
studies according to study type to observe the effect on the PAR estimate.
By including only studies with an exposure quality rating of 4 or 5, the PAR estimate was
reduced to 3.5%. The effect of including studies based on highly conservative inclusion
criteria is to underestimate the population attributable risk.
Recalculating the summary risk estimates using the random effects model resulted in the
PAR decreasing to 2.0%. This reduction was due to the summary risk estimate used for
low-level PAH exposure. It was not deemed appropriate to group the studies to
calculate a summary risk estimate for low-level PAH exposure due to heterogeneity
among the studies. Instead, the risk estimate from the study with the highest exposure
quality and the most number of subjects was chosen. Including this estimate resulted in
no change to the overall PAR of 5.6% using the random effects model.
Since the strength of association for the risk of bladder cancer due to exposure to diesel
exhaust (SRE 1.21) was not as strong as the summary risk estimates for the other
carcinogens included in the PAR estimate, the PAR was recalculated without diesel

78
exhaust. This had a negligible effect on the PAR, as it was only slightly reduced to
5.3%. This is a logical reduction since the summary risk estimate was relatively low, the
prevalence of exposure in Ontario to diesel exhaust would have to be much greater for
there to be a significant effect on the overall PAR.
By grouping the studies according to study type, the PAR changed drastically: 0.6% and
2.0% for cohort studies and case-control studies, respectively. The PAR estimates
would justifiably be so divergent from the overall PAR estimate due to the regrouping of
the studies themselves. The estimate for the overall PAR was based on 21 studies for
high exposure and 12 studies for low exposure. When these studies were combined by
carcinogen this resulted in three or more studies being grouped together to calculate the
summary risk estimates. By limiting the results by study type, the studies were further
parsed resulting in some groups of no more than two studies. This resulted in very
unstable SREs. It was no longer appropriate to group the studies, resulting in the highly
divergent PAR estimates.
5.2 Sample Size Calculation
The PAR estimate relies on the prevalence of exposure in the population under
study as well as the relative risk of disease. A summary risk estimate was calculated
and used in the PAR estimate for each carcinogen included. Did the studies included in
the summary risk estimate calculation include enough subjects to detect a statistically
significant effect? To answer this question, the sample size in case-control studies was
calculated using the following formula:
n (each group)= (p0q0 + p1q1)(z1-α/2 + z1-β)2/ (p1 – p0)
2
The sample size required for PAHs was calculated since this exposure contributed the
most by far to the overall PAR estimate. Data from the CAREX Canada database

79
indicated that the proportion of Ontario workers exposed to PAHs is 0.02. The SRE
calculated for PAH exposure is 1.40. Using the conventional alpha level of 0.05 and
beta level of 0.20 (80% power), the required sample size calculated was approximately
5735 per group. None of the studies which contributed to the SRE included this many
control subjects. Because both the proportion of exposure among Ontario workers and
the SRE are both relatively low, a large number of subjects is needed to detect a relative
risk of 1.40. The SRE calculated is a best estimate of the risk of bladder cancer
associated with occupational PAH exposure. If the “true” relative risk were higher, the
required sample size would decrease (Table 39). Similarly, if the proportion of exposure
among the controls was higher, the required sample size would also decrease (Table
40).
Table 39 – Sample Size Estimates for Postulated Relative Risks of Bladder Cancer
Associated with PAH exposure
Postulated Relative Risks Required Sample Size in E ach Group
1.40 5735 1.80 1663 2.00 1137 2.50 584
Table 40 – Sample Size Estimates for Various Proportions of Exposure to PAHs Among
Controls
Estimated Proportion of Exposure among Controls
Required Sample Size in Each Group
0.02 5735 0.04 2795 0.10 1031 0.20 443

80
Using the CAREX Canada database provided the best estimate of PAH exposure
among Ontario workers, as no other sources data are readily available. The assessors
deemed workers exposed to PAHs for exposures above non-occupational levels of
exposure in urban air (i.e. above background levels). Due to the broad definition of
occupational exposure, it is unlikely that the estimate of 0.02 workers exposed to PAHs
in Ontario is an underestimate. However, the SRE calculated for exposure to PAHs,
1.40, may be an underestimate of the risk of bladder cancer associated with PAH
exposure. Given that the sample sizes of the studies included in the calculation of the
SRE for exposure to PAHs may not have have been large enough to detect such a
relatively small risk, it is possible that the PAR calculated here is an underestimate of the
risk of bladder cancer in Ontario that may be preventable should PAH exposure be
eliminated.
5.3 Occupations Potentially at Risk for Bladder Cancer in Ontario
Polycyclic aromatic hydrocarbons (excluding environmental tobacco smoke),
diesel exhaust, beta-naphthylamine and aromatic amines have been identified as
bladder carcinogens in Ontario workplaces, with the greatest contribution coming from
exposure to PAHs.
The two industry sectors in Ontario with the most workers exposed to PAHs are
wholesale and retail trade and restaurants and hotels and manufacturing. The
assessors defined exposure to PAHs as:
“Inhalatory exposure at work to PAHs with at least four aromatic rings (eg,
benzo(a)pyrene, benz(a)anthracene, dibenz[a,h]anthracene) likely to exceed
significantly the nonoccupational levels in urban air (usually <0.005 ug/m3 of
benzo(a)pyrene). Includes coal tar pitch, coal tars, soots, creosotes, shale oils, and

81
untreated/mildly treated mineral oils. Excludes environmental tobacco smoke (assessed
separately) and bus/truck/van/taxi drivers exposed to engine exhaust (low exposure)”
The CAREX Canada database provides additional information on subgroups
exposed to the carcinogens included in the database, thus providing information on
potential subgroups to target prevention efforts.
The majority of PAH exposure occurring in the wholesale and retail trade and
restaurants and hotels sector occurs in occupations in food and beverage service, and
among chefs and cooks. Exposure in these occupational groups occurs when working
in the vicinity of a grill or barbeque or cooking over a grill/barbeque. The assessors have
deemed these exposures to be low. It is most likely that exposure to PAH in these
occupations will never be completely eliminated. However, due to the large numbers of
workers potentially exposed it is important that workers understand the hazards in the
workplace and that employers ensure that proper ventilation of the workplace to avoid
unnecessary peaks in exposure. The next subgroup within the wholesale and retail
trade and restaurants and hotel sector at potential risk for PAH exposure are automotive
service technicians, truck mechanics and mechanical repairers; heavy-duty equipment
mechanics; and other small engine and equipment mechanics. Exposure in these
occupational groups occurs during maintenance and repair of diesel powered vehicles
and equipment. There appears to be some overlap between PAH exposure and diesel
exhaust exposure in the CAREX Canada database. The main distinction being that
workers identified as being exposed to diesel exhaust are diesel vehicle drivers who are
exposed to diesel exhaust; whereas, workers exposed to combustion by-products while
repairing diesel-powered vehicles/equipment are considered exposed to PAHs.
Manufacturing was identified as the next industry sector with the most workers
potentially exposed to PAHs. The majority of workers are employed in the manufacture

82
of transport equipment, the manufacture of fabricated metal products and the
manufacture of machinery (excluding electrical machinery). The occupations at risk of
PAH exposure in these manufacturing sectors include: welders and related machine
operators; foundry workers; metalworking machine operators; machining tool operators;
machinists and machining and tooling inspectors; tool and die makers; and structural
metal and platework fabricators and fitters. This is not an exhaustive list of occupations
within these sectors. Exposure scenarios in which PAH exposure may occur include:
the operation, cleaning and maintenance of ovens and furnaces in nonferrous metal
mills and foundries; the hardening of metals, forging, founding and other related metal
working tasks; metal machining and tool manufacturing; and welding of painted steel in
confined spaces. Again, this is not an exhaustive list of exposure scenarios in which
exposure to PAHs may occur.
5.4 Strengths
A major strength of the current study is the PAR was calculated using local level
exposure prevalence and proportions of workers employed in each industry sector. Past
studies assumed the occupational exposure prevalences of other countries were similar
to their own and applied them to their own workforce statistics. Had the Finnish and U.S
prevalence estimates been used to estimate the total number of workers exposed to
diesel exhaust and PAH, the Ontario estimates would have been 109, 939 and 27, 908
workers respectively. When the prevalence estimates were improved by occupational
hygienists using local data sources the number of workers increased to 228, 719 Ontario
workers exposed to diesel exhaust and 119, 779 workers exposed to PAH. The CAREX
Canada database contains comprehensive information on the type of occupational
exposures to known and suspected human carcinogens, IARC groups 1 and 2A, in
Ontario. As well, the CAREX Canada database provides estimates of the number of
83
workers exposed to known and suspected occupational carcinogens in Ontario by
industry sector, which in itself is another way to assess the potential magnitude of
occupational cancer.
In addition to using Ontario-based estimates for the proportions of workers
exposed to occupational bladder carcinogens, this study also attempted to account for
level of exposure by applying a partitioning factor for high and low exposures. The
partitioning factor was used because Ontario-specific data on the level of exposure
within the industry sectors is not available. Other studies simply classified exposure as
present or absent. Summary risk estimates were included for both high and low levels of
exposure to the bladder carcinogens of interest.
Another strength of the present study is the timeframe covered by the studies
included in when calculating the summary risk estimates. Exposures and working
conditions from 1900 to 2004 were included and the studies were published between
1985 and 2007. This represents a much broader and recent study period compared to
past calculations of the PAR were derived.
Unlike other studies that have calculated the PAR for occupational cancer using
a risk estimate from a single study, the current study reviewed original studies and
calculated a summary risk estimate to be used in the PAR calculation.
The a priori inclusion criteria were developed to ensure smoking, a major confounder,
was accounted for, to include countries with industrial development similar to that of
Ontario and to ensure studies included sufficient exposure information. The studies
were further rated by the quality of the exposure information to exclude studies with poor
exposure assessments.

84
5.5 Limitations
To make appropriate recommendations and summary statements regarding the
magnitude of occupational bladder cancer in Ontario, it is important to understand the
limitations in the current methodology and the estimates obtained. There are several
sources of uncertainty in the estimation of the proportion of bladder cancer attributable to
occupational exposures in Ontario. As demonstrated from the different sensitivity
analyses conducted, the PAR calculated is heavily dependent on the risk estimate used
in the calculation. The cohorts of workers in the studies included in the pooled analyses
are, therefore, probably not representative of the entire exposed workforce in Ontario.
However, in the absence of Ontario-specific risk estimates for occupational bladder
cancer, the summary risk estimates calculated were a best estimate of an overall relative
risk for exposure to the carcinogens of interest. When calculating the summary risk
estimates used in the PAR calculation, a priori criteria were set to be able to include
studies with the best methods and exposure assessments and to control for such
confounders such as smoking, which is strongly associated with the risk of bladder
cancer.
The CAREX Canada database estimates the current exposure circumstance for
workers in Ontario. Although the PAR estimated here accounts for past numbers of
workers by applying a turnover factor to estimate the number of workers “ever” exposed
to bladder carcinogens, the current exposure circumstance is still used. Based on the
CAREX Canada database it would be more accurate to estimate the future burden of
occupational bladder cancer. However, recognizing this limitation helps to place the
current estimate into context as past exposures can be assumed to be much more
prevalent. The current estimate, therefore, underestimates the prevalence of exposure.

85
The exposure assessment methods used to populate the CAREX Canada
database were unclear, and mostly based on the Finnish and U.S data. Although
detailed labour force statistics have been entered into the CAREX Canada database and
Ontario-specific measurement data was made available by the Ministry of Labour, there
are still limitations regarding the broadness of exposure categories, the issue of overlap
between exposures (i.e between PAHs and diesel exhaust) and issues in possible
double-counting of workers that have yet to be resolved, all leading to crude estimates.
However, the version available at the time this study took place was a preliminary
version of the database and further improvements have been made. In addition, the
lead investigator for CAREX Canada has received funding to continue to further refine
the estimates contained in the database. This being the case the CAREX Canada
database does have the potential to be a useful tool in occupational cancer surveillance
in Ontario and Canada overall once information from the remaining provinces and
territories has been included.
Another limitation of the current study was that there was a single quality
assessor to rate the exposure quality of the studies included in the summary risk
estimate calculations. There is no way to test whether the exposure rating criteria are
reliable, as there was no opportunity to verify inter-rater reliability. It is possible, then,
that the exposure criteria chosen were quite arbritrary and not indicative of study quality
at all.
The PAR estimates calculated here were applied to the number of incident
bladder cancer cases in Ontario for both male and females combined. The CAREX
Canada database does not provide estimates for the number of workers exposed to
workplace carcinogens by gender, but provides an overall estimate for the number of
workers exposed within each industry sector. Due to a lack of data, no attempt was
made to account for gender-based differences in exposure. The decision was made not

86
to apply the PAR calculated to the number of incident cases of bladder cancer among
males and females separately as this would have been an inappropriate application of
the estimate.
No definitive list of all carcinogens used in Ontario presently exists. As such,
other documents and reliable lists of occupational carcinogens were sought. Inevitably
bladder carcinogens may have been overlooked in the present study, either because
exposure levels to the carcinogen are too low within the industry sector and therefore did
not meet the exposure threshold hold to be included in the CAREX Canada database, or
simply because the exposure was not included in the CAREX Canada database at all.
Another factor related to this point are unidentified carcinogens in processes or
occupations that have been listed as human carcinogens by IARC such as painters,
shoe repair, and the rubber industry. The PAR calculated will vary according to the
carcinogens included. However, this also depends on the prevalence of exposure within
the population and the risk associated with the particular carcinogen. It is up to the
discretion of the investigators to determine which carcinogens are going to be included
in the estimate, for example Nurminen and Karjalainen (2001) included exposure to lead
and chlorinated hydrocarbon solvents as occupational bladder carcinogens in their
estimate of the attributable fraction. The CAREX Canada database does provide
estimates for the number of workers in Ontario who are exposed to these substances.
73, 569 Ontario workers are exposed to lead and 13, 639 workers are exposed to
perchloroethylene and trichloroethylene combined. However, the decision was made
not to include these substances as bladder carcinogens since they were not identified as
such by Siemiatycki et al. (2004). The present estimate, then, may underestimate the
proportion of the bladder cancers in Ontario due to occupation.

87
Another issue to consider when determining which bladder carcinogens to include in the
PAR calculation is the strength of evidence for carcinogenic potency. An underlying
assumption when calculating the PAR is that of causality. Causality is assessed
differently by different investigators leading to differing lists of carcinogens included in
PAR estimates.
One of the limitations of using the CAREX Canada database was that exposure
was defined broadly. The criterion for exposure was defined to include all exposures
above background levels for each carcinogen. The CAREX Canada database does not
contain exposure information by level of exposure
The two bladder carcinogens with the greatest prevalence in Ontario, PAH and
diesel exhaust, are both ubiquitous exposures that are also found outside of the
workplace. In addition, they are considered complex mixtures and assessing exposure
to a single PAH is difficult. Although diesel exhaust is also recognized as a complex
mixture containing PAH, it was assessed separately in the CAREX Canada database.
This calls into question the feasibility and utility of preventing occupational exposure
when exposure outside of the workplace will also occur.
Conclusion and Recommendations
The Cancer 2020 Action Plan found that there was a lack of well-documented
data on factors associated with occupational carcinogens (Canadian Cancer Society,
2006). The 2006 Cancer 2020 Report found that there is very little information in Ontario
on the burden of occupational cancer. The current study advances our knowledge of the
extent to which specific occupational bladder carcinogens contribute to the overall
bladder cancer burden in Ontario. The proportion of bladder cancer in Ontario due to
exposure to occupational carcinogens is approximately 5.6% (95% CI 0.002 to 0.140).
Including only the studies with the best exposure quality, the proportion is reduced to

88
3.5%. In Ontario, it is estimated that in 2001, there were between 33 to 52 incident
cases of bladder cancer due to occupational exposure to PAH, diesel exhaust, aromatic
amines and 2-naphthylamine. Based on the strengths and limitations identified above
the present PAR calculation may be an underestimation of the actual proportion of
bladder cancer that may be avoided by eliminating occupational exposures.
In addition to estimating the proportion of bladder cancer due to occupational
exposures in Ontario, the present study helps to inform strategies for primary cancer
prevention through the identification of priority areas on which to focus efforts. Through
the CAREX Canada database, Ontario-specific exposure estimates were available.
These estimates were necessary for the calculation of the PAR but are also useful in
themselves since knowledge of the numbers of exposed workers and the prevalence of
exposure within industry sectors allow focused prevention efforts on priority areas.
Large numbers of Ontario workers are exposed to PAHs and diesel exhaust, 119, 779
workers and 228, 719 workers, respectively. One consideration is to screen identified
high-risk groups for bladder cancer. However, due to the broad classification of both
exposure and industry sectors in the CAREX Canada database, the identification of such
high-risk groups is not yet possible.
Several studies in the past have attempted to quantify the proportion of cancer
due to occupational exposures. Other studies have also estimated the proportion of
bladder cancer attributable to occupational exposures. The estimates range from 2.0%
to 14% of cancer is due to occupation and specifically 2.0% to 24% of bladder cancer is
attributable to exposure to bladder carcinogens at work. Given the broad range of
estimates, why then was it necessary to calculate the PAR specifically for Ontario?
Although the present estimate of 5.6% is lower than estimates from past studies from
other countries, see Table 1, the present estimate is a much more valid one since it

89
accounts for the local prevalence of exposure and the effects of historical risks over time
by using risk estimates that are more reflective of present day exposure scenarios.
Studies that have assumed the exposure prevalence of another country is similar to their
own have produced the exact PAR estimates to those of the country whose exposure
prevalence was utilized (Fritschi and Driscoll, 2006;’t Mannetje and Pearce, 2005;
Nurminen and Karjalainen, 2001). Had resources been available to estimate local
exposure prevalence, it is feasible that the PAR estimates calculated in those studies
may have differed.
The present study also has the added benefit of identifying a changing pattern of
risk over time. For example, as bladder carcinogens are eliminated from the workplace
new carcinogens are emerging. The highest risks for bladder cancer were found for 2-
naphthylamine and for the overall group of aromatic amines, with risks ranging from 3.21
to 16.83 at high exposure levels. These represent historic exposures as the data
contained in the CAREX Canada database identified that current exposure to these
carcinogens in Ontario was very minimal. The emerging carcinogens that are of concern
are those affecting a large proportion of workers, namely exposure to PAHs and diesel
exhaust. This also highlights the issue of regulation of carcinogenic agents. The
purpose of the Ontario Occupational Health and Safety Act and the regulations under
this act is to protect Ontario workers against health and safety hazards on the job. The
legislation outlines the workers’ and employers’ rights and duties under the Act.
Regulation 833, Control of Exposure to Biological or Chemical Agents, sets limits for
approximately 600 toxic substances in workplace air. Under Part 10 of Regulation 833,
benzidine and 2-naphthylamine have been listed as known toxic agents for which
exposure values have not been established and to which any exposure should be
avoided. The results of the PAR calculation show the effectiveness of current legislation

90
as the aromatic amines contribute very little to the burden of bladder cancer in Ontario.
Interestingly, benzo(a)pyrene, a specifc PAH is also on this same list of exposures which
should be avoided. However, the current results show that of the bladder carcinogens
under study, PAHs contribute the most to the burden of bladder cancer in Ontario. This
is in part because PAHs are complex mixtures and very rarely can exposure to a single
PAH, such as benzo(a)pyrene, be isolated. In addition, due to the ubiquitous nature of
PAHs, exposure to PAHs may be reduced but in reality never eliminated. This highlights
a dilemma for occupational health professionals and the need for increased attention to
prevention efforts in the area of PAHs.
The current study highlights the utility of the CAREX Canada database in
advancing current knowledge on the burden of occupational cancer in Ontario. The
methods used to estimate the proportion of bladder cancer attributable to occupational
exposure in Ontario may be replicated to estimate the proportion of cancer in Ontario
that is due to occupational exposure. There is also the opportunity through the periodic
updating of the CAREX Canada database to identify changing exposure and therefore
risk patterns in Ontario industry sectors over time.
The current study contributes to the overall body of knowledge on risk factors
associated to bladder cancer. The elimination of smoking can account for a 30 to 60
percent reduction in bladder cancer (IARC 2004). The elimination of chlorination by-
products in drinking water can account for a 14 to 16 percent reduction in bladder cancer
(King and Marrett, 1996). A further 5 to 6 percent of bladder cancer incidence can be
avoided through the elimination of occupational exposures.
The present study may be criticized for attempting to determine the proportion of bladder
cancer that is due to occupational exposures. The criticism lies in the complex nature of
cancer causation and the many factors involved. It may be inappropriate to assign

91
certain exposures a particular role in causing cancer that will total 100% when no one
exposure on its own produces cancer and there are likely many other causes of cancer
which are still unknown. However, the objective of this study was not merely to produce
a single number to characterize the burden of occupational bladder cancer in Ontario.
This number will change as new carcinogens are identified, as risks estimates for
bladder cancer are further refined and as the prevalence of exposure to carcinogens in
Ontario workers changes. Through trying to estimate the magnitude of occupational
bladder cancer in Ontario, those exposed to occupational carcinogens have been
identified and most importantly these exposures can be minimized and are preventable.

92
References Adami HO, Hunter D, Trichopoulos, D, editors. Textbook of Cancer Epidemiology. New York: Oxford University Press; 2002. Bonassi S, Merlo F, Pearce N, Puntoni, R. Bladder cancer and occupational exposure to polycyclic aromatic hydrocarbons. Int J Cancer 1989; 44:648-651. Borden LS, Clark PE, Hall MC. Bladder cancer. Opin Oncol 2003; 15:227-233. Boyko R, Cartwright M, Glashan R. Bladder cancer in dye manufacturing workers. J Occup Med 1985; 27(11): 799-803. Canadian Cancer Society/Cancer Care Ontario. Report on Cancer 2020 A Call for Renewed Action on Cancer Prevention and Detection in Ontario. Toronto, Canada, 2006. Canadian Cancer Society/National Cancer Institute of Canada. Canadian Cancer Statistics 2008. Toronto, Canada, 2008. Cancer Care Ontario website: http://www.cancercare.on.ca/print/index_statisticsBladder.htm Accessed: June, 2008 Cancer Surveillance On-line website: http://dsol-smed.phac-aspc.gc.ca/dsol-smed/cancer/index_e.html Accessed: June, 2008 Carreon T, LeMasters G, Ruder A, Schulte P. The genetic and environmental factors involved in benzidine metabolism and bladder carcinogenesis in exposed workers. Frontiers Biosci 2006; 11:2889-2902. Cassidy L, Youk A, Marsh G. The Drake health registry study: cause-specific mortality experience of workers potentially exposed to beta-naphthylamine. Am J Industrial Med 2003; 44:282-290. Clavel J, Mandereau L, Limasset J, Hemon D, Cordier S. Occupational exposure to polycyclic aromatic hydrocarbons and the risk of bladder cancer: a French case-control study. Int J Epidemiol 1994; 23(6): 1145-1153. Cohen S, Johansson S. Epidemiology and etiology of bladder cancer. Urol Clin North Am 1992; 19(3): 421-428. Cohen S, Shirai T, Steineck G. Epidemiology and etiology of premalignant and malignant urothelial changes. Scan J Urol Nephrol Supp. 2000; 205:105-115. Concha-Barrientos M, Imel N, Driscoll T, Steenland K et al. Selected occupational risk factors. In: EzzatiM, LopezA, Murray J, eds. Comparative quantification of health risks: global and regional burden of disease attributable to selected major risk factors. Geneva, World Health Organization, 2004.

93
D’Avanzo B, La Vecchia C, Negri E, Decarli A, Benichou J. Attributable risks for bladder cancer in Northern Italy. Ann Epidemiol 1995; 5(6):427-431. Demers P, McCaig K, Astrakianakis G, Friesen M, Du W. Carcinogen Surveillance Program Final Report to Workers’ Compensation Board of British Columbia. Vancouver: Worksafe BC, 2007. Available: http://www.worksafebc.com/contact_us/research/research_results/res_60_10_340.asp [Accessed June, 2008]. Demers P, Waller B, Marrett L, Payne J et al. CAREX as a Tool for Occupational Carcinogen Exposure Surveillance in Ontario. Unpublished manuscript. Deschampts F, Barouh M, Deslee G, Prevost A, Munck J. Estimates of work-related cancers in workers exposed to carcinogens. Occup Med 2006; 56:204-209. Doll R and Peto R. The causes of cancer: Quantitative estimates of avoidable risks of cancer in the United States today. J Natl Cancer Inst 1981; 66:1191-1308. Driscoll T, Steenland K, Pruss-Ustun A, Nelson D, Leigh J. Occupational carcinogens: assessing the environmental burden of disease at national and local levels. Geneva, World Health Organization, 2004. (Environmental Burden of Disease Series, No.6). Droller M. Epidemiology of bladder cancer. In Textbook of Bladder Cancer. Lerner S, Schoenberg M, Sternberg C. Eds. Taylor and Francis: Abingdon, 2006. 3-12. Ezzati M, Lopez A, Rodgers A, Vander Hoorn S, Murray C; Comparative Risk Assessment Collaborating Group. Selected major risk factors and global and regional burden of disease. Lancet 2002; 360(9343):1347-1360. Fritschi L and Driscoll T. Cancer due to occupation in Australia. Aust N Z J Public Health 2006; 30:213-219. Gaertner RW, Trpeski L, Johnson KC. The Canadian Cancer Registries Epidemiology Research Group. A case-control study of occupational risk factors for bladder cancer in Canada. Cancer Causes Control 2004; 15:1007-1019. Guo J, Kauppinen T, Kyyronen P, Heikkila P et al. Risk of esophageal, ovarian, testicular, kidney and bladder cancers and leukemia among Finnish workers exposed to diesel or gasoline engine exhaust. Int J Cancer 2004; 111:286-292. Higgins JP, Thompson SG, Deeks JJ, Altman DG. Measuring inconsistency in meta-analyses. BMJ 2003; 327: 557-560. IARC Monographs on the Evaluation of Carcinogenic Risks to Humans: Tobacco Smoke and Involuntary Smoking Vol.83 Lyon: France;2004. Kauppinen T, Toikkanen J, Pedersen D, Young R et al. Occupational Exposure to Carcinogens in the European Union in 1990-93. Helsinki: Finnish Institute of Occupational Health; 1998.

94
Kellen E, Zeegers M, Paulussen A, Vlietinck R et al. Does occupational exposure to PAHs, diesel and aromatic amines interact with smoking and metabolic genetic polymorphisms to increase the risk on bladder cancer? The Belgian case control study on bladder cancer risk. Cancer Letters 2007; 245:51-60. Kelsey JL, Whittemore AS, Evans AS, Thompson WD, editors. Methods in Observational Epidemiology. New York: Oxford University Press; 1996. King W, Marrett L. Case-control study of bladder cancer and chlorination by-products in treated water (Ontario, Canada). Cancer Causes Control 1996; 7(6):596-604. Kogevinas M, ‘t Mannetje A, Cordier S, Ranft U et al. Occupation and bladder cancer among men in Western Europe. Cancer Causes Control 2003; 14:907-914. Mantanoski G, Elliott E. Bladder cancer epidemiology. Epidemiol Rev 1981; 3: 203-229. Marrett LD, Nishri ED, Swift MB, Walter SD. Holowaty EJ. Geographic Distribution of Cancer in Ontario Vol II: Atlas of Cancer Incidence. Toronto: Ontario Cancer Treatment and Research Foundation; 1995. Moulin J, Clavel T, Buclez B, Laffitte-Rigaud G. A mortality study among workers in a French aluminum reduction plant. Int Arch Occup Environ Health 2000; 73:323-330. Negri E, La Vecchia C. Epidemiology and prevention of bladder cancer. Euro J Cancer Prev 2001; 10:7-14. Nurminen M, Karjalainen A. Epidemiologic estimate of the proportion of fatalities related to occupational factors in Finland. Scand J Work Environ Health 2001; 24(3):161-213. Ouellet-Hellstrom R and Rench J. Bladder cancer incidence in arylamine workers. Occup Environ Med 1996; 38(12): 1239-1247. Pesch B, Haertling J, Ranft U, Klimpel A et al. Occupational risk factors for urothelial carcinoma:agent-specific results from a case-control study in Germany. Int J Epidemiology 2000; 29:238-247. Romundstad P, Haldorsen T, Andersen A. Lung and bladder cnacer among workers in a Norwegian aluminium reduction plant. Occup Environ Med 2000; 57:495-499. Romundstad P, Haldorsen T, Andersen A. Cancer incidence and cause specific mortality among workers in two Norwegian aluminum reduction plants. Am J Ind Med 2000; 37:175-183. Schulte P, Ringen K, Hemstreet G, Altekruse E et al. Risk factors for bladder cancer in a cohort exposed to aromatic amines. Cancer 1986; 58:2156-2162. Siemiatycki J, Richardson L, Straif K, Latreille B, et al., Listing occupational carcinogens. Environ Health Perspec 2004; 112(15):1447-1459.

95
Silverman D, Hoover R, Mason T, Swanson G. Motor exhaust-related occupations and bladder cancer. Cancer Res 1986; 46: 2113-2116.
Silverman D, Devesa S, et al. Bladder Cancer. In Cancer Epidemiology and Prevention: Third Edition. Oxford University Press: Oxford, 2006. 1101-1127.
Smith E, Miller E, Woolson R, Brown C. Bladder cancer risk among auto and truck mechanics and chemically related occupations. AJPH 1985; 75:881-883. Soll-Johanning H, Bach E, Jensen S. Lung and bladder cancer among Danish urban bus drivers and tramway employees: a nested case-control study. Occup Med 2003; 53:25-33. Steenland K, Burnett C, Lalich N, Ward E, Hurrell J. Dying for Work: The magnitude of US mortality from selected causes of death associated with occupation. Am J Indus Med 2003; 43:461-482. Steenland K, Armstrong B. An overview of methods for calculating the burden of disease due to specific risk factors. Epidemiology 2006; 17(5):512-519.
Steineck G, Plato N, Gerhardsson M, Norell S, Hogstedt C. Increased risk of urothelial cancer in Stockholm during 1985-87 after exposure to benzene and exhausts. Int J Cancer 1990; 45:1012-1017. Steineck G, Plato N, Alfredsson L, Norell S. 1989. Industry-related urothelial carcinogens: application of a job-exposure matrix to census data. Am J Ind Med 1989; 16:209-224. Steineck G. Demographic and epidemiologic aspects of bladder cancer. In Bladder Cancer Current Diagnosis and Treatment. Droller M. ed.; Humana Press: Totowa, 2001. 1-24. ‘t Mennetje A, Pearce N. Quantitative estimate of work-related death, disease and injury in New Zealand. Scan J Work Environ Health 2005; 31(4):266-276. Tremblay C, Armstrong B, Theriault G, Brodeur J. Estimation of risk of developing bladder cancer among workers exposed to coal tar pitch volatiles in the primary aluminum industry. Am J Ind Med 1995; 27:335-348. Tola S. Occupational cancer of the urinary bladder. J. Toxicol Environ Health 1980; 6(5-6):1253-1260. van der Meijden AP. Fortnightly review:bladder cancer. BMJ 1998; 317(7169):1366-9 Vineis P and Esteve J. Temporal aspects of bladder carcinogenesis. Toxic Pathol 1987; 15(2): 234-237. Vineis P, Simonato L. Proportion of lung and bladder cancers in males resulting from occupation: a systemic approach. Arch Environ Health 1991; 46(1):6-15. Zeegers M, Swaen G, Kant I, Goldbohm R, van den Brandt P. Occupational risk factors

96
for male bladder cancer: results from a population based case cohort study in the Netherlands. Occup Environ Med 2001; 58:590-596.

97
APPENDIX A
Carcinogens included in CAREX Canada Database

98
Carcinogens included in CAREX Canada Database
Occupational Carcinogen IARC Group
4-Aminobiphenyl 1
Acrylamide 2A
Adriamycin* 2A
Acrylonitrile 2B
Aflatoxins 1
Androgenic steroids* 2A
Arsenic and its compounds 1
Asbestos 1
Azacitidine* 2A
Azathioprine* 1
Bischloroethyl nitrourea (BCNU) 2A
Bis(chloromethyl)ether & chloromethyl methyl ether 1
Benzidine-based dyes 2A
Beryllium and its compounds 1
Benzene 1
Benzidine 1
1,3-Butadiene 2A
1,4-Butanediol dimethanesulfonate (Myleran)* 1
Cadmium and its compounds 1

99
Captafol 2A
Carbon tetrachloride 2B
Ceramic fibers 2B
Chlorambucil* 1
Chloramphenicol* 2A
Chlorozotocin* 2A
Chromium VI compounds 1
Ciclosporin* 1
Cisplatin* 2A
1-(2-Chlorethyl)-3-(4-methylcyclohexyl)-1-nitrosourea* 1
1-(2-Chlorethyl)-3-cyclohexyl-1-nitrosourea (CCNU)* 2A
Cobalt and its compounds 2B
Cyclophosphamide* 1
Creosotes 2A
Coal-tars 1
Diesel engine exhaust 2A
Diethylstilboestrol 1
Diethyl sulfate 2A
Dimethylcarbamoyl chloride 2A
Dimethyl sulfate 2A
Epichlorohydrin 2A
Erionite 1
Ethylene dibromide 2A
Ethylene oxide 1
Environmental tobacco smoke (at work) 1
Formaldehyde 1
Glasswool 2B
Helicobacter pylori 1
Hepatitis B virus 1
Hepatitis C virus 1
Ionizing radiation and radioactive elements (exclu. Radon) 1

100
Lead and lead compounds 2A
Melophalan* 1
5-Methoxypsoalen* 2A
8-Methoxyspoalen therapy* 1
Methylene chloride 2B
4,4’-Methylen bis(2-chloroaniline) (MOCA) 2A
Mustard gas (sulphur mustard)* 1
Mineral oils, untreated 1
MOPP and other chemotherapy, including alkylating agents* 1
N-Ethyl-N-nitrosourea 2A
N-Methyl-N’-nitro-N-nitrosoquanidine (MNNG)* 2A
N-Methyl-N-nitrosourea 2A
N,N-Bis(2-chloroethyl)-2-naphthylamine (Chlonaphazine)* 1
N-Nitrosodiethylamine 2A
N-Nitrosodimethylamine 2A
2-Naphthylamine 1
Nickel compounds 1
Nitrogen mustard* 1
Non-arsenical insecticides 2A
Oestrogens, nonsteroidal* 1
Oestrogens, steroidal* 1
Oral contraceptives, combined* 1
Oral contraceptives, sequential* 1
Para-Chloro-ortho-toluidine & its strong acid salts 2A
Pentachlorophenol 2B
Polychlorinated biphenyls (PCBs) 2A
Polycyclic aromatic hydrocarbons (PAHs) 2A
Procarbazine hydrochloride* 2A
Radon and its decay products 1
Shale-oils 1
Silica, crystalline 1
Solar radiation 1
Styrene 2B
Styrene-7,8-oxide 2A

101
Sulfuric acid mist 1
Talc containing asbestiform fibers 1
Tetrachloroethylene 2A
Thiotepa* 1
Tresulfan 1
Tris(2,3-dibromopropyl)phosphate 2A
1,2,3-trichloropropane 2A
Trichloroethylene 2A
Ultraviolet (UV) radiation, artificial 2A
Vinyl bromide 2A
Vinyl chloride 1
Vinyl fluoride 2A
Wood dust 1
*pharmaceutical agents to which health care and pharmacy industry workers may be
exposed, many are now banned from use in Canada.

102
APPENDIX B
CAREX Canada Screenshots

103
CAREX Canada Opening Screen

104
CAREX Canada Primary Exposure Estimation Screen

105
APPENDIX C Evidence Tables

106
Cohort Studies Beta-naphtylamine Authors Cassidy LD, Youk AO, Marsh GM Publication Year 2003 Study type Cohort study Geographic Region Pennsylvania, USA Outcome Mortality Study years (enrolment) 1940 to 1981 Years of follow-up 1960 to 1998 Study population Workers employed at a chemical plant that
produced or used beta-naphthylamine Occupation/Exposure Data Source Limited industrial hygiene data and reports
from former employees Reference Population US Standard Population and Local County
Population Outcome Data Source National Death Index or death certificates Total Subjects Included for Analysis 400 Bladder Cancer Risk Estimate Comparison OBS SMR 95% CI
US 4 21.43 5.84-54.87 Local 4 16.83 4.59-43.21
Exposure Quality (EQ) Score/Notes EQ = 3 Bladder cancer SMRs were highest and statistically significant among subjects at risk before age 45, hired before 1963, employed 5 or more years, followed 20-29 years since first employment, or in the highest BNA exposure risk group
Polycyclic Aromatic Hydrocarbons Authors Zeegers MPA, Swaen GMH, Kant I,
Goldbohm RA, van den Brandt PA Publication Year 2001 Study type Prospective cohort study, case-cohort
approach Geographic Region Netherlands Outcome Incidence Study years (enrolment) 1986 to 1992 Years of follow-up 1986 to 1992 Study population General population, cases enumerated from
entire cohort Occupation/Exposure Data Source Experts in occupational epidemiology and
occupational hygiene assessed probability of carcinogenic exposures based on self-administered questionnaires
Reference Population Subcohort of men randomly sampled from entire cohort after baseline exposure measurement
Outcome Data Source Record linkage to dutch cancer registries and dutch national database of pathology reports
Total Subjects Included for Analysis 2249 Bladder Cancer Risk Estimate PAH exp index RR*(95%CI)
No exposure 1.00 (reference) Low exposure 0.47 (0.21 to 1.04)

107
Medium exposure 0.85 (0.45 to 1.59) High exposure 1.24 (0.72 to 2.13) P Value for trend = 0.98 *adjusted for age PAH exp index RR**(95% CI) No exposure 1.00 (reference) Low exposure 0.51 (0.22 to 1.19) Medium exposure 0.97 (0.40 to 1.90) High exposure 1.18 (0.62 to 2.24) P Value for trend = 0.85 ** adjusted for age, other occupational exposures, cigarette smoking amount and duration
Exposure Quality (EQ) Score/Notes EQ = 4 Qualitative exposure information assessed by experts in occupational epidemiology and occupational hygiene
Authors Moulin JJ, Clavel T, Buclez B, Laffitte-Rigaud
G Publication Year 2000 Study type Retrospective cohort study Geographic Region France Outcome mortality Study years (enrolment) January 1950 to December 1994 Years of follow-up January 1968 to December 1994 Study population Every male worker employed in an aluminum
reduction plant Occupation/Exposure Data Source Personnel files, administrative records Reference Population France regional population Outcome Data Source National death files, national death certificate
files Total Subjects Included for Analysis 2133 Bladder Cancer Risk Estimate Obs SMR 95% CI
7 1.77 0.71 to 3.64 Exposure Quality (EQ) Score/Notes EQ = 2
Only broad definition of PAH exposure “having ever been employed in the potroom, electrode manufacture department, exhaust ventilation operations, pot-lining and maintenance”, other exposures not accounted for
Authors Romundstad P, Haldorsen T, Andersen A Publication Year 2000 Study type Cohort study Geographic Region Norway Outcome incidence Study years (enrolment) 1953 to 1995 Years of follow-up 1953 to 1995 Study population Men employed for more than 5 years at a
Norwegian aluminum plant

108
Occupation/Exposure Data Source Quantitative estimate of PAH exposure based on personal measurements, stationary measurements and descriptions of changes in the technological processes over time, for periods with very little measurements, a panel of 3 occupational hygienists agreed on subjective estimates. The results were summed in a job-exposure matrix for PAHs.
Reference Population National population Outcome Data Source Cancer Registry of Norway Total Subjects Included for Analysis 1790 Bladder Cancer Risk Estimate Obs SIR 95% CI
23 1.3 0.8 to 1.9 Exposure Quality (EQ) Score/Notes EQ = 5
Quantitative exposure measurements used Authors Romundstad P, Haldorsen T, Andersen A Publication Year 2000 Study type Retrospective cohort study Geographic Region Norway Outcome Incidence Study years (enrolment) 1954 to 1995 Years of follow-up Time of hire to 1995 Study population Men employed for six months or more at one
of the two plants under study Occupation/Exposure Data Source Estimation of exposure to PAHs based on
statistical modeling of personal measurements, stationary measurements and process data.
Reference Population National population Outcome Data Source Cancer Registry of Norway Total Subjects Included for Analysis 5627 Bladder Cancer Risk Estimate Less than 3 yrs of employment
Obs SIR 95% CI 5 0.78 0.25 to 1.82 More than 3 yrs of employment Obs SIR 95% CI 36 1.37 0.96 to 1.90 Lag = 30 years Cumulative Obs SIR 95% CI PAH exposure (µg/m3. year) <50 24 1.29 0.83 to 1.92 50-500 3 1.04 0.21 to 3.03 500-2000 4 1.16 0.32 to 2.97 >2000 5 4.08 1.32 to 9.51
Exposure Quality (EQ) Score/Notes EQ = 5 Quantitative exposure measurements used

109
Diesel Exhaust Authors Guo J, Kauppinen T, Kyyronen P, Heikkila P,
Lindbohm M, Pukkala E Publication Year 2004 Study type Cohort study Geographic Region Finland Outcome incidence Study years (enrolment) Finns born between 1906 and 1945 Years of follow-up 1971 to 1995 Study population Economically active Finns born between 1906
and 1945 who participated in the 1970 national population census
Occupation/Exposure Data Source Data on occupation held for the longest period in the 1970 Censes record, exposure estimates for the cohort were derived from FINJEM based on exposure measurements, hazard surveys and judgements of 20 occupational hygienists
Reference Population Finnish population Outcome Data Source Finnish cancer registry Total Subjects Included for Analysis 8110 Bladder Cancer Risk Estimate Diesel exhaust exposure (mg/m3 x years)
Cases RR 95% CI None 6026 1.00 <2.0 493 1.00 0.91 to 1.11 2.0-9.9 200 0.95 0.83 to 1.10 ≥10.0 78 0.97 0.77 to 1.21
Exposure Quality (EQ) Score/Notes EQ = 4 Semi-quantitative exposure assessment using FINJEM
Authors Zeegers MPA, Swaen GMH, Kant I,
Goldbohm RA, van den Brandt PA Publication Year 2001 Study type Prospective cohort study, case-cohort
approach Geographic Region Netherlands Outcome Incidence Study years (enrolment) 1986 to 1992 Years of follow-up 1986 to 1992 Study population General population, cases enumerated from
entire cohort Occupation/Exposure Data Source Experts in occupational epidemiology and
occupational hygiene assessed probability of carcinogenic exposures based on self-administered questionnaires
Reference Population Subcohort of men randomly sampled from entire cohort after baseline exposure measurement
Outcome Data Source Record linkage to dutch cancer registries and dutch national database of pathology reports
Total Subjects Included for Analysis 2249 Bladder Cancer Risk Estimate Diesel exp index RR*(95%CI)

110
No exposure 1.00 (reference) Low exposure 1.00 (0.68 to 1.51) Medium exposure 0.99 (0.65 to 1.52) High exposure 1.07 (0.70 to 1.62) P Value for trend = 0.78 *adjusted for age Diesel exp index RR**(95% CI) No exposure 1.00 (reference) Low exposure 1.00 (0.65 to 1.54) Medium exposure 0.96 (0.60 to 1.53) High exposure 1.17 (0.74 to 1.84) P Value for trend = 0.76 ** adjusted for age, other occupational exposures, cigarette smoking amount and duration
Exposure Quality (EQ) Score/Notes EQ = 4 Qualitative exposure information assessed by experts in occupational epidemiology and occupational hygiene
Aromatic Amines Authors Ouellet-Hellstrom R, Rench J Publication Year 1996 Study type Cohort study Geographic Region United States Outcome incidence Study years (enrolment) June 1965 to December 1989 Years of follow-up 1990 to 1993 Study population 704 workers employed at a Connecticut
chemical from mid-1965 to 1989. The plant produced a variety of chemicals including arylamines
Occupation/Exposure Data Source Work histories and demographic information obtained from corporate database and personnel records. Exposure Assessment Committee of former and current workers knowledgeable about work processes developed exposure score for each job title. The exposure scoring system was based on intensity of exposure (0 – no exposure to 5 –greatest exposure) and frequency of contact (0% no time spent to 100% of time spent). The exposure scoring system took into account exposure-control measures at the plant. Work histories also obtained through mail survey.
Reference Population Connecticut cancer incidence rates through 1990
Outcome Data Source Company’s medical surveillance, cancer cases register at the Connecticut Tumor Registry, review of death certificate of

111
deceased workers and mail survey to identify and confirm reported cancers
Total Subjects Included for Analysis 698 workers (583 men, 115 women) Bladder Cancer Risk Estimate Obs SIR* 95% CI
7 8.3 3.3 to 17.1 *regression model included confounders such as sex, smoking and age at hire
Exposure Quality (EQ) Score/Notes EQ = 4 Qualitative exposure scoring system based on intensity of exposure and frequency of contact
Authors Zeegers MPA, Swaen GMH, Kant I,
Goldbohm RA, van den Brandt PA Publication Year 2001 Study type Prospective cohort study, case-cohort
approach Geographic Region Netherlands Outcome Incidence Study years (enrolment) 1986 to 1992 Years of follow-up 1986 to 1992 Study population General population, cases enumerated from
entire cohort Occupation/Exposure Data Source Experts in occupational epidemiology and
occupational hygiene assessed probability of carcinogenic exposures based on self-administered questionnaires
Reference Population Subcohort of men randomly sampled from entire cohort after baseline exposure measurement
Outcome Data Source Record linkage to dutch cancer registries and dutch national database of pathology reports
Total Subjects Included for Analysis 2249 Bladder Cancer Risk Estimate Aromatic amines RR*(95%CI)
No exposure 1.00 (reference) Low exposure 0.77 (0.21 to 2.85) High exposure 2.00 (0.68 to 5.88) P Value for trend = 0.24 *adjusted for age Aromatic amines RR**(95% CI) No exposure 1.00 (reference) Low exposure 0.64 (0.13 to 3.22) High exposure 1.36 (0.42 to 4.35) P Value for trend = 0.72 ** adjusted for age, other occupational exposures, cigarette smoking amount and duration
Exposure Quality (EQ) Score/Notes EQ = 4 Qualitative exposure information assessed by experts in occupational epidemiology and occupational hygiene

112
Case Control Studies Polycyclic Aromatic Hydrocarbons Authors Tremblay C, Armstrong B, Theriault G,
Brodeur J Publication Year 1995 Study type Nested case-control study Geographic Region Quebec Outcome incidence Study years (enrolment) January 1950 to December 1979 Years of follow-up 1970 to 1988 Study population Cohort of 16 000 males employed for more
than one year at a aluminum plant in Quebec Occupation/Exposure Data Source JEM constructed by company hygienists Reference Population Random sample of cohort members, 3
matched controls per case Outcome Data Source Record linkage from regional hospital and
Quebec tumour registry Total Subjects Included for Analysis 138 cases, 414 controls Bladder Cancer Risk Estimate Cases OR 95% CI
Never Smokers 1.00 Current Smokers 91 2.63 1.29 to 5.37 Ex-smokers 20 1.79 0.68 to 4.67 Benzene-soluble matter (BSM) mg/m3-years Cases OR* 95% CI 0-0.9 136 1.0 1.0-9.9 146 1.67 0.89 to 3.16 10.0-19.9 47 3.93 1.85 to 8.49 20.0-29.9 40 7.31 3.36 to 14.99 30.0+ 45 5.18 2.47 to 10.89 Benzo(a)pyrene (BaP) µg/m3-years Cases OR* 95% CI 0-9.9 215 1.0 10.0-99.9 96 1.97 1.10 to 3.51 100.0-199.9 32 6.24 3.00 to 12.97 200.0-299.9 38 6.66 3.42 to 12.99 300+ 33 4.36 2.10 to 9.17 *controlled for smoking
Exposure Quality (EQ) Score/Notes EQ = 5 Quantitative exposure estimates used
Authors Clavel J, Mandereau L, Limasset J, Hemon D,
Cordier S Publication Year 1994 Study type Multicentre hospital-based case-control study Geographic Region France Outcome incidence Study years (enrolment) 1984 to 1987 Years of follow-up 1984 to 1987

113
Study population Patients admitted to multiple hospitals in five areas in France
Occupation/Exposure Data Source Structured questionnaire, occupational exposures were evaluated by industrial health experts who were blind to case/control status, semi-quantitative classification of PAH exposure
Reference Population Controls were patients admitted to variety of diseases other than cancer, haematuira and work accidents, matched to controls by gender, date of birth, hospital, place of residence and ethnic origin
Outcome Data Source Cases presenting with histologically-confirmed bladder cancer, aged <80 years
Total Subjects Included for Analysis 765 cases, 765 controls Bladder Cancer Risk Estimate Overall Exposure to PAH (ng/m3)
Cases OR* 95% CI Unexposed 424 1.0 Exposed 231 1.3 1.0 to 1.7 Maximum exposure to PAH Unexposed 424 1.0 Low 129 1.2 0.9 to 1.7 Medium 64 1.3 0.9 to 2.1 High 29 1.8 0.9 to 3.6 P for trend <0/.05 Average exposure to PAH Unexposed 424 1.0 Low 127 1.2 0.9 to 1.7 Medium 64 1.4 0.9 to 2.2 High 26 1.8 0.8 to 3.9 P for trend <0.05 Cumulative exposure to PAH (ng/m3 x years) Unexposed 424 1.0 <100 108 1.7 1.2 to 2.4 100-499 37 0.8 0.5 to 1.3 500- 14 999 48 1.3 0.8 to 2.0 ≥15 000 24 1.8 0.8 to 3.9 p for trend not significant *adjusted for cumulative smoking, coffee consumption, and subjects possibly exposed to aromatic amines
Exposure Quality (EQ) Score/Notes EQ = 4 Semi-quantitative exposure estimates used Slight dose-response relationship observed

114
Authors Pesch B, Haertling J, Ranft U, Klimpel A,
Oelschlagel B, Schill W Publication Year 2000 Study type Population-based case-control study Geographic Region Germany Outcome incidence Study years (enrolment) 1991 to 1995 Years of follow-up 1991 to 1995 Study population German nationals Occupation/Exposure Data Source Face-to-face interview, structured
questionnaire Reference Population Randomly selected population controls
selected from local residency registries, controls matched to cases by region, sex and age
Outcome Data Source Histologically confirmed urothelial cancer Total Subjects Included for Analysis 704 male cases, 2650 controls Bladder Cancer Risk Estimate PAH Exposure
Index Cases OR 95% CI Medium 97 1.0 0.8 to 1.3 High 123 1.3 1.0 to 1.7 Substantial 47 1.6 1.1 to 2.3
Exposure Quality (EQ) Score/Notes EQ = 3 Qualitative exposure assessment using British JEM
Diesel Exhaust Authors Kellen E, Zeegers M, Paulussen A, Vlietinck
R, Vlem E, Veulemans H, Bintinx F Publication Year 2007 Study type Population-based case-control study Geographic Region Belgium Outcome incidence Study years (enrolment) 1999 to 2004 Years of follow-up 1999 to 2004 Study population Population of Limburg Belgium Occupation/Exposure Data Source Structured interview, occupational exposure to
PAHs, aromatic amines and diesel were blindly coded by 2 occupational hygienists
Reference Population Simple random sampling of social security among all citizens 50+ years in the province of Limburg
Outcome Data Source Histologically confirmed cases selected from the Limburg Cancer Registry
Total Subjects Included for Analysis 200 cases, 385 controls Bladder Cancer Risk Estimate Diesel
Exposure Cases OR* 95% CI No exposure 144 1.00 Low exposure 20 0.80 0.40 to 1.57 High exposure 36 1.51 0.85 to 2.75 P for trend = 0.25

115
*OR adjusted for sex, age, smoking status Exposure Quality (EQ) Score/Notes EQ = 4
Qualitative exposure estimates made by occupational hygienists
Authors Soll-Johanning H, Bach E, Jensen S Publication Year 2003 Study type Nested case-control Geographic Region Denmark Outcome No distinction between incident and deceased
cases Study years (enrolment) 1900 to 1994 Years of follow-up Study population Cohort of 18 174 bus and tramway employees
employed by the Copenhagen Traffic Company from 1900 to 1994
Occupation/Exposure Data Source Information on length of employement obtained from employment files
Reference Population Random sample controls from cohort Outcome Data Source Danish cancer registry Total Subjects Included for Analysis 84 cases, 255 controls Bladder Cancer Risk Estimate > 10 year lag
cumulated employment Cases RR 95% CI <3 months 1 1.21 0.12 to 12.34 3 mo-2 yrs 11 1.00 10-<20 yrs 15 1.61 0.57 to 4.55 20+ yrs 33 1.28 0.52 to 3.13 *adjusted for smoking
Exposure Quality (EQ) Score/Notes EQ = 3 Diesel exposure highly prevalent in this occupation, but exposure assessed only at level of occupation, no employment measurements estimated or obtained, environmental exposure to pollution estimated and accounted for
Authors Steineck G, Plato N, Gerhardsson M, Norell
S, Hogstedt C Publication Year 1990 Study type Population based case-control study Geographic Region Stockholm Outcome Incident cases Study years (enrolment) 1985 to 1987 Years of follow-up 1985 to 1987 Study population Men born between 1911 and 1945 living in
County of Stockholm Occupation/Exposure Data Source Postal questionnaire on occupational history,
hygienist blinded to case status classified subjects as exposed or unexposed, as well as level of exposure
Reference Population Stratified random sample of register covering the population of Stockholm

116
Outcome Data Source All incident cases of uorthelial cancer and/or squamous-cell carcinoma in the lower urinary tract
Total Subjects Included for Analysis 256 cases, 287 cases Bladder Cancer Risk Estimate Cases RR* 95% CI
Diesel Exhausts 25 1.7 0.9 to 3.3 Diesel Exhaust Exposure RR* 95% CI Low 1.3 0.6 to 3.1 Moderate 2.2 0.7 to 6.6 High 2.9 0.3 to 30.0 *adjusted for year of birth and smoking
Exposure Quality (EQ) Score/Notes EQ = 4 Occupational hygienist provided qualitative analysis levels of exposure for exposure of interest
Authors Silverman D, Hoover R, Mason T, Swanson M Publication Year 1986 Study type Population-based case control study Geographic Region United States Outcome Incident cases Study years (enrolment) 1977 to 1978 Years of follow-up 1977 to 1978 Study population Residents of states that participate in the
National Cancer Institute’s SEER program aged 21 to 84 years
Occupation/Exposure Data Source Interviews conducted by trained interviewers using questionnaire eliciting every job held for at least 6 months since the age of 12 years
Reference Population Random digit dialing to contact controls from the general population of the study areas and stratified random sample drawn from health care financing administrative list of the population over 64 years for each study area
Outcome Data Source All histologically confirmed cases of urinary bladder cancer as identified through population based cancer registry
Total Subjects Included for Analysis 1909 male cases, 3569 white male controls Bladder Cancer Risk Estimate Occupation cases RR* 95% CI
Never any Motor exhaust 1353 1.0 Related occ Truck driver or deliveryman Ever 488 1.3 1.1 to 1.4 Usual 99 1.5 1.1 to 2.0 Taxi driver or chauffeur Ever 77 1.6 1.2 to 2.2 Usual 10 6.3 1.6 to 29.3 Bus driver Ever 49 1.3 0.9 to 1.9

117
Usual 9 1.5 0.6 to 3.9 *adjusted for age and smoking Duration of employment Ever truck driver or deliveryman Years cases RR* <5 208 1.1 5-9 102 1.3 10-14 58 1.7 15-24 59 2.2 25+ 54 1.1 p<0.001 *adjusted for age and smoking No duration-response gradient observed for either taxi drivers or bus drivers
Exposure Quality (EQ) Score/Notes EQ = 2 Diesel exhaust exposure prevalent in occupations studied but other exposures may be possible and are not accounted for
Authors Smith E, Miller E, Woolson R, Brown C Publication Year 1985 Study type Population based case control study Geographic Region United States Outcome Incident cases Study years (enrolment) 1977 to 1978 Years of follow-up 1977 to 1978 Study population Residents of states that participate in the
National Cancer Institute’s SEER program aged 21 to 84 years
Occupation/Exposure Data Source Face-to-face interviews using structured questionnaire
Reference Population Age-sex-frequency matched to cases at 2:1 ratio in each geographic area
Outcome Data Source Newly diagnosed, histologically confirmed carcinoma of the urinary bladder, including papillomas not specified as benign
Total Subjects Included for Analysis 2108 cases, 4046 controls Bladder Cancer Risk Estimate Mechanics
RR 95%CI Smokers 1.21 0.90 to 1.63 Non-smokers 1.33 0.77 to 2.31 Chemically related Exposed Smokers 0.99 0.81 to 1.20 Non-smokers 1.53 1.13 to 2.07 Duration Smoker Nonsmoker Years RR (95%CI) RR (95%CI) 1-5 1.53 (1.07-2.20) 1.48 (0.73-2.75) 6-10 0.74 (0.43-1.28) 1.29 (0.54-3.11) 11-20 1.13 (0.67-1.92) 0.73 (0.21-2.53)

118
21-29 2.77 (1.34-5.71) 0.51 (0.06-4.11) 30+ 1.19 (0.66-2.13) 2.13 (0.78-5.80)
Exposure Quality (EQ) Score/Notes EQ = 3 Attempted to account for other possible exposures/similar exposures in analysis
Aromatic Amines Authors Bonassi S, Merlo F, Pearce N, Puntoni R Publication Year 1989 Study type Population-based case-control study Geographic Region Italy Outcome incidence Study years (enrolment) 1972 to 1982 Years of follow-up 1972 to 1982 Study population Population of Bormida Valley Italy Occupation/Exposure Data Source Standardized questionnaire administered by
trained interviewers. Subjects classified into 11 occupational categories identified a priori. A job-exposure matrix constructed to assess potential lifetime exposure to PAH and aromatic amines.
Reference Population Randomly selected from demographic registries of 19 communities from which the cases were identified
Outcome Data Source Histologically confirmed cases identified from hospital admission-discharge records
Total Subjects Included for Analysis 121 cases, 342 controls Bladder Cancer Risk Estimate Aromatic Amine (w/ exposure to PAH)
Exposure Cases OR* 95% CI No exposure 32 1.00 Low exposure 17 0.81 0.33 to 1.96 Med exposure 32 1.14 0.50 to 2.45 High exposure 39 3.55 1.56 to 8.06 *OR adjusted for smoking status
Exposure Quality (EQ) Score/Notes EQ = 3 Occupations included where aromatic amines are highly prevalent and other exposures such as PAHs have been accounted for. JEM used to assess potential lifetime exposure to PAH and aromatic amines.
Authors Boyko R, Cartwright R, Chir B, Glashan R Publication Year 1985 Study type Hospital-based and population-based case-
control Geographic Region England Outcome incident and prevalent cases Study years (enrolment) Incident cases from 1978 to 1981, prevalent
cases (diagnosed within the previous five years) from April to September 1978
Years of follow-up 1978 to 1981 Study population Six districts in West Yorkshire England

119
Occupation/Exposure Data Source Subjects classified as chemical dye workers or non-chemical dye workers according to information collected in face-to-face interviews
Reference Population Controls were patients of the same sex and age who occupied a hospital bed in the same hospital within 3 months of a case. Small subset of population-based controls also interviewed.
Outcome Data Source Any bladder cancer identified in the records of the District Health Authority of six districts in West Yorkshire
Total Subjects Included for Analysis 932 cases, 1457 controls Bladder Cancer Risk Estimate RR* 95% CI
2.60 1.84 to 3.66 *adjusted for age and smoking
Exposure Quality (EQ) Score/Notes EQ = 2 Aromatic amine exposure highly prevalent in dye manufacturing workers, but exposure assessed only at level of occupation, no employment measurements estimated or obtained
Authors Kellen E, Zeegers M, Paulussen A, Vlietinck
R, Vlem E, Veulemans H, Bintinx F Publication Year 2007 Study type Population-based case-control study Geographic Region Belgium Outcome incidence Study years (enrolment) 1999 to 2004 Years of follow-up 1999 to 2004 Study population Population of Limburg Belgium Occupation/Exposure Data Source Structured interview, occupational exposure to
PAHs, aromatic amines and diesel were blindly coded by 2 occupational hygienists
Reference Population Simple random sampling of social security among all citizens 50+ years in the province of Limburg
Outcome Data Source Histologically confirmed cases selected from the Limburg Cancer Registry
Total Subjects Included for Analysis 200 cases, 385 controls Bladder Cancer Risk Estimate Aromatic Amines
Exposure Cases OR* 95% CI No exposure 176 1.00 Low exposure 6 2.16 0.54 to 8.69 High exposure 18 5.75 2.09 to 15.83 P for trend = 0.00 *OR adjusted for sex, age, smoking status
Exposure Quality (EQ) Score/Notes EQ = 4 Qualitative exposure estimates made by occupational hygienists

120
Authors Schulte P, Ringen K, Hemstreet G, Altekruse E, Gullen W, Tillett S, Allsbrook W, Crosby J, Witherington R, Stringer W, Brubaker M.
Publication Year 1986 Study type Nest case-control study Geographic Region United States Outcome Incidence Study years (enrolment) 1940 to 1972 Years of follow-up 1940 to 1983 Study population All hourly workers ever employed at plant
between January 1 1940 and December 31 1972.
Occupation/Exposure Data Source As part of a medical screening program work in high exposure departments of the plant was identified. Information on potential risk factors such as race, marital, educational and income status, use of tobacco, work in other high risk occupations etc was gathered by questionnaire.
Reference Population Remaining 1372 workers in overall cohort Outcome Data Source Bladder cancer assessed through medical
screening program, contacting local urologists and death certificates of deceased members of the cohort
Total Subjects Included for Analysis 1385 workers (13 cases, 1372 controls) Bladder Cancer Risk Estimate Cases OR* 95% CI
13 4.3 1.8 to 10.3 *controlled for age, smoking and source of drinking water
Exposure Quality (EQ) Score/Notes EQ = 3 Qualitative exposure information determining areas of high exposure and questionnaire used for information on other potential exposures
Authors Vineis P, Esteve J Publication Year 1987 Study type Hospital-based case-control study (did not
specify if cancer controls were included) Geographic Region Italy Outcome Incidence Study years (enrolment) Not specified Years of follow-up Not specified Study population Hospital patients under 70 years residing in
Turin, Italy Occupation/Exposure Data Source Standardized questionnaire administered by
trained interviewers capturing items such as life history of smoking and complete occupational history.
Reference Population Hospital controls less than 70 years at time of diagnosis.
Outcome Data Source Hospital based bladder cancer patients (no indication of how bladder cancer diagnosis

121
was confirmed or ascertained) Total Subjects Included for Analysis 461 cases, 566 controls Bladder Cancer Risk Estimate Cases OR* 95% CI
42 2.96 1.7 to 5.3 *controlled for age, and dose, duration of smoking and smoking status
Exposure Quality (EQ) Score/Notes EQ = 2 Exposed individuals were considered if worked for at least 6 months in the rubber industry or in dyestuff production. Carcinogens of interest are present in these occupational groups but no indication if other possible occupational exposures were accounted for