Estimating probable maximum loss from a Cascadia tsunami
19
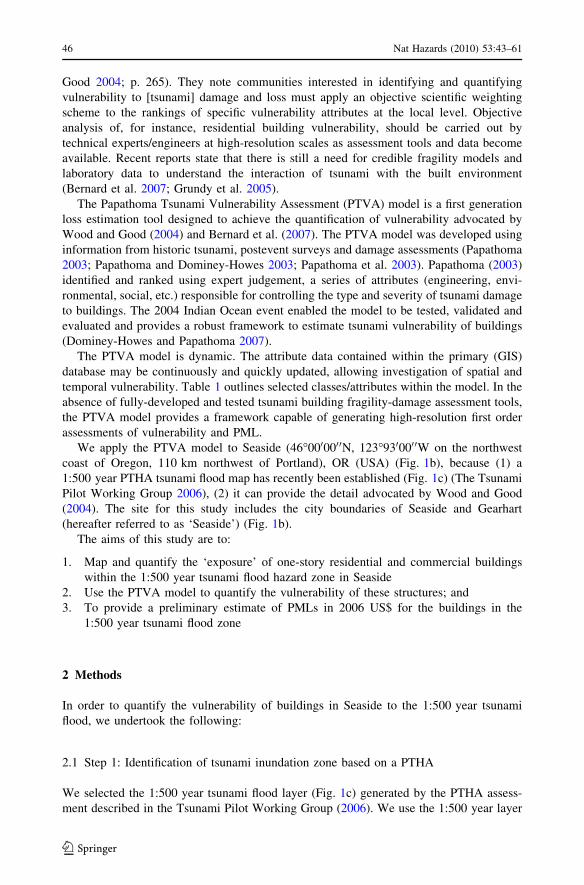
ORIGINAL PAPER Estimating probable maximum loss from a Cascadia tsunami Dale Dominey-Howes Paula Dunbar Jesse Varner Maria Papathoma-Ko ¨hle Received: 5 May 2008 / Accepted: 25 May 2009 / Published online: 17 June 2009 Ó Springer Science+Business Media B.V. 2009 Abstract The Cascadia margin is capable of generating large magnitude seismic-tsu- nami. We use a 1:500 year tsunami hazard flood layer produced during a probabilistic tsunami hazard assessment as the input to a pilot study of the vulnerability of residential and commercial buildings in Seaside, OR, USA. We map building exposure, apply the Papathoma Tsunami Vulnerability Assessment Model to calculate building vulnerability and estimate probable maximum loss (PML) associated with a 1:500 year tsunami flood. Almost US$0.5 billion worth of buildings would be inundated, 95% of single story resi- dential and 23% of commercial buildings would be destroyed with PML’s exceeding US$116 million. These figures only represent a tiny fraction of the total values of exposed assets and loss that would be associated with a Cascadia tsunami impacting the NW Pacific coast. Not withstanding the various issues associated with our approach, this study represents the first time that PML’s have ever been calculated for a Cascadia type tsunami, and these results have serious implications for tsunami disaster risk management in the region. This method has the potential to be rolled out across the United States and elsewhere for estimating building vulnerability and loss to tsunami. Keywords Tsunami Cascadia Building vulnerability assessment Loss PTVA model D. Dominey-Howes (&) Australian Tsunami Research Center, School of Biological, Earth and Environmental Science, University of New South Wales, Sydney, NSW 2052, Australia e-mail: [email protected] P. Dunbar National Geophysical Data Center, National Oceanic and Atmospheric Administration (NOAA), Boulder, CO 80303, USA J. Varner Cooperative Institute for Research in Environmental Sciences (CIRES), University of Colorado, Boulder, CO 80309, USA M. Papathoma-Ko ¨hle Department of Geography and Regional Research, University of Vienna, 1010 Wien, Austria 123 Nat Hazards (2010) 53:43–61 DOI 10.1007/s11069-009-9409-9
-
Upload
independent -
Category
Documents
-
view
2 -
download
0
Transcript of Estimating probable maximum loss from a Cascadia tsunami

ORI GIN AL PA PER
Estimating probable maximum loss from a Cascadiatsunami
Dale Dominey-Howes Æ Paula Dunbar Æ Jesse Varner ÆMaria Papathoma-Kohle
Received: 5 May 2008 / Accepted: 25 May 2009 / Published online: 17 June 2009� Springer Science+Business Media B.V. 2009
Abstract The Cascadia margin is capable of generating large magnitude seismic-tsu-
nami. We use a 1:500 year tsunami hazard flood layer produced during a probabilistictsunami hazard assessment as the input to a pilot study of the vulnerability of residential
and commercial buildings in Seaside, OR, USA. We map building exposure, apply the
Papathoma Tsunami Vulnerability Assessment Model to calculate building vulnerability
and estimate probable maximum loss (PML) associated with a 1:500 year tsunami flood.
Almost US$0.5 billion worth of buildings would be inundated, 95% of single story resi-
dential and 23% of commercial buildings would be destroyed with PML’s exceeding
US$116 million. These figures only represent a tiny fraction of the total values of exposed
assets and loss that would be associated with a Cascadia tsunami impacting the NW Pacific
coast. Not withstanding the various issues associated with our approach, this study
represents the first time that PML’s have ever been calculated for a Cascadia type tsunami,
and these results have serious implications for tsunami disaster risk management in
the region. This method has the potential to be rolled out across the United States and
elsewhere for estimating building vulnerability and loss to tsunami.
Keywords Tsunami � Cascadia � Building vulnerability assessment �Loss � PTVA model
D. Dominey-Howes (&)Australian Tsunami Research Center, School of Biological, Earth and Environmental Science,University of New South Wales, Sydney, NSW 2052, Australiae-mail: [email protected]
P. DunbarNational Geophysical Data Center, National Oceanic and Atmospheric Administration (NOAA),Boulder, CO 80303, USA
J. VarnerCooperative Institute for Research in Environmental Sciences (CIRES), University of Colorado,Boulder, CO 80309, USA
M. Papathoma-KohleDepartment of Geography and Regional Research, University of Vienna, 1010 Wien, Austria
123
Nat Hazards (2010) 53:43–61DOI 10.1007/s11069-009-9409-9

1 Introduction and aims
The Cascadia Subduction Zone (CSZ) (Fig. 1a) generates large (moment magnitude [ 8)
‘mega-thrust’ earthquakes similar to the 2004 Indian Ocean event (Satake and Atwater
2007). Coastal sediments in Oregon, Washington and British Columbia attest to the
occurrence of at least eight Holocene earthquake-tsunami (Kelsey et al. 2005; Losey 2005;
Nelson et al. 2006; Peters et al. 2007). Recurrence intervals along the CSZ range from 300
to 1,000 years with an average of 500–600 years (Peters et al. 2007).
Having recognized the hazard, efforts have begun to estimate future tsunami occurrence
using a probabilistic tsunami hazard assessment (PTHA) framework (The Tsunami Pilot
Working Group 2006). Once estimates are available, it is desirable to move to the next
stage of the risk management process by calculating likely probable maximum losses(PMLs) for particular events. This is important as PMLs are used to develop disaster
preparedness and response plans, to establish appropriate mitigation efforts such as land-
use zoning policies, to develop and apply building codes and regulations and to determine
where appropriate, insurance premiums. To estimate PMLs, information is needed about
the extent and severity of the hazard (in this case inundation distance and flow depth), asset
exposure (e.g., buildings located within the expected flood zone), the vulnerability of those
buildings and their market value (or replacement cost).
PACIFIC OCEAN
Seaside
Gearhart
Necanicum River
45.98 N
46.00 N
46.04 N
46.02 N
46.04 N
46.02 N
46.00 N
45.98 N
123.90 W123.92 W123.94 W123.96 W
123.90 W123.92 W123.96 W 123.94 W
0 200km
PACIFIC PLATE
JUAN DE FUCA PLATE
NORTH AMERICAN PLATE
California
Oregon
Washington
British Columbia
Vancouver
Portland
Seattle
44
48
122 W126
40 N
52
Vancouver Is
CA
SC
AD
IA S
UB
DU
CT
ION
ZO
NE
Juan
de
Fuca
Rid
ge
(a) (b)
130
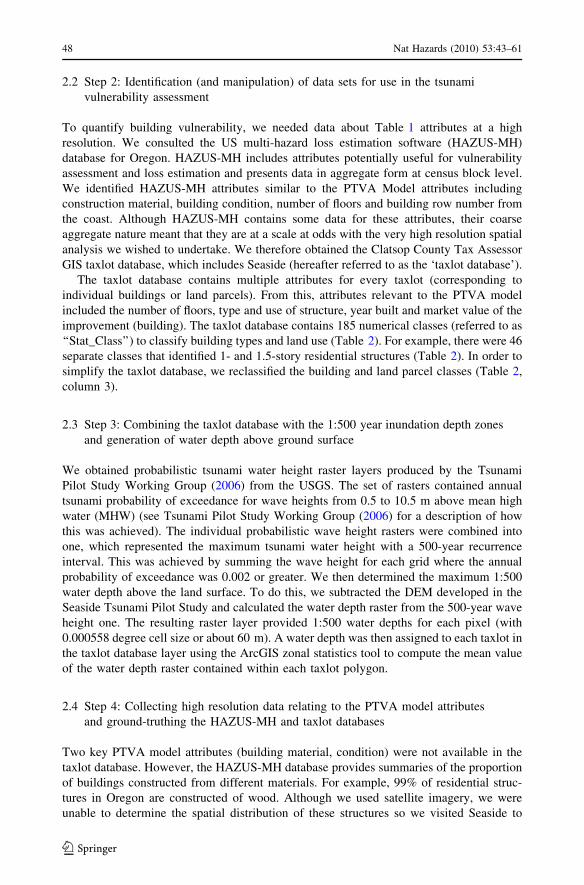
Fig. 1 a Map of the Cascadia Subduction Zone (including crustal plates) and NW USA (together withplaces referred to in the text), b Seaside study location, c PTHA 1:500 tsunami map
44 Nat Hazards (2010) 53:43–61
123

Wood (2002), Wood et al. (2002a, b) and Wood and Good (2004) developed a
framework for identifying ‘relative vulnerability hotspots’—places that are exposed to
hazard processes. As valuable as the framework is, they acknowledge that their approach is
an ‘issues identification tool’ that does not provide a quantification of PML (Wood and
(c)
Fig. 1 continued
Nat Hazards (2010) 53:43–61 45
123
Good 2004; p. 265). They note communities interested in identifying and quantifying
vulnerability to [tsunami] damage and loss must apply an objective scientific weighting
scheme to the rankings of specific vulnerability attributes at the local level. Objective
analysis of, for instance, residential building vulnerability, should be carried out by
technical experts/engineers at high-resolution scales as assessment tools and data become
available. Recent reports state that there is still a need for credible fragility models and
laboratory data to understand the interaction of tsunami with the built environment
(Bernard et al. 2007; Grundy et al. 2005).
The Papathoma Tsunami Vulnerability Assessment (PTVA) model is a first generation
loss estimation tool designed to achieve the quantification of vulnerability advocated by
Wood and Good (2004) and Bernard et al. (2007). The PTVA model was developed using
information from historic tsunami, postevent surveys and damage assessments (Papathoma
2003; Papathoma and Dominey-Howes 2003; Papathoma et al. 2003). Papathoma (2003)
identified and ranked using expert judgement, a series of attributes (engineering, envi-
ronmental, social, etc.) responsible for controlling the type and severity of tsunami damage
to buildings. The 2004 Indian Ocean event enabled the model to be tested, validated and
evaluated and provides a robust framework to estimate tsunami vulnerability of buildings
(Dominey-Howes and Papathoma 2007).
The PTVA model is dynamic. The attribute data contained within the primary (GIS)
database may be continuously and quickly updated, allowing investigation of spatial and
temporal vulnerability. Table 1 outlines selected classes/attributes within the model. In the
absence of fully-developed and tested tsunami building fragility-damage assessment tools,
the PTVA model provides a framework capable of generating high-resolution first order
assessments of vulnerability and PML.
We apply the PTVA model to Seaside (46�0000000N, 123�9300000W on the northwest
coast of Oregon, 110 km northwest of Portland), OR (USA) (Fig. 1b), because (1) a
1:500 year PTHA tsunami flood map has recently been established (Fig. 1c) (The Tsunami
Pilot Working Group 2006), (2) it can provide the detail advocated by Wood and Good
(2004). The site for this study includes the city boundaries of Seaside and Gearhart
(hereafter referred to as ‘Seaside’) (Fig. 1b).
The aims of this study are to:
1. Map and quantify the ‘exposure’ of one-story residential and commercial buildings
within the 1:500 year tsunami flood hazard zone in Seaside
2. Use the PTVA model to quantify the vulnerability of these structures; and
3. To provide a preliminary estimate of PMLs in 2006 US$ for the buildings in the
1:500 year tsunami flood zone
2 Methods
In order to quantify the vulnerability of buildings in Seaside to the 1:500 year tsunami
flood, we undertook the following:
2.1 Step 1: Identification of tsunami inundation zone based on a PTHA
We selected the 1:500 year tsunami flood layer (Fig. 1c) generated by the PTHA assess-
ment described in the Tsunami Pilot Working Group (2006). We use the 1:500 year layer
46 Nat Hazards (2010) 53:43–61
123

rather than the 1:100 year layer they developed because no buildings are located within the
1:100 year flood layer (thus exposure, vulnerability and PML are negligible) and because
no other flood return periods (e.g., 1:1,000 year) were available. It should be noted that
since the 1:500 year tsunami flood layer is based upon a probabilistic calculation, it does
not exactly correlate with a specific event of a given magnitude. The Tsunami Pilot
Working Group (2006) was unable to determine a ‘credible worst case scenario’. However,
since the 1:500 year layer is dominated by a local CSZ tsunami (the Tsunami Pilot Study
Working Group 2006), we examine vulnerability deterministically based upon the prob-
abilistic 1:500 year flood layer.
Table 1 Selected class/attribute fields within the PTVA model relevant to this study (after Dominey-Howesand Papathoma, 2007)
Major class Attribute Attribute description Vulnerabilitydescriptor
The builtenvironment
Number of floorsin each building
Only one floor High
More than one floor Low
Description of groundfloor
Open plan with movable objects(e.g., tables and chairs)
High
Open plan or with big glass windowswithout movable objects
Medium
None of the above Low
Building surroundings No barrier Very high
Low/narrow earth embankment High
Low/narrow concrete wall Medium
High concrete wall Low
Building material, age,design
Buildings of field stone, unreinforced,crumbling and/or deserted, wood frameand wood construction
High
Ordinary masonry brick buildings, cementmortar, no reinforcement
Medium
Pre-cast concrete skeleton, reinforcedconcrete
Low
Shape and orientationof building
Square or oblong shaped structure High
Non cubic shaped building (e.g., hashexagonal or circular shaped floor plan)
Low
Walls parallel to shoreline High
Corners of building facing the shoreline Low
The environment Natural environment Narrow intertidal zone High
Intermediate intertidal zone Medium
Wide intertidal zone Low
Land cover (vegetation) No vegetation cover High
Scrub and low vegetation, small trees Medium
Trees and dense scrub Low
The ‘‘vulnerability descriptors’’ in the last column are defined as ‘relative’ to one another and are based onprevious field surveys
Nat Hazards (2010) 53:43–61 47
123
2.2 Step 2: Identification (and manipulation) of data sets for use in the tsunami
vulnerability assessment
To quantify building vulnerability, we needed data about Table 1 attributes at a high
resolution. We consulted the US multi-hazard loss estimation software (HAZUS-MH)
database for Oregon. HAZUS-MH includes attributes potentially useful for vulnerability
assessment and loss estimation and presents data in aggregate form at census block level.
We identified HAZUS-MH attributes similar to the PTVA Model attributes including
construction material, building condition, number of floors and building row number from
the coast. Although HAZUS-MH contains some data for these attributes, their coarse
aggregate nature meant that they are at a scale at odds with the very high resolution spatial
analysis we wished to undertake. We therefore obtained the Clatsop County Tax Assessor
GIS taxlot database, which includes Seaside (hereafter referred to as the ‘taxlot database’).
The taxlot database contains multiple attributes for every taxlot (corresponding to
individual buildings or land parcels). From this, attributes relevant to the PTVA model
included the number of floors, type and use of structure, year built and market value of the
improvement (building). The taxlot database contains 185 numerical classes (referred to as
‘‘Stat_Class’’) to classify building types and land use (Table 2). For example, there were 46
separate classes that identified 1- and 1.5-story residential structures (Table 2). In order to
simplify the taxlot database, we reclassified the building and land parcel classes (Table 2,
column 3).
2.3 Step 3: Combining the taxlot database with the 1:500 year inundation depth zones
and generation of water depth above ground surface
We obtained probabilistic tsunami water height raster layers produced by the Tsunami
Pilot Study Working Group (2006) from the USGS. The set of rasters contained annual
tsunami probability of exceedance for wave heights from 0.5 to 10.5 m above mean high
water (MHW) (see Tsunami Pilot Study Working Group (2006) for a description of how
this was achieved). The individual probabilistic wave height rasters were combined into
one, which represented the maximum tsunami water height with a 500-year recurrence
interval. This was achieved by summing the wave height for each grid where the annual
probability of exceedance was 0.002 or greater. We then determined the maximum 1:500
water depth above the land surface. To do this, we subtracted the DEM developed in the
Seaside Tsunami Pilot Study and calculated the water depth raster from the 500-year wave
height one. The resulting raster layer provided 1:500 water depths for each pixel (with
0.000558 degree cell size or about 60 m). A water depth was then assigned to each taxlot in
the taxlot database layer using the ArcGIS zonal statistics tool to compute the mean value
of the water depth raster contained within each taxlot polygon.
2.4 Step 4: Collecting high resolution data relating to the PTVA model attributes
and ground-truthing the HAZUS-MH and taxlot databases
Two key PTVA model attributes (building material, condition) were not available in the
taxlot database. However, the HAZUS-MH database provides summaries of the proportion
of buildings constructed from different materials. For example, 99% of residential struc-
tures in Oregon are constructed of wood. Although we used satellite imagery, we were
unable to determine the spatial distribution of these structures so we visited Seaside to
48 Nat Hazards (2010) 53:43–61
123

Table 2 Clatsop County Tax Assessor taxlot database classes, class descriptions and our simplified(revised) Stat_Class number
Original Clatsop County TaxAssessor taxlot Stat_Class
Description Our revisedStat_Class
110, 111, 112, 120, 121, 122, 123, 124, 125,130, 131, 132, 133, 134, 135, 140, 141,142, 143, 144, 145, 150, 151, 152, 153,154, 155, 160, 161, 162, 163, 164, 165,170, 171, 172, 173, 174, 175, 180, 181,182, 183, 184, 185, 630
Residential 1 story* 100
116, 126, 127, 128, 129, 136, 137, 138, 139,146, 147, 148, 149, 156, 157, 158, 159,166, 167, 168, 169, 177, 178, 186, 188,189, 656, 657, 646, 176, 179, 187, 637
Residential 2 ? story 120
420, 421 Residential apartments (low rise) 130
422, 423, 900 Residential apartments (medium andhigh rise, e.g., condos)
140
190, 181, 182, 183, 194, 199, 200, 300, 500 Residential single-widemanufactured homes (MFD),vacant MFD and miscellaneousoutbuildings
150
232, 233, 234, 242, 243, 244, 252, 253, 254 Residential all plexes (duplex,triplex, etc.)
155
410, 411, 412, 413, 414 Commercial—motels, hotels B&B 160
440, 441, 442, 443, 444, 446, 447, 448, 449,475, 490, 430, 431, 432, 433, 434, 435,540
Commercial—retail, departmentstores, etc.
170
480, 481, 482, 483, 484, 485, 698 Commercial—automotive, servicestations, etc.
180
400, 651, 460, 461, 462, 463, 464, 499 Commercial—other, misc.,communications—all types,financial—banks, ATMs, etc.
190
470, 471, 472, 473, 474, 476, 477 Industrial—warehouse, storage, etc. 200
700, 710, 720, 730, 740, 750, 760, 770,780, 790
Industrial—all others(e.g., manufacturing)
210
450, 452, 453, 454, 455, 496, 520, 530,566, 570
Medical—hospitals, veterinary, daycare, nursing home, etc.
230
000, xxx Land—vacant land/ contiguous landholding
0, 240
564 Emergency service—fire, police,ambulance
250
493, 494, 495, 497, 492, 511 Recreation—sports, art venues, RVparks, etc.
280
445, 550, 560, 561, 562, 563, 564, 565,567, 491
Public services—schools, postoffices, churches, libraries,regional centers
290
* 1.5-story structures were houses with1-room attics
Note: In this table, we have listed every building class (e.g., 1 story, industrial, recreation etc) we examinedin our study. However, in this paper we only report on the vulnerability and likely PMLs of 1- and 1.5-* story residential (hereafter referred to as ‘1 story’) and commercial buildings
Nat Hazards (2010) 53:43–61 49
123

ground truth the taxlot database. Selected ‘representative’ residential and commercial
blocks located within the peninsula area of Seaside (the area of Fig. 1b located between the
Pacific Ocean and the Necanicum River) were chosen and information related to eight key
PTVA model attributes (Table 3) was recorded for every structure. The peninsula region
was selected because it is the area affected by the deepest tsunami inundation (Fig. 1c) and
is therefore, extraordinarily vulnerable. We used the ground-truthed data from 12 resi-
dential and 12 commercial blocks together with a rapid visual assessment of the remaining
building stock in the peninsula area to generate a high resolution dataset of building
attributes.
2.5 Step 5: Calculation of PTVA vulnerability scores for ground-truthed blocks
We restrict our calculation of building vulnerability to the ground-truthed one-story resi-
dential and commercial buildings on the peninsula region of Seaside. The percentage
distribution of these vulnerability scores was then scaled up to all one-story residential and
commercial buildings within the peninsula area.
For each attribute, descriptions of possible alternatives were provided, and these
alternatives were given a raw score. The list of attributes, and thus raw scores, varied
depending upon the particular locality being evaluated. These are shown in Table 4.
To calculate the overall ‘‘vulnerability score’’ for each building, we:
• Weighted the attributes (Table 3) from highest (those most significant in controlling
vulnerability) to lowest (those least significant in controlling vulnerability). The
weighting of the attributes was determined by expert judgement by Papathoma (2003)
from an analysis of numerous tsunami damage assessment surveys and engineering
reports
• Transformed (or standardized) the raw scores for each attribute to a ratio scale to permit
interattribute manipulation. Thus, we take the raw score and divide that number by the
highest possible value for that attribute. For example, for water depth, the raw score
may be 4 (indicating a water depth of between 2.0 and 2.99 m) and 4 is divided by 6
(which is the maximum possible score for this attribute ; see Table 4). So, 4/6 = 0.66.
We then complete this calculation for each attribute
Table 3 Attributes from the PTVA model and their weighting within the study
Attribute Weighted value
Water depth above ground surface 8
Building row number (from the sea) 7
Building material 6
Number of floors 5
Orientation of building 4
Condition of building 3
Building surroundings 2
Land cover 1
These specific attributes were selected for this study because they are (1) known to be important inpredicting/controlling vulnerability and (2) because data related to these attributes was readily available tous. The weighting of the attributes was determined by Papathoma (2003) via a process of ‘expert judgement’
50 Nat Hazards (2010) 53:43–61
123

Ta
ble
4A
ttri
bu
tes,
thei
rd
escr
ipti
on
san
dth
e‘r
awsc
ore
’fo
rea
chd
escr
ipti
on
Wat
erd
epth
abo
ve
gro
und
surf
ace
(m)
(a)
Buil
din
gro
wn
um
ber
(fro
mth
ese
a)(b
)
Bu
ild
ing
mat
eria
l(c
)N
um
ber
of
flo
ors
(d)
Ori
enta
tio
no
fb
uil
din
g(e
)
Co
nd
itio
no
fb
uil
din
g(f
)
Bu
ild
ing
surr
ou
nd
ing
s(g
)
Lan
dco
ver
(h)
Dep
thR
awsc
ore
Row
nu
mb
erR
awsc
ore
Mat
eria
lR
awsc
ore
Flo
or
nu
mb
erR
awsc
ore
Ori
enta
tio
nR
awsc
ore
Co
nd
itio
nR
awsc
ore
Su
rro
un
din
gs
Raw
sco
reC
ov
erR
awsc
ore
C4
.06
*1
37
*W
oo
do
nly
;w
oo
do
nco
ncr
ete
bas
e;st
eel
fram
ew
ith
wo
od
wal
ls
4*
1st
ory
2*
Irre
gula
r3
*P
oo
r3
*N
on
e4
*N
on
e3
*
3.0
–3
.99
5D
ow
nto
…S
ton
ean
dco
ncr
ete;
con
cret
ean
db
rick
32
or mo
re1
#C
ub
icw
ith
corn
erto
sea
2F
air
2L
ow
bri
ckw
all
3B
ush
esan
dlo
wtr
ees
2
2.0
–2
.99
43
7#
1#
Co
ncr
ete
2C
ub
ic/
par
alle
l1
#E
xce
llen
t1
#M
ediu
mb
rick
/co
ncr
ete
wal
l
2L
arg
etr
ees
1#
1.0
–1
.99
3S
teel
and
con
cret
e1
#H
igh
con
cret
ew
all
1#
0.5
–0
.92
0.0
1–
0.4
91
#
No
te:
Eac
hof
the
attr
ibute
sin
ves
tigat
edw
ithin
the
PT
VA
model
contr
ibute
sto
the
‘over
all’
vuln
erab
ilit
yof
anin
div
idual
buil
din
gst
ruct
ure
.S
ince
the
attr
ibute
sar
eal
lv
ery
dif
fere
nt,
they
hav
eto
be
redu
ced
toa
com
mo
nn
um
eric
val
ue
toen
able
the
calc
ula
tio
no
fan
ov
eral
lv
uln
erab
ilit
ysc
ore
.T
he
ov
eral
lv
uln
erab
ilit
ysc
ore
of
each
bu
ild
ing
stru
ctu
reis
asu
mm
atio
no
fth
ere
lati
ve
nu
mer
icra
wsc
ore
for
each
attr
ibute
.T
he
raw
sco
reo
fea
chat
trib
ute
wil
lv
ary
,b
ut
inev
ery
case
ran
ges
fro
ma
‘hig
hvuln
erab
ilit
y’
(wh
ich
inT
able
4is
ind
icat
edb
yth
e*
)an
da
‘lo
wv
uln
erab
ilit
y’
(wh
ich
isin
dic
ated
by
the
#).
See
tex
tfo
ran
exp
lan
atio
no
fth
eca
lcu
lati
on
of
the
fin
al‘v
uln
erab
ilit
y’
sco
re
Nat Hazards (2010) 53:43–61 51
123

To calculate the vulnerability score (V) of each individual building, we then sum as
follows:
V ¼ 8� að Þ þ 7� bð Þ þ 6� cð Þ þ 5� dð Þ þ 4� eð Þ þ 3� fð Þ þ 2� gð Þ þ 1� hð Þ
where a, b, c, d, e, f, g and h are the standardized scores for water depth, row number, material,
floors, orientation, condition, surroundings and land cover, respectively (Table 4, row 1).
The lowest possible vulnerability score is:
R 8� 0:16ð Þ þ 7� 0:027ð Þ þ 6� 0:25ð Þ þ 5� 0:5ð Þ þ 4� 0:33ð Þ þ 3� 0:33ð Þþ 2� 0:25ð Þ þ 1� 0:33ð Þ ¼ 8:609
The highest possible vulnerability score is:
R 8� 1ð Þ þ 7� 1ð Þ þ 6� 1ð Þ þ 5� 1ð Þ þ 4� 1ð Þ þ 3� 1ð Þ þ 2� 1ð Þ þ 1� 1ð Þ ¼ 36
The ‘vulnerability score’ of each building will lie between these values.
Since we now know that the building vulnerability score will lie between 8.609 and 36,
we divide this range into ‘equal intervals’ (Table 5).
2.6 Step 6: Extrapolation from ground-truthed blocks to whole of Seaside peninsula
and calculation of PML’s
Once we had estimated the vulnerability of buildings in our ground-truthed blocks, we took
the relative distribution of ‘high vulnerability’ and ‘medium vulnerability’ (etc.) structures
and scaled these numbers up to the total number of buildings present on the whole pen-
insula. Finally, we calculated the PMLs (both absolute number of buildings and their $
value) for one-story residential and commercial buildings.
3 Results
There are a total of 4,910 buildings (of different classes) and land plots within Seaside
(Table 6, column 2). Here, we focus on the vulnerability of one-story residential and
commercial buildings only since collectively they represent over 50% of the building
stock, and we only wish to ‘demonstrate’ the capability of our approach (rather than
provide a comprehensive assessment of building vulnerability and PML).
3.1 Summary of building exposure within the 1:500 year tsunami flood layer, spatial
distribution and replacement costs
A total of 3,032 buildings (62% of the total) are located within the 1:500 year tsunami
flood hazard layer. Their spatial distribution is shown in Fig. 2a, and the total number of
Table 5 Range of vulnerabilityclasses and their respectivenumeric distributions
Numeric values Vulnerability class
30.53–36 High vulnerability
25.031–30.529 Medium-high vulnerability
19.56–25.03 Medium vulnerability
14.08–19.55 Medium-low vulnerability
8.609–14.079 Low vulnerability
52 Nat Hazards (2010) 53:43–61
123
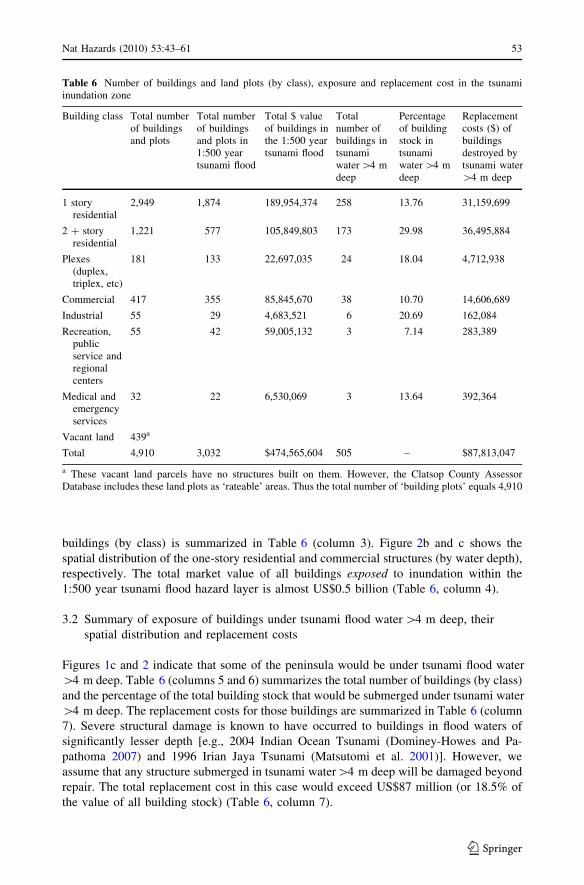
buildings (by class) is summarized in Table 6 (column 3). Figure 2b and c shows the
spatial distribution of the one-story residential and commercial structures (by water depth),
respectively. The total market value of all buildings exposed to inundation within the
1:500 year tsunami flood hazard layer is almost US$0.5 billion (Table 6, column 4).
3.2 Summary of exposure of buildings under tsunami flood water [4 m deep, their
spatial distribution and replacement costs
Figures 1c and 2 indicate that some of the peninsula would be under tsunami flood water
[4 m deep. Table 6 (columns 5 and 6) summarizes the total number of buildings (by class)
and the percentage of the total building stock that would be submerged under tsunami water
[4 m deep. The replacement costs for those buildings are summarized in Table 6 (column
7). Severe structural damage is known to have occurred to buildings in flood waters of
significantly lesser depth [e.g., 2004 Indian Ocean Tsunami (Dominey-Howes and Pa-
pathoma 2007) and 1996 Irian Jaya Tsunami (Matsutomi et al. 2001)]. However, we
assume that any structure submerged in tsunami water[4 m deep will be damaged beyond
repair. The total replacement cost in this case would exceed US$87 million (or 18.5% of
the value of all building stock) (Table 6, column 7).
Table 6 Number of buildings and land plots (by class), exposure and replacement cost in the tsunamiinundation zone
Building class Total numberof buildingsand plots
Total numberof buildingsand plots in1:500 yeartsunami flood
Total $ valueof buildings inthe 1:500 yeartsunami flood
Totalnumber ofbuildings intsunamiwater [4 mdeep
Percentageof buildingstock intsunamiwater [4 mdeep
Replacementcosts ($) ofbuildingsdestroyed bytsunami water[4 m deep
1 storyresidential
2,949 1,874 189,954,374 258 13.76 31,159,699
2 ? storyresidential
1,221 577 105,849,803 173 29.98 36,495,884
Plexes(duplex,triplex, etc)
181 133 22,697,035 24 18.04 4,712,938
Commercial 417 355 85,845,670 38 10.70 14,606,689
Industrial 55 29 4,683,521 6 20.69 162,084
Recreation,publicservice andregionalcenters
55 42 59,005,132 3 7.14 283,389
Medical andemergencyservices
32 22 6,530,069 3 13.64 392,364
Vacant land 439a
Total 4,910 3,032 $474,565,604 505 – $87,813,047
a These vacant land parcels have no structures built on them. However, the Clatsop County AssessorDatabase includes these land plots as ‘rateable’ areas. Thus the total number of ‘building plots’ equals 4,910
Nat Hazards (2010) 53:43–61 53
123
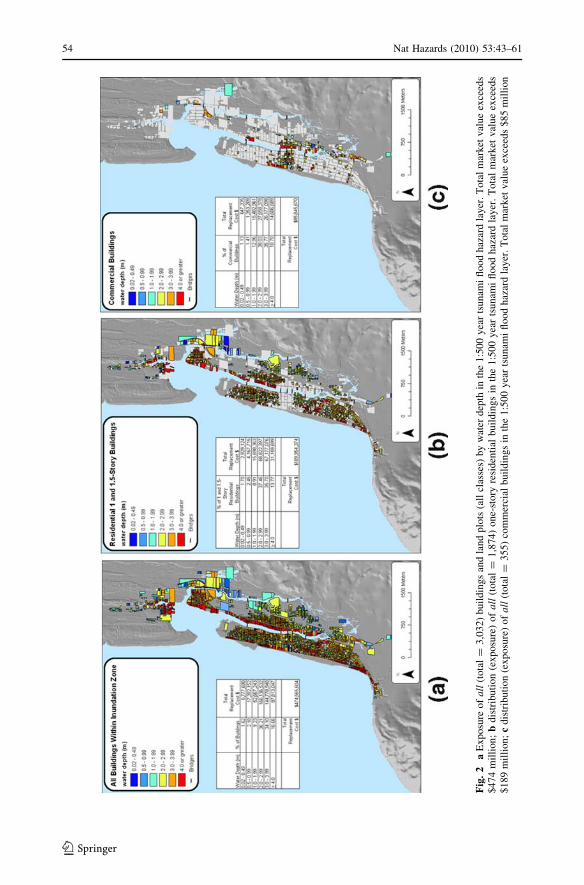
Fig
.2
aE
xp
osu
reo
fa
ll(t
ota
l=
3,0
32
)b
uil
din
gs
and
lan
dp
lots
(all
clas
ses)
by
wat
erd
epth
inth
e1
:50
0y
ear
tsun
ami
flo
od
haz
ard
lay
er.
To
tal
mar
ket
val
ue
exce
eds
$4
74
mil
lion
;b
dis
trib
uti
on
(exp
osu
re)
of
all
(to
tal
=1
,874
)o
ne-
sto
ryre
sid
enti
alb
uil
din
gs
inth
e1
:50
0y
ear
tsu
nam
ifl
oo
dh
azar
dla
yer
.T
ota
lm
ark
etv
alu
eex
ceed
s$
18
9m
illi
on
;c
dis
trib
uti
on
(ex
po
sure
)o
fa
ll(t
ota
l=
355)
com
mer
cial
buil
din
gs
inth
e1:5
00
yea
rts
unam
ifl
ood
haz
ard
layer
.T
ota
lm
arket
val
ue
exce
eds
$85
mil
lion
54 Nat Hazards (2010) 53:43–61
123

3.3 Results of building tsunami vulnerability assessment
Figure 3 shows the spatial distribution of the 1,017 exposed one-story residential and 199
commercial buildings in the peninsula region. We ground-truthed 131 (or 12.88%) of the
one-story residential and 98 (or 49.25%) of the commercial structures.
3.3.1 Residential building tsunami vulnerability assessment
Of the 131 ground-truthed one-story residential structures (Fig. 4a, b), 14.5% have a
vulnerability classification of ‘high’ and 81.7% are ‘medium-high’. The remaining clas-
sifications are shown in Table 7 (columns 1 and 3). These relative percentages were then
scaled up for the entire peninsula region. We assume that a total loss of structure occurs for
buildings classified ‘medium-high’ and ‘high’ (which in the vast majority of cases cor-
related with water depth[4 m). Therefore, the PML is the aggregate replacement costs of
buildings that fall within these classifications. This replacement cost, calculated from the
2006 market value of the residential buildings, amounts to more than US$103 million
(Table 7, column 5).
3.3.2 Commercial building tsunami vulnerability assessment
Of the 98 ground-truthed commercial structures (Fig. 4c), none have a vulnerability
classification of ‘high’, and only 23.5% have a classification of ‘medium-high’. The
remaining classifications are shown in Table 7 (columns 1 and 3). These percentages were
also scaled up for the entire peninsula region, and it was again assumed that a total loss
occurs for buildings classified ‘medium-high’ and ‘high’. Consequently, the PML for these
structures exceeds US$13 million (Table 7, column 5).
4 Discussion
Wood and Good (2004) provide a framework to begin to examine tsunami vulnerability at
the local level. We go well beyond Wood and Good (2004) using a specific technical tool
to identify and quantify one-story residential and commercial building vulnerability and to
estimate PMLs—something that to our knowledge, has never been done for tsunami in the
United States.
We attempted to use data from the HAZUS-MH database to estimate PMLs from the
1:500 year tsunami. However, HAZUS-MH data are at present, too coarse to be used for
this type of detailed tsunami vulnerability assessment. The County Tax Assessor Taxlot
Database on the other hand, is useful, although we are uncertain if other similar databases
are as accurate. This issue would need to be investigated for each community subjected to
similar detailed vulnerability assessment.
There are a large number of buildings (3,032) with a high market value within the
1:500 year tsunami flood layer, and they are densely concentrated on the low-lying pen-
insula (Fig. 2a). This is a significant issue during tsunami inundation since the peninsula is
connected to the mainland by six small bridges with one lane of traffic flow in each
direction. In the event of an evacuation, significant bottlenecks would be expected to
develop at these critical points.
Some 1,874 single-story residential structures with a combined value of more than
US$189 million are located within the 1:500 year tsunami flood layer. However, exposure
Nat Hazards (2010) 53:43–61 55
123
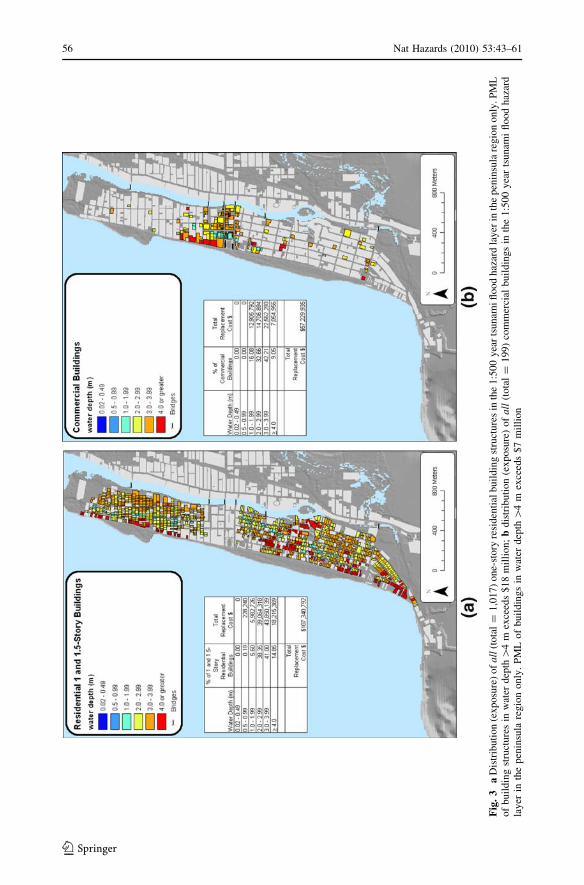
Fig
.3
aD
istr
ibuti
on
(exposu
re)
of
all
(to
tal
=1
,017
)o
ne-
sto
ryre
sid
enti
alb
uil
din
gst
ruct
ure
sin
the
1:5
00
yea
rts
un
ami
flo
od
haz
ard
lay
erin
the
pen
insu
lare
gio
no
nly
.P
ML
of
bu
ild
ing
stru
ctu
res
inw
ater
dep
th[
4m
exce
eds
$1
8m
illi
on
;b
dis
trib
uti
on
(ex
po
sure
)o
fa
ll(t
ota
l=
199)
com
mer
cial
buil
din
gs
inth
e1:5
00
yea
rts
unam
ifl
ood
haz
ard
lay
erin
the
pen
insu
lare
gio
no
nly
.P
ML
of
bu
ild
ing
sin
wat
erd
epth
[4
mex
ceed
s$
7m
illi
on
56 Nat Hazards (2010) 53:43–61
123

Fig
.4
a(U
pp
er)
Dis
trib
uti
on
(exposu
re)
of
gro
und-t
ruth
edone-
story
resi
den
tial
buil
din
gs
inth
e1:5
00
yea
rts
unam
ifl
ood
haz
ard
layer
inth
enort
her
npen
insu
lare
gio
no
nly
.(L
ow
er)
Act
ual
‘vu
lner
abil
ity
’o
fth
ose
stru
ctu
res
acco
rdin
gto
the
PT
VA
Mo
del
;b
(Up
per
)D
istr
ibu
tio
n(e
xp
osu
re)
of
gro
und
-tru
thed
on
e-st
ory
resi
den
tial
bu
ild
ings
inth
e1
:50
0y
ear
tsu
nam
ifl
oo
dh
azar
dla
yer
inth
eso
uth
ern
pen
insu
lare
gio
no
nly
.(L
ow
er)
Act
ual
‘vu
lner
abil
ity
’o
fth
ose
stru
ctu
res
acco
rdin
gto
the
PT
VA
mo
del
;c
(Up
per
)D
istr
ibu
tio
n(e
xp
osu
re)
of
gro
und
-tru
thed
com
mer
cial
bu
ild
ings
inth
e1
:50
0y
ear
tsun
ami
flo
od
haz
ard
lay
erin
the
pen
insu
lare
gio
no
nly
.(L
ow
er)
Act
ual
‘vu
lner
abil
ity
’o
fth
ose
stru
ctu
res
acco
rdin
gto
the
PT
VA
mod
el
Nat Hazards (2010) 53:43–61 57
123

to tsunami flooding does not automatically mean that these structures will be damaged
beyond repair. If we assume that only those residential structures affected by tsunami water
depths[4 m will be completely destroyed, then the replacement cost of these 258 homes
(14% of the single story residential building stock) alone exceeds US$31 million (Table 6,
column 7).
Three hundred and fifty-five commercial buildings (out of 417) with a combined value
of US$85 million are located within the 1:500 year tsunami flood layer. However, only 38
of these (10.7% of the stock) are located in areas where tsunami water depth will be[4 m.
Assuming that all these buildings would be destroyed, their replacement costs would
exceed US$14 million (Table 6, column 7). Our assumption about water depth and total
building loss needs to be explored in greater detail however.
The vulnerability/resilience of an individual structure is a function of a number of
parameters that include structural engineering, age, condition, material, distance from the
coast, engineering standards, orientation and shape. The PTVA model attempts to account
for these factors and ascribes a vulnerability score to each structure. Thus, two adjacent
building structures both in 4 m of tsunami flood water, may sustain varying degrees of
damage according to these factors. Therefore, when the PTVA model is applied to
buildings in Seaside, the patterns shown in Figs. 2 and 3 vary, and the PMLs change
dramatically.
In our analyses, it is assumed that buildings categorized as ‘high’ or ‘medium-high’
vulnerability will be completely destroyed. Consequently, over 95% (Table 7, column 3)
of one-story residential buildings in Seaside would be destroyed with a PML in excess of
Table 7 Building vulnerability and PML of one-story residential and commercial buildings located on thepeninsula
PTVA vulnerability class Number ofground-truthedstructures
Percentageof buildingstock
Scaled-upmarketvalue $
Probablemaximumloss $
Residential buildings
High 19 14.5 15,568,512 15,568,512
Medium-high 107 81.7 87,675,303 87,675,303
Medium 3 2.3 2,458,186 –a
Medium-low 0 – – –a
Low 2 1.5 1,638,791 –a
Total 131 100 107,340,792 103,243,815
Commercial buildings
High 0 – – –
Medium-high 23 23.5 13,431,515 13,431,515
Medium 51 52.0 29,782,925 –a
Medium-low 5 5.1 2,919,895 –a
Low 19 19.4 11,095,600 –a
Total 98 100 57,229,935 13,431,515
Total PML for one-story residential and commercial buildings in the 1:500 year tsunami 116,675,330
a While buildings with a vulnerability classification of ‘Medium’, ‘Medium-low’ and ‘Low’ will bedamaged by the 1:500 year tsunami flood, we assume that they will not be damaged beyond repair.Therefore, we do not include the likely replacement costs for these structures since we are only concernedwith the replacement costs of structures that are completely destroyed by the tsunami
58 Nat Hazards (2010) 53:43–61
123
US$103 million. When the same analysis is repeated for commercial buildings, some 23%
(Table 7, column 3) would be destroyed with a PML of approximately US$13 million.
Therefore, total PML for these two building classes would exceed US$116 million
(Table 7, column 5) out of a total exposure worth close to US$0.5 billion.
The PML of US$116 million is the minimum that would be expected at Seaside for a
1:500 year tsunami. The real figure would be much higher as other classes of buildings
would also be destroyed. Also, our calculations have only considered the costs associated
with the full replacement of destroyed buildings. It does not include the costs associated
with the repair of partly-damaged buildings.
The PTVA model is a useful tool for quantifying the vulnerability of buildings enabling
estimates of PML and could easily be ‘rolled-out’ across the United States to help gain a
high-resolution first-order assessment of exposure, vulnerability and PML. This loss esti-
mation tool should be useful to emergency management and local government officials in
prioritizing disaster mitigation efforts. As fragility curves become available, individual
fragility functions could be added as an attribute field within the PTVA model.
This pilot study was designed to test the capability of the PTVA model rather than
provide a comprehensive assessment of building vulnerability and PML for Seaside (and
the Pacific NW coast). There are several limitations to this work:
• We have deterministically quantified exposure, vulnerability and PML based upon a
probabilistic map that does not directly equate to an actual event. Use of a ‘credible
worst case scenario’ would increase our confidence in the estimates of exposure and
PML. When a ‘credible worst case scenario’ is developed, this study should be repeated
to gain a more comprehensive estimate of PMLs
• PMLs associated with the 1:500 year tsunami do not (in our study) take account of
earthquake-related damage to structures prior to the arrival of the tsunami. Given that
the 1:500 year tsunami flood layer is dominated by a Cascadia type earthquake, such an
event will likely have caused significant structural damage to buildings that would then
be affected by a tsunami. As such, PMLs are likely to be higher than reported here.
Further work should try to incorporate this issue
• Ground truthing was limited to a few blocks on the peninsula. Increased coverage of
blocks on both the peninsula and mainland regions of Seaside would increase our
confidence in the representativeness of the building stock surveyed (even if it did not
change the distribution of building types/vulnerabilities)
• We have only included the peninsula region in our analysis. Further analysis should
focus on the mainland. Additionally, we simplified tsunami inundation to a single wave
running across the region parallel with the shoreline. In reality, the wave would funnel
up the Necanicum River estuary (Fig. 1b, c). Inundation of buildings adjacent to the
estuary could occur before water from the coast reaches them. This might alter the
relative vulnerability (and PMLs) at these locations
• The County Tax Assessor Taxlot Database is useful, although we are uncertain if other
databases are as accurate. This would need checking ‘on the ground’ for each
community and could potentially limit the usefulness of the PTVA model; and
• We have made no attempt to estimate human vulnerability, which is important for a
complete tsunami vulnerability assessment. Databases containing business information
such as number of hotel beds, employees, etc, could also be used to determine the
variability in human exposure and vulnerability
Nat Hazards (2010) 53:43–61 59
123
5 Conclusion
It is now known that the Cascadia margin is capable of generating large magnitude seis-
mic-tsunami. Consequently, there is an urgent need to identify and apply quantitative tools
to assess the relative vulnerability of buildings located within expected tsunami inundation
zones and to use the assessments of vulnerability to estimate PML for future possible
events. The results of such analyses may then be used for developing appropriate miti-
gation strategies.
We have used a 1:500 year tsunami hazard flood layer produced during a PTHA as the
input to a study of the vulnerability of one-story residential and commercial buildings in
the low-lying peninsula region of Seaside, OR, USA. We have mapped building exposure,
applied the ‘‘PTVA model’’ to calculate their vulnerability and estimate PMLs associated
with a 1:500 year tsunami flood. Almost US$0.5 billion worth of buildings would be
inundated, 95% of single-story residential and 23% of commercial buildings would be
destroyed with PMLs exceeding US$116 million. This study represents the first time that
PMLs have ever been calculated for a Cascadia type tsunami, and the results have serious
implications for risk management.
It is clear from this pilot study that the PTVA model may be a useful tool for inves-
tigating high resolution vulnerability of structures and for estimating PMLs within United
States coastal tsunami inundation zones and could be applied elsewhere.
Acknowledgments NOAA/NGDC is thanked for providing the resources to enable Dale Dominey-Howesand Papathoma-Kohle to participate in this study. Two anonymous referees and Filippo Dall’Osso arethanked for making numerous helpful comments on an earlier version of this manuscript all of whichsignificantly improved the final version.
References
Bernard B, Dengler L, Yim S (2007) National Tsunami Research Plan: report of a workshop sponsored byNSF/NOAA. NOAA Technical Memorandum OAR PMEL-133, 135 p. http://nctr.pmel.noaa.gov/pubs.html
Dominey-Howes D, Papathoma M (2007) Validating a tsunami vulnerability assessment model (the PTVAModel) using field data from the 2004 Indian Ocean tsunami. Nat Hazards 40:113–136. doi:10.1007/s11069-006-0007-9
Grundy P, Thurairaja A, Walker G (2005) Some reflections on the structural engineering aspects of tsunami.In: Lam NTK, Wilson JL, Butler B (eds) Proceedings, Australian Earthquake Engineering Society,Albury, New South Wales, p 7-1-7-4
Kelsey H, Nelson A, Hemphill-Haley E, Witter R (2005) Tsunami history of an Oregon coastal lake revealsa 4600 year record of great earthquakes on the Cascadia subduction zone. Bull Geol Soc Am 117(7–8):1009–1032. doi:10.1130/B25452.1
Losey R (2005) Earthquakes and tsunami as elements of environmental disturbance on the Northwest coastof North America. J Anthropol Archaeol 24:101–116. doi:10.1016/j.jaa.2005.02.001
Matsutomi H, Shuto N, Imamura F, Takahashi T (2001) Field survey of the 1996 Irian Jaya earthquaketsunami in Biak island. Nat Hazards 24:199–212. doi:10.1023/A:1012042222880
Nelson A, Kelsey H, Witter R (2006) Great earthquakes of variable magnitude at the Cascadia subductionzone. Quat Res 65:354–365. doi:10.1016/j.yqres.2006.02.009
Papathoma M (2003) Tsunami vulnerability assessment using a geographic information system with specialreference to Greece. Unpublished PhD Thesis, Coventry University, UK, 289 p
Papathoma M, Dominey-Howes D (2003) Tsunami vulnerability assessment and its implications for coastalhazard analysis and disaster management planning, Gulf of Corinth, Greece. Nat Hazards Earth SystSci 3:733–744
Papathoma M, Dominey-Howes D, Zong Y, Smith D (2003) Assessing tsunami vulnerability, an examplefrom Herakleio, Crete. Nat Hazards Earth Syst Sci 3:377–389
60 Nat Hazards (2010) 53:43–61
123

Peters R, Jaffe B, Gelfenbaum G (2007) Distribution and sedimentary characteristics of tsunami depositsalong the Cascadia margin of western North America. Sediment Geol 200:372–386. doi:10.1016/j.sedgeo.2007.01.015
Satake K, Atwater B (2007) Long-term perspectives on giant earthquakes and tsunamis at subduction zones.Annu Rev Earth Planet Sci 35:349–374. doi:10.1146/annurev.earth.35.031306.140302
The Tsunami Pilot Study Working Group (2006) Seaside, oregon tsunami pilot study—modernization ofFEMA Flood Hazard Maps, Joint NOAA/USGS/FEMA special report, 94 p, 7 appendices. http://pubs.usgs.gov/of/2006/1234/
Wood N (2002) Vulnerability of port and harbor communities to earthquake and tsunami hazards in thePacific Northwest. Unpublished PhD dissertation, Department of Geosciences, Oregon State University
Wood N, Good J (2004) Vulnerability of port and harbor communities to earthquake and tsunami hazards:the use of GIS in community hazard planning. Coast Manage 32:243–269. doi:10.1080/08920750490448622
Wood N, Good J, Goodwin R (2002a) Reducing vulnerability of ports and harbors to earthquake andtsunami hazards. In: Proceedings, solutions to coastal disasters, American Society of Civil Engineers,Reston, Virginia, pp 949–963
Wood N, Good J, Goodwin R (2002b) Vulnerability assessment of a port and harbor community toearthquake and tsunami hazards: integrating technical and expert and stakeholder input. Nat HazardsRev 3(4):148–157. doi:10.1061/(ASCE)1527-6988(2002)3:4(148)
Nat Hazards (2010) 53:43–61 61
123